From ‘Donorship’ to Ownership?: Moving towards PRSP Round Two
PRSP – II Period Progress Report
FY 2008/09 – FY 2010/11
Strengthening Poverty Reduction
Strategy Monitoring Project
Government of Pakistan
Finance Division
“I believe in materialism. I believe in all proceeds of a healthy materialism----good cooking, dry houses, dry feet, sewers, drain pipes, hot water, baths, electric lights, automobiles, good roads, bright streets, new ideas,
intellectual debates, theaters, operas, orchestras……..
I believe in them all for everybody. The man who dies without knowing these may be as exquisite as a saint, and as rich as a poet; but it is in spite of, not because of his deprivation.”
----Francis Hackett (Article Published in Chicago Post, 1911)

Preface
The Poverty Reduction Strategy Paper (PRSP) Secretariat has been authorized with the overall lead in coordinating, evaluating and reporting progress on pro‐poor public expenditures, intermediate social indicators, and final outcomes on a regular basis. The PRSP offers powerful tools to forge a consensus on policies and resources needed at all levels of government to reduce poverty and enhance the pace of economic and social development in Pakistan. Through this exercise, the government seeks to improve the allocation of scarce public resources and redistribute them for the betterment of the poor. The PRSP‐II outlined the targets under each pillar based upon the previous PRSP Strategies. The real test of pro‐poor public expenditures lies in their impact. Hence, the policies in PRSP‐II were linked with the achievement of key economic, financial, social and human development goals.
The Ministry of Finance is grateful for the valuable efforts, advises and comments provided to the PRSP Secretariat in these three years. I would like to extend my appreciation to Mr. Sajjad Ahmad Shaikh, NPM, Strengthening PRS Monitoring Project (SPRSMP) and SPRSM’s team for their continuous support in completing the PRSP‐II tenure successfully. I would also take this opportunity to acknowledge the individuals, civil society, academia, and the development community, who pro‐actively supported the PRSP Secretariat.
Amjad Mahmood National Project Director (NPD)/ Joint Secretary, EF‐P

Foreword
“The issue of poverty is not a statistical issue.
It is a human issue”
— James Wolfensohn
(President World Bank, 2002)
The Poverty Reduction Strategy Paper is an evolving document initiated by the World Bank and IMF in the year 2000. This analytical exercise has resulted in enhancing the effectiveness of strategies designed to uplift poverty. The PRSP‐II is the third Poverty Reduction Strategy Paper. Based upon the lessons learned, the PRSP‐II gives a comprehensive description of all economic and social aspects. It focuses on the last three years i.e. FY 2008/09 to FY 2010/11. Furthermore the PRSP II takes a very effective approach towards formulating a long‐term national economic strategy that aims at reducing poverty mainly through nine pillars. These include (i) Macroeconomic Stability and Real Sector Growth; (ii) Protecting the Poor and the Vulnerable; (iii) Increasing Productivity and Value Addition in Agriculture; (iv) Integrated Energy Development Programme; (v) Making Industry Internationally Competitive; (vi) Human Development for the 21st Century; (vii) Removing Infrastructure Bottlenecks through Public Private Partnerships; (viii) Capital and Finance for Development; and (ix) Governance for a Just and Fair System.
The PRSP secretariat regularly reports budgetary and non‐budgetary expenditures in the pro‐poor sectors. It also monitors the outcome and output indicators. The purpose of formally documenting these reports on a quarterly and annual basis has been to track the pro poor expenditures and to identify the gaps prevailing in the implementation of the PRSP‐II. This practice promises to play a key role in improving future policies regarding poverty reduction. This progress report not only intends to specify the desired objectives in pro‐poor sectors of PRSP expenditures but also discusses the actual outcomes at the grass root level. The PRSP Secretariat has made a conscious effort to share these reports regularly with key stakeholders.
I would like to extend my appreciation and gratitude to Mr. Nouman Ghani, Ms. Humaira Aziz, Ms. Mahwish Z Chowdhary, Ms. Sana Badar, Ms Shafaq Zaheer, Ms Mariam Haq, Ms Rabia Javed, Ms Farwa Basit, Mr. Noor Taj , Ms Uzma Ashraf, Mr. Saifullah Asad, Mr. Azam Khan and Mr. Bilal Shaikh for their vigorous efforts and contribution in the preparation of this report.
Sajjad Ahmad Shaikh National Project Manager (NPM) Strengthening PRS Monitoring Project
Research Team Mr. Sajjad Ahmad Shaikh National Project Manager Mr. Nouman Ghani Poverty Monitoring and Evaluation Specialist Ms Shafaq Zaheer Social Sector Analyst Mr. Noor Taj Research Associate Ms. Mahwish Z Chowdhary Research Associate Ms. Humaira Aziz Research Associate Ms. Sana Badar Research Associate Ms Mariam Haq Research Associate Ms Farwa Basit Research Associate Ms Rabia Javed Research Associate Ms Uzma Ashraf Research Associate Mr. Saifullah Asad Admin and Finance Officer Mr. Azam Khan Admin and Finance Assistant Mr. Bilal Shaikh Computer Operator

Table of Contents
Preface ............................................................................................................................................................................ i
Lists of Figures/Graphs/Boxes ....................................................................................................................................... x
Acronyms ....................................................................................................................................................................... x
1. Introduction .......................................................................................................................................................... 1
2. Targets achieved under PRSP‐II (FY2008/09‐‐FY2010/11) .................................................................................... 5
I. Agriculture ......................................................................................................................................... 13
II. Manufacturing ................................................................................................................................... 15
III. Services .............................................................................................................................................. 16
V. Fiscal Balance: ..................................................................................................................................................... 19
V.I. Revenues ........................................................................................................................................... 19
VI. External Account: ............................................................................................................................................... 20
4. Pro Poor Budgetary Expenditures ...................................................................................................................... 22
PRSP Budgetary Expenditures as percentage of GDP ........................................................................................ 26
Distribution of Expenditures .............................................................................................................................. 27
PRSP Budgetary Expenditures by Province and Sectors..................................................................................... 31
I. Effect of Subsidies on PRSP Budgetary Expenditures ......................................................................................... 33
II. Budget Allocations for Pro poor Sectors ............................................................................................................ 33
Sectoral shares in total PRSP Budgetary Allocations.......................................................................................... 34
Deviations of Actual PRSP Expenditures from budgetary Allocations ............................................................... 35
Deviations of actual Current and Development Expenditures from Revised Budgetary Allocations ................ 36
III. PRSP Current and Development Expenditures ................................................................................................... 39
PRSP Current and Development Expenditures by Province ............................................................................... 40
Sector‐wise change in Current and Development Expenditures ....................................................................... 41
IV. PRSP Expenditures in Sub sectors of Education and Health ............................................................................... 42
PRSP Expenditures in Education ........................................................................................................................ 42
PRSP Expenditures in Health .............................................................................................................................. 44
V. Actual PRSP budgetary expenditures relative to PRSP‐II Projections ................................................................. 47
4. Protecting the Poor and Vulnerable ................................................................................................................... 49
I. Zakat ................................................................................................................................................................... 50
II. Employees’ Old Age Benefits Institution (EOBI) ................................................................................................. 51
III. Pakistan Bait‐ul‐Mal (PBM) ................................................................................................................................. 52
IV. Benazir Income Support Program (BISP) ............................................................................................................ 53

V. Workers Welfare Fund (WWF) ........................................................................................................................... 55
VI. Microfinance ....................................................................................................................................................... 56
Active Borrowers, Active Savers and Active Policy holders by Peer Group ....................................................... 57
Summary of Microcredit Indicators ................................................................................................................... 58
5. Monitoring the PRSP Intermediate (output) Indicators ..................................................................................... 61
I. Education Sector ................................................................................................................................................. 62
Number of Functional Schools ........................................................................................................................... 62
Percentage of Trained Teachers ........................................................................................................................ 63
Basic Facilities in Public Schools ......................................................................................................................... 64
Private Schools and Deeni Madrassahs ............................................................................................................. 67
Technical and Vocational Trainings .................................................................................................................... 67
National Internship Program (NIP) ..................................................................................................................... 68
II. Health Sector ..................................................................................................................................................... 68
Immunization Coverage of Pregnant Women .................................................................................................... 69
Immunization Coverage of Children 12‐23 months ........................................................................................... 70
Lady Health Workers (LHWs) ............................................................................................................................. 71
III. Environment/Water Supply and Sanitation........................................................................................................ 72
Land Area Covered by Forests ............................................................................................................................ 72
Land Area Protected .......................................................................................................................................... 72
Depletion of Ozone Layer ................................................................................................................................... 73
Integrated Energy Development Program ......................................................................................................... 73
Water Supply & Sanitation ................................................................................................................................. 74
IV. People Works Programme‐I (PWP‐I) .................................................................................................................. 74
V. Capital and Finance for Development ................................................................................................................ 76
Capital Adequacy Ratio (CAR) ............................................................................................................................ 76
Earnings and Profitability ................................................................................................................................... 76
Liquidity .......................................................................................................................................................... 77
Management Soundness.................................................................................................................................... 77
VI. Employment ....................................................................................................................................................... 77
VII. Governance for a Just and Fair System............................................................................................................... 78
6. Monitoring the Outcome Indicators ................................................................................................................... 79
I. Education ............................................................................................................................................................ 80
Literacy Rate....................................................................................................................................................... 80
Gross Enrolment Rate (GER) at Primary Level ................................................................................................... 81
Gross Enrolment Rate (GER) at Middle Level ..................................................................................................... 82

GER at Matric Level ............................................................................................................................................ 83
Net Enrolment Rate (NER) at Primary Level: ...................................................................................................... 84
Net Enrolment Rate (NER) at Middle Level ........................................................................................................ 85
Net Enrolment Rate (NER) at Matric Level ......................................................................................................... 86
Drop‐out Rates Aged 15‐19 Years – by Gender and Class.................................................................................. 86
II. Health ................................................................................................................................................................. 87
Children under five (5) suffering from diarrhea in past 30 days ‐ by Region and Province ............................... 87
Total Fertility Rate (TFR)..................................................................................................................................... 88
Infant Mortality Rate (IMR) ................................................................................................................................ 88
Contraceptive Prevalence Rate (CPR) ................................................................................................................ 88
Pre Natal Consultations – by Province ............................................................................................................... 89
III. Environment/Water Supply and Sanitation........................................................................................................ 89
Main Sources of Drinking Water ........................................................................................................................ 89
Type of Toilet used by Household ...................................................................................................................... 90
Seats Held by Women in Senate/Parliament/Provincial Assembly ................................................................... 91
Seats Held by Women in District/Tehsil/Town/Union Councils ......................................................................... 92
7. Feedback from Household .................................................................................................................................. 93
I. Perception of Economic Situation ..................................................................................................... 94
II. Satisfaction by Facilities and Service Use .......................................................................................... 95
8. Conclusion .......................................................................................................................................................... 97
ANNEX – I ................................................................................................................................................................... 100
List of Tables
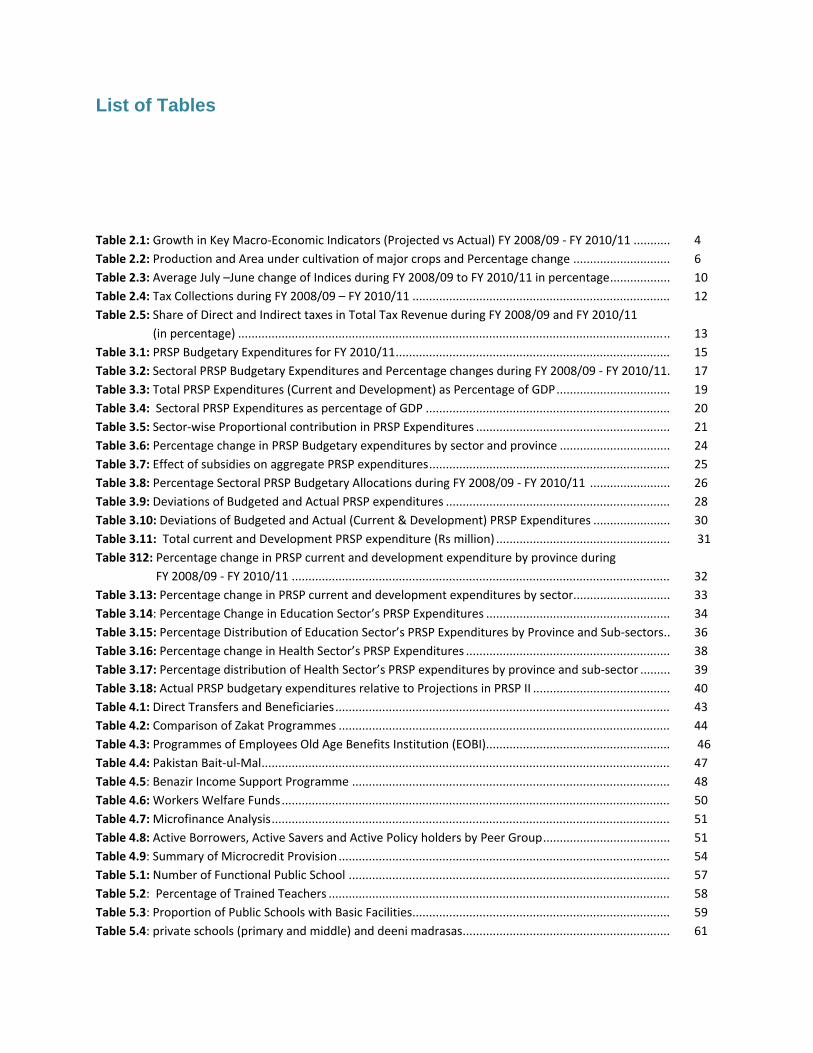
Table 2.1: Growth in Key Macro‐Economic Indicators (Projected vs Actual) FY 2008/09 ‐ FY 2010/11 ........... 4 Table 2.2: Production and Area under cultivation of major crops and Percentage change ............................. 6 Table 2.3: Average July –June change of Indices during FY 2008/09 to FY 2010/11 in percentage .................. 10 Table 2.4: Tax Collections during FY 2008/09 – FY 2010/11 ............................................................................. 12 Table 2.5: Share of Direct and Indirect taxes in Total Tax Revenue during FY 2008/09 and FY 2010/11 (in percentage) ................................................................................................................................. 13 Table 3.1: PRSP Budgetary Expenditures for FY 2010/11 .................................................................................. 15 Table 3.2: Sectoral PRSP Budgetary Expenditures and Percentage changes during FY 2008/09 ‐ FY 2010/11. 17 Table 3.3: Total PRSP Expenditures (Current and Development) as Percentage of GDP .................................. 19 Table 3.4: Sectoral PRSP Expenditures as percentage of GDP ......................................................................... 20 Table 3.5: Sector‐wise Proportional contribution in PRSP Expenditures .......................................................... 21 Table 3.6: Percentage change in PRSP Budgetary expenditures by sector and province ................................. 24 Table 3.7: Effect of subsidies on aggregate PRSP expenditures ........................................................................ 25 Table 3.8: Percentage Sectoral PRSP Budgetary Allocations during FY 2008/09 ‐ FY 2010/11 ........................ 26 Table 3.9: Deviations of Budgeted and Actual PRSP expenditures ................................................................... 28 Table 3.10: Deviations of Budgeted and Actual (Current & Development) PRSP Expenditures ....................... 30 Table 3.11: Total current and Development PRSP expenditure (Rs million) .................................................... 31 Table 312: Percentage change in PRSP current and development expenditure by province during FY 2008/09 ‐ FY 2010/11 ................................................................................................................. 32 Table 3.13: Percentage change in PRSP current and development expenditures by sector............................. 33 Table 3.14: Percentage Change in Education Sector’s PRSP Expenditures ....................................................... 34 Table 3.15: Percentage Distribution of Education Sector’s PRSP Expenditures by Province and Sub‐sectors .. 36 Table 3.16: Percentage change in Health Sector’s PRSP Expenditures ............................................................. 38 Table 3.17: Percentage distribution of Health Sector’s PRSP expenditures by province and sub‐sector ......... 39 Table 3.18: Actual PRSP budgetary expenditures relative to Projections in PRSP II ......................................... 40 Table 4.1: Direct Transfers and Beneficiaries .................................................................................................... 43 Table 4.2: Comparison of Zakat Programmes ................................................................................................... 44 Table 4.3: Programmes of Employees Old Age Benefits Institution (EOBI)....................................................... 46 Table 4.4: Pakistan Bait‐ul‐Mal .......................................................................................................................... 47 Table 4.5: Benazir Income Support Programme ............................................................................................... 48 Table 4.6: Workers Welfare Funds .................................................................................................................... 50 Table 4.7: Microfinance Analysis ....................................................................................................................... 51 Table 4.8: Active Borrowers, Active Savers and Active Policy holders by Peer Group ...................................... 51 Table 4.9: Summary of Microcredit Provision ................................................................................................... 54 Table 5.1: Number of Functional Public School ................................................................................................ 57 Table 5.2: Percentage of Trained Teachers ...................................................................................................... 58 Table 5.3: Proportion of Public Schools with Basic Facilities ............................................................................. 59 Table 5.4: private schools (primary and middle) and deeni madrasas .............................................................. 61

Table 5.5: Technical and Vocational Trainings .................................................................................................. 62 Table 5.6: National Internship Programme ....................................................................................................... 62 Table 5.7: TT‐ Immunization Coverage for Pregnant Women ........................................................................... 64 Table 5.8: Percentage of children 12‐23 months that have been immunized .................................................. 65 Table 5.9: Population coverage of Lady Health Workers .................................................................................. 65 Table 5.10: Total strength of lady health workers ............................................................................................ 66 Table 5.11: Percentage of land area covered by forests ................................................................................... 67 Table 5.12: Land protected area ....................................................................................................................... 68 Table 5.13: Depletion of Ozone layer ................................................................................................................ 68 Table 5. 14: Integrated Energy Development ................................................................................................... 69 Table 5.15: Water supply through water purification plants ............................................................................ 69 Table 5.16: Number of PWP Schemes approved under each ........................................................................... 70 Table 5.17 Capital and finance for development (Progress of output indicators) ............................................ 71 Table 5.18: Labor Force, employed labor force, and unemployed family helpers ............................................ 73 Table 6.1: Literacy‐ Population 10 Years and Older ‐ By Region and Province ................................................. 74 Table 6.2: GER at Primary Level (age 5‐9) ‐ By Region and Province (Excluding Katchi Class) ......................... 76 Table 6.3: GER at the Middle Level (age 10‐12) ‐ By Region and Province ........................................................ 77 Table 6.4: GER at the Matric Level (age 13‐14) ‐ By Region and Province ........................................................ 78 Table 6.5: NER at Primary Level (age 5‐9) ‐ By Region and Province (Excluding Katchi Class) ......................... 79 Table 6.6: NER at the Middle Level (age 10‐12) ‐ By Region and Province ....................................................... 80 Table 6.7: NER at the Matric Level (age 13‐14) ‐ By Region and Province ........................................................ 81 Table 6.8: Drop‐out Rates 15‐9 years (percent) ................................................................................................ 81 Table 6.9: Children under five (5) suffering from diarrhea in past 30 days ‐ by region and Province ............... 82 Table 6.10: Total Fertility Rate (TFR) ................................................................................................................. 83 Table 6.11: Infant Mortality Rate ‐ by Sex and Region (Deaths per thousand live births ................................. 83 Table 6.12: Contraceptive Prevalence Rate (Women Aged 15‐49 Years) ......................................................... 84 Table 6.13: Pre Natal Consultations by Province .............................................................................................. 84 Table 6.14: Main Sources of Drinking Water in Pakistan (Percentages) ........................................................... 85 Table 6.15: Type of Toilet Used by Households ................................................................................................ 86 Table 6.16: Senate/National Assembly/Provincial Assemblies ......................................................................... 87
Lists of Figures/Graphs/Boxes
Figure 2.1: Area under cultivation of major crops during FY 2008/09 ‐ FY 2010/11 ......................................... 6 Figure 2.2: Production of Major Crops during FY 2008/09 ‐ FY 2010/ ............................................................. 7 Figure 2.3: Average Change of Indices during FY 2008/09 to FY 2010/ ............................................................ 10 Figure 2.4: Monthly trends by CPI, SPI and WPI ................................................................................................ 11 Figure 2.5: Fiscal Deficit as a percentage of GDP .............................................................................................. 12 Figure 3.1: PRSP Expenditures as %age of GDP ................................................................................................. 19 Figure 3.2: Proportional Contribution by Sector for FY 2010/11 ...................................................................... 22 Figure 3.3: Proportional contribution of Broad Categories in Total Expenditures ............................................ 23 Figure 3.4: Trend in Total Current and Development PRSP Expenditures (Percentage change) in last four years 32 Figure 3.5: Percentage Distribution of Education Expenditures by Sub‐ sector during FY 2008/09 – FY 2010/11 36 Figure 3.6: Percentage Distribution of Health Expenditures by Sub‐ sector during FY 2008/09 ‐ FY 2010/11 . 39 Figure 4.1: Active Borrowers ............................................................................................................................. 52 Figure 4.2: Active Savers ................................................................................................................................... 53 Figure 4.3: Active Policy Holders ....................................................................................................................... 53 Figure 6.1: Main Sources of Drinking Water, Overall Pakistan in FY 2010/11 ................................................... 85 Figure 6.2: Type of Toilet Used by Households ................................................................................................. 86 Figure 6.3: Seats Held by Women at Various Levels ......................................................................................... 88 Figure 7.1: Perception of the economic situation of the household compared to the year before the survey 98 Figure 7.2:Perception of the situation of the community as compared to year before the survey ................ 99 Figure 7.3: Percent distribution of households satisfaction by facilities & services use ...................................

Acronyms
AJ&K Azad Jammu & Kashmir BHUs Basic Health Units BISP Benazir Income Support Programme CDA Capital Development Authority CFIs Commercial Financial Institutions CPI Consumer Price Index CSP Child Support Program CFY Current Fiscal Year EDB Engineering Development Board EOBI Employees Old Age Benefit Institution FANA Federally Administered Northern Areas FATA Federally Administered Tribal Areas FBR Federal Bureau of Revenue FBS Federal Bureau of Statistics FED Federal Excise Duty FSP Food Support Programme FRDLA Fiscal Responsibility and Debt Limitation Act FY Fiscal Year GDP Gross Domestic Product GER Gross Enrollment Rate GOP Government of Pakistan ICT Islamabad Capital Territory IFA Individual Finance Assistance IDPs Internally Displaced People IMR Infant Mortality Rate IR Institutional Rehabilitation KP Kyber Pakhtoon Khawa LFS Labour Force Survey LHWs Lady Health Workers LSM Large Scale Manufacturing LP Langer Program MFBs Micro Finance Banks
MFIs Micro Finance Institutions NCRCL National Centre for Rehabilitation of Child Labour NFNE Non Food Non Energy NEMIS National Educationnel Mangement Information System NER Net Enrolment Rate NGO Non Government Organizations NIP National Internship Programme PBM Pakistan Bait‐ul‐Maal PFY Previous Fiscal Year PIFRA Project for improving financial reporting and auditing PWP People Works Program PRSP Poverty Reduction Strategy Paper PFSP Punjab Food Support Program PSRP Punjab Sasti Roti Program PMN Pakistan Micro‐Finance Network PH Pakistan Homes PSH Pakistan Sweet Homes PWP Peoples Works Program RSPs Rural Support Programs SMEs Small and Medium Enterprises SPI Sensitive Price Index SPRSM Strengthening Poverty Reduction Monitoring Project SBP State Bank of Pakistan TFR Total Fertility Rate TT Tetanus Toxoid VTC Vocational Training Center WPI Wholesale Price index WWF Workers Welfare Fund YoY Year‐on‐Year

Chapter: 1
Introduction

“We must honestly recognize that poverty is not a mere flue; it is more like a cancer. It will take determined
policy actions to banish poverty – including redistribution of assets and credits, provision of adequate social
services and generation of pro-poor growth. It will also require a new model of development which enlarges
human lives, not just GNP, and whose central purpose is development of the people for the people by the
people.”
------Dr. Mahbub ul Haq (State of the World Forum: 8 November 1997)
1.1 In 2008, when the new government came to power, Pakistan was facing the twin challenges of reviving economic growth and eliminating poverty and other social inequities. Following broad national consultations, the government announced its development strategy which focused on:
1. Macroeconomic Stability & Real Sector Growth 2. Protecting the Poor and the Vulnerable 3. Increasing Productivity & Value Addition in Agriculture 4. Integrated Energy Development Programme 5. Making Industries Internationally Competitive 6. Human Development for the 21st Century 7. Removing Infrastructure Bottlenecks through Public Private Partnerships (PPPs) 8. Capital and Finance Development 9. Governance for a Just and Fair System
1.2 This reform agenda formed the backbone of the Poverty Reduction Strategy –II (PRSP‐II) finalized in December 2008 after a broad‐based consultative process based on above mentioned nine (9) pillars. The government launched a multifaceted attack on poverty that combined macroeconomic stabilization, reduction in debt burden, fundamental structural reforms, enhanced social service delivery and improved governance. 1.3 The Poverty Reduction Strategy Papers (PRSP) offers a potentially powerful tool to forge a consensus on policies, priorities and resources needed at all levels of government to reduce poverty and inequities, impeding the pace of economic and social development in Pakistan. To achieve the targets underlying these principles, the PRSP emphasized the importance of a well‐developed and extensive monitoring and evaluation system for assessing the impact of the government’s poverty reduction strategies and resource allocations, along with a good feedback mechanism for informed decision making. For this purpose it identified 17 pro‐poor sectors and a set of related social sector indicators – intermediate and process indicators, outputs and outcomes, which were finalized after a long consultative process for monitoring different dimensions of poverty. The indicators cover macroeconomic targets as well as poverty, education, health, population, water and sanitation, housing, rural development, environment, gender, employment, food support, governance, children, social funds, and microfinance.

1.4 The Poverty Reduction Strategy Paper (PRSP) annual progress report is the tenth in line ever since the inception of PRSP Secretariat in the Ministry of Finance. This annual report covers the PRSP‐II period i.e. FY 2008/09 to FY 2010/11.The PRSP Secretariat regularly reports budgeted and non‐budgeted spending in selected pro‐poor sectors followed by the evaluation of key social sector indicators. The purpose of PRSP quarterly and annual reports is to keep track of the progress taken towards poverty reduction and socio‐economic development. 1.5 The PRSP–II period progress report begins with an introduction in Section 1, followed by the detail of targets achieved during the PRSP‐II period discussed in Section 2. An overview of Pakistan’s key economic indicators is given in Section 3. Section 4 gives a detailed analysis of the data of PRSP budgetary expenditures. Subsequently, Section 5 highlights both budgetary and non budgetary programs that provide social protection and social safety nets to the poor and vulnerable. Section 6 explains in detail the key outputs of intermediate indicators. The outcomes/results of the investments made by the Government of Pakistan and others have been covered in Section 7. Data from the Pakistan Social and Living Standard Measurement Surveys (PSLM) FY 2008/09 ‐ FY 2010/11 has been utilized to give a factual analysis of funds allocated particularly in Education, Health and Water Supply and Sanitation sectors. Section 8 gives the concluding remarks. 1.6 The economy registered lower growth mainly due to the massive floods that hit the country in two consecutive years. The catastrophic floods were huge and its devastating consequences were witnessed in the form of a sharp decline in nearly all macroeconomic indicators. The production of crops remained low as the two major crops were damaged i.e. cotton and rice. Impressive services sector performance was the only stimulant in an otherwise declining economy. The post‐flood supply disruptions that were temporary in nature became the key cause of persistently high inflation. Inflation remained in double digit in three consecutive years. The external sector showed an overall improvement on the basis of exports and buoyant remittances. Rise in global petroleum prices had serious implication for the already large fiscal deficit. It is therefore of critical significance that the Government focuses on generating revenues by increasing the tax base rather than controlling the deficit by reduction in development spending. 1.7 Overall PRSP budgetary expenditures in seventeen pro‐poor sectors of PRSP‐II during the last three years (FY 2008/09 – FY 2010/11) were substantial. A total of Rs. 1,245,541 million were incurred in FY 2010/11 (registering a growth of 12.13 percent) against Rs. 1,110,762 million in FY 2009/10 (13.66 percent growth) and Rs. 977,228 million in FY 2008/09. Expenditures on natural calamities and other Disasters underwent maximum YoY growth of 291.42 percent in FY 2010/11 on account of rehabilitation activities caused by the massive floods that hit the country during the previous years. In contrast to the considerable cut down by the government in development spending, the Land Reclamation, Education, Health, Justice, Administration and Law and Order sectors provided support in effective utilization of expenditures allocated for developmental programs. 1.8 Social protection and Social safety nets in the form of direct cash transfers, both budgetary and non‐budgetary, through Zakat, Pakistan Bait‐ul‐Mal (PBM), Employees’ Old Age Benefit Institution

(EOBI), Benazir Income Support Programme (BISP), Workers Welfare Fund (WWF) Programme and provision of Micro‐credit are intrinsically linked with Pakistan’s Poverty Reduction Strategy Papers (PRSPs). Targeting the poor and vulnerable is an integral part of PRSP. The government of Pakistan understands the need for curtailing the detrimental implications of poverty on the economy and aims to provide full support to the most vulnerable segments of the society through social safety nets. Total transfers through all programs showed a net decrease of 11 percent in terms of grants and 8 percent in terms of beneficiaries during FY2010/11 as compared to FY2009/10. During all three FYs of PRSP–II period, the maximum disbursement was in FY2009/10 of Rs.74,628 million, followed by Rs. 66,301 million in FY2010/11 and lastly Rs.45,840 million in FY2008/09. The total beneficiaries in the same period were again the highest in FY2009/10 i.e. 5.87 million, followed by 5.43 million in FY 2010/11 and 4.358 million in FY2008/09. During the PRSP–II period, the total budgetary to non budgetary transfers were highest in FY 2009/10 i.e. 84:16 and lowest in FY 2008/09 77:23. The ratio remained almost same i.e. 83:17 in the FY 2010/11. The total budgetary to non budgetary beneficiaries were highest in FY 2010/11 i.e. 91:9 and lowest in FY 2008/09 i.e. 67:33. A similar ratio of 72:28 was witnessed in FY 2009/10. 1.9 The Education and Health sectors are key elements of the Poverty Reduction Strategy. PSLM Survey FY 2010/11 recently released by Federal Bureau of Statistics, shows that literacy rate increased from 57 percent in FY 2008/09 to 58 percent in FY 2010/11 showing an improvement of 1 percentage point. Literacy remained much higher amongst men than women in Pakistan. Overall GER at primary level (age 5‐9) increased to 92 percent in FY 2010/11, 1 percent more than in FY 20o8/09. GER, for boys increased by 1 percentage point to 100 percent during FY 2010/11 relative to 99 percent in FY 2008/09. GER for girls stood at 83 percent during both FYs 2008/09, 2010/11 showing no change.

Chapter: 2
Targets achieved Under PRSP-II (FY2008/09--FY2010/11)

“The only worthwhile achievements of men are those which are socially useful."
- Alfred Adler
2.1 The performance of any project can be scrutinized by comparing its actual performance with the targets laid down at the commencement of the project. The PRSP‐II has completed its initial tenure of three years from FY2008/09 to FY2010/11. This section intends to elaborate the targets achieved in the area of macroeconomic stability, pro‐poor budgetary expenditures and social protection & safety nets during PRSP‐II period. It also tries to establish the impact of social sector and pro‐poor budgetary expenditures on outcomes.
I. Macroeconomic Stability and Real Sector Growth
2.2 The macroeconomic stability and real sector growth is the first and primary pillar of PRSP‐II. The targets set under the PRSP‐II period were based upon the economic projections and policy options taken by the government. The reduction of poverty heavily depends on the macroeconomic environment of a country. Any policy intervention aimed at reducing poverty cannot reach the masses unless it is supported by a stable economy. This section intends to evaluate the actual performance of macroeconomic indicators against the targets set under the PRSP‐II (FY 2008/09‐ FY 2010/11). 2.3 Despite the turbulent political and economic environment in the country, the GDP growth rate still managed to record 2.4 percent in FY 2010/11. The economy witnessed a sharp downturn in FY2010/11 whereas in FY2009/10 the economy saw a rise in GDP growth i.e. 3.8 percent as compared to FY 2008/09 i.e. 1.7 percent the lowest ever recorded in the last three years. Pakistan’s macroeconomic indicators showed a declining trend mainly because of the disastrous floods and its involvement in the war on terror. 2.4 Almost one‐fifth of the country’s agricultural land was swamped with floods, causing massive disruptions in the economic growth of the country. The financial crisis, intensification of war on terror, and security vulnerability are the major factors in hindering the economic activity. Agricultural sector acutely suffered as the growth rate shrank to 1.2 percent in FY 2010/11. In spite of its considerable significance, the agricultural sector remained neglected by the policy makers. The services sector on the other hand played a vital role in the economic progress during the last few years and consequently has emerged as one of the driving forces of economic growth, displaying the highest trajectory trend in FY 2010/11 i.e. 4.1 percent, against the 2.9 percent in FY 2009/10. Although, the progress of services sector during FY 2008/09 and FY 2009/10 was nearer to the projected rate but it achieved the projected figures in FY 2010/11 (see table 2.1). The performance of some subsectors in services sector has not been very encouraging as the Finance & Insurance witnessed a negative growth from FY2008/10 to FY2010/11. The wholesale & trade after depicting good performance in FY2008/09 declined drastically in FY2009/10 and FY2010/11, failing to meet the projected growth rate.
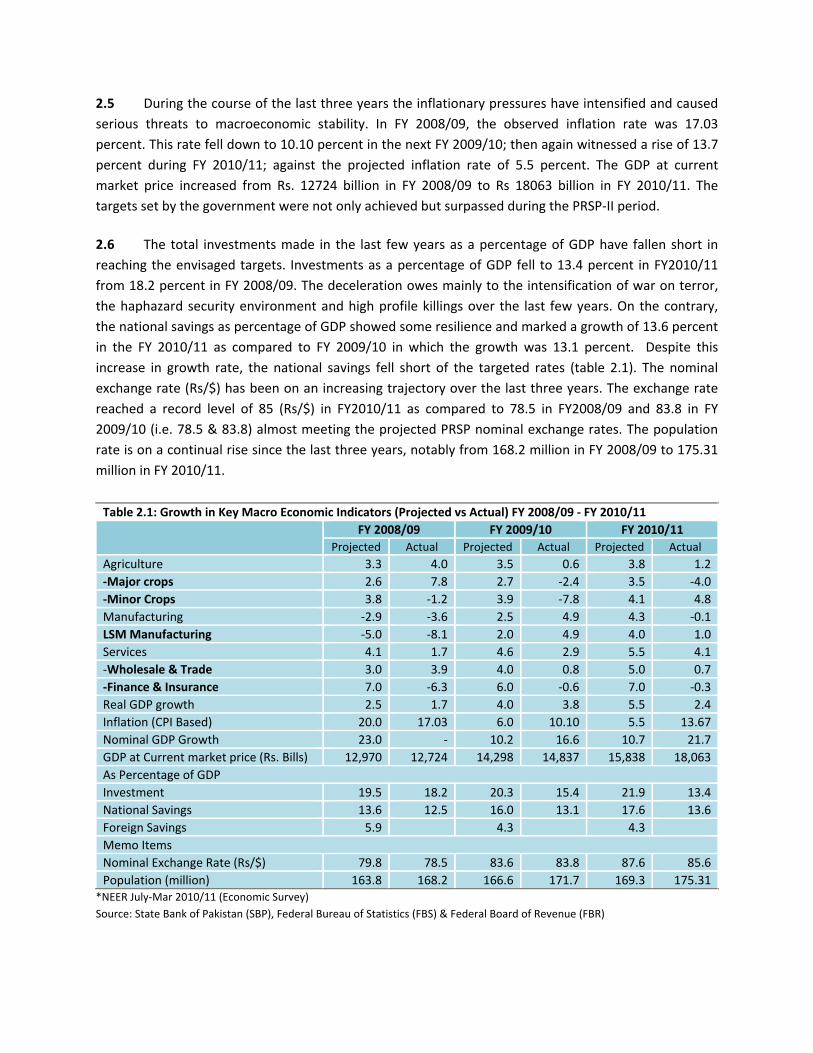
2.5 During the course of the last three years the inflationary pressures have intensified and caused serious threats to macroeconomic stability. In FY 2008/09, the observed inflation rate was 17.03 percent. This rate fell down to 10.10 percent in the next FY 2009/10; then again witnessed a rise of 13.7 percent during FY 2010/11; against the projected inflation rate of 5.5 percent. The GDP at current market price increased from Rs. 12724 billion in FY 2008/09 to Rs 18063 billion in FY 2010/11. The targets set by the government were not only achieved but surpassed during the PRSP‐II period. 2.6 The total investments made in the last few years as a percentage of GDP have fallen short in reaching the envisaged targets. Investments as a percentage of GDP fell to 13.4 percent in FY2010/11 from 18.2 percent in FY 2008/09. The deceleration owes mainly to the intensification of war on terror, the haphazard security environment and high profile killings over the last few years. On the contrary, the national savings as percentage of GDP showed some resilience and marked a growth of 13.6 percent in the FY 2010/11 as compared to FY 2009/10 in which the growth was 13.1 percent. Despite this increase in growth rate, the national savings fell short of the targeted rates (table 2.1). The nominal exchange rate (Rs/$) has been on an increasing trajectory over the last three years. The exchange rate reached a record level of 85 (Rs/$) in FY2010/11 as compared to 78.5 in FY2008/09 and 83.8 in FY 2009/10 (i.e. 78.5 & 83.8) almost meeting the projected PRSP nominal exchange rates. The population rate is on a continual rise since the last three years, notably from 168.2 million in FY 2008/09 to 175.31 million in FY 2010/11.
Table 2.1: Growth in Key Macro Economic Indicators (Projected vs Actual) FY 2008/09 ‐ FY 2010/11 FY 2008/09 FY 2009/10 FY 2010/11
Projected Actual Projected Actual Projected Actual Agriculture 3.3 4.0 3.5 0.6 3.8 1.2‐Major crops 2.6 7.8 2.7 ‐2.4 3.5 ‐4.0‐Minor Crops 3.8 ‐1.2 3.9 ‐7.8 4.1 4.8Manufacturing ‐2.9 ‐3.6 2.5 4.9 4.3 ‐0.1LSM Manufacturing ‐5.0 ‐8.1 2.0 4.9 4.0 1.0Services 4.1 1.7 4.6 2.9 5.5 4.1‐Wholesale & Trade 3.0 3.9 4.0 0.8 5.0 0.7‐Finance & Insurance 7.0 ‐6.3 6.0 ‐0.6 7.0 ‐0.3Real GDP growth 2.5 1.7 4.0 3.8 5.5 2.4Inflation (CPI Based) 20.0 17.03 6.0 10.10 5.5 13.67Nominal GDP Growth 23.0 ‐ 10.2 16.6 10.7 21.7GDP at Current market price (Rs. Bills) 12,970 12,724 14,298 14,837 15,838 18,063As Percentage of GDP Investment 19.5 18.2 20.3 15.4 21.9 13.4National Savings 13.6 12.5 16.0 13.1 17.6 13.6Foreign Savings 5.9 4.3 4.3 Memo Items Nominal Exchange Rate (Rs/$) 79.8 78.5 83.6 83.8 87.6 85.6Population (million) 163.8 168.2 166.6 171.7 169.3 175.31
*NEER July‐Mar 2010/11 (Economic Survey) Source: State Bank of Pakistan (SBP), Federal Bureau of Statistics (FBS) & Federal Board of Revenue (FBR)

II. Pro‐Poor Budgetary Expenditures
2.7 The comparison of actual PRSP expenditures as percentage of GDP for the three years period under analysis is illustrated in Table 2.2. In aggregate terms, PRSP actual expenditures surpassed the targets by 0.28 percentage points in FY 2010/11; 1.56 percentage points in FY 2009/10; and 1.6 percentage points in FY 2008/09. Similarly, expenditures in current and development categories exceeded the projections in all the three years, with one exception that is development expenditures that fell short by 0.36 percentage points in FY 2010/11 against the target of 2.2 percent of GDP. 2.8 In the course of three years, actual expenditures as percentage of GDP exceeded the PRSP‐II targets in nine pro‐poor sectors namely Roads Highways & Bridges, Environment Water Supply & Sanitation, Health, Rural development, Subsidies, ‘Natural Calamities & other Disasters’, PWP‐I, Justice Admin and Law & Order. In the Law & Order sector the ratio of actual expenditures as percentage of GDP as compared to forecasted PRSP percentages increased by 0.44 percent points in FY 2008/09; 0.67 percent points in FY 2009/10; and 0.68 percent points in FY 2010/11. However, expenditure to GDP ratio for Education, Agriculture, Social Security & Welfare, Pakistan Bait‐ul‐Maal, Benazir Income Support Programme and Pakistan Bait‐ul‐Maal remained below the projected figures during FY2009/10 and FY2010/11.
2.9 In the Health sector, ratio of actual expenditures to GDP remained above PRSP‐II projections in FY2008/09 and FY2009/10 but declined to 0.59 percent in FY 2010/11. Actual expenditure in Education surpassed the target in FY 2008/09, but lagged behind in FY 2009/10 and FY 2010/11. Hence in overall terms, Health sector performed better than education in terms of actual expenditure to GDP as compared to PRSP‐II Projections.
Table 2.2: Actual PRSP Budgetary Expenditures Relative to Projection in PRSP‐II (in terms of expenditure to GDP ratio)
PRSP Expenditures FY 2008/09 FY 2009/10 FY 2010/11
Projec‐ted
Actual Projec‐ted
Actual Projec‐ted
Actual
Development 1.74 2.36 1.9 2.22 2.2 1.84
Current 4.12 5.11 4.12 5.35 4.43 5.06
Total 5.86 7.46 6.01 7.57 6.62 6.9
Market Access and Community Services
Roads, Highways, & Bridges 0.36 0.76 0.41 0.67 0.48 0.55
Environment/ Water Supply & Sanitation 0.07 0.17 0.08 0.17 0.08 0.16
Human Development
Education 1.51 1.84 1.82 1.77 2.2 1.78
Health 0.34 0.64 0.43 0.64 0.56 0.59
Population Planning 0.03 0.04 0.03 0.05 0.03 0.03
Rural Development
Agriculture 0.7 0.68 0.77 0.71 0.84 0.64
Continue…
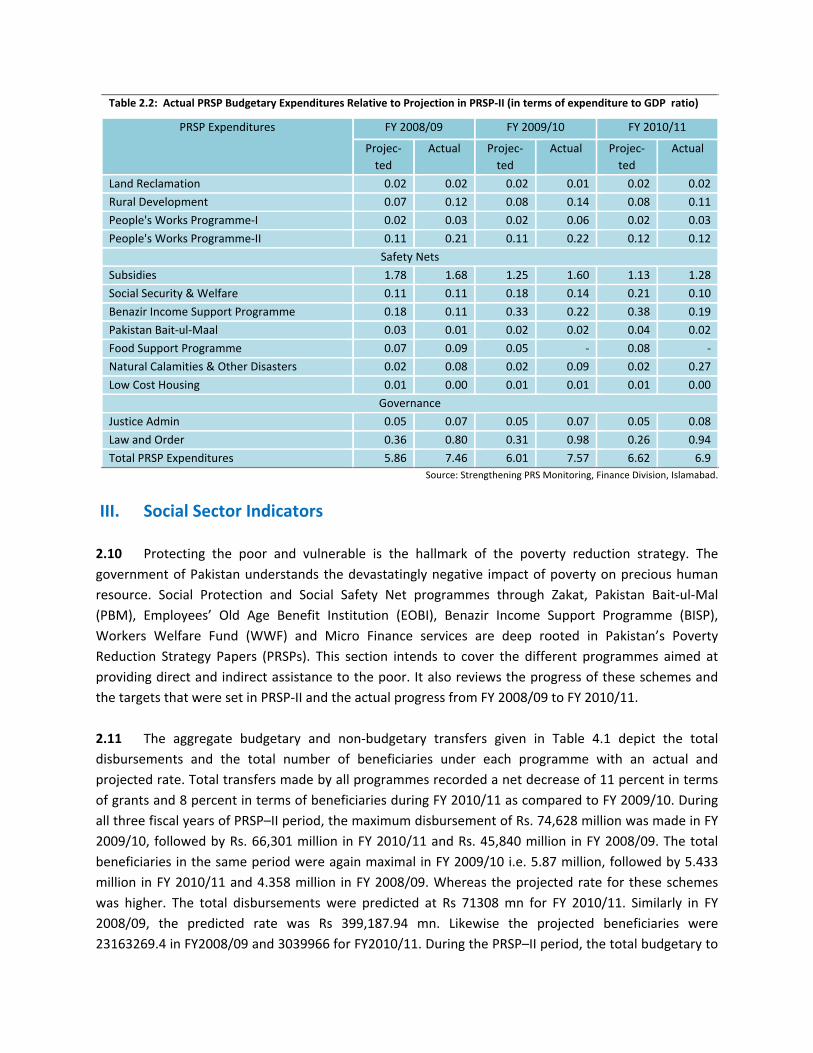
Table 2.2: Actual PRSP Budgetary Expenditures Relative to Projection in PRSP‐II (in terms of expenditure to GDP ratio)
PRSP Expenditures FY 2008/09 FY 2009/10 FY 2010/11
Projec‐ted
Actual Projec‐ted
Actual Projec‐ted
Actual
Land Reclamation 0.02 0.02 0.02 0.01 0.02 0.02
Rural Development 0.07 0.12 0.08 0.14 0.08 0.11
People's Works Programme‐I 0.02 0.03 0.02 0.06 0.02 0.03
People's Works Programme‐II 0.11 0.21 0.11 0.22 0.12 0.12
Safety Nets
Subsidies 1.78 1.68 1.25 1.60 1.13 1.28
Social Security & Welfare 0.11 0.11 0.18 0.14 0.21 0.10
Benazir Income Support Programme 0.18 0.11 0.33 0.22 0.38 0.19
Pakistan Bait‐ul‐Maal 0.03 0.01 0.02 0.02 0.04 0.02
Food Support Programme 0.07 0.09 0.05 ‐ 0.08 ‐
Natural Calamities & Other Disasters 0.02 0.08 0.02 0.09 0.02 0.27
Low Cost Housing 0.01 0.00 0.01 0.01 0.01 0.00
Governance
Justice Admin 0.05 0.07 0.05 0.07 0.05 0.08
Law and Order 0.36 0.80 0.31 0.98 0.26 0.94
Total PRSP Expenditures 5.86 7.46 6.01 7.57 6.62 6.9 Source: Strengthening PRS Monitoring, Finance Division, Islamabad.
III. Social Sector Indicators
2.10 Protecting the poor and vulnerable is the hallmark of the poverty reduction strategy. The government of Pakistan understands the devastatingly negative impact of poverty on precious human resource. Social Protection and Social Safety Net programmes through Zakat, Pakistan Bait‐ul‐Mal (PBM), Employees’ Old Age Benefit Institution (EOBI), Benazir Income Support Programme (BISP), Workers Welfare Fund (WWF) and Micro Finance services are deep rooted in Pakistan’s Poverty Reduction Strategy Papers (PRSPs). This section intends to cover the different programmes aimed at providing direct and indirect assistance to the poor. It also reviews the progress of these schemes and the targets that were set in PRSP‐II and the actual progress from FY 2008/09 to FY 2010/11. 2.11 The aggregate budgetary and non‐budgetary transfers given in Table 4.1 depict the total disbursements and the total number of beneficiaries under each programme with an actual and projected rate. Total transfers made by all programmes recorded a net decrease of 11 percent in terms of grants and 8 percent in terms of beneficiaries during FY 2010/11 as compared to FY 2009/10. During all three fiscal years of PRSP–II period, the maximum disbursement of Rs. 74,628 million was made in FY 2009/10, followed by Rs. 66,301 million in FY 2010/11 and Rs. 45,840 million in FY 2008/09. The total beneficiaries in the same period were again maximal in FY 2009/10 i.e. 5.87 million, followed by 5.433 million in FY 2010/11 and 4.358 million in FY 2008/09. Whereas the projected rate for these schemes was higher. The total disbursements were predicted at Rs 71308 mn for FY 2010/11. Similarly in FY 2008/09, the predicted rate was Rs 399,187.94 mn. Likewise the projected beneficiaries were 23163269.4 in FY2008/09 and 3039966 for FY2010/11. During the PRSP–II period, the total budgetary to

non budgetary transfers were highest in FY 2009/10 i.e. 84:16 and lowest in FY 2008/09 i.e. 77:23. The same ratio of 83:17 was observed in FY 2010/11. The total budgetary to non budgetary beneficiaries were highest in FY 2010/11 i.e. 91:9 and lowest in FY 2008/09 67:33. The same ratio of 72:28 was recorded in FY 2009/10. 2.12 The total disbursements under the Social Security and other Welfare in FY 2010/11 declined to Rs 17,617 million from Rs. 20,278 million in FY 2009/10. Under Pakistan Bait‐ul‐Mal, the total number of beneficiaries declined from 1,915,071 in FY 2009/10 to 1,885,035 in FY 2010/11. In contrast, the projected beneficiaries under the PBM during FY 2008/09 and FY 2010/11 were 2,045,000 and 2,64,1000 in Rs 7,250 mn and Rs 31,588 mn. Whereas the actual beneficiaries for the FY 2008/09 and FY 2010/11 were 1,159,822 and 1,915,071 respectively. The number of beneficiaries under Benazir Income Support Programme (BISP) increased in the course of three years time period i.e. 1.76 million in FY 2008/09 to 3.081 million in FY 2010/11, but it failed to meet the projected number of beneficiaries covered in the BISP programme. In non‐budgetary social protection and safety net programmes Zakat, Employees’ Old Age Benefit Institution (EOBI), Worker’s Welfare Fund (WWF) the actual figures fell short of the projected figures under PRSP‐II period. Contrary to this the WWF in FY 2008/09 have shown remarkable performance in the number of beneficiaries that stood at 63,008 mn as compared to the target set in the PRSP‐II i.e. 23,760. The actual amount disbursed was Rs 2,087mn that is much smaller as compared to the projections for WWF for FY 2008/09. The aggregate number of loans disbursed under the microcredit observed a decreasing trend in FY 2010/11 i.e. 1,892, 966 while in FY2008/09 and FY2009/10 an increase trend was exhibited from 1,939,050 to 1,966,457 respectively. Table 2.3 reflects upon the performance of different programmes functioning under the social protection and safety nets.
Table 2.3: Direct Transfers and Beneficiaries
Programme Disbursement / Beneficiaries
FY 2008/09 FY 2009/10 FY 2010/11
Budgetary Transfers
Social Security & Other Welfare
Total Expenditure (Rs. Million)
Projected Actual Projected Actual Projected Actual 13,957 20,278 ‐ 17,617
Total Beneficiaries N/A N/A ‐ N/A Pakistan Bait‐ul‐Mal (all Programmes)
Amount Disbursed (Rs. Million)
7,250 3,432
2,602 31,588 3,224
Total Beneficiaries 2,045,000 1,159,822 1,915,071 2,641,000 1,885,035
BISP Amount Disbursed (Rs. Million)
34,000 15,800
32,000 ‐ 34,330
Total Beneficiaries 3.4 1,760,000 2,290,000 7,000 3,081,000
Punjab Sasti Roti Program (PSRP)
Amount Disbursed (Rs. Million)
1900 ‐ 8000 ‐ ‐
Total Beneficiaries ‐ ‐ 1. Sub Total: Budgetary Transfers
Amount Disbursed (Rs. Million)
54250 35,089
62,880 31,588 55,171
Total Beneficiaries 2,945,003.4 2,919,822 4,205,071 2,648,000 4,966,035
Non‐Budgetary Transfers
Zakat Amount disbursed (Rs. Million)
5123.994 2,877 ‐ 2,874
218.9
Total Beneficiaries 1,085,378 1,289,050 110,915 Continue…

Table 2.3: Direct Transfers and Beneficiaries
Programme Disbursement / Beneficiaries
FY 2008/09 FY 2009/10 FY 2010/11
EOBI Amount disbursed (Rs. Million)
4,839 7,464 ‐
11059 9,366
Total Beneficiaries 194,506 300,478 ‐ 363,217 336,281 Workers Welfare Fund (WWF)*
Amount disbursed (Rs. Million)
27,975 2,087
2,432 28,661 1545.5
Total Beneficiaries 23,760 63,008 70,403 28,749 19,952 2. Sub Total: Non‐Budgetary Transfers
Amount Disbursed (Rs. Million)
34,937.944 10,751
11,748 39720 11,130
Total Beneficiaries 218,266 1,438,386 1,669,805 391,966 467,148
Total : 1+2 Amount Disbursed (Rs. Million)
399,187.94 45,840
74,628 71308 66,301
Total Beneficiaries 23,163,269.4 4,358,208 5,874,876 3,039,966 5,433,183
Micro Finance Amount Disbursed (Rs. Million)
8,500 28,660
33,775
42,384
(micro credit only) Total Loans 910,000 1,939,050 1,966,457 1,892,966
Chapter: 3
Overview of Pakistan’s Economy
“Government's view of the economy could be summed up in a few short phrases: If it moves, tax it. If it keeps
moving, regulate it. And if it stops moving, subsidize it.”
------Ronald Reagan
A brief review of growth trends in macroeconomic indicators is given below:
I. Agriculture
3.1 The agriculture sector in Pakistan mainly consists of crops, livestock, fishing and forestry. Majority of the population depends directly or indirectly on income streams generated by the agriculture sector. It provides employment to 44 percent of the country’s labor force. The agriculture sector has witnessed a persistent decrease in its share in GDP during the last three fiscal years from 4.0 percent in FY2008/09 to 1.2 percent in FY 2010/11. Its growth fell to a record level of 0.6 percent during the FY 2009/10.The share of agricultural sector during FY 2010/11 noticed a slight increase as compared to FY 2009/10. Low productivity, water shortages, rising seed and fertilizer prices, and energy crisis remained major challenges in the agriculture sector. 3.2 Despite its undeniable significance for economic growth, exports, employment and food security, the performance of agriculture sector depicted a decreasing trajectory during the PRSP‐II period. Growth in the major crop sub‐sectors has been falling for the past three years due to natural calamities. Three out of four major crops witnessed negative growth from FY2008/09 to FY2010/11. The major crops accounting for 33.4 percent of GDP in FY 2008/09 declined to 32.8 percent in FY 2009/10. In FY 2010/11 their share in GDP further declined to 31.8 percent.
3.3 Due to the unprecedented floods in FY 2010/11, the agricultural sector was badly damaged as the two major crops i.e. cotton and rice was hit the hardest by the unpredictable weather conditions. The agricultural sector largely suffered due to water shortages, decline in the availability of seeds and lack of infrastructural invention. Because of the persistent issues, YoY growth area under cultivation of cotton, rice and wheat declined to 18 percent, 13 percent and 2 percent respectively. The actual production of wheat and sugarcane exceeded the targeted amount as it accounted 25.2 percent and 55.30 percent growth respectively in FY 2010/11 showing an improved production scale as compared to FY 2008/09. The actual YoY production under cultivation of major crops of cotton and rice declined in FY 2010/11 whereas during the FY 2008/09, three out of four major crops depicted a slow YoY production rate in rice, sugarcane and wheat.

Table 3.1 : Production and Area under cultivation of major crops and Percentage change Area under Cultivation (million hectares)
Crops FY 09 FY10 FY11
(Target) FY11
(Actual) YoY growth in FY 10
YoY growth in FY 11
Cotton 2.8 3.106 3.2 2.689 10.7 ‐13.4Sugarcane 1 0.943 1.07 0.988 ‐10 4.78Rice 3 2.883 2.710 2.365 ‐3.31 ‐18.0Wheat 9 9.132 9.045 8.892 1.11 ‐2.63
Production (million tons; cotton in ’million bales of 0.17009 kg each)
FY 09 FY10 FY11T FY11 YoY growth in FY 10
YoY growth in FY 11
Cotton 11.8 12.914 14.010 11.5 9.3 ‐11.0Sugarcane 50 49.373 53.690 55.308 ‐1.2 12.02Rice 7 6.882 6.176 4.823 ‐1.4 ‐30.0Wheat 24 23.311 25.000 25.2 ‐.0.41 8.1
Source: Federal Bureau of Statistics (FBS)
3.4 The graphs given below cover the last three fiscal years from FY 2008/09 to FY 2010/11 for major crops i.e. cotton, sugarcane, rice and wheat. As evident, the production of sugarcane and wheat has improved in the current year whereas the cotton and rice show decline in productivity mainly due to the destruction caused by the floods.
2.8
1.0
3.0
9.0
3.106
0.943
2.883
9.132
2.689
0.988
2.365
8.892
0
1
2
3
4
5
6
7
8
9
10
Cotton Sugarcane Rice Wheat
Figure: 3.1 Area under cultivation of major crops (million hectares) for FY 2008/09, 2009/10 & 2010/11
FY 09 FY 10 FY 11

3.5 Reversing the gloomy growth trajectory rates in agricultural sector is critical to escape the trap of slow economic growth and poverty. Developing the agri‐industry as a more diversified and technologically advanced sector requires a precise and thorough intervention in policies. Such policies should provide crop insurance and storage facilities, increase investment in infrastructure to improve water shortage issues; farm‐to‐market roads, energy and value‐chains (e.g. through processing and cold storages).
II. Manufacturing
3.6 The manufacturing sector has always been a major contributor in economic growth, employment generation, and trade development of a country. Over the FY2009/10 the manufacturing sector enlarged by 4.9 percent as compared to the negative growth rate of 3.6 percent in FY 2008/09. In FY2010/11 it observed a negative trajectory of 0.1 percent. The lower demand due to global economic meltdown and supply side constraints caused the manufacturing sector to weaken over the last few years. 3.7 The Large Scale Manufacturing recorded its weakest growth in FY2008/09. Most of the growth in the Large Scale Manufacturing (LSM) was witnessed in FY 2009/10 as it posted an increase of 4.9 percent, while in the FY 2010/11 it declined to 1 percent. The decline of the LSM sector is mainly attributed to factors like weakening of demand in the international and domestic market, inflation, high input costs, high government sector borrowing, crowding out of private sector investment and acute energy shortages. 3.8 Textile and clothing industry continues to be the driving force of the manufacturing sector. There is no other industry that can complete efficiently in the international market. The textile industry
11.8
50.0
7.0
24.0
12.914
49.373
6.882
23.311
11.5
55.308
4.823
25.2
0
10
20
30
40
50
60
Cotton Sugarcane Rice Wheat
Figure: 3.2 Production of Major Crops (million tons; cotton in ’million bales of 0.17009 kg each) for FY 2008/09, FY 2009/10 & 2010/11
FY 09 FY 10 FY 11

is pre‐dominantly an export orientated industry as it observed an increasing trend in export earnings in the last three fiscal years (FY 2008/09‐ FY 2010/11). The positive terms of trade have improved the competitiveness of textile industry in particular. In FY 2010/11, the total export earnings from textile industry have increased to US$ 99,565 million from US$ 7,193,588 million. 3.9 Pakistan’s Engineering Industry contributes a large share in the overall trade in the country. The Engineering Development Board (EDB) has worked like a bridge between the government and engineering sector of Pakistan by initiating a consultative process with several private sector stakeholders/organizations and through formulation of committees headed by private sector representatives. The Engineering Industry possesses a large potential to grow and contribute to GDP and exports. The automotive industry has progressed well in terms of cars, LCVs/ Jeeps, and two/three wheelers as it managed to record a positive growth of 16.4%, 20.5% and 12.6% respectively during FY2010‐11.In the production of trucks, buses and tractors the industry has observed a negative trend of 24.7%, 19.4% and 2.2% respectively during the years under review. The continual decline in production of these automotive products is due to their falling demand as imported vehicles have captured a considerable share of the market. The fertilizer industry is the second largest consumer of gas after the power sector. Its production has taken a sharp downturn because of persistent gas shortages. 3.10 The importance of Small and Medium Enterprises (SMEs) in economic development cannot be understated. This sector has emerged as a lifeline of Pakistan’s economy. According to recent estimates, it contributed 40 percent to the GDP. The number of projects under the SMEs has seen a rising trend in the last few years as it increased from 16 projects to 28 projects in FY 2010/11. A total of Rs 2.8 billion in collaboration with both private and public stakeholders was allocated for these projects. 3.11 Pakistan has a diverse geological framework, ranging from pre‐Cambrian to the present that includes a number of zones hosting several metallic minerals, coal deposits, precious and semi‐precious stones. Despite this abundance of resources, the mining and quarrying industry has depicted a mixed trend during FY 2008/09 to FY 2010/11. The mining and quarrying industry improved by 2.2 percent in FY 2009/10 from ‐0.5 percent but again declined by 0.4 percent depicting an overall negative trend.
III. Services
3.12 The services sector has emerged as a key contributor in economic growth in the recent years. During the last three years, services sector has observed a rising trajectory growth. This sector has caused a major transformation in the economic landscape since the share of the services sector registered a significant increase of 53.3 percent in the FY 2010‐11 which is the maximum growth in the past two decades. The weakest growth rate was seen in FY 2008/09 i.e. 1.7 percent which increased to 4.1 percent in the last fiscal year 2010/11. The FY 2010/11 marked the highest growth rate compared to FYs 2008/09 and 2009/10 of the PRSP‐II era.

3.13 The services sector comprises of transport, wholesale and retail trade, public administration and defense, finance and insurance, and social services. During the last few years, the services sector has been dominated by the public administration and defense sector. This is due to the rise in government employees and higher defense spending in the previous decades. Increase in social sector services because of the logistics support and flood relief activities have also enlarged the share of public administration and defense. However, the performance of finance and insurance sector has deteriorated due to the global financial crisis in the course of three years.
IV. Inflation
3.14 Inflationary pressures heightened around the world in the course of last few years; driven mostly by the soaring food, and oil prices. The intensification of inflation during these years was due to domestic food and non‐food inflation, high global commodity prices and domestic market imperfections. The devastating floods and strong global prices of oil and agricultural commodities along with the massive government borrowings kept the inflation rate in double digits for three consecutive years from FY 2008/09 to FY 2010/11. The supply constraints have also upset the economic growth badly; disrupting gas and electricity shortages; and increasing cost of capital. 3.15 All price indices depicted a substantial increase in the outgoing FY 2010/11 posing serious concerns to the macroeconomic stability of Pakistan (see table 3.2). The inflation rate fell sharply to 10.1 percent in FY2009/10 as compared to 17.03 in the FY2008/09. It witnessed an increase of 13.7 percent in FY 2010/11 against the government’s target of 9.5 percent. Inflation as measured by Wholesale Price Index (WPI) and Sensitive Price Index (SPI) showed a significant rise in the course of three years. The Wholesale Price Index (WPI) in the preceding year has increased in spite of deceleration in FY 2009/10 of 13.82 percent as compared to the FY 2008/09 i.e. 18.96 percent.
3.16 Due to the devastating floods, a significant portion of agricultural land was seriously damaged by floods in terms of infrastructure (e.g. roads, canal system, communication, government buildings etc) and displaced over two million people. Resultantly, the food inflation intensified sharply over the years. The Government’s policy decision of increasing the discount rate to 13 percent in July 2010 was ineffective in curbing inflation since the government borrowings from the SBP increased drastically due to floods. Table 3.2 gives the average price indices during the last three years – FY2008/09 to FY 2010/11.
Table 3.2: Average July –June, over same period of previous years (Change of indices in %)
Index 2008‐09 2009/10 2010‐11CPI 17.03 10.10 13.66 SPI 23.41 13.32 18.18WPI 18.96 13.82 21.24
Source: Federal Bureau of Statistics (FBS)

Source: Federal Bureau of Statistics (FBS)
3.17 As evident from the given figure (Fig 3.3), the Sensitive Price Index (SPI) during Nov FY10 showed a considerable increase. Similarly, the Wholesale price Index (WPI) depicted an increasing trajectory from FY 2009/10 to FY 2010/11. Moreover, the Consumer Price Index (CPI) observed a declining trend in the second half of the outgoing FY 2010/11 as seen in Fig 3.3. The figure given below takes into account the monthly trends of CPI, SPI and WPI from FY10 to FY 11.
Source: Federal Bureau of Statistics (FBS)
17.03
10.1
13.66
23.41
13.32
18.1818.96
13.82
21.24
0
5
10
15
20
25
2008‐09 2009‐10 2010‐11
Figure 3.3: Average Change of Indices during FY 2008/09 to FY 2010/11
CPI
SPI
WPI
0
5
10
15
20
25
30
Jul‐0
9
Aug
‐09
Sep‐09
Oct‐09
Nov
‐09
Dec‐09
Jan‐10
Feb‐10
Mar‐10
Apr‐10
May‐10
Jun‐10
Jul‐1
0
Aug
‐10
Sep‐10
Oct‐10
Nov
‐10
Dec‐10
Jan‐11
Feb‐11
Mar‐11
Apr‐11
May‐11
Jun‐11
Figure 3.4: Monthly trends by CPI, SPI and WPI
CPI WPI SPI
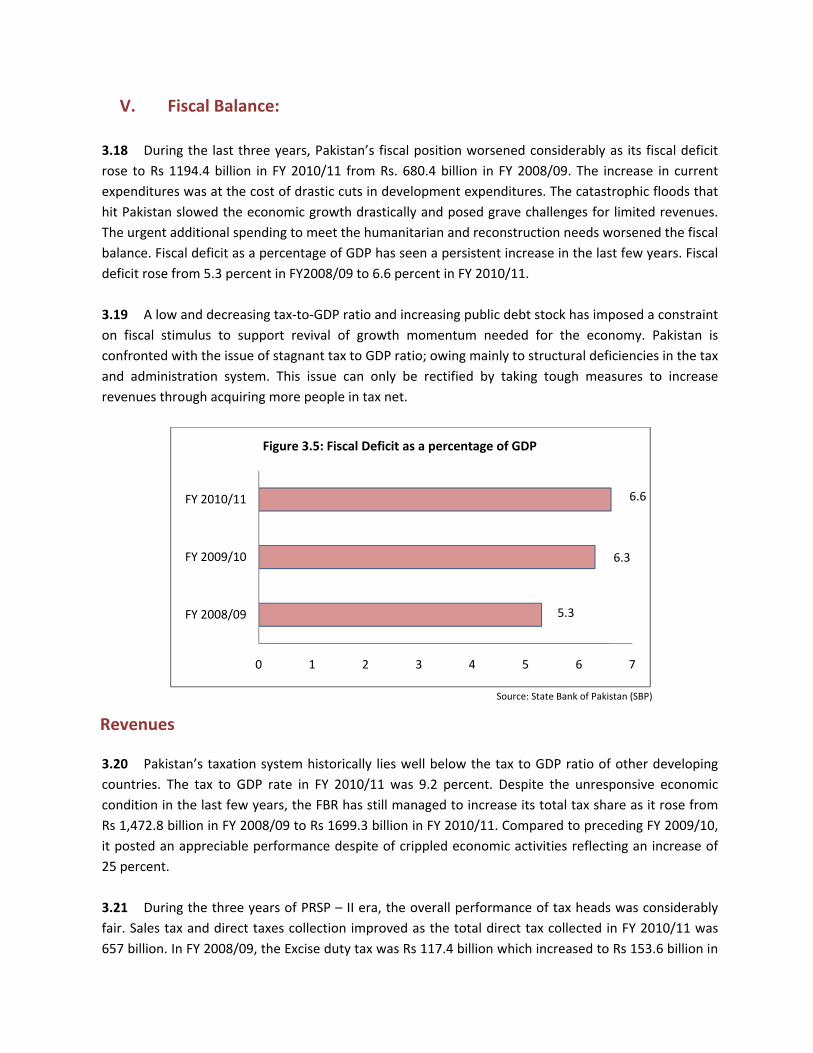
V. Fiscal Balance: 3.18 During the last three years, Pakistan’s fiscal position worsened considerably as its fiscal deficit rose to Rs 1194.4 billion in FY 2010/11 from Rs. 680.4 billion in FY 2008/09. The increase in current expenditures was at the cost of drastic cuts in development expenditures. The catastrophic floods that hit Pakistan slowed the economic growth drastically and posed grave challenges for limited revenues. The urgent additional spending to meet the humanitarian and reconstruction needs worsened the fiscal balance. Fiscal deficit as a percentage of GDP has seen a persistent increase in the last few years. Fiscal deficit rose from 5.3 percent in FY2008/09 to 6.6 percent in FY 2010/11. 3.19 A low and decreasing tax‐to‐GDP ratio and increasing public debt stock has imposed a constraint on fiscal stimulus to support revival of growth momentum needed for the economy. Pakistan is confronted with the issue of stagnant tax to GDP ratio; owing mainly to structural deficiencies in the tax and administration system. This issue can only be rectified by taking tough measures to increase revenues through acquiring more people in tax net.
Source: State Bank of Pakistan (SBP)
Revenues
3.20 Pakistan’s taxation system historically lies well below the tax to GDP ratio of other developing countries. The tax to GDP rate in FY 2010/11 was 9.2 percent. Despite the unresponsive economic condition in the last few years, the FBR has still managed to increase its total tax share as it rose from Rs 1,472.8 billion in FY 2008/09 to Rs 1699.3 billion in FY 2010/11. Compared to preceding FY 2009/10, it posted an appreciable performance despite of crippled economic activities reflecting an increase of 25 percent. 3.21 During the three years of PRSP – II era, the overall performance of tax heads was considerably fair. Sales tax and direct taxes collection improved as the total direct tax collected in FY 2010/11 was 657 billion. In FY 2008/09, the Excise duty tax was Rs 117.4 billion which increased to Rs 153.6 billion in
5.3
6.3
6.6
0 1 2 3 4 5 6 7
FY 2008/09
FY 2009/10
FY 2010/11
Figure 3.5: Fiscal Deficit as a percentage of GDP
outgoing FY 2010/11. The performance of custom tax has been modest in last few years, Rs 148 billion (FY 2008/09) to Rs 180.8 billion (2010/11).Major spinners for custom tax have been automobiles, edible oil, petroleum products and machinery.
Table 3.3 : Tax Collections during FY 2008/09 ‐ FY 2010/11Tax Heads FY 2008/09 (Rs. Billion) FY 2009/10 (Rs. Billion) FY 2010/11 (Rs. Billion)
Direct Taxes 444 529 657Sales tax 452 516 674FED 117.4 121 153.6Customs 148 162 180.8Total 1,161.4 1,328 1,665.40
Source: Federal Board of Revenue (FBR)
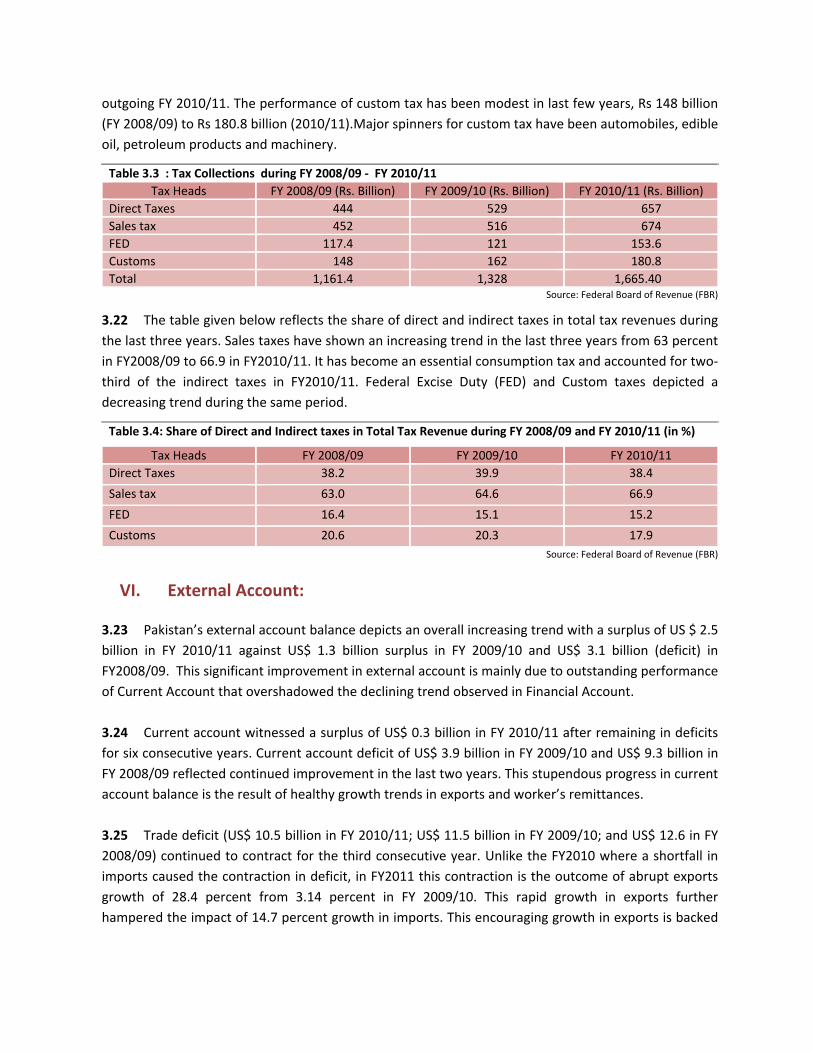
3.22 The table given below reflects the share of direct and indirect taxes in total tax revenues during the last three years. Sales taxes have shown an increasing trend in the last three years from 63 percent in FY2008/09 to 66.9 in FY2010/11. It has become an essential consumption tax and accounted for two‐third of the indirect taxes in FY2010/11. Federal Excise Duty (FED) and Custom taxes depicted a decreasing trend during the same period.
Table 3.4: Share of Direct and Indirect taxes in Total Tax Revenue during FY 2008/09 and FY 2010/11 (in %)
Tax Heads FY 2008/09 FY 2009/10 FY 2010/11Direct Taxes 38.2 39.9 38.4
Sales tax 63.0 64.6 66.9
FED 16.4 15.1 15.2
Customs 20.6 20.3 17.9 Source: Federal Board of Revenue (FBR)
VI. External Account:
3.23 Pakistan’s external account balance depicts an overall increasing trend with a surplus of US $ 2.5 billion in FY 2010/11 against US$ 1.3 billion surplus in FY 2009/10 and US$ 3.1 billion (deficit) in FY2008/09. This significant improvement in external account is mainly due to outstanding performance of Current Account that overshadowed the declining trend observed in Financial Account. 3.24 Current account witnessed a surplus of US$ 0.3 billion in FY 2010/11 after remaining in deficits for six consecutive years. Current account deficit of US$ 3.9 billion in FY 2009/10 and US$ 9.3 billion in FY 2008/09 reflected continued improvement in the last two years. This stupendous progress in current account balance is the result of healthy growth trends in exports and worker’s remittances. 3.25 Trade deficit (US$ 10.5 billion in FY 2010/11; US$ 11.5 billion in FY 2009/10; and US$ 12.6 in FY 2008/09) continued to contract for the third consecutive year. Unlike the FY2010 where a shortfall in imports caused the contraction in deficit, in FY2011 this contraction is the outcome of abrupt exports growth of 28.4 percent from 3.14 percent in FY 2009/10. This rapid growth in exports further hampered the impact of 14.7 percent growth in imports. This encouraging growth in exports is backed
by better unit prices for textile products, rising international cotton prices and other favorable developments in global markets, thus reflecting an increased demand for Pakistani exports. 3.26 Worker’s remittances are the second most important contributor in improved external account balance in the three years under review. Worker’s remittances of increased to US$ 11.2 billion in FY 2010/11 from US$ 8.9 billion in FY 2009/10 and US$ 7.8 billion in FY 2008/09, recording a significant growth of 25.8 percent and 14.1 percent respectively. Numerous factors contributed to this growth in remittances these include lack of investment opportunities abroad, channelizing remittances through banking system, curbing market premium reduction, enhancement in worker’s skill level, and increased flood related grants. Gulf Regions, which have recovered after last year’s financial crisis in Dubai, generated more than half of the remittances. 3.27 Financial Account recorded a surplus of US$ 2.2 billion in FY 2010/11 as compared to US$ 5.2 billion in FY2009/10 and US$ 6.1 billion in FY2008/09 respectively, depicting a declining trend for the fourth consecutive year. Foreign Direct Investment also depicted a downtrend from US$ 3.7 billion in FY 2008/09, to US$ 2.2 billion in FY 2009/10 and US$ 1.6 in FY 2010/11. This decline in FDI was the main cause of reduction in financial account surplus. 3.28 Exchange rate of Pak Rupee reflected stability during the course of three years as it depreciated nominally by 0.7 percent in FY 2010/11 against 4.7 percent in FY 2009/10 and 12 percent in FY2008/09. This improved stability in Pak Rupee/US$ is attributable to encouraging performance witnessed in the external account.

Chapter: 4
Pro Poor Budgetary Expenditures
“The conflict between equality and efficiency is our biggest socio-economic tradeoff, and it plagues us in dozens
of dimensions of social policy. How can we have our cake of market efficiency and share it equally?”
-----Arthur Okun (1975)

4.1 Since the initiation of PRSP‐II in FY 2008/09, pro‐poor expenditures in 17 sectors have been reported regularly on a quarterly and annual basis. This section gives an overview of the expenditures incurred since FY 2008/09.The 17 pro‐poor sectors will be revisited during compilation of PRSP‐III in the light of changing socio‐economic conditions of the country. 4.2 Table 4.1 gives the aggregate PRSP expenditures. These expenditures have increased over time in nominal terms. PRSP expenditures in FY 2010/11 incurred on 17 pro poor sectors accounted Rs. 1,245,541 million, with the highest amount of spending incurred in Education (Rs. 322,334 million); followed by Subsidies, Law & Order and Agriculture sectors. Total expenditures reached 6.9 percent of GDP in FY2010/11. Fiscal Responsibility & Debt Limitation (FRDL) Act, 2005 requires that the Poverty and Social sector related expenditures should not be less than 4.5 percent of GDP in any given year. The total expenditures were therefore well above the required level.
Table 4.1: PRSP Budgetary Expenditures for FY 2010/11Sector Expenditures (Rs. million) as %age of GDP
Market Access and Community Services Roads, Highways, & Bridges 99,567 0.55Environment/Water Supply & Sanitation 28,506 0.16Human Development Education 322,334 1.78Health 106,017 0.59Population Planning 4,861 0.03Rural Development Agriculture 115,511 0.64Land Reclamation 3,669 0.02Rural Development 19,109 0.11People's Works Programme‐I 5,049 0.03People's Works Programme‐II 21,300 0.12Safety Nets Subsidies* 230,945 1.28Social Security & Welfare 17,617 0.10Benazir Income Support Programme 34,330 0.19Pakistan Bait‐ul‐Maal 3,224 0.02Food Support Programme 0 0.00Natural Calamities & Other Disasters 49,115 0.27Low Cost Housing 373 0.00Governance Justice Admin 14,223 0.08Law and Order 169,791 0.94GRAND TOTAL 1,245,541 6.90GDP (Rs. Billions)** 18,063
Source: Civil Accounts provided by Accountant General’s Offic * Food Subsidies of Account‐II for Khyber Pakhtunkhwa (KP) are not included in the total PRSP expenditures. **GDP at market prices‐‐‐‐‐‐‐ Source: Economic Advisor’s Wing
4.3 The overall PRSP expenditures depicted a significant growth of 12.13 percent in FY 2010/11 and 13.66 percent in FY 2009/10. According to figures given in table 3.2 budgetary expenditures in 17 pro‐
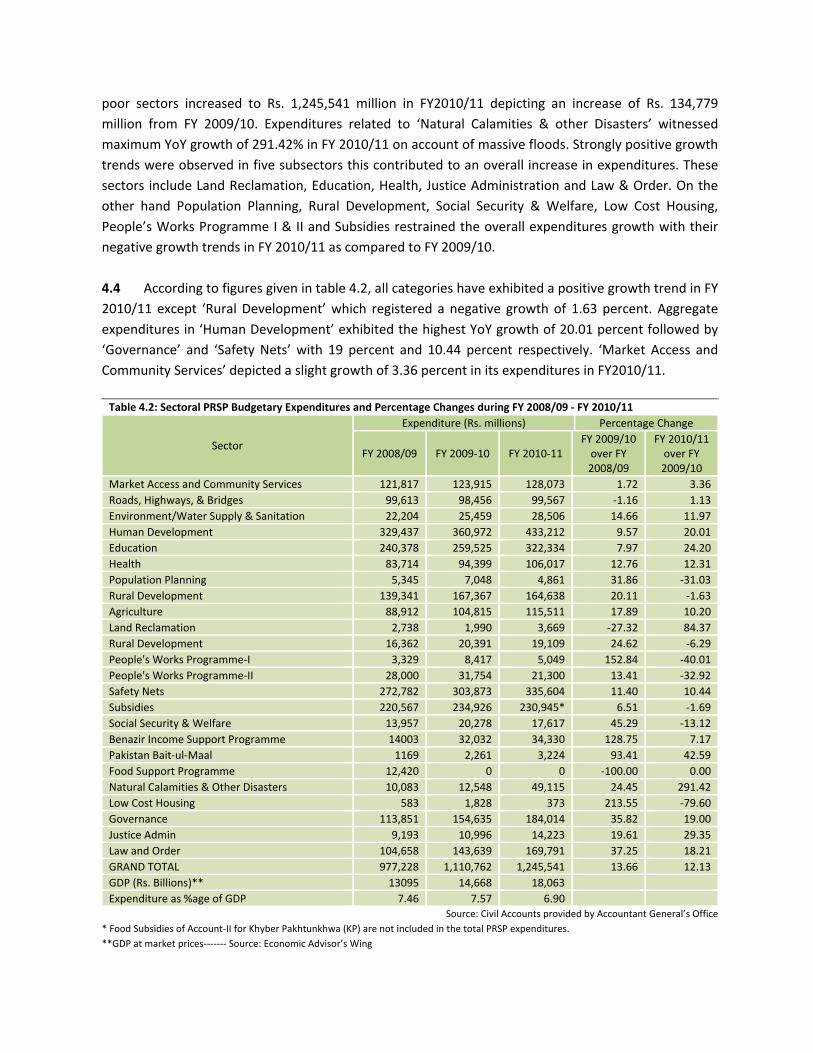
poor sectors increased to Rs. 1,245,541 million in FY2010/11 depicting an increase of Rs. 134,779 million from FY 2009/10. Expenditures related to ‘Natural Calamities & other Disasters’ witnessed maximum YoY growth of 291.42% in FY 2010/11 on account of massive floods. Strongly positive growth trends were observed in five subsectors this contributed to an overall increase in expenditures. These sectors include Land Reclamation, Education, Health, Justice Administration and Law & Order. On the other hand Population Planning, Rural Development, Social Security & Welfare, Low Cost Housing, People’s Works Programme I & II and Subsidies restrained the overall expenditures growth with their negative growth trends in FY 2010/11 as compared to FY 2009/10. 4.4 According to figures given in table 4.2, all categories have exhibited a positive growth trend in FY 2010/11 except ‘Rural Development’ which registered a negative growth of 1.63 percent. Aggregate expenditures in ‘Human Development’ exhibited the highest YoY growth of 20.01 percent followed by ‘Governance’ and ‘Safety Nets’ with 19 percent and 10.44 percent respectively. ‘Market Access and Community Services’ depicted a slight growth of 3.36 percent in its expenditures in FY2010/11.
Table 4.2: Sectoral PRSP Budgetary Expenditures and Percentage Changes during FY 2008/09 ‐ FY 2010/11
Sector
Expenditure (Rs. millions) Percentage Change
FY 2008/09 FY 2009‐10 FY 2010‐11 FY 2009/10 over FY 2008/09
FY 2010/11 over FY 2009/10
Market Access and Community Services 121,817 123,915 128,073 1.72 3.36 Roads, Highways, & Bridges 99,613 98,456 99,567 ‐1.16 1.13 Environment/Water Supply & Sanitation 22,204 25,459 28,506 14.66 11.97 Human Development 329,437 360,972 433,212 9.57 20.01 Education 240,378 259,525 322,334 7.97 24.20 Health 83,714 94,399 106,017 12.76 12.31 Population Planning 5,345 7,048 4,861 31.86 ‐31.03 Rural Development 139,341 167,367 164,638 20.11 ‐1.63 Agriculture 88,912 104,815 115,511 17.89 10.20 Land Reclamation 2,738 1,990 3,669 ‐27.32 84.37 Rural Development 16,362 20,391 19,109 24.62 ‐6.29 People's Works Programme‐I 3,329 8,417 5,049 152.84 ‐40.01 People's Works Programme‐II 28,000 31,754 21,300 13.41 ‐32.92 Safety Nets 272,782 303,873 335,604 11.40 10.44 Subsidies 220,567 234,926 230,945* 6.51 ‐1.69 Social Security & Welfare 13,957 20,278 17,617 45.29 ‐13.12 Benazir Income Support Programme 14003 32,032 34,330 128.75 7.17 Pakistan Bait‐ul‐Maal 1169 2,261 3,224 93.41 42.59 Food Support Programme 12,420 0 0 ‐100.00 0.00 Natural Calamities & Other Disasters 10,083 12,548 49,115 24.45 291.42 Low Cost Housing 583 1,828 373 213.55 ‐79.60 Governance 113,851 154,635 184,014 35.82 19.00 Justice Admin 9,193 10,996 14,223 19.61 29.35 Law and Order 104,658 143,639 169,791 37.25 18.21 GRAND TOTAL 977,228 1,110,762 1,245,541 13.66 12.13 GDP (Rs. Billions)** 13095 14,668 18,063 Expenditure as %age of GDP 7.46 7.57 6.90
Source: Civil Accounts provided by Accountant General’s Office * Food Subsidies of Account‐II for Khyber Pakhtunkhwa (KP) are not included in the total PRSP expenditures. **GDP at market prices‐‐‐‐‐‐‐ Source: Economic Advisor’s Wing

4.5 Expenditure growth under Market Access and Community Services has doubled from 1.72 percent in FY 2009/10 to 3.36 in FY 2010/11. This increase was witnessed on account of 11.97 percent increase in expenditures for Environment/Water supply & sanitation and a slight growth of 1.13 percent in expenditure on Roads, Highways & Bridges. 4.6 The expenditure in the Human Development has experienced an increase of 10.44 percent from 9.57 percent in FY2009/10 to 20.01 in FY2010/11. Education and Health sectors exhibited significantly positive growth in expenditure of 24.2 percent and 12.31 percent in FY2009/10 and FY2010/11 respectively. Conversely, a strongly negative growth of ‐31.o3 percent was witnessed in Population Planning expenditures that declined from Rs. 7,048 million in FY 2009/10 to Rs. 4,861 million in FY 2010/11. 4.7 Rural Development experienced the second largest percentage change in its expenditures in FY2009/10 over FY2008/09 whereas it is the only category with negative expenditures growth of 1.63 percent in FY2010/11. This change occurred due to government’s decision to curtail down the development spending under People’s Works Programme‐I & II by 40.01 percent in FY2009/10 and 32.92 percent in FY2010/11. Positive growth trends of 10.20 percent and 84.37 percent were observed in Agriculture and Land Reclamation respectively.
4.8 In the Safety Nets percentage change in expenditures observed in FY 2010/11 was 0.96 percent below the expenditure made in FY2009/10. All the subsectors depicted positive growth in their expenditures during the above mentioned period. ‘Natural Calamities & Other Disasters’ experienced maximum increase of 291.42 percent followed by Pakistan Bait‐ul‐Maal (PBM) and Benazir Income Support Programme (BISP) of 42.59 percent and 7.17 percent respectively. No expenditure was incurred in the Food Support Programme in FY 2009/10 and FY 2010/11 because it was merged in BISP as part of the policy to consolidate all cash transfer programmes. Contrary to this some sectors endured negative growth trends as expenditures in Subsidies, Social Security & Welfare and Land Reclamation declined by 1.69 percent, 13.12 percent and 79.6 percent respectively. Decline in subsidies can be explained by the government’s concerted effort to move away from board subsidization and to provide direct assistance to the poor and deserving.
4.9 In the Governance, Law & Order and Justice Admin depicted robust growth trends from FY2009/10 to FY2010/11. Increased expenditures under this category were due to the demanding security situation in the country. The Law & Order related expenditures were recorded at 19.61 percent in FY2009/10 over FY2008/09; and 29.35 percent in FY2010/11 over FY2009/10. The Justice Admin expenditures stood at 37.25 percent in FY2009/10 over FY2008/09; and 18.21 percent in FY2010/11 over FY2009/10.
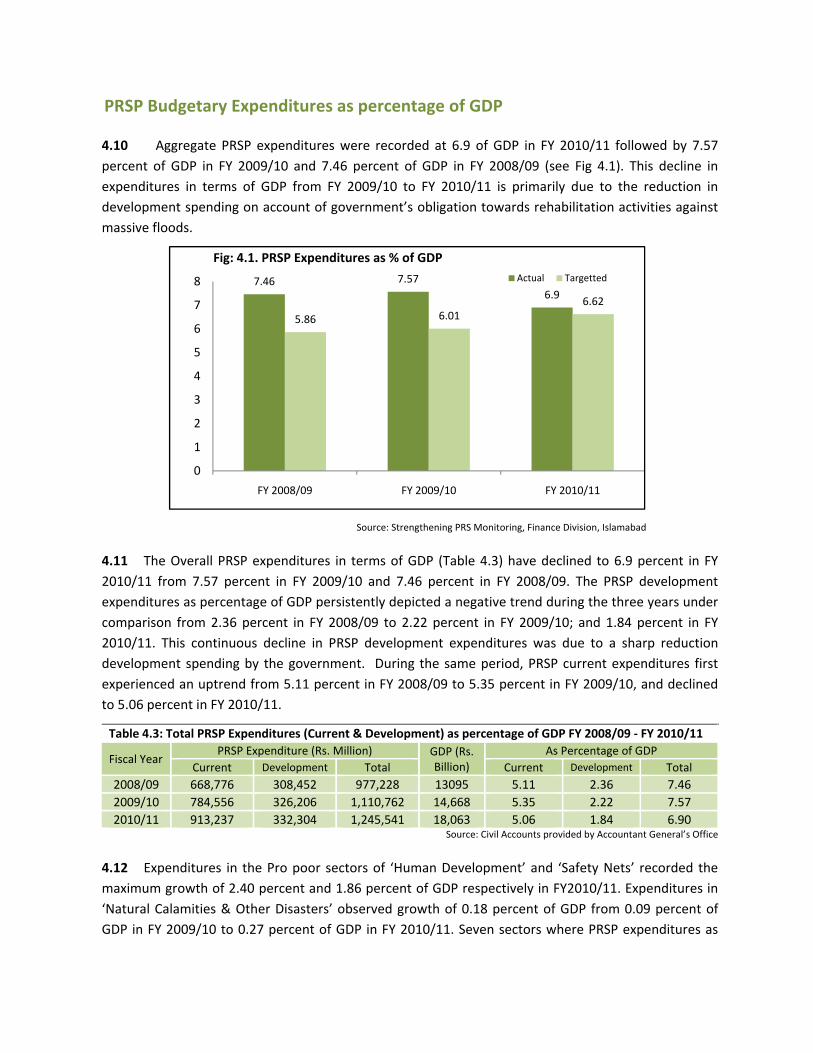
PRSP Budgetary Expenditures as percentage of GDP
4.10 Aggregate PRSP expenditures were recorded at 6.9 of GDP in FY 2010/11 followed by 7.57 percent of GDP in FY 2009/10 and 7.46 percent of GDP in FY 2008/09 (see Fig 4.1). This decline in expenditures in terms of GDP from FY 2009/10 to FY 2010/11 is primarily due to the reduction in development spending on account of government’s obligation towards rehabilitation activities against massive floods.
Source: Strengthening PRS Monitoring, Finance Division, Islamabad
4.11 The Overall PRSP expenditures in terms of GDP (Table 4.3) have declined to 6.9 percent in FY 2010/11 from 7.57 percent in FY 2009/10 and 7.46 percent in FY 2008/09. The PRSP development expenditures as percentage of GDP persistently depicted a negative trend during the three years under comparison from 2.36 percent in FY 2008/09 to 2.22 percent in FY 2009/10; and 1.84 percent in FY 2010/11. This continuous decline in PRSP development expenditures was due to a sharp reduction development spending by the government. During the same period, PRSP current expenditures first experienced an uptrend from 5.11 percent in FY 2008/09 to 5.35 percent in FY 2009/10, and declined to 5.06 percent in FY 2010/11.
Table 4.3: Total PRSP Expenditures (Current & Development) as percentage of GDP FY 2008/09 ‐ FY 2010/11
Fiscal Year PRSP Expenditure (Rs. Million) GDP (Rs.
Billion) As Percentage of GDP
Current Development Total Current Development Total 2008/09 668,776 308,452 977,228 13095 5.11 2.36 7.462009/10 784,556 326,206 1,110,762 14,668 5.35 2.22 7.572010/11 913,237 332,304 1,245,541 18,063 5.06 1.84 6.90
Source: Civil Accounts provided by Accountant General’s Office
4.12 Expenditures in the Pro poor sectors of ‘Human Development’ and ‘Safety Nets’ recorded the maximum growth of 2.40 percent and 1.86 percent of GDP respectively in FY2010/11. Expenditures in ‘Natural Calamities & Other Disasters’ observed growth of 0.18 percent of GDP from 0.09 percent of GDP in FY 2009/10 to 0.27 percent of GDP in FY 2010/11. Seven sectors where PRSP expenditures as
7.46 7.576.9
5.86 6.016.62
0
1
2
3
4
5
6
7
8
FY 2008/09 FY 2009/10 FY 2010/11
Fig: 4.1. PRSP Expenditures as % of GDPActual Targetted

percentage of GDP in FY 2010/11 have not surpassed those in FY 2009/10 consisting of; Roads Highways & Bridges, Health, Agriculture, People’s Works Programme‐II, Subsidies, Social Security & Welfare and Law & Order. Slight increase of 0.01 percent of GDP was depicted in expenditures for Education, Land Reclamation and Justice Admin. In the remaining sectors, PRSP expenditures as percentage of GDP declined marginally in FY 2010/11 as compared to FY 2009/10. (Table 4.4)
Table 4.4 : Sectoral PRSP Expenditures as percentage of GDP
Sector Expenditure as percentage of GDP
FY 2008‐09 FY 2009‐10 FY 2010‐11
Market Access and Community Services 0.93 0.84 0.71
Roads, Highways, & Bridges 0.76 0.67 0.55
Environment/Water Supply & Sanitation 0.17 0.17 0.16
Human Development 2.52 2.46 2.40
Education 1.84 1.77 1.78
Health 0.64 0.64 0.59
Population Planning 0.04 0.05 0.03
Rural Development 1.06 1.14 0.91
Agriculture 0.68 0.71 0.64
Land Reclamation 0.02 0.01 0.02
Rural Development 0.12 0.14 0.11
People's Works Programme‐I 0.03 0.06 0.03
People's Works Programme‐II 0.21 0.22 0.12
Safety Nets 2.08 2.07 1.86
Subsidies 1.68 1.60 1.28
Social Security & Welfare 0.11 0.14 0.10
Benazir Income Support Programme 0.11 0.22 0.19
Pakistan Bait‐ul‐Maal 0.01 0.02 0.02
Food Support Programme 0.09 0.00 0.00
Natural Calamities & Other Disasters 0.08 0.09 0.27
Low Cost Housing 0.00 0.01 0.00
Governance 0.87 1.05 1.02
Justice Admin 0.07 0.07 0.08
Law and Order 0.80 0.98 0.94
GRAND TOTAL 7.46 7.57 6.90 Source: Strengthening PRS Monitoring, Finance Division, Islamabad.
Distribution of Expenditures
4.13 Proportional distribution of expenditures in pro‐poor sectors reflected a similar pattern under the three years under review (see Table 4.5 & Fig 4.2). Education holds the maximum share of PRSP expenditures i.e. 24.6 percent in FY2008/09, 23.36 percent in FY2009/10 and 25.88 percent in FY

2010/11. Followed by Subsidies expenditure of 22.57 percent in FY2008/09, 21.15 percent in FY 2009/10 and 18.54 percent in FY2010/11. Law & Order expenditure was recorded at 10.71 percent in FY2008/09, 12.93 percent in FY2009/10 and 13.63 percent in FY2010/11, depicting an increasing trend. Share of subsidies has declined by 2.61 percentage points in FY 2010/11, in contrast to the share of Natural Calamities & Other Disasters which increased by 2.81 percentage points in FY2010/11. Table 4.5: Sector‐wise Proportional Contribution in PRSP Expenditures
Sector FY 2008‐
09
% age of Total
Expenditure
FY 2009‐10
% age of Total
Expenditure
FY 2010‐11
% age of Total
Expenditure Roads, Highways, & Bridges 99,613 10.19 98,456 8.86 99,567 7.99Environment/Water Supply & Sanitation
22,204 2.27 25,459 2.29 28,506 2.29
Education 240,378 24.60 259,525 23.36 322,334 25.88Health 83,714 8.57 94,399 8.50 106,017 8.51Population Planning 5,345 0.55 7,048 0.63 4,861 0.39Social Security & Welfare 13,957 1.43 20,278 1.83 17,617 1.41Benazir Income Support Programme
14,003 1.43 32,032 2.88 34,330 2.76
Pakistan Bait‐ul‐Maal 1,169 0.12 2,261 0.20 3,224 0.26Natural Calamities & Other Disasters
10,083 1.03 12,548 1.13 49,115 3.94
Agriculture 88,912 9.10 104,815 9.44 115,511 9.27Land Reclamation 2,738 0.28 1,990 0.18 3,669 0.29Rural Development 16,362 1.67 20,391 1.84 19,109 1.53Law and Order 104,658 10.71 143,639 12.93 169,791 13.63Low Cost Housing 583 0.06 1,828 0.16 373 0.03Justice Admin 9,193 0.94 10,996 0.99 14,223 1.14Subsidies 220,567 22.57 234,926 21.15 230,945 18.54Food Support Programme 12,420 1.27 0 0.00 0 0.00People's Works Programme‐I 3,329 0.34 8,417 0.76 5,049 0.41People's Works Programme‐II 28,000 2.87 31,754 2.86 21,300 1.71GRAND TOTAL 977,228 100 1,110,762 100 1,245,541 100
Source: Strengthening PRS Monitoring, Finance Division, Islamabad.
4.14 Proportional share of Environment/Water Supply & Sanitation and Health sectors remained unchanged in FY2009/10 and FY2010/11 whereas all the other sectors experienced a negligible increase or decrease of less than one percentage points in their contribution to overall PRSP expenditures.

8.862.29
23.36
8.5
0.63
1.832.88
0.21.13
9.44
0.18
1.84
12.930.16
0.99
21.15
0 0.76 2.86
Roads, Highways, & Bridges Environment/Water Supply & Sanitation Education
Health Population Planning Social Security & Welfare
Benazir Income Support Programme Pakistan Bait‐ul‐Maal Natural Calamities & Other Disasters
Agriculture Land Reclamation Rural Development
Law and Order Low Cost Housing Justice Admin
Subsidies Food Support Programme People's Works Programme‐I
People's Works Programme‐II
Figure 4.2: Sector‐wise Proportional Contribution in PRSP Expenditures (FY 2008/09)
Source: Strengthening PRS Monitoring, Finance Division, Islamabad.
Figure 4.3: Sector‐wise Proportional Contribution in PRSP Expenditures (FY 2009/10)
Source: Strengthening PRS Monitoring, Finance Division, Islamabad.
10.192.27
24.6
8.57
0.551.43
1.430.12
1.03
9.10.28
1.67
10.710.06
0.94
22.57
1.27 0.34 2.87
Roads, Highways, & Bridges Environment/Water Supply & Sanitation EducationHealth Population Planning Social Security & WelfareBenazir Income Support Programme Pakistan Bait‐ul‐Maal Natural Calamities & Other DisastersAgriculture Land Reclamation Rural DevelopmentLaw and Order Low Cost Housing Justice AdminSubsidies Food Support Programme People's Works Programme‐I People's Works Programme‐II

Figure 4.4: Sector‐wise Proportional Contribution in PRSP Expenditures (FY2010/11)
Source: Strengthening PRS Monitoring, Finance Division, Islamabad.
4.15 Figures 4.2, 4.3 and 4.4 give the Sector‐wise Proportional Contribution in PRSP Expenditures of various pro‐poor sectors in the year 2008‐09, 2009‐10 and 2010‐11. According to Figure 4.5 ‘Human Development’ held the maximum share of 33.71 percent in FY 2008/09, 32.5 percent in FY 2009/10; and 34.78 percent in FY2010/11. Followed by ‘Safety nets’ with the second largest share of 27.91 percent in FY2008/09; 27.36 percent in FY2009/10, and 26.94 percent in FY2010/11. Market Access and Community Services continued with the lowest contribution of 12.47 percent in FY2008/09, 11.16 percent in FY 2009/10 and 10.28 percent in FY 2010/11 in overall expenditures. In cumulative terms, expenditure shares of Human Development and Governance have risen by 1.07 and 3.12 percentage points respectively. Safety Nets, Rural Development and Market Access & Community Services have declined by 0.97, 1.04 and 2.19 percentage points respectively during FY 2008/09 to FY 2010/11.
7.992.29
25.88
8.51
0.39
1.41
2.760.26
3.94
9.270.29
1.53
13.63
0.03
1.1418.54
0.000.41 1.71
Roads, Highways, & Bridges Environment/Water Supply & SanitationEducation HealthPopulation Planning Social Security & WelfareBenazir Income Support Programme Pakistan Bait‐ul‐Maal Natural Calamities & Other Disasters AgricultureLand Reclamation Rural DevelopmentLaw and Order Low Cost HousingJustice Admin SubsidiesFood Support Programme People's Works Programme‐I People's Works Programme‐II

Source: Strengthening PRS Monitoring, Finance Division, Islamabad.
PRSP Budgetary Expenditures by Province and Sectors 4.16 PRSP Budgetary expenditures when examined at provincial level, exhibited positive trends in all the provinces during the three years period under comparison except for KP in FY 2010/11. Maximum increase in expenditures in FY 2010/11 over FY 2009/10 was observed in Balochistan which rose to 67.7 percent followed by 21.13 percent growth in Sindh. KP is the only province with negative growth in expenditures i.e. 4.49 percent due to very low spending in Education and Rural Development sectors. The expenditures in Education and Rural Development declined by a significant 34.19 and 17.96 percent respectively in KP (see, table 4.6). 4.17 Figures given in Table 4.6 clearly suggest that Pakistan’s overall expenditures in Natural Calamities and Justice Admin registered a substantial increase due to devastating floods. Maximum increase in expenditures of 8140 percent was recorded in Balochistan for Natural Calamities & Other Disasters and in KP of 40.91 percent for Justice Admin. Expenditures in Education, Health and Population Planning showed a positive trend in all the provinces except in KP for Education where it declined by 34.19 percent. Balochistan exhibited the maximum increase in Education, Health and Population planning expenditures in the above three sectors with 66.15, 62.92 and 50.41 percent respectively in FY2010/11.
12.47
33.71
14.26
27.91
11.65
11.16
32.50
15.07
27.36
13.92
10.28
34.78
13.22
26.94
14.77
0.00
5.00
10.00
15.00
20.00
25.00
30.00
35.00
40.00
Market Access and Community Services
Human Development Rural Development Safety Nets Governance
Figure 4.5: Proportional contribution of Broad Categories in Total Expenditures
FY 2008‐09 FY 2009‐10 FY 2010‐11

Table 4.6: Percentage Change in PRSP Budgetary Expenditures by Sector and Province
Sector FY 2009/10 over FY 2008/09 FY 2010/11 over FY 2009/10
Fed Pun Sindh KP Bal Pak Fed Pun Sindh KP Bal Pak
Roads, Highways, & Bridges ‐23.34 ‐2.28 ‐12.45 16.05 66.46 ‐1.16 4.77 ‐14.22 ‐12.98 47.71 85.9 1.13
Environment/Water Supply & Sanitation 125.00 7.58 15.34 17.87 38.91 14.66 97.92 22.86 ‐27.91 ‐10.49 63.91 11.97
Education 4.58 3.21 8.35 21.53 25.85 7.97 28.81 33.71 36.52 ‐34.19 66.15 24.2
Health 37.89 6.55 7.43 ‐1.73 25.71 12.76 ‐1.68 13.26 17.82 9.49 62.92 12.31
Population Planning 42.00 14.27 33.43 18.06 47.77 31.86 ‐76.94 10.67 17.51 12.24 50.41 ‐31.03
Social Security & Welfare 120.19 ‐3.31 56.85 7.31 ‐4.25 87.34 2.75 ‐29.08 ‐18.14 80.65 220.56 ‐13.12
Benazir Income Support Programme 128.75 ‐ ‐ ‐ ‐ 128.75 7.17 ‐ ‐ ‐ ‐ 7.17
Pakistan Bait‐ul‐Maal 93.41 ‐ ‐ ‐ ‐ 93.41 42.59 ‐ ‐ ‐ ‐ 42.59
Natural Calamities & Other Disasters ‐15.55 ‐12.25 880.12 311.74 ‐98.07 24.45 402.01 319.45 529.5 47.51 8140 291.42
Agriculture 10.17 12.63 29.35 19.48 37.67 17.89 ‐9.89 ‐1.73 30.15 45.03 35.28 10.2
Land Reclamation 0.00 0.00 ‐29.24 0.00 0.00 ‐27.32 0.00 61.67 86.63 0.00 0.00 84.37
Rural Development 22.07 16.89 25.77 57.21 ‐17.54 24.62 ‐38.89 ‐16.87 19.51 ‐17.96 62.28 ‐6.29
Law and Order 53.54 24.60 16.76 114.81 ‐5.88 37.25 29.14 7.53 24.22 ‐7.06 73.17 18.21
Low Cost Housing 0.00 33.45 35,033.33 0.00 0.00 213.55 0.00 ‐53.88 ‐98.48 0.00 0.00 ‐79.6
Justice Admin 27.21 9.58 26.33 36.76 21.07 19.61 7.22 36.46 24.65 40.91 36.07 29.35
Subsidies 8.33 ‐75.40 261.41 ‐71.31 0.00 6.51 ‐5.81 1931.72 ‐33.19 33.33 0.00 ‐1.69
Food Support Programme ‐100.00 ‐100.00 0.00 0.00 0.00 ‐100 0.00 0.00 0.00 0.00 0.00 0.00
People's Works Programme‐I 152.84 0.00 0.00 0.00 0.00 152.84 ‐40.01 0.00 0.00 0.00 0.00 ‐40.01
People's Works Programme‐II 13.41 0.00 0.00 0.00 0.00 13.41 ‐32.92 0.00 0.00 0.00 0.00 ‐32.92
GRAND TOTAL 17.81 2.61 14.61 28.35 21.14 13.66 2.62 18.35 21.13 ‐4.49 67.7 12.13
Source: Strengthening PRS Monitoring, Finance Division, Islamabad.
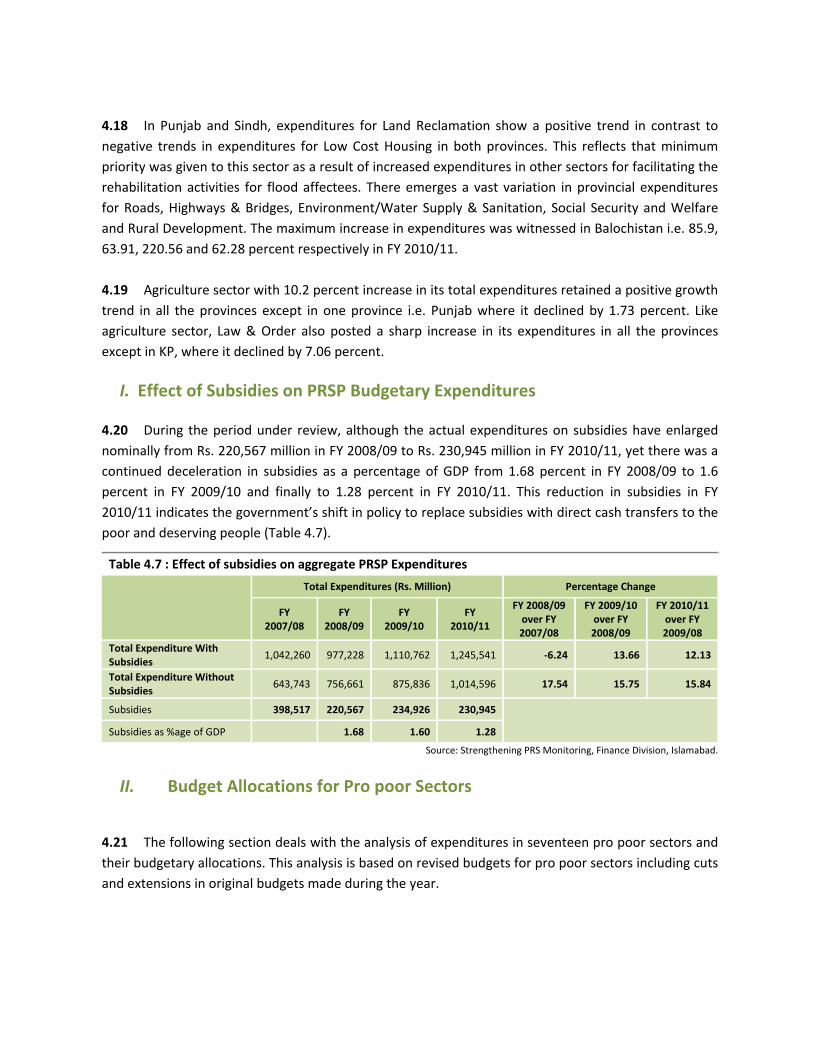
4.18 In Punjab and Sindh, expenditures for Land Reclamation show a positive trend in contrast to negative trends in expenditures for Low Cost Housing in both provinces. This reflects that minimum priority was given to this sector as a result of increased expenditures in other sectors for facilitating the rehabilitation activities for flood affectees. There emerges a vast variation in provincial expenditures for Roads, Highways & Bridges, Environment/Water Supply & Sanitation, Social Security and Welfare and Rural Development. The maximum increase in expenditures was witnessed in Balochistan i.e. 85.9, 63.91, 220.56 and 62.28 percent respectively in FY 2010/11. 4.19 Agriculture sector with 10.2 percent increase in its total expenditures retained a positive growth trend in all the provinces except in one province i.e. Punjab where it declined by 1.73 percent. Like agriculture sector, Law & Order also posted a sharp increase in its expenditures in all the provinces except in KP, where it declined by 7.06 percent.
I. Effect of Subsidies on PRSP Budgetary Expenditures
4.20 During the period under review, although the actual expenditures on subsidies have enlarged nominally from Rs. 220,567 million in FY 2008/09 to Rs. 230,945 million in FY 2010/11, yet there was a continued deceleration in subsidies as a percentage of GDP from 1.68 percent in FY 2008/09 to 1.6 percent in FY 2009/10 and finally to 1.28 percent in FY 2010/11. This reduction in subsidies in FY 2010/11 indicates the government’s shift in policy to replace subsidies with direct cash transfers to the poor and deserving people (Table 4.7).
Table 4.7 : Effect of subsidies on aggregate PRSP Expenditures
Total Expenditures (Rs. Million) Percentage Change
FY 2007/08
FY 2008/09
FY 2009/10
FY 2010/11
FY 2008/09 over FY 2007/08
FY 2009/10 over FY 2008/09
FY 2010/11 over FY 2009/08
Total Expenditure With Subsidies
1,042,260 977,228 1,110,762 1,245,541 ‐6.24 13.66 12.13
Total Expenditure Without Subsidies
643,743 756,661 875,836 1,014,596 17.54 15.75 15.84
Subsidies 398,517 220,567 234,926 230,945
Subsidies as %age of GDP 1.68 1.60 1.28
Source: Strengthening PRS Monitoring, Finance Division, Islamabad.
II. Budget Allocations for Pro poor Sectors
4.21 The following section deals with the analysis of expenditures in seventeen pro poor sectors and their budgetary allocations. This analysis is based on revised budgets for pro poor sectors including cuts and extensions in original budgets made during the year.

Sectoral shares in total PRSP Budgetary Allocations 4.22 Budgetary allocations for pro poor sectors during FY 2009/10 and FY 2010/11 are given in Table 4.8. During FY 2010/11 budgetary allocations stood at Rs. 1,228,188 million which was more than Rs. 1,140,822 million allocated in FY 2009/10, depicting YoY growth of 7.7 percent.
Table 4.8: Percentage Sectoral PRSP Budgetary Allocations During 2008/09 ‐ FY 2010/11 (Rs. Million)
Sector Budget % age Share
by sector
Budget % age Share by sector FY 2009/10 FY 2010/11
Roads, Highways, & Bridges 88,054 7.7 102,522 8.3
Water Supply & Sanitation 20,488 1.8 23,648 1.9
Education 163,037 14.3 191,890 15.6
Health 84,847 7.4 94,565 7.7
Population Planning 8,269 0.7 8,172 0.7
Social Security & Welfare 19,732 1.7 54,261 4.4
Benazir Income Support Programme 70000 6.1 38,000 3.1
Pakistan Bait‐ul‐Maal 3200 0.3 2,000 0.2
Natural Calamities & Other Disasters 24,901 2.2 24,922 2.0
Agriculture 102,683 9.0 112,908 9.2
Land Reclamation 3,705 0.3 4,026 0.3
Rural Development 24,012 2.1 20,077 1.6
Law and Order 140,850 12.3 168,040 13.7
Low Cost Housing 4,739 0.4 1,944 0.2
Justice Admin 11,250 1.0 15,293 1.2
Subsidies 371,055 32.5 365,919 29.8
Food Support Programme ‐ ‐ ‐ ‐
People's Works Programme‐I ‐ ‐ ‐ ‐
People's Works Programme‐II ‐ ‐ ‐ ‐
GRAND TOTAL* 1,140,822 100.0 1,228,188 100.0 *Budgets for PWP‐I & II are not included. Source: PIFRA Online Accounts
4.23 Among the sectoral shares in aggregate budgetary allocations subsidies held the maximum share of 29.8 percent in FY 2010/11 (32.5 percent in FY 2009/10) followed by Education with 15.6 percent share (14.3 percent in FY 2009/10); Law and Order with 13.7 percent share (12.3 percent in FY 2009/10) and Agriculture sector with 9.2 percent share (9 percent in FY 2009/10). In aggregate terms, these four sectors accounted for 68.3 percent of total budgetary allocations during FY 2010/11 as compared to 68.1 percent share in FY 2009/10. Population Planning, Pakistan Bait‐ul‐Mal, Land Reclamation and Low Cost Housing exhibited a share of less than one percent of total allocations in FY2009/10 and FY2010/11.

4.24 Social Security & Welfare depicted the maximum increase from 1.7 percent in FY2009/10 to 4.4 percent in FY2010/11, increasing its share by 2.7 percentage points. Education and Law & Order sectors also registered an increase of 1.3 percentage points in FY 2010/11 as compared to FY 2009/10. Similarly proportional shares of Roads, Highways & Bridges, Health, Agriculture and Justice Admin experienced an increase in their shares by 0.6, 0.3, 0.2 and 0.3 percentage points respectively from FY 2009/10 to FY 2010/11. This increase in share of Law & Order and Justice Admin in overall PRSP budgets was the result of increased security concerns all over the country. Proportional share of subsidies declined by 2.7 percentage points from 32.5 percent in FY 2009/10 to 29.8 percent in FY 2010/11 on account of government’s policy to move away from subsidization and providing direct assistance to the poor and vulnerable. Population Planning, Natural Calamities & Disasters, Rural Development and Low Cost Housing experienced a slight decline of less than 0.5 percent in their shares in FY 2010/11 as compared to that in FY 2009/10.
Deviations of Actual PRSP Expenditures from budgetary Allocations
4.25 The following section analyses the deviations of actual PRSP expenditures in pro‐poor sectors from budgetary allocations at the aggregate level. These deviations refer to the difference between actual expenditure and budgetary allocation expressed as a percentage of the approved budget. Considerable variations were observed between aggregate actual PRSP expenditures and the budgets of PRSP sectors during the two years under review (see, Table 4.9). At the aggregate level, PRSP expenditures increased by 1.4 percent in FY 2010/11 indicating an overutilization of budget. This overutilization was due to the budgets for PWP‐I & II that were not included in aggregate budgetary allocations. A higher degree of deviation was observed at the sectoral level during FY 2010/11. Eight sectors registered a slight downward deviation whereas six sectors portrayed substantial upward deviations indicating an overall excess expenditure relative to budgetary allocations.
Table 4.9: Deviations of Budgeted and Actual PRSP Expenditures (Rs. Millions)
Sectors
FY 2009/10 FY 2010/11
Budgeted Actual Deviation (%age)
Budgeted Actual Deviation (%age)
Roads, Highways, & Bridges 88,054 98,456 11.8 102,522 99,567 ‐2.9
Environment/Water Supply & Sanitation
20,488 25,459 24.3 23,648 28,506 20.5
Education 163,037 259,525 59.2 191,890 322,334 68.0
Health 84,847 94,399 11.3 94,565 106,017 12.1
Population Planning 8,269 7,048 ‐14.8 8,172 4,861 ‐40.5
Social Security & Social Welfare 19,732 20,278 2.8 54,261 17,617 ‐67.5
Benazir Income Support Programme 70,000 32,032 ‐54.2 38,000 34,330 ‐9.7
Pakistan Bait‐ul‐Maal 3,200 2,261 ‐29.3 2,000 3,224 61.2
Natural Calamities & Other Disasters 24,901 12,548 ‐49.6 24,922 49,115 97.1
Agriculture 102,683 104,815 2.1 112,908 115,511 2.3
Land Reclamation 3,705 1,990 ‐46.3 4,026 3,669 ‐8.9
Rural Development 24,012 20,391 ‐15.1 20,077 19,109 ‐4.8
Law and Order 140,850 143,639 2.0 168,040 169,791 1.0
Continue…

Table 4.9: Deviations of Budgeted and Actual PRSP Expenditures (Rs. Millions)
Sectors
FY 2009/10 FY 2010/11
Budgeted Actual Deviation (%age)
Budgeted Actual Deviation (%age)
Low Cost Housing 4,739 1,828 ‐61.4 1,944 373 ‐80.8
Justice Admin 11,250 10,996 ‐2.3 15,293 14,223 ‐7.0
Subsidies 371,055 234,926 ‐36.7 365,919 230,945 ‐36.9
Food Support Programme ‐ ‐ ‐ ‐ ‐ ‐
People's Works Programme‐I ‐ 8,417 ‐ ‐ 5,049 ‐
People's Works Programme‐II ‐ 31,754 ‐ ‐ 21,300 ‐
GRAND TOTAL* 1,140,822 1,110,762 ‐2.6 1,228,188** 1,245,541 1.4 *Budgets for PWP‐I & II are not included. Source: Strengthening PRS Monitoring, Finance Division, Islamabad. **Budgets for FY 2010/11 are less than aggregate expenditures as budgets for PWP‐I & II are not included.
4.26 Significant excess spending was observed in the Natural Calamities & Other Disasters and Education sectors during FY2010/11 depicting upward deviations to the extent of 97.1 percent and 68 percent respectively. Actual spending in Natural Calamities sector has mainly increased on account of flood relief and rehabilitation activities during the year. Environment/Water Supply & Sanitation, Health, Pakistan Bait‐ul‐Maal, Law & Order and Agriculture recorded upward deviations of 20.5, 12.1, 81.3, 2.3 and 1 percent respectively in their spending from budgetary allocations in FY 2010/11. 4.27 Population Planning, Social Security & Welfare, Low Cost Housing and Subsidies depicted an underutilization of budgetary allocations to a greater extent as reflected by the downward deviations of 40.5, 67.5, 80.8 and 36.9 percent respectively. On the other hand remaining sectors including Roads, Highways & Bridges, Land Reclamation, Rural Development and Justice Admin depicted a slight downward deviation of less than 10 percent during FY 2010/11.
Deviations of actual Current and Development Expenditures from Revised Budgetary Allocations
“The elimination of ignorance, of illiteracy and of needless inequalities in opportunities is to be seen as
objectives that are valued for their own sake. They expand our freedom to lead the lives we have reason to
value, and these elementary capabilities are of importance on their own.”
-------Prof Amartya Sen, Nobel economics laureate
4.28 Sector specific percentage deviations of Development and Current expenditures relative to revised budgetary allocations during FY 2009/10 and FY 2010/11 were shown in Table 4.10. A downward deviation of 21.5 percent was recorded on the development side. The current expenditures
witnessed an upward deviation of 13.5 percent in FY2010/11. Significant underutilization of Development budget can be explained by a sizeable reduction in development spending to meet short term obligations regarding post flood rehabilitation activities. 4.29 Substantial underutilization reflected by downward deviation was witnessed on the Development side in all but six sectors i.e. ‘Roads, Highways & Bridges’, ‘Environment/ Water Supply & Sanitation’, Population Planning, Social Security & Welfare, Natural Calamities & Disasters and Rural Development. Five sectors including Land Reclamation, Law & Order, Low Cost Housing, Justice Admin and Subsidies registered negative deviation in excess of seventy five percent indicating underutilization of approved Development budgetary allocations. Education, Health and Agriculture sectors sustained the underutilization trend for development expenditures as reflected by their downward deviations of 50, 51.1 and 20.6 percent respectively in FY 2010/11 as compared to 51.9, 51.2 and 7.8 percent respectively in FY 2009/10. 4.30 Among the current expenditures of PRSP (see, table 4.10) seven sectors have experienced overutilization of budgetary allocations with maximum upward deviation in Land Reclamation i.e. 14,576 percent. Education and Justice Admin also showed an upward deviation of 173.6 and 153 percent respectively in FY 2010/11. Substantial downward deviations in excess of 75 percent were witnessed in ‘Roads, Highways & Bridges’, Population Planning, Social Security & Welfare, Rural Development and Low Cost Housing.

Table 4.10: Deviations of Budgeted and Actual (Current and Development) PRSP Expenditures (Rs. Million)
FY 2009/10 FY 2010/11
Sector
Development Current Development Current
Budget Actual Deviation (%age)
Budget Actual Deviation (%age)
Budget Actual Deviation (%age)
Budget Actual Deviation (%age)
Roads, Highways, & Bridges 18,609 85,963 362.0 69,445 12,493 ‐82.0 26,222 84,271 221.4 76,300 15,296 ‐80.0
Environment/Water Supply & Sanitation
5,718 18,039 215.5 14,770 7,420 ‐49.8 7,585 19,183 152.9 16,064 9,323 ‐42.0
Education 82,233 39,592 ‐51.9 80,804 219,933 172.2 90,648 45,348 ‐50.0 101,243 276,986 173.6
Health 57,966 28,301 ‐51.2 26,881 66,098 145.9 56,549 27,658 ‐51.1 38,017 78,359 106.1
Population Planning 2,058 6,802 230.6 6,211 246 ‐96.0 1,374 4,650 238.5 6,798 211 ‐96.9
Social Security & Social Welfare 582 17,438 2895.0 19,149 2,840 ‐85.2 1,547 13,996 804.7 52,714 3,621 ‐93.1
Benazir Income Support Programme ‐ ‐ ‐ 70,000 32,032 ‐54.2 38,000 34330 ‐9.7 ‐ ‐ ‐
Pakistan Bait‐ul‐Maal ‐ ‐ ‐ 3,200 2,261 ‐29.3 ‐ ‐ ‐ 2,000 3224 61.2
Natural Calamities & Other Disasters 2,303 2,693 16.9 22,598 9,855 ‐56.4 2,572 2,652 3.1 22,350 46,463 107.9
Agriculture 63,316 58,384 ‐7.8 39,367 46,431 17.9 65,442 51,948 ‐20.6 47,466 63,563 33.9
Land Reclamation 3,680 0 ‐100.0 25 1,990 7892.0 4,001 0 ‐100.0 25 3,669 14576.0
Rural Development 16,234 19,591 20.7 7,778 800 ‐89.7 13,836 18,118 30.9 6,241 991 ‐84.1
Law and Order 71,033 1,756 ‐97.5 69,817 141,883 103.2 81,531 1,382 ‐98.3 86,509 168,409 94.7
Low Cost Housing 2,239 675 ‐69.9 2,500 1,153 ‐53.9 1,294 231 ‐82.2 650 142 ‐78.2
Justice Admin 7,791 945 ‐87.9 3,460 10,051 190.5 10,531 2173 ‐79.4 4,762 12,050 153.0
Subsidies 28,519 5,856 ‐79.5 342,536 229,070 ‐33.1 22,334 15 ‐99.9 343,585 230,930 ‐32.8
Food Support Programme ‐ ‐ ‐ ‐ ‐ ‐ ‐ ‐ ‐ ‐ ‐ ‐
People's Works Programme‐I ‐ 8,417 ‐ ‐ ‐ ‐ ‐ 5049 ‐ ‐ ‐ ‐
People's Works Programme‐II ‐ 31,754 ‐ ‐ ‐ ‐ ‐ 21300 ‐ ‐ ‐ ‐
GRAND TOTAL 362,280 326,206 ‐10.0 778,542 784,556 0.8 423,463 332,304 ‐21.5 804,724 913,237 13.5
Source: Strengthening PRS Monitoring, Finance Division, Islamabad.
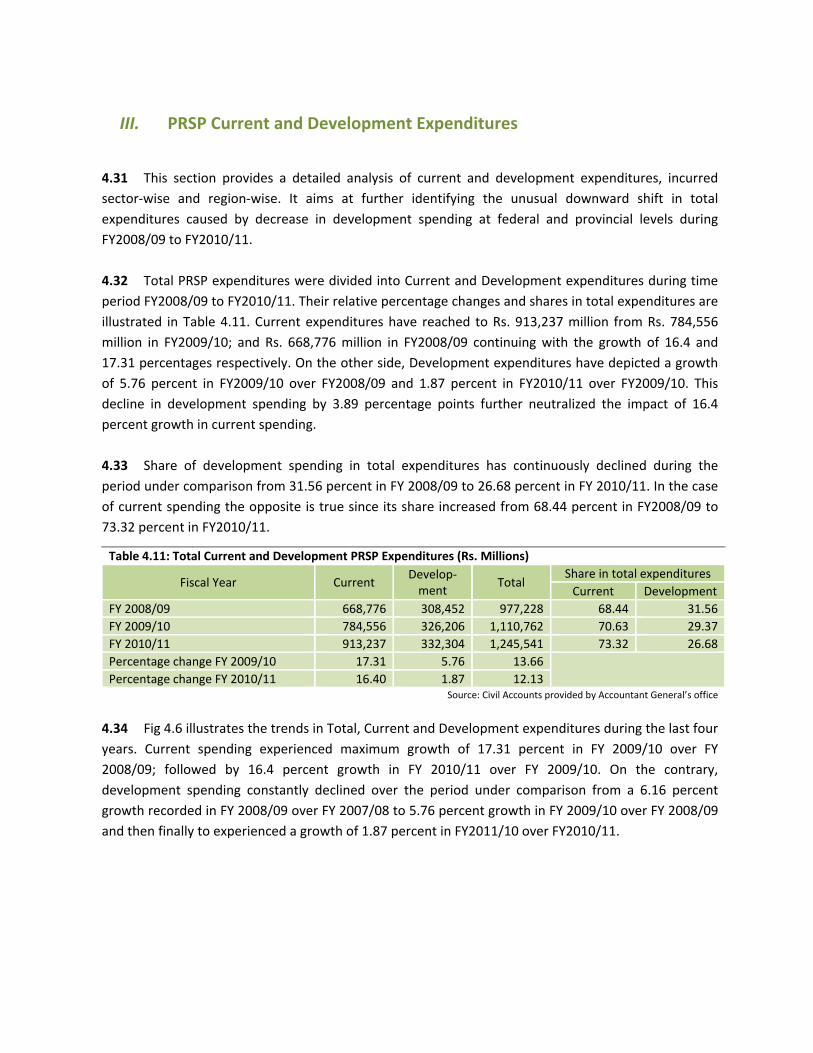
III. PRSP Current and Development Expenditures
4.31 This section provides a detailed analysis of current and development expenditures, incurred sector‐wise and region‐wise. It aims at further identifying the unusual downward shift in total expenditures caused by decrease in development spending at federal and provincial levels during FY2008/09 to FY2010/11. 4.32 Total PRSP expenditures were divided into Current and Development expenditures during time period FY2008/09 to FY2010/11. Their relative percentage changes and shares in total expenditures are illustrated in Table 4.11. Current expenditures have reached to Rs. 913,237 million from Rs. 784,556 million in FY2009/10; and Rs. 668,776 million in FY2008/09 continuing with the growth of 16.4 and 17.31 percentages respectively. On the other side, Development expenditures have depicted a growth of 5.76 percent in FY2009/10 over FY2008/09 and 1.87 percent in FY2010/11 over FY2009/10. This decline in development spending by 3.89 percentage points further neutralized the impact of 16.4 percent growth in current spending. 4.33 Share of development spending in total expenditures has continuously declined during the period under comparison from 31.56 percent in FY 2008/09 to 26.68 percent in FY 2010/11. In the case of current spending the opposite is true since its share increased from 68.44 percent in FY2008/09 to 73.32 percent in FY2010/11.
Table 4.11: Total Current and Development PRSP Expenditures (Rs. Millions)
Fiscal Year Current Develop‐ment
Total Share in total expendituresCurrent Development
FY 2008/09 668,776 308,452 977,228 68.44 31.56FY 2009/10 784,556 326,206 1,110,762 70.63 29.37FY 2010/11 913,237 332,304 1,245,541 73.32 26.68Percentage change FY 2009/10 17.31 5.76 13.66
Percentage change FY 2010/11 16.40 1.87 12.13
Source: Civil Accounts provided by Accountant General’s office
4.34 Fig 4.6 illustrates the trends in Total, Current and Development expenditures during the last four years. Current spending experienced maximum growth of 17.31 percent in FY 2009/10 over FY 2008/09; followed by 16.4 percent growth in FY 2010/11 over FY 2009/10. On the contrary, development spending constantly declined over the period under comparison from a 6.16 percent growth recorded in FY 2008/09 over FY 2007/08 to 5.76 percent growth in FY 2009/10 over FY 2008/09 and then finally to experienced a growth of 1.87 percent in FY2011/10 over FY2010/11.

Source: Strengthening PRS Monitoring, Finance Division, Islamabad.
PRSP Current and Development Expenditures by Province
4.35 Table 4.12 reveals the Current and Development expenditures incurred at federal and provincial levels. Current expenditures posted an increasing trend in all provinces except in KP. Development expenditures however depicted a mixed trend. In FY2009/10, Punjab, Sindh and KP, all experienced escalating growth trends in both current and development spending; whereas in FY 2010/11, Balochistan was the only province exhibiting an increase in current and developing expenditure of 61.97 percent and 88.84 percent respectively. Current spending in Punjab, Sindh and Federal registered a growth of 30.24, 48.8 and 11.58 percent respectively, while development expenditure declined in the three provinces. Development expenditures were doubled in Balochistan from Rs. 12,433 million in FY2009/10 to Rs. 34,780 million in FY2010/11. Declining trends in development expenditures of other provinces have suppressed this growth, as reflected by a slight growth of 1.87 percent in the overall development expenditures in FY2010/11 against 5.76 percent in FY 2009/10.
Table:4.12 Percentage Change in PRSP Current and Development Expenditures by Province for FY 2008/09, 2009/10 and 2010/11
Province FY 2008‐09 FY 2009‐10 FY 2010‐11
Percentage change in FY 2009/10
Percentage change in FY 2010/11
Cur Dev Cur Dev Cur Dev Cur Dev Cur Dev
Federal 285,822 112,287 362,026 106,980 367,832 113,462 26.66 ‐4.73 1.60 6.06
Punjab 212,404 90,031 219,403 90,934 285,760 81,528 3.30 1.00 30.24 ‐10.34
Sindh 86,629 64,165 102,444 70,375 152,433 56,898 18.26 9.68 48.80 ‐19.15
KP 56,552 27,999 70,308 38,088 58,015 45,636 24.32 36.03 ‐17.48 19.82
Balochistan 27,369 13,970 30,375 12,433 49,197 34,780 10.98 ‐11.00 61.97 179.74
Pakistan 668,776 308,452 784,556 326,206 913,237 332,304 17.31 5.76 16.40 1.87
Source: Civil Accounts provided by Accountant General’s office
‐11.03
17.31
16.406.16
5.761.87
‐15‐10‐505
10152025
2007/08 to 2008/09 2008/09 to 2009/10 2009/10 to 2010/11
Figure 4.6: Trend by Percentage change in Total Current and Development PRSP Expenditures in last four years
Current Development

Sector‐wise change in Current and Development Expenditures
4.36 Percentage change in Current and Development expenditures in 17 pro‐poor sectors during PRSP‐II period (FY2008/09 to FY2010/11) is presented in Table 4.13. Among the percentage changes in current and development spending, all the sectors depicted mixed trend with a few exceptions as ‘Population Planning’ and ‘Low Cost Housing’ in FY2010/11 and ‘Roads, Highways & Bridges’ and Land Reclamation in FY 2009/10 showed declining trends for both current and development spending. ‘Natural Calamities and other disasters’ contributed up to 371.47 percent in the total increase in current expenditures in FY 2010/11. Low Cost Housing contributed 109.26 percent while the Social Security & Welfare contributed 105.81 percent in FY 2009/10. 4.37 On development side a huge reduction of 99.74, 65.78, 31.64, 40.01 and 32.92 percent was witnessed in the five sectors including Subsidies, Low Cost Housing, Population Planning, People’s Works Programme I & II respectively. This lead to a considerable decline in total expenditures of these sectors in FY 2010/11. In contrast, a massive increase of 2009.38 percent, 161.01 percent and 152.84 percent in Low Cost Housing, Justice Admin and People’s Works Programme‐I respectively provided the basis for enlargement in development expenditures in FY 2009/10.
Table‐4.13 Percentage Change in PRSP Current and Development Expenditures by Sector
Sector FY 2009/10 over FY 2008/09 FY 2010/11 over FY 2009/10
Current Develop‐ ment
Total Current Develop‐ ment
Total
Roads, Highways, & Bridges ‐8.31 ‐0.03 ‐1.16 22.44 ‐1.97 1.13 Environment/Water Supply & Sanitation 6.53 18.37 14.66 25.65 6.34 11.97 Education 11.23 ‐7.18 7.97 25.94 14.54 24.2 Health 15.44 6.97 12.76 18.55 ‐2.27 12.31 Population Planning 6.49 33.01 31.86 ‐14.23 ‐31.64 ‐31.03 Social Security & Welfare 105.81 57.28 87.34 27.5 ‐19.74 ‐13.12 Benazir Income Support Programme 128.75 ‐ 128.75 ‐ 7.17 7.17 Pakistan Bait‐ul‐Maal 93.41 ‐ 93.41 42.59 ‐ 42.59 Natural Calamities & Other Disasters 26.69 16.88 24.45 371.47 ‐1.52 291.42 Agriculture 21.45 15.2 17.89 36.9 ‐11.02 10.2 Land Reclamation ‐27.32 ‐ ‐27.32 84.37 ‐ 84.37 Rural Development ‐29.02 28.59 24.62 23.88 ‐7.52 ‐6.29 Law and Order 37.37 28.08 37.25 18.7 ‐21.3 18.21 Low Cost Housing 109.26 2009.38 213.55 ‐87.68 ‐65.78 ‐79.6 Justice Admin 13.81 161.05 19.61 19.89 129.95 29.35 Subsidies 14.55 ‐71.57 6.51 0.81 ‐99.74 ‐1.69 Food Support Programme 0 0 0 ‐ ‐ ‐ People's Works Programme‐I 0 152.84 152.84 ‐ ‐40.01 ‐40.01 People's Works Programme‐II 0 13.41 13.41 ‐ ‐32.92 ‐32.92 GRAND TOTAL 17.31 5.76 13.66 16.4 1.87 12.13
Source: Strengthening PRS Monitoring, Finance Division, Islamabad.
4.38 In aggregate terms, only three sectors namely Environment/Water Supply & Sanitation, Education and Justice Admin came up with positive trends in both current and development

expenditures in FY2010/11, in contrast to nine sectors that showed an increasing trend in FY20o9/10. This was the consequence of the government’s decision to cut off development expenditures to meet short term demands.
IV. PRSP Expenditures in Sub sectors of Education and Health
4.39 Investment in the sectors of Education and Health is critical to assist poor people to get out of the vicious circle of poverty. This section gives a thorough scrutiny of expenditures incurred in sub‐sectors of Education and Health, both at federal and provincial levels.
PRSP Expenditures in Education
4.40 According to figures given in Table 4.14 aggregate spending in education sector has depicted significant YoY growth of 24.2 percent in FY 2010/11 over FY 2009/10 against 7.97 percent in FY 2009/10 over FY 2008/09. This considerable growth in education sector spending is the outcome of strong positive trends by all the provinces except for KP with negative expenditure growth of 34.19 percent. Among the sub sectors of education General Universities and Vocational Training dominated the other subsectors with their positive growth trends of 33.59 and 32.69 percent respectively in FY 2010/11 over FY 2009/10.
Table 4.14: Percentage Change in Education sector’s PRSP Expenditures
Education sub‐sector Fiscal Year Federal Punjab Sindh KP Balo‐chistan
Total
Primary Education 2009/10 over 2008/09 21.79 12.89 ‐2.19 19.14 21.53 10.75 2010/11 over 2009/10 25.52 33.09 30.74 ‐59.17 45.36 16.54
Secondary Education 2009/10 over 2008/09 16.66 7.15 ‐3.38 24.75 9.71 9.23 2010/11 over 2009/10 34.18 41.09 35.69 ‐45.63 89.72 20.1
General Universities, Colleges, & Institutes
2009/10 over 2008/09 ‐8.61 11.82 ‐6.6 17.22 15.44 ‐2.62 2010/11 over 2009/10 27.98 29.45 25.96 71.34 134.72 33.59
Professional & Technical Universities, Colleges & Institutes
2009/10 over 2008/09 34.89 7.09 9.96 18.66 29.49 21.84
2010/11 over 2009/10 49.15 ‐24.82 21.97 21.63 12.54 27.07
Teacher & Vocational Training
2009/10 over 2008/09 ‐4.29 65.22 ‐34.04 0.00 23.12 51.61 2010/11 over 2009/10 7.46 31.4 63.71 0.00 34.93 32.69
Others 2009/10 over 2008/09 34.15 ‐25.26 89.28 24.77 70.14 4.73 2010/11 over 2009/10 9.21 33.53 55.93 ‐15.45 56.39 33.84
Total 2009/10 over 2008/09 4.58 3.21 8.35 21.53 25.85 7.97 2010/11 over 2009/10 28.81 33.71 36.52 ‐34.19 66.15 24.2
Source: Strengthening PRS Monitoring, Finance Division, Islamabad.
4.41 Total expenditures on Primary and Secondary education increased by 16.54 percent and 20.1 percent respectively in FY 2010/11 over FY 2009/10 owing to healthy growth by all the provinces; except for KP where the expenditures declined to 59.17 percent and 45.63 percent in the two subsectors of primary and secondary education respectively. Among the two subsectors of Higher education namely General and Professional Universities and’ Vocational Training’ subsector, spending increased by 33.59 percent, 27.07 percent and 32.69 percent respectively in FY 2010/11 over FY

2009/10. ‘Others’ subsector exhibited the maximum percentage change of 33.84 percent in FY 2010/11 among all the subsectors. 4.42 Balochistan experienced maximum increase in expenditures in the four subsectors of primary education, secondary education, general universities and others. At the federal level, professional universities recorded the maximum growth in spending of 49.15 percent, followed by secondary education that registered a growth of 34.18 percent in FY 2010/11. 4.43 Percentage distribution of education expenditures in subsectors depicted an identical pattern in all the three years from FY2008/09 to Fy2010/11. Maximum priority was assigned to Primary Education recording a growth of 31.18 percent in FY 2010/11; 33.23 percent in FY 2009/10; and 32.40 percent in FY 2008/09. Secondary education figure stood at 24.15 percent in FY 2010/11; 24.97 percent in FY 2009/10; and 24.68 percent in FY 2008/09. The smallest share in spending in total education expenditures was allocated to “Teacher & Vocational training” with 1.53 percent in FY2008/09, 2.15 percent in FY2009/10 and 2.29 percent in FY2010/11.
Source: Strengthening PRS Monitoring, Finance Division, Islamabad.
4.44 At provincial level, Primary and Secondary education retained their maximum share in aggregate spending in all the four provinces. ‘Balochistan exhibited a share of 20.24 percent and 14.17 percent for General and Professional Universities respectively, much larger than the other provinces. 4.45 Table 4.15 gives the spending share pattern in subsectors of Education at federal level. The expenditures pursue a similar trend under the comparison period. Maximum priority was given to two subsectors of Higher education namely General and Professional Universities showing 55.5 percent and
32.40
33.23
31.18
24.68
24.97
24.15
19.30
17.41
18.73
5.13
5.79
5.92
1.53
2.15
2.29
16.96
16.45
17.73
0.00 10.00 20.00 30.00 40.00 50.00 60.00 70.00 80.00 90.00 100.00
FY 2008‐09
FY 2009‐10
FY 2010‐11
Figure 4.6: Percentage Distribution of Education Expenditures by Sub‐ sector duringFY 2008/09 ‐ FY 2010/11
Primary Education Secondary Education
General Universities, Colleges, & Institutes Professional & Technical Universities, Colleges & Institutes
Teacher & Vocational Training Others

16.15 percent ditribution respectively in FY 2010/11. One similarity observed in spending distribution pattern at federal and provincial levels is the least share holding by ‘Teacher and Vocational Training’.
Table 4.15: Percentage Distribution of Education sector’s PRSP Expenditures by Province and Sub‐sector
Federal Punjab Sindh KP Balo‐chistan
Total
Education sub‐sector FY 2010/11Primary Education 7.04 40.98 35.19 23.12 29.48 31.18Secondary Education 9.9 26.52 25.92 32.97 31.49 24.15General Universities, Colleges, & Institutes
55.5 8.61 9.52 20.24 12.49 18.73
Professional & Technical Universities, Colleges & Institutes
16.15 1.04 4.77 14.17 3.44 5.92
Teacher & Vocational Training 0.12 4.6 0.56 0 1.56 2.29Others 11.3 18.25 24.03 9.5 21.54 17.73Total 100 100 100 100 100 100Education sub‐sector FY 2009/10Primary Education 7.22 41.17 36.75 37.26 33.7 33.23Secondary Education 9.5 25.14 26.08 39.9 27.58 24.97General Universities, Colleges, & Institutes
55.86 8.9 10.32 7.78 8.84 17.41
Professional & Technical Universities, Colleges & Institutes
13.94 1.84 5.34 7.67 5.08 5.79
Teacher & Vocational Training 0.14 4.68 0.47 0 1.92 2.15Others 13.33 18.27 21.04 7.39 22.88 16.45Total 100 100 100 100 100 100Education sub‐sector FY 2008/09Primary Education 6.20 37.64 40.71 38.01 34.90 32.40Secondary Education 8.52 24.21 29.24 38.88 31.64 24.68General Universities, Colleges, & Institutes
63.92 8.21 11.97 8.06 9.63 19.30
Professional & Technical Universities, Colleges & Institutes
10.81 1.78 5.26 7.85 4.94 5.13
Teacher & Vocational Training 0.16 2.93 0.77 0.00 1.96 1.53Others 10.39 25.23 12.05 7.20 16.93 16.96Total 100 100 100 100 100 100
Source: Strengthening PRS Monitoring, Finance Division, Islamabad.
PRSP Expenditures in Health
4.46 According to figures given in Table 4.16 aggregate expenditures in Health sector depicted a substantial YoY growth of 12.31 percent. Positive growth trends were observed in two subsectors of General Hospitals and ‘Others’. Two subsectors of Mother & Child Health’ and ‘Health Facilities’ showed negative growth trends. This negative trend contributed in lowering the overall YoY expenditures growth for Health sector.

4.47 General Hospitals and Clinics experienced maximum YoY growth of 17.35 percent in FY 2010/11 with positive growth exhibited by all the provinces. Conversely, ‘Mother & Child Health’ showed negative growth of 45.37 percent in total expenditures for all provinces.
Table 4.16: Percentage Change in Health Sector’s PRSP Expenditures
Health sub‐sector Fiscal Year Federal Punjab Sindh KP Balo‐chistan
Total
General Hospitals & Clinics 2009/10 over 2008/09 34.95 2.76 ‐3.92 8.36 16.19 5.03
2010/11 over 2009/10 7.75 15.14 14.95 10.92 150.14 17.35
Mother & Child Health 2009/10 over 2008/09 75.00 113.73 0.00 0 ‐9.84 70.45
2010/11 over 2009/10 14.29 ‐36.7 ‐100 ‐48.28 ‐100 ‐45.37
Health Facilities & Preventive Measures
2009/10 over 2008/09 40.76 37.76 153.33 33.85 50.86 48.18
2010/11 over 2009/10 ‐6.39 10.41 30.52 ‐32.18 55.98 ‐0.29
Others 2009/10 over 2008/09 10.33 27.62 48.42 ‐61.11 28.64 13.37
2010/11 over 2009/10 ‐1.91 5.68 26.01 36.82 ‐27.38 6.38
Total 2009/10 over 2008/09 37.89 6.55 7.43 ‐1.73 25.71 12.76
2010/11 over 2009/10 ‐1.68 13.26 17.82 9.49 62.92 12.31
Source: Strengthening PRS Monitoring, Finance Division, Islamabad.
4.48 At provincial level, all the four provinces underwent enhancement in their spending in the Health sector. Baluchistan dominated the other provinces with 62.92 percent in FY 2010/11 and 25.71 percent in FY 2009/10. This significant growth by Balochistan is the combined impact of 150.14 percent and 55.98 percent increase in expenditures for ‘General Hospitals’ and ‘Health Facilities’ subsectors respectively in FY 2010/11 over FY 2009/10. Percentage change in PRSP Health expenditures at federal level, exhibited a trivial growth of 1.68 percent in FY 2010/11 over FY 2009/10 against 37.89 percent growth in FY 2009/10 over FY 2008/09. 4.49 Proportional distribution of aggregate health expenditures given in Table 4.17 and Fig 3.6, reflects a similar pattern during the three years period under comparison. ‘General Hospitals & Clinics’ were the maximum shareholder with 73.47 percent in FY 2008/09; 68.43 percent in FY 2009/10; and 71.5 percent in FY 2010/11. ‘Mother & Child Health’ held the lowest share in aggregate expenditures in the three years under comparison.
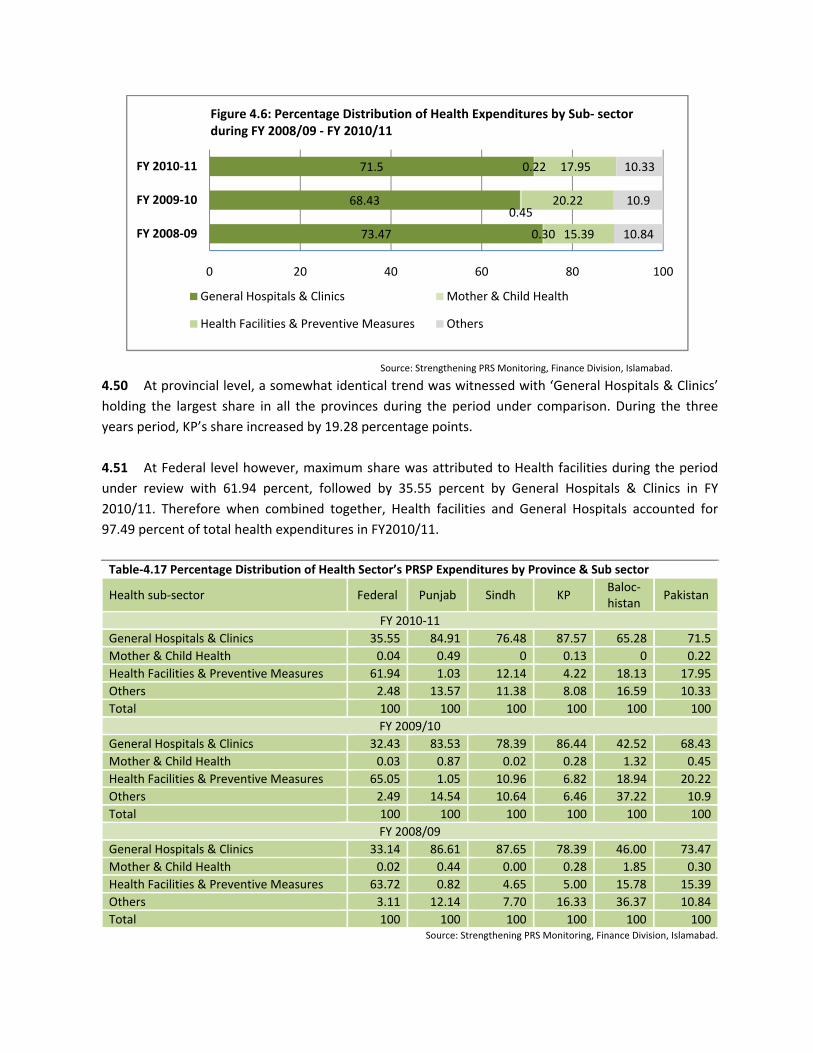
Source: Strengthening PRS Monitoring, Finance Division, Islamabad.
4.50 At provincial level, a somewhat identical trend was witnessed with ‘General Hospitals & Clinics’ holding the largest share in all the provinces during the period under comparison. During the three years period, KP’s share increased by 19.28 percentage points. 4.51 At Federal level however, maximum share was attributed to Health facilities during the period under review with 61.94 percent, followed by 35.55 percent by General Hospitals & Clinics in FY 2010/11. Therefore when combined together, Health facilities and General Hospitals accounted for 97.49 percent of total health expenditures in FY2010/11.
Table‐4.17 Percentage Distribution of Health Sector’s PRSP Expenditures by Province & Sub sector
Health sub‐sector Federal Punjab Sindh KP Baloc‐histan
Pakistan
FY 2010‐11General Hospitals & Clinics 35.55 84.91 76.48 87.57 65.28 71.5Mother & Child Health 0.04 0.49 0 0.13 0 0.22Health Facilities & Preventive Measures 61.94 1.03 12.14 4.22 18.13 17.95Others 2.48 13.57 11.38 8.08 16.59 10.33Total 100 100 100 100 100 100
FY 2009/10General Hospitals & Clinics 32.43 83.53 78.39 86.44 42.52 68.43Mother & Child Health 0.03 0.87 0.02 0.28 1.32 0.45Health Facilities & Preventive Measures 65.05 1.05 10.96 6.82 18.94 20.22Others 2.49 14.54 10.64 6.46 37.22 10.9Total 100 100 100 100 100 100
FY 2008/09General Hospitals & Clinics 33.14 86.61 87.65 78.39 46.00 73.47Mother & Child Health 0.02 0.44 0.00 0.28 1.85 0.30Health Facilities & Preventive Measures 63.72 0.82 4.65 5.00 15.78 15.39Others 3.11 12.14 7.70 16.33 36.37 10.84Total 100 100 100 100 100 100
Source: Strengthening PRS Monitoring, Finance Division, Islamabad.
73.47
68.43
71.5
0.30
0.45
0.22
15.39
20.22
17.95
10.84
10.9
10.33
0 20 40 60 80 100
FY 2008‐09
FY 2009‐10
FY 2010‐11
Figure 4.6: Percentage Distribution of Health Expenditures by Sub‐ sector during FY 2008/09 ‐ FY 2010/11
General Hospitals & Clinics Mother & Child Health
Health Facilities & Preventive Measures Others

V. Actual PRSP budgetary expenditures relative to PRSP‐II Projections 4.52 The comparison of actual PRSP expenditures as percentage of GDP for the three years period under analysis is illustrated in Table 4.18. In aggregate terms, PRSP actual expenditures surpassed the targets by 0.28 percentage points in FY 2010/11; 1.56 percentage points in FY 2009/10; and 1.6 percentage points in FY 2008/09. Similarly, Expenditures in current and development categories exceeded the projections in all the three years, with one exception that is development expenditures that fell short by 0.36 percentage points in FY 2010/11 against the target of 2.2 percent of GDP.
Table 4.18 Actual PRSP Budgetary Expenditures Relative to Projection in PRSP‐II (in terms of expenditure to GDP ratio)
PRSP Expenditures FY 2008/09 FY 2009/10 FY 2010/11
Actual Projected Actual Projected Actual Projected Development 2.36 1.74 2.22 1.9 1.84 2.2 Current 5.11 4.12 5.35 4.12 5.06 4.43 Total 7.46 5.86 7.57 6.01 6.9 6.62
Market Access and Community Services Roads, Highways, & Bridges 0.76 0.36 0.67 0.41 0.55 0.48 Environment/ Water Supply & Sanitation
0.17 0.07 0.17 0.08 0.16 0.08
Human Development Education 1.84 1.51 1.77 1.82 1.78 2.2 Health 0.64 0.34 0.64 0.43 0.59 0.56 Population Planning 0.04 0.03 0.05 0.03 0.03 0.03
Rural Development Agriculture 0.68 0.7 0.71 0.77 0.64 0.84 Land Reclamation 0.02 0.02 0.01 0.02 0.02 0.02 Rural Development 0.12 0.07 0.14 0.08 0.11 0.08 People's Works Programme‐I 0.03 0.02 0.06 0.02 0.03 0.02 People's Works Programme‐II 0.21 0.11 0.22 0.11 0.12 0.12
Safety Nets Subsidies 1.68 1.78 1.60 1.25 1.28 1.13 Social Security & Welfare 0.11 0.11 0.14 0.18 0.10 0.21 Benazir Income Support Programme
0.11 0.18 0.22 0.33 0.19 0.38
Pakistan Bait‐ul‐Maal 0.01 0.03 0.02 0.02 0.02 0.04 Food Support Programme 0.09 0.07 ‐ 0.05 ‐ 0.08 Natural Calamities & Other Disasters
0.08 0.02 0.09 0.02 0.27 0.02
Low Cost Housing 0.00 0.01 0.01 0.01 0.00 0.01 Governance
Justice Admin 0.07 0.05 0.07 0.05 0.08 0.05 Law and Order 0.80 0.36 0.98 0.31 0.94 0.26 Total PRSP Expenditures 7.46 5.86 7.57 6.01 6.9 6.62
Source: Strengthening PRS Monitoring, Finance Division, Islamabad.
4.53 In the course of three years, actual expenditures as percentage of GDP exceeded the PRSP‐II targets in nine pro‐poor sectors namely Roads Highways & Bridges, Environment Water Supply & Sanitation, Health, Rural development, Subsidies, ‘Natural Calamities & other Disasters’, PWP‐I, Justice Admin and Law & Order. In the Law & Order sector the ratio of actual expenditures as percentage of

GDP as compared to forecasted PRSP percentages increased by 0.44 percent points in FY 2008/09; 0.67 percent points in FY 2009/10; and 0.68 percent points in FY 2010/11. However, expenditure to GDP ratio for Education, Agriculture, Social Security & Welfare, Pakistan Bait‐ul‐Maal, Benazir Income Support Programme and Pakistan Bait‐ul‐Maal remained below the projected figures during FY2009/10 and FY2010/11. 4.54 In the Health sector, ratio of actual expenditures to GDP remained above PRSP‐II projections in FY 2008/09 and FY 2009/10 but declined to 0.59 percent in FY 2010/11. Actual expenditure in Education surpassed the target in FY 2008/09, but lagged behind in FY 2009/10 and FY 2010/11. Hence in overall terms, Health sector performed better than education in terms of actual expenditure to GDP as compared to PRSP‐II Projections.

Chapter: 5
Protecting the Poor and Vulnerable
“If poverty is unacceptable to us, and we believe that it should not belong to a civilized society, then we must
create appropriate institutions and policies to create a poverty-free world”
— Muhammad Yunus

5.1 The government of Pakistan has made strenuous efforts to protect the poor and vulnerable sections of society from social and economic exclusion. The measures taken in this regard during the PRSP‐II period (FY2008/09‐FY2010/11) have been discussed in this section. These include Zakat, Employee Old Age Benefit Institution (EOBI), Worker’s Welfare Fund (WWF), Pakistan Bait‐ul‐Mal (PBM), Benazir Income Support Program (BISP), Microfinance and other such schemes.
I. Zakat
"Protect your wealth as though in a strong fort by paying its due Zakat and treat your sick with charity".-----
Prophet Muhammad (SAWA)
5.2 According to figures given in table 5.1 a total of Rs. 2,874 million were disbursed in FY 2009/10 under different Zakat programmes as compared to Rs. 2,877 million during FY 2008/09 registering a decrease of less than 1 percent. A slight decrease in Zakat disbursements and a significant increase in beneficiaries were noticed during FY 2009/10 in comparison with FY 2008/09. If we compare the disbursements of FY 2009/10 with FY 2010/11, an increasing trend of 245 percent from Rs. 2,874 million to Rs. 9909.753 million was recorded in zakat funds. Of the total Zakat disbursements, 56 percent was disbursed under Regular Zakat Programmes, 23 percent under Other Zakat Programmes and remaining 21 percent under National Level Schemes during FY 2009/10 against the previous year’s share of 51 percent, 33 percent and 16 percent, respectively.
5.3 Disbursements under Guzara allowance, Education stipends, stipends to students of deeni madrassahs, Health care, marriage assistance to unmarried women, and Eid grants have increased by 5, 19, 13, 19, 150 and 3 percent respectively; resultantly beneficiaries increased by 11, 46, 45, 8, 132 and 1 percent respectively during FY 2009/10 as compared to FY 2008/09. However, in case of Leprosy patients zakat disbursements fell by 51 percent while beneficiaries went up by 119 percent during the same period. Nothing was spent under the Permanent Rehabilitation Scheme of zakat during both years nor was any amount spent under Social Welfare/Rehabilitation during FY 2009/10.
5.4 On the other hand if we compare the disbursements of FY 2010/11 with the FY 2009/10, there emerges a positive trend of 140 percent under Guzara Allowance, 113 percent in education stipends, 131 percent under stipends to students of deeni madrassahs, 115 percent in health care, 105 percent in marriage assistance to unmarried women, 135 percent under eid grants, 204 in leprosy patient, 107 percent in educational stipend (tech) and 23 percent under model deeni madrassahs. National level health institutions registered a decline of 11 percent (from Rs. 577.85 million to Rs. 513.8 million). Whereas Rs. 4170 million were invested under Natural calamities/ flood affectees /IDPs iand Rs. 100 million under hepatitis‐C program for the very first year during the review period.

Table 5.1: Comparison of Zakat Programmes
FY 2008/09 FY 2009/10 FY 2010/11Amount Utilised
(Rs Million)
No. of Bene‐ficiaries
Amount Utilised
(Rs Million)
No. of Bene‐ficiaries
Amount Utilised
(Rs. Million)
No. of Bene‐ficiaries
Regular Zakat ProgrammesGuzara Allowance 882 241,011 925.76 266,390 2225.429 ‐Education stipends 262 190,799 312.994 278,765 667.629 ‐Stipends to students of Deeni Madrassahs
114 66,228 128.723 96,255 296.723 ‐
Health care 87 66,952 103.371 72,028 222.542 ‐Social welfare / Rehabilitation
56 19,219 ‐ ‐ ‐ ‐
Marriage assistance to unmarried women 58 5,986
144.907 13,900 296.726 ‐
Sub Total 1459 590,195 1,616 727,338 3709.049 ‐Other Zakat Programmes
Eid Grants 77 156,076 78.93 157,883 185.455 ‐Leprosy Patients 1 103 0.493 226 1.500 ‐Permanent rehabilitation scheme of Zakat
‐ ‐ ‐ ‐ ‐ ‐
Educational Stipend (tech) 868 75,237 586.1 101,898 1211.954 ‐Sub Total 946 231,416 665.523 260,007 1398.909 ‐
National level SchemesNational level health institutions
461 262,92s0 577.85 299,051 513.795 ‐
Model Deeni Madrassahs 11 847 14.62 2654 18 ‐Natural Calamities/Flood Affectees/IDPs
‐ ‐ ‐ ‐ 4170 ‐
Hepatitis –C ‐ ‐ ‐ ‐ 100 ‐Subtotal 472 263,767 592.47 301,705 4801.795 ‐Grand Total 2,877 1,085,378 2,874 1,289,050 9909.753 ‐
II. Employees’ Old Age Benefits Institution (EOBI)
5.5 A slight increase in EOBI’s activities was noticed during FY 2010/11 in comparison to FY 2009/10. Table 5.2 shows that a total of Rs. 9,366 million was disbursed during FY 2010/11 under different programmes of EOBI as compared to Rs. 6,442 million during FY 2009/10 registering an increase of 45 percent. The number of beneficiaries was recorded at 290,000 in FY 2008/09; 310,352 in FY 2009/10; 336,281 in FY 2010/11. 5.6 Under the Old Age Pension, the flagship programme of EOBI, disbursements increased by 44 percent from Rs.4156 million in FY 2009/10 to Rs. 5,977 million in FY 2010/11. Disbursements under Invalidity Pension Programme recorded a growth of 3230 percent from Rs.96 million in FY 2009/10 to Rs. 3,197 million in FY 2010/11. Substantial growth of 114 percent from Rs. 21 million in FY2009/10 to
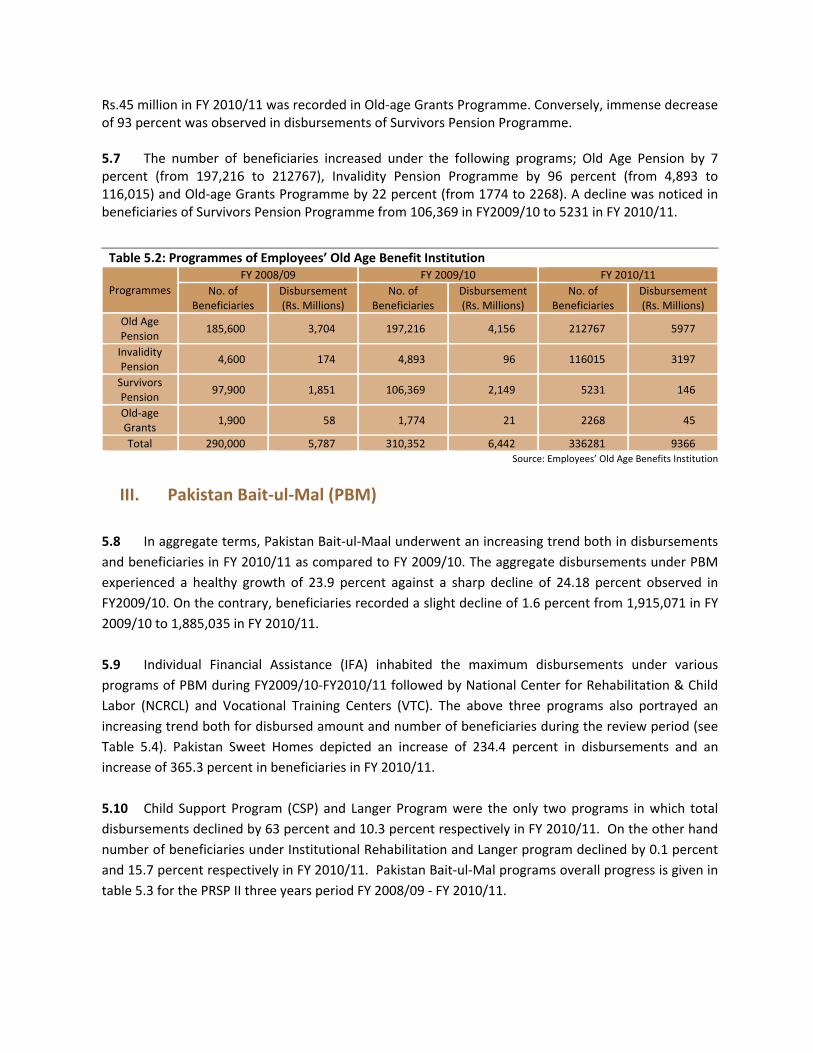
Rs.45 million in FY 2010/11 was recorded in Old‐age Grants Programme. Conversely, immense decrease of 93 percent was observed in disbursements of Survivors Pension Programme. 5.7 The number of beneficiaries increased under the following programs; Old Age Pension by 7 percent (from 197,216 to 212767), Invalidity Pension Programme by 96 percent (from 4,893 to 116,015) and Old‐age Grants Programme by 22 percent (from 1774 to 2268). A decline was noticed in beneficiaries of Survivors Pension Programme from 106,369 in FY2009/10 to 5231 in FY 2010/11.
Table 5.2: Programmes of Employees’ Old Age Benefit Institution
Programmes FY 2008/09 FY 2009/10 FY 2010/11
No. of Beneficiaries
Disbursement (Rs. Millions)
No. of Beneficiaries
Disbursement (Rs. Millions)
No. of Beneficiaries
Disbursement (Rs. Millions)
Old Age Pension
185,600 3,704 197,216 4,156 212767 5977
Invalidity Pension
4,600 174 4,893 96 116015 3197
Survivors Pension
97,900 1,851 106,369 2,149 5231 146
Old‐age Grants
1,900 58 1,774 21 2268 45
Total 290,000 5,787 310,352 6,442 336281 9366 Source: Employees’ Old Age Benefits Institution
III. Pakistan Bait‐ul‐Mal (PBM) 5.8 In aggregate terms, Pakistan Bait‐ul‐Maal underwent an increasing trend both in disbursements and beneficiaries in FY 2010/11 as compared to FY 2009/10. The aggregate disbursements under PBM experienced a healthy growth of 23.9 percent against a sharp decline of 24.18 percent observed in FY2009/10. On the contrary, beneficiaries recorded a slight decline of 1.6 percent from 1,915,071 in FY 2009/10 to 1,885,035 in FY 2010/11. 5.9 Individual Financial Assistance (IFA) inhabited the maximum disbursements under various programs of PBM during FY2009/10‐FY2010/11 followed by National Center for Rehabilitation & Child Labor (NCRCL) and Vocational Training Centers (VTC). The above three programs also portrayed an increasing trend both for disbursed amount and number of beneficiaries during the review period (see Table 5.4). Pakistan Sweet Homes depicted an increase of 234.4 percent in disbursements and an increase of 365.3 percent in beneficiaries in FY 2010/11. 5.10 Child Support Program (CSP) and Langer Program were the only two programs in which total disbursements declined by 63 percent and 10.3 percent respectively in FY 2010/11. On the other hand number of beneficiaries under Institutional Rehabilitation and Langer program declined by 0.1 percent and 15.7 percent respectively in FY 2010/11. Pakistan Bait‐ul‐Mal programs overall progress is given in table 5.3 for the PRSP II three years period FY 2008/09 ‐ FY 2010/11.

Table 5.3 Pakistan Bait‐ul‐Mal
Programmes FY 2008/09 FY 2009/10 FY 2010/11
No. of Beneficiaries
Disbursement (Rs. Millions)
No. of Beneficiaries
Disbursement (Rs. millions)
No. of Beneficiaries
Disbursement (Rs. Millions)
Food Support Programme
754,332 2,263 ‐ ‐ ‐ ‐
Individual Financial Assistance (IFA)
18,974 775.0 34,968 2,018.623 57,852 2,487.054.
National Centre for Rehabilitation of Child Labor (NCRCL)
181,607 194.0 262,375 287.005 341,319 345.743
Vocational Training Centers (VTC)
52,462 87.0 139,599 103.474 213,849 137.943
Institutional Rehabilitation (Grant‐In‐Aid to NGOs)
125,406 87.0 16,961 56.499 16,939 60.181
Child Support Programme (CSP)
26,141 26.0 20,406 53.371 35,587 19.767
Pakistan Sweet Homes (Orphanages)
‐ ‐ 1,159 40.418 5,393 135.151
Langer Program ‐ ‐ 1,439,603 42.177 1,214,096 37.835 Total Disbursement under all Programmes
1,158,922 3,432 1,915,071 2,602 1,885,035 3,224
Source: Pakistan Bait‐ul‐Maal
IV. Benazir Income Support Program (BISP)
5.11 When the present government took over in 2008 the total amount of subsidies were Rs 295.20 billion according to figures released by the Ministry of Finance. The new regime made a conscious effort to put a stop to the disbursement of blanket subsidies that caused fiscal imbalances in the economy. The overall subsidies had declined to 252.01 billion in FY2009/10 and 131.9 billion in FY2010/11. The initiation of BISP confirmed with the government’s intention to focus its efforts on granting targeted subsidies, thus avoiding any wastage of public revenues. The BISP was launched in FY 2008 with an initial allocation of Rs. 34 billion which is the largest allocation in the total budget and was 0.3 percent of the GDP for FY 2008/09. In order to ensure transparent disbursement of budgeted funds the government recently adopted the “Poverty Score Card” under the BISP. The Poverty Score Card is a simple quantitative tool designed by Mark Schreiner1 to assess poverty likelihood of an individual household. The score card comprises of 10 simple and easy questions which have been assigned weight‐age. The households’ poverty likelihood is assessed by calculating the weight‐age given to the answers. The organizations involved in conducting the Poverty Score Card survey include Rural Support Program Network (RSPN), Population Poverty Alleviation Fund (PPAF) and working under the Federal Bureau of Statistics the Population Support Organization (PSO). The main purpose of this mechanism is to ensure that funds reach the poorest
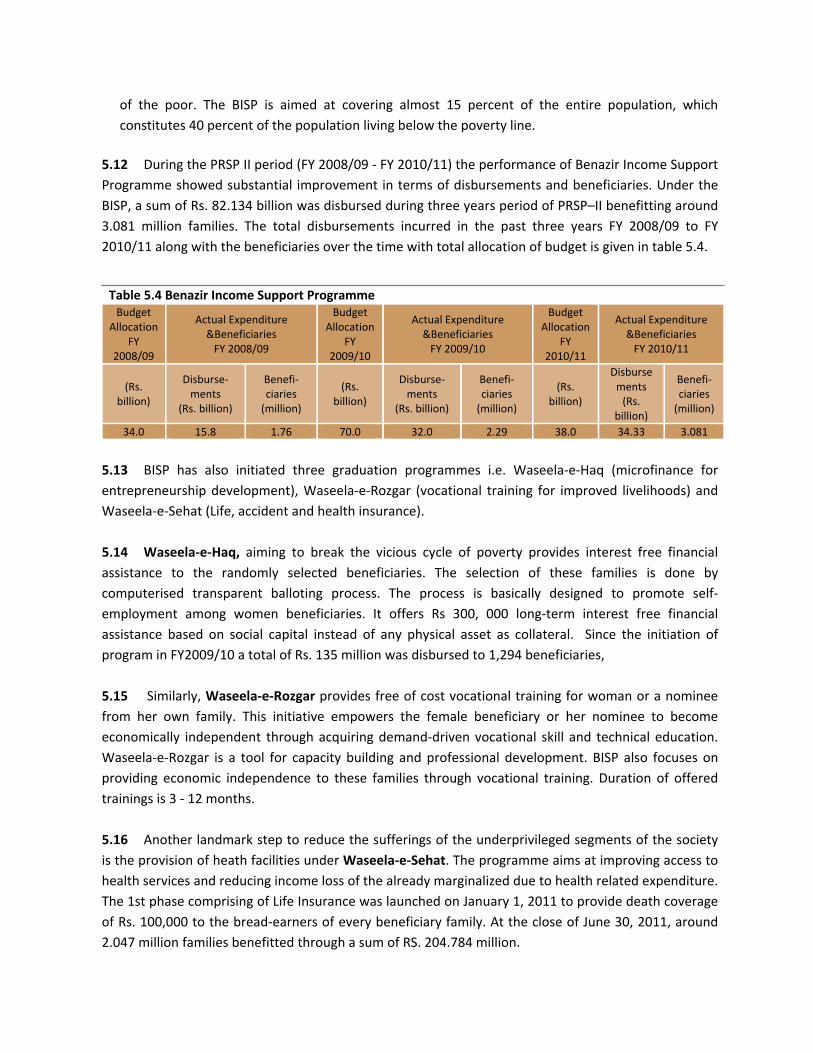
of the poor. The BISP is aimed at covering almost 15 percent of the entire population, which constitutes 40 percent of the population living below the poverty line.
5.12 During the PRSP II period (FY 2008/09 ‐ FY 2010/11) the performance of Benazir Income Support Programme showed substantial improvement in terms of disbursements and beneficiaries. Under the BISP, a sum of Rs. 82.134 billion was disbursed during three years period of PRSP–II benefitting around 3.081 million families. The total disbursements incurred in the past three years FY 2008/09 to FY 2010/11 along with the beneficiaries over the time with total allocation of budget is given in table 5.4.
Table 5.4 Benazir Income Support ProgrammeBudget
Allocation FY
2008/09
Actual Expenditure &Beneficiaries FY 2008/09
Budget Allocation
FY 2009/10
Actual Expenditure &Beneficiaries FY 2009/10
Budget Allocation
FY 2010/11
Actual Expenditure &Beneficiaries FY 2010/11
(Rs. billion)
Disburse‐ments
(Rs. billion)
Benefi‐ciaries (million)
(Rs. billion)
Disburse‐ments
(Rs. billion)
Benefi‐ciaries (million)
(Rs. billion)
Disbursements (Rs.
billion)
Benefi‐ciaries (million)
34.0 15.8 1.76 70.0 32.0 2.29 38.0 34.33 3.081
5.13 BISP has also initiated three graduation programmes i.e. Waseela‐e‐Haq (microfinance for entrepreneurship development), Waseela‐e‐Rozgar (vocational training for improved livelihoods) and Waseela‐e‐Sehat (Life, accident and health insurance). 5.14 Waseela‐e‐Haq, aiming to break the vicious cycle of poverty provides interest free financial assistance to the randomly selected beneficiaries. The selection of these families is done by computerised transparent balloting process. The process is basically designed to promote self‐employment among women beneficiaries. It offers Rs 300, 000 long‐term interest free financial assistance based on social capital instead of any physical asset as collateral. Since the initiation of program in FY2009/10 a total of Rs. 135 million was disbursed to 1,294 beneficiaries, 5.15 Similarly, Waseela‐e‐Rozgar provides free of cost vocational training for woman or a nominee from her own family. This initiative empowers the female beneficiary or her nominee to become economically independent through acquiring demand‐driven vocational skill and technical education. Waseela‐e‐Rozgar is a tool for capacity building and professional development. BISP also focuses on providing economic independence to these families through vocational training. Duration of offered trainings is 3 ‐ 12 months. 5.16 Another landmark step to reduce the sufferings of the underprivileged segments of the society is the provision of heath facilities under Waseela‐e‐Sehat. The programme aims at improving access to health services and reducing income loss of the already marginalized due to health related expenditure. The 1st phase comprising of Life Insurance was launched on January 1, 2011 to provide death coverage of Rs. 100,000 to the bread‐earners of every beneficiary family. At the close of June 30, 2011, around 2.047 million families benefitted through a sum of RS. 204.784 million.
V. Workers Welfare Fund (WWF) 5.17 Workers Welfare Fund (WWF) was established in 1971 with an initial allocation of Rs. 100 million provided by the Federal Government. The underlying objectives of WWF are:
• Financing of housing projects for the workers
• Financing of welfare measures including education, trainings, skill enhancement, apprenticeship, marriage, death grants and post metric scholarships for the welfare of workers.
5.18 The Central secretariat of the WWF is based in Islamabad which operates through Workers Welfare Board developed at each provincial headquarter. WWF is supervised by a governing body comprising of the government, workers, and employer representatives. A standard eligibility criterion has been developed to identify the benefits of the WWF projects/schemes details of which are given under;
• The industrial worker must fulfil the definition given in the Workers Welfare Fund Ordinance 1971,
• The industrial worker under the Industrial Relations Act (IRA), 2009 fulfils the definition of the labourer,
• The worker must be registered either with EOBI or with Social Security Institution, and
• The minimum employment period should not be less than 3 years (in case of death grant, this condition is not applicable).
5.19 A significant decrease was observed in disbursements and beneficiaries under various programs of WWF in FY 2010/11 as compared to the positive growth trends observed in FY2009/10 and FY2010/11. According to figures given in table 5.5, a total of Rs. 1,545.5 million were disbursed in FY 2010/11 under various programmes of WWF. A decline in disbursements caused the number of beneficiaries to decline by 71.7 percent in FY 2010/11 over FY 2009/10 against an upward trend of 11.7 percent observed in FY2009/10. 5.20 Education Grant cases distributed the maximum of aggregate WWF disbursements (45.3 percent in FY 2008/09 and 50.5 percent in FY 2009/10) of total disbursements whereas in FY 2010/11, Marriage Grants disbursed the highest proportion of 49.3 percent followed by 34.6 percent under Education Grant Cases and 16.1 percent under Death Grant Cases.
5.21 Disbursements under Marriage Grants depicted a growing trend of 53.7 and 4.8 percent in FY 2010/11 and FY 2009/10 respectively. Death Grants depicted a declining trend for disbursements from ‐9.2 percent in FY 2010/11 and to ‐11 percent in FY 2009/10. Scholarship disbursements exhibited a

growth of 25.7 percent in FY 2009/10 whereas nothing was disbursed under this program in FY 2010/11. Beneficiaries under marriage grants increased by 20 percent and fell by 84.4 percent under education grants in FY 2010/11.
Table 5.5 Workers Welfare Fund
Programmes
FY 2008/09 FY 2009/10 FY 2010/11No. of Benefi‐ciaries
Disburse‐ment (Rs. Millions)
No. of Benefi‐ciaries
Disburse‐ment (Rs. Millions)
No. of Benefi‐ciaries
Disburse‐ment (Rs. Millions)
Marriage Grant 9,499 473 9,074 495.80 10892 761.82Death grant Cases 1,135 307 943 273.35 809 248.225Education Grant Cases 36,314 945 52,746 1,228.73 8251 535.46Earthquake affectees Cases 339 17 ‐ ‐ ‐ ‐Scholarship Cases 15,721 345 7,640 433.73 ‐ ‐Total Disbursement under all Programmes
63,008 2,087 70,403 2,432 19952 1545.5
VI. Microfinance 5.22 Microfinance is disbursed through three key instruments namely Micro‐Credit, Micro‐Savings and Micro‐Insurance. This type of capital and financial support to the poor help them in diversifying their options in terms of earning a better livelihood and mitigating potential risks of poverty and social exclusion. The performance of Micro Finance in terms of disbursements and beneficiaries during the PRSP – II period is given in table 5.6.
5.23 In aggregate terms, data shows that Micro‐Credit and Micro‐Savings services maintained their rising trends during the comparison period whereas Micro‐Insurance services underwent a decline of 37.3 percent and 29.5 percent in disbursements and beneficiaries respectively, in FY 2010/11 as compared to FY 2009/10. Disbursements under Micro credit services were increased to Rs.27,471 million in FY 2010/11 from Rs.25,082 million in FY2009/10 and Rs.20, 319 million in FY2008/09, registering an increase of 9.5 and 23.4 percent respectively. Similarly, beneficiaries of Micro‐Credit services increased to 2,030,680 in FY 2010/11 from 1,975,820 in FY 2009/10 and 1,782,239 in FY 2008/09.
Table 5.6: Micro Finance Analysis
Fiscal Year Micro‐credit Micro‐Savings Micro‐Insurance
Active Borrowers
Value (PKR Million)
Active Savers
Value (PKR Million)
Active Policy Holders
Sum insured (PKR Million)
FY 2008/09 1,782,239 20,319 2,153,538 6,893 2,085,395 29,414FY 2009/10 1,975,820 25,082 2,834,916 9,566 3,813,594 53,706FY 2010/11 2,030,680 27,471 3,637,888 12,746 2,690,052 33,650
Percentage ChangesFY09/10 over FY08/09 10.9 23.4 31.6 38.8 82.9 82.6FY10/11 over FY09/10 2.8 9.5 28.3 33.2 ‐29.5 ‐37.3
Source: Pakistan Microfinance Network (PMN), Islamabad.
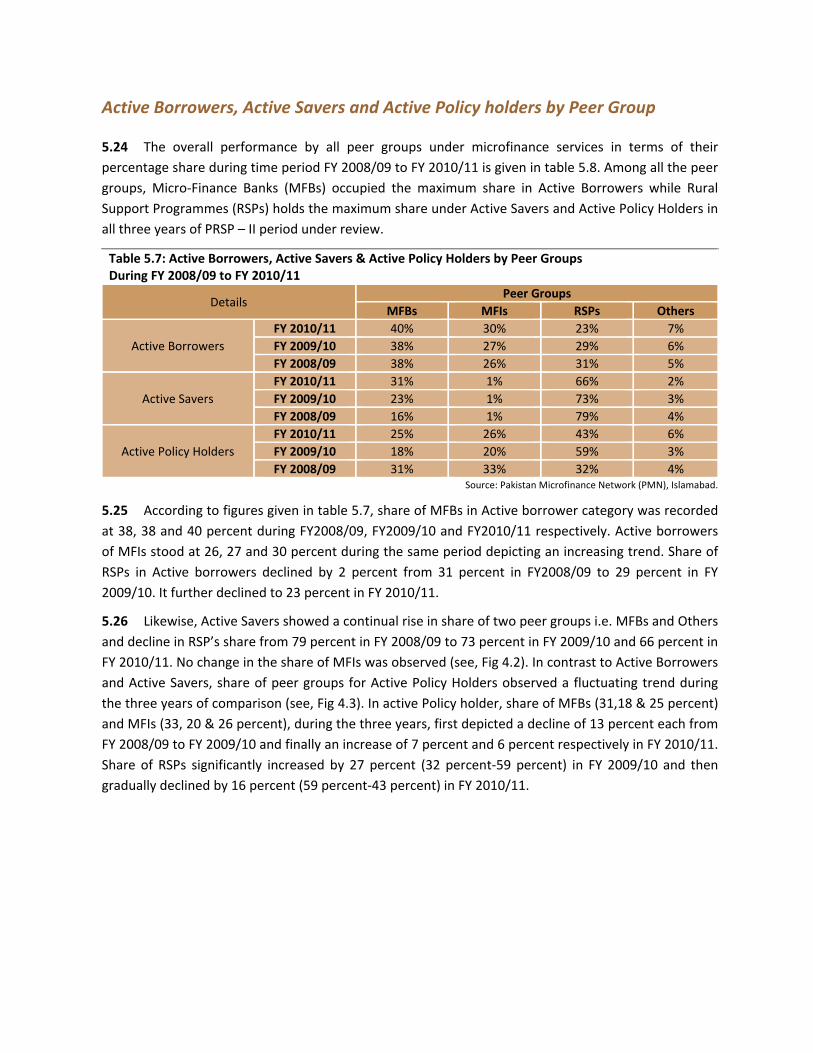
Active Borrowers, Active Savers and Active Policy holders by Peer Group
5.24 The overall performance by all peer groups under microfinance services in terms of their percentage share during time period FY 2008/09 to FY 2010/11 is given in table 5.8. Among all the peer groups, Micro‐Finance Banks (MFBs) occupied the maximum share in Active Borrowers while Rural Support Programmes (RSPs) holds the maximum share under Active Savers and Active Policy Holders in all three years of PRSP – II period under review.
Table 5.7: Active Borrowers, Active Savers & Active Policy Holders by Peer Groups During FY 2008/09 to FY 2010/11
Details Peer Groups
MFBs MFIs RSPs Others
Active Borrowers FY 2010/11 40% 30% 23% 7%FY 2009/10 38% 27% 29% 6%FY 2008/09 38% 26% 31% 5%
Active Savers FY 2010/11 31% 1% 66% 2%FY 2009/10 23% 1% 73% 3%FY 2008/09 16% 1% 79% 4%
Active Policy Holders FY 2010/11 25% 26% 43% 6%FY 2009/10 18% 20% 59% 3%FY 2008/09 31% 33% 32% 4%
Source: Pakistan Microfinance Network (PMN), Islamabad.
5.25 According to figures given in table 5.7, share of MFBs in Active borrower category was recorded at 38, 38 and 40 percent during FY2008/09, FY2009/10 and FY2010/11 respectively. Active borrowers of MFIs stood at 26, 27 and 30 percent during the same period depicting an increasing trend. Share of RSPs in Active borrowers declined by 2 percent from 31 percent in FY2008/09 to 29 percent in FY 2009/10. It further declined to 23 percent in FY 2010/11.
5.26 Likewise, Active Savers showed a continual rise in share of two peer groups i.e. MFBs and Others and decline in RSP’s share from 79 percent in FY 2008/09 to 73 percent in FY 2009/10 and 66 percent in FY 2010/11. No change in the share of MFIs was observed (see, Fig 4.2). In contrast to Active Borrowers and Active Savers, share of peer groups for Active Policy Holders observed a fluctuating trend during the three years of comparison (see, Fig 4.3). In active Policy holder, share of MFBs (31,18 & 25 percent) and MFIs (33, 20 & 26 percent), during the three years, first depicted a decline of 13 percent each from FY 2008/09 to FY 2009/10 and finally an increase of 7 percent and 6 percent respectively in FY 2010/11. Share of RSPs significantly increased by 27 percent (32 percent‐59 percent) in FY 2009/10 and then gradually declined by 16 percent (59 percent‐43 percent) in FY 2010/11.

Summary of Microcredit Indicators
5.27 Summary of micro credit indicators is presented in Table 5.8 for the PRSP–II period FY 2008/09 ‐ FY 2010/11. The statistics given below articulate that all micro credit indicators have underwent a
40% 38% 38%
30% 27% 26%
23% 29% 31%
7% 6% 5%
0%
20%
40%
60%
80%
100%
FY 2010/11 FY 2009/10 FY 2008/09
Figure: 5.1 Active Borrowers MFBs MFIs RSPs Others
31% 23% 16%
1%1%
1%
66% 73% 79%
2% 3% 4%
0%
20%
40%
60%
80%
100%
120%
FY 2010/11 FY 2009/10 FY 2008/09
Figure: 5.2 Active Savers MFBs MFIs RSPs Others
25% 18%31%
26%20%
33%
43%59%
32%
6% 3% 4%
0%
20%
40%
60%
80%
100%
FY 2010/11 FY 2009/10 FY 2008/09
Figure: 5.3 Active Policy Holders MFBs MFIs RSPs Others
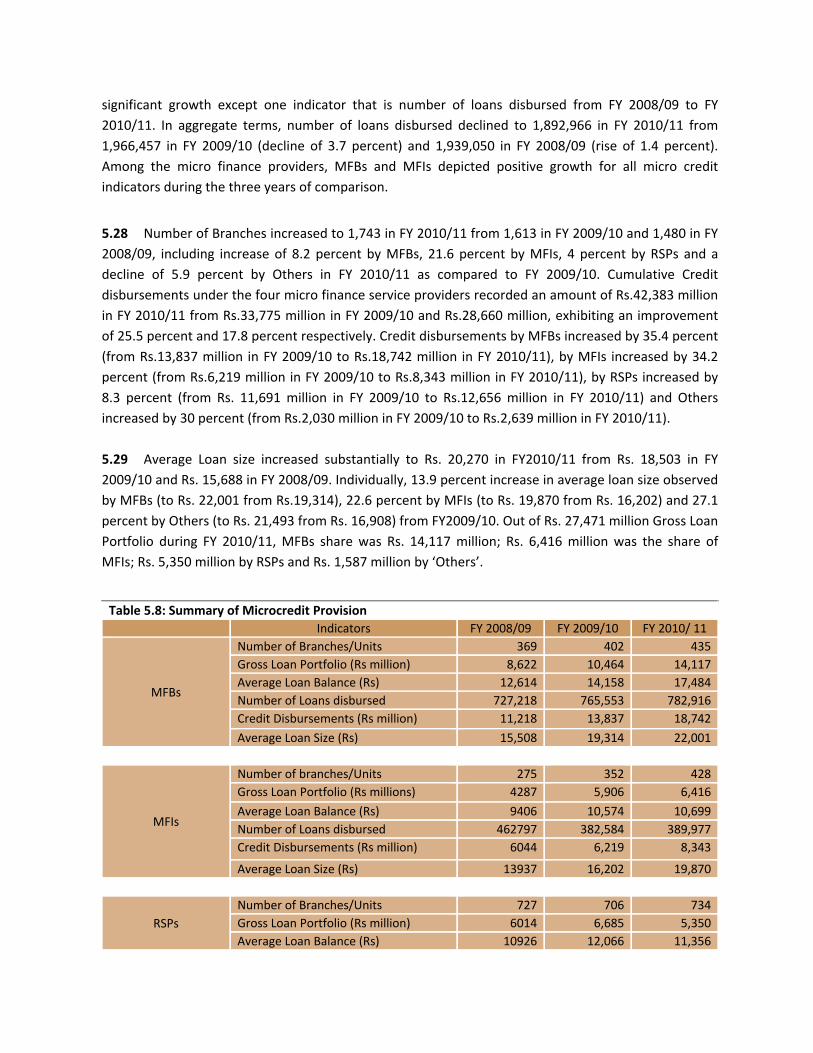
significant growth except one indicator that is number of loans disbursed from FY 2008/09 to FY 2010/11. In aggregate terms, number of loans disbursed declined to 1,892,966 in FY 2010/11 from 1,966,457 in FY 2009/10 (decline of 3.7 percent) and 1,939,050 in FY 2008/09 (rise of 1.4 percent). Among the micro finance providers, MFBs and MFIs depicted positive growth for all micro credit indicators during the three years of comparison.
5.28 Number of Branches increased to 1,743 in FY 2010/11 from 1,613 in FY 2009/10 and 1,480 in FY 2008/09, including increase of 8.2 percent by MFBs, 21.6 percent by MFIs, 4 percent by RSPs and a decline of 5.9 percent by Others in FY 2010/11 as compared to FY 2009/10. Cumulative Credit disbursements under the four micro finance service providers recorded an amount of Rs.42,383 million in FY 2010/11 from Rs.33,775 million in FY 2009/10 and Rs.28,660 million, exhibiting an improvement of 25.5 percent and 17.8 percent respectively. Credit disbursements by MFBs increased by 35.4 percent (from Rs.13,837 million in FY 2009/10 to Rs.18,742 million in FY 2010/11), by MFIs increased by 34.2 percent (from Rs.6,219 million in FY 2009/10 to Rs.8,343 million in FY 2010/11), by RSPs increased by 8.3 percent (from Rs. 11,691 million in FY 2009/10 to Rs.12,656 million in FY 2010/11) and Others increased by 30 percent (from Rs.2,030 million in FY 2009/10 to Rs.2,639 million in FY 2010/11). 5.29 Average Loan size increased substantially to Rs. 20,270 in FY2010/11 from Rs. 18,503 in FY 2009/10 and Rs. 15,688 in FY 2008/09. Individually, 13.9 percent increase in average loan size observed by MFBs (to Rs. 22,001 from Rs.19,314), 22.6 percent by MFIs (to Rs. 19,870 from Rs. 16,202) and 27.1 percent by Others (to Rs. 21,493 from Rs. 16,908) from FY2009/10. Out of Rs. 27,471 million Gross Loan Portfolio during FY 2010/11, MFBs share was Rs. 14,117 million; Rs. 6,416 million was the share of MFIs; Rs. 5,350 million by RSPs and Rs. 1,587 million by ‘Others’.
Table 5.8: Summary of Microcredit Provision Indicators FY 2008/09 FY 2009/10 FY 2010/ 11
MFBs
Number of Branches/Units 369 402 435Gross Loan Portfolio (Rs million) 8,622 10,464 14,117Average Loan Balance (Rs) 12,614 14,158 17,484Number of Loans disbursed 727,218 765,553 782,916Credit Disbursements (Rs million) 11,218 13,837 18,742
Average Loan Size (Rs) 15,508 19,314 22,001
MFIs
Number of branches/Units 275 352 428Gross Loan Portfolio (Rs millions) 4287 5,906 6,416
Average Loan Balance (Rs) 9406 10,574 10,699Number of Loans disbursed 462797 382,584 389,977Credit Disbursements (Rs million) 6044 6,219 8,343
Average Loan Size (Rs) 13937 16,202 19,870
RSPs Number of Branches/Units 727 706 734Gross Loan Portfolio (Rs million) 6014 6,685 5,350Average Loan Balance (Rs) 10926 12,066 11,356

Table 5.8: Summary of Microcredit Provision Indicators FY 2008/09 FY 2009/10 FY 2010/ 11
Number of Loans disbursed 648220 695,971 575,960Credit Disbursements (Rs million) 9777 11,691 12,656Average Loan Size (Rs) 16213 19,581 17,018
Others
Number of Branches/Units 109 153 144Gross Loan Portfolio (Rs million) 1397 2,027 1,587Average Loan Balance (Rs) 15084 16,329 10,412Number of Loans disbursed 96888 122,349 144,113Credit Disbursements (Rs million) 1552 2,030 2,639Average Loan Size (Rs) 16676 16,908 21,493
Total
Number of Branches/Units 1480 1,613 1,743Gross Loan Portfolio (Rs million) 20319 25,082 27,471Average Loan Balance (Rs) 11401 12,695 13,528Number of Loans disbursed 1939050 1,966,457 1,892,966Credit Disbursements (Rs million) 28660 33,775 42,384Average Loan Size (Rs) 15688 18,503 20,270
Source: Pakistan Microfinance Network (PMN), Islamabad.

Chapter: 6
Monitoring the PRSP Intermediate (Output) Indicators
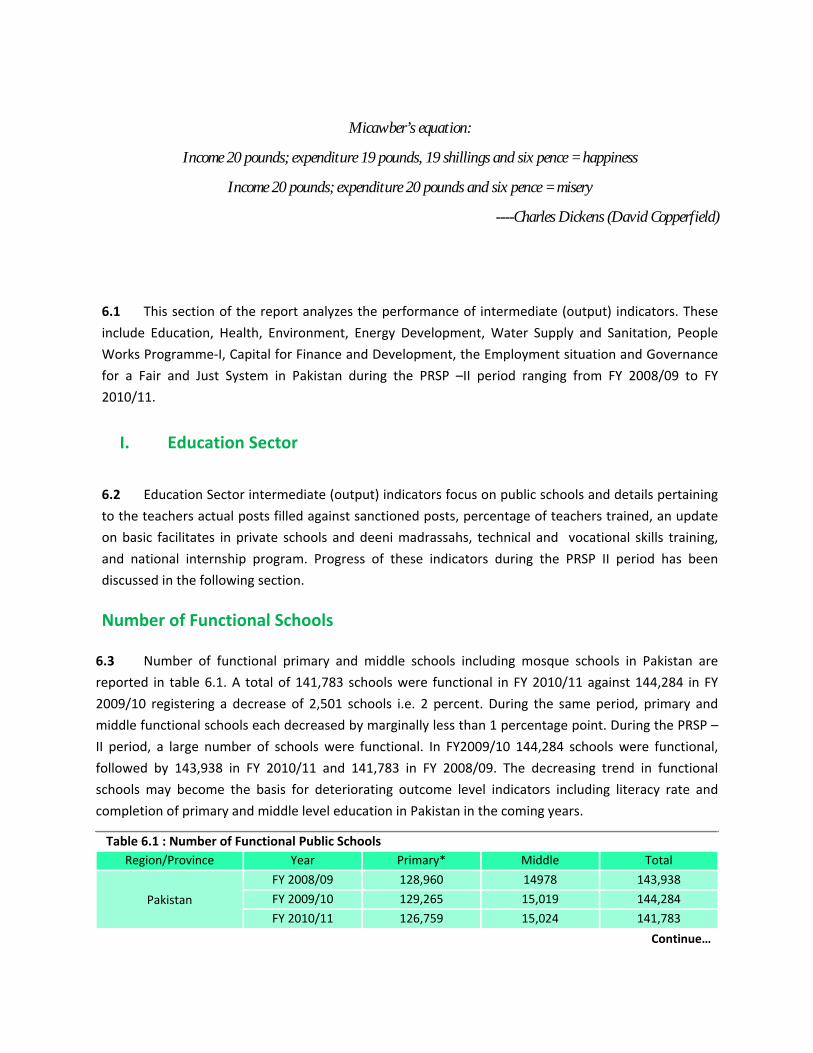
Micawber’s equation:
Income 20 pounds; expenditure 19 pounds, 19 shillings and six pence = happiness
Income 20 pounds; expenditure 20 pounds and six pence = misery
----Charles Dickens (David Copperfield)
6.1 This section of the report analyzes the performance of intermediate (output) indicators. These
include Education, Health, Environment, Energy Development, Water Supply and Sanitation, People
Works Programme‐I, Capital for Finance and Development, the Employment situation and Governance
for a Fair and Just System in Pakistan during the PRSP –II period ranging from FY 2008/09 to FY
2010/11.
I. Education Sector
6.2 Education Sector intermediate (output) indicators focus on public schools and details pertaining
to the teachers actual posts filled against sanctioned posts, percentage of teachers trained, an update
on basic facilitates in private schools and deeni madrassahs, technical and vocational skills training,
and national internship program. Progress of these indicators during the PRSP II period has been
discussed in the following section.
Number of Functional Schools
6.3 Number of functional primary and middle schools including mosque schools in Pakistan are
reported in table 6.1. A total of 141,783 schools were functional in FY 2010/11 against 144,284 in FY
2009/10 registering a decrease of 2,501 schools i.e. 2 percent. During the same period, primary and
middle functional schools each decreased by marginally less than 1 percentage point. During the PRSP –
II period, a large number of schools were functional. In FY2009/10 144,284 schools were functional,
followed by 143,938 in FY 2010/11 and 141,783 in FY 2008/09. The decreasing trend in functional
schools may become the basis for deteriorating outcome level indicators including literacy rate and
completion of primary and middle level education in Pakistan in the coming years.
Table 6.1 : Number of Functional Public SchoolsRegion/Province Year Primary* Middle Total
Pakistan
FY 2008/09 128,960 14978 143,938
FY 2009/10 129,265 15,019 144,284
FY 2010/11 126,759 15,024 141,783
Continue…
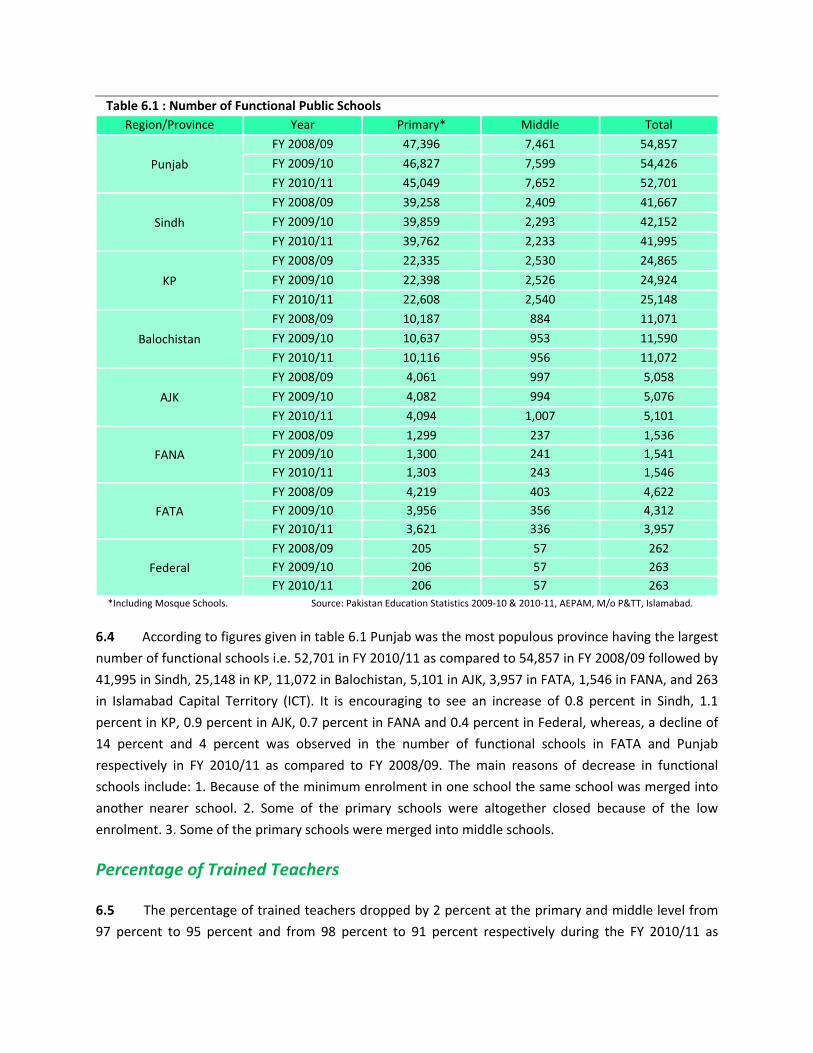
Table 6.1 : Number of Functional Public SchoolsRegion/Province Year Primary* Middle Total
Punjab
FY 2008/09 47,396 7,461 54,857
FY 2009/10 46,827 7,599 54,426
FY 2010/11 45,049 7,652 52,701
Sindh
FY 2008/09 39,258 2,409 41,667
FY 2009/10 39,859 2,293 42,152
FY 2010/11 39,762 2,233 41,995
KP
FY 2008/09 22,335 2,530 24,865
FY 2009/10 22,398 2,526 24,924
FY 2010/11 22,608 2,540 25,148
Balochistan
FY 2008/09 10,187 884 11,071
FY 2009/10 10,637 953 11,590
FY 2010/11 10,116 956 11,072
AJK
FY 2008/09 4,061 997 5,058
FY 2009/10 4,082 994 5,076
FY 2010/11 4,094 1,007 5,101
FANA
FY 2008/09 1,299 237 1,536FY 2009/10 1,300 241 1,541FY 2010/11 1,303 243 1,546
FATA
FY 2008/09 4,219 403 4,622FY 2009/10 3,956 356 4,312FY 2010/11 3,621 336 3,957
Federal
FY 2008/09 205 57 262FY 2009/10 206 57 263FY 2010/11 206 57 263
*Including Mosque Schools. Source: Pakistan Education Statistics 2009‐10 & 2010‐11, AEPAM, M/o P&TT, Islamabad.
6.4 According to figures given in table 6.1 Punjab was the most populous province having the largest
number of functional schools i.e. 52,701 in FY 2010/11 as compared to 54,857 in FY 2008/09 followed by
41,995 in Sindh, 25,148 in KP, 11,072 in Balochistan, 5,101 in AJK, 3,957 in FATA, 1,546 in FANA, and 263
in Islamabad Capital Territory (ICT). It is encouraging to see an increase of 0.8 percent in Sindh, 1.1
percent in KP, 0.9 percent in AJK, 0.7 percent in FANA and 0.4 percent in Federal, whereas, a decline of
14 percent and 4 percent was observed in the number of functional schools in FATA and Punjab
respectively in FY 2010/11 as compared to FY 2008/09. The main reasons of decrease in functional
schools include: 1. Because of the minimum enrolment in one school the same school was merged into
another nearer school. 2. Some of the primary schools were altogether closed because of the low
enrolment. 3. Some of the primary schools were merged into middle schools.
Percentage of Trained Teachers
6.5 The percentage of trained teachers dropped by 2 percent at the primary and middle level from
97 percent to 95 percent and from 98 percent to 91 percent respectively during the FY 2010/11 as

compared to FY 2008/09 during the PRSP – II period (see table 6.2). KP and Balochistan showed the
highest figures in teacher’s trainings at the primary and middle level respectively during FY 2010/11. In
Sindh 94 percent teachers were trained at the primary level while 96 percent were trained at the middle
level. At the primary level, percentage of trained teachers decreased by 6 percentage points in Punjab,
31 percentage points in FATA, 4 percentage points in ICT, 1 percentage points in KP during FY 2010/11 in
comparison with FY 2008/09. At the middle level, percentage of trained teachers decreased by 13
percentage points in Punjab, 11 percentage points in FATA and 6 percentage points in ICT during the
three years period under review. No change was observed at the primary level in Balochistan and AJK
during FY 2008/09 and FY 2010/11. Also, no change has been observed at the middle level in the
percentage of teachers trained in KP and AJK during the comparison period.
Table 6.2 : Percentage of Trained Teachers
Region/ Province
FY 2008/09 FY 2009/10 FY 2010/11
Primary * Middle Primary* Middle Primary* Middle
Pakistan 97 98 95 91 95 91
Punjab 100 100 95 88 94 87
Sindh 92 94 92 96 94 96
KP 100 100 100 100 99 100
Baluchistan 99 94 99 97 99 97
AJK 81 94 87 94 81 94
FATA 99 100 65 88 68 89
FANA 69 87 97 98 94 93
ICT 96 97 92 91 92 91
*Including Mosque Schools. Source: Pakistan Education Statistics 2009‐10 & 2010‐11, AEPAM, M/o P&TT, Islamabad.
Basic Facilities in Public Schools
6.6 The figures given in table 6.3 give the detail of basic facilities provided in public schools all over
Pakistan. Basic facilities include access to water, latrine, electricity, and boundary wall in schools. At the
national level, public schools containing the above facilities increased in FY 2010/11 as compared to FY
2008/09. A total of 67 percent, 64 percent, 42 percent and 64 percent schools contained the facilities of
water, latrines, electricity and boundary wall respectively in FY 2010/11 relative to 64, 60, 37 and 60
percent in FY 2009/10 and 55, 52, 38 and 51 percent in FY 2008/09. The proportion of public schools
with boundary walls in FY2010/11 increased significantly by 13 percentage points from 51 percent to 64
percent, followed by the proportion of schools with water and latrine facility, each depicting an increase
of 12 percentage points from 55 percent to 67 percent and from 52 percent to 64 percent respectively
from FY 2008/09, only 4 percentage points change was observed in electricity from 38 percent to 42
percent.

Table 6.3: Proportion of Public Schools with Basic FacilitiesRegion/Province Years Level Water Latrine Electricity Boundary‐Wall
(percent) (percent) (percent) (percent)
Pakistan
FY 2008/09 Primary* 64 60 34 59Middle 80 79 68 77Total 55 52 38 51
FY 2009/10 Primary* 62 58 33 58Middle 78 78 67 77Total 64 60 37 60
FY 2010/11 Primary* 65 62 39 62Middle 81 84 72 80Total 67 64 42 64
Punjab
FY 2008/09 Primary* 83 72 48 74Middle 97 91 88 90Total 85 74 54 77
FY 2009/10 Primary* 82 73 51 76Middle 95 93 87 92Total 84 76 56 78
FY 2010/11 Primary* 87 81 57 80Middle 96 96 91 93Total 88 83 62 82
Sindh
FY 2008/09 Primary* 49 57 18 52Middle 58 70 35 70Total 50 57 19 53
FY 2009/10 Primary* 49 54 14 49Middle 55 69 26 66Total 49 55 15 50
FY 2010/11 Primary* 49 55 22 52Middle 61 73 42 71Total 49 56 24 53
KP
FY 2008/09 Primary* 60 68 44 64Middle 70 81 64 71Total 61 69 46 65
FY 2009/10 Primary* 63 70 46 67Middle 74 85 67 75Total 64 71 48 68
FY 2010/11 Primary* 65 73 49 70Middle 75 87 70 79Total 66 74 52 71
Balochistan
FY 2008/09 Primary* 64 27 15 33Middle 70 59 41 68Total 65 30 17 36
FY 2009/10 Primary* 53 2 14 22Middle 58 3 41 41Total 54 2 17 24
FY 2010/11 Primary* 72 16 17 30Middle 73 53 40 61Total 72 19 19 32

Table 6.3: Proportion of Public Schools with Basic FacilitiesRegion/Province Years Level Water Latrine Electricity Boundary‐Wall
(percent) (percent) (percent) (percent)
AJK
FY 2008/09 Primary* 32 29 11 10Middle 48 40 31 17Total 35 31 15 12
FY 2009/10 Primary* 27 25 14 13Middle 43 42 35 23Total 30 28 18 15
FY 2010/11 Primary* 26 27 12 17Middle 46 50 35 28Total 30 31 16 19
FANA
FY 2008/09 Primary* 28 30 27 28Middle 57 55 61 53Total 33 34 32 32
FY 2009/10 Primary* 32 34 20 26Middle 73 85 99 71Total 38 42 32 33
FY 2010/11 Primary* 32 34 20 26Middle 73 85 99 71Total 38 42 33 33
FATA
FY 2008/09 Primary* 34 38 43 55Middle 58 61 70 89Total 36 40 45 58
FY 2009/10 Primary* 35 34 37 55Middle 51 52 61 81Total 36 36 39 57
FY 2010/11 Primary* 36 37 37 54Middle 54 54 60 79Total 38 39 39 56
Federal
FY 2008/09 Primary* 98 86 97 97Middle 98 86 100 95Total 98 86 97 96
FY 2009/10 Primary* 97 97 97 89Middle 96 96 100 86Total 97 97 98 89
FY 2010/11 Primary* 97 97 97 89Middle 96 96 100 86Total 97 97 98 89
*Including Mosque Schools. Source: Pakistan Education Statistics 2009‐10 & 2010‐11, AEPAM, M/o P&TT, Islamabad.
6.7 The federal capital was the only area where the proportion of public schools with basic facilities
except in the case of boundary walls was above 95 percent in FY 2010/11. The Federal Area increased
the proportion of public schools having latrine and electricity while a decrease of 1 and 7 percentage
points was registered in the case of water and boundary walls respectively during FY 2010/11 as
compared to FY 2008/09.
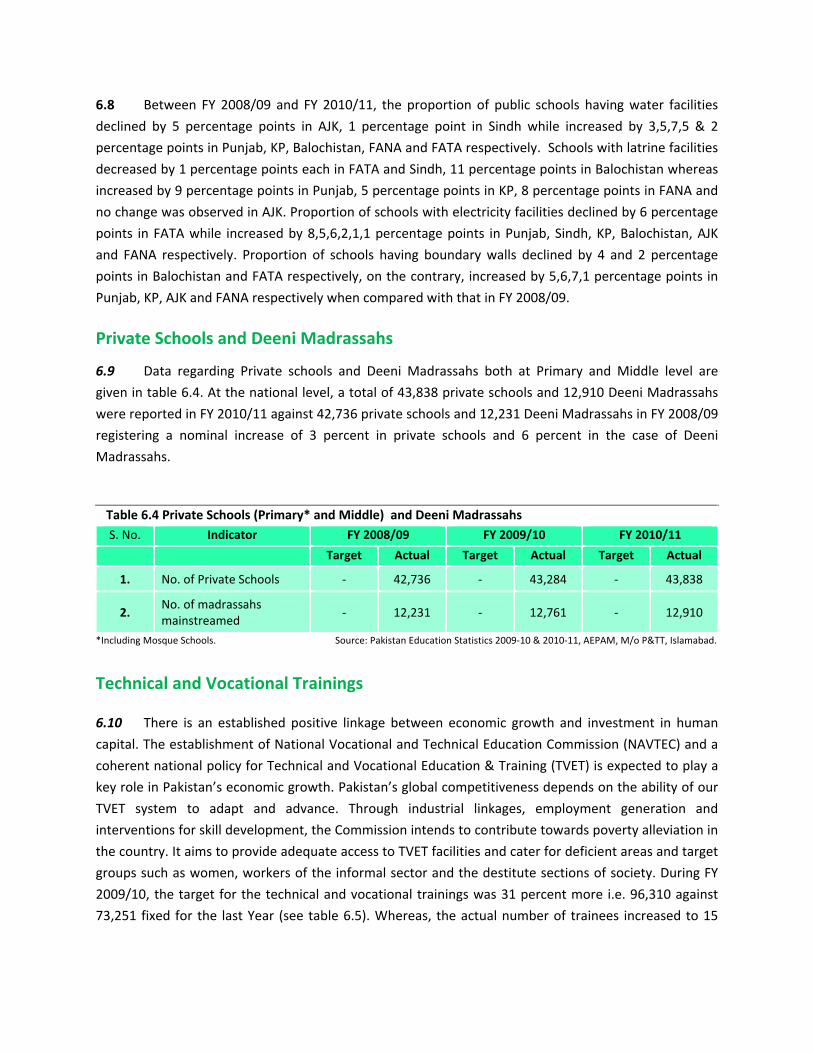
6.8 Between FY 2008/09 and FY 2010/11, the proportion of public schools having water facilities
declined by 5 percentage points in AJK, 1 percentage point in Sindh while increased by 3,5,7,5 & 2
percentage points in Punjab, KP, Balochistan, FANA and FATA respectively. Schools with latrine facilities
decreased by 1 percentage points each in FATA and Sindh, 11 percentage points in Balochistan whereas
increased by 9 percentage points in Punjab, 5 percentage points in KP, 8 percentage points in FANA and
no change was observed in AJK. Proportion of schools with electricity facilities declined by 6 percentage
points in FATA while increased by 8,5,6,2,1,1 percentage points in Punjab, Sindh, KP, Balochistan, AJK
and FANA respectively. Proportion of schools having boundary walls declined by 4 and 2 percentage
points in Balochistan and FATA respectively, on the contrary, increased by 5,6,7,1 percentage points in
Punjab, KP, AJK and FANA respectively when compared with that in FY 2008/09.
Private Schools and Deeni Madrassahs
6.9 Data regarding Private schools and Deeni Madrassahs both at Primary and Middle level are
given in table 6.4. At the national level, a total of 43,838 private schools and 12,910 Deeni Madrassahs
were reported in FY 2010/11 against 42,736 private schools and 12,231 Deeni Madrassahs in FY 2008/09
registering a nominal increase of 3 percent in private schools and 6 percent in the case of Deeni
Madrassahs.
Table 6.4 Private Schools (Primary* and Middle) and Deeni Madrassahs S. No. Indicator FY 2008/09 FY 2009/10 FY 2010/11
Target Actual Target Actual Target Actual
1. No. of Private Schools ‐ 42,736 ‐ 43,284 ‐ 43,838
2. No. of madrassahs mainstreamed
‐ 12,231 ‐ 12,761 ‐ 12,910
*Including Mosque Schools. Source: Pakistan Education Statistics 2009‐10 & 2010‐11, AEPAM, M/o P&TT, Islamabad.
Technical and Vocational Trainings
6.10 There is an established positive linkage between economic growth and investment in human
capital. The establishment of National Vocational and Technical Education Commission (NAVTEC) and a
coherent national policy for Technical and Vocational Education & Training (TVET) is expected to play a
key role in Pakistan’s economic growth. Pakistan’s global competitiveness depends on the ability of our
TVET system to adapt and advance. Through industrial linkages, employment generation and
interventions for skill development, the Commission intends to contribute towards poverty alleviation in
the country. It aims to provide adequate access to TVET facilities and cater for deficient areas and target
groups such as women, workers of the informal sector and the destitute sections of society. During FY
2009/10, the target for the technical and vocational trainings was 31 percent more i.e. 96,310 against
73,251 fixed for the last Year (see table 6.5). Whereas, the actual number of trainees increased to 15

percent from 26,925 to 31,051 in FY 2009/10. The male to female trainees’ ratio was 71:29 in FY
2009/10 against the 70:30 in FY 2008/09. Data for FY 2010/11 is not available to report here.
Table 6.5 Technical and Vocational Trainings
S. No. Indicator FY 2008/09 FY 2009/10 FY 2010/11*
Target Actual Target Actual Target Actual
No of Persons trained by NAVTEC
1 Male 60,453 18,901 80,635 22,006 N/A N/A
2 Female 12,798 8,024 15,675 9,045 N/A N/A
3 Total 73,251 26,925 96,310 31,051 N/A N/A
* Data for FY 2010/11 not received.
National Internship Program (NIP)
6.11 The National Internship Program (NIP) was designed for the young unemployed postgraduates
and graduates all over the country. The individuals who have completed sixteen years of education from
recognized universities or degree awarding institutions including external candidates were given the
opportunity to work as interns. The scheme was intended to provide financial relief to fresh graduates
and also to keep them engaged and interested in acquiring additional knowledge and work experience
and exposure.
Table 6.6: National Internship Program (NIP)Indicator FY 2008/09 FY 2009/10 FY 2010/11
No of Internships provided under NIPMale 10,745 11,675 11,894Female 10,659 11,082 11,658Total 21,404 22,757 23,552
6.12 During FY2009/10, 30,000 internships were planned by the GOP under the NIP, out of which 22,757 i.e. 76% fresh graduates were engaged in various government departments (see table 6.6) which was 6 percent more than the last year. In FY 2010/11, a total of 23,552 internships were offered by the government which benefitted 11,894 males and 11,658 females. The male to female ratio for this internship program stood at 51:49 in last two fiscal years.
II. Health Sector
6.13 This section discusses the performance of health sector intermediate (output) indicators such as; immunization coverage for pregnant women and children (aged 12‐23 months); number of lady health workers and coverage of the lady health workers during the PRSP – II period FY 2008/09 ‐ FY 2010/11.
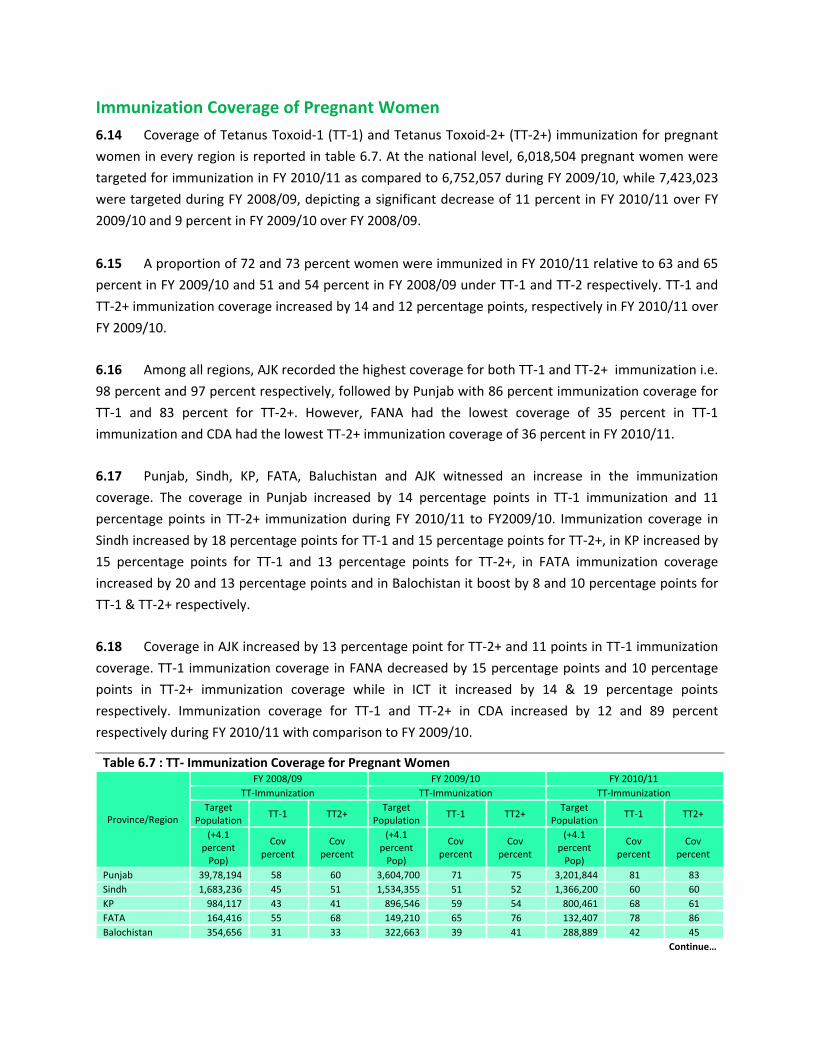
Immunization Coverage of Pregnant Women 6.14 Coverage of Tetanus Toxoid‐1 (TT‐1) and Tetanus Toxoid‐2+ (TT‐2+) immunization for pregnant
women in every region is reported in table 6.7. At the national level, 6,018,504 pregnant women were
targeted for immunization in FY 2010/11 as compared to 6,752,057 during FY 2009/10, while 7,423,023
were targeted during FY 2008/09, depicting a significant decrease of 11 percent in FY 2010/11 over FY
2009/10 and 9 percent in FY 2009/10 over FY 2008/09.
6.15 A proportion of 72 and 73 percent women were immunized in FY 2010/11 relative to 63 and 65
percent in FY 2009/10 and 51 and 54 percent in FY 2008/09 under TT‐1 and TT‐2 respectively. TT‐1 and
TT‐2+ immunization coverage increased by 14 and 12 percentage points, respectively in FY 2010/11 over
FY 2009/10.
6.16 Among all regions, AJK recorded the highest coverage for both TT‐1 and TT‐2+ immunization i.e.
98 percent and 97 percent respectively, followed by Punjab with 86 percent immunization coverage for
TT‐1 and 83 percent for TT‐2+. However, FANA had the lowest coverage of 35 percent in TT‐1
immunization and CDA had the lowest TT‐2+ immunization coverage of 36 percent in FY 2010/11.
6.17 Punjab, Sindh, KP, FATA, Baluchistan and AJK witnessed an increase in the immunization
coverage. The coverage in Punjab increased by 14 percentage points in TT‐1 immunization and 11
percentage points in TT‐2+ immunization during FY 2010/11 to FY2009/10. Immunization coverage in
Sindh increased by 18 percentage points for TT‐1 and 15 percentage points for TT‐2+, in KP increased by
15 percentage points for TT‐1 and 13 percentage points for TT‐2+, in FATA immunization coverage
increased by 20 and 13 percentage points and in Balochistan it boost by 8 and 10 percentage points for
TT‐1 & TT‐2+ respectively.
6.18 Coverage in AJK increased by 13 percentage point for TT‐2+ and 11 points in TT‐1 immunization
coverage. TT‐1 immunization coverage in FANA decreased by 15 percentage points and 10 percentage
points in TT‐2+ immunization coverage while in ICT it increased by 14 & 19 percentage points
respectively. Immunization coverage for TT‐1 and TT‐2+ in CDA increased by 12 and 89 percent
respectively during FY 2010/11 with comparison to FY 2009/10.
Table 6.7 : TT‐ Immunization Coverage for Pregnant Women
Province/Region
FY 2008/09 FY 2009/10 FY 2010/11TT‐Immunization TT‐Immunization TT‐Immunization
Target Population
TT‐1 TT2+ Target
Population TT‐1 TT2+
Target Population
TT‐1 TT2+
(+4.1 percent Pop)
Cov percent
Cov percent
(+4.1 percent Pop)
Cov percent
Cov percent
(+4.1 percent Pop)
Cov percent
Cov percent
Punjab 39,78,194 58 60 3,604,700 71 75 3,201,844 81 83Sindh 1,683,236 45 51 1,534,355 51 52 1,366,200 60 60KP 984,117 43 41 896,546 59 54 800,461 68 61FATA 164,416 55 68 149,210 65 76 132,407 78 86Balochistan 354,656 31 33 322,663 39 41 288,889 42 45
Continue…
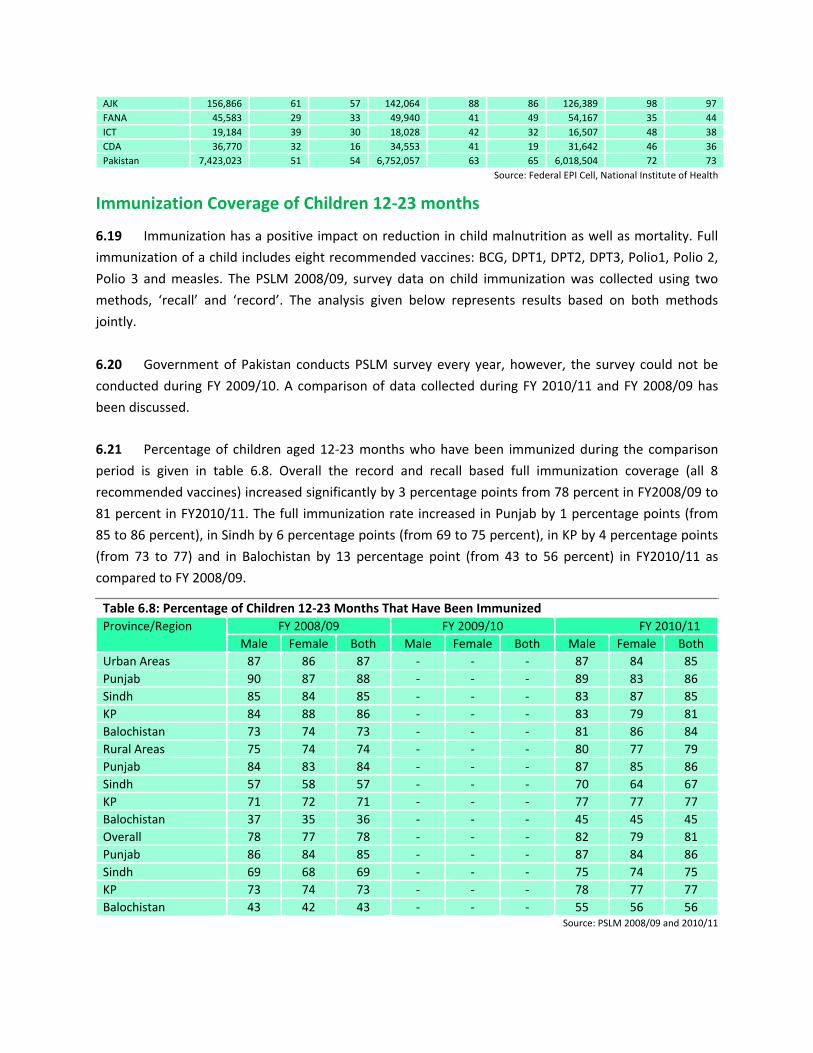
AJK 156,866 61 57 142,064 88 86 126,389 98 97FANA 45,583 29 33 49,940 41 49 54,167 35 44ICT 19,184 39 30 18,028 42 32 16,507 48 38CDA 36,770 32 16 34,553 41 19 31,642 46 36Pakistan 7,423,023 51 54 6,752,057 63 65 6,018,504 72 73
Source: Federal EPI Cell, National Institute of Health
Immunization Coverage of Children 12‐23 months
6.19 Immunization has a positive impact on reduction in child malnutrition as well as mortality. Full
immunization of a child includes eight recommended vaccines: BCG, DPT1, DPT2, DPT3, Polio1, Polio 2,
Polio 3 and measles. The PSLM 2008/09, survey data on child immunization was collected using two
methods, ‘recall’ and ‘record’. The analysis given below represents results based on both methods
jointly.
6.20 Government of Pakistan conducts PSLM survey every year, however, the survey could not be
conducted during FY 2009/10. A comparison of data collected during FY 2010/11 and FY 2008/09 has
been discussed.
6.21 Percentage of children aged 12‐23 months who have been immunized during the comparison
period is given in table 6.8. Overall the record and recall based full immunization coverage (all 8
recommended vaccines) increased significantly by 3 percentage points from 78 percent in FY2008/09 to
81 percent in FY2010/11. The full immunization rate increased in Punjab by 1 percentage points (from
85 to 86 percent), in Sindh by 6 percentage points (from 69 to 75 percent), in KP by 4 percentage points
(from 73 to 77) and in Balochistan by 13 percentage point (from 43 to 56 percent) in FY2010/11 as
compared to FY 2008/09.
Table 6.8: Percentage of Children 12‐23 Months That Have Been Immunized Province/Region FY 2008/09 FY 2009/10 FY 2010/11
Male Female Both Male Female Both Male Female BothUrban Areas 87 86 87 ‐ ‐ ‐ 87 84 85Punjab 90 87 88 ‐ ‐ ‐ 89 83 86Sindh 85 84 85 ‐ ‐ ‐ 83 87 85KP 84 88 86 ‐ ‐ ‐ 83 79 81Balochistan 73 74 73 ‐ ‐ ‐ 81 86 84Rural Areas 75 74 74 ‐ ‐ ‐ 80 77 79Punjab 84 83 84 ‐ ‐ ‐ 87 85 86Sindh 57 58 57 ‐ ‐ ‐ 70 64 67KP 71 72 71 ‐ ‐ ‐ 77 77 77Balochistan 37 35 36 ‐ ‐ ‐ 45 45 45Overall 78 77 78 ‐ ‐ ‐ 82 79 81Punjab 86 84 85 ‐ ‐ ‐ 87 84 86Sindh 69 68 69 ‐ ‐ ‐ 75 74 75KP 73 74 73 ‐ ‐ ‐ 78 77 77Balochistan 43 42 43 ‐ ‐ ‐ 55 56 56
Source: PSLM 2008/09 and 2010/11

Lady Health Workers (LHWs)
6.22 Table 6.9 gives the detail of population covered by LHWs. The population stood at 89.10 million during FY 2010/11 as compared to 86.06 million in FY 2009/10 registering an increase of 4 percent in FY 2010/11 over FY 2009/10. LHW’s coverage in urban areas increased by 12 percent and 2 percent in rural areas respectively in FY 2010/11 and 10 and 5 percent respectively in FY 2009/10. Population covered by LHWs in Punjab, Sindh, AJK, FANA and FATA increased by 4, 4, 1, 1 and 15 percent respectively whereas it decreased by 5 percent in ICT and no change took place in KP and Balochistan during FY 2010/11 as compared to FY 2009/10.
Table 6.9: Population Covered by LHW’s
FY 2008/09 FY 2009/10 FY 2010/11
Urban Rural Total Urban Rural Total Urban Rural TotalPunjab 7,098,618 38,380,045 45,478,663 7,422,372 40,144,507 47,566,879 7,731,234 41,916,775 49,648,009Sindh 3,640,031 13,202,396 16,842,427 4,405,335 13,782,279 18,187,614 5,251,572 13,748,811 19,000,383KP 1,369,563 9,969,546 11,339,109 1,712,083 10,561,750 12,273,833 2,332,948 9,936,221 12,269,169Baluchistan 1,336,363 2,138,222 3,474,585 1,336,363 2,138,222 3,474,585 1,336,363 2,138,222 3,474,585AJK 198,138 2,101,490 2,299,628 200,104 2,211,644 2,411,748 197,094 2,228,994 2,426,088FANA 138,366 534,834 673,200 152,728 643,510 796,238 154,159 649,887 804,046FATA 0 1,012,895 1,012,895 ‐ 1,002,052 1,002,052 0 1,148,724 1,148,724ICT 38,242 259,702 297,944 40,124 310,457 350,581 39,111 294,203 333,314Total 13,819,321 67,599,130 81,418,451 15,269,109 70,794,421 86,063,530 17,042,481 72,061,837 89,104,318
Source: National Programme for Family Planning and Primary Health Care, Ministry of Health
6.23 During the three years period, total number of LHWs (Table 6.10) increased to 102,931 (3 percent growth) in FY 2010/11 from 99,688 (an increase of 8 percent) in FY 2009/10 and 92,064 in FY 2008/09. This number increased by 5 and 3 percent in urban and rural areas respectively in FY 2010/11 from FY 2009/10 and by 11 and 8 percent in FY 2009/10 over FY 2008/09. A ratio of 83:17 of total LHWs were sent to rural and urban areas respectively in FY 2010/11 against the proportion of 84:16 percent in last two years. Out of the total, 51 percent LHWs were sent to Punjab whereas the proportion of LHWs in Sindh, KP, Balochistan, AJK, FANA, FATA and ICT stood at 22, 14, 7, 3, 1, 1 and 0.33 percent, respectively during FY 2010/11. 6.24 The total strength of LHWs increased substantially in Punjab and FANA by 5 percent each, followed by 4 percent in KP and 1 percent in Sindh, Balochistan and ICT during FY 2010/11 as compared to FY 2009/10, whereas no change was recorded in the strength of the LHWs in AJK and FATA. In urban areas, number of LHWs in Punjab and KP increased by 10 percent each, 4 percent in Balochistan and 3 percent in AJK, whereas the number decreased by 3 and 2 percent in Sindh and FANA respectively in FY 2010/11 over FY 2009/10. No LHW was deployed in urban areas of FATA during the three fiscal years. In rural areas number of LHWs increased by 4, 1, 3, 6 and 1 percent in Punjab, Sindh, KP, FANA and ICT respectively while it declined by 1 percent in Balochistan with no change observed in the strength of LHWs at AJK and FATA during FY 2010/11 from FY 2009/10.

Table 6.10 : Total Strength of LHW’s FY 2008/09 FY 2009/10 FY 2010/11
Urban Rural Total Urban Rural Total Urban Rural TotalPunjab 7,136 40,425 47,561 7,397 42,938 50,335 8,125 44,617 52,742Sindh 3,669 16,023 19,692 4,628 18,192 22,820 4,510 18,444 22,954KP 1,399 11,201 12,600 1,756 11,882 13,638 1,933 12,277 14,210Baluchistan 1,929 4,032 5,961 2,001 4,673 6,674 2,088 4,638 6,726AJK 185 2,965 3,150 180 2,957 3,137 185 2,963 3,148FANA 157 1097 1,254 178 1,102 1,280 175 1,170 1,345FATA 0 1,495 1,495 0 1,463 1,463 0 1,463 1,463ICT 36 315 351 38 303 341 38 305 343Total 14,511 77,553 92,064 16,178 83,494 99,688 17,054 85,877 102,931
* Includes under training LHWs Source: National Programme for Family Planning and Primary Health Care, Ministry of Health
III. Environment/Water Supply and Sanitation
6.25 This section discusses the progress of Environment and Water Supply and Sanitation sectors intermediate (output) indicators. These include forests, protected land area, depletion of ozone layer, water purification plants installed under clean drinking water programme and the number of functional/operational plants during FY 2008/09 and FY 2009/10 (see, table 6.11). Data for FY 2010/11 was not available.
Land Area Covered by Forests
6.26 Forests occupy only 5.1 percent of the total land area in Pakistan. The country is facing one of the highest rates of deforestation in the world. One third of the forest is productive and the remaining two third is maintained for environmental stability. Ministry of Environment, which has been devolved, launched several projects/schemes to enhance forest covered area in Pakistan. No change has taken place in the target and actual percentage of the forest covered area in Pakistan during FY 2008/09 and FY 2009/10 (see table 6.11). The target stood at 6 percent whereas the actual area covered by forests was at 5.01 percent in both fiscal years. Data for FY 2010/11 is not available to report here.
Table 6.11 Percentage of Land Area Covered by ForestsS. No. Indicator FY 2008/09 2009/10 FY 2010/11
Target Actual Target Actual Target Actual1. Percentage of land area
covered by Forests 6% 5.01% 6% 5.01% N.A N.A
N.A Not available Source: Ministry of Environment, GOP
Land Area Protected
6.27 In Pakistan, a national park is an area of outstanding scenic merit where the landscape, flora and fauna are protected and preserved in their natural state. Public access to such recreational facilities must be ensured by the government. Access roads and other facilities should be planned so that they do not conflict with the main objectives of national parks. Clearing land for cultivation, mining or allowing

polluted water to flow in National Parks is also prohibited. In addition to National Parks, Pakistan has Wildlife Sanctuaries which are areas set aside for the protection of wildlife. Public access is prohibited or regulated and no exploitation of forests is allowed. Game reserves, hunting and shooting of wild animals is regulated under permit. As far as the protected area as percentage of total area is concerned, no change has taken place in the target and actual percentage of the land area protected in Pakistan during FY 2008/09 and FY 2009/10 (see table 6.12). The target stood at 12 percent whereas the actual area protected remained at 11.35 percent in the comparison period. The data for FY 2010/11 was not available to report here.
Table 6.12 Land Protected Area S. No. Indicator FY 2008/09 2009/10 FY 2010/11
Target Actual Target Actual Target Actual
1. Protected area percentage of the total area
12% 11.35% 12% 11.35% N.A N.A
N.A Not available Source: Ministry of Environment, GOP
Depletion of Ozone Layer
6.28 The ozone layer protects the Earth from the ultraviolet radiations of the sun. If the ozone layer is depleted by human action, the effects on the planet could be catastrophic. Ozone is present in the stratosphere. The stratosphere reaches 30 miles above the Earth, and at the very top it contains ozone. The sun rays are absorbed by the ozone in the stratosphere and thus do not reach the Earth. The target for reducing Ozone depleting substances was 251.9 metric tons while the actual progress was 167.42 Metric tons in FY 2008/09. The data for the FYs 2009/10 and 2010/11 were not available to report here. (See table 6.13).
Table 6.13 Depletion of Ozone Layer S. No. Indicator FY 2008/09 2009/10 FY 2010/11
Target Actual Target Actual Target Actual
1. Ozone depleting substance (level of CFC reduced)
251.9 Metric tons
167.42 Metric tons
N.A N.A N.A N.A
N.A Not available Source: Ministry of Environment, GOP
Integrated Energy Development Program
6.29 A review of the past pattern of energy consumption reveals that there is a persistent shift in energy consumption from petroleum products to other energy sources such as coal, electricity and gas. This shift has been observed in the case of electricity consumption and growth rate of energy supply invariably (see table 6.14). Per capita consumption of electricity was 457 Kilo Watt Hour (KWH) in FY 2008/09.

Table 6.14 Integrated Energy Development S. No. Indicator FY 2008/09 2009/10 FY 2010/11
Target Actual Target Actual Target Actual
1. Per capita consumption of electricity (KWH)
‐ 457 KWH
N.A N.A N.A N.A
2. Energy supplies growth (%) ‐ ‐2.50 N.A N.A N.A N.A
N.A Not available Source: Ministry of Petroleum and Natural Resources, GOP
Water Supply & Sanitation
6.30 It is the priority of the Government to provide clean drinking water to its people. Unfortunately, most of the water sources are contaminated and there exists no proper mechanism whereby poor people could get clean water (both biologically and chemically treated). Safe drinking water supplied through water purification plants provides safeguard to human health, including reduction in the mortality rate (associated with lack of access to safe drinking water, inadequate sanitation and poor hygiene) by improving the quality of drinking water. GOP has planned to install 6,620 water filtration plants all over the country. During FY 2009/10, 370 new water filtration plants were installed which made the cumulative number 1,145 inclusive of those plants installed in FY 2008/09. At the close of the FY 2009/10, only 679 plants (include those installed in FY 2008/09) were functional. Remaining 466 plants were not functional because of the lack of the provision of electricity in the rural areas and some other technical maintenance problems all over the country. The data for the FY 2010/11 was not available to report here.
N.A. Not available Source: Ministry of Special Initiatives Clean Drinking Water for All (CDWA) Project
IV. People Works Programme‐I (PWP‐I) 6.31. People’s Works Programme covers numerous developmental schemes for the provision of electricity, gas, farm to market roads, telephone, education, health, water supply, sanitation and bulldozers hours facilities to the rural poor. Budget allocated for FY 2009/10 stood at Rs 35.0 billion out of which Rs 31.billion was utilized during July‐March, FY 2009/10. Up till March, 2010, 904 schemes were approved under PWP I, with the highest number of schemes under Road i.e. 320 followed by 272 schemes related to Water Supply and 209 electrification schemes. 6.32 Under PWP‐I, a total of 2330 schemes were approved during FY 2010/11 as compared to approval of 6,918 schemes during FY 2009/10 registering a 66 percent down turn, as reported in table
Table 6.15 Water Supply through Water Purification Plants S. No. Indicator FY 2008/09 FY 2009/10 FY 2010/11
Target Actual Target Actual Target Actual
1. No. of water purification plants installed under clean drinking water program
2721 775 2271 370 N.A N.A
2. No. of functional/operational water purification plants
‐ 680 ‐ 679 N.A N.A
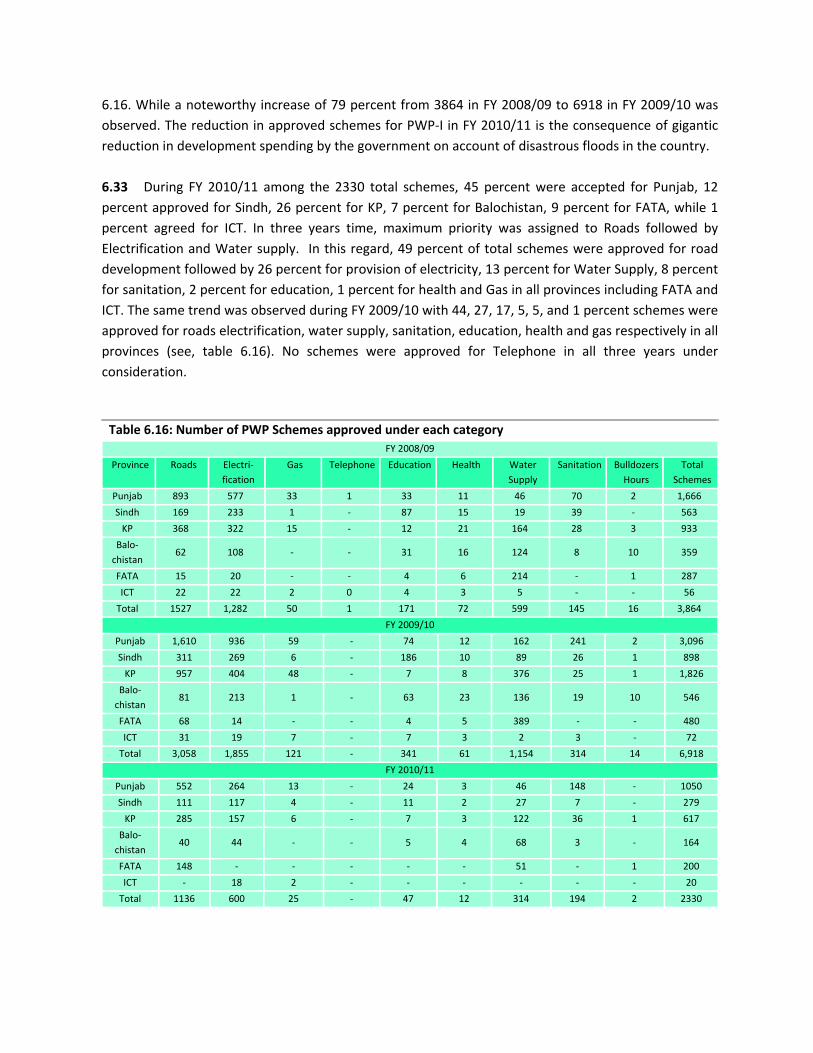
6.16. While a noteworthy increase of 79 percent from 3864 in FY 2008/09 to 6918 in FY 2009/10 was observed. The reduction in approved schemes for PWP‐I in FY 2010/11 is the consequence of gigantic reduction in development spending by the government on account of disastrous floods in the country. 6.33 During FY 2010/11 among the 2330 total schemes, 45 percent were accepted for Punjab, 12 percent approved for Sindh, 26 percent for KP, 7 percent for Balochistan, 9 percent for FATA, while 1 percent agreed for ICT. In three years time, maximum priority was assigned to Roads followed by Electrification and Water supply. In this regard, 49 percent of total schemes were approved for road development followed by 26 percent for provision of electricity, 13 percent for Water Supply, 8 percent for sanitation, 2 percent for education, 1 percent for health and Gas in all provinces including FATA and ICT. The same trend was observed during FY 2009/10 with 44, 27, 17, 5, 5, and 1 percent schemes were approved for roads electrification, water supply, sanitation, education, health and gas respectively in all provinces (see, table 6.16). No schemes were approved for Telephone in all three years under consideration.
Table 6.16: Number of PWP Schemes approved under each categoryFY 2008/09
Province Roads Electri‐fication
Gas Telephone Education Health Water Supply
Sanitation Bulldozers Hours
Total Schemes
Punjab 893 577 33 1 33 11 46 70 2 1,666
Sindh 169 233 1 ‐ 87 15 19 39 ‐ 563
KP 368 322 15 ‐ 12 21 164 28 3 933
Balo‐chistan
62 108 ‐ ‐ 31 16 124 8 10 359
FATA 15 20 ‐ ‐ 4 6 214 ‐ 1 287
ICT 22 22 2 0 4 3 5 ‐ ‐ 56
Total 1527 1,282 50 1 171 72 599 145 16 3,864
FY 2009/10
Punjab 1,610 936 59 ‐ 74 12 162 241 2 3,096
Sindh 311 269 6 ‐ 186 10 89 26 1 898
KP 957 404 48 ‐ 7 8 376 25 1 1,826
Balo‐chistan
81 213 1 ‐ 63 23 136 19 10 546
FATA 68 14 ‐ ‐ 4 5 389 ‐ ‐ 480
ICT 31 19 7 ‐ 7 3 2 3 ‐ 72
Total 3,058 1,855 121 ‐ 341 61 1,154 314 14 6,918
FY 2010/11
Punjab 552 264 13 ‐ 24 3 46 148 ‐ 1050
Sindh 111 117 4 ‐ 11 2 27 7 ‐ 279
KP 285 157 6 ‐ 7 3 122 36 1 617
Balo‐chistan
40 44 ‐ ‐ 5 4 68 3 ‐ 164
FATA 148 ‐ ‐ ‐ ‐ ‐ 51 ‐ 1 200
ICT ‐ 18 2 ‐ ‐ ‐ ‐ ‐ ‐ 20
Total 1136 600 25 ‐ 47 12 314 194 2 2330

V. Capital and Finance for Development 6.34 Pakistan attaches great importance to financial sector development. The financial sector is seen as playing a critical role in facilitating economic growth, directly through broadening access to finance and indirectly through its contribution in poverty reduction. Keeping in view the importance of the sector, a set of key (intermediate) output indicators reflecting the health of financial institutions were included in the Monitoring Matrix of the PRSP II for regular review and analysis. These indicators are being developed to cover progress of the Pillar 8: Capital and Finance for Development. State Bank of Pakistan (SBP) has developed a supervisory framework, which covers the risk monitoring indicators through a regular review of performance of financial institutions/banks. Sections 5.29 to 5.34 and table 6.17 discusses Capital Adequacy, Asset Quality, Management Quality, Earnings and Profitability, and Sensitivity to Market Risk. While data for the FY 2010/11 was not available to report here.
Table 6.17 Progress of Output IndicatorsSr. No Intermediate (Output) Indicators FY 2008/09 FY 2009/10 FY 2010/11
1. Capital Adequacy Capital to Liability Ratio
12.3% 14% N.A
2. Asset Quality NPLs to Gross Advance Ratio
11.5% 15.6% N.A
3. Management Soundness Cost /Income Ratio
‐ ‐ N.A
4. Earnings and Profitability 0.8 0.91 N.A5. Liquidity
Loans to deposit ratio ‐ ‐ N.A
N.A: Not Available Source: State Bank of Pakistan (SBP)
Capital Adequacy Ratio (CAR)
6.35 Capital Adequacy Ratio (CAR), also called Capital to Risk (weighted) Assets Ratio (CRAR), is a ratio of bank’s capital to its risk. SBP tracks a bank’s CRR to ensure that it can absorb a reasonable amount of loss complying with their statutory capital requirements. The recent global financial crisis has encouraged a trend towards capital requirements. Under these circumstances, the financial institutions find it difficult to raise the needed capital, and would be reluctant on lending to the private sector. CAR improved sharply in Pakistan since 2002‐03. However, CAR increased marginally to 14 % during FY 2009/10 compared with 13.2 percent in FY 2008/09. Even at this level, CAR is much higher than the standard benchmark of 9 percent for the industry.
Earnings and Profitability
6.36 The soundness and security of any banking system depends on its capability to earn from its assets. The profits of banks also act as a frontline defense to absorb losses without disturbing the capital base. This is the second consecutive year when banks are facing decline in their profits. After recovery from the international financial crisis, the return on assets (ROA) has increased from 0.8% in FY 2008/09 to 0.91% in FY 2009/10.

Liquidity
6.37 An adequate liquidity position refers to a situation, where an institution can obtain sufficient funds, either by increasing liabilities or by converting its assets quickly at a minimal cost. It is, therefore, generally assessed in terms of overall assets and liability management as mismatching gives rise to liquidity risk. The liquidity management remained quite challenging during FY 2009/10 as SBP had to maintain a balance between overall monetary policy objectives of containing excess demand on one side and at the same time ensuring smooth functioning of the domestic financial system.
Management Soundness
6.38 Data on the management soundness and liquidity position from SBP has not been received at finalization of the report.
VI. Employment 6.39 During FY 2010/11, a total of 57.24 million people became part of the labour force having a share of 43.95 million males and 13.29 million females. The previous year’s total Labour Force 53.59 million comprised of 42.25 million males and 11.34 million females during FY 2009/10. During FY2008/09 total labour force was 52.59 million, with 41.53 million males and 11.06 million females. 6.40 Out of the total labour force, 73 percent were males and 21.15 percent were females during FY 2010/11. In FY 2009/10, 94.80 percent of total labour force was employed with a share of 75.4 percent males and 19.4 percent females. Similarly for the duration of FY 2008/09, the proportion of males in employed labour force was 75.45 percent and 1.35 percent of females out of 94.8 percent. 6.41 In FY 2010/11, percentage of unpaid family workers stood at 18 percent representing 5 and 13 percent contribution by males and females respectively. On the contrary, this percentage of unpaid family workers remained to be quite high about 29 percent during FY 2009/10 and FY 2008/09 (see Table 6.18).
Table 6.18: Labour Force, Employed Labour Force and Unpaid Family Helpers FY 2008/09 FY 2009/10 FY 2010/11
Total Males Females Total Males Females Total Males Females
Labour Force (millions) 52.59 41.53 11.0 53.59 42.25 11.34 57.24 43.95 13.27
Employed Labour Force (%)
94.8 75.45 1.35 94.8 75.44 19.36 94.05 72.90 21.15
Percentage of unpaid family workers
28.49 ‐ ‐ 28.94 ‐ ‐ 17.83 4.89 12.94
Source: Ministry of Labour and Manpower, HRD Wing

VII. Governance for a Just and Fair System
6.42 Number of Cases Pending With Courts: The position of pending cases as on April 01, 2009 is given in Table 6.19 depicts that a total of 19,055 cases were pending with courts including 12, 578 cases in Islamabad, followed by 3,931 in Lahore, 1,658 in Karachi, 594 in Peshawar and 294 in Quetta.
6.43 Institution (INS)/Disposal (DIS) of cases during April 2009 to March 2010 is given in Table 6.20. It shows that a total of 18,744 cases were disposed of against 17,314 cases instituted during the review period. If we compare the monthly data, institution (INS) of cases was highest in July, 2009 while disposal (DIS) of cases was highest in June, 2009. 6.44 Among the Main registry at Islamabad and Branch registries in four provincial capitals, maximum number of cases was recorded in Islamabad both for INS and DIS (i.e. 7284 and 9583 cases respectively); followed by Punjab (6100 INS and 5193 DIS). Lowest number of cases both for INS and DIS was registered in Quetta with 631 institutional cases and 593 disposal cases.
Table 6.20: Institution/Disposal of Cases during April, 2009 to March, 2010
Months Islamabad Lahore Karachi Peshawar Quetta Total
INS DIS INS DIS INS DIS INS DIS INS DIS INS DIS
April, 2009 754 552 566 517 209 235 212 291 65 182 1806 1777
May, 2009 671 1275 605 797 241 171 125 112 143 122 1785 2477
June, 2009 800 1671 719 889 151 208 163 107 87 57 1920 2932
July, 2009 638 847 805 826 307 202 134 29 49 23 1933 1927
Aug, 2009 678 518 756 385 134 24 138 11 57 9 1763 947
Sep, 2009 388 548 605 395 54 118 61 30 34 43 1142 1134
Oct, 2009 656 862 401 0 71 0 32 0 18 0 1178 862
Nov, 2009 383 632 235 174 55 48 39 0 37 25 749 879
Dec, 2009 415 238 464 581 131 212 74 90 44 44 1128 1165
Jan, 2010 697 1110 291 29 114 11 72 1 32 0 1206 1151
Feb, 2010 580 802 222 62 120 199 99 192 14 0 1035 1255
Mar, 2010 624 528 431 538 102 184 284 900 51 88 1492 2238
Total 7284 9583 6100 5193 1689 1612 1433 1763 631 593 17137 18744
Table 6.19: Position of Pending Cases with CourtsMain Registry at Islamabad Lahore Peshawar Karachi Quetta Total
12,578 3,931 594 1,658 294 19,055
Chapter: 7
Monitoring the Outcome Indicators
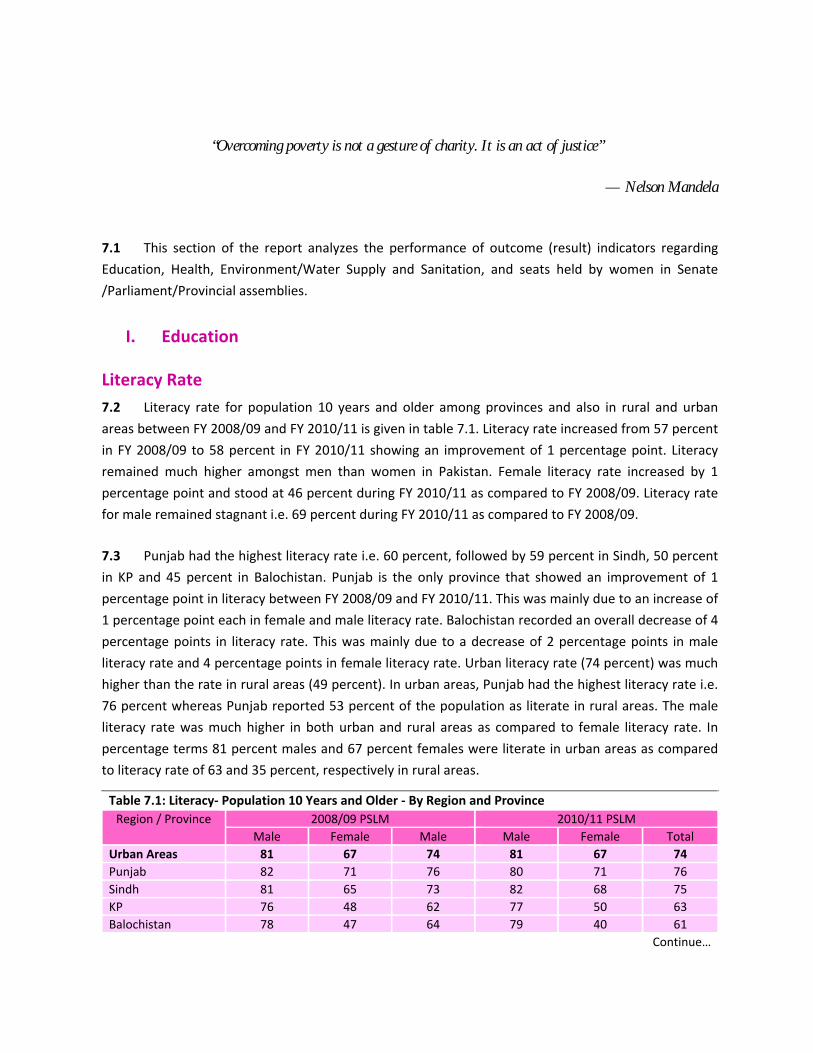
“Overcoming poverty is not a gesture of charity. It is an act of justice”
— Nelson Mandela
7.1 This section of the report analyzes the performance of outcome (result) indicators regarding
Education, Health, Environment/Water Supply and Sanitation, and seats held by women in Senate
/Parliament/Provincial assemblies.
I. Education
Literacy Rate 7.2 Literacy rate for population 10 years and older among provinces and also in rural and urban
areas between FY 2008/09 and FY 2010/11 is given in table 7.1. Literacy rate increased from 57 percent
in FY 2008/09 to 58 percent in FY 2010/11 showing an improvement of 1 percentage point. Literacy
remained much higher amongst men than women in Pakistan. Female literacy rate increased by 1
percentage point and stood at 46 percent during FY 2010/11 as compared to FY 2008/09. Literacy rate
for male remained stagnant i.e. 69 percent during FY 2010/11 as compared to FY 2008/09. 7.3 Punjab had the highest literacy rate i.e. 60 percent, followed by 59 percent in Sindh, 50 percent
in KP and 45 percent in Balochistan. Punjab is the only province that showed an improvement of 1
percentage point in literacy between FY 2008/09 and FY 2010/11. This was mainly due to an increase of
1 percentage point each in female and male literacy rate. Balochistan recorded an overall decrease of 4
percentage points in literacy rate. This was mainly due to a decrease of 2 percentage points in male
literacy rate and 4 percentage points in female literacy rate. Urban literacy rate (74 percent) was much
higher than the rate in rural areas (49 percent). In urban areas, Punjab had the highest literacy rate i.e.
76 percent whereas Punjab reported 53 percent of the population as literate in rural areas. The male
literacy rate was much higher in both urban and rural areas as compared to female literacy rate. In
percentage terms 81 percent males and 67 percent females were literate in urban areas as compared
to literacy rate of 63 and 35 percent, respectively in rural areas.
Table 7.1: Literacy‐ Population 10 Years and Older ‐ By Region and ProvinceRegion / Province 2008/09 PSLM 2010/11 PSLM
Male Female Male Male Female TotalUrban Areas 81 67 74 81 67 74Punjab 82 71 76 80 71 76Sindh 81 65 73 82 68 75KP 76 48 62 77 50 63Balochistan 78 47 64 79 40 61
Continue…
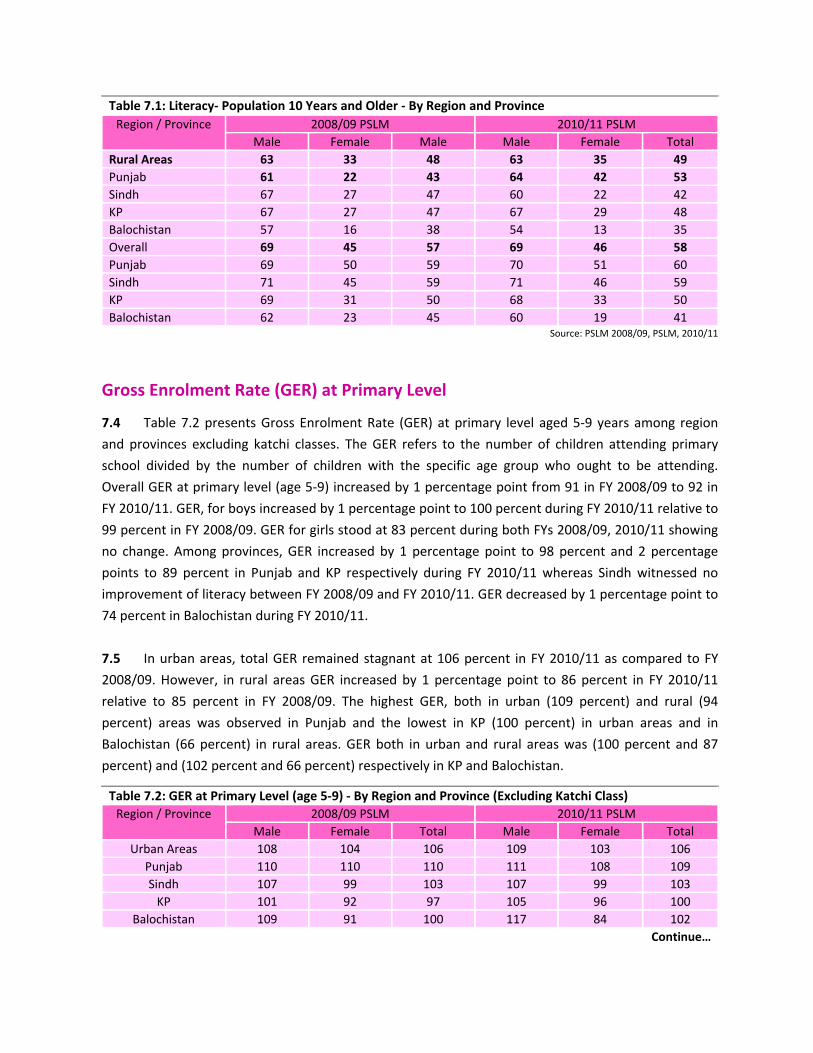
Table 7.1: Literacy‐ Population 10 Years and Older ‐ By Region and ProvinceRegion / Province 2008/09 PSLM 2010/11 PSLM
Male Female Male Male Female TotalRural Areas 63 33 48 63 35 49Punjab 61 22 43 64 42 53Sindh 67 27 47 60 22 42KP 67 27 47 67 29 48Balochistan 57 16 38 54 13 35Overall 69 45 57 69 46 58Punjab 69 50 59 70 51 60Sindh 71 45 59 71 46 59KP 69 31 50 68 33 50Balochistan 62 23 45 60 19 41
Source: PSLM 2008/09, PSLM, 2010/11
Gross Enrolment Rate (GER) at Primary Level
7.4 Table 7.2 presents Gross Enrolment Rate (GER) at primary level aged 5‐9 years among region
and provinces excluding katchi classes. The GER refers to the number of children attending primary
school divided by the number of children with the specific age group who ought to be attending.
Overall GER at primary level (age 5‐9) increased by 1 percentage point from 91 in FY 2008/09 to 92 in
FY 2010/11. GER, for boys increased by 1 percentage point to 100 percent during FY 2010/11 relative to
99 percent in FY 2008/09. GER for girls stood at 83 percent during both FYs 2008/09, 2010/11 showing
no change. Among provinces, GER increased by 1 percentage point to 98 percent and 2 percentage
points to 89 percent in Punjab and KP respectively during FY 2010/11 whereas Sindh witnessed no
improvement of literacy between FY 2008/09 and FY 2010/11. GER decreased by 1 percentage point to
74 percent in Balochistan during FY 2010/11.
7.5 In urban areas, total GER remained stagnant at 106 percent in FY 2010/11 as compared to FY
2008/09. However, in rural areas GER increased by 1 percentage point to 86 percent in FY 2010/11
relative to 85 percent in FY 2008/09. The highest GER, both in urban (109 percent) and rural (94
percent) areas was observed in Punjab and the lowest in KP (100 percent) in urban areas and in
Balochistan (66 percent) in rural areas. GER both in urban and rural areas was (100 percent and 87
percent) and (102 percent and 66 percent) respectively in KP and Balochistan.
Table 7.2: GER at Primary Level (age 5‐9) ‐ By Region and Province (Excluding Katchi Class) Region / Province 2008/09 PSLM 2010/11 PSLM
Male Female Total Male Female TotalUrban Areas 108 104 106 109 103 106
Punjab 110 110 110 111 108 109Sindh 107 99 103 107 99 103KP 101 92 97 105 96 100
Balochistan 109 91 100 117 84 102Continue…

Table 7.2: GER at Primary Level (age 5‐9) ‐ By Region and Province (Excluding Katchi Class) Region / Province 2008/09 PSLM 2010/11 PSLM
Male Female Total Male Female TotalRural Areas 95 74 85 96 75 86Punjab 99 86 93 100 88 94Sindh 83 57 72 87 55 72KP 102 67 85 100 73 87
Balochistan 89 45 68 85 43 66Overall 99 83 91 100 83 92Punjab 102 92 97 103 93 98Sindh 93 75 84 94 72 84KP 102 70 87 101 76 89
Balochistan 93 54 75 92 52 74Source: PSLM 2008/09 PSLM, FY 2010/11
Gross Enrolment Rate (GER) at Middle Level
7.6 GER at middle level aged 10‐12 years by region and provinces is presented in Table 7.3. The GER
at the middle level for Pakistan as a whole was 54 percent in FY 2010/11, 1 percentage more than in FY
2008/09. The GER increased by 1 and 3 percentage points in Punjab and KP respectively whereas Sindh
and Balochistan witnessed a decline of 1 percentage point each. The GER for males was higher than
females, increased by 2 percentage points for females and remained same for males in the comparison
period. The GER was the highest in Punjab for females i.e. 55 percent and in KP for males i.e. 71 percent.
For males, GER improved by 3 percentage points in KP and decreased by 2 and 1 percentage points in
Sindh and Balochistan while it is same in Punjab over the period. Females GER registered an increase of
2, 1, and 3 percentage points in Punjab, Sindh and KP and registered a decrease of 3 percentage points
in Balochistan.
7.7 The GER in urban areas remained same to 71 percent in both FYs 2008/09 and 2010/11 while it
is increased by 1 percentage point in rural areas during the period. In urban areas, GER for males and
females was 70 and 73 percent respectively in contrast to rural areas where rate was 55 percent for
males against 37 percent for females. Gross Enrollment Rate both for males and females was higher in
urban areas (70 and 73 percent) than in rural areas (55 and 37 percent), respectively.
Table 7.3: GER at the Middle Level (age 10‐12) ‐ By Region and ProvinceRegion / Province 2008/09 PSLM 2010/11 PSLM
Male Female Total Male Female TotalUrban Areas 71 71 71 70 73 71
Punjab 73 76 74 70 77 73Sindh 68 68 68 67 72 69KP 81 61 71 86 59 73
Balochistan 66 53 60 62 56 60Continue….

Table 7.3: GER at the Middle Level (age 10‐12) ‐ By Region and ProvinceRegion / Province 2008/09 PSLM 2010/11 PSLM
Male Female Total Male Female TotalRural Areas 55 35 46 55 37 47Punjab 56 43 55 57 46 52Sindh 45 19 34 43 18 32KP 66 33 51 68 37 54
Balochistan 41 13 29 40 9 27Overall 59 46 53 59 48 54Punjab 61 53 57 61 55 58Sindh 54 41 49 52 42 48KP 68 38 54 71 41 57
Balochistan 46 23 36 45 20 35Source: PSLM 2008/09, PSLM, 2010/11
GER at Matric Level
7.8 Table 7.4 illustrates GER at matric level aged 13‐14 years by region and province. The GER at
matric level rose by 3 percentage points to 57 percent in FY 2010/11 as compared to 54 percent in FY
2008/09. The GER in Punjab stood at 61 percent followed by 55 percent in Sindh, 54 percent in KP and
38 percent in Balochistan registering an increase of 4 percentage points each in Punjab and Balochistan
and significant 5 percentage points in Sindh and 3 percentage points registered in KP. Both males and
females GER increased by 3 and 5 percentage points from 62 to 65 percent and from 44 to 49 percent,
respectively over the period. At matric level, Punjab had the highest GER i.e. 65 percent for males and
56 percent for females.
7.9 The GER in urban areas increased significantly by 7 percentage points to 79 percent but still
much higher than the rural areas whereas it increased by 3 percentage points to 47 percent in FY
2010/11 in relation to FY 2008/09. GER both for males and females i.e. 80 and 77 percent, respectively
in urban areas was higher than rural areas indicating enrollment of 57 percent for males and 35 percent
for females. For males, Sindh had the highest GER in urban areas (84 percent) and in rural areas KP (69
percent) whereas for females Punjab had the highest rate each in urban (82 percent) and rural areas (44
percent).
Table 7.4: GER at the Matric Level (age 13‐14) ‐ By Region and ProvinceRegion / Province 2008/09 PSLM 201/11 PSLM
Male Female Total Male Female Total
Urban Areas 76 69 72 80 77 79
Punjab 77 74 76 80 82 81
Sindh 73 64 69 84 75 79
KP 78 62 71 76 58 67
Balochistan 78 46 63 72 52 64
Continue…
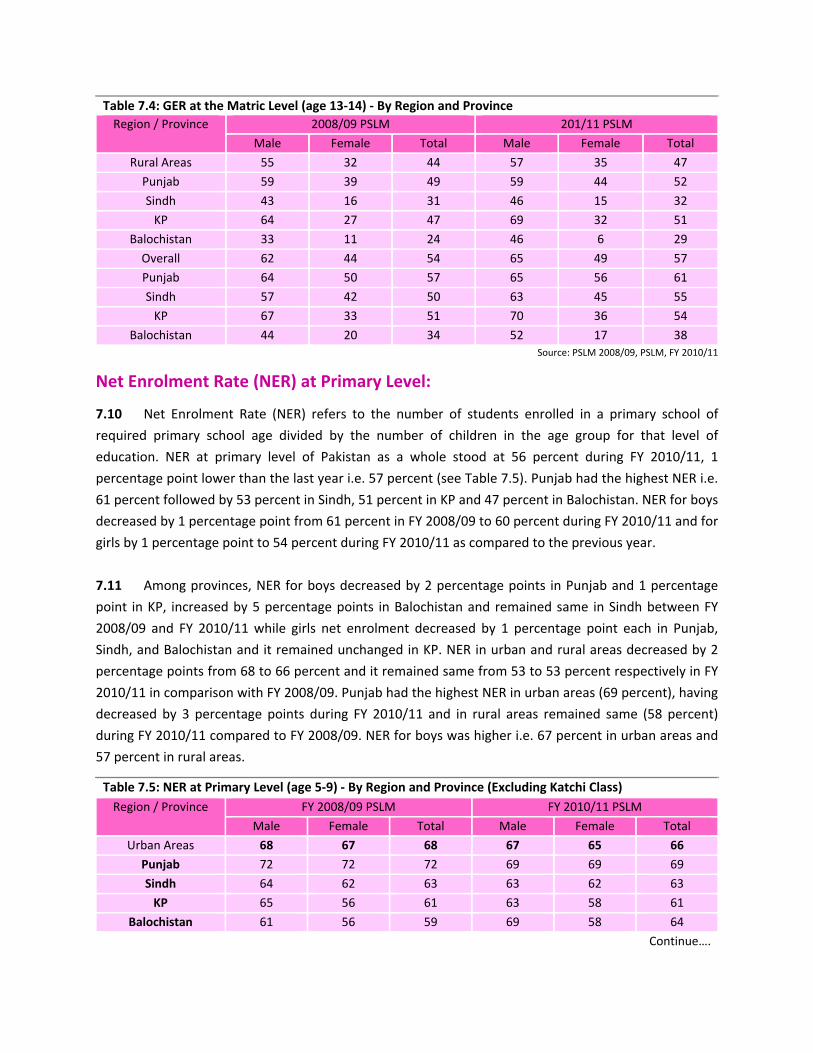
Table 7.4: GER at the Matric Level (age 13‐14) ‐ By Region and ProvinceRegion / Province 2008/09 PSLM 201/11 PSLM
Male Female Total Male Female Total
Rural Areas 55 32 44 57 35 47
Punjab 59 39 49 59 44 52
Sindh 43 16 31 46 15 32
KP 64 27 47 69 32 51
Balochistan 33 11 24 46 6 29
Overall 62 44 54 65 49 57
Punjab 64 50 57 65 56 61
Sindh 57 42 50 63 45 55
KP 67 33 51 70 36 54
Balochistan 44 20 34 52 17 38Source: PSLM 2008/09, PSLM, FY 2010/11
Net Enrolment Rate (NER) at Primary Level:
7.10 Net Enrolment Rate (NER) refers to the number of students enrolled in a primary school of
required primary school age divided by the number of children in the age group for that level of
education. NER at primary level of Pakistan as a whole stood at 56 percent during FY 2010/11, 1
percentage point lower than the last year i.e. 57 percent (see Table 7.5). Punjab had the highest NER i.e.
61 percent followed by 53 percent in Sindh, 51 percent in KP and 47 percent in Balochistan. NER for boys
decreased by 1 percentage point from 61 percent in FY 2008/09 to 60 percent during FY 2010/11 and for
girls by 1 percentage point to 54 percent during FY 2010/11 as compared to the previous year.
7.11 Among provinces, NER for boys decreased by 2 percentage points in Punjab and 1 percentage
point in KP, increased by 5 percentage points in Balochistan and remained same in Sindh between FY
2008/09 and FY 2010/11 while girls net enrolment decreased by 1 percentage point each in Punjab,
Sindh, and Balochistan and it remained unchanged in KP. NER in urban and rural areas decreased by 2
percentage points from 68 to 66 percent and it remained same from 53 to 53 percent respectively in FY
2010/11 in comparison with FY 2008/09. Punjab had the highest NER in urban areas (69 percent), having
decreased by 3 percentage points during FY 2010/11 and in rural areas remained same (58 percent)
during FY 2010/11 compared to FY 2008/09. NER for boys was higher i.e. 67 percent in urban areas and
57 percent in rural areas.
Table 7.5: NER at Primary Level (age 5‐9) ‐ By Region and Province (Excluding Katchi Class) Region / Province FY 2008/09 PSLM FY 2010/11 PSLM
Male Female Total Male Female Total
Urban Areas 68 67 68 67 65 66
Punjab 72 72 72 69 69 69
Sindh 64 62 63 63 62 63
KP 65 56 61 63 58 61
Balochistan 61 56 59 69 58 64
Continue….

Table 7.5: NER at Primary Level (age 5‐9) ‐ By Region and Province (Excluding Katchi Class) Region / Province FY 2008/09 PSLM FY 2010/11 PSLM
Male Female Total Male Female Total
Rural Areas 58 48 53 57 48 53
Punjab 61 55 58 60 55 58
Sindh 53 40 47 54 39 47
KP 57 43 50 56 43 50
Balochistan 49 31 40 53 29 42
Overall 61 54 57 60 53 56
Punjab 64 60 62 62 59 61
Sindh 57 49 54 57 48 53
KP 58 45 52 57 45 51
Balochistan 51 36 44 56 35 47Source: PSLM 2008/09 PSLM, 2010/11
Net Enrolment Rate (NER) at Middle Level
7.12 During FY 2010/11, total NER at middle level aged 10‐12 years remained same in both periods
i.e. 20 percent (see Table 7.6). Among provinces, the rate increased by 1, 1, and 2 percentage points in
Punjab, Sindh and Balochistan provinces respectively while remained same for KP. Males NER was 22
percent, 1 percentage point higher than last year rate, similarly for females NER showed an
improvement of 1 percentage point to 19 percent. Punjab had the highest males NER i.e. 23 percent and
females NER 22 percent.
7.13 In urban areas, there was an increase (2 percentage point from 27 percent to 29 percent) and in
rural areas there was an increase of (1 percentage point from 16 to 17) in NER. Females NER was 31
percent in urban areas higher than male (27 percent) and in case of rural areas rate was higher for males
(19 percent) and lower for females (14 percent). In urban areas, Punjab had the highest rate for females
(34 percent) and males (29 percent) while in rural areas; males (21 percent) and for females (17
percent).
Table 7.6: NER at the Middle Level (age 10‐12) ‐ By Region and ProvinceRegion / Province 2008/09 PSLM 2010/11 PSLM
Male Female Total Male Female Total
Urban Areas 27 28 27 27 31 29
Punjab 29 33 31 29 34 31
Sindh 24 24 24 26 30 18
KP 27 24 25 27 21 24
Balochistan 22 18 20 21 19 21
Rural Areas 19 13 16 19 14 17
Punjab 20 17 18 21 17 19
Sindh 19 8 14 18 8 13
KP 19 11 16 19 12 16
Continue…

Table 7.6: NER at the Middle Level (age 10‐12) ‐ By Region and ProvinceRegion / Province 2008/09 PSLM 2010/11 PSLM
Male Female Total Male Female Total
Balochistan 12 4 9 16 3 11
Overall 21 18 20 22 19 20
Punjab 23 21 22 23 22 23
Sindh 21 15 18 21 17 19
KP 20 13 17 20 13 17
Balochistan 14 8 11 17 7 13Source: PSLM 2008/09, PSLM, FY 2010/11
Net Enrolment Rate (NER) at Matric Level 7.14 NER at Matric level aged 13‐14 years remained same to 12 percent points during FY 2010/11
and FY 2008/09 (see Table 7.7). Punjab had the highest NER at 14 percent followed by Sindh 11 percent,
KP 7 percent and Balochistan 6 percent. Females NER increased by 1 percentage point from 11 to 12
percent and remained same for males from 12 to 12 percent during the comparison period.
7.15 In urban and rural areas, NER registered no change in FY 2010/11 as compared with last FY
2008/09. Females NER was higher in urban areas i.e. 20 percent as compared to males NER which was
higher in rural areas (10 percent). Punjab had the highest NER both for males and females in urban as
well as rural areas.
Table 7.7: NER at the Matric Level (age 13‐14) ‐ By Region and ProvinceRegion / Province 2008/09 PSLM 2010/11 PSLM
Male Female Total Male Female TotalUrban Areas 17 18 18 16 20 18
Punjab 18 22 20 17 25 21Sindh 17 14 16 17 16 16KP 13 11 12 9 12 10
Balochistan 10 9 9 13 8 11Rural Areas 10 7 9 10 8 9Punjab 12 9 10 11 11 11Sindh 9 4 7 8 3 6KP 9 4 7 7 5 6
Balochistan 4 2 3 7 1 4Overall 12 11 12 12 12 12Punjab 14 13 13 13 16 14Sindh 13 10 11 12 10 11KP 9 5 8 8 6 7
Balochistan 5 3 5 8 3 6Source: PSLM 208/09, PSLM, FY 2010/11
Drop‐out Rates Aged 15‐19 Years – by Gender and Class
7.16 Table 7.8 illustrates dropout rate percentages for classes 1 to 6 by gender and class. The data
on dropout rates has not been covered in PSLM 2008/09 as the survey was based on the districts.
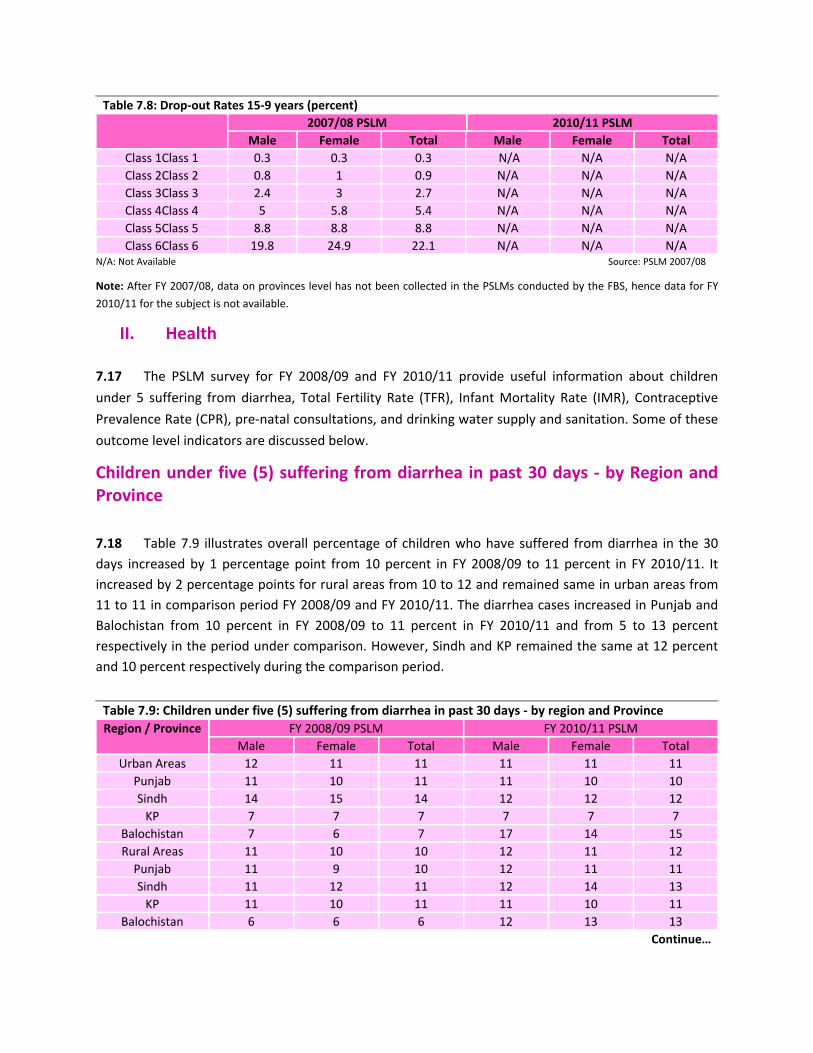
Table 7.8: Drop‐out Rates 15‐9 years (percent) 2007/08 PSLM 2010/11 PSLM
Male Female Total Male Female TotalClass 1Class 1 0.3 0.3 0.3 N/A N/A N/AClass 2Class 2 0.8 1 0.9 N/A N/A N/AClass 3Class 3 2.4 3 2.7 N/A N/A N/AClass 4Class 4 5 5.8 5.4 N/A N/A N/AClass 5Class 5 8.8 8.8 8.8 N/A N/A N/AClass 6Class 6 19.8 24.9 22.1 N/A N/A N/A
N/A: Not Available Source: PSLM 2007/08
Note: After FY 2007/08, data on provinces level has not been collected in the PSLMs conducted by the FBS, hence data for FY
2010/11 for the subject is not available.
II. Health 7.17 The PSLM survey for FY 2008/09 and FY 2010/11 provide useful information about children
under 5 suffering from diarrhea, Total Fertility Rate (TFR), Infant Mortality Rate (IMR), Contraceptive
Prevalence Rate (CPR), pre‐natal consultations, and drinking water supply and sanitation. Some of these
outcome level indicators are discussed below.
Children under five (5) suffering from diarrhea in past 30 days ‐ by Region and Province
7.18 Table 7.9 illustrates overall percentage of children who have suffered from diarrhea in the 30 days increased by 1 percentage point from 10 percent in FY 2008/09 to 11 percent in FY 2010/11. It increased by 2 percentage points for rural areas from 10 to 12 and remained same in urban areas from 11 to 11 in comparison period FY 2008/09 and FY 2010/11. The diarrhea cases increased in Punjab and Balochistan from 10 percent in FY 2008/09 to 11 percent in FY 2010/11 and from 5 to 13 percent respectively in the period under comparison. However, Sindh and KP remained the same at 12 percent and 10 percent respectively during the comparison period.
Table 7.9: Children under five (5) suffering from diarrhea in past 30 days ‐ by region and ProvinceRegion / Province FY 2008/09 PSLM FY 2010/11 PSLM
Male Female Total Male Female TotalUrban Areas 12 11 11 11 11 11
Punjab 11 10 11 11 10 10Sindh 14 15 14 12 12 12KP 7 7 7 7 7 7
Balochistan 7 6 7 17 14 15Rural Areas 11 10 10 12 11 12Punjab 11 9 10 12 11 11Sindh 11 12 11 12 14 13KP 11 10 11 11 10 11
Balochistan 6 6 6 12 13 13Continue…
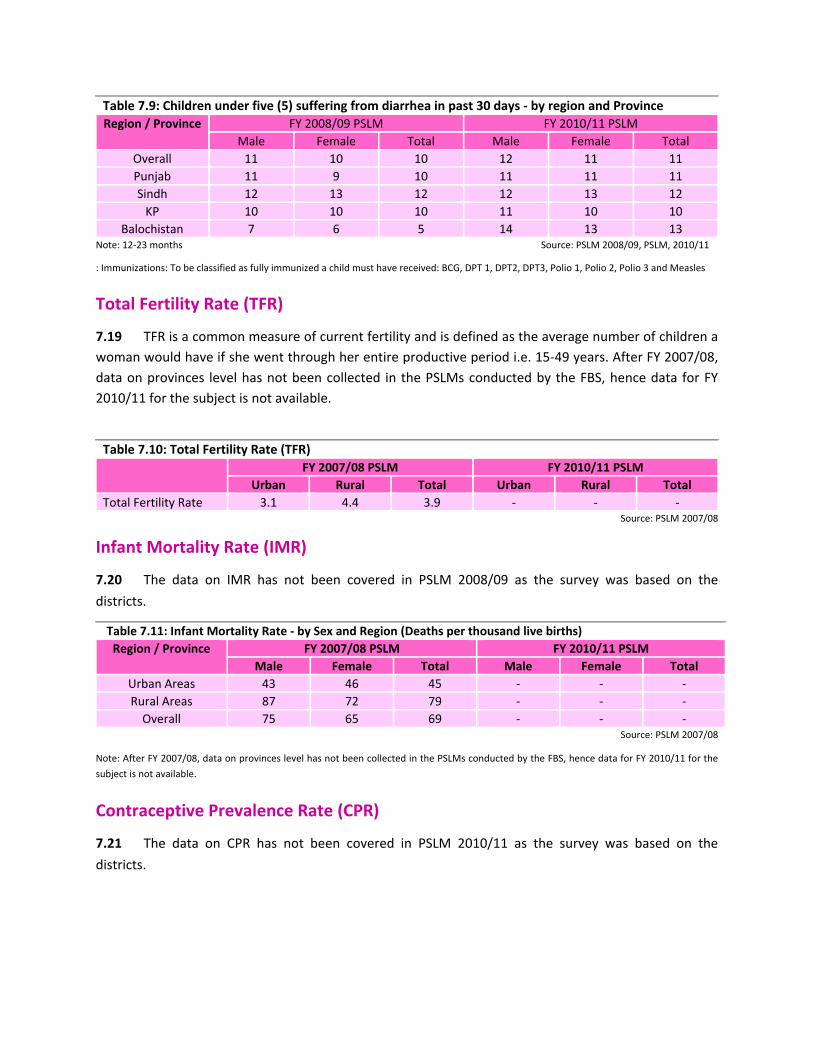
Table 7.9: Children under five (5) suffering from diarrhea in past 30 days ‐ by region and ProvinceRegion / Province FY 2008/09 PSLM FY 2010/11 PSLM
Male Female Total Male Female TotalOverall 11 10 10 12 11 11Punjab 11 9 10 11 11 11Sindh 12 13 12 12 13 12KP 10 10 10 11 10 10
Balochistan 7 6 5 14 13 13Note: 12‐23 months Source: PSLM 2008/09, PSLM, 2010/11
: Immunizations: To be classified as fully immunized a child must have received: BCG, DPT 1, DPT2, DPT3, Polio 1, Polio 2, Polio 3 and Measles
Total Fertility Rate (TFR)
7.19 TFR is a common measure of current fertility and is defined as the average number of children a woman would have if she went through her entire productive period i.e. 15‐49 years. After FY 2007/08, data on provinces level has not been collected in the PSLMs conducted by the FBS, hence data for FY 2010/11 for the subject is not available.
Table 7.10: Total Fertility Rate (TFR) FY 2007/08 PSLM FY 2010/11 PSLM
Urban Rural Total Urban Rural TotalTotal Fertility Rate 3.1 4.4 3.9 ‐ ‐ ‐
Source: PSLM 2007/08
Infant Mortality Rate (IMR)
7.20 The data on IMR has not been covered in PSLM 2008/09 as the survey was based on the
districts.
Table 7.11: Infant Mortality Rate ‐ by Sex and Region (Deaths per thousand live births) Region / Province FY 2007/08 PSLM FY 2010/11 PSLM
Male Female Total Male Female TotalUrban Areas 43 46 45 ‐ ‐ ‐Rural Areas 87 72 79 ‐ ‐ ‐Overall 75 65 69 ‐ ‐ ‐
Source: PSLM 2007/08
Note: After FY 2007/08, data on provinces level has not been collected in the PSLMs conducted by the FBS, hence data for FY 2010/11 for the
subject is not available.
Contraceptive Prevalence Rate (CPR)
7.21 The data on CPR has not been covered in PSLM 2010/11 as the survey was based on the
districts.
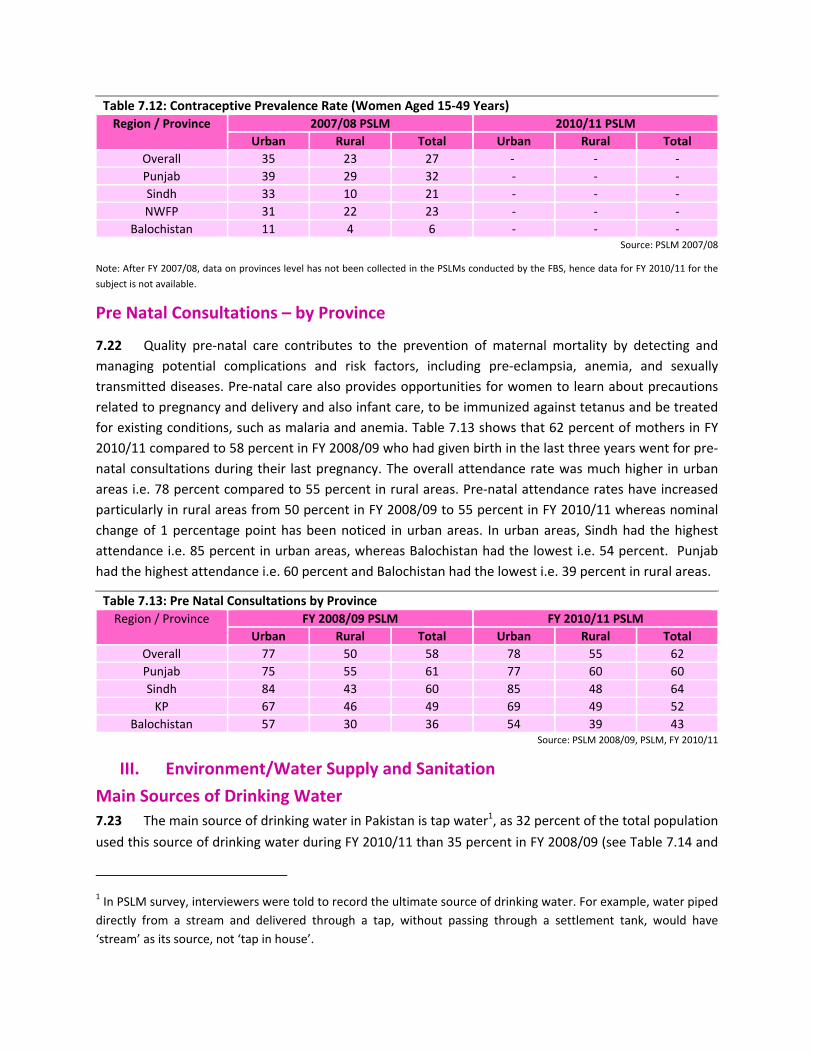
Table 7.12: Contraceptive Prevalence Rate (Women Aged 15‐49 Years)Region / Province 2007/08 PSLM 2010/11 PSLM
Urban Rural Total Urban Rural TotalOverall 35 23 27 ‐ ‐ ‐Punjab 39 29 32 ‐ ‐ ‐Sindh 33 10 21 ‐ ‐ ‐NWFP 31 22 23 ‐ ‐ ‐
Balochistan 11 4 6 ‐ ‐ ‐Source: PSLM 2007/08
Note: After FY 2007/08, data on provinces level has not been collected in the PSLMs conducted by the FBS, hence data for FY 2010/11 for the
subject is not available.
Pre Natal Consultations – by Province
7.22 Quality pre‐natal care contributes to the prevention of maternal mortality by detecting and managing potential complications and risk factors, including pre‐eclampsia, anemia, and sexually transmitted diseases. Pre‐natal care also provides opportunities for women to learn about precautions related to pregnancy and delivery and also infant care, to be immunized against tetanus and be treated for existing conditions, such as malaria and anemia. Table 7.13 shows that 62 percent of mothers in FY 2010/11 compared to 58 percent in FY 2008/09 who had given birth in the last three years went for pre‐natal consultations during their last pregnancy. The overall attendance rate was much higher in urban areas i.e. 78 percent compared to 55 percent in rural areas. Pre‐natal attendance rates have increased particularly in rural areas from 50 percent in FY 2008/09 to 55 percent in FY 2010/11 whereas nominal change of 1 percentage point has been noticed in urban areas. In urban areas, Sindh had the highest attendance i.e. 85 percent in urban areas, whereas Balochistan had the lowest i.e. 54 percent. Punjab had the highest attendance i.e. 60 percent and Balochistan had the lowest i.e. 39 percent in rural areas.
Table 7.13: Pre Natal Consultations by ProvinceRegion / Province FY 2008/09 PSLM FY 2010/11 PSLM
Urban Rural Total Urban Rural TotalOverall 77 50 58 78 55 62Punjab 75 55 61 77 60 60Sindh 84 43 60 85 48 64KP 67 46 49 69 49 52
Balochistan 57 30 36 54 39 43Source: PSLM 2008/09, PSLM, FY 2010/11
III. Environment/Water Supply and Sanitation
Main Sources of Drinking Water 7.23 The main source of drinking water in Pakistan is tap water1, as 32 percent of the total population
used this source of drinking water during FY 2010/11 than 35 percent in FY 2008/09 (see Table 7.14 and
1 In PSLM survey, interviewers were told to record the ultimate source of drinking water. For example, water piped directly from a stream and delivered through a tap, without passing through a settlement tank, would have ‘stream’ as its source, not ‘tap in house’.

Fig 7.1). Hand and motor pumps together provided 55 percent of the household with drinking water in
FY 2010/11 as compared to 54 percent in FY 2008/09. However, compared to the previous year’s PSLM
survey, the usage of motor pump has increased both in urban and rural areas. Moreover, the
percentage of households depending on dug well as a water source remained same at 4 percent
whereas other sources increased from 8 percent in FY 2008/09 to 9 percent in FY 2010/11.
Table 7.14: Main Sources of Drinking Water in Pakistan (Percentages) FY 2008/09 PSLM FY 2010/11 PSLM
Urban Rural Total Urban Rural TotalTap/Piped water 62 21 35 58 19 32
Hand pump 8 41 30 8 38 28Motor pump 25 24 24 28 27 27Dug well 1 6 4 1 6 4Others 4 9 8 6 10 9Total 100 100 100 100 100 100
Source: PSLM 2008/09, PSLM, 2010/11
Type of Toilet used by Household
7.24 Overall, 18 percent households in FY 2010/11 compared to 22 percent in FY 2008/09 do not
have access to any toilet facility in Pakistan (see Table 7.15 and Fig 7.2). This varies largely between
urban and rural areas i.e. 2 percent of urban households had no toilet compared to 27 percent of rural
households. The percentage of flush and non‐flush use has also changed over the comparison period,
as the use of flush increased from 63 percent in FY 2008/09 to 66 percent in FY 2010/11 and the use of
non‐flush remained the same from 15 to 15 percent in the period under comparison.
32%
28%
27%
4% 9%
Figure 7.1: Main Sources of Drinking Water Overall Pakistan FY 2010/11
Tap/Piped water Hand pump Motor pump Dug well Others
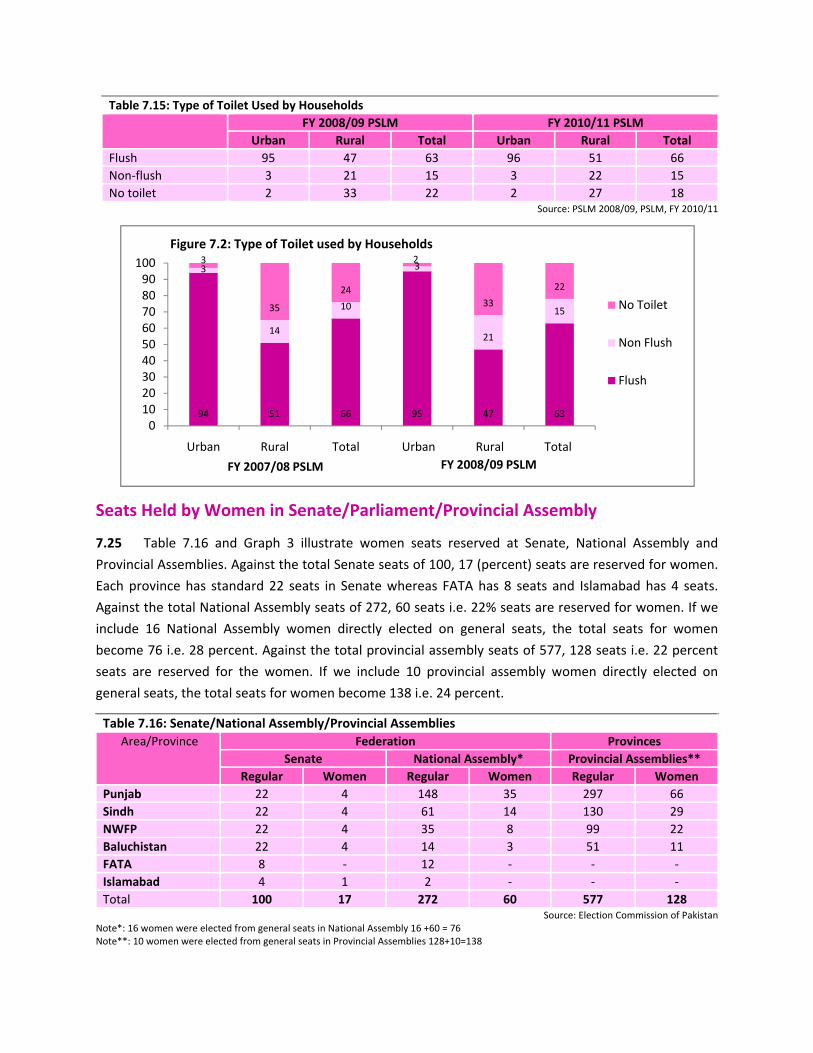
Table 7.15: Type of Toilet Used by Households FY 2008/09 PSLM FY 2010/11 PSLM
Urban Rural Total Urban Rural TotalFlush 95 47 63 96 51 66Non‐flush 3 21 15 3 22 15No toilet 2 33 22 2 27 18
Source: PSLM 2008/09, PSLM, FY 2010/11
Seats Held by Women in Senate/Parliament/Provincial Assembly
7.25 Table 7.16 and Graph 3 illustrate women seats reserved at Senate, National Assembly and
Provincial Assemblies. Against the total Senate seats of 100, 17 (percent) seats are reserved for women.
Each province has standard 22 seats in Senate whereas FATA has 8 seats and Islamabad has 4 seats.
Against the total National Assembly seats of 272, 60 seats i.e. 22% seats are reserved for women. If we
include 16 National Assembly women directly elected on general seats, the total seats for women
become 76 i.e. 28 percent. Against the total provincial assembly seats of 577, 128 seats i.e. 22 percent
seats are reserved for the women. If we include 10 provincial assembly women directly elected on
general seats, the total seats for women become 138 i.e. 24 percent.
Table 7.16: Senate/National Assembly/Provincial Assemblies Area/Province Federation Provinces
Senate National Assembly* Provincial Assemblies**Regular Women Regular Women Regular Women
Punjab 22 4 148 35 297 66Sindh 22 4 61 14 130 29NWFP 22 4 35 8 99 22Baluchistan 22 4 14 3 51 11FATA 8 ‐ 12 ‐ ‐ ‐Islamabad 4 1 2 ‐ ‐ ‐Total 100 17 272 60 577 128
Source: Election Commission of Pakistan Note*: 16 women were elected from general seats in National Assembly 16 +60 = 76 Note**: 10 women were elected from general seats in Provincial Assemblies 128+10=138
94 51 66 95 47 63
3
14
10
3
21
15
3
35
24
2
33
22
0102030405060708090
100
Urban Rural Total Urban Rural Total
Figure 7.2: Type of Toilet used by Households
No Toilet
Non Flush
Flush
FY 2007/08 PSLM FY 2008/09 PSLM
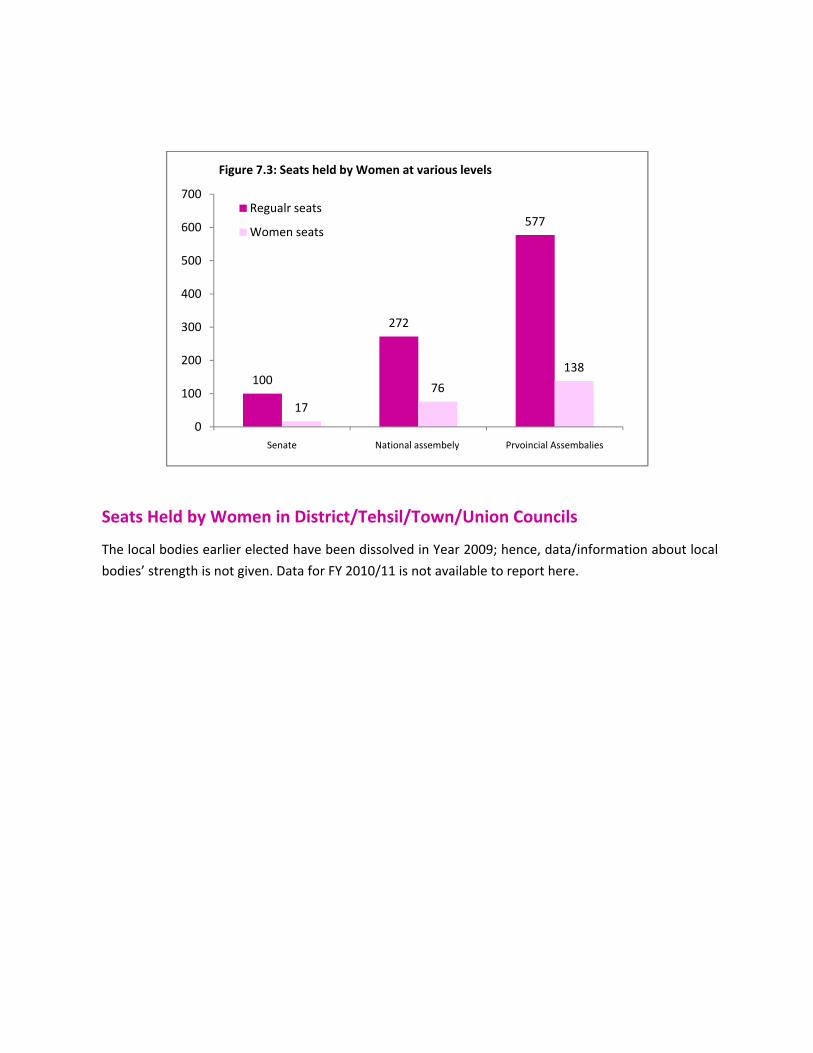
Seats Held by Women in District/Tehsil/Town/Union Councils
The local bodies earlier elected have been dissolved in Year 2009; hence, data/information about local
bodies’ strength is not given. Data for FY 2010/11 is not available to report here.
100
272
577
17
76
138
0
100
200
300
400
500
600
700
Senate National assembely Prvoincial Assembalies
Figure 7.3: Seats held by Women at various levels
Regualr seats
Women seats

Chapter: 8
Feedback from Household

8.1 In order to realize the commitments made under PRSP, the government has initiated numerous schemes that aim at bringing the poor out of social and economic exclusion. For this purpose several distinct projects have been initiated in addition to considerable investment in providing different types of facilities/services to the masses. Henceforth, it is also necessary for the government to get feedback of how people perceive their wellbeing against the different policies adopted by the government. Effective implementation requires that the perspective of clients must be taken into consideration for further enhancement and continuation of projects. 8.2 This section provides an overview of the response of people when inquired about the economic situation and the provision of amenities. Accordingly the respondents were asked to give their perception in their economic as well as community improvement and how effectively services/ facilities were available to them. These responses have been reported in Pakistan Social and Living Standards Measurement (PSLM) Survey (2010‐11). This synopsis will provide the essential information to the government about the priority sectors to properly address the multifaceted problems and the areas of concern associated with these sectors.
I. Perception of Economic Situation
8.3 Primarily, the households were asked to compare the general economic situation with last year. Below is the visual depiction of their response to this question in Pakistan on the whole.
Figure 8.1: Perception of the economic situation of the household compared to the year before the survey.
Source: PSLM Survey, 2010‐11.
8.4 In FY 2010/11, 40% reported no change (44 percent in 2008‐09), 43 percent reported worse or much worse (33 in 2008‐09) and 16 percent reported better or much better (22 percent in 2008‐09). Muzaffar Garh with 67 percent in Punjab, Dadu with 66 percent in Sindh, Kohistan with 72 percent in Khyber Pakhtunkhwa and Musa Khel with 91 percent in Balochistan are top ranked districts where the economic situations are worse or much worse according to perception of household as compared to other districts.
much worse
worse
same
better
much better
don’t know

8.5 However, when asked to compare the economic situation of the community where they live (Figure 7.2), 54 percent in 2010‐11 the same (as same as reported in 2008‐09), 29 percent reported worse or much worse (19 percent in 2008‐09) and 12 percent reported better or much better (21 percent in 2008‐09).
Figure 8.2: Perception of the situation of the community as compared to year before the survey.
Source: PSLM Survey, 2010‐11.
II. Satisfaction by Facilities and Service Use
8.6 Besides the general condition, the households were also asked to give their opinion about their satisfaction from facilities and services provided by the government. The figure below illustrates that comparatively people are well satisfied by the level of education being provided to them, followed by the health facilities in basis health units. It has been found that public is not content by the security and law & order situation being maintained by the Police. Situation in agriculture extension is also not very satisfactory.
Figure 8.3: Percent distribution of households’ satisfaction by facilities & services use.
Source: PSLM Survey, 2010‐11.
much worse
worse
same
better
much better
don’t know
0
10
20
30
40
50
60
70
Basic Health Unit
Family Planning
School Vatrinary Agriculture Police

8.7 Statistically, in response to this question, 31 percent in 2010‐11 reported satisfaction on Govt Basic Health Facilities (40 percent in 2008‐09), 12 percent satisfied with the Family Planning Services (15 percent in 2008‐09), 61 percent with Schools (63 percent in 2008‐09), 15 percent with Veterinary Services pre‐dominantly rural (15 percent in 2008‐09), 15 percent with Agriculture Extension all rural (15 percent in 2008‐09) and 10 percent with police (10 percent in 2008‐09). Bhakhar in Punjab with 11 percent, Hyderabad and Karachi in Sindh with 16 percent, Kohistan in Khyber Pakhtunkhwa with 7 percent and Lasbilla in Balochistan with 10 percent have lowest satisfaction in respect of Basic Health Facilities. Chiniot with 45 percent, Thatta with 34 percent, Kohistan with 20 percent and Dera Bugti with 20 percent are reported to have the lowest satisfaction for Schooling Facilities. Only 8 percent households in rural Bhakhar, 0 percent in Karachi, 2 percent in Swat and 1 percent in Qilla Saifullah are satisfied with Veterinary Services, while no household reported satisfaction with Veterinary Services in Nushki. More or less the same pattern is observed for Agriculture Extension. The highest percentage (90 percentages) of households in Pakistan is dissatisfied with Police Services.

Chapter: 9
Conclusion

9.1 The PRSP‐II Progress report gives a detailed analysis of a three years period from FY 2008/09 to FY 2010/11. It is the third annual progress report since the PRSP‐II was finalized in FY 2008/09. The PRSP‐II can be termed a successful strategy, as significant progress was exhibited by all pro‐poor sectors during the last nine years. Efforts to track pro‐poor budgetary and non‐budgetary expenditures, originally initiated during the interim PRSP and later on revised during the PRSP‐II, have been reported since FY 2001. The overall expenditures on pro‐poor sectors have depicted a consistently positive trend. The monitoring indicators including both output and outcome have also registered steady progress. 9.2 Pakistan’s economy experienced a lower GDP growth of 2.4 percent in FY2010/11 as compared to a modest growth of 3.8 percent in FY2009/10. The impact of catastrophic floods was obvious as the agricultural sector suffered acutely, with the growth rate declining to 1.2 percent in FY 2010/11 alone, a negligible increase of 0.6 percent as compared to FY 2009/10. The services sector improved and has emerged as one of the driving forces for economic growth. It registered a substantial growth of 4.1 percent in FY 2010/11 from 2.9 percent in FY 2009/10. Inflation increased to 13.7 percent in FY 2010/11 as compared to 10.1 percent in FY2009/10. Increased exports and robust growth in remittances led the Current account to register a surplus of US$ 0.3 billion in FY 2010/11 after remaining in deficit for six consecutive years. On the downside, the fiscal deficit remained a growing cause of concern and depicted a persistent increase from 5.3 percent in FY 2008/09 to 6.6 percent in FY 2010/11 as percentage of GDP. The share of tax collection increased to 9.2 percent of GDP depicting a slight improvement in performance. 9.3 The actual pro‐poor PRSP expenditure as a percent of GDP stood at 6.9 in FY 2010/11 surpassing the limit of 4.5 percent set by the FRDL Act. The overall PRSP budgetary expenditures in seventeen pro‐poor sectors of PRSP‐II during FY 2008/09 to FY 2010/11 depicted an increasing trend. A total of Rs.1, 245,541 million was incurred in FY 2010/11, registering a growth of 12.13 percent against Rs.1, 110,762 million in FY 2009/10. Natural calamities & Other Disasters underwent maximum YoY growth in expenditures by 291.42 percent in FY 2010/11 on account of rehabilitation activities against disastrous flood situation in the country. Land Reclamation, Education, Health, Justice Admin and Law & Order sectors provided support to the development sector in contrast to a considerable cut down by the government in development spending. 9.4 The total disbursement under social security and other welfare related projects in FY 2010/11 was Rs 17,617 million which declined to Rs 20,278 million in FY 2009/10. Under Pakistan Bait‐ul‐Mal, the total number of beneficiaries declined in the FY 2010/11 as compared to the FY 2009/10 from 1,915,071 to 1,885,035. The number of beneficiaries under Benazir Income Support Programme (BISP) increased in the course of three years period from 1.76 million in FY 2008/09 to 3.081 million in FY 2010/11. Under the BISP, the Poverty Score Card (PSC) data for assessment of the poor people in Pakistan from all districts of Pakistan has been collected. This data will help in the disbursement of targeted subsidies in Pakistan. The aggregate number of loans disbursed under the microcredit schemes observed a decreasing trend in FY 2010/11 from 1,892, 966 to 1,939,050 in FY 2009/10 and 1,966,457 in FY 2008/09.

9.5 The education sector reflected an overall increase in gross and net enrolments rates at both pre‐secondary and secondary levels. Nevertheless there is a pressing need to enhance the budgetary allocations for the social sector in Pakistan. The annual allocations for education and health sectors are alarmingly low in comparison with other countries in South Asia causing serious setbacks in achieving the Millennium Development Goals (MDGs). 9.6 In conclusion the PRSP‐II period (FY2008/09‐FY2010/11) exhibited an encouraging performance but a lot still needs to be done. Firstly the schemes and policy options taken under this project must be consistently monitored and enhanced further. Secondly the government must invest in the demographic dividend to benefit from its youth. Thirdly an in depth study of how regional countries are eradicating poverty must be carried out in order to advance the poverty reduction initiatives. Poverty in itself is a global phenomenon and therefore a collective effort both nationally and internationally is required to eliminate it from society. In the words of Nelson Mandela “Like slavery and apartheid, poverty is not natural. It is man‐made and it can be overcome and eradicated by the actions of human beings.”
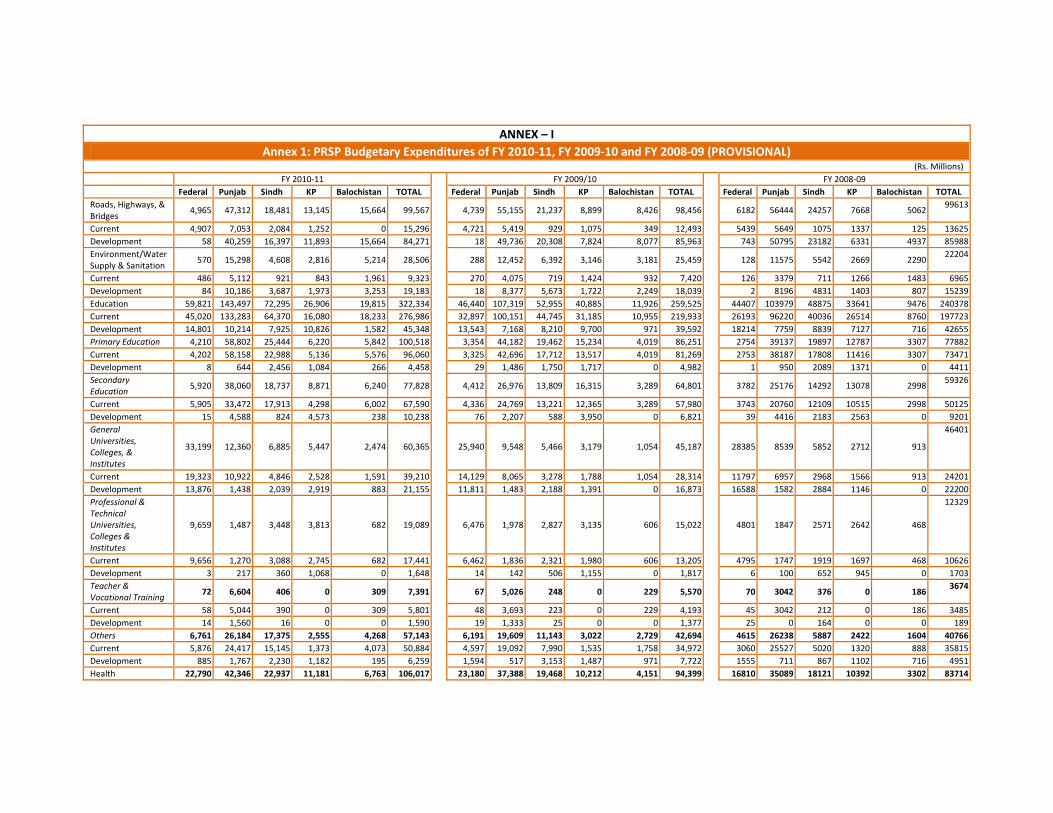
ANNEX – IAnnex 1: PRSP Budgetary Expenditures of FY 2010‐11, FY 2009‐10 and FY 2008‐09 (PROVISIONAL)
(Rs. Millions) FY 2010‐11 FY 2009/10 FY 2008‐09
Federal Punjab Sindh KP Balochistan TOTAL Federal Punjab Sindh KP Balochistan TOTAL Federal Punjab Sindh KP Balochistan TOTALRoads, Highways, & Bridges
4,965 47,312 18,481 13,145 15,664 99,567 4,739 55,155 21,237 8,899 8,426 98,456 6182 56444 24257 7668 506299613
Current 4,907 7,053 2,084 1,252 0 15,296 4,721 5,419 929 1,075 349 12,493 5439 5649 1075 1337 125 13625Development 58 40,259 16,397 11,893 15,664 84,271 18 49,736 20,308 7,824 8,077 85,963 743 50795 23182 6331 4937 85988Environment/Water Supply & Sanitation
570 15,298 4,608 2,816 5,214 28,506 288 12,452 6,392 3,146 3,181 25,459 128 11575 5542 2669 229022204
Current 486 5,112 921 843 1,961 9,323 270 4,075 719 1,424 932 7,420 126 3379 711 1266 1483 6965Development 84 10,186 3,687 1,973 3,253 19,183 18 8,377 5,673 1,722 2,249 18,039 2 8196 4831 1403 807 15239Education 59,821 143,497 72,295 26,906 19,815 322,334 46,440 107,319 52,955 40,885 11,926 259,525 44407 103979 48875 33641 9476 240378Current 45,020 133,283 64,370 16,080 18,233 276,986 32,897 100,151 44,745 31,185 10,955 219,933 26193 96220 40036 26514 8760 197723Development 14,801 10,214 7,925 10,826 1,582 45,348 13,543 7,168 8,210 9,700 971 39,592 18214 7759 8839 7127 716 42655Primary Education 4,210 58,802 25,444 6,220 5,842 100,518 3,354 44,182 19,462 15,234 4,019 86,251 2754 39137 19897 12787 3307 77882Current 4,202 58,158 22,988 5,136 5,576 96,060 3,325 42,696 17,712 13,517 4,019 81,269 2753 38187 17808 11416 3307 73471Development 8 644 2,456 1,084 266 4,458 29 1,486 1,750 1,717 0 4,982 1 950 2089 1371 0 4411Secondary Education
5,920 38,060 18,737 8,871 6,240 77,828 4,412 26,976 13,809 16,315 3,289 64,801 3782 25176 14292 13078 299859326
Current 5,905 33,472 17,913 4,298 6,002 67,590 4,336 24,769 13,221 12,365 3,289 57,980 3743 20760 12109 10515 2998 50125Development 15 4,588 824 4,573 238 10,238 76 2,207 588 3,950 0 6,821 39 4416 2183 2563 0 9201General Universities, Colleges, & Institutes
33,199 12,360 6,885 5,447 2,474 60,365 25,940 9,548 5,466 3,179 1,054 45,187 28385 8539 5852 2712 913
46401
Current 19,323 10,922 4,846 2,528 1,591 39,210 14,129 8,065 3,278 1,788 1,054 28,314 11797 6957 2968 1566 913 24201Development 13,876 1,438 2,039 2,919 883 21,155 11,811 1,483 2,188 1,391 0 16,873 16588 1582 2884 1146 0 22200Professional & Technical Universities, Colleges & Institutes
9,659 1,487 3,448 3,813 682 19,089 6,476 1,978 2,827 3,135 606 15,022 4801 1847 2571 2642 468
12329
Current 9,656 1,270 3,088 2,745 682 17,441 6,462 1,836 2,321 1,980 606 13,205 4795 1747 1919 1697 468 10626Development 3 217 360 1,068 0 1,648 14 142 506 1,155 0 1,817 6 100 652 945 0 1703Teacher & Vocational Training
72 6,604 406 0 309 7,391 67 5,026 248 0 229 5,570 70 3042 376 0 1863674
Current 58 5,044 390 0 309 5,801 48 3,693 223 0 229 4,193 45 3042 212 0 186 3485Development 14 1,560 16 0 0 1,590 19 1,333 25 0 0 1,377 25 0 164 0 0 189Others 6,761 26,184 17,375 2,555 4,268 57,143 6,191 19,609 11,143 3,022 2,729 42,694 4615 26238 5887 2422 1604 40766Current 5,876 24,417 15,145 1,373 4,073 50,884 4,597 19,092 7,990 1,535 1,758 34,972 3060 25527 5020 1320 888 35815Development 885 1,767 2,230 1,182 195 6,259 1,594 517 3,153 1,487 971 7,722 1555 711 867 1102 716 4951Health 22,790 42,346 22,937 11,181 6,763 106,017 23,180 37,388 19,468 10,212 4,151 94,399 16810 35089 18121 10392 3302 83714
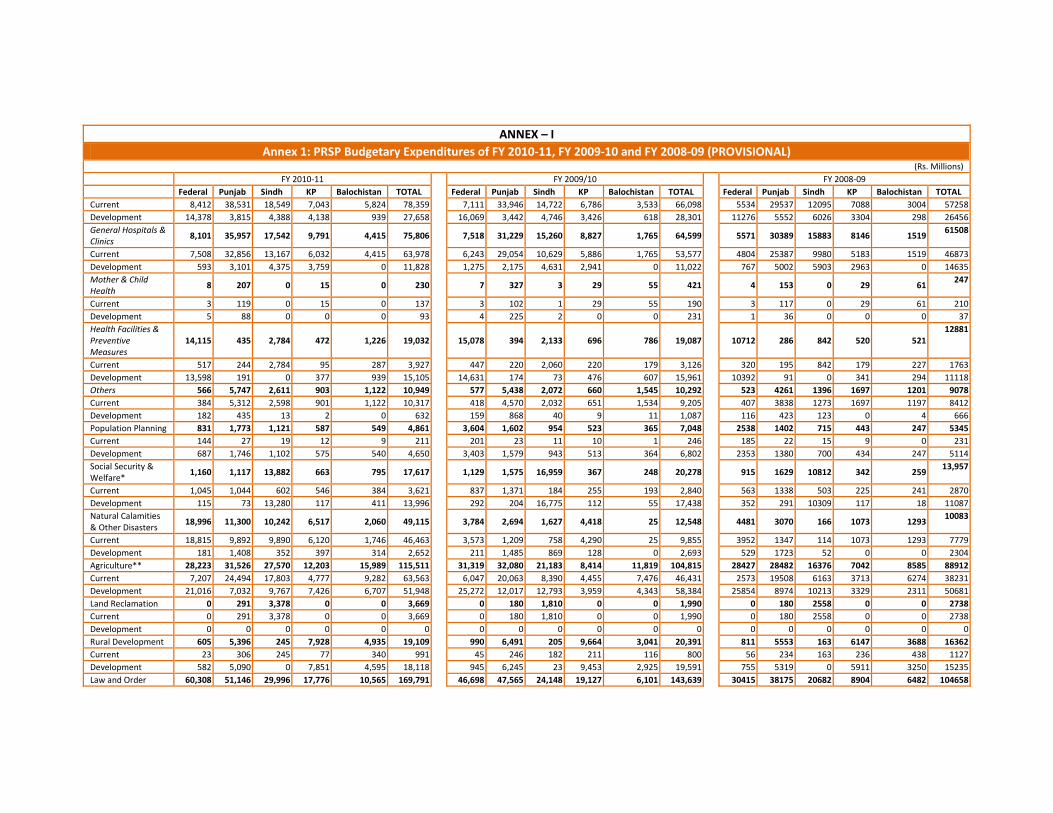
ANNEX – IAnnex 1: PRSP Budgetary Expenditures of FY 2010‐11, FY 2009‐10 and FY 2008‐09 (PROVISIONAL)
(Rs. Millions) FY 2010‐11 FY 2009/10 FY 2008‐09
Federal Punjab Sindh KP Balochistan TOTAL Federal Punjab Sindh KP Balochistan TOTAL Federal Punjab Sindh KP Balochistan TOTALCurrent 8,412 38,531 18,549 7,043 5,824 78,359 7,111 33,946 14,722 6,786 3,533 66,098 5534 29537 12095 7088 3004 57258Development 14,378 3,815 4,388 4,138 939 27,658 16,069 3,442 4,746 3,426 618 28,301 11276 5552 6026 3304 298 26456General Hospitals & Clinics
8,101 35,957 17,542 9,791 4,415 75,806 7,518 31,229 15,260 8,827 1,765 64,599 5571 30389 15883 8146 151961508
Current 7,508 32,856 13,167 6,032 4,415 63,978 6,243 29,054 10,629 5,886 1,765 53,577 4804 25387 9980 5183 1519 46873Development 593 3,101 4,375 3,759 0 11,828 1,275 2,175 4,631 2,941 0 11,022 767 5002 5903 2963 0 14635Mother & Child Health
8 207 0 15 0 230 7 327 3 29 55 421 4 153 0 29 61247
Current 3 119 0 15 0 137 3 102 1 29 55 190 3 117 0 29 61 210Development 5 88 0 0 0 93 4 225 2 0 0 231 1 36 0 0 0 37Health Facilities & Preventive Measures
14,115 435 2,784 472 1,226 19,032 15,078 394 2,133 696 786 19,087 10712 286 842 520 52112881
Current 517 244 2,784 95 287 3,927 447 220 2,060 220 179 3,126 320 195 842 179 227 1763Development 13,598 191 0 377 939 15,105 14,631 174 73 476 607 15,961 10392 91 0 341 294 11118Others 566 5,747 2,611 903 1,122 10,949 577 5,438 2,072 660 1,545 10,292 523 4261 1396 1697 1201 9078Current 384 5,312 2,598 901 1,122 10,317 418 4,570 2,032 651 1,534 9,205 407 3838 1273 1697 1197 8412Development 182 435 13 2 0 632 159 868 40 9 11 1,087 116 423 123 0 4 666Population Planning 831 1,773 1,121 587 549 4,861 3,604 1,602 954 523 365 7,048 2538 1402 715 443 247 5345Current 144 27 19 12 9 211 201 23 11 10 1 246 185 22 15 9 0 231Development 687 1,746 1,102 575 540 4,650 3,403 1,579 943 513 364 6,802 2353 1380 700 434 247 5114Social Security & Welfare*
1,160 1,117 13,882 663 795 17,617 1,129 1,575 16,959 367 248 20,278 915 1629 10812 342 25913,957
Current 1,045 1,044 602 546 384 3,621 837 1,371 184 255 193 2,840 563 1338 503 225 241 2870Development 115 73 13,280 117 411 13,996 292 204 16,775 112 55 17,438 352 291 10309 117 18 11087Natural Calamities & Other Disasters
18,996 11,300 10,242 6,517 2,060 49,115 3,784 2,694 1,627 4,418 25 12,548 4481 3070 166 1073 129310083
Current 18,815 9,892 9,890 6,120 1,746 46,463 3,573 1,209 758 4,290 25 9,855 3952 1347 114 1073 1293 7779Development 181 1,408 352 397 314 2,652 211 1,485 869 128 0 2,693 529 1723 52 0 0 2304Agriculture** 28,223 31,526 27,570 12,203 15,989 115,511 31,319 32,080 21,183 8,414 11,819 104,815 28427 28482 16376 7042 8585 88912Current 7,207 24,494 17,803 4,777 9,282 63,563 6,047 20,063 8,390 4,455 7,476 46,431 2573 19508 6163 3713 6274 38231Development 21,016 7,032 9,767 7,426 6,707 51,948 25,272 12,017 12,793 3,959 4,343 58,384 25854 8974 10213 3329 2311 50681Land Reclamation 0 291 3,378 0 0 3,669 0 180 1,810 0 0 1,990 0 180 2558 0 0 2738Current 0 291 3,378 0 0 3,669 0 180 1,810 0 0 1,990 0 180 2558 0 0 2738Development 0 0 0 0 0 0 0 0 0 0 0 0 0 0 0 0 0 0Rural Development 605 5,396 245 7,928 4,935 19,109 990 6,491 205 9,664 3,041 20,391 811 5553 163 6147 3688 16362Current 23 306 245 77 340 991 45 246 182 211 116 800 56 234 163 236 438 1127Development 582 5,090 0 7,851 4,595 18,118 945 6,245 23 9,453 2,925 19,591 755 5319 0 5911 3250 15235Law and Order 60,308 51,146 29,996 17,776 10,565 169,791 46,698 47,565 24,148 19,127 6,101 143,639 30415 38175 20682 8904 6482 104658

ANNEX – IAnnex 1: PRSP Budgetary Expenditures of FY 2010‐11, FY 2009‐10 and FY 2008‐09 (PROVISIONAL)
(Rs. Millions) FY 2010‐11 FY 2009/10 FY 2008‐09
Federal Punjab Sindh KP Balochistan TOTAL Federal Punjab Sindh KP Balochistan TOTAL Federal Punjab Sindh KP Balochistan TOTALCurrent 59,622 51,140 29,996 17,751 9,900 168,409 45,996 47,559 24,148 18,079 6,101 141,883 30376 38171 20682 8861 5197 103287Development 686 6 0 25 665 1,382 702 6 0 1,048 0 1,756 39 4 0 43 1285 1371Low Cost Housing 0 357 16 0 0 373 0 774 1,054 0 0 1,828 0 580 3 0 0 583Current 0 126 16 0 0 142 0 99 1,054 0 0 1,153 0 548 3 0 0 551Development 0 231 0 0 0 231 0 675 0 0 0 675 0 32 0 0 0 32Justice Admn 2,080 6,258 2,877 1,929 1,079 14,223 1,940 4,586 2,308 1,369 793 10,996 1525 4185 1827 1001 655 9193Current 1,885 4,805 2,877 1,514 969 12,050 1,460 4,586 2,273 1,038 694 10,051 1283 4179 1814 1001 554 8831Development 195 1,453 0 415 110 2,173 480 0 35 331 99 945 242 6 13 0 101 362Subsidies*** 217,042 9,671 1,683 2,000 549 230,945 230,431 476 2,519 1,500 0 234,926 212706 1935 697 5229 0 220567Current 217,042 9,656 1,683 2,000 549 230,930 224,575 476 2,519 1,500 0 229,070 192107 1935 697 5229 0 199968Development 0 15 0 0 0 15 5,856 0 0 0 0 5,856 20599 0 0 0 0 20599Food Support Programme~
2263 1015712420
People's Works Programme‐I
5,049 5,049 8,417 8,417 33293329
People's Works Programme‐II ****
21,300 21,300 31,754 31,754 2800028000
Benazir Income Support Programme ^
34,330 34,330 32,032 32,032 14,00314,003
Pakistan Bait‐ul‐Maal ^
3,224 3,224 2,261 2,261 1,1691,169
GRAND TOTAL 481,294 367,288 209,331 103,651 83,977 1,245,541 469,006 310,337 172,819 108,524 50,076 1,110,762 398,109 302,435 150,794 84,551 41,339 977,228* Total expenditures for Social Security & Welfare excludes the budgetary expenditures for Benazir Income Support Programme (BISP) and Pakistan Bait‐ul‐Maal (PBM) as they are separately mentioned above.
**This includes irrigation, fisheries, forestry & livestock ***This includes subsidies on financial & fiscal affairs, commercial affairs and food. Total subsidies for FY2010/11 exclude the Food subsidy of KP ****This includes schemes in the area of Electricity, Gas, Water Supply & Sanitation and Roads. ^ Revised figures for Benazir Income Support Programme and Pakistan Bait‐ul‐Maal in FY 2010/11