ANNUAL FINANCIAL RESULTS...•Resourcing division –outstanding performance in a tough market ......
96
ANNUAL FINANCIAL RESULTS for the year ended 31 December 2018 FOR THE YEAR ENDED 31 DECEMBER 2018 ANNUAL FINANCIAL RESULTS
Transcript of ANNUAL FINANCIAL RESULTS...•Resourcing division –outstanding performance in a tough market ......

ANNUAL FINANCIAL RESULTS for the year ended 31 December 2018
FOR THE YEAR ENDED 31 DECEMBER 2018
ANNUAL FINANCIAL
RESULTS

ANNUAL FINANCIAL RESULTS for the year ended 31 December 2018
Tough Economic Times - 2018
ANNUAL FINANCE RESULTS for the year ended 31 December 2018
GDP growth:
Last five years 1.2%
Last three years 0.9%
SA GDP 2018
grew 0.8% IMF World Economic Outlook: SA
expected to remain below
1.3% GDP growth
Average South African
poorer – income per
capita declines 5th year
in a rowUnemployment
Stats SA Q4 2018
27,1%
ANNUAL FINANCIAL RESULTS for the year ended 31 December 2018Source: STATSSA, IMF, City-Press

ANNUAL FINANCIAL RESULTS for the year ended 31 December 2018
Strategic imperatives
Innovation > Business process> Product/market
development
Africa
Customer focus> Easy to do business with > Understanding needs
Academic excellence> Teaching & learning> Benchmarking our
performance> Learning analytics> International & Employer
recognition
Growth> Organic and Acquisitive> Channel> Product> Segment> Geographic
REG
ULA
TIO
NS
SOCIO-ECONOMIC ENVIRONMENT
REP
UTATIO
N
TRANSFORMATION
Human &capitalproductivity
Excellence through specialisation> Market focus> Benchmarking> Data driven
decisions
Operating Environment
ANNUAL FINANCIAL RESULTS for the year ended 31 December 2018
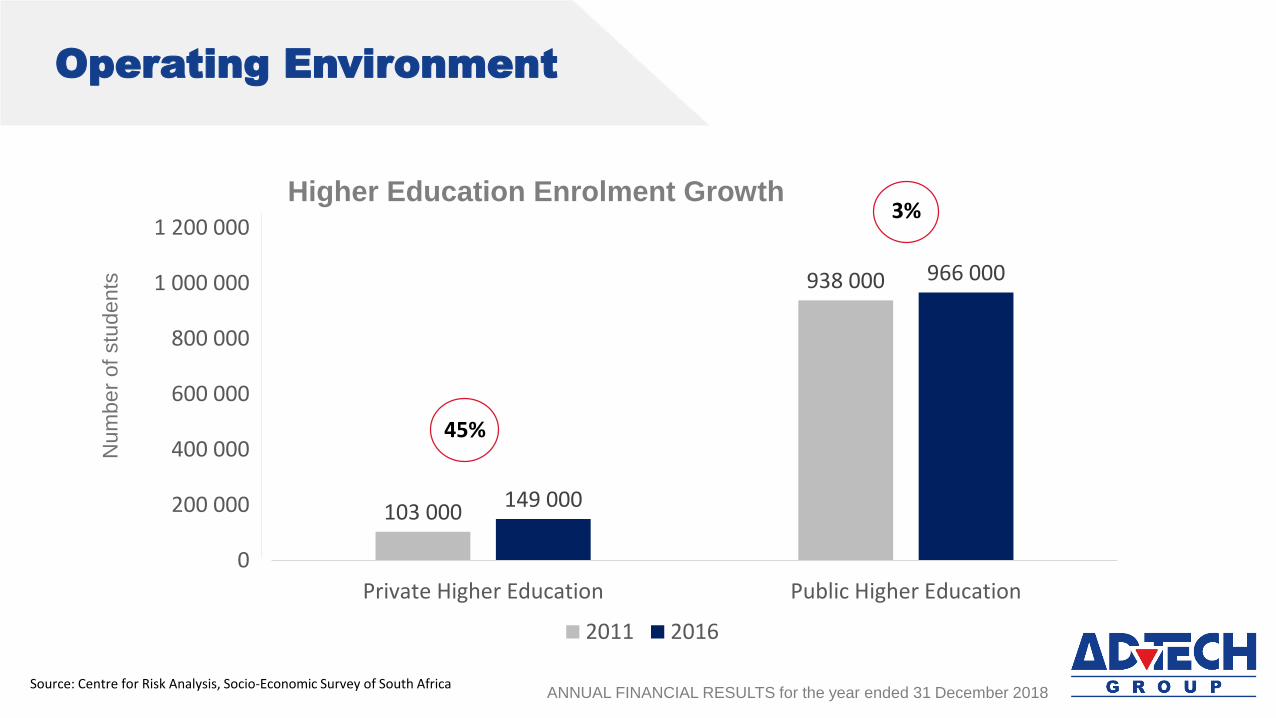
103 000
938 000
149 000
966 000
0
200 000
400 000
600 000
800 000
1 000 000
1 200 000
Private Higher Education Public Higher Education
Higher Education Enrolment Growth
2011 2016
3%
45%
Source: Centre for Risk Analysis, Socio-Economic Survey of South Africa
Nu
mbe
r of
stu
de
nts

Operating Environment
ANNUAL FINANCIAL RESULTS for the year ended 31 December 2018Source: Centre for Risk Analysis, Socio-Economic Survey of South Africa
480 000
11 800 000
590 000
12 300 000
0
2 000 000
4 000 000
6 000 000
8 000 000
10 000 000
12 000 000
14 000 000
Independent Schools Public Schools
Schools Enrolment Growth
2011 2016
23%
4%
Num
ber
of
stu
dents

Operating Environment
ANNUAL FINANCIAL RESULTS for the year ended 31 December 2018
971
26789
1966
23796
0
5 000
10 000
15 000
20 000
25 000
30 000
Independent Schools Public Schools
Nr. of Schools: Independent vs Public
2000 2017
102%
-11%
Source: Centre for Risk Analysis, Socio-Economic Survey of South Africa
Num
ber
of
stu
dents

ANNUAL FINANCIAL RESULTS for the year ended 31 December 2018
Positive momentum continues
• Strong Group performance despite the challenging economic environment
• Positive growth in operating profit and revenue
• Schools division – good enrolments at entry levels, off-set by leavers due to
emigration and financial difficulties
• Despite strong headwinds the schools division has continued to grow scale
• Tertiary division – continued excellent performance
• Resourcing division – outstanding performance in a tough market
• Africa expansion strategy demonstrating good potential

ANNUAL FINANCIAL RESULTS for the year ended 31 December 2018
Good resultsTrading performance summary
RevenueOperational
profit
Operating
margin
11% 14% 17.4%

ANNUAL FINANCIAL RESULTS for the year ended 31 December 2018
Segmental trading performance
Schools Tertiary Resourcing
Revenue 15% 10% 4%
Operating profit 5% 23% 22%
Schools
The Rest of Africa
131%
(89)%

ANNUAL FINANCIAL RESULTS for the year ended 31 December 2018
Enrolment numbers
24199 26713 27408 30827
29138
3346336136
39629
0
10000
20000
30000
40000
50000
60000
70000
80000
2016 2017 2018 2019
Schools Tertiary: Full Qualifications
70 456
53 337
60 17663 544
Num
ber
of
stu
dents

ANNUAL FINANCIAL RESULTS for the year ended 31 December 2018
Group enrolments history
Group enrolments end February Feb-16 Feb-17 Feb-18%
IncreaseFeb-19
%
Increase
Schools 24 199 26 713 27 408 3% 30 827 12%
Tertiary: Full Qualification 29 138 33 463 36 136 8% 39 629 10%
Total 53 337 60 176 63 544 6% 70 456 11%

ANNUAL FINANCIAL RESULTS for the year ended 31 December 2018
Financial Overview

ANNUAL FINANCIAL RESULTS for the year ended 31 December 2018
1 851
2 594
3 224
3 938
4 389
0
500
1 000
1 500
2 000
2 500
3 000
3 500
4 000
4 500
5 000
14 15 16 17 18
R'm
Group Revenue

ANNUAL FINANCIAL RESULTS for the year ended 31 December 2018
Operating profit
256
454
560
668
763
0
100
200
300
400
500
600
700
800
900
14 15 16 17 18
R'm

ANNUAL FINANCIAL RESULTS for the year ended 31 December 2018
Group operating margin
13.85%
17.51%17.37%
16.96%
17.38%
10%
12%
14%
16%
18%
14 15 16 17 18

ANNUAL FINANCIAL RESULTS for the year ended 31 December 2018
Normalised earnings per share
42.3
53.9
63.3
75.3
81.1
0
10
20
30
40
50
60
70
80
90
14 15 16 17 18
Ce
nts

ANNUAL FINANCIAL RESULTS for the year ended 31 December 2018
286
558
738
806
946
93
223
291
394348
0
100
200
300
400
500
600
700
800
900
1 000
14 15 16 17 18
R'm
Cash generated by operations Cash from operations (after working capital)
Cash flow generation

ANNUAL FINANCIAL RESULTS for the year ended 31 December 2018
Free operating cash flow before capex
196
338
468
586563
50
100
150
200
250
300
350
400
450
500
550
600
650
14 15 16 17 18
R'm
• Reduced in 2018 due to
lower fees received in
advance
• Different payment terms
selected
• Good post year-end inflows
• Strong cash conversion at
139% of earnings

ANNUAL FINANCIAL RESULTS for the year ended 31 December 2018
Net cash position
- 436
-1 157 -1 110
-1 617
-1 915
-2 500
-2 000
-1 500
-1 000
- 500
0
14 15 16 17 18
R'm
• Net Borrowings: EBITDA 2.0 times
• Covenant 3.5 times
• Borrowing capacity R3.3 bn
• Potential head room R1.4 bn

ANNUAL FINANCIAL RESULTS for the year ended 31 December 2018
Percentage revenue contribution – segmental overview
46
39
15
Schools
Tertiary
Resourcing
2018

ANNUAL FINANCIAL RESULTS for the year ended 31 December 2018
Percentage revenue contribution – segmental overview
45
39
16
46
39
15
Schools
Tertiary
Resourcing
20182017

ANNUAL FINANCIAL RESULTS for the year ended 31 December 2018
Percentage operating profit contribution – segmental overview
43
52
5
Schools
Tertiary
Resourcing
2018

ANNUAL FINANCIAL RESULTS for the year ended 31 December 2018
Percentage operating profit contribution – segmental overview
46
49
5
43
52
5
Schools
Tertiary
Resourcing
20182017

ANNUAL FINANCIAL RESULTS for the year ended 31 December 2018
Bad debt As a percentage of revenue
Schools
1%
Tertiary
3%
• Tough economic environment
• Pressure on consumers
• Well managed and under control

ANNUAL FINANCIAL RESULTS for the year ended 31 December 2018
SCHOOLSSCHOOLS

ANNUAL FINANCIAL RESULTS for the year ended 31 December 2018
Schools Revenue
865
1 350
1 545
1 742
2 009
0
500
1 000
1 500
2 000
14 15 16 17 18
R'm

ANNUAL FINANCIAL RESULTS for the year ended 31 December 2018
Schools operating profit
162
299
321327 331
100
150
200
250
300
350
400
14 15 16 17 18
R'm

ANNUAL FINANCIAL RESULTS for the year ended 31 December 2018
Schools operating margin
18.7%
22.2% 22.4%
18.8%
16.5%
0%
5%
10%
15%
20%
25%
14 15 16 17 18

ANNUAL FINANCIAL RESULTS for the year ended 31 December 2018
20
17
-2
01
826 751 -2 032
-979-1 880
-1 486
7 009
3 155 30 538
End 2017 End 2018MatricLeavers
Emigration Financial OtherLeavers
Joiners Acquisitions
23 920 -1 636
-829-1 230
-801
4 803
2 524 26 751
20
16
-2
01
7
ADvTECH Schools enrolment waterfall
Grey comparison to previous year

ANNUAL FINANCIAL RESULTS for the year ended 31 December 2018
Strategic imperatives
Innovation > Business process> Product/market
development
Africa
Customer focus> Easy to do business with > Understanding needs
Academic excellence> Teaching & learning> Benchmarking our
performance> Learning analytics> International & Employer
recognition
Growth> Organic and Acquisitive> Channel> Product> Segment> Geographic
REG
ULA
TIO
N
SOCIO-ECONOMIC ENVIRONMENT
REP
UTATIO
N
TRANSFORMATION
Human &capitalproductivity
Excellence through specialisation> Market focus> Benchmarking> Data driven
decisions

ANNUAL FINANCIAL RESULTS for the year ended 31 December 2018ANNUAL FINANCIAL RESULTS for the year ended 31 December 2018
Integration, consolidation, rationalisation
Accelerated growth and acquisitions
Necessary changes:
Acquired 49 schools past 4 years
Total 103 schools
Doubled in size
Organisational and
management restructure
Create a strong
portfolio of brands
On-board acquisitions
Academic standards Shared Services New systems to replace a
variety of legacy systems
Single unified systems
• Simplified
• Standardised
• Optimised
• Automated
• Time consuming and
complex
• Making progress
• Limited impact on
results

ANNUAL FINANCIAL RESULTS for the year ended 31 December 2018ANNUAL FINANCIAL RESULTS for the year ended 31 December 2018
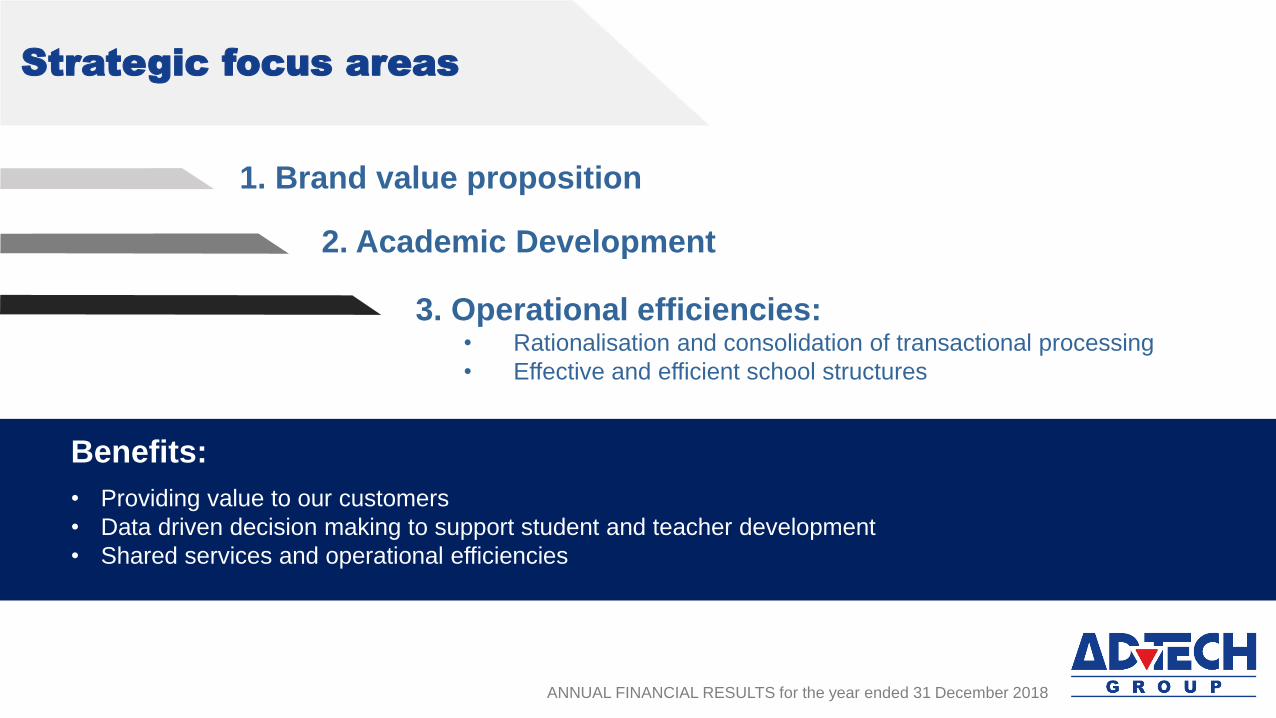
Strategic focus areas
1. Brand value proposition
2. Academic Development
3. Operational efficiencies:• Rationalisation and consolidation of transactional processing
• Effective and efficient school structures
Benefits:
• Providing value to our customers
• Data driven decision making to support student and teacher development
• Shared services and operational efficiencies

ANNUAL FINANCIAL RESULTS for the year ended 31 December 2018ANNUAL FINANCIAL RESULTS for the year ended 31 December 2018
Strategic focus areas:Brand value proposition

ANNUAL FINANCIAL RESULTS for the year ended 31 December 2018ANNUAL FINANCIAL RESULTS for the year ended 31 December 2018
Strategic focus areas
1. Brand value proposition
2. Academic Development
3. Operational efficiencies:• Rationalisation and consolidation of transactional processing
• Effective and efficient school structures
Benefits:
• Providing value to our customers
• Data driven decision making to support student and teacher development
• Shared services and operational efficiencies

ANNUAL FINANCIAL RESULTS for the year ended 31 December 2018
Academic Development
FUTURE FOCUSED EDUCATION
IEB, DBE, ISASA,
EYFS, Cambridge,
International
Baccalaureate
Future-focused
teaching and
learning
Challenging
and engaging
curriculum
Performance
analysis =
personalised
learning
Computational thinking
and coding
Computer networks
and productivity
New age
technology
spacesfor collaborative problem-based learning
Understanding
sustainable global goals
and taking action
International
mindedness
Embracing diversity
Critical
Creative
Reflective
Inquiring
Interpreting
Presenting
Personal
integration
Communicating
with others
Collaboration
Leadership
Personal
behaviour
Organisational
skills
Self reflection
Growth mindset
EVERY STUDENT IS DEVELOPING
INCREMENTALLY, IN AN ENGAGING,
INSPIRING AND CHALLENGING
LEARNING ENVIRONMENT.
CURRICULUM
GLOBAL
COMPETENCIES
DIGITAL
LITERACY
GLOBAL
CITIZENSHIPTHINKING RESEARCHING COMMUNICATING SOCIAL SKILLS SELF-MANAGEMENT
ANNUAL FINANCE RESULTS for the year ended 31 December 2018ANNUAL FINANCIAL RESULTS for the year ended 31 December 2018

ANNUAL FINANCIAL RESULTS for the year ended 31 December 2018
Technological
collaborative
problem based
learning
Computational
thinking and coding
Computer networks
and productivity
ANNUAL FINANCIAL RESULTS for the year ended 31 December 2018
Strategic focus onAcademic development

ANNUAL FINANCIAL RESULTS for the year ended 31 December 2018
Strategic focus areas:Academic development
• Bachelor pass rate increased from 81% to 87% - last 4 years
• Higher education pass of 98% - last 4 years (degree, diploma, higher certificate)
• Performance of Maragon and Centurus distinction rates per matric
students - improved since acquired
• Crawford, Trinityhouse, Maragon and Centurus 100% pass rate

ANNUAL FINANCIAL RESULTS for the year ended 31 December 2018
Schools academic results comparison
NSC IEB
NSC 2018
78.2%
34%
IEB 2018
98.9%
91%
Matric pass
rate
Bachelor pass
rate
Average
distinctions per
candidate
Competitor
NSC
2018
94.3%
52%
860
ADvTECH
NSC
Schools
2018
97.0%
68%
0.9
499
Competitor
IEB
2018
99.7%
88%
1 196
ADvTECH
IEB
Schools
2018
100%
95%
2.0
1 145
ADvTECH
Group
2018
99%
87%
1.7
1 644Number of
matrics
Strategic focus areas:Academic development
ANNUAL FINANCIAL RESULTS for the year ended 31 December 2018ANNUAL FINANCIAL RESULTS for the year ended 31 December 2018
Strategic focus areas
1. Brand value proposition
2. Academic Development
3. Operational efficiencies:• Rationalisation and consolidation of transactional processing
• Effective and efficient school structures
Benefits:
• Providing value to our customers
• Data driven decision making to support student and teacher development
• Shared services and operational efficiencies

ANNUAL FINANCIAL RESULTS for the year ended 31 December 2018
Strategic focus area:Operational efficiencies
Academic efficiencies• School cost structures
• Optimise teacher timetable:
• Teacher: Pupil ratios
• Staff: Pupil ratios
Organisational and management
restructure
Integrated Facilities Management
Group Shared Services• Payroll and HR Admin
• Transactional finance
• Debtors and creditors
• Payments
• Procurement
• Brand teams supported by Finance,
Marketing, HR and Principals
• Time consuming and complex
• Making progress
• Limited impact on results
Student Information system
• Enable data driven decisions

ANNUAL FINANCIAL RESULTS for the year ended 31 December 2018
• Transactional processes
• Debtors and creditors
• Payroll + HR Admin
• Procurement
• Facilities management
Strategic focus area:Operational efficiencies

ANNUAL FINANCIAL RESULTS for the year ended 31 December 2018
Accountability and centralised service
delivery
Standardised service delivery
Improved responsiveness
Reduce invoices, payments and
contracts
Suppliers No. Contracts
Cleaning 8 50
Hygiene 12 71
Security 17 64
37 185
Single
unified
systems
Simplified
Standardised
Optimised
Automated
Example: Integrated facilities management
Strategic focus area:Operational efficiencies

ANNUAL FINANCIAL RESULTS for the year ended 31 December 2018
Strategic focus area:Operational effectiveness, efficient schools structure
Tough decisions
Trinityhouse School
Palm Lakes, KZN Abbotts College, Centurion
Success!
Increased enrolments

ANNUAL FINANCIAL RESULTS for the year ended 31 December 2018
Pinnacle College, Rynfield
• Acquired 2015
• Originally defined as an “Inclusive” school
• Repositioning as mid fee
• Current student numbers: 291
• Planned capacity: 1 625
Strategic focus area:Operational effectiveness, efficient schools structure

ANNUAL FINANCIAL RESULTS for the year ended 31 December 2018
Pinnacle College, Kyalami
• Acquired 2016
• Confused market positioning
• Reposition as mid fee
• Adjusted fee structure
• Planned capex to realise full potential
• Current student numbers: 545
• Phase 1 : 1 800
• Phase 2 : 3 600
Strategic focus area:Operational effectiveness, efficient schools structure

ANNUAL FINANCIAL RESULTS for the year ended 31 December 2018
Strategic imperatives
Innovation > Business process> Product/market
development
Africa
Customer focus> Easy to do business with > Understanding needs
Academic excellence> Teaching & learning> Benchmarking our
performance> Learning analytics> International & Employer
recognition
Growth> Organic and Acquisitive> Channel> Product> Segment> Geographic
REG
ULA
TIO
N
SOCIO-ECONOMIC ENVIRONMENT
REP
UTATIO
N
TRANSFORMATION
Human &capitalproductivity
Excellence through specialisation> Market focus> Benchmarking> Data driven
decisions

ANNUAL FINANCIAL RESULTS for the year ended 31 December 2018
Strategic imperatives
Innovation > Business process> Product/market
development
Africa
Customer focus> Easy to do business with> Understanding needs
Academic excellence> Teaching & learning> Benchmarking our
performance> Learning analytics> International & Employer
recognition
Growth> Organic and Acquisitive> Channel> Product> Segment> Geographic
REG
ULA
TIO
N
SOCIO-ECONOMIC ENVIRONMENT
REP
UTATIO
N
TRANSFORMATION
Human &capitalproductivity
Excellence through specialisation> Market focus> Benchmarking> Data driven
decisions

ANNUAL FINANCIAL RESULTS for the year ended 31 December 2018
African education market
6m households
will earn
$5 000 - $20 000
by 2025
“Private education proves to be one of the fastest growing sectors in
Africa”
Emerging markets education
investments increased more than
5 000% between 2001 and 2015
66m scholars in private
education by 2021
Population will double to 2.4bn
by 2050 1.2bn will
need education Sub-Saharan
Africa, largest
and fastest
growing
Median age
20
Urbanisation
will go from
35% (2010)
to 50% by
2030 Currently:
2/5 of population
age is
0–14 years
1/5 between
15–24 years
Source: Caerus Capital: The Business of Education in Africa
ANNUAL FINANCIAL RESULTS for the year ended 31 December 2018
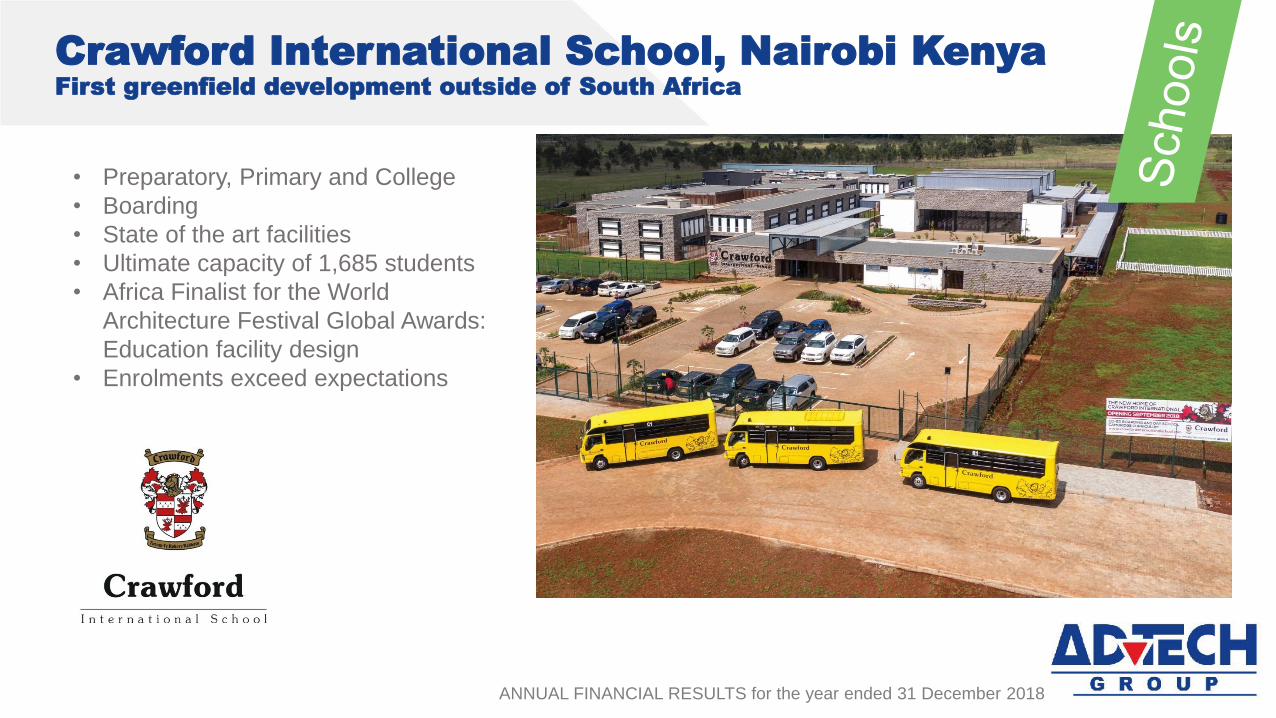
Crawford International School, Nairobi KenyaFirst greenfield development outside of South Africa
• Preparatory, Primary and College
• Boarding
• State of the art facilities
• Ultimate capacity of 1,685 students
• Africa Finalist for the World
Architecture Festival Global Awards:
Education facility design
• Enrolments exceed expectations

ANNUAL FINANCIAL RESULTS for the year ended 31 December 2018
Expansion into the rest of AfricaAcquisition: Makini Schools – Nairobi & Kisumu, Kenya
• Founded in 1978
• 3 197 students
• K12 to Grade 12
• 7 Schools, 3 campuses
• Positive enrolments

ANNUAL FINANCIAL RESULTS for the year ended 31 December 2018
Mid-Fee schools – excellent growth
Mooikloof High School

ANNUAL FINANCIAL RESULTS for the year ended 31 December 2018
Schools – GrowthMid-fee sector
• Opening 2020
• Mid Fee School
• Preparatory, Primary and College (opening grade 000 –
grade 9)
• Planned capacity: 1 875
Pinnacle College, Waterfall

ANNUAL FINANCIAL RESULTS for the year ended 31 December 2018
Schools – GrowthMid-fee sector
• Opening 2020
• Mid Fee School
• Preparatory, Primary and College (opening grade 000
– grade 9)
• Planned capacity: 1 625
Pinnacle College, Linden

ANNUAL FINANCIAL RESULTS for the year ended 31 December 2018
Create a strong portfolio of brandsMid-fee success
Opening in 2020Success Re-positioning

ANNUAL FINANCIAL RESULTS for the year ended 31 December 2018
Schools – GrowthPremium sector
• Opening 2020
• Preparatory, Primary and College
(opening grade 000 – grade 9)
• Planned capacity: 1 800
Trinityhouse, Glenvista

ANNUAL FINANCIAL RESULTS for the year ended 31 December 2018
Strategic imperatives
Innovation > Business process> Product/market
development
Africa
Customer focus> Easy to do business with > Understanding needs
Academic excellence> Teaching & learning> Benchmarking our
performance> Learning analytics> International & Employer
recognition
Growth> Organic and Acquisitive> Channel> Product> Segment> Geographic
REG
ULA
TIO
N
SOCIO-ECONOMIC ENVIRONMENT
REP
UTATIO
N
TRANSFORMATION
Human &capitalproductivity
Excellence through specialisation> Market focus> Benchmarking> Data driven
decisions

ANNUAL FINANCIAL RESULTS for the year ended 31 December 2018
Innovation - New product developmentThe Bridge Assisted Learning School
• Grade 0 – 7
• Northern Suburbs, Gauteng
• Opened 2018
• Enrolments ahead of targets

ANNUAL FINANCIAL RESULTS for the year ended 31 December 2018
Schools – GrowthStrong pipeline – Mid-fee focus
Schools
By phase (end Feb)
Pipeline
103 103 112 117 122
Total 103
9 5 5 3
2019 2020 2021 2022 2023
112 117 122 125
ANNUAL FINANCIAL RESULTS for the year ended 31 December 2018
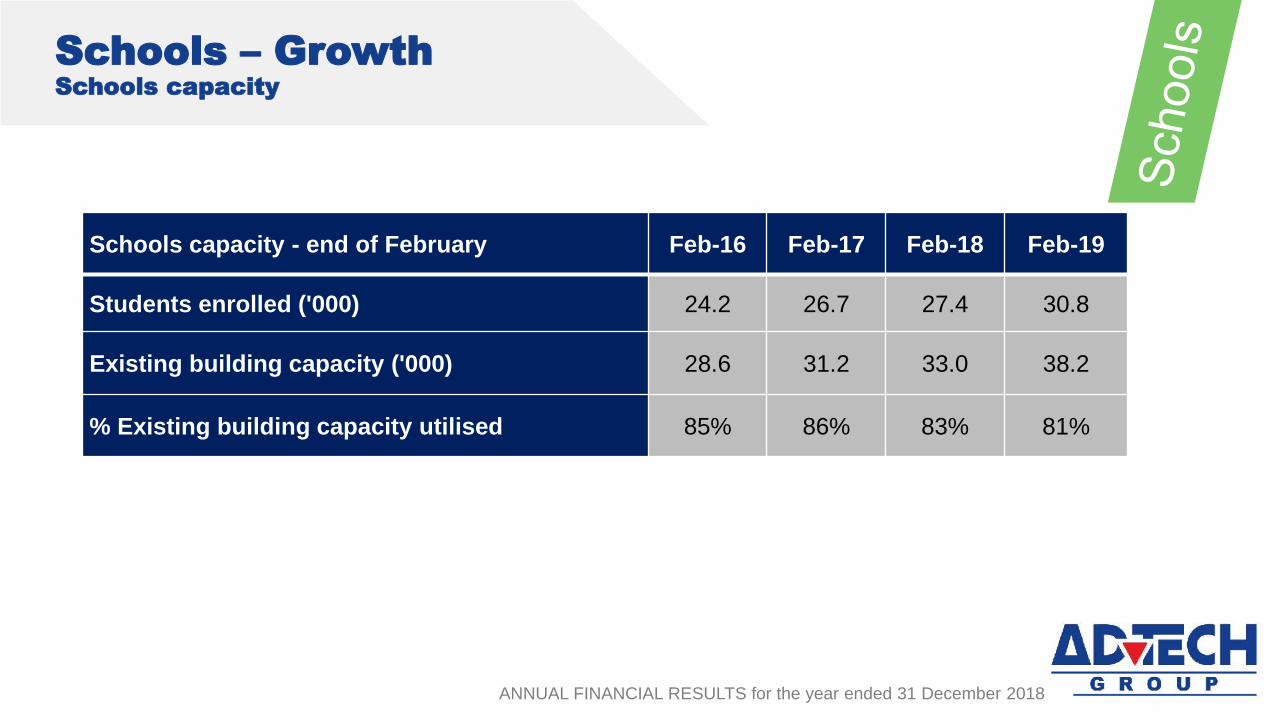
Schools – GrowthSchools capacity
Schools capacity - end of February Feb-16 Feb-17 Feb-18 Feb-19
Students enrolled ('000) 24.2 26.7 27.4 30.8
Existing building capacity ('000) 28.6 31.2 33.0 38.2
% Existing building capacity utilised 85% 86% 83% 81%

ANNUAL FINANCIAL RESULTS for the year ended 31 December 2018
TERTIARYTERTIARY

ANNUAL FINANCIAL RESULTS for the year ended 31 December 2018
Tertiary revenue
799
954
1228
1556
1719
0
200
400
600
800
1 000
1 200
1 400
1 600
1 800
2 000
14 15 16 17 18
R'm

ANNUAL FINANCIAL RESULTS for the year ended 31 December 2018
Tertiary operating profit
84
135
223
321
395
0
50
100
150
200
250
300
350
400
14 15 16 17 18
R'm

ANNUAL FINANCIAL RESULTS for the year ended 31 December 2018
Tertiary operating margin
10.5%
14.1%
18.2%
20.7%
23.0%
0%
3%
6%
9%
12%
15%
18%
21%
24%
27%
14 15 16 17 18

ANNUAL FINANCIAL RESULTS for the year ended 31 December 2018
Tertiary Division
• The IIE – SA’s largest and most accredited ‘private university’• The IIE and Central Academic Team have 3 000+ academic staff• 6 Established faculties • 201 Accredited tertiary courses• Comprehensive integrated Student Information System • International partnerships and endorsements
• BAC – British Accreditation Council• City and Guilds Institute UK• Swiss Education Group• World Association of Chefs• AHA – American Hospitality Academy • Fontys Academy for Creative Industries (Holland)• Offenbach University of Art and Design (Germany)• Sup de Pub School of Communication (France)

ANNUAL FINANCIAL RESULTS for the year ended 31 December 2018
Strategic imperatives
Innovation > Business process> Product/market
development
Africa
Customer focus> Easy to do business with > Understanding needs
Academic excellence> Teaching & learning> Benchmarking our
performance> Learning analytics> International & Employer
recognition
Growth> Organic and Acquisitive> Channel> Product> Segment> Geographic
REG
ULA
TIO
N
SOCIO-ECONOMIC ENVIRONMENT
REP
UTATIO
N
TRANSFORMATION
Human &capitalproductivity
Excellence through specialisation> Market focus> Benchmarking> Data driven
decisions

ANNUAL FINANCIAL RESULTS for the year ended 31 December 2018
THE INDEPENDENT INSTITUTE OF EDUCATION
South Africa’s largest and most accredited
“private university”/private higher
education system

ANNUAL FINANCIAL RESULTS for the year ended 31 December 2018
THE IIE FACULTIES
FACULTY OF COMMERCE
FACULTY OF INFORMATION
& COMMUNICATION TECHNOLOGY
FACULTY OF SOCIAL SCIENCES
FACULTY OF LAW
ANNUAL FINANCIAL RESULTS for the year ended 31 December 2018
FACULTY OF EDUCATION
FACULTY OF HUMANITIES

ANNUAL FINANCIAL RESULTS for the year ended 31 December 2018
Academic excellenceAccredited tertiary courses by category
42 programmes in the accreditation pipeline
201
101
IIE
1 MASTERS
11 HONOURS
28 DEGREES
34 DIPLOMAS
27 HIGHER
CERTIFICATES
3
Capsicum
3 NATIONAL
CERTIFICATES
AND DIPLOMAS
5
The Private
Hotel School
1 DEGREE
1 ADVANCED
DIPLOMA
1 DIPLOMA
1 HIGHER
CERTIFICATE
1 NATIONAL
CERTIFICATE AND
DIPLOMA (N1-6)
92
Oxbridge
12 DIPLOMAS
80 NATIONAL
CERTIFICATES
AND DIPLOMAS
total
29
DEGREES
11
HONOURS
1
MASTERSACCREDITED
TERTIARY
COURSES
84
NATIONAL CERTIFICATES AND DIPLOMAS
(N1 –N6)
1 2947
DIPLOMASADVANCED
DIPLOMA
28
HIGHER
CERTIFICATES

ANNUAL FINANCIAL RESULTS for the year ended 31 December 2018
The IIE – Professional qualifications
IIE’s
Professional
Qualifications
2017 2019 Growth
Law 1 634 2 686 64%
Education 1 783 3 964 122%
Accounting 166 607 266%
Total 3 583 7 257 103%

ANNUAL FINANCIAL RESULTS for the year ended 31 December 2018
29 Campuses
82%
Average module pass rate
+3 000
Academic
Staff
40 000 Registered Students for full time qualifications
Tertiary division by numbersFebruary 2019

ANNUAL FINANCIAL RESULTS for the year ended 31 December 2018
The IIE – TrendsettersLLB High Court ruling success
• High Court rules in favour of IIE Varsity College law degree
• Positive precedent to address the issue of ‘private university’ /
private higher education institutions
• Confirms to professional bodies in all fields, including law,
engineering, accountancy, teaching, nursing and psychology that
the same rules apply across the board, and that students and
graduates from public and private universities and institutions
must be treated equally

ANNUAL FINANCIAL RESULTS for the year ended 31 December 2018
The IIE – teaching and learning excellence
Data-driven decision-making informed by global best practice and
local relevance
Investment in technology from business solutions and student
learning experience
Superior student support before, during and after studies
Continuous professional development of lecturers and industry
collaboration
Unparalleled market insight and response: student needs &
regulatory environment

ANNUAL FINANCIAL RESULTS for the year ended 31 December 2018
The IIE – Teaching and learning excellence
• The Independent Journal of Teaching and Learning
• The only private higher education provider publishing
an accredited research journal
• Train and develop our own lecturers, set standards
and teaching practices

ANNUAL FINANCIAL RESULTS for the year ended 31 December 2018
Data driven decision makingAcademic intelligence
Cohort qualifications dashboard
Setting module
targets
Performance tracking
Analysed by:
• Students
• Lecturers
• Campuses

ANNUAL FINANCIAL RESULTS for the year ended 31 December 2018
Reputation match
• Academic Excellence
• Module pass rate
• Student employability
Add 32 qualifications to portfolio
• MBA
• Engineering
• Public health, etc.
West Rand campus – capacity 6 500 students
4 Student residences
ANNUAL FINANCE RESULTS for the year ended 31 December 2018
Monash SA (MSA)Expected to be effective April 2019
ANNUAL FINANCIAL RESULTS for the year ended 31 December 2018
ANNUAL FINANCIAL RESULTS for the year ended 31 December 2018
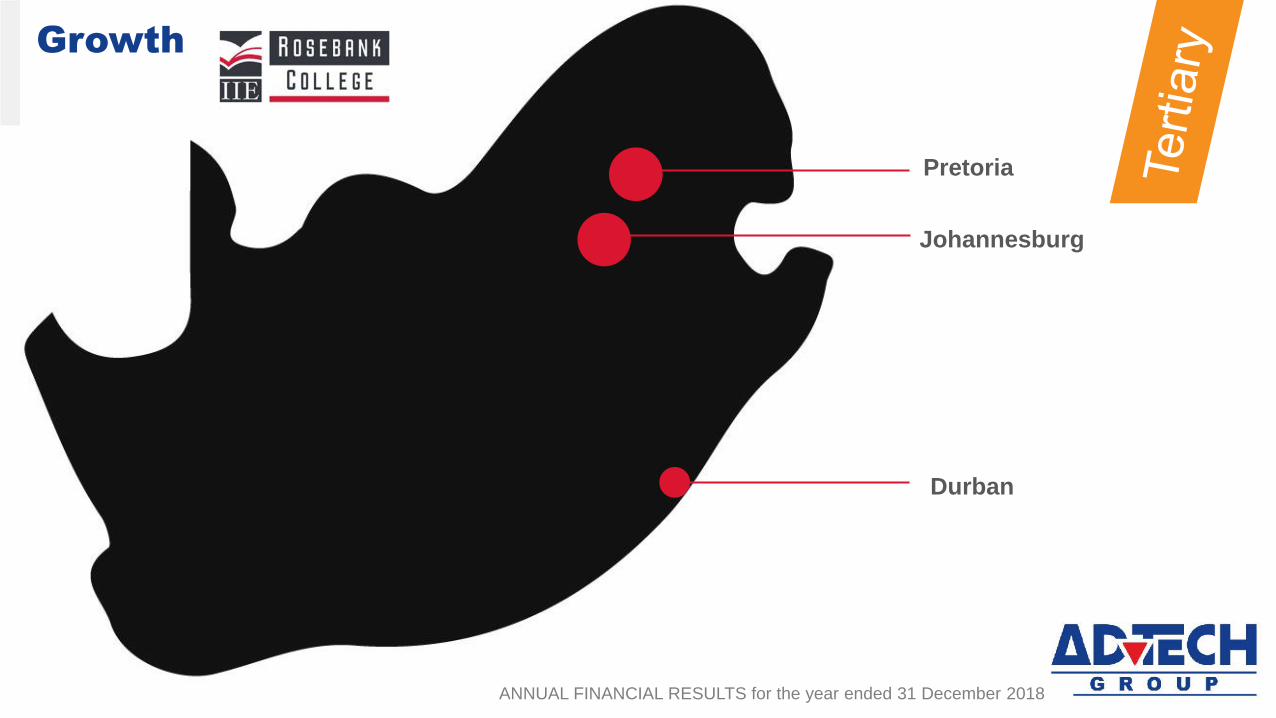
Growth
Pretoria
Johannesburg
Durban

ANNUAL FINANCIAL RESULTS for the year ended 31 December 2018
Growth
Pretoria
Johannesburg
Durban 2018

ANNUAL FINANCIAL RESULTS for the year ended 31 December 2018
Growth
Pretoria
Johannesburg
Durban 2018
Cape Town 2020

ANNUAL FINANCIAL RESULTS for the year ended 31 December 2018
Growth
Polokwane 2016
Pretoria
Johannesburg
Durban 2018
Cape Town 2020

ANNUAL FINANCIAL RESULTS for the year ended 31 December 2018
Growth
Polokwane 2016
Pretoria
Johannesburg
Durban 2018
Pietermaritzburg 2018
Bloemfontein 2018
Cape Town 2020
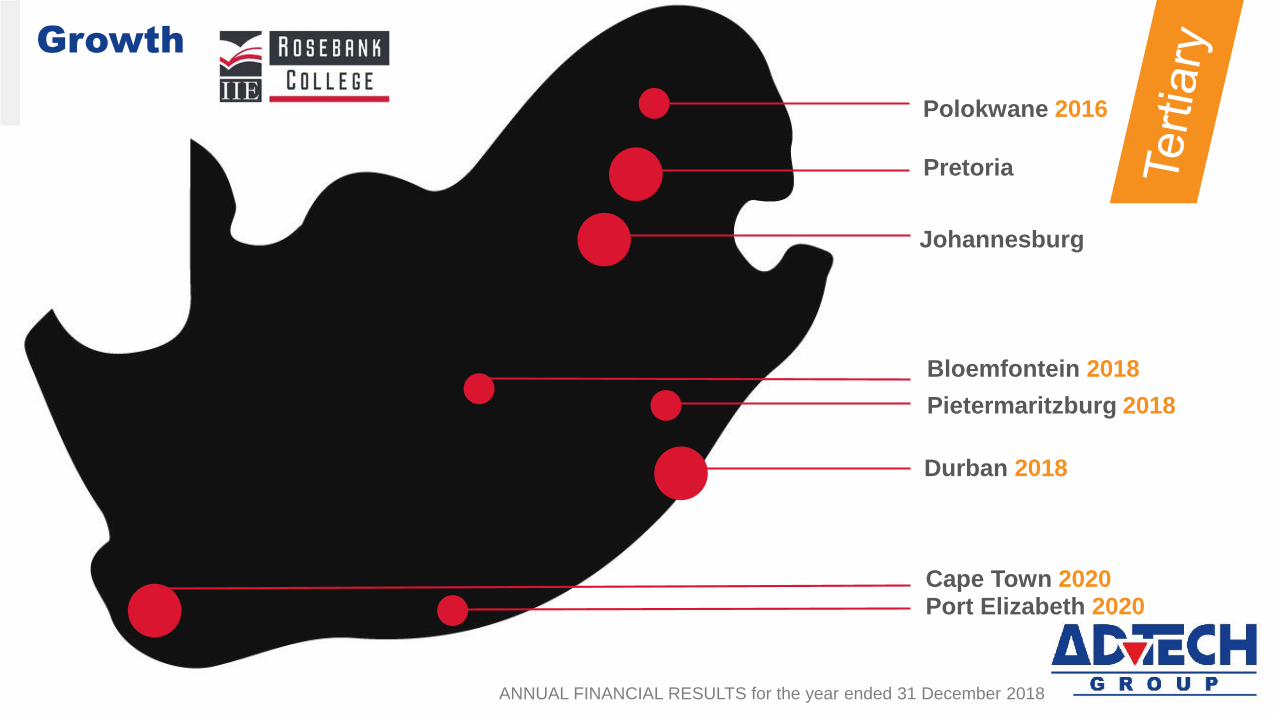
ANNUAL FINANCIAL RESULTS for the year ended 31 December 2018
Growth
Polokwane 2016
Pietermaritzburg 2018
Bloemfontein 2018
Port Elizabeth 2020
Pretoria
Johannesburg
Durban 2018
Cape Town 2020

ANNUAL FINANCIAL RESULTS for the year ended 31 December 2018
Growth
Polokwane 2016
Pietermaritzburg
Bloemfontein
Port Elizabeth 2020
Mbombela 2021
Pretoria
Johannesburg
Durban 2018
Pietermaritzburg 2018
Bloemfontein 2018
Cape Town 2020

ANNUAL FINANCIAL RESULTS for the year ended 31 December 2018
New hospitality campus in Rosebank
2018
2 CAMPUSES6 CAMPUSES
ANNUAL FINANCE RESULTS for the year ended 31 December 2018ANNUAL FINANCIAL RESULTS for the year ended 31 December 2018
Tertiary segment growth

ANNUAL FINANCIAL RESULTS for the year ended 31 December 2018
Academic Excellence
ANNUAL FINANCIAL RESULTS for the year ended 31 December 2018
International and employer recognition
43 760 The IIE graduates
71% were employed within
6 months after graduation

ANNUAL FINANCIAL RESULTS for the year ended 31 December 2018
4 Silver
4 Bronze
2 New Blood
Awards
1 student in
the top 10
5 Semi-
finalists
1 Student
admitted to
international
society
2nd Place1 Gold
1 Gold Muse
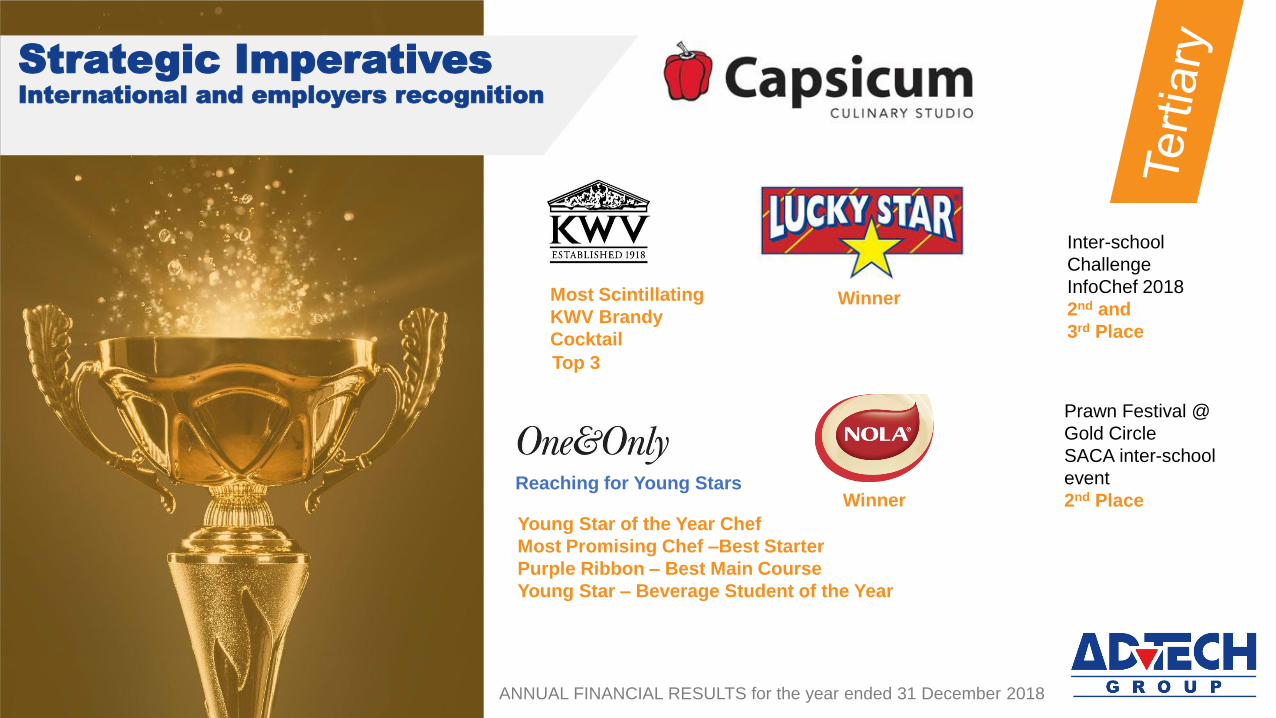
Strategic ImperativesInternational and employers recognition
ANNUAL FINANCIAL RESULTS for the year ended 31 December 2018
ANNUAL FINANCIAL RESULTS for the year ended 31 December 2018
WinnerMost Scintillating
KWV Brandy
Cocktail
Top 3
Young Star of the Year Chef
Most Promising Chef –Best Starter
Purple Ribbon – Best Main Course
Young Star – Beverage Student of the Year
Reaching for Young Stars
Inter-school
Challenge
InfoChef 2018
2nd and
3rd Place
Prawn Festival @
Gold Circle
SACA inter-school
event
2nd PlaceWinner
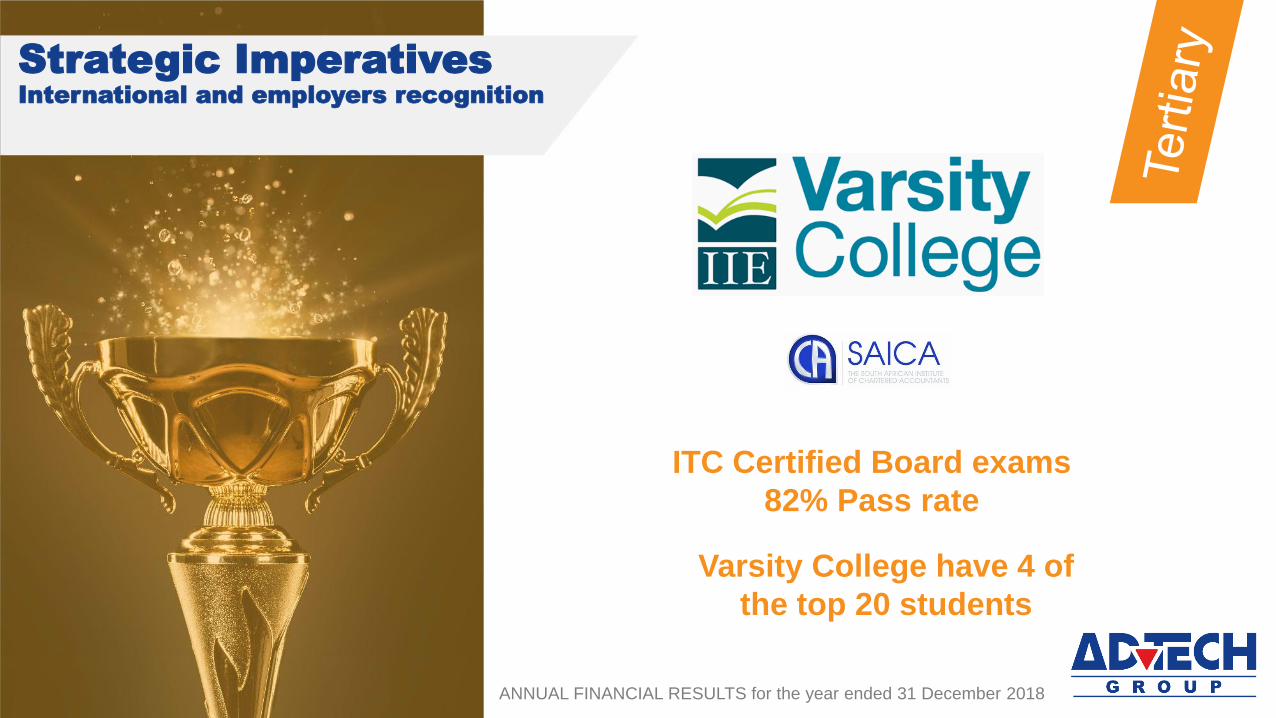
Strategic ImperativesInternational and employers recognition
ANNUAL FINANCIAL RESULTS for the year ended 31 December 2018
ANNUAL FINANCIAL RESULTS for the year ended 31 December 2018
Varsity College have 4 of
the top 20 students
ITC Certified Board exams
82% Pass rate
Strategic ImperativesInternational and employers recognition
ANNUAL FINANCIAL RESULTS for the year ended 31 December 2018

ANNUAL FINANCIAL RESULTS for the year ended 31 December 2018
RESOURCING

ANNUAL FINANCIAL RESULTS for the year ended 31 December 2018
Resourcing revenue
194
297
461
644670
0
100
200
300
400
500
600
700
800
14 15 16 17 18
R'm
ANNUAL FINANCIAL RESULTS for the year ended 31 December 2018
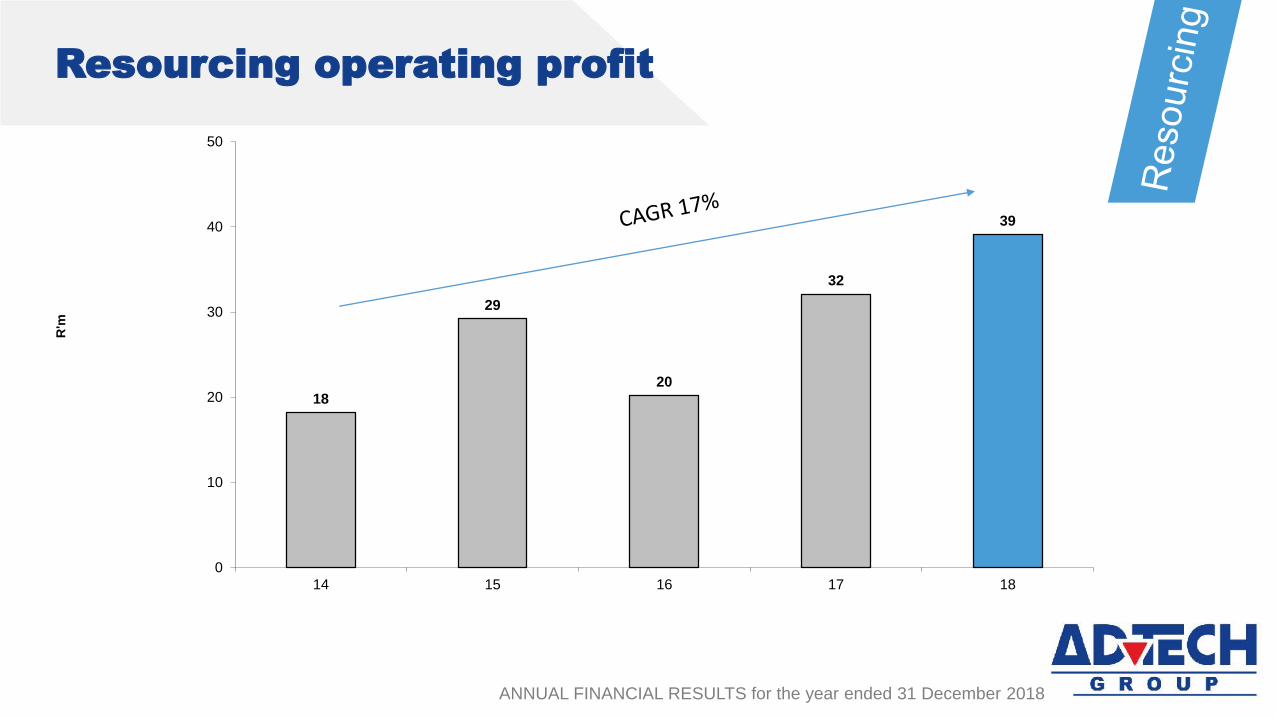
Resourcing operating profit
18
29
20
32
39
0
10
20
30
40
50
14 15 16 17 18
R'm

ANNUAL FINANCIAL RESULTS for the year ended 31 December 2018
Resourcing operating margin
9.4%9.8%
4.4%
5.0%
5.8%
0%
2%
4%
6%
8%
10%
12%
14 15 16 17 18
Different business model

ANNUAL FINANCIAL RESULTS for the year ended 31 December 2018
Outstanding Performance
SA markets Grew market share in a
declining market
Superb growth
Endorses our
strategy to diversify and
explore alternative markets
Africa revenue Dollar based
• Placements increased by
23%
• Highly cash generative
• SA markets: grown our
market share in a declining
market
ANNUAL FINANCIAL RESULTS for the year ended 31 December 2018

ANNUAL FINANCIAL RESULTS for the year ended 31 December 2018
Prospects
• Strong position to explore numerous opportunities in and
outside South Africa
• Tertiary and Resourcing divisions are well positioned and
perform strongly
• Schools division
• Continue integration, consolidation and rationalisation
phase
• Drive operational efficiencies
• Sharpen market focus

ANNUAL FINANCIAL RESULTS for the year ended 31 December 2018
Dividend –Prudent and responsible
ANNUAL FINANCIAL RESULTS for the year ended 31 December 2018
Dividends per
share for the year
30.0 cents
Final Gross Dividend
15.0 cents
• Significant investment opportunities
• Balance between preserving cash for development projects and
shareholder returns
• Capital allocations amount R1.9bn
• Prudent and responsible management of cash resources

ANNUAL FINANCIAL RESULTS for the year ended 31 December 2018
QUESTIONS

ANNUAL FINANCIAL RESULTS for the year ended 31 December 2018
THANK YOU