ANNEXURE 12 OVERVIEW OF BUDGET ASSUMPTIONS APPLIED...
15
2017/18 Budget (May 2017) ANNEXURE 12 OVERVIEW OF BUDGET ASSUMPTIONS APPLIED TO THE 2017/18 MTREF REQUIRED TO BE INCLUDED IN ANNEXURE 11 (IDP)
Transcript of ANNEXURE 12 OVERVIEW OF BUDGET ASSUMPTIONS APPLIED...

2017/18 Budget (May 2017)
ANNEXURE 12
OVERVIEW OF BUDGET ASSUMPTIONS
APPLIED TO THE 2017/18 MTREF REQUIRED
TO BE INCLUDED IN ANNEXURE 11 (IDP)

Annexure 12 – Overview of budget assumptions applied to the 2017/18 MTREF required to be included in Annexure 11 (IDP)
1
2017/18 – 2019/20 MEDIUM TERM FINANCIAL PLAN (MTREF)
Executive summary
Section 26 of Chapter 5, of the Local Government Municipal Systems Act, No 32 of 2000,
prescribes the core components of the Integrated Development Plan. Section 26 (h) requires
the inclusion of a financial plan which should include a budget projection for at least the next
three years. This financial plan aims to determine the financial affordability and -sustainability
levels of the City over the medium term.
The City’s financial plan integrates the financial relationships of various revenue and
expenditure streams to give effect to the IDP. It provides guidance for the development of
current budgets and assesses financial impacts on outer years’ budgets by incorporating
capital expenditure outcomes, operating expenditure trends, optimal asset management plans
and the consequential impact on rates, tariffs and other service charges.
The 2017/18 MTREF coincides with the new term of office, a new IDP, new strategic
objectives, a new Organisational Development Transformation Plan (ODTP) and a
differentiated approach to budgeting.
The Long term financial plan (LTFP) model developed to determine the appropriate mix of
financial parameters and assumptions within which the City should operate to facilitate
budgets are affordable and sustainable at least ten years into the future, was specifically more
challenging this time round.
Financial Strategic Approach
The 2017/18 MTREF representing the first year of the City’s five-year IDP coupled with a new
ODTP approach required a change in focus areas of the City’s Capital and Operating
investment. The budget development brief for the 2017/18 MTREF can be summarised as
follows:
Not business as usual
Affordable, but sustainable tariff increase package
Executive Mayor Budget briefing
Budget hearings with political involvement
Specific areas of focus per strategies and political directive
Zero-based approach to budget elements
Area based service delivery will inform and influence resource allocations
Giving effect to ODTP
The 11 priority areas to elevate the 5 strategic focus areas of the City’s draft IDP (2017/18 –
2021/22) and which influenced the financial considerations provided for in the MTREF had to
be clearly demonstrated during the budget hearings by directorates. They had to further
demonstrate/indicate:
How the budget gives effect to the transformational priorities and strategies of:
City Development Strategy
Draft Integrated Development Plan
Economic Growth and Social Development Strategy
Integrated Human Settlements Framework

Annexure 12 – Overview of budget assumptions applied to the 2017/18 MTREF required to be included in Annexure 11 (IDP)
2
Integrated Public Transport Network
Transit Orientated Development strategic framework, and
Integrated Zones
that projects are within Spatial Targeting zone/nodes
to what extent catalytic or flagship projects are incorporated and supported in budgets
what current partnership exist with SOEs, government departments, private sector and
NGOs
what cost containment measures were implemented to give effect to MFMA circular 82
that at least 40% of capital resources are allocated for upgrading and renewal of existing
infrastructure
that proposed projects are tender or demand plan ready.
Financial Modelling and Key Planning Drivers The principles applied to the MTREF in determining and maintaining an affordability envelope
included:
A differentiated approach in applying parameters in the operating budget based on trends
of previous expenditure, cost containment considerations and strategic needs;
A 100% capital expenditure implementation rate assumed;
Credible collection rates based on collection achievements to date and incorporating
improved success anticipated in selected revenue items;
national and provincial allocations as per the 2017 Division of Revenue Bill and the 2017
Provincial Government gazette; and
giving effect to cost containment measures
The ODTP came into effect 1 January 2017 which required the 2016/17 mid-year Adjustment
budget to incorporate the new organisational structure. This together with the appointment of
new senior management resulted in a later start than normal to the budget process with budget
hearings taking place in January / early February 2017.
Economic outlook / external factors
Over the past year there were various international developments placing uncertainty on the
future of both the global and domestic economies. These uncertainties relate to politics and
policy changes, specifically referring to the new US administration and the expected outcome
of the Brexit vote.
According to BER and the 2017 Budget review GDP is expected to grow at levels higher than
1 per cent from 2017. This growth can be attributed to several developments which include
improved labour relations, stabilisation of electricity supply, improved global conditions and
rising consumer and business confidence.
The Rand ended 2016 at a substantially stronger level than projected which according to BER
is as a result of SA’s investment grade credit rating remaining intact, better performance of
exports commodity prices, stability in the euro-dollar exchange rate and the improved current
account deficit. The 2017 R/$ exchange rate is projected at R13.74/US$.

Annexure 12 – Overview of budget assumptions applied to the 2017/18 MTREF required to be included in Annexure 11 (IDP)
3
A rise in Brent crude oil was evident towards the end of last year after the oil cartel agreed to
reduce output. It is however expected that that the OPEC output for 2017 may not be much
different to the output experienced in 2016 and US oil output could make a comeback in 2017.
BER projects that Brent crude oil will reach around $60/bbl. by the end of 2017. The oil price
will further be affected by the 2017 Budget review. At the 2017 budget speech it was
announced that the general fuel levy will increase by 30c/litre which will affect the end
consumer price of oil further.
Inflation outlook for the years ahead is also projected to improve. BER forecasts that the CPI
inflation rate of 6.8% recorded in December 2016 will be the peak for the current cycle.
Improved grain crops, a stable currency and revised weights for CPI is expected to ensure a
more favourable inflation outcome. CPI is therefore projected below 6% over the future years.
The City’s CPI projection is based on BER calendar year projection of 5.8% for 2017, 5.6%
for 2018 and 5.4% for 2019.
National and Provincial influences Attention was given to National and Provincial influences and guidelines. National Treasury
issued two circulars to guide municipalities on the preparation of the 2017/18 Medium Term
Revenue and Expenditure Framework (MTREF) and should be read with previous annual
budget circulars.
a) National Treasury MFMA circular No. 85 issued December 2016 The key focus of the circular is the implementation of municipal Standard Chart of Accounts
(mSCOA) and addressing municipal revenue generation challenges.
Some of the key points from the circular:
The tabled 2017/18 MTREF budget & IDP will be assessed in March 2017 for mSCOA
compliance.
With regards to the Integrated Development Plan (IDP):
IDP should be drafted taking into account key global and national policies and priorities
including the Sustainable Development Goals, the NDP, the Integrated Urban
Development Framework and the Back-to-Basics Programme
IDP should reflect catalytic programmes and projects to be implemented by all spheres
as well as SOE.
On the Revenue Budget, municipalities to maintain tariff increases:
at levels that reflect appropriate balance between affordability and sustainability
and increases higher than CPI to be justified
Attention to differential incidence of tariff increases across all consumer groups
On funding choices and management issues, with the current declining trend of the
ability of customers to pay for services, municipalities must consider:
o effectiveness of revenue management processes and procedures
o pay special attention to cost containment measures
o the affordability of providing FBS to all households
o curb consumption of Water and Electricity by indigents, not to exceed their
allocation
Annexure 12 – Overview of budget assumptions applied to the 2017/18 MTREF required to be included in Annexure 11 (IDP)
4
b) National Treasury MFMA circular No. 86 issued March 2017
The key focus of the circular is the implementation of municipal Standard Chart of Accounts
(mSCOA) and the grant allocations as per the 2017 Budget Review.
Some of the key points from the circular:
Local government conditional grants and additional allocations as per the Division of
Revenue Bill to be included in municipalities budgets
The impact of the updated Eskom bulk tariff increases to be included in the municipalities
budgets
mSCOA compliance in respect of the tabled 2017/18 MTREF and IDP submission required
the data string uploaded to the LG Database portal to meet the following requirements:
no mapping;
correct us of all segments;
seamless integration of core system with sub-systems
integrated budgeting facility directly linked to the IDP and SDBIP facilities on the
system
c) Updated MFMA Circular 82 on Cost Containment measures were also issued and considered in the preparation of the 2017/18 budget. the amendment refers to rates set for domestic hotel accommodation and flights
d) Various mSCOA circulars have been issued in the 2016/17 financial year to prepare municipalities in ensuring compliance at the prescribed dates.
e) The latest Division of Revenue Bill information was incorporated in the 2017/18 budget to be tabled.
Expenditure analysis – a three-year preview
The City adopted a differentiated budgeting approach for the 2017/18 MTREF. The principles
of cost containment and elimination of wasteful expenditure, reprioritisation of spending and
attainment of savings were the technical themes of the budget. The approach in differentiation
was supported by expenditure trends and considering impending needs to support City
strategy.
The following assumptions and parameters were made in the drafting of the 2017/18 MTREF:
a) General inflation outlook and its impact on municipal activities CPI projected for the City is 5.7% for 2017/18 and 5.5% for the two outer years of the
MTREF period. These projections are based on the BER and are lower than National
Treasury’s projections of 6.4% for the 2017/18 financial year. These levels are within the
South African Reserve Bank (SARB) inflation targeting range of between 3% to 6% range.
b) Contracted Services, Overtime and Operational Cost
A differentiated approach in applying parameters to expenditure elements in the
abovementioned categories were introduced in the 2017/18 MTREF.

Annexure 12 – Overview of budget assumptions applied to the 2017/18 MTREF required to be included in Annexure 11 (IDP)
5
This included the reduction of the 2016/17 base on some elements and CPI or no growth
for the 2017/18 financial year. The differentiated was based on the nature of the work that
the service provides and expenditure trends.
c) Interest rates for borrowing and investment of funds Borrowing interest rates are factored in at a rate of 12% over the 2017/18 MTREF and an
average investment rate of 7% is forecast over the 2017/18 MTREF period.
d) Collection rate for Property Rates and Service charges In accordance with relevant legislation and national directives, the City’s projected revenue
recovery rates are based on realistic and sustainable trends. In calculating the debt
impairment, the following collection rates were applied to Property Rates and Service
charges:
Table 1 Collection Rates
The Electricity collection rate remains constant at 98% over the 2017/18 MTREF. This is
mainly attributed to the vigorous implementation of prepaid meters and the revenue protection
initiative.
It is projected that the Refuse collection rate will improve from 92% in 2016/17 to 93% over
the 2017/18 MTREF. This is due to ongoing debt management initiatives implemented.
Water and Sanitation actual collection rate outcome over the past years was lower than
anticipated. The budgeted collection rate for both Water and Sanitation was therefore reduced
to more realistic rates for the 2017/18 MTREF. The projected collection rate for Water is 82%
and Sanitation is 86% over the MTREF period.
The Property Rates collection rate is projected to remain at 96% this is supported by previous
years’ outcomes.
e) Salary increases Salaries, wages and related staff cost expenses
The three-year salary and wage collective agreement concluded in 2015 comes to an end in
the 2017/18 financial year.
In terms of the agreement, the salary and wage increases are to be annually calculated for all
three years using the average CPI for the period 1 February of the previous year to 31 January
of the forecasted budget year + 1%. This formula was used in determining the staff cost
provisions of the MTREF. In addition, provision was made for an incremental allowance of 2%
to cater for performance and other notch increases.
ServiceBase Budget
2016/17
Budget Year
2017/18
Budget Year +1
2018/19
Budget Year +2
2019/20
Rates 96.00% 96.00% 96.00% 96.00%
Electricity 98.00% 98.00% 98.00% 98.00%
Water 88.00% 82.00% 82.00% 82.00%
Sanitation 89.00% 86.00% 86.00% 86.00%
Refuse 92.00% 93.00% 93.00% 93.00%
Annexure 12 – Overview of budget assumptions applied to the 2017/18 MTREF required to be included in Annexure 11 (IDP)
6
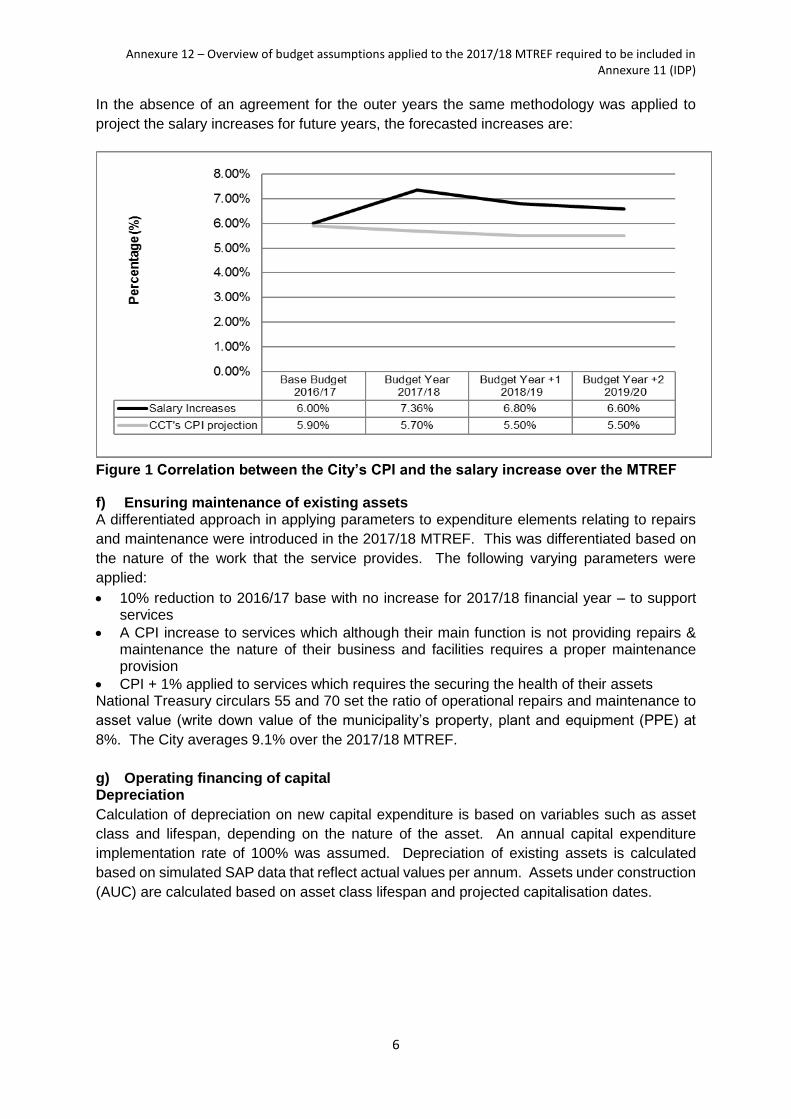
In the absence of an agreement for the outer years the same methodology was applied to
project the salary increases for future years, the forecasted increases are:
Figure 1 Correlation between the City’s CPI and the salary increase over the MTREF
f) Ensuring maintenance of existing assets A differentiated approach in applying parameters to expenditure elements relating to repairs
and maintenance were introduced in the 2017/18 MTREF. This was differentiated based on
the nature of the work that the service provides. The following varying parameters were
applied:
10% reduction to 2016/17 base with no increase for 2017/18 financial year – to support services
A CPI increase to services which although their main function is not providing repairs & maintenance the nature of their business and facilities requires a proper maintenance provision
CPI + 1% applied to services which requires the securing the health of their assets National Treasury circulars 55 and 70 set the ratio of operational repairs and maintenance to
asset value (write down value of the municipality’s property, plant and equipment (PPE) at
8%. The City averages 9.1% over the 2017/18 MTREF.
g) Operating financing of capital Depreciation
Calculation of depreciation on new capital expenditure is based on variables such as asset
class and lifespan, depending on the nature of the asset. An annual capital expenditure
implementation rate of 100% was assumed. Depreciation of existing assets is calculated
based on simulated SAP data that reflect actual values per annum. Assets under construction
(AUC) are calculated based on asset class lifespan and projected capitalisation dates.
Annexure 12 – Overview of budget assumptions applied to the 2017/18 MTREF required to be included in Annexure 11 (IDP)
7
Borrowing and credit rating outlook
The City’s borrowing is done in terms of chapter 6 of the MFMA and the City’s borrowing
policy, where a long term loan will only be entered into if it’s affordable and sustainable. It is
influenced by the capital investment requirement over the 2017/18 MTREF. The City needs
a credit rating to demonstrate its ability to meet its short and long term financial obligations.
Potential lenders also use it to assess the City's credit risk, which in turn affects the pricing of
any subsequent loans taken. Factors used to evaluate the creditworthiness of municipalities
include the economy, debt, finances, politics, management and institutional framework.
On 4 April 2017, Moody's placed the City of Cape Town’s long-term global scale issuer rating
on review for downgrade. The decision reflects the close operational and financial linkages
between the national government and municipalities and follows the potential weakening of
the South African government's credit profile, in particular in the country’s institutional,
economic and fiscal strength, as captured by Moody's recent decision to place South Africa's
Baa2 government bond ratings on review for downgrade. The City of Cape Town’s national
scale ratings of Aaa.za/P-1.za were not affected by the action.
The City is rated at the high end of the range of South African municipalities rated by Moody's.
The City’s relative position reflects debt levels that are lower than the median of other
metropolitan cities. Cape Town compares favourably with the other metros in South Africa in
terms of budgetary performance and management, and displays robust cash holdings. The
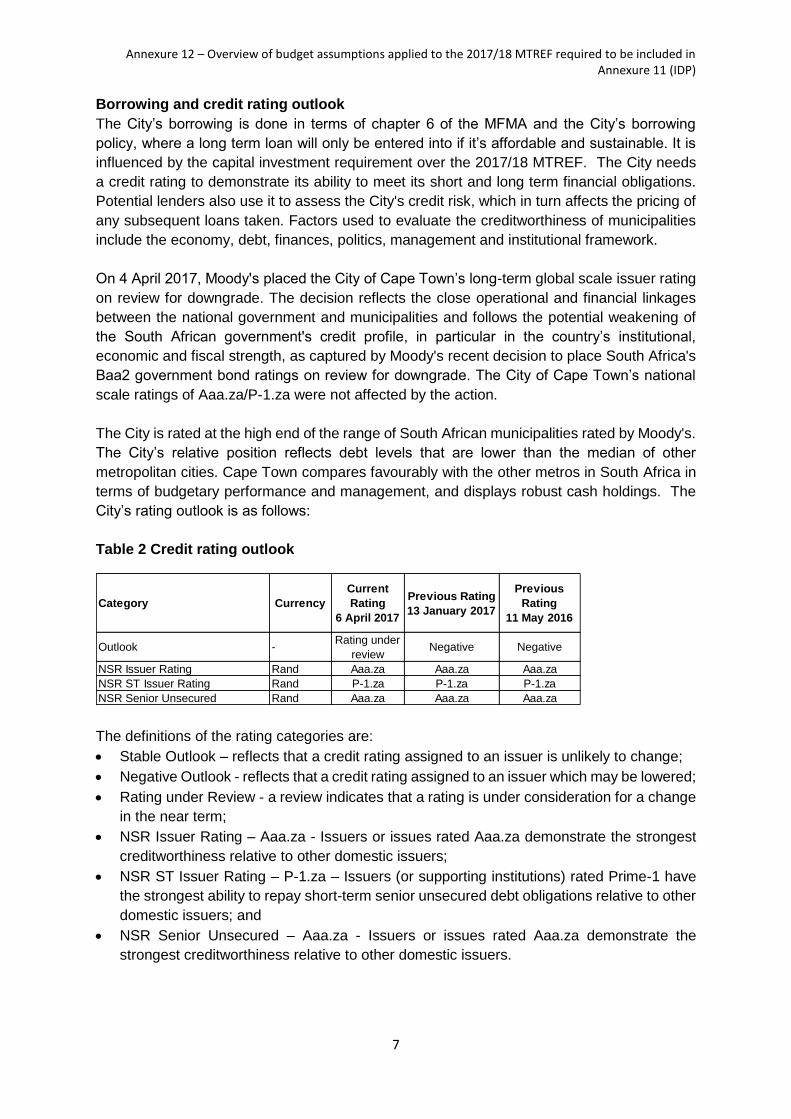
City’s rating outlook is as follows:
Table 2 Credit rating outlook
The definitions of the rating categories are:
Stable Outlook – reflects that a credit rating assigned to an issuer is unlikely to change;
Negative Outlook - reflects that a credit rating assigned to an issuer which may be lowered;
Rating under Review - a review indicates that a rating is under consideration for a change
in the near term;
NSR Issuer Rating – Aaa.za - Issuers or issues rated Aaa.za demonstrate the strongest
creditworthiness relative to other domestic issuers;
NSR ST Issuer Rating – P-1.za – Issuers (or supporting institutions) rated Prime-1 have
the strongest ability to repay short-term senior unsecured debt obligations relative to other
domestic issuers; and
NSR Senior Unsecured – Aaa.za - Issuers or issues rated Aaa.za demonstrate the
strongest creditworthiness relative to other domestic issuers.
Category Currency
Current
Rating
6 April 2017
Previous Rating
13 January 2017
Previous
Rating
11 May 2016
Outlook -Rating under
reviewNegative Negative
NSR Issuer Rating Rand Aaa.za Aaa.za Aaa.za
NSR ST Issuer Rating Rand P-1.za P-1.za P-1.za
NSR Senior Unsecured Rand Aaa.za Aaa.za Aaa.za
Annexure 12 – Overview of budget assumptions applied to the 2017/18 MTREF required to be included in Annexure 11 (IDP)
8
Capital investment
No further additional or consequential operational costs flowing from the City’s capital
investment programme were provided for. It is assumed that these will be catered for
via efficiency gains, revenue multiplying affects and the prioritisation of existing
operational resources.
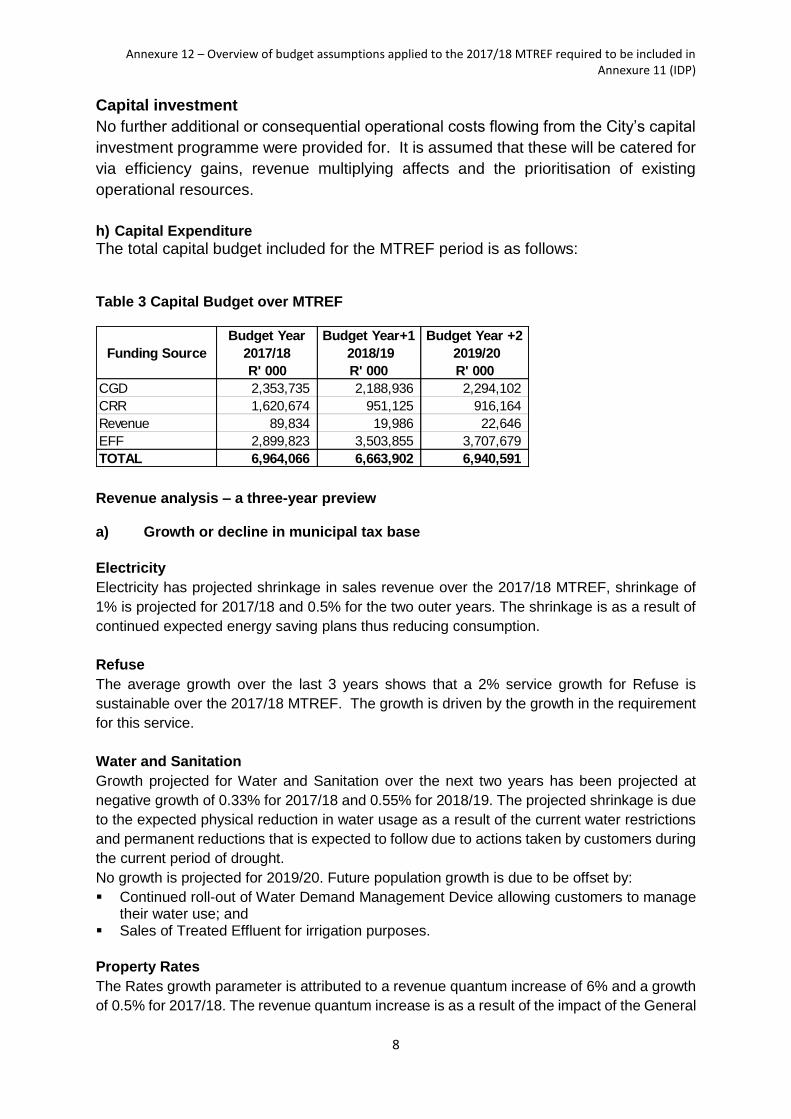
h) Capital Expenditure
The total capital budget included for the MTREF period is as follows:
Table 3 Capital Budget over MTREF
Revenue analysis – a three-year preview
a) Growth or decline in municipal tax base
Electricity
Electricity has projected shrinkage in sales revenue over the 2017/18 MTREF, shrinkage of
1% is projected for 2017/18 and 0.5% for the two outer years. The shrinkage is as a result of
continued expected energy saving plans thus reducing consumption.
Refuse
The average growth over the last 3 years shows that a 2% service growth for Refuse is
sustainable over the 2017/18 MTREF. The growth is driven by the growth in the requirement
for this service.
Water and Sanitation
Growth projected for Water and Sanitation over the next two years has been projected at
negative growth of 0.33% for 2017/18 and 0.55% for 2018/19. The projected shrinkage is due
to the expected physical reduction in water usage as a result of the current water restrictions
and permanent reductions that is expected to follow due to actions taken by customers during
the current period of drought.
No growth is projected for 2019/20. Future population growth is due to be offset by:
Continued roll-out of Water Demand Management Device allowing customers to manage their water use; and
Sales of Treated Effluent for irrigation purposes.
Property Rates
The Rates growth parameter is attributed to a revenue quantum increase of 6% and a growth
of 0.5% for 2017/18. The revenue quantum increase is as a result of the impact of the General
Funding Source
Budget Year
2017/18
R' 000
Budget Year+1
2018/19
R' 000
Budget Year +2
2019/20
R' 000
CGD 2,353,735 2,188,936 2,294,102
CRR 1,620,674 951,125 916,164
Revenue 89,834 19,986 22,646
EFF 2,899,823 3,503,855 3,707,679
TOTAL 6,964,066 6,663,902 6,940,591

Annexure 12 – Overview of budget assumptions applied to the 2017/18 MTREF required to be included in Annexure 11 (IDP)
9
Valuation, the over provision of objections and the benefit of the implementation of real time
supplemental valuations. The growth in property value is expected to be 0.5% over the MTREF
period.
b) Major tariffs and charges: Rates and Trading services
The adverse impact of the current economic climate, the demand for new and upgraded
infrastructure, savings initiates and lower demand for services made tariff increases at higher-
than-CPI levels inevitable.
National Treasury Circular 85 of December 2016 stated the following: “National Treasury
encourages municipalities to maintain tariff increases at levels that reflect an appropriate
balance between the affordability to poorer households and other customers while ensuring
the financial sustainability of the municipality. The Consumer Price Index (CPI) inflation has
however breached the upper limit of the 3 to 6 per cent target band; therefore, municipalities
are now required to justify all increases in excess of the 6.1 per cent projected inflation target
in their budget narratives, and pay careful attention to the differential incidence of tariff
increases across all consumer groups”.
The circular also requires municipalities to ensure that any drought penalty tariffs are provided
for in their tariff policy and / or to incorporate the penalty tariffs in the Inclining Block Tariff
(IBT) structure. With the City being in the throes of a disaster due to the drought conditions,
restriction tariffs have already been implemented in the 2016/17 financial year and will
continue into the 2017/18 financial year.
In addition, National Treasury encourages municipalities to ensure tariffs that are cost-
reflective. The City has therefore included the following revenue increases in the 2017/18
MTREF:
Figure 2 Revenue parameters for 2017/18 MTREF period
Annexure 12 – Overview of budget assumptions applied to the 2017/18 MTREF required to be included in Annexure 11 (IDP)
10
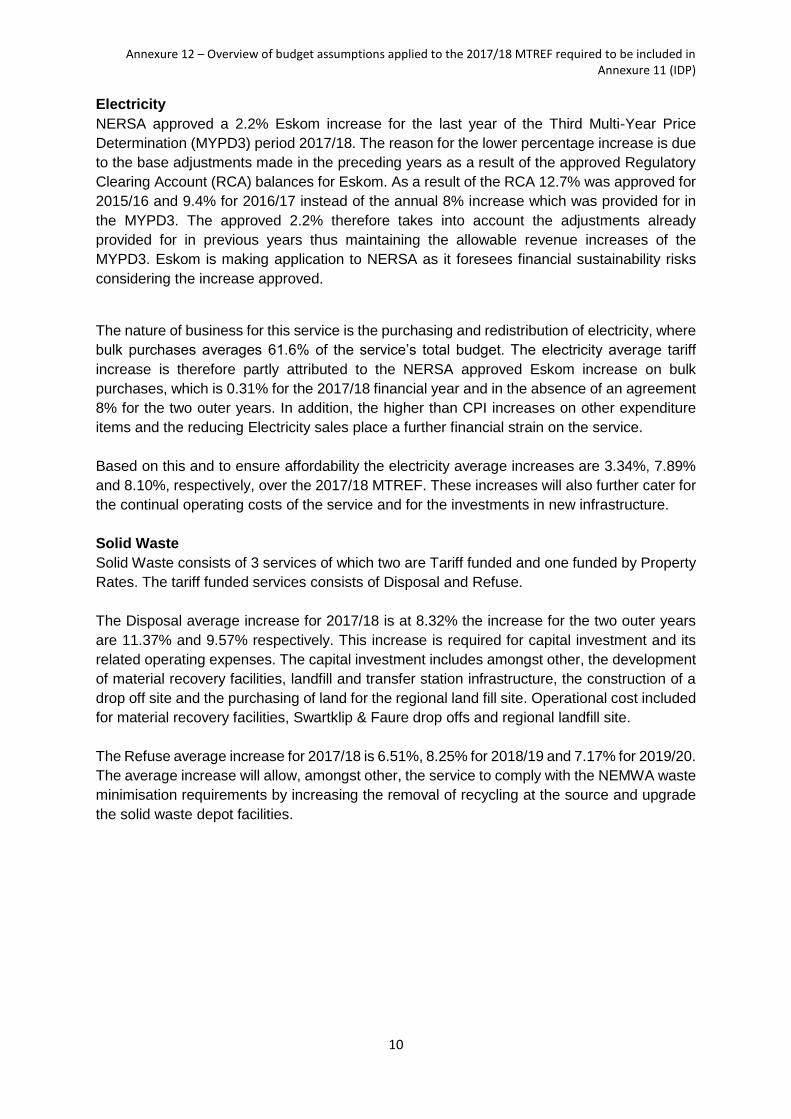
Electricity
NERSA approved a 2.2% Eskom increase for the last year of the Third Multi-Year Price
Determination (MYPD3) period 2017/18. The reason for the lower percentage increase is due
to the base adjustments made in the preceding years as a result of the approved Regulatory
Clearing Account (RCA) balances for Eskom. As a result of the RCA 12.7% was approved for
2015/16 and 9.4% for 2016/17 instead of the annual 8% increase which was provided for in
the MYPD3. The approved 2.2% therefore takes into account the adjustments already
provided for in previous years thus maintaining the allowable revenue increases of the
MYPD3. Eskom is making application to NERSA as it foresees financial sustainability risks
considering the increase approved.
The nature of business for this service is the purchasing and redistribution of electricity, where
bulk purchases averages 61.6% of the service’s total budget. The electricity average tariff
increase is therefore partly attributed to the NERSA approved Eskom increase on bulk
purchases, which is 0.31% for the 2017/18 financial year and in the absence of an agreement
8% for the two outer years. In addition, the higher than CPI increases on other expenditure
items and the reducing Electricity sales place a further financial strain on the service.
Based on this and to ensure affordability the electricity average increases are 3.34%, 7.89%
and 8.10%, respectively, over the 2017/18 MTREF. These increases will also further cater for
the continual operating costs of the service and for the investments in new infrastructure.
Solid Waste
Solid Waste consists of 3 services of which two are Tariff funded and one funded by Property
Rates. The tariff funded services consists of Disposal and Refuse.
The Disposal average increase for 2017/18 is at 8.32% the increase for the two outer years
are 11.37% and 9.57% respectively. This increase is required for capital investment and its
related operating expenses. The capital investment includes amongst other, the development
of material recovery facilities, landfill and transfer station infrastructure, the construction of a
drop off site and the purchasing of land for the regional land fill site. Operational cost included
for material recovery facilities, Swartklip & Faure drop offs and regional landfill site.
The Refuse average increase for 2017/18 is 6.51%, 8.25% for 2018/19 and 7.17% for 2019/20.
The average increase will allow, amongst other, the service to comply with the NEMWA waste
minimisation requirements by increasing the removal of recycling at the source and upgrade
the solid waste depot facilities.

Annexure 12 – Overview of budget assumptions applied to the 2017/18 MTREF required to be included in Annexure 11 (IDP)
11
Water and Sanitation
In light of MFMA Circular 85, current drought condition experienced and other budgetary
requirements the Water and Sanitation average increases are set at 19.25% for 2017/18,
12.07% for 2018/19 and 11.07% for 2019/20. The higher than CPI increases is due to various
factors, including:
Continuing aggressive capital programmes to ensure water security, implementation of
augmentation schemes, extensions to wastewater treatment plants, appropriate capacity
levels and asset replacements programmes to ensure proper asset management;
The lower collection ratio;
The anticipated shrinkage in sales; and
Acceleration of the repairs and maintenance programme as well as staffing strategy to
ensure that service delivery and responsiveness expectations are met.
In addition, due to the current climatic conditions, Water and Sanitation is recommending level
4 restriction tariff for the 2017/18 Operating Budget submission to Council in May 2017. The
revenue neutral status has been maintained. Should additional funding materialise, this will
be earmarked for once-off emergency expenditure, potential impact of the increases on the
collection rate as well as Contribution to Capital Replacement Reserve (CRR) to fund future
capital programmes.
Finally, to buffer the average increases the free basic Water and Sanitation allocation currently
provided to non-indigent customers have been discontinued. The pricing for step 1 of the
Domestic category will be phased in over the next two years.
Property Rates
An average Property Rates increase of 5% is proposed for the 2017/18 financial year with an
increase of 6% proposed for the two outer years. This lower than CPI increase is as a result
of the increase in the Property Rates revenue quantum achieved with the 2015 General
valuation and supplemental valuations. The increase allows for recurring operating costs,
budget realities and investments in new infrastructure for Rates funded services.
Housing rental (Council rental properties)
The monthly rental charge for the City’s housing rental properties is based on a rate per square
meter applied to the size of the unit being rented coupled with a set of premiums/deductions
based on the location, maintenance level, facilities et al of the specific property for which the
rent is charged.
Through addressing the economic challenges faced by many poorer communities residing in,
particularly, the City’s rental stock, the average total monthly rental charge percentage
increase associated with the City’s rental properties has been retained at an affordable level
and is based on an annual increase of 6.25% (where the unit has a separate water meter) or
10.40% (for those units which include water in the rental charge) for 2017/18.
The annual rental charge percentage increase, acknowledging the ongoing multi-year
implications of inflation on the costs associated with the management of rental properties
including, inter alia, maintenance of the properties, administrative costs is not directly aligned
to the full economic cost of operating the rental units and operates on a City of Cape Town

Annexure 12 – Overview of budget assumptions applied to the 2017/18 MTREF required to be included in Annexure 11 (IDP)
12
subsidized basis for the financial differential between the economic cost recovery based rental
(CPI linked) and the actual amount charged.
Tenants who were in occupation of the City’s rental properties in 2007 receive a subsidy of
20% of the rental charge being the final portion of the phase out program which was not fully
implemented by the City to facilitate affordability of long standing tenants. This key initiative,
reflected within the City’s Housing Debt Management Policy, supports affordable rentals to
many poor communities and supports the City’s initiatives in terms of its housing debt
collection drives whilst supporting the City’s housing debtor book that it does not unduly
increase due to, potentially, unreachable charges.
The proposed 2017/18 housing rental charge is in line with previous annual rental increases
and is again aimed at ensuring affordability for the City’s poorer communities. The rental rate
(per square meter per month) is R9.69 (where the unit has a separate water meter) or a rental
charge (including water charge where applicable) of R14.76 per square meter per month.
The City’s housing premiums and deductions charge structure addressing the variations in the
City’s diverse rental properties remains as follows:
Discounts on account
• Outside toilet (R20 per month)
• External Water (R30 per month)
• No ceiling (R15 per month)
Premiums on account
• Saleable unit (R4,50 per month)
• Well maintained (R5 per month)
• Local environment (R3,50 per month)
• Well located (R5 per month)
• Hot water cylinder (R4 per month).
A surcharge for tenants earning a monthly income above the rental income threshold (R3 500)
is charged as follows at a stepped rate of 8% for those earning R3 501 – R7 500 and 10% for
those earning R7 501 – R10 000. Tenants who earn more than R10 000 per month will pay a
surcharge of 25% of any amount above R10 000. A two (2) year lease agreement will be
signed which will not be renewed if the income remains more than R10 000.
2017 Division of Revenue Bill
Equitable Share
The reviewed Equitable Share formula provide a subsidy for the provision of free basic water,
electricity, sanitation and refuse removal services for the poor. It also provides funds for the
institutional costs of municipalities and a community services component which provides
funding towards the provision of core municipal services not included under basic services.
To ensure that the funds for institutional costs and non-trading services are targeted at poorer
municipalities, the formula applies a revenue-adjustment factor reflecting municipalities’ ability
to generate their own revenue. The revised formula used data from the 2011 Census which
are to be updated annually to reflect estimates of population growth and projected increases
in the cost of services such as water and electricity.

Annexure 12 – Overview of budget assumptions applied to the 2017/18 MTREF required to be included in Annexure 11 (IDP)
13
Equitable share provisions included in the budget are based on the 2017 Division of
Revenue Bill. The following equitable share amounts were allocated to the City:
2017/18 - R2.293 billion
2018/19 - R2.582 billion
2019/20 - R2.836 billion
Fuel levy
The general fuel levy is legislated by the Taxation Laws Amendment Act, Act 17 of 2009 which
provides that each metro’s share should be announced in the Government Gazette. The
amounts in respect of fuel levy sharing for each metro are therefore published annually by way
of a notice in the Government Gazette.
The fuel levy allocation is based on the latest available fuel sales figures within the jurisdiction
of the City as a metro. The following amounts were allocated to the City as per the 2017/18
allocation letter received from National Treasury:
2017/18 - R2.418 billion
2018/19 - R2.617 billion
2019/20 - R2.825 billion
Annexure 12 – Overview of budget assumptions applied to the 2017/18 MTREF required to be included in Annexure 11 (IDP)
14
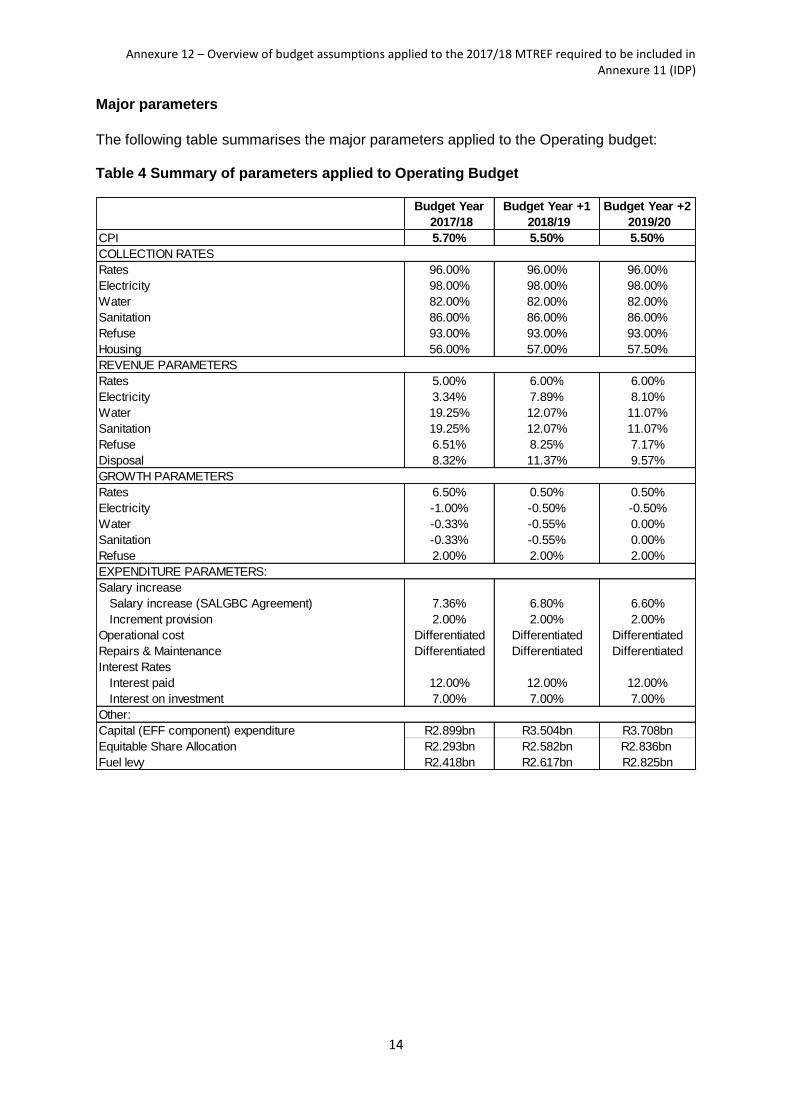
Major parameters
The following table summarises the major parameters applied to the Operating budget: Table 4 Summary of parameters applied to Operating Budget
Budget Year
2017/18
Budget Year +1
2018/19
Budget Year +2
2019/20
CPI 5.70% 5.50% 5.50%
COLLECTION RATES
Rates 96.00% 96.00% 96.00%
Electricity 98.00% 98.00% 98.00%
Water 82.00% 82.00% 82.00%
Sanitation 86.00% 86.00% 86.00%
Refuse 93.00% 93.00% 93.00%
Housing 56.00% 57.00% 57.50%
REVENUE PARAMETERS
Rates 5.00% 6.00% 6.00%
Electricity 3.34% 7.89% 8.10%
Water 19.25% 12.07% 11.07%
Sanitation 19.25% 12.07% 11.07%
Refuse 6.51% 8.25% 7.17%
Disposal 8.32% 11.37% 9.57%
GROWTH PARAMETERS
Rates 6.50% 0.50% 0.50%
Electricity -1.00% -0.50% -0.50%
Water -0.33% -0.55% 0.00%
Sanitation -0.33% -0.55% 0.00%
Refuse 2.00% 2.00% 2.00%
EXPENDITURE PARAMETERS:
Salary increase
Salary increase (SALGBC Agreement) 7.36% 6.80% 6.60%
Increment provision 2.00% 2.00% 2.00%
Operational cost Differentiated Differentiated Differentiated
Repairs & Maintenance Differentiated Differentiated Differentiated
Interest Rates
Interest paid 12.00% 12.00% 12.00%
Interest on investment 7.00% 7.00% 7.00%
Other:
Capital (EFF component) expenditure R2.899bn R3.504bn R3.708bn
Equitable Share Allocation R2.293bn R2.582bn R2.836bn
Fuel levy R2.418bn R2.617bn R2.825bn