Estudio de Factibilidad de Langostino de Mar - Litopenaeus Vannamei

Intensive production and preliminary economic analyses from growing Litopenaeus vannamei in limited discharge biofloc-dominated greenhouse-
enclosed raceways
Tzachi M. Samocha1, André Braga2, Timothy C. Morris1, Vita Magalhães2, Tim Markey3, Bob Advent4, and Terry Hanson5
1 Texas AgriLife Research Mariculture Lab at Flour Bluff, Corpus Christi, Texas 2 Universidade Federal do Rio Grande, RS, Brazil
3 Zeigler Bros., Gardners, Pennsylvania
4 a3 All Aqua Aeration, Orlando, Florida 5 Auburn University Department of Fisheries and Allied Aquaculture, Auburn, Alabama
FENACAM 2013 June 11-13, 2013, Natal, Brazil

Nursery Systems’ Benefits Use of a nursery can provides better survival,
facility utilization, control over predators, water quality, growth and feed utilization while reducing grow-out cycle by 20-30 d compare to direct stocking
Producers in Ecuador, Mexico and other areas affected by WSSV reported good shrimp survival when PL are kept in water temp. >32C
In temperate climate greenhouse-enclosed nursery systems can increase the number of shrimp crops/year

Use of Limited Discharge Practices Studies showed that the L. vannamei can be
cultured with reduced water exchange without adverse affect on the growth, survival and yield
In limited discharge systems, shrimp depend on commercial feed as the primary source of food
Microbial communities in these systems can serve as a source of single cell protein that provides supplemental food source
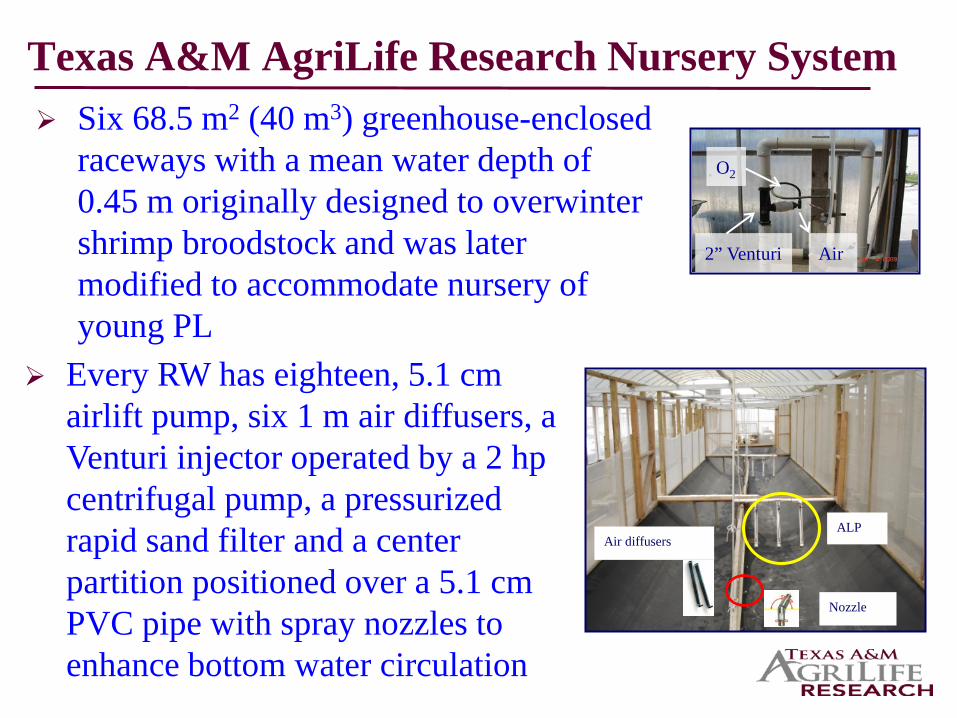
Texas A&M AgriLife Research Nursery System Six 68.5 m2 (40 m3) greenhouse-enclosed
raceways with a mean water depth of 0.45 m originally designed to overwinter shrimp broodstock and was later modified to accommodate nursery of young PL
ALP
Nozzle
Air diffusers
Every RW has eighteen, 5.1 cm airlift pump, six 1 m air diffusers, a Venturi injector operated by a 2 hp centrifugal pump, a pressurized rapid sand filter and a center partition positioned over a 5.1 cm PVC pipe with spray nozzles to enhance bottom water circulation
2” Venturi
O2
Air

40 m3 Raceway in operation - note the color of water and the the floating bioflocs
Texas A & M AgriLife Research Mariculture Laboratory, Corpus Christi, TX, USA

The AgriLife Research Early Nursery Studies Cohen et al. (2005) stocked (3,300 PL/m3) in 2 RWs
in a 50-d trial with low water exchange (1.1%/d) and found that shrimp exposure to high nitrite levels (up to 26 mg/L) for 2 wks had no adverse effect on shrimp survival (>98%), growth (1.1 g juveniles), FCR (<1), and yields (>4 kg/m3)
The exposure had no adverse effect on growth and survival of the shrimp in the grow-out phase as good growth (1.32 g/wk with 21.2 g av. wt. after 106 d) and survival (80%) were reported when the shrimp were stocked (50/m2) in HDPE-lined outdoor ponds operated under limited water discharge

The AgriLife Research Nursery System Mishra et al. (2008) compared two methods of suspended-solids
removal (sand filtration and foam fractionator) and their effect of on system performance
In their 71-d study, four RWs were stocked with L. vannamei at a density of about 4,000 PL4-5/m3
Two RWs were equipped with FF and were operated with water exchange of 3.35%/d while the other two were operated with no FF and water exchange of 9.37%/d
Treatment Wto (mg)
Wtf (g)
Yield (kg/m3)
Survival (%) FCR
FF-2 1 0.6 1.91 a 3 7.64 a 100 a 0.97 a FF-3 1 0.6 2.00 a 6.89 a 92.4 a 1.08 a WE-1 2 0.6 1.73 b 3.92 b 55.9 1.64 a WE-4 2 0.6 1.43 b 4.74 b 81.8 a 1.36 a

2009 Nursery Trial (Correia et al., 2010) This 62-d study (5,000 PL10-12/m3) evaluated the effect of high and low protein
feed on growth, survival and selected WQ indicators and the potential use of molasses to prevent ammonia & nitrite build up under no exchange
Molasses (24% C): Day 10-18: 500 mL every other day; from Day 19 on, molasses supplementation targeted conversion of ammonia to bacteria biomass assuming each 1 g of TAN requires 6 g of C
Each RW was equipped with inline DO monitoring system (YSI 5200 system)

Variables 30% CP 40% CP
Final weight (g) 0.94a ± 0.00 1.03a ± 0.02
Survival (%) 82.3a ±11.26 84.1a ±6.07
FCR 0.91a ± 0.05 0.82a ± 0.05
Yield (kg/m³) 3.70a ± 0.49 4.18a ± 0.23
Significantly higher nitrate levels in the high-protein diet Molasses can be used to enhance development of bacterial floc
and to prevent ammonia build up in the culture medium Molasses was not effective in preventing nitrite build up DO monitoring was very useful in feed management
2009 Nursery Trial (Correia et al., 2010)

Use of intensive nursery system in commercial operations

Loma Alta Aquaculture San Perlita, TX Pond-side greenhouse-enclosed
nursery in low salinity water (2-3 ppt) to avoid dragonfly predation
10,000-5,000 PL10-12/m3; Av. Survival: 80-97%; Av. wt: 0.1-0.25 g (30-35 d); FCR: 0.7-1.0
Survival in grow-out ponds stocked with juveniles from the nursery RWs was higher than direct stocking (71% vs. 50%)
The farm benefitted from off-season lower PL cost
Stocking the grow-out ponds with juveniles, provided the farm with competitive edge as shrimp were harvested before any other farms

Nursery RWs Ocean Boy, FL, USA – Inland low salinity
300 m3 nursery RWs stocked with PL8-10 at 4-22 PL/L; 20-64 d cycle; shrimp were stocked in tanks filled with diluted NSW (25 ppt) filled to one fourth the working volume; acclimation to 2 ppt over 2 wks; water exchange when TAN or NO2-N exceed 1.0 and 0.5 mg/L, respectively
Survival: 44-99%; FCR: 0.7-1.4; Av. wt: 15-910 mg;
Pond-side RW
Central Nursery Site

Inland freshwater (<1 ppt): Primary Nursery in greenhouse-enclosed 30 m3 tanks, NSW chlorinated to 20 ppm, slow acclimation transfer at 0.01 g into 1 ha covered lined/earthen greenhouse-enclosed pond
for Secondary Nursery at 1,400/m2 (20 hp/ha – PW)

Ecuador Nursery System Farms use nursery raceways to enable stocking of
larger shrimp which reduces the grow-out cycle duration and provides more crops/year
Stocking 60-70 PL10-12/L or less kept for 10-15 days Most “RWs” are 30-100 m3 HDPE-lined Aeration by perforated PVC pipes or air stones Most structures are under greenhouses Supplemental heating sometime is provided with
flexible black plastic piping connected to a boiler Water exchange start with 10%-15%/d and increased
according to WQ and waste buildup
Info provided by Mr. Juan Aguire

# Vol. Tot. PLs Tot Juv. PL/L Sur. Av. Wt. Load FCR Cycle TKs m3 Stocked Harvested (%) (g) kg/m3 (d) 38 91 79.8 x 10⁶ 71 x 106 21 89 0.092 1.87 1.04 29
Intensive Nursery AQUASOLES, Sonora
Important factors to be considered: Optimal DO (airstones, air diffusers, O2 vs. Venturi), mixing (use of airlift pumps), feed & feed management, carbon supplement,
control of SS, TSS, pH, alkalinity, temperature

Genitech Intensive Nursery: 5 PL18/L, 3 hp pump, two 86 m3 circular TKs each with two a3 All Aqua injectors, AeroTube air diffusers & 7 hp air blower
Note: water circulation was initiated at PL23
Vol. PL Feed/d Temp. DO Alka. NH3-N TAN NO2-N NO3-N Av. Wt. Bio. Bio.(m3) age PRO-W Efinol Hatcheries (g) (C) (mg/L) (mg/L) (mg/L) (mg/L) (mg/L) (mg/L) (g) (kg) (kg/m3)
0 4/16/11 86 18 180 180 400 AQUAXEL 300-600 100 27.5 7.8 0.016 6.8 0.0791 4/17/11 86 19 180 180 1,550 AQUAXEL 300-600 100 28.5 6.22 4/18/11 86 20 180 180 1,800 AQUAXEL 800 100 28.3 6.1 0.037 15.7 0.1833 4/19/11 86 21 180 180 1,800 AQUAXEL 800 100 29.5 6.3. . . . . . . . . . . . . . . . . . . . . .
23 5/9/11 86 41 0 270 270 13,200 VIMIFOS MIGAJA 1/VIMIFOS RACEW. 50 / 50 31.1 4.2 255 7.3 0.13 7.90 0.10 3.10 0.424 180.2 2.09524 5/10/11 86 42 0 450 450 13,200 VIMIFOS MIGAJA 1/VIMIFOS RACEW. 50 / 50 30.7 4.2 225 7.3 0.09 4.50 1.09 4.3025 5/11/11 86 43 0 450 450 13,200 VIMIFOS MIGAJA 1/VIMIFOS RACEW. 50 / 50 30.3 4.5 285 7.4 0.05 2.40 2.80 3.8026 5/12/11 86 44 0 450 450 13,200 VIM. MIJ 1/ EPACK NL / STRES P. 8/12 60 / 20 /20 27.6 4.8 200 7.5 0.13 5.60 1.18 4.50 0.52 221.0 2.57027 5/13/11 90 45 0 0 0 6,000 VIMIFOS MIGAJA 1 / EPACK NL 70 / 30 26.8 4.9 265 7.7 0.14 3.70 1.13 0.20 0.644 222.9 2.590
TK 3 Stocking: 425,000 PL18 Density: 5 PL/L Survival: 0.81% FCR 0.73 Final Weight: 0.644 g Yield: 2.59 kg/m3
0 4/16/11 90 18 180 180 400 AQUAXEL 300-600 100 27.1 7.9 0.016 6.8 0.081 4/17/11 90 19 180 180 1,550 AQUAXEL 300-600 100 28.5 6.52 4/18/11 90 20 180 180 1,800 AQUAXEL 800 100 28.3 6.5 0.031 13.2 0.153 4/19/11 90 21 180 180 1,800 AQUAXEL 800 100 29.4 6.1. . . . . . . . . . . . . . . . . . . . . .
23 5/9/11 90 41 0 270 270 13,200 VIMIFOS MIGAJA 1/VIMIFOS RACEW. 50 / 50 30.9 4.6 245 7.3 0.13 6.80 0.26 3.40 0.422 179.4 2.0924 5/10/11 90 42 0 450 450 13,200 VIMIFOS MIGAJA 1/VIMIFOS RACEW. 50 / 50 30.7 4.5 230 7.3 0.04 2.20 0.95 2.6025 5/11/11 90 43 0 450 450 13,200 VIMIFOS MIGAJA 1/VIMIFOS RACEW. 50 / 50 30.2 4.5 240 7.4 0.05 2.40 2.37 1.2026 5/12/11 90 44 0 450 450 13,200 VIM. MIJ 1/ EPACK NL / STRES P. 8/12 60 / 20 /20 26.5 4.9 185 7.5 0.17 7.10 0.50 4.5027 5/13/11 90 45 0 0 0 13,200 VIMIFOS MIGAJA 1 / EPACK NL 70 / 30 27.2 4.7 210 7.3 0.12 7.00 0.82 0.80 0.545 231.6 2.6928 5/14/11 90 46 0 0 0 12,600 VIMIFOS MIGAJA 1 / EPACK NL 70 / 30 26.7 4.6 230 7.3 0.08 5.10 0.99 0.7529 5/15/11 90 46 0 0 0 12,600 VIMIFOS MIGAJA 1 / EPACK NL 71 / 30 26.5 4.8 0.707 221.7 2.58
TK 4 Stocking: 425,000 PL18 Density: 5 PL/L Survival: 0.74% FCR 0.88 Final Weight: 0.707 g Yield: 2.58 kg/m3
pHDOC Date Feed PropProbiotics (g)

Forty 100 m3 (1st Stage) & Sixty 330 m3 (2nd Stage) RWs Hainan, China

Grow-out Systems Recent advances in super-intensive, limited-
discharge, biofloc systems for the culture of Litopenaeus vannamei, suggest that these systems can be profitable when used to produce live or fresh (never frozen) shrimp for niche markets
Researchers, supported in part by the United States Marine Shrimp Farming Program have been working to improve system efficiency and make this technology economically viable

Grow-out Systems These systems offer improved biosecurity with
reduced risk of crop losses to viral diseases Furthermore, operating these systems with no
water exchange minimizes the negative impact from effluent on receiving waters
Use of greenhouse-enclosed super-intensive limited discharge biofloc systems can potentially: Reduce water usage and effluent discharge Increase biosecurity Be constructed close to markets

Grow-out Systems Super-Intensive
These systems require substantial inputs to satisfy the high oxygen demand of the shrimp and the microbial communities
Performance is improve when these systems are equipped with automation for environmental and water quality control

Grow-out Systems Previous studies at the Texas A&M AgriLife
Research Mariculture Lab have utilized a combination of a pump driven Venturi injectors, airlifts & air diffusers to provide adequate DO and mixing
Recently we began looking into a non-Venturi alternative currently used in several wastewater treatment facilities in Florida
This technology may be successfully transferred to biofloc systems and other types of aquaculture

According to the manufacturer these pump-driven nozzles are capable of providing a 3:1 air to water ratio
In contrast, our current Venturi system provides a ratio of < 1:1 and requires supplementation of O2 to at high biomass loading (>7-8 kg/m3)
A 106 d study conducted in 2011 in two 100 m3 RWs stocked at 390 shrimp/ m3 produced 25 g shrimp at 8.4 kg/m3 with weekly growth of 1.46 g/wk, survival of 83%, and FCR of 1.7
Home-made foam fractionators and settling tanks were used to control solids
New Concepts in Grow-out

2012 Study Objectives – 100 m3 RWs Evaluate the ability of the a3 nozzles to maintain
adequate mixing of the biofloc and eliminate the use of pure oxygen
Evaluate the effect of the a3 nozzles on the shrimp Determine if the foam fractionators (FFs) and settling
tanks (STs) can control particulate matter & dissolved organics in the culture medium despite the anticipated increase in loading in biomass, and feed input
Determine the benefit from using inline YSI 5200 DO monitoring system
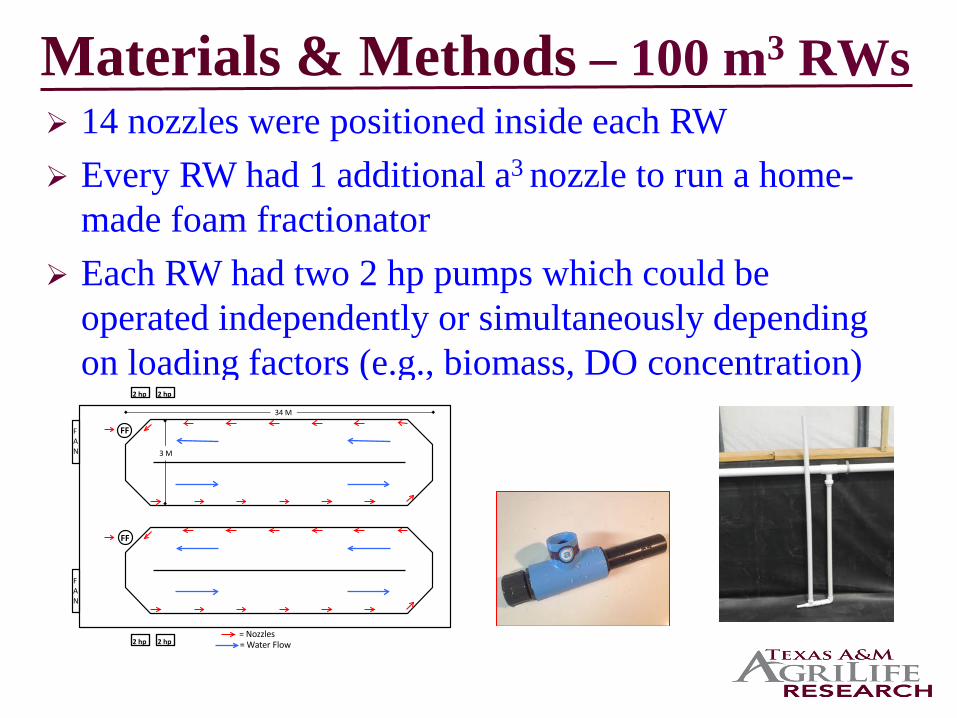
Materials & Methods – 100 m3 RWs 14 nozzles were positioned inside each RW Every RW had 1 additional a3 nozzle to run a home-
made foam fractionator Each RW had two 2 hp pumps which could be
operated independently or simultaneously depending on loading factors (e.g., biomass, DO concentration)
= Nozzles
34 M
FAN
FAN
3 M
FF
2 hp
FF
= Water Flow2 hp
2 hp 2 hp

Materials & Methods – 100 m3 RWs Foam fractionator Home-made foam fractionator (≈ 0.30 m in
diameter and ≈ 2 m tall) operated with one nozzle at a flow rate ≈ 28 Lpm Settling Tank Conical tank 2 m3, flow rate 8.5- 20 Lpm,
supplied from a side-loop off aeration pump and land application of sludge

Materials & Methods – 100 m3 RWs A 63 d study in two 100 m3 RWs filled with a mixture
of seawater, freshwater, and biofloc-rich water from a previous study
Municipal FW served to offset losses to evaporation & solids removal
RWs stocked with juveniles (3.6 g) at 500/m3 originated from a cross of Taura Resistant and Fast-Growth genetic lines (SIS Islamorada, FL)
Fed a 35% CP feed (HI-35, Zeigler Bros., Gardners, PA) Feed was delivered by belt feeders 24h/day

Materials & Methods – 100 m3 RWs Temperature, salinity, dissolved oxygen, and pH were
recorded twice daily Settleable (SS) were measured daily Total suspended solids (TSS) were measured twice/wk TAN, NO2-N, NO3-N, VSS, turbidity, cBOD5, and RP
were monitored weekly Alkalinity maintained daily at ≈160 mg/L using sodium
bicarbonate Each RW was equipped with a YSI 5200 monitoring
system to provide continuous DO and temperature readings

Mean TAN levels were low: 0.3 mg/L (0.15-0.59) Mean NO2-N levels were low: 0.36 mg/L (0.10-1.4) NO3-N levels increased from 67 mg/L to 308.8 mg/L FFs use began on Day-7, STs from Day-22 Mean TSS levels were 292 mg/L Mean SS levels were 12 mL/L The use of FFs and STs was adequate to control solids
within the targeted ranges at feed loads of 22 kg/RW/d The YSI 5200 monitoring system operated with no
problems throughout the trial and provided valuable information for better feed and DO management
Results – 100 m3 RWs

Despite relatively high mean DO levels (85.7 % saturation) supplemental oxygen was provided intermittently between Day-22 and Day-44 for various reasons
The second 2 hp pump was engaged on Day-44, when biomass was estimated to be about 8.2 kg shrimp/m3
No O2 supplementation was provided during the final 16 days until harvest (9.03 kg shrimp/m3)
Observed improved FCRs over 2011 trial (1.48 vs. 1.77), good survival (79.5%), and excellent growth (>2.1 g/wk)
Decreased grow-out duration to 22.7 g shrimp from 94 d to 63 d
Results – 100 m3 RWs
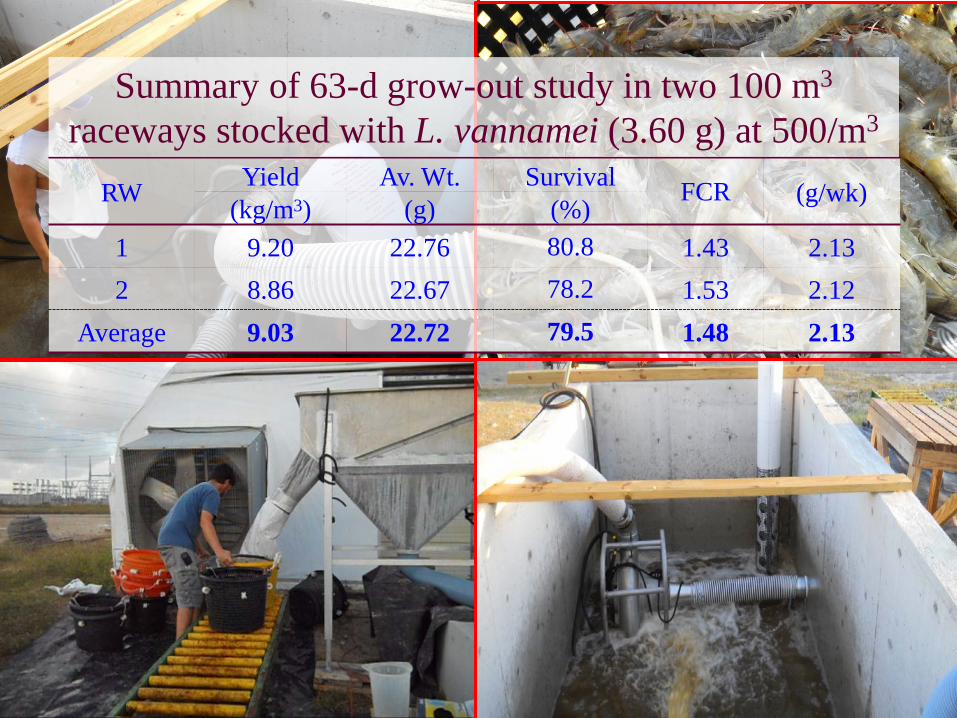
RW Yield Av. Wt. Survival FCR (g/wk) (kg/m3) (g) (%) 1 9.20 22.76 80.8 1.43 2.13 2 8.86 22.67 78.2 1.53 2.12
Average 9.03 22.72 79.5 1.48 2.13
Summary of 63-d grow-out study in two 100 m3
raceways stocked with L. vannamei (3.60 g) at 500/m3

2012 Study Objectives - 40 m3 RWs To study the performance of L.
vannamei juveniles when fed two commercial diets under high density and no water exchange
To study the changes in selected WQ indicators in RWs stocked with these shrimp
To study the benefit from using the YSI 5500 DO monitoring system as a management tool in operating a super-intensive, zero-exchange shrimp production system

Materials & Methods - 40 m3 RWs Six 40 m3 EPDM-lined RWs (Firestone Specialty
Products, Indianapolis, IN) filled with seawater and biofloc-rich water from an earlier nursery trial
Salinity was adjusted to 30 ppt Stocking: 500 juveniles (2.66 g/m3) from the same
source used in the previous study Each RW had eighteen 5.1 cm airlifts, six 1 m long
air diffusers (AeroTube, Colorite Division, Tekni-Plex, Austin, TX) and a center longitudinal partition over a 5.1 cm PVC pipe with spray nozzles fed by a Venturi injector operated by a 2 hp pump

Raceways were operated with no water exchange Evaporation was compensated weekly using municipal
freshwater (1-2 ppm mg/L chlorine) Three RWs were fed the HI-35 ($1.75/kg) while the
other three received the SI-35 ($0.99/kg) feed (Zeigler Bros., Gardners, PA)
Feed was distributed continuously by belt feeders Rations were initially determined using an assumed
FCR of 1.4, growth of 1.5 g/wk, and mortality of 0.5%/wk, and were adjusted according to twice a week growth samples
Materials & Methods - 40 m3 RWs

RWs had optical DO probes and YSI 5500 monitoring systems
DO, temperature, salinity, and pH twice daily; TAN, NO2-N, NO3-N, alkalinity, SS, turbidity, TSS, VSS, and cBOD5 once a week
Alkalinity was adjusted to 150-200 mg/L (as CaCO3) using sodium bicarbonate
Each RW had a small FF (VL 65 Aquatic Eco Systems, Apopka, FL) and a settling tank which were used to control particulate matter and dissolved organics, targeting TSS and SS levels in the ranges of 200-300 mg/L and 10-14 mL/L, respectively
Materials & Methods - 40 m3 RWs

Result - 40 m3 RWs The optical DO probe worked very well in
the biofloc environment The YSI 5500 monitoring system
improved feed management and minimized DO fluctuations TSS, turbidity and VSS levels remained
significantly higher in the SI-35 treatment These results may be related to the higher
non-digestible ingredients in the SI-35 with fiber at 2.69% vs. 1.61% and ash at 11.11% vs. 9.55%, respectively TAN and NO2-N levels were low (< 0.5
and 1.22 mg/L, respectively) in all six RWs throughout the trial NO3-N increased from about 40 mg/L at
the study initiation to 359 mg/L at the end of the trial
Result: 2012 Study, 40 m3 RWs

HI-35 SI-35 Mean Min - Max Mean Min - Max
Temperature (C)
a.m. 29.6 27.5-30.7 29.5 28.1-30.5 p.m. 30.5 28.2-31.6 30.3 28.8-31.5
DO (mg/L)
a.m. 5.9 4.6-7.0 5.9 4.6-7.6 p.m. 5.5 4.7-6.6 5.5 4.5-7.0
pH a.m. 7.1 6.6-7.5 7.1 6.7-7.5 p.m. 7.1 6.2-7.6 7.1 6.3-7.5
Salinity (ppt) 28.3 24.4-36.5 28.3 24.6-36.7 ALK (mg/L) 208a 123-274 171b 102-230 TSS (mg/L) 223a 115-552 278b 155-460 VSS (mg/L) 161a 92-435 205b 117-288 SS (mL/L) 8 2-21 11 2.5-27 Turb. (NTU) 90a 46-132 125b 68-246

Performance of shrimp fed HI-35 & SI-35 diets in a high-density 67-d in biofloc dominated system
HI-35 SI-35 Final Weight (g) 22.12 ± 11.35a 19.74 ± 8.28b Growth (g/wk) 2.03 ± 0.01a 1.76 ± 0.10b Total Biomass (kg) 389.8 ± 1.77a 348.5 ± 9.21b Yield (kg/m3) 9.74 ± 0.04a 8.71 ± 0.22b FCR 1.25 ± 0.01a 1.43 ± 0.04b Survival (%) 87.4 ± 0.52a 88.3 ± 4.18a

Economic Analyses Economic analyses were performed on: Effect of culture system and the two diets on
shrimp performance The economic analysis summary included: Cost of Production, Net Returns, Net
Present Value, Internal Rate of Return, Payback Period

SD 0.94 0.06 0.01 0.3 0.18 0.02 7.9
Trial A 2011 Study Results “Fast” Growth Line with HI-35
RW Stocking Stock Harvest Days Growth Sur Yield FCR (Juv/m3) (g) (g) (g/wk) (g/d) (%) (Kg/m3)
Water Use L/1 kg
Sal (ppt)
1 500 1.9 22.16 81 1.75 0.25 87.6 9.66 1.39 169.0 18 2 500 1.9 23.63 82 1.86 0.27 81.5 9.59 1.44 160.8 18 3 500 1.9 23.36 82 1.83 0.26 80.7 9.40 1.45 149.0 18 4 500 1.9 23.79 83 1.85 0.26 79.3 9.39 1.45 161.0 18 5 500 1.4 25.12 85 1.95 0.28 78.9 9.87 1.44 148.2 30
Av. 23.61 83 1.85 0.26 81.6 9.58 1.43 157.6

2012 Two Diet Study*: HI-35 v SI-35
(Juv/m3) (g) Size (g) Days RW Stocking Harvest Growth (g/wk)
Sur Yield (%) (Kg/m3) FCR
Water Use
(L/kg)
HI-35
SI-35
1 500 2.66 22.26 67 2.02 87.20 9.70 1.24 23.2 3 500 2.66 22.29 67 2.02 87.85 9.79 1.25 17.9 5 500 2.66 22.45 67 2.04 86.76 9.74 1.26 28.3
Average 500 2.66 22.33 67 2.03 87.27 9.74 1.25 23.1
2 500 2.66 19.06 67 1.69 93.04 8.87 1.4 21.1 4 500 2.66 20.81 67 1.87 84.78 8.82 1.41 25.5 6 500 2.66 19.49 67 1.73 86.71 8.45 1.48 22.7
Average 500 2.66 19.79 67 1.76 88.18 8.71 1.43 23.1
B1 500 3.6 22.76 63 2.13 80.8 9.20 1.43 38.59 B2 500 3.6 22.67 63 2.12 78.2 8.86 1.53 44.00
Average 500 3.6 22.72 63 2.13 79.5 9.03 1.48 41.30
* Use of juveniles from a cross between Taura resistant and fast-growth genetic lines

Comparison of Production Results From 2011 to 2012
Treatment 2011 A HI-35 40 m3
SI-35 40 m3
HI-35 100 m3
Stocking density (Juveniles/m3) 500 500 500 500 Survival rate (%) +7.0%, +8.1%, -2.6% 81.6 87.3 88.2 79.5 Growth rate (g/wk) +9.7%, -4.9%, +15.1% 1.85 2.03 1.76 2.13 Stocking size (g) +50%, +50%, +100% 1.8 2.7 2.7 3.6 Harvest size (g) -5.5%, -16.1%, -3.8% 23.6 22.3 19.8 22.7 FCR -12.6%, 0%, +3.5% 1.43 1.25 1.43 1.48 Crop length (days) -19.3%, -19.3%, -24.1% 83 67 67 63 Production (kg/m3) +1.7%, -9.1%, -5.7% 9.58 9.74 8.71 9.03

Economic Analysis Performed a 10-year cash flow analysis to estimate: Cost of production, Net returns to land, Net present
value, Internal rate of return, and Payback period Prices/Costs used in analysis Shrimp sales price: averaged $7.20/kg ($3.27/lb) Commercial row-out feed from Zeigler Brothers
• Semi-Intensive (SI-35): $0.99/kg or $0.452/lb • Hyper-Intensive (HI-35): $1.75/kg or $0.795/lb
Juveniles production cost: $20.00/1,000 Interest rate for loans: 8%
Initial investment = $991,997

Economic Analysis
Study results extrapolated to: One greenhouse system (GH), each consists of eight 500 m3/m2 grow-out RWs and two 500 m3/m2 nursery RWs. Budget results are based on production figures
Summary of Production and Sales for Super-intensive Recirculating Shrimp Production Systems 2011 Compared
to 2012 Trials – Metric Units 2011 HI-35 40 m3 SI-35 40 m3 HI-35 100 m3
Production, kg/crop 38,320 38,960 34,840 36,120 Crops per year 4.4 5.5 5.5 5.8 Production, kg/year 168,608 214,280 191,620 209,496 Production MT/year 169 214 192 209 Selling price, $/kg 7.20 7.20 7.20 7.20 Total Sales per year, $ 1,213,978 1,542,816 1,379,664 1,508,371

Summary of Enterprise Budgets for Super-intensive Recirculating Shrimp Production Systems 2011
Compared to 2012 Trials $/kg
2011 HI-35 40 m3
SI-35 40 m3
HI-35 100 m3
Gross Receipts 7.20 7.20 7.20 7.20 Variable Costs 5.38 4.06 4.54 4.31 Income Above Variable Cost 1.82 3.14 2.66 2.89 Fixed Cost 0.59 0.47 0.53 0.48 Total of All Specified Expenses 5.97 4.53 5.07 4.79 Net Returns Above All Costs 1.23 2.67 2.13 2.41 Payback period, years 2.9 1.4 1.9 1.6 Net present value ($ mil.) 1.0 2.9 2.0 2.6 Internal Rate of Return (%) 31.3 66.6 50.1 60.6

Opportunities for the Future Improved technology & experience continues to: Increase growth rate Improve FCR Increase survival Increase yield
BIG CAVEATS REMAIN !!! 1. Must have year-round PL supply! 2. Research must show back-to-back-to-back… production
is feasible Financial analyses are focusing research to sharpen
competitiveness

National Institute of Food & Agriculture (NIFA) USDA, AgriLife Research, The National Academy of Sciences USAID and CAPES, CNPq, FURG of Brazil for funding
Zeigler Bros. for the feed YSI for the DO monitoring systems Aquatic Eco-Systems for the foam fractionators Colorite Plastics for the air diffusers Firestone Specialty Products for the EPDM liner a3 All Aqua for the injectors
Acknowledgements