An Optical Fiber Sensor for Corrosion Detection of ... · PDF fileAn Optical Fiber Sensor for...
30
An Optical Fiber Sensor for Corrosion Detection of Reinforced Concrete Structures Presentation at HKCI Annual Seminar 2016 Christopher K.Y. Leung Department of Civil and Environmental Engineering Hong Kong University of Science and Engineering Kai Tai Wan Department of Mechanical, Aerospace and Civil Engineering Brunel University, UK
Transcript of An Optical Fiber Sensor for Corrosion Detection of ... · PDF fileAn Optical Fiber Sensor for...

An Optical Fiber Sensor for Corrosion Detection of
Reinforced Concrete Structures
Presentation at HKCI Annual Seminar 2016
Christopher K.Y. Leung
Department of Civil and Environmental Engineering
Hong Kong University of Science and Engineering
Kai Tai Wan
Department of Mechanical, Aerospace and Civil Engineering
Brunel University, UK

Introduction Steel Corrosion is a Major Problem with Reinforced
Concrete Structures
Early Detection of Potential Corrosion Enables Proper Maintenance to Extend the Life of Structures
Corroded Beam and Column Corroded Slab
Initiation of Steel Corrosion in Concrete
Iron oxide formed on steel surface is initially stable in the alkaline environment of concrete
The stable layer protects underlying material from corroding, so the corrosion rate is Negligible
The Protection is Lost when
– pH at steel surface drops below 11 (normally due to the penetration of Carbon Dioxide)
– A Critical Chloride Concentration is reached at the Steel
Steel corrosion is then Greatly Accelerated
NO Corrosion
Concrete Surface
Front of CO2
or Chloride
Steel
Significant Corrosion
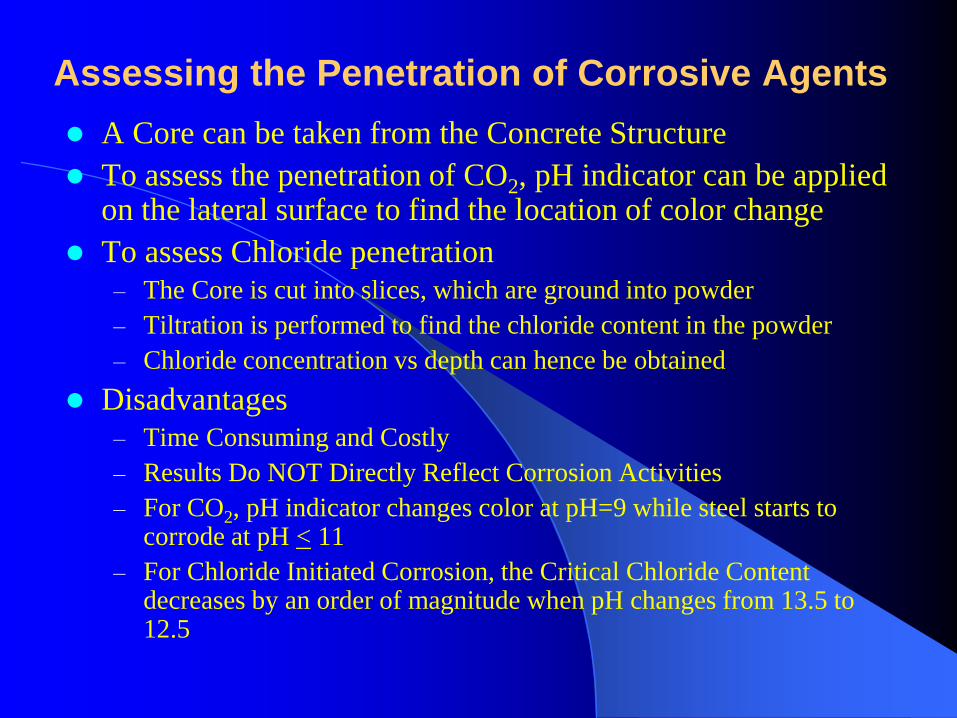
Assessing the Penetration of Corrosive Agents
A Core can be taken from the Concrete Structure
To assess the penetration of CO2, pH indicator can be applied on the lateral surface to find the location of color change
To assess Chloride penetration
– The Core is cut into slices, which are ground into powder
– Tiltration is performed to find the chloride content in the powder
– Chloride concentration vs depth can hence be obtained
Disadvantages
– Time Consuming and Costly
– Results Do NOT Directly Reflect Corrosion Activities
– For CO2, pH indicator changes color at pH=9 while steel starts to corrode at pH < 11
– For Chloride Initiated Corrosion, the Critical Chloride Content decreases by an order of magnitude when pH changes from 13.5 to 12.5
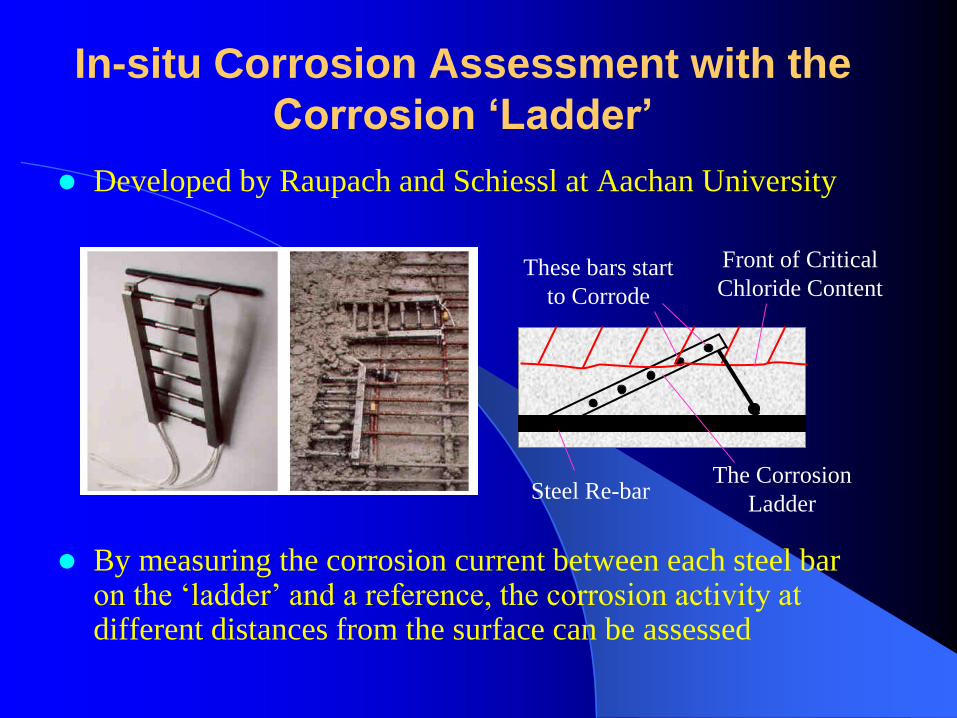
In-situ Corrosion Assessment with the
Corrosion ‘Ladder’
Developed by Raupach and Schiessl at Aachan University
By measuring the corrosion current between each steel bar on the ‘ladder’ and a reference, the corrosion activity at different distances from the surface can be assessed
These bars start
to Corrode
Front of Critical
Chloride Content
The Corrosion
Ladder Steel Re-bar

The Corrosion Ladder is a very Robust ‘Instrument’ and has been used in many Real-World Projects
Limitations:
– Not Applicable to Existing Structures
– Relatively Costly
A version for Installation in Existing Structures has been developed but sealing is a problem

A Novel Corrosion Detection Concept
Optical Fiber
Thin Iron
Coating With sufficient coating thickness,
Most of the Light is reflected
Coating Thickness
REDUCED BY CORROSION
Drop in Intensity
of Reflected Light Light Loss
at Fiber End
The Coating can be Produced by the Sputtering Process, with many Fibers coated at the same time – Cost of Each Sensor can be Low
Retrofitting of Sensor into a Structure is Possible

The Sputtering Process
Physical Principle Coating of Optical Fibers
Iron Target
Bundle of Fiber (Stripped at the End)
Coated Optical Fibers
Fiber
Holder

0
100
200
300
400
500
0 50 100 150 200F
ilm
th
ick
nes
s (n
m)
Time (minutes)
Sputtering process
Series1
P=80W,2.92nm/min
Measurements on Sputtered
Substrate and Fiber
Film Thickness vs
Sputtering Time
- Measured from Glass
Substrate with the
Profilometer
Reflectivity vs
Film Thickness
- Measured from Coated
Optical Fibers in Air
with OTDR
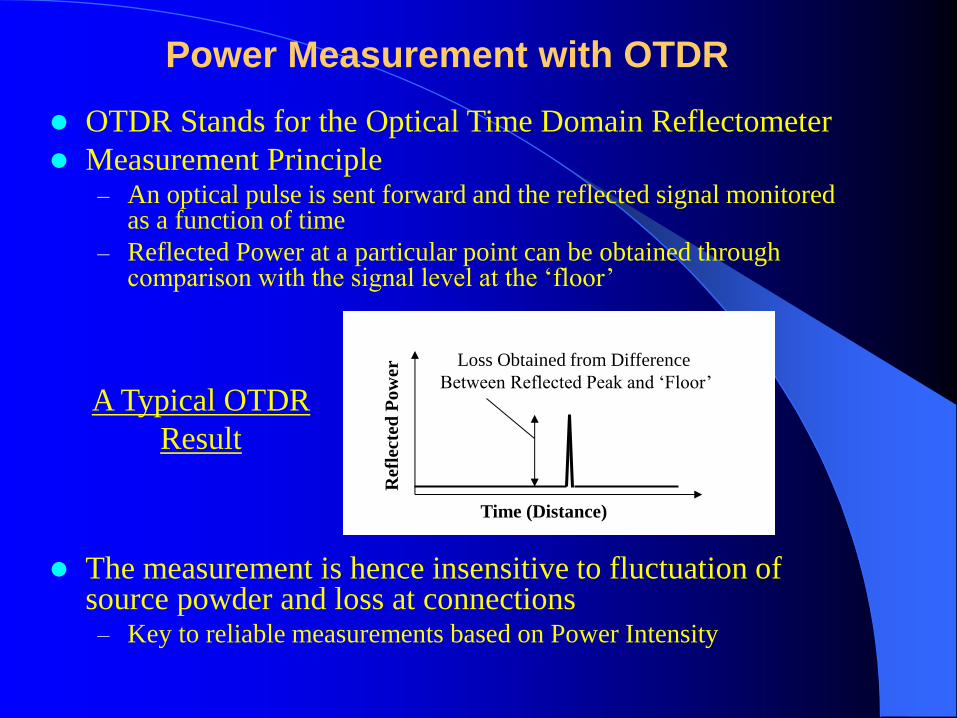
Power Measurement with OTDR
OTDR Stands for the Optical Time Domain Reflectometer
Measurement Principle – An optical pulse is sent forward and the reflected signal monitored
as a function of time
– Reflected Power at a particular point can be obtained through comparison with the signal level at the ‘floor’
The measurement is hence insensitive to fluctuation of source powder and loss at connections – Key to reliable measurements based on Power Intensity
Time (Distance)
Ref
lect
ed P
ow
er Loss Obtained from Difference
Between Reflected Peak and ‘Floor’
A Typical OTDR
Result
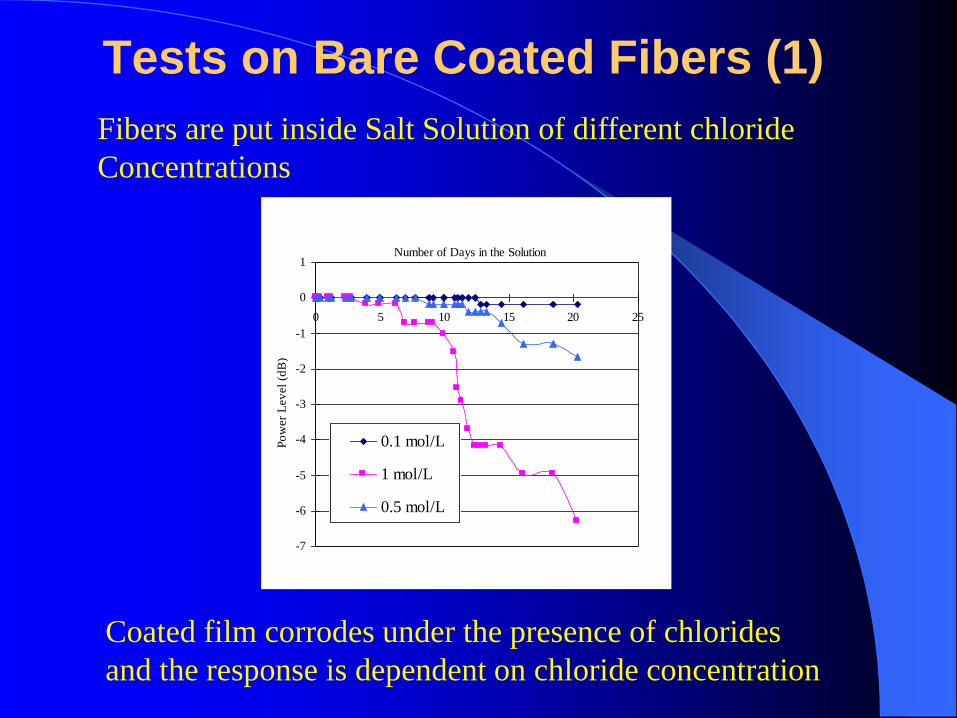
Tests on Bare Coated Fibers (1)
Coated film corrodes under the presence of chlorides
and the response is dependent on chloride concentration
Fibers are put inside Salt Solution of different chloride
Concentrations
-7
-6
-5
-4
-3
-2
-1
0
1
0 5 10 15 20 25
Number of Days in the Solution
Po
wer
Lev
el
(dB
)
0.1 mol/L
1 mol/L
0.5 mol/L

Tests on Bare Coated Fibers (II)
-0.5
0
0.5
1
1.5
2
2.5
0 20 40 60 80 100 120 140
Days after Embedment
dB
Lo
ss in
Lig
ht
Po
wer
Wet
Wet
Dry
Dry
Sensor can detect corrosion and distinguish between
different corrosive environments
Fibers are embedded inside Mortar Blocks containing
salt, which are either placed in Water or left in Air
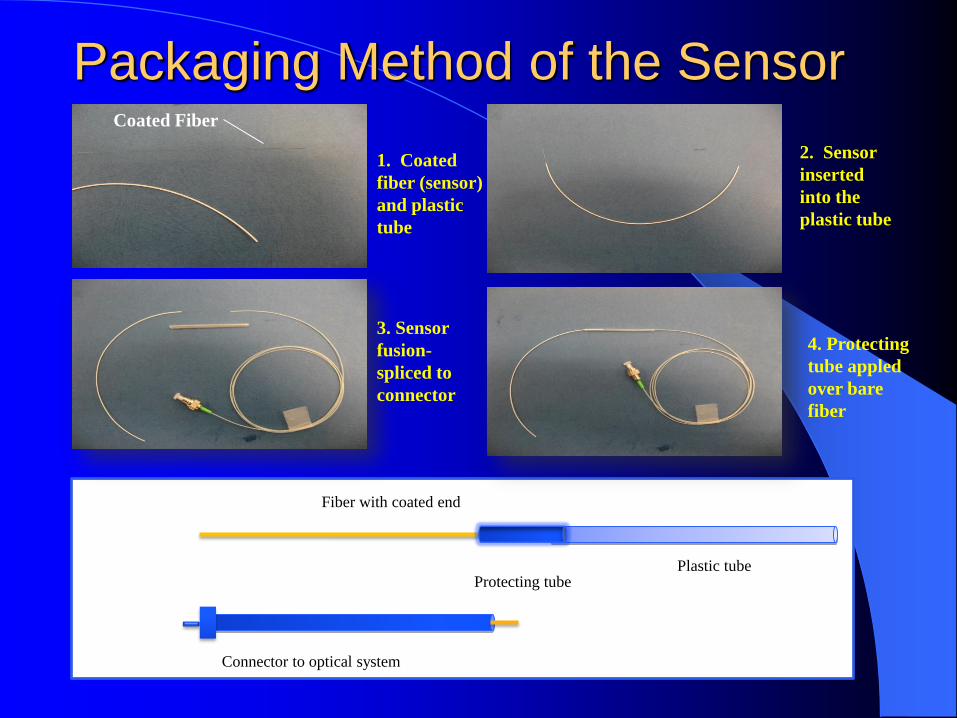
Packaging Method of the Sensor
Plastic tube
Fiber with coated end
Connector to optical system
Protecting tube
1. Coated
fiber (sensor)
and plastic
tube
2. Sensor
inserted
into the
plastic tube
3. Sensor
fusion-
spliced to
connector
4. Protecting
tube appled
over bare
fiber
Coated Fiber
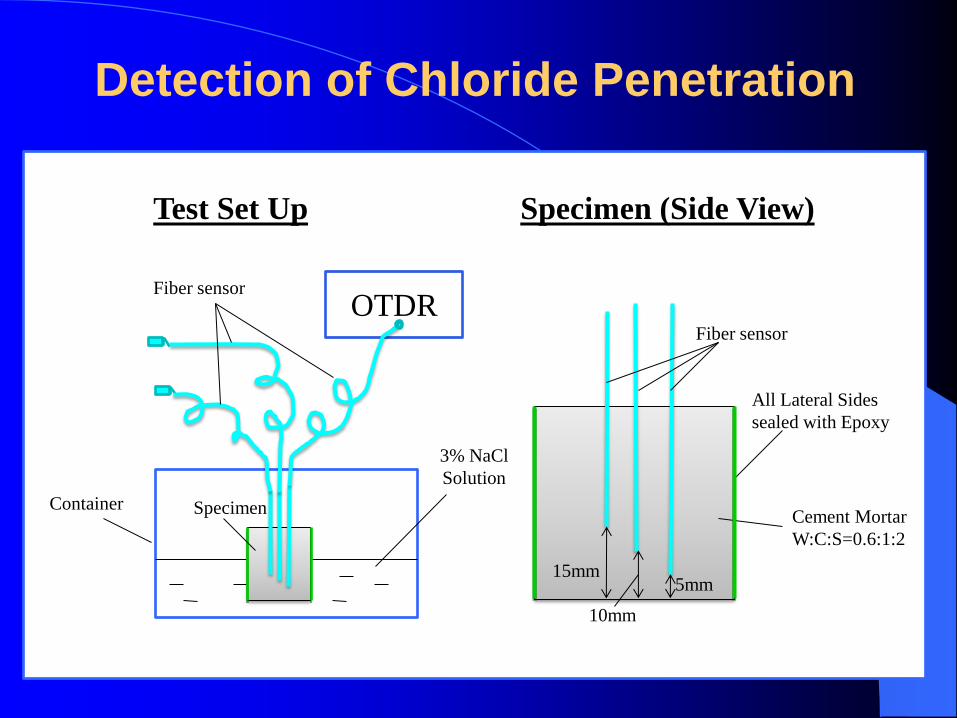
Detection of Chloride Penetration
Test Set Up Specimen (Side View)
Cement Mortar
W:C:S=0.6:1:2
Fiber sensor
15mm
10mm
5mm
All Lateral Sides
sealed with Epoxy
OTDR
3% NaCl
Solution
Container Specimen
Fiber sensor

Results for Chloride Penetration Test
-25
-20
-15
-10
-5
0
5
0 20 40 60 80 100
Pow
er L
oss
(d
B)
Time (Days)
Diffusion Test
5mm
10mm
15mm
Corrosion starts at sensor closest to the surface exposed
to chlorides
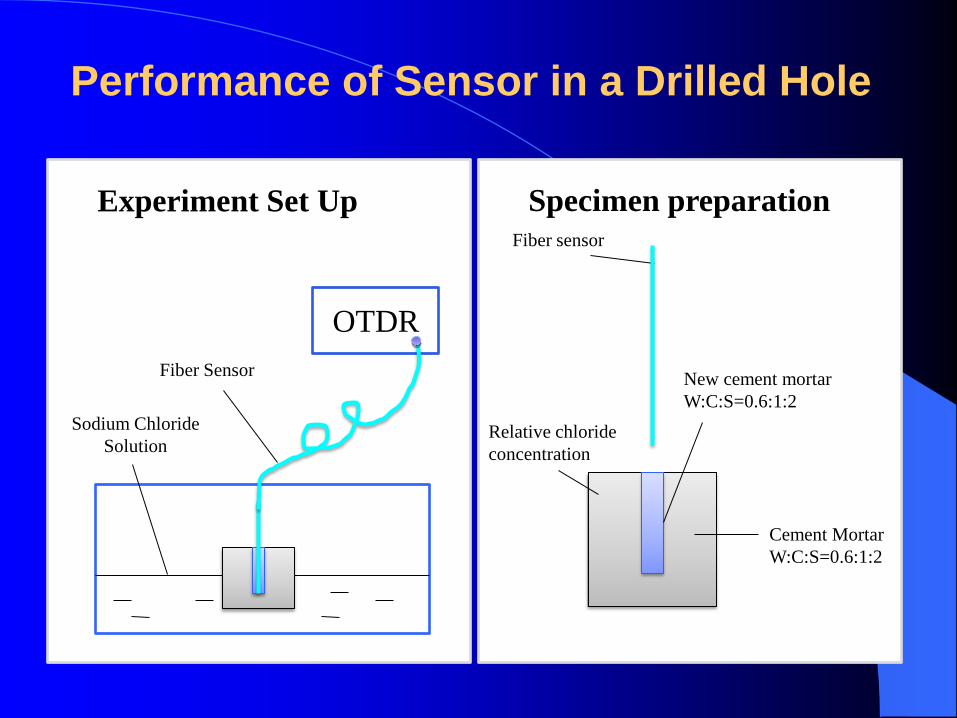
Performance of Sensor in a Drilled Hole
Experiment Set Up Specimen preparation
OTDR
Sodium Chloride
Solution
Fiber Sensor
Cement Mortar
W:C:S=0.6:1:2
Fiber sensor
New cement mortar
W:C:S=0.6:1:2
Relative chloride
concentration
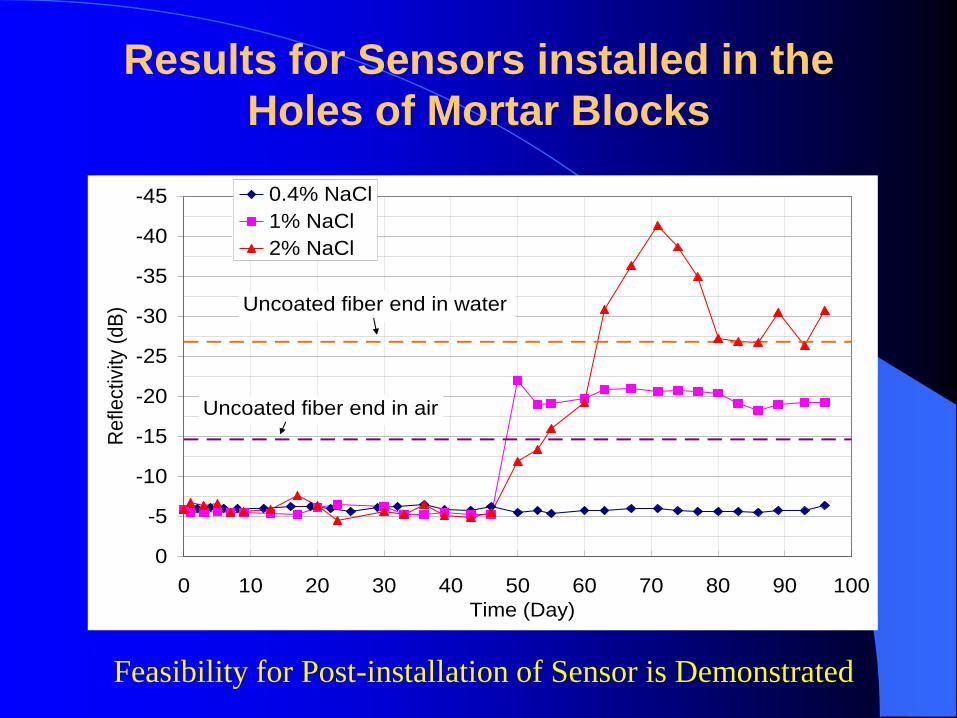
Results for Sensors installed in the
Holes of Mortar Blocks
-45
-40
-35
-30
-25
-20
-15
-10
-5
0
0 10 20 30 40 50 60 70 80 90 100
Time (Day)
Re
flectiv
ity (
dB
)
0.4% NaCl
1% NaCl
2% NaCl
Uncoated fiber end in air
Uncoated fiber end in water
Feasibility for Post-installation of Sensor is Demonstrated

Sensor Output vs corrosion current
Experimental Set-Up
(modified ASTM G109)
Fiber Sensor
Ground clamp
Steel bars
3% NaCl Solution
V R
R=100Ω
Adhesive tape
10mm
Corrosion Current =V/R
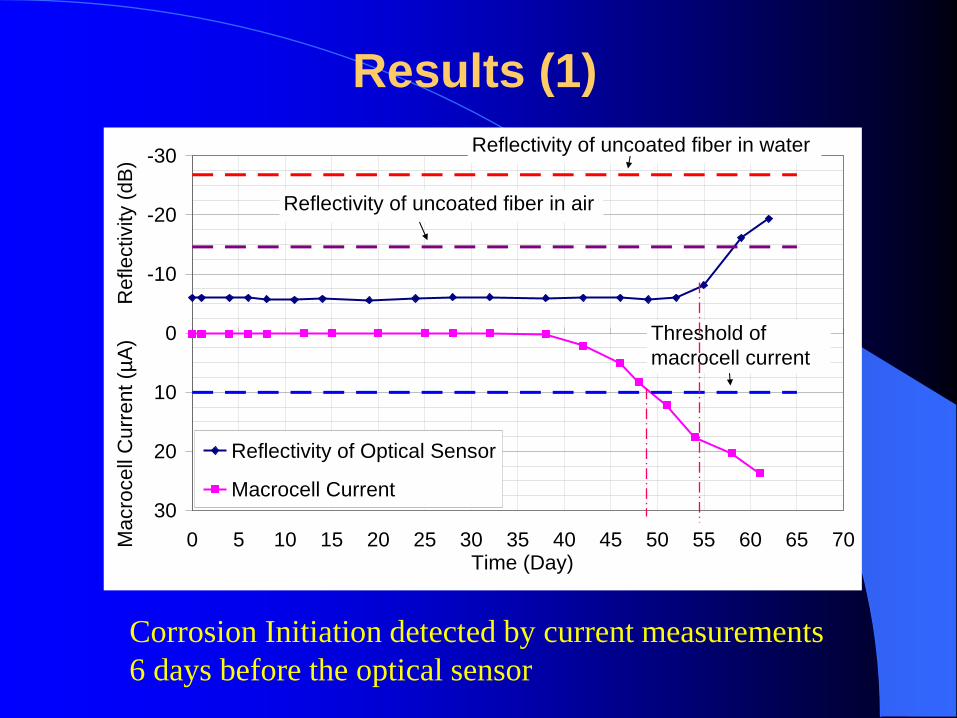
-30
-20
-10
0
10
20
30
0 5 10 15 20 25 30 35 40 45 50 55 60 65 70Time (Day)
Re
fle
ctivity (
dB
)
Reflectivity of Optical Sensor
Macrocell Current
Ma
cro
ce
ll C
urr
en
t (µ
A)
Reflectivity of uncoated fiber in air
Reflectivity of uncoated fiber in water
Threshold of
macrocell current
Results (1)
Corrosion Initiation detected by current measurements
6 days before the optical sensor

Results (2)
-50
-40
-30
-20
-10
0
10
20
30
0 10 20 30 40 50 60 70 80
Time (Day)
Refle
ctiv
ity (
dB
)
Reflectivity of Optical Sensor
Macrocell Current
Macro
cell
Cu
rre
nt (μA)
Threshold of macrocell current
Reflectivity of uncoated fiber in air
Reflectivity of uncoated fiber in water
- Corrosion Initiation detected by optical sensors 16 days
before the current measurement
- Different is not significant for practical long-term monitoring

Sensor Installation in Concrete Structures
New Structures (angled sensor)
Concrete Surface Bottom of Sensor
Glued to Surface
of Steel Bar
Steel Reinforcement
Fiber
Sensors
Fiber corrosion sensor
Sensor head
Flat part glued to steel
Fixture
Inclined part
Sensor head
Fixture end
Sensor Outlet
Sensor Encased in GFRP

Existing Structures
Steel Reinforcements
Steel
Reinforcements
Optical
Fiber
Sensor Hole Drilled
from inside
of Box Section
Optical Fiber Sensor
in the Drilled Hole
Hole Fully
Sealed on
the side
Chloride Penetration from the
Lower Surface to be Monitored
Box Section Solid Section

Field Trial in an Existing Structure
10 sensors installed on two piers of a
footbridge right next to the sea
Sensors are installed
in holes drilled on
these surfaces

Locations of the Sensors
Sensor #4
60mm from back surface
40mm depth
SEA Sensor #5
300mm from surface
100mm depth
Sensor #2
80mm from surface
40mm depth
Sensor #1
60mm from surface
40mm depth
Sensor #3
100mm from surface
40mm depth
5 sensors installed in each pier

Installation Procedure (1)
Locating of Steel Reinforcements
Cleaning of Hole with
Compressed Air
Drilling of Hole for the Sensor

Installation Procedure (2)
Sealing of Hole
Surface with
Epoxy Coating
Sensors Placed inside the Holes Filling of hole with Cement Grout
The sensors have survived THREE big typhoons since their installation

OTDR Readings
0
5
10
15
20
25
30
35
40
45
50
80 130 180 230
Distance from the Bulkhead of OTDR (m)
Inte
nsity o
f th
e R
efle
cte
d S
ign
al (d
B)
13-Aug-0815-Aug-0819-Aug-0817-Sep-0825-Sep-0829-Oct-08
Sensor 1Sensor 5
Sensor 2 Sensor 4
Sensor 3Reference
The loss for each sensor is measured at different times
The reference is a fiber embedded inside an epoxy block

Signal Loss vs Time
Results appear to correlate well with location of sensors
-30
-25
-20
-15
-10
-5
0
0 50 100 150 200 250 300 350Number of Days
Reflectivity (
dB
)
Sensor 06
Sensor 07
Sensor 08
Sensor 09
Sensor 10Reflectivity of uncoated fiber in air
Reflectivity of uncoated fiber in water Sensor 1
Sensor 2
Sensor 3
Sensor 4
Sensor 5
1 2 5 4
3

Correlation with Chloride Content in Pier
Powder taken around the 3 sensors on the seaward side (at 25-40mm depth) and also around the sensor in the middle of the pier (at 85-100mm depth)
Chloride content obtained through tiltration with silver nitrate solution
Location Chloride Content (%wt of cement)
Near the Sea 0.314
Center of Pier 0.214
Results seem to be reasonable as chloride threshold is
normally between 0.2 to 0.4% cement weight
sensors
Powder taken
Within these regions
SEA
Conclusion
A New Corrosion Sensor based on OTDR Measurement of Reflected Light Intensity is developed together with a simple packaging technique
The Sensor can be mass produced at low cost and is suitable for both new and existing concrete structures
Laboratory Results show that
– The sensor can monitor corrosion penetration
– The sensor can be post-installed into an existing structure
– There is reasonable agreement between sensor measurement and macro-cell current
Site Trial indicates robustness of sensor and reasonable correlation between measured corrosion and sensor location
Through this investigation, the potential of a novel corrosion sensor is demonstrated