
Aeroflot Group Consolidated financials...
35
Aeroflot Group Consolidated financials (IFRS) 12M2011 Moscow May 17, 2012 Speaker: Shamil Kurmashov Deputy Director General Finance and investments
Transcript of Aeroflot Group Consolidated financials...
R: 182
G: 196
B: 204
R: 135
G: 157
B: 179
R: 59
G: 100
B: 135
Цвета заливки графиков и фигур
R: 22
G: 44
B: 66
R: 178
G: 178
B: 178
Цвет контура
R: 0
G: 176
B: 80
R: 0
G: 112
B: 192
R: 255
G: 255
B: 255
R: 0
G: 0
B: 0
R: 255
G: 0
B: 0
R: 1
G: 40
B: 120
R: 0
G: 128
B: 0
Цвет текста
Aeroflot Group
Consolidated financials (IFRS)
12M2011
Moscow
May 17, 2012
Speaker:
Shamil Kurmashov
Deputy Director General
Finance and investments
R: 182
G: 196
B: 204
R: 135
G: 157
B: 179
R: 59
G: 100
B: 135
Цвета заливки графиков и фигур
R: 22
G: 44
B: 66
R: 178
G: 178
B: 178
Цвет контура
R: 0
G: 176
B: 80
R: 0
G: 112
B: 192
R: 255
G: 255
B: 255
R: 0
G: 0
B: 0
R: 255
G: 0
B: 0
R: 1
G: 40
B: 120
R: 0
G: 128
B: 0
Цвет текста
Table of contents
1.Introduction
2.Market position of the Group
3.Operating highlights
4.Financial results
5.Conclusions
6.Subsidiary airlines
2
R: 182
G: 196
B: 204
R: 135
G: 157
B: 179
R: 59
G: 100
B: 135
Цвета заливки графиков и фигур
R: 22
G: 44
B: 66
R: 178
G: 178
B: 178
Цвет контура
R: 0
G: 176
B: 80
R: 0
G: 112
B: 192
R: 255
G: 255
B: 255
R: 0
G: 0
B: 0
R: 255
G: 0
B: 0
R: 1
G: 40
B: 120
R: 0
G: 128
B: 0
Цвет текста
Key highlights for the 12 months 2011
3
• November 15, 2011 JSC “Aeroflot” completed the transaction of receiving airlines owned by State
Corporation “Russian Technogies”. LLC “Aeroflot-Finance” received stakes in JSC “Vladivostok Avia”
(52.156%), JSC “Saratov Airlines” (51%), JSC “SAT Airlines” (100%), JSC “Rossiya Airlines”(75% minus 1
share) , JSC “Orenburg Airlines” (100%) in exchange for 3.55% stake of charter capital of JSC “Aeroflot –
Russian Airlines”.
• December 13, 2011 the agreement on JSC “Terminal” consolidation into JSC “Sheremetyevo International
Airport” has been signed. The agreement implies merger of the companies and conversion of 52.82% of
JSC “Terminal” stock, owned by Aeroflot Group, into 8.96% stake in joint company JSC “Sheremetyevo
International Airport”.
• Aeroflot received the award «Russian Business Travel & MICE Award» in category «Best company for
business travelers». «Russian Business Travel & MICE Award» is an annual award established by Business
Travel magazine and internet portal Conference.ru.
• Aeroflot was awarded by SAP Company for best implementation SAP’s products in transport sector. SAP
ERP system has been implementing in JSC “Aeroflot” since 2009.
• According to the rating of the Boston Consulting Group (BCG) – the world leader in operating consulting and
business strategy developing, JSC “Aeroflot” took seventh place among top ten transport and tourist
companies. Pursuant to the research total shareholder return, volume of sales, margin performed certain
growth in recent years.
• Despite negative market conditions in Eurozone and anticipated downgrades of countries’ credit ratings, on
March 22, 2012 International Rating Agency “Fitch” has confirmed long-term rating for JSC “Aeroflot” at
“BB+” level with stable outlook.
R: 182
G: 196
B: 204
R: 135
G: 157
B: 179
R: 59
G: 100
B: 135
Цвета заливки графиков и фигур
R: 22
G: 44
B: 66
R: 178
G: 178
B: 178
Цвет контура
R: 0
G: 176
B: 80
R: 0
G: 112
B: 192
R: 255
G: 255
B: 255
R: 0
G: 0
B: 0
R: 255
G: 0
B: 0
R: 1
G: 40
B: 120
R: 0
G: 128
B: 0
Цвет текста
Table of contents
1.Introduction
2.Market position of the Group
3.Operating highlights
4.Financial results
5.Conclusions
6.Subsidiary airlines
4
R: 182
G: 196
B: 204
R: 135
G: 157
B: 179
R: 59
G: 100
B: 135
Цвета заливки графиков и фигур
R: 22
G: 44
B: 66
R: 178
G: 178
B: 178
Цвет контура
R: 0
G: 176
B: 80
R: 0
G: 112
B: 192
R: 255
G: 255
B: 255
R: 0
G: 0
B: 0
R: 255
G: 0
B: 0
R: 1
G: 40
B: 120
R: 0
G: 128
B: 0
Цвет текста
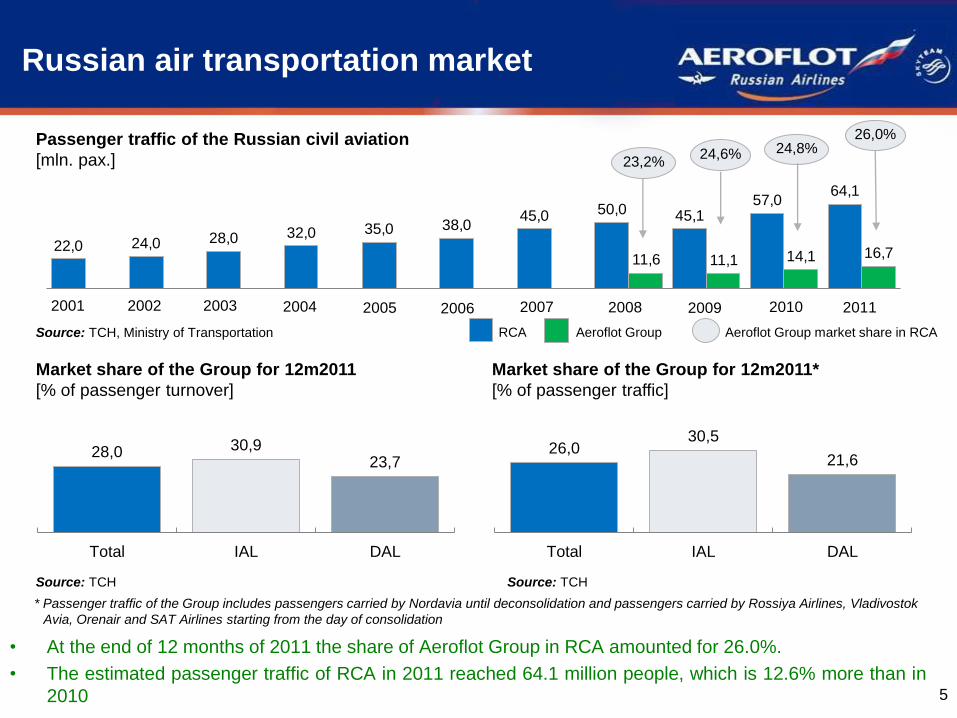
Source: TCH, Ministry of Transportation
Source: TCH Source: TCH
Market share of the Group for 12m2011
[% of passenger turnover]
Market share of the Group for 12m2011*
[% of passenger traffic]
Passenger traffic of the Russian civil aviation
[mln. pax.]
Russian air transportation market
• At the end of 12 months of 2011 the share of Aeroflot Group in RCA amounted for 26.0%.
• The estimated passenger traffic of RCA in 2011 reached 64.1 million people, which is 12.6% more than in
2010 5
23,2% 24,6% 24,8%
RCA Aeroflot Group market share in RCA Aeroflot Group
26,0%
* Passenger traffic of the Group includes passengers carried by Nordavia until deconsolidation and passengers carried by Rossiya Airlines, Vladivostok
Avia, Orenair and SAT Airlines starting from the day of consolidation
22,0 24,0 28,0 32,0 35,0 38,045,0 50,0 45,1
57,064,1
11,6 11,1 14,1 16,7
2010200920082007200620052004200320022001 2011
28,0 30,9 23,7
Total IAL DAL
26,0 30,5
21,6
Total IAL DAL
R: 182
G: 196
B: 204
R: 135
G: 157
B: 179
R: 59
G: 100
B: 135
Цвета заливки графиков и фигур
R: 22
G: 44
B: 66
R: 178
G: 178
B: 178
Цвет контура
R: 0
G: 176
B: 80
R: 0
G: 112
B: 192
R: 255
G: 255
B: 255
R: 0
G: 0
B: 0
R: 255
G: 0
B: 0
R: 1
G: 40
B: 120
R: 0
G: 128
B: 0
Цвет текста
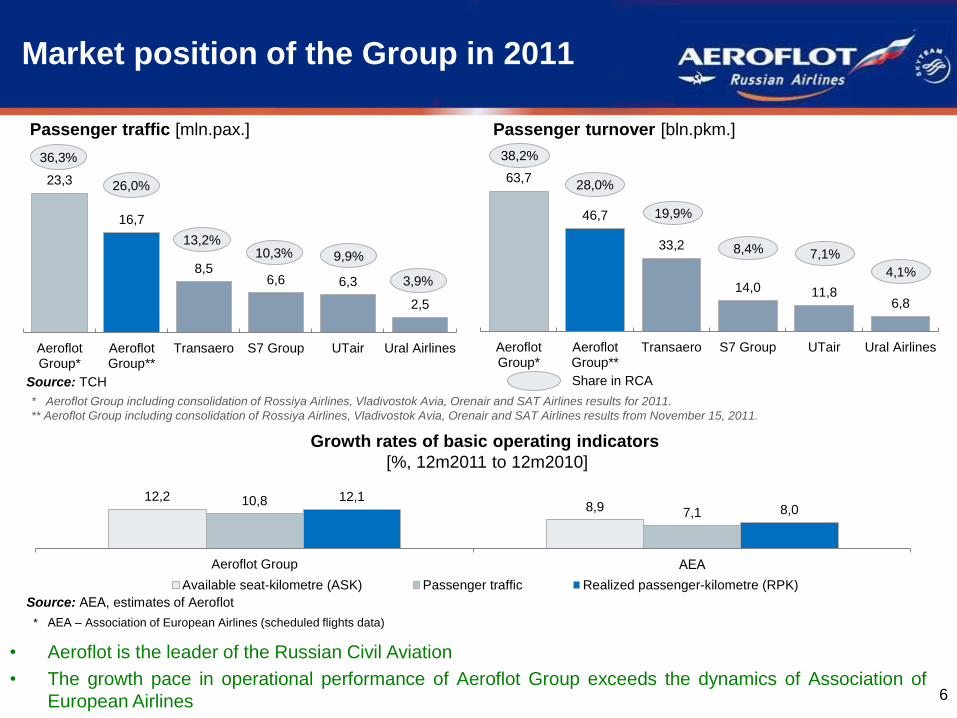
Market position of the Group in 2011
6
Passenger traffic [mln.pax.] Passenger turnover [bln.pkm.]
Growth rates of basic operating indicators
[%, 12m2011 to 12m2010]
Source: TCH Share in RCA
* Aeroflot Group including consolidation of Rossiya Airlines, Vladivostok Avia, Orenair and SAT Airlines results for 2011.
** Aeroflot Group including consolidation of Rossiya Airlines, Vladivostok Avia, Orenair and SAT Airlines results from November 15, 2011.
Source: АЕА, estimates of Aeroflot
* АЕА – Association of European Airlines (scheduled flights data)
• Aeroflot is the leader of the Russian Civil Aviation
• The growth pace in operational performance of Aeroflot Group exceeds the dynamics of Association of
European Airlines
23,3
16,7
8,5 6,6 6,3
2,5
AeroflotGroup*
AeroflotGroup**
Transaero S7 Group UTair Ural Airlines
36,3%
26,0%
13,2% 10,3% 9,9%
3,9%
63,7
46,7
33,2
14,0 11,8 6,8
AeroflotGroup*
AeroflotGroup**
Transaero S7 Group UTair Ural Airlines
38,2%
28,0%
19,9%
8,4% 7,1%
4,1%
12,2 8,9 10,8
7,1
12,1 8,0
Aeroflot Group АЕА
Available seat-kilometre (ASK) Passenger traffic Realized passenger-kilometre (RPK)
R: 182
G: 196
B: 204
R: 135
G: 157
B: 179
R: 59
G: 100
B: 135
Цвета заливки графиков и фигур
R: 22
G: 44
B: 66
R: 178
G: 178
B: 178
Цвет контура
R: 0
G: 176
B: 80
R: 0
G: 112
B: 192
R: 255
G: 255
B: 255
R: 0
G: 0
B: 0
R: 255
G: 0
B: 0
R: 1
G: 40
B: 120
R: 0
G: 128
B: 0
Цвет текста
Table of contents
1.Introduction
2.Market position of the Group
3.Operating highlights
4.Financial results
5.Conclusions
6.Subsidiary airlines
7
R: 182
G: 196
B: 204
R: 135
G: 157
B: 179
R: 59
G: 100
B: 135
Цвета заливки графиков и фигур
R: 22
G: 44
B: 66
R: 178
G: 178
B: 178
Цвет контура
R: 0
G: 176
B: 80
R: 0
G: 112
B: 192
R: 255
G: 255
B: 255
R: 0
G: 0
B: 0
R: 255
G: 0
B: 0
R: 1
G: 40
B: 120
R: 0
G: 128
B: 0
Цвет текста
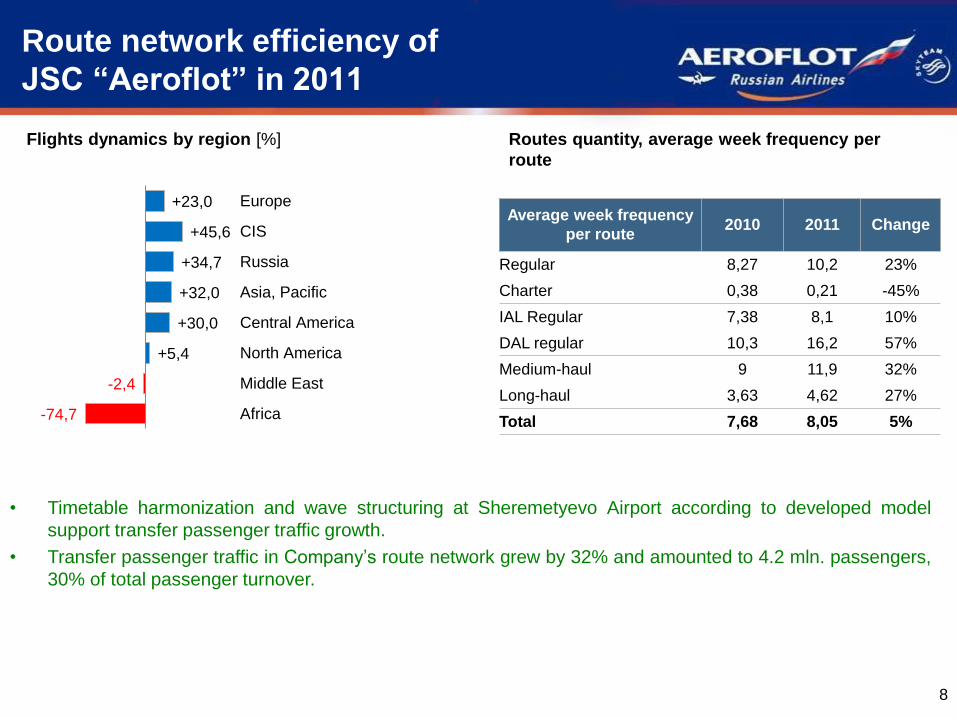
Route network efficiency of
JSC “Aeroflot” in 2011
8
• Timetable harmonization and wave structuring at Sheremetyevo Airport according to developed model
support transfer passenger traffic growth.
• Transfer passenger traffic in Company’s route network grew by 32% and amounted to 4.2 mln. passengers,
30% of total passenger turnover.
Routes quantity, average week frequency per
route
Average week frequency
per route 2010 2011 Change
Regular 8,27 10,2 23%
Charter 0,38 0,21 -45%
IAL Regular 7,38 8,1 10%
DAL regular 10,3 16,2 57%
Medium-haul 9 11,9 32%
Long-haul 3,63 4,62 27%
Total 7,68 8,05 5%
Flights dynamics by region [%]
-74,7
-2,4
+5,4
+30,0
+32,0
+34,7
+45,6
+23,0
Africa
Middle East
North America
Central America
Asia, Pacific
Russia
CIS
Europe
R: 182
G: 196
B: 204
R: 135
G: 157
B: 179
R: 59
G: 100
B: 135
Цвета заливки графиков и фигур
R: 22
G: 44
B: 66
R: 178
G: 178
B: 178
Цвет контура
R: 0
G: 176
B: 80
R: 0
G: 112
B: 192
R: 255
G: 255
B: 255
R: 0
G: 0
B: 0
R: 255
G: 0
B: 0
R: 1
G: 40
B: 120
R: 0
G: 128
B: 0
Цвет текста
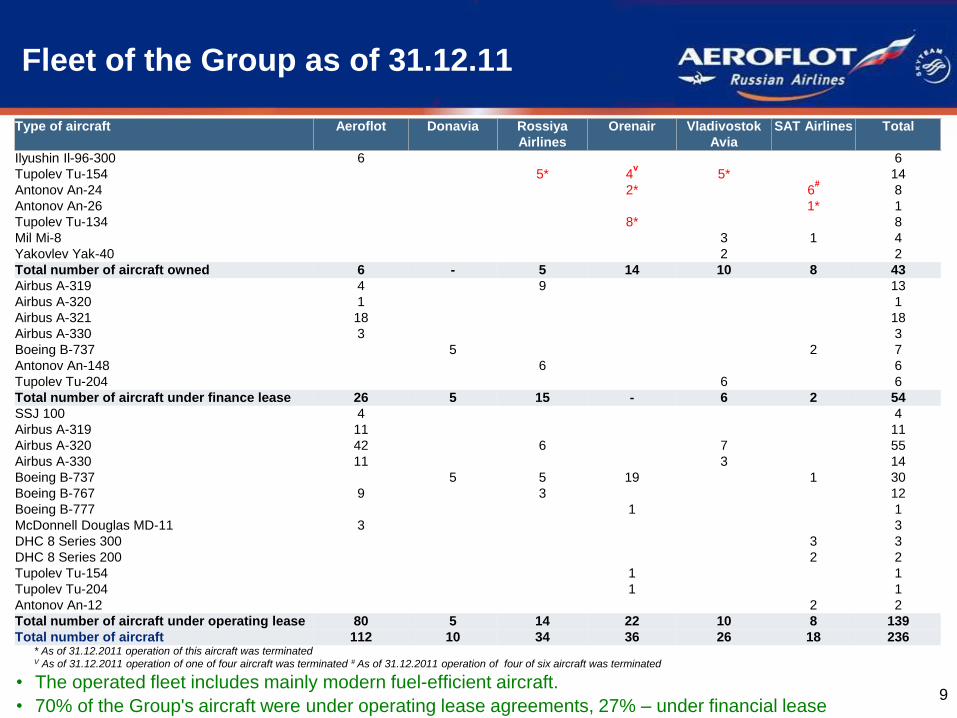
Fleet of the Group as of 31.12.11
• The operated fleet includes mainly modern fuel-efficient aircraft.
• 70% of the Group's aircraft were under operating lease agreements, 27% – under financial lease 9
Type of aircraft Aeroflot Donavia Rossiya
Airlines
Orenair Vladivostok
Avia
SAT Airlines Total
Ilyushin Il-96-300 6 6
Tupolev Tu-154 5* 4v
5* 14
Antonov An-24 2* 6#
8
Antonov An-26 1* 1
Tupolev Tu-134 8* 8
Mil Mi-8 3 1 4
Yakovlev Yak-40 2 2
Total number of aircraft owned 6 - 5 14 10 8 43
Airbus A-319 4 9 13
Airbus A-320 1 1
Airbus A-321 18 18
Airbus A-330 3 3
Boeing B-737 5 2 7
Antonov An-148 6 6
Tupolev Tu-204 6 6
Total number of aircraft under finance lease 26 5 15 - 6 2 54
SSJ 100 4 4
Airbus A-319 11 11
Airbus A-320 42 6 7 55
Airbus A-330 11 3 14
Boeing B-737 5 5 19 1 30
Boeing B-767 9 3 12
Boeing B-777 1 1
McDonnell Douglas MD-11 3 3
DHC 8 Series 300 3 3
DHC 8 Series 200 2 2
Tupolev Tu-154 1 1
Tupolev Tu-204 1 1
Antonov An-12 2 2
Total number of aircraft under operating lease 80 5 14 22 10 8 139
Total number of aircraft 112 10 34 36 26 18 236 * As of 31.12.2011 operation of this aircraft was terminated V As of 31.12.2011 operation of one of four aircraft was terminated # As of 31.12.2011 operation of four of six aircraft was terminated
R: 182
G: 196
B: 204
R: 135
G: 157
B: 179
R: 59
G: 100
B: 135
Цвета заливки графиков и фигур
R: 22
G: 44
B: 66
R: 178
G: 178
B: 178
Цвет контура
R: 0
G: 176
B: 80
R: 0
G: 112
B: 192
R: 255
G: 255
B: 255
R: 0
G: 0
B: 0
R: 255
G: 0
B: 0
R: 1
G: 40
B: 120
R: 0
G: 128
B: 0
Цвет текста
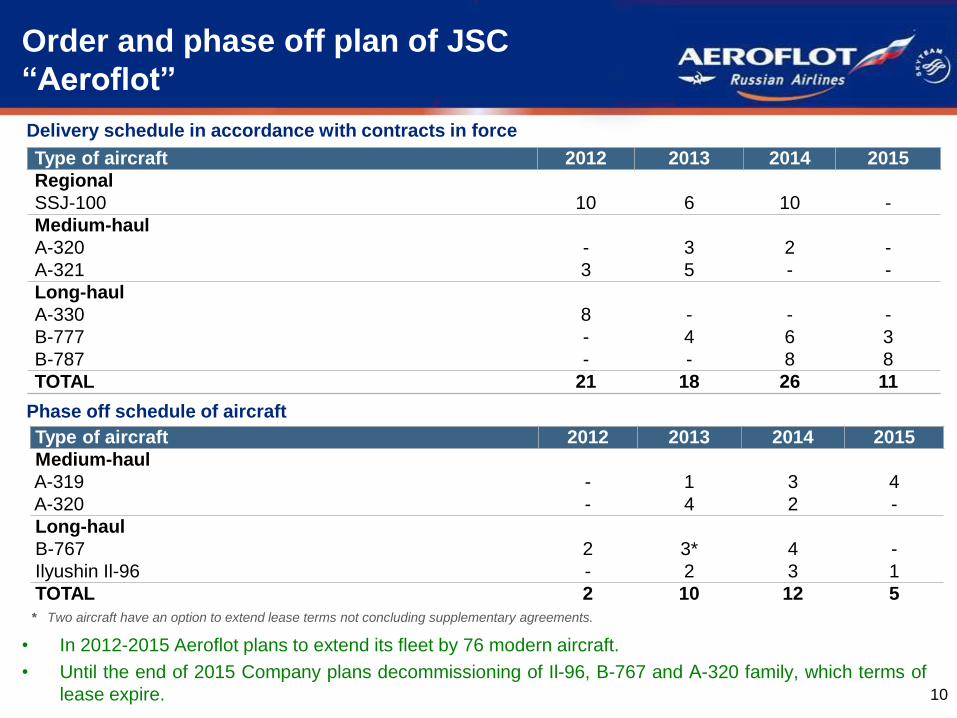
Order and phase off plan of JSC
“Aeroflot”
• In 2012-2015 Aeroflot plans to extend its fleet by 76 modern aircraft.
• Until the end of 2015 Company plans decommissioning of Il-96, B-767 and А-320 family, which terms of
lease expire. 10
Delivery schedule in accordance with contracts in force
Phase off schedule of aircraft
Type of aircraft 2012 2013 2014 2015
Regional
SSJ-100 10 6 10 -
Medium-haul
A-320 - 3 2 -
A-321 3 5 - -
Long-haul
A-330 8 - - -
B-777 - 4 6 3
B-787 - - 8 8
TOTAL 21 18 26 11
Type of aircraft 2012 2013 2014 2015
Medium-haul
A-319 - 1 3 4
A-320 - 4 2 -
Long-haul
B-767 2 3* 4 -
Ilyushin Il-96 - 2 3 1
TOTAL 2 10 12 5
* Two aircraft have an option to extend lease terms not concluding supplementary agreements.
R: 182
G: 196
B: 204
R: 135
G: 157
B: 179
R: 59
G: 100
B: 135
Цвета заливки графиков и фигур
R: 22
G: 44
B: 66
R: 178
G: 178
B: 178
Цвет контура
R: 0
G: 176
B: 80
R: 0
G: 112
B: 192
R: 255
G: 255
B: 255
R: 0
G: 0
B: 0
R: 255
G: 0
B: 0
R: 1
G: 40
B: 120
R: 0
G: 128
B: 0
Цвет текста
294,2323,2
352,3 378,9 353,9399,7
461,3
2005 2006 2007 2008 2009 2010 2011
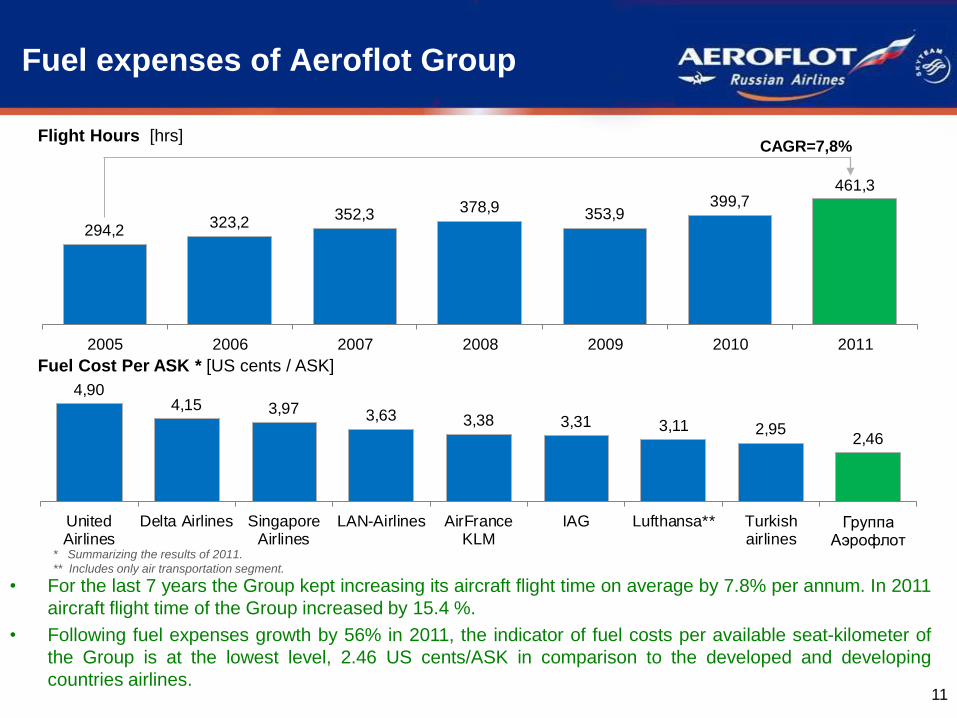
Fuel expenses of Aeroflot Group
11
• For the last 7 years the Group kept increasing its aircraft flight time on average by 7.8% per annum. In 2011
aircraft flight time of the Group increased by 15.4 %.
• Following fuel expenses growth by 56% in 2011, the indicator of fuel costs per available seat-kilometer of
the Group is at the lowest level, 2.46 US cents/ASK in comparison to the developed and developing
countries airlines.
Flight Hours [hrs]
Fuel Cost Per ASK * [US cents / ASK]
CAGR=7,8%
* Summarizing the results of 2011.
** Includes only air transportation segment.
4,904,15 3,97 3,63 3,38 3,31 3,11 2,95
2,46
UnitedAirlines
Delta Airlines SingaporeAirlines
LAN-Airlines AirFranceKLM
IAG Lufthansa** Turkishairlines
Группа Аэрофлот
R: 182
G: 196
B: 204
R: 135
G: 157
B: 179
R: 59
G: 100
B: 135
Цвета заливки графиков и фигур
R: 22
G: 44
B: 66
R: 178
G: 178
B: 178
Цвет контура
R: 0
G: 176
B: 80
R: 0
G: 112
B: 192
R: 255
G: 255
B: 255
R: 0
G: 0
B: 0
R: 255
G: 0
B: 0
R: 1
G: 40
B: 120
R: 0
G: 128
B: 0
Цвет текста
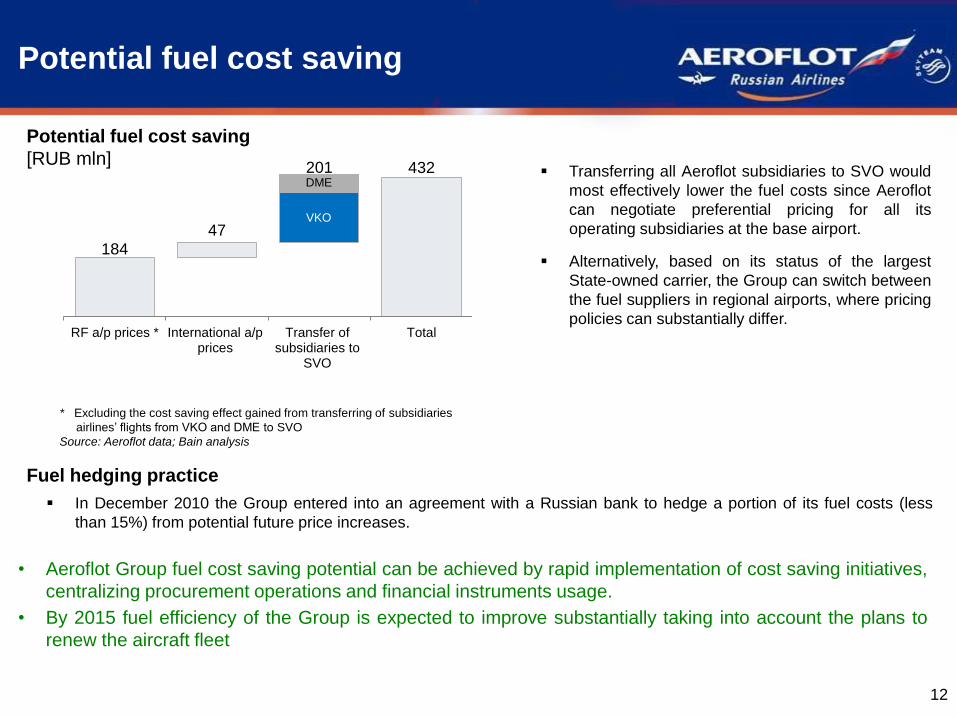
Potential fuel cost saving
12
Potential fuel cost saving
[RUB mln]
• Aeroflot Group fuel cost saving potential can be achieved by rapid implementation of cost saving initiatives,
centralizing procurement operations and financial instruments usage.
• By 2015 fuel efficiency of the Group is expected to improve substantially taking into account the plans to
renew the aircraft fleet
VKO
In December 2010 the Group entered into an agreement with a Russian bank to hedge a portion of its fuel costs (less
than 15%) from potential future price increases.
Fuel hedging practice
Transferring all Aeroflot subsidiaries to SVO would
most effectively lower the fuel costs since Aeroflot
can negotiate preferential pricing for all its
operating subsidiaries at the base airport.
Alternatively, based on its status of the largest
State-owned carrier, the Group can switch between
the fuel suppliers in regional airports, where pricing
policies can substantially differ.
* Excluding the cost saving effect gained from transferring of subsidiaries
airlines’ flights from VKO and DME to SVO
Source: Aeroflot data; Bain analysis
184
432
47
201
RF a/p prices * International a/pprices
Transfer ofsubsidiaries to
SVO
Total
DME
VKO
R: 182
G: 196
B: 204
R: 135
G: 157
B: 179
R: 59
G: 100
B: 135
Цвета заливки графиков и фигур
R: 22
G: 44
B: 66
R: 178
G: 178
B: 178
Цвет контура
R: 0
G: 176
B: 80
R: 0
G: 112
B: 192
R: 255
G: 255
B: 255
R: 0
G: 0
B: 0
R: 255
G: 0
B: 0
R: 1
G: 40
B: 120
R: 0
G: 128
B: 0
Цвет текста
292 228
329 261
JSC "Aeroflot" Aeroflot Group
0,86 0,74
1,00 0,80
JSC "Aeroflot" Aeroflot Group
2,64 2,07
2,95 2,24
JSC "Aeroflot" Aeroflot Group
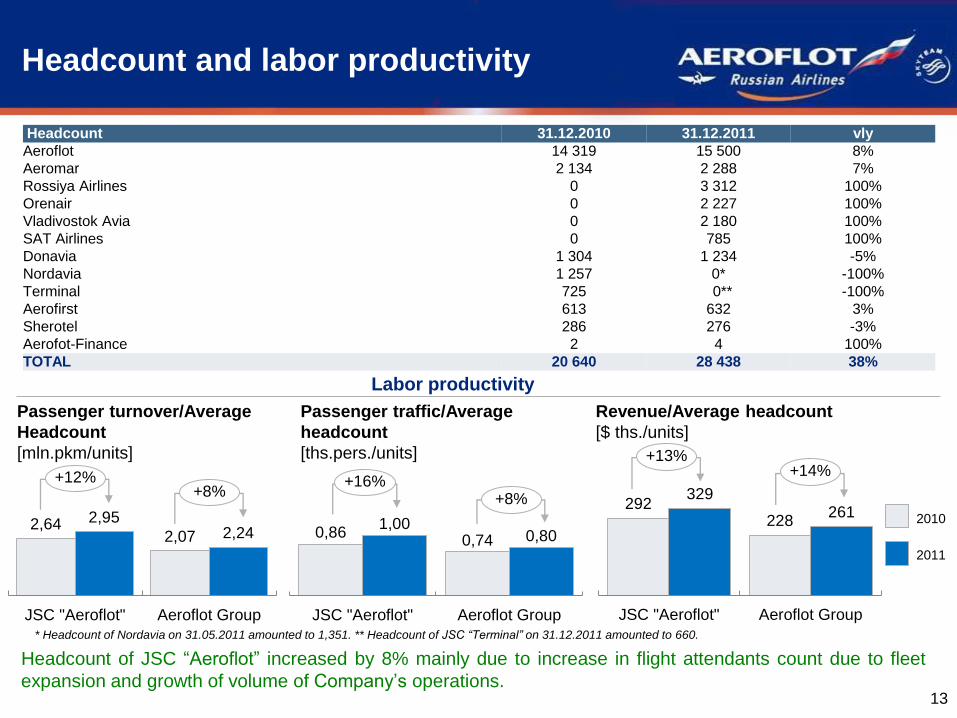
Headcount and labor productivity
Headcount of JSC “Aeroflot” increased by 8% mainly due to increase in flight attendants count due to fleet
expansion and growth of volume of Company’s operations. 13
Passenger turnover/Average
Headcount
[mln.pkm/units]
Passenger traffic/Average
headcount
[ths.pers./units]
2010
2011
+12% +8% +8%
Labor productivity
Revenue/Average headcount
[$ ths./units]
+13% +14%
* Headcount of Nordavia on 31.05.2011 amounted to 1,351. ** Headcount of JSC “Terminal” on 31.12.2011 amounted to 660.
+16%
Headcount 31.12.2010 31.12.2011 vly
Aeroflot 14 319 15 500 8%
Aeromar 2 134 2 288 7%
Rossiya Airlines 0 3 312 100%
Orenair 0 2 227 100%
Vladivostok Avia 0 2 180 100%
SAT Airlines 0 785 100%
Donavia 1 304 1 234 -5%
Nordavia 1 257 0* -100%
Terminal 725 0** -100%
Aerofirst 613 632 3%
Sherotel 286 276 -3%
Aerofot-Finance 2 4 100%
TOTAL 20 640 28 438 38%
R: 182
G: 196
B: 204
R: 135
G: 157
B: 179
R: 59
G: 100
B: 135
Цвета заливки графиков и фигур
R: 22
G: 44
B: 66
R: 178
G: 178
B: 178
Цвет контура
R: 0
G: 176
B: 80
R: 0
G: 112
B: 192
R: 255
G: 255
B: 255
R: 0
G: 0
B: 0
R: 255
G: 0
B: 0
R: 1
G: 40
B: 120
R: 0
G: 128
B: 0
Цвет текста
70,4
72,6
74,6 75,4
76,0
79,2
84,4
83,5
80,6
77,8
72,6 70,9
70,9
73,4 75,0
76,3
74,9
77,5
83,7
84,4
81,0
78,5
74,3 72,8
72,0 73,2
3 789 3 365 3 797 3 674
4 217 4 676 4 990 5 039
4 705 4 405
4 054 4 092
4 403 3 935
4 364 4 378 4 790
5 110 5 389 5 369 5 079 4 824
5 696
6 626 6 776
6 168
6 834
6 172
5 116 5 089
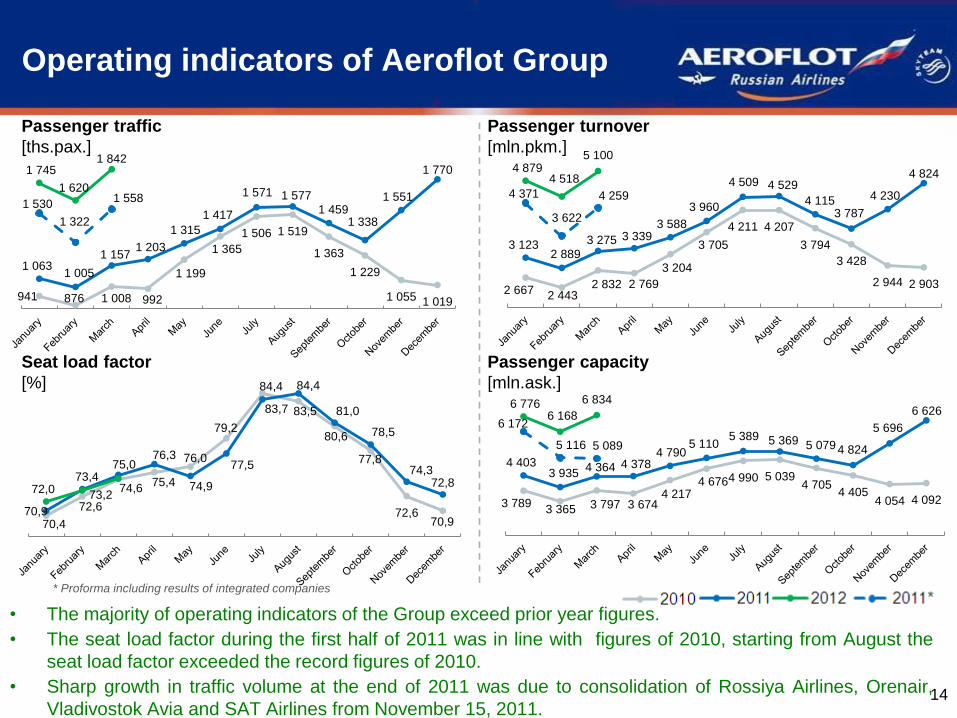
Operating indicators of Aeroflot Group
• The majority of operating indicators of the Group exceed prior year figures.
• The seat load factor during the first half of 2011 was in line with figures of 2010, starting from August the
seat load factor exceeded the record figures of 2010.
• Sharp growth in traffic volume at the end of 2011 was due to consolidation of Rossiya Airlines, Orenair,
Vladivostok Avia and SAT Airlines from November 15, 2011. 14
Passenger traffic
[ths.pax.]
Seat load factor
[%]
Passenger turnover
[mln.pkm.]
Passenger capacity
[mln.ask.]
* Proforma including results of integrated companies
941 876 1 008 992
1 199
1 365
1 506 1 519
1 363
1 229
1 055 1 019
1 063 1 005
1 157 1 203
1 315
1 417
1 571 1 577 1 459
1 338
1 551
1 770 1 745
1 620
1 842
1 530
1 322
1 558
2 667 2 443 2 832 2 769
3 204
3 705
4 211 4 207
3 794
3 428
2 944 2 903
3 123 2 889
3 275 3 339 3 588
3 960
4 509 4 529
4 115 3 787
4 230
4 824 4 879
4 518
5 100
4 371
3 622
4 259
R: 182
G: 196
B: 204
R: 135
G: 157
B: 179
R: 59
G: 100
B: 135
Цвета заливки графиков и фигур
R: 22
G: 44
B: 66
R: 178
G: 178
B: 178
Цвет контура
R: 0
G: 176
B: 80
R: 0
G: 112
B: 192
R: 255
G: 255
B: 255
R: 0
G: 0
B: 0
R: 255
G: 0
B: 0
R: 1
G: 40
B: 120
R: 0
G: 128
B: 0
Цвет текста
29,3 29,7 29,6 30,0
JSC "Aeroflot" Aeroflot Group
8,6 8,7 8,9 9,1
JSC "Aeroflot" Aeroflot Group
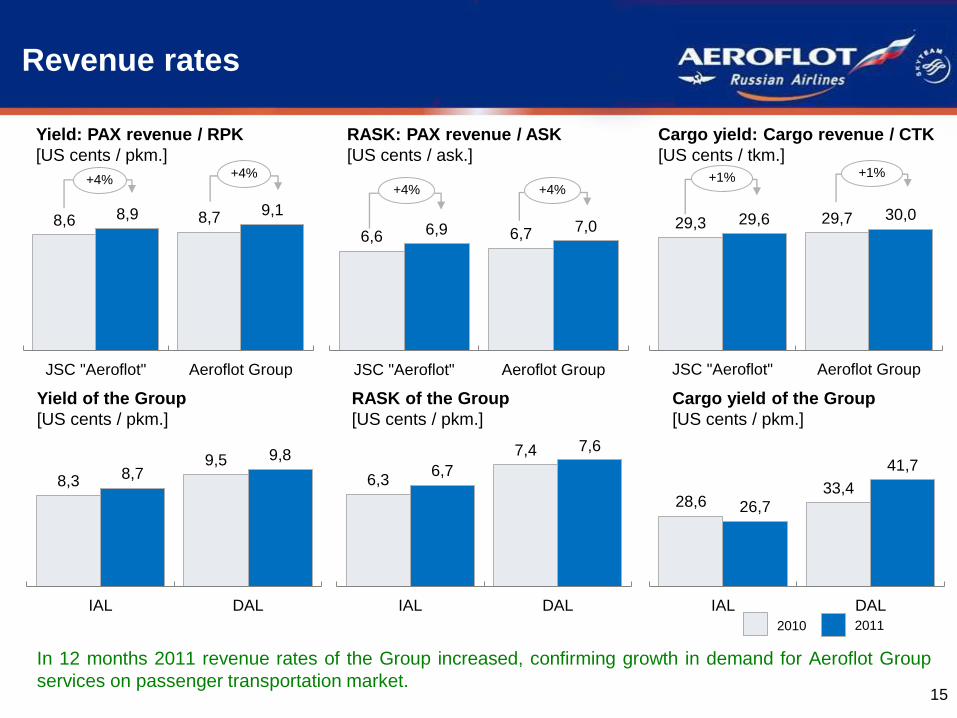
Revenue rates
In 12 months 2011 revenue rates of the Group increased, confirming growth in demand for Aeroflot Group
services on passenger transportation market. 15
Yield: PAX revenue / RPK
[US cents / pkm.]
RASK: PAX revenue / ASK
[US cents / ask.]
Cargo yield: Cargo revenue / CTK
[US cents / tkm.]
+4% +4%
+4%
+4% +1% +1%
Yield of the Group
[US cents / pkm.]
RASK of the Group
[US cents / pkm.]
Cargo yield of the Group
[US cents / pkm.]
2010 2011
8,3
9,5 8,7
9,8
IAL DAL
6,3
7,4
6,7
7,6
IAL DAL
28,6 33,4
26,7
41,7
IAL DAL
6,6 6,7 6,9 7,0
JSC "Aeroflot" Aeroflot Group
R: 182
G: 196
B: 204
R: 135
G: 157
B: 179
R: 59
G: 100
B: 135
Цвета заливки графиков и фигур
R: 22
G: 44
B: 66
R: 178
G: 178
B: 178
Цвет контура
R: 0
G: 176
B: 80
R: 0
G: 112
B: 192
R: 255
G: 255
B: 255
R: 0
G: 0
B: 0
R: 255
G: 0
B: 0
R: 1
G: 40
B: 120
R: 0
G: 128
B: 0
Цвет текста
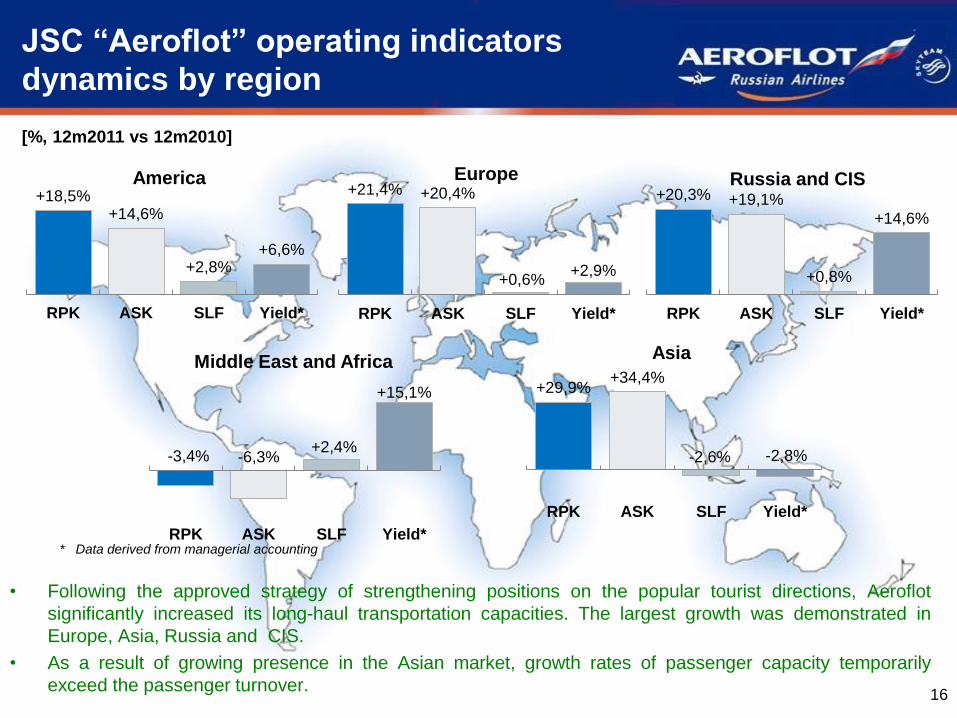
JSC “Aeroflot” operating indicators
dynamics by region
• Following the approved strategy of strengthening positions on the popular tourist directions, Aeroflot
significantly increased its long-haul transportation capacities. The largest growth was demonstrated in
Europe, Asia, Russia and CIS.
• As a result of growing presence in the Asian market, growth rates of passenger capacity temporarily
exceed the passenger turnover. 16
* Data derived from managerial accounting
[%, 12m2011 vs 12m2010]
+18,5% +14,6%
+2,8% +6,6%
RPK ASK SLF Yield*
America +21,4% +20,4%
+0,6% +2,9%
RPK ASK SLF Yield*
Europe +20,3% +19,1%
+0,8%
+14,6%
RPK ASK SLF Yield*
Russia and CIS
-3,4% -6,3% +2,4%
+15,1%
RPK ASK SLF Yield*
Middle East and Africa
+29,9% +34,4%
-2,6% -2,8%
RPK ASK SLF Yield*
Asia
R: 182
G: 196
B: 204
R: 135
G: 157
B: 179
R: 59
G: 100
B: 135
Цвета заливки графиков и фигур
R: 22
G: 44
B: 66
R: 178
G: 178
B: 178
Цвет контура
R: 0
G: 176
B: 80
R: 0
G: 112
B: 192
R: 255
G: 255
B: 255
R: 0
G: 0
B: 0
R: 255
G: 0
B: 0
R: 1
G: 40
B: 120
R: 0
G: 128
B: 0
Цвет текста
286 278
1 0,8 11
7 14
2010 Europe Asia NorthAmerica
Others Russia 2011
3 331
4 110
333 212 16 26
192
2010 Europe Asia NorthAmerica
Others Russia 2011
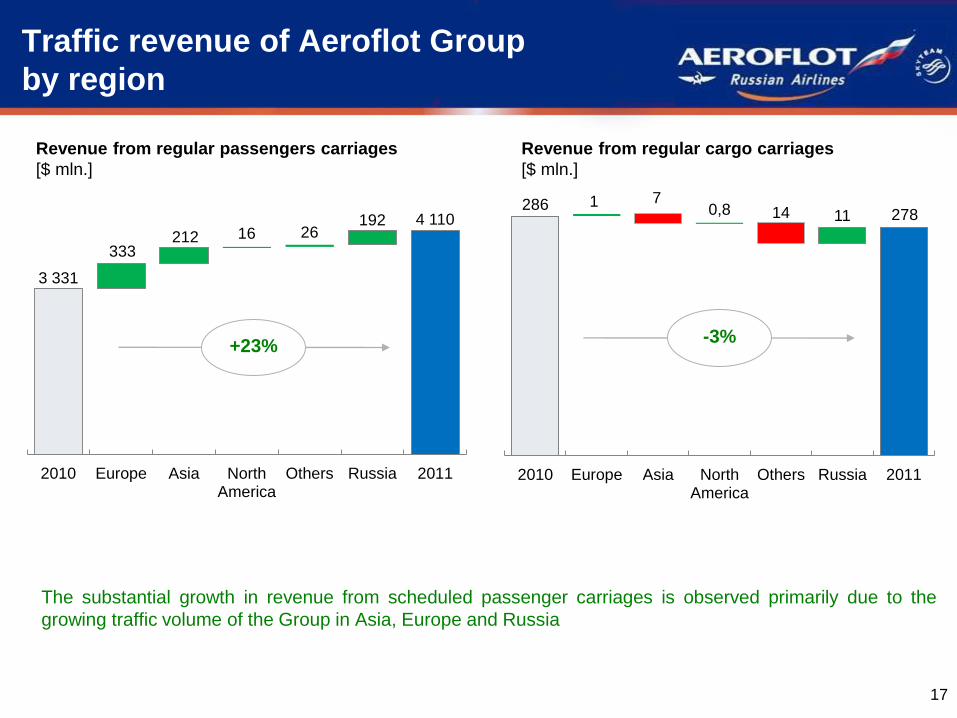
Traffic revenue of Aeroflot Group
by region
The substantial growth in revenue from scheduled passenger carriages is observed primarily due to the
growing traffic volume of the Group in Asia, Europe and Russia
17
Revenue from regular passengers carriages
[$ mln.]
Revenue from regular cargo carriages
[$ mln.]
+23% -3%
R: 182
G: 196
B: 204
R: 135
G: 157
B: 179
R: 59
G: 100
B: 135
Цвета заливки графиков и фигур
R: 22
G: 44
B: 66
R: 178
G: 178
B: 178
Цвет контура
R: 0
G: 176
B: 80
R: 0
G: 112
B: 192
R: 255
G: 255
B: 255
R: 0
G: 0
B: 0
R: 255
G: 0
B: 0
R: 1
G: 40
B: 120
R: 0
G: 128
B: 0
Цвет текста
Table of contents
1.Introduction
2.Market position of the Group
3.Operating highlights
4.Financial results
5.Conclusions
6.Subsidiary airlines
18
R: 182
G: 196
B: 204
R: 135
G: 157
B: 179
R: 59
G: 100
B: 135
Цвета заливки графиков и фигур
R: 22
G: 44
B: 66
R: 178
G: 178
B: 178
Цвет контура
R: 0
G: 176
B: 80
R: 0
G: 112
B: 192
R: 255
G: 255
B: 255
R: 0
G: 0
B: 0
R: 255
G: 0
B: 0
R: 1
G: 40
B: 120
R: 0
G: 128
B: 0
Цвет текста
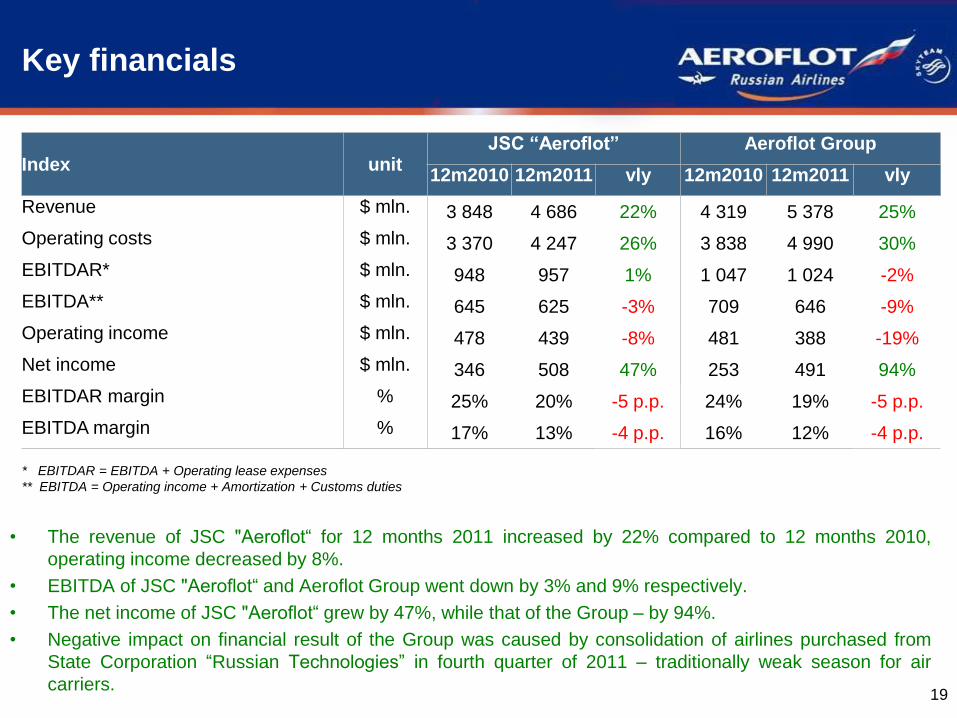
Key financials
• The revenue of JSC "Aeroflot“ for 12 months 2011 increased by 22% compared to 12 months 2010,
operating income decreased by 8%.
• EBITDA of JSC "Aeroflot“ and Aeroflot Group went down by 3% and 9% respectively.
• The net income of JSC "Aeroflot“ grew by 47%, while that of the Group – by 94%.
• Negative impact on financial result of the Group was caused by consolidation of airlines purchased from
State Corporation “Russian Technologies” in fourth quarter of 2011 – traditionally weak season for air
carriers. 19
* EBITDAR = EBITDA + Operating lease expenses
** EBITDA = Operating income + Amortization + Customs duties
Index unit JSC “Aeroflot” Aeroflot Group
12m2010 12m2011 vly 12m2010 12m2011 vly
Revenue $ mln. 3 848 4 686 22% 4 319 5 378 25%
Operating costs $ mln. 3 370 4 247 26% 3 838 4 990 30%
EBITDAR* $ mln. 948 957 1% 1 047 1 024 -2%
EBITDA** $ mln. 645 625 -3% 709 646 -9%
Operating income $ mln. 478 439 -8% 481 388 -19%
Net income $ mln. 346 508 47% 253 491 94%
EBITDAR margin % 25% 20% -5 p.p. 24% 19% -5 p.p.
EBITDA margin % 17% 13% -4 p.p. 16% 12% -4 p.p.
R: 182
G: 196
B: 204
R: 135
G: 157
B: 179
R: 59
G: 100
B: 135
Цвета заливки графиков и фигур
R: 22
G: 44
B: 66
R: 178
G: 178
B: 178
Цвет контура
R: 0
G: 176
B: 80
R: 0
G: 112
B: 192
R: 255
G: 255
B: 255
R: 0
G: 0
B: 0
R: 255
G: 0
B: 0
R: 1
G: 40
B: 120
R: 0
G: 128
B: 0
Цвет текста
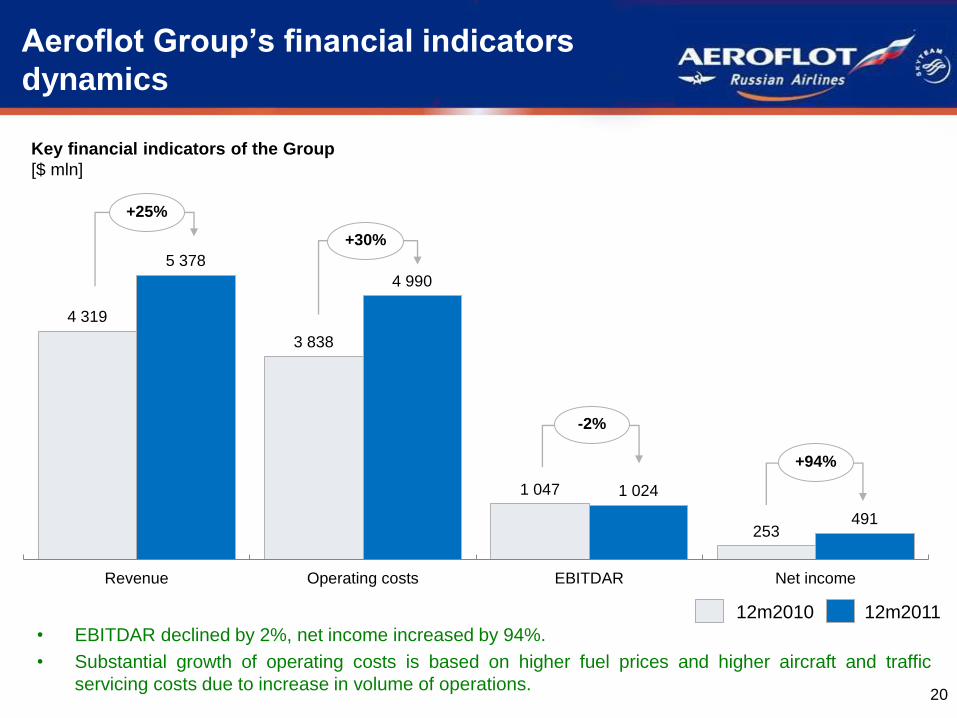
Aeroflot Group’s financial indicators
dynamics
• EBITDAR declined by 2%, net income increased by 94%.
• Substantial growth of operating costs is based on higher fuel prices and higher aircraft and traffic
servicing costs due to increase in volume of operations. 20
Key financial indicators of the Group
[$ mln]
-2%
+30%
+25%
12m2010 12m2011
+94%
4 319
3 838
1 047
253
5 378
4 990
1 024
491
Revenue Operating costs EBITDAR Net income
R: 182
G: 196
B: 204
R: 135
G: 157
B: 179
R: 59
G: 100
B: 135
Цвета заливки графиков и фигур
R: 22
G: 44
B: 66
R: 178
G: 178
B: 178
Цвет контура
R: 0
G: 176
B: 80
R: 0
G: 112
B: 192
R: 255
G: 255
B: 255
R: 0
G: 0
B: 0
R: 255
G: 0
B: 0
R: 1
G: 40
B: 120
R: 0
G: 128
B: 0
Цвет текста
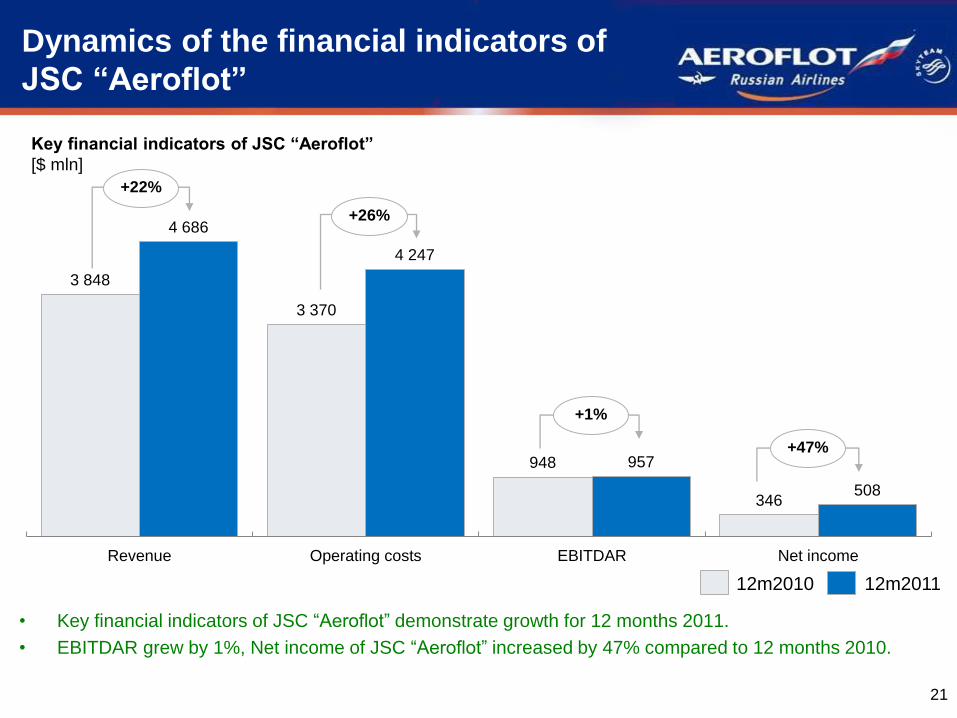
Dynamics of the financial indicators of
JSC “Aeroflot”
• Key financial indicators of JSC “Aeroflot” demonstrate growth for 12 months 2011.
• EBITDAR grew by 1%, Net income of JSC “Aeroflot” increased by 47% compared to 12 months 2010.
21
Key financial indicators of JSC “Aeroflot”
[$ mln]
+22%
+26%
+1%
+47%
12m2010 12m2011
3 848
3 370
948
346
4 686
4 247
957
508
Revenue Operating costs EBITDAR Net income
R: 182
G: 196
B: 204
R: 135
G: 157
B: 179
R: 59
G: 100
B: 135
Цвета заливки графиков и фигур
R: 22
G: 44
B: 66
R: 178
G: 178
B: 178
Цвет контура
R: 0
G: 176
B: 80
R: 0
G: 112
B: 192
R: 255
G: 255
B: 255
R: 0
G: 0
B: 0
R: 255
G: 0
B: 0
R: 1
G: 40
B: 120
R: 0
G: 128
B: 0
Цвет текста
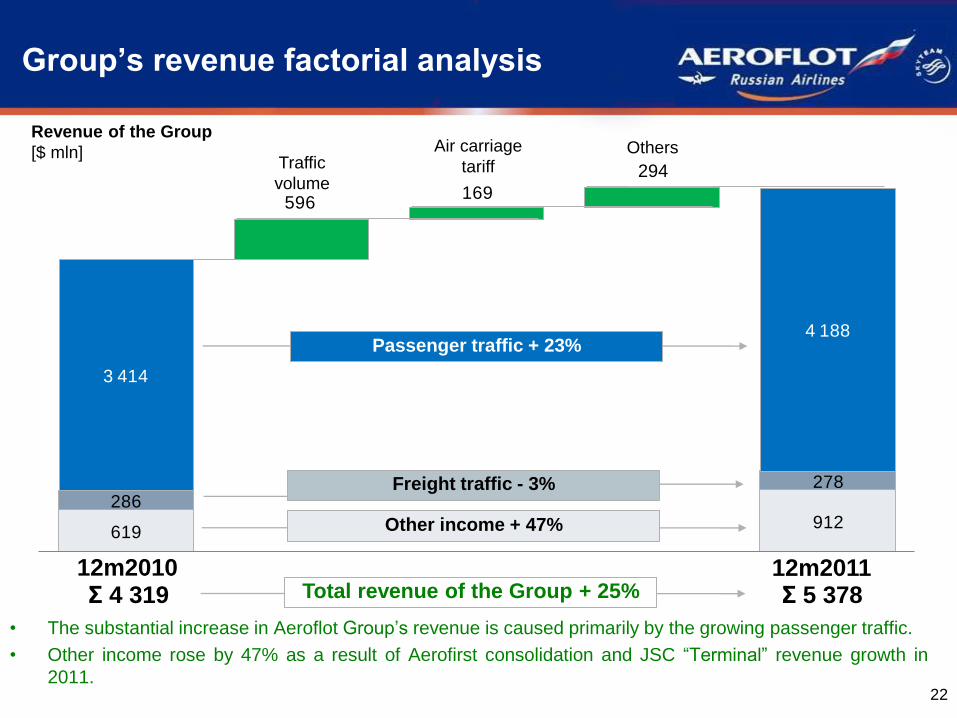
619912
286278
3 414
596169
293
4 188
Group’s revenue factorial analysis
• The substantial increase in Aeroflot Group’s revenue is caused primarily by the growing passenger traffic.
• Other income rose by 47% as a result of Aerofirst consolidation and JSC “Terminal” revenue growth in
2011. 22
Revenue of the Group
[$ mln] Traffic
volume
Air carriage
tariff Others
Passenger traffic + 23%
Freight traffic - 3%
Other income + 47%
Σ 4 319 Σ 5 378 Total revenue of the Group + 25% 12m2010 12m2011
294
R: 182
G: 196
B: 204
R: 135
G: 157
B: 179
R: 59
G: 100
B: 135
Цвета заливки графиков и фигур
R: 22
G: 44
B: 66
R: 178
G: 178
B: 178
Цвет контура
R: 0
G: 176
B: 80
R: 0
G: 112
B: 192
R: 255
G: 255
B: 255
R: 0
G: 0
B: 0
R: 255
G: 0
B: 0
R: 1
G: 40
B: 120
R: 0
G: 128
B: 0
Цвет текста
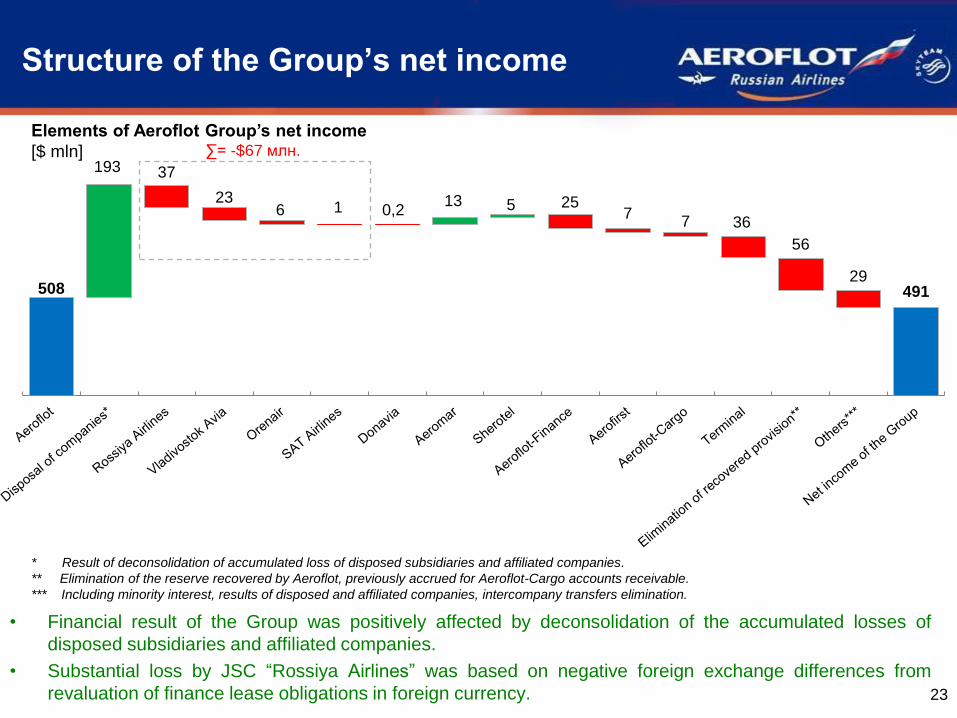
508 491
193
13 5
37
23 6 1 0,2
25 7
7 36
56
29
Structure of the Group’s net income
• Financial result of the Group was positively affected by deconsolidation of the accumulated losses of
disposed subsidiaries and affiliated companies.
• Substantial loss by JSC “Rossiya Airlines” was based on negative foreign exchange differences from
revaluation of finance lease obligations in foreign currency. 23
Elements of Aeroflot Group’s net income
[$ mln]
* Result of deconsolidation of accumulated loss of disposed subsidiaries and affiliated companies.
** Elimination of the reserve recovered by Aeroflot, previously accrued for Aeroflot-Cargo accounts receivable.
*** Including minority interest, results of disposed and affiliated companies, intercompany transfers elimination.
∑= -$67 млн.
R: 182
G: 196
B: 204
R: 135
G: 157
B: 179
R: 59
G: 100
B: 135
Цвета заливки графиков и фигур
R: 22
G: 44
B: 66
R: 178
G: 178
B: 178
Цвет контура
R: 0
G: 176
B: 80
R: 0
G: 112
B: 192
R: 255
G: 255
B: 255
R: 0
G: 0
B: 0
R: 255
G: 0
B: 0
R: 1
G: 40
B: 120
R: 0
G: 128
B: 0
Цвет текста
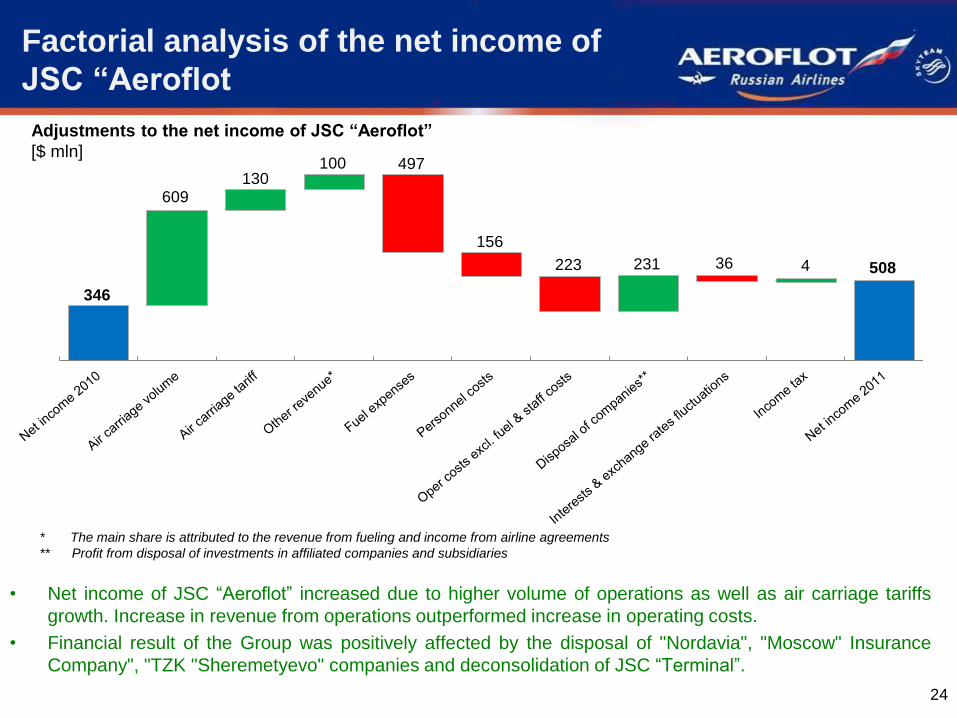
346
508
609 130
100
231 4
497
156
223 36
Factorial analysis of the net income of
JSC “Aeroflot
• Net income of JSC “Aeroflot” increased due to higher volume of operations as well as air carriage tariffs
growth. Increase in revenue from operations outperformed increase in operating costs.
• Financial result of the Group was positively affected by the disposal of "Nordavia", "Moscow" Insurance
Company", "TZK "Sheremetyevo" companies and deconsolidation of JSC “Terminal”.
24
Adjustments to the net income of JSC “Aeroflot”
[$ mln]
* The main share is attributed to the revenue from fueling and income from airline agreements
** Profit from disposal of investments in affiliated companies and subsidiaries
R: 182
G: 196
B: 204
R: 135
G: 157
B: 179
R: 59
G: 100
B: 135
Цвета заливки графиков и фигур
R: 22
G: 44
B: 66
R: 178
G: 178
B: 178
Цвет контура
R: 0
G: 176
B: 80
R: 0
G: 112
B: 192
R: 255
G: 255
B: 255
R: 0
G: 0
B: 0
R: 255
G: 0
B: 0
R: 1
G: 40
B: 120
R: 0
G: 128
B: 0
Цвет текста
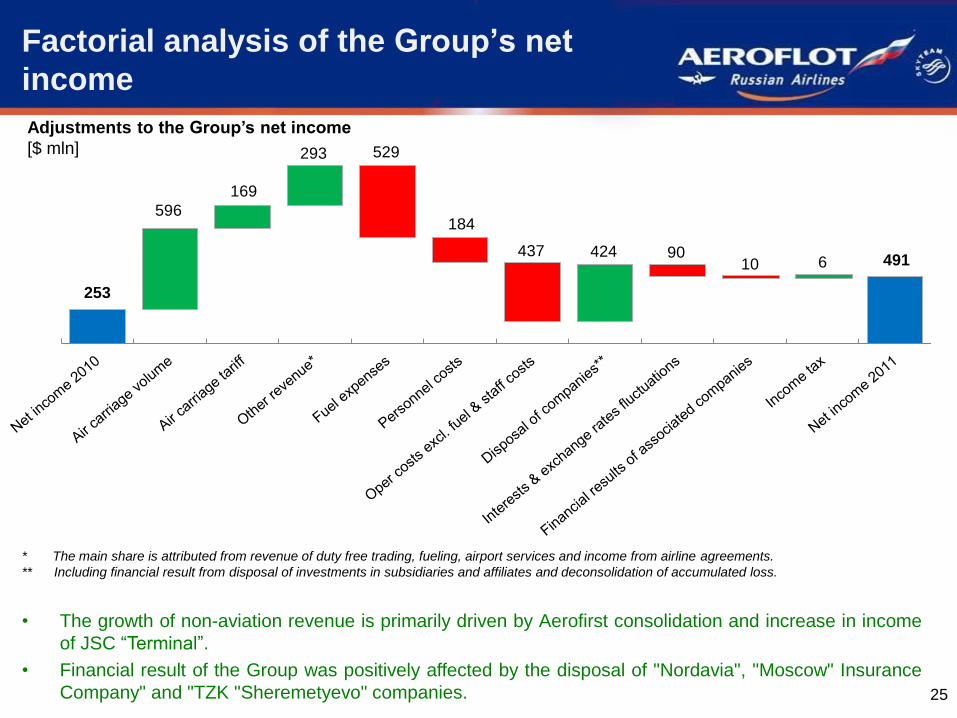
253
491
596
169
293
424 6
529
184
437 90 10
Factorial analysis of the Group’s net
income
25
• The growth of non-aviation revenue is primarily driven by Aerofirst consolidation and increase in income
of JSC “Terminal”.
• Financial result of the Group was positively affected by the disposal of "Nordavia", "Moscow" Insurance
Company" and "TZK "Sheremetyevo" companies.
Adjustments to the Group’s net income
[$ mln]
* The main share is attributed from revenue of duty free trading, fueling, airport services and income from airline agreements.
** Including financial result from disposal of investments in subsidiaries and affiliates and deconsolidation of accumulated loss.
R: 182
G: 196
B: 204
R: 135
G: 157
B: 179
R: 59
G: 100
B: 135
Цвета заливки графиков и фигур
R: 22
G: 44
B: 66
R: 178
G: 178
B: 178
Цвет контура
R: 0
G: 176
B: 80
R: 0
G: 112
B: 192
R: 255
G: 255
B: 255
R: 0
G: 0
B: 0
R: 255
G: 0
B: 0
R: 1
G: 40
B: 120
R: 0
G: 128
B: 0
Цвет текста
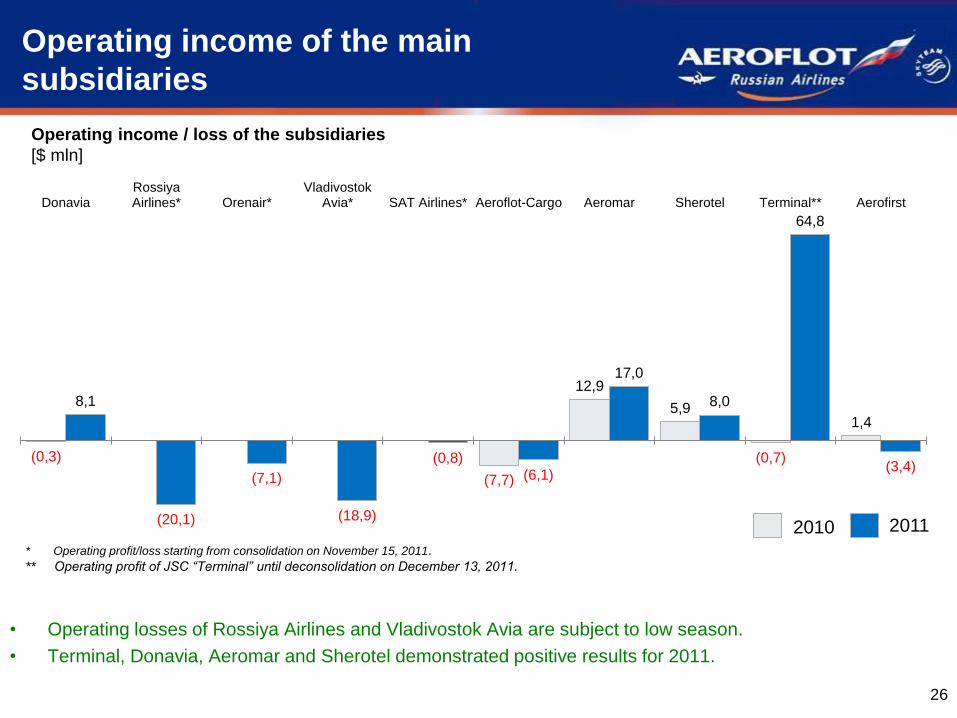
Operating income of the main
subsidiaries
• Operating losses of Rossiya Airlines and Vladivostok Avia are subject to low season.
• Terminal, Donavia, Aeromar and Sherotel demonstrated positive results for 2011.
26
2010
Operating income / loss of the subsidiaries
[$ mln]
2011
* Operating profit/loss starting from consolidation on November 15, 2011.
** Operating profit of JSC “Terminal” until deconsolidation on December 13, 2011.
(0,3)
(7,7)
12,9
5,9
(0,7)
1,4
8,1
(20,1)
(7,1)
(18,9)
(0,8) (6,1)
17,0
8,0
64,8
(3,4)
DonaviaRossiyaAirlines* Orenair*
VladivostokAvia* SAT Airlines* Aeroflot-Cargo Aeromar Sherotel Terminal** Aerofirst
R: 182
G: 196
B: 204
R: 135
G: 157
B: 179
R: 59
G: 100
B: 135
Цвета заливки графиков и фигур
R: 22
G: 44
B: 66
R: 178
G: 178
B: 178
Цвет контура
R: 0
G: 176
B: 80
R: 0
G: 112
B: 192
R: 255
G: 255
B: 255
R: 0
G: 0
B: 0
R: 255
G: 0
B: 0
R: 1
G: 40
B: 120
R: 0
G: 128
B: 0
Цвет текста
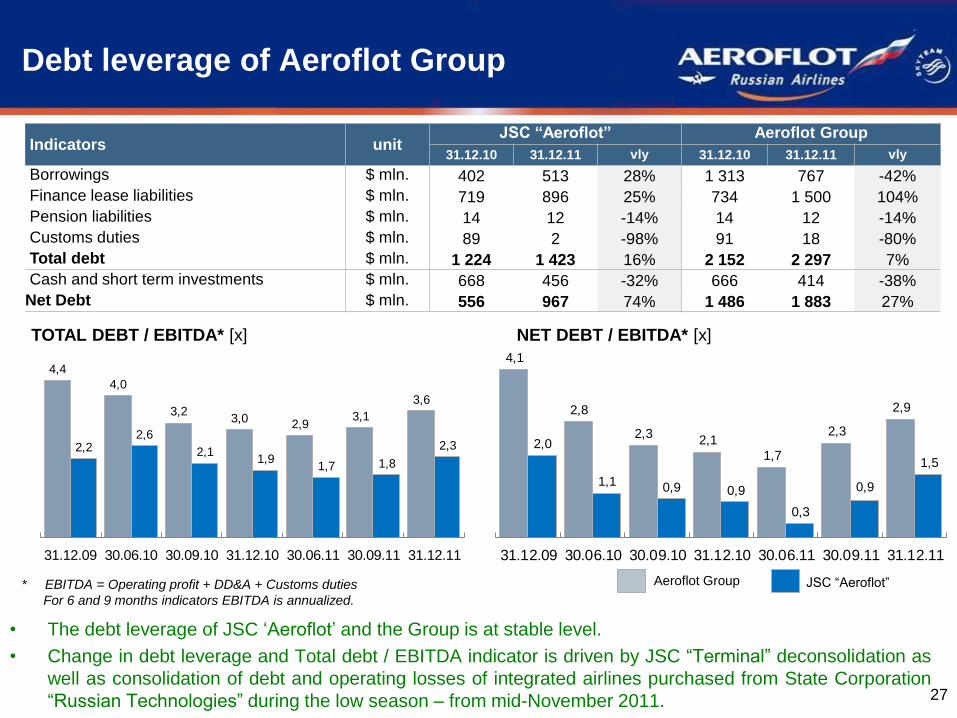
TOTAL DEBT / EBITDA* [x]
Debt leverage of Aeroflot Group
• The debt leverage of JSC ‘Aeroflot’ and the Group is at stable level.
• Change in debt leverage and Total debt / EBITDA indicator is driven by JSC “Terminal” deconsolidation as
well as consolidation of debt and operating losses of integrated airlines purchased from State Corporation
“Russian Technologies” during the low season – from mid-November 2011. 27
NET DEBT / EBITDA* [x]
Aeroflot Group JSC “Aeroflot” * EBITDA = Operating profit + DD&A + Customs duties
For 6 and 9 months indicators EBITDA is annualized.
4,1
2,8
2,32,1
1,7
2,3
2,9
2,0
1,1 0,9 0,9
0,3
0,9
1,5
31.12.09 30.06.10 30.09.10 31.12.10 30.06.11 30.09.11 31.12.11
4,4
4,0
3,23,0
2,93,1
3,6
2,22,6
2,11,9
1,7 1,8
2,3
31.12.09 30.06.10 30.09.10 31.12.10 30.06.11 30.09.11 31.12.11
Indicators unit JSC “Aeroflot” Aeroflot Group
31.12.10 31.12.11 vly 31.12.10 31.12.11 vly
Borrowings $ mln. 402 513 28% 1 313 767 -42%
Finance lease liabilities $ mln. 719 896 25% 734 1 500 104%
Pension liabilities $ mln. 14 12 -14% 14 12 -14%
Customs duties $ mln. 89 2 -98% 91 18 -80%
Total debt $ mln. 1 224 1 423 16% 2 152 2 297 7%
Cash and short term investments $ mln. 668 456 -32% 666 414 -38%
Net Debt $ mln. 556 967 74% 1 486 1 883 27%
R: 182
G: 196
B: 204
R: 135
G: 157
B: 179
R: 59
G: 100
B: 135
Цвета заливки графиков и фигур
R: 22
G: 44
B: 66
R: 178
G: 178
B: 178
Цвет контура
R: 0
G: 176
B: 80
R: 0
G: 112
B: 192
R: 255
G: 255
B: 255
R: 0
G: 0
B: 0
R: 255
G: 0
B: 0
R: 1
G: 40
B: 120
R: 0
G: 128
B: 0
Цвет текста
15%
11%
7%
11% 11% 10%
6%
10%
Aeroflot Group DeutscheLufthansa
Air France-KLM Turkish Airlines
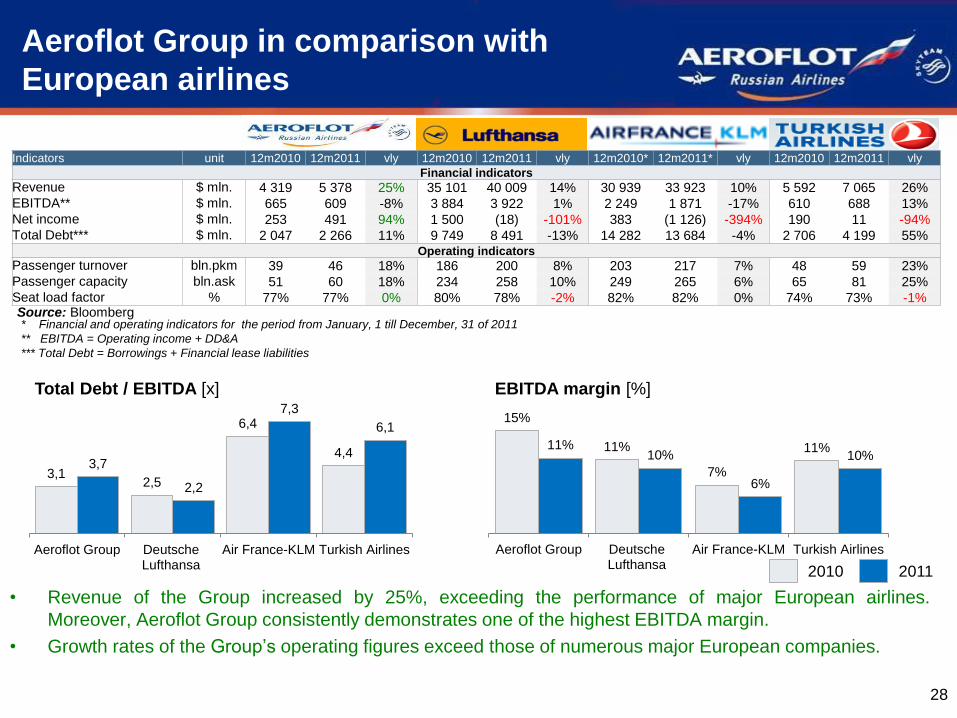
Aeroflot Group in comparison with
European airlines
• Revenue of the Group increased by 25%, exceeding the performance of major European airlines.
Moreover, Aeroflot Group consistently demonstrates one of the highest EBITDA margin.
• Growth rates of the Group’s operating figures exceed those of numerous major European companies.
28
2010
Total Debt / EBITDA [x] EBITDA margin [%]
* Financial and operating indicators for the period from January, 1 till December, 31 of 2011
** EBITDA = Operating income + DD&A
*** Total Debt = Borrowings + Financial lease liabilities
2011
Source: Bloomberg
Indicators unit 12m2010 12m2011 vly 12m2010 12m2011 vly 12m2010* 12m2011* vly 12m2010 12m2011 vly
Financial indicators
Revenue $ mln. 4 319 5 378 25% 35 101 40 009 14% 30 939 33 923 10% 5 592 7 065 26% EBITDA** $ mln. 665 609 -8% 3 884 3 922 1% 2 249 1 871 -17% 610 688 13% Net income $ mln. 253 491 94% 1 500 (18) -101% 383 (1 126) -394% 190 11 -94% Total Debt*** $ mln. 2 047 2 266 11% 9 749 8 491 -13% 14 282 13 684 -4% 2 706 4 199 55%
Operating indicators
Passenger turnover bln.pkm 39 46 18% 186 200 8% 203 217 7% 48 59 23% Passenger capacity bln.ask 51 60 18% 234 258 10% 249 265 6% 65 81 25% Seat load factor % 77% 77% 0% 80% 78% -2% 82% 82% 0% 74% 73% -1%
3,1 2,5
6,4
4,4 3,7
2,2
7,3
6,1
Aeroflot Group DeutscheLufthansa
Air France-KLM Turkish Airlines
R: 182
G: 196
B: 204
R: 135
G: 157
B: 179
R: 59
G: 100
B: 135
Цвета заливки графиков и фигур
R: 22
G: 44
B: 66
R: 178
G: 178
B: 178
Цвет контура
R: 0
G: 176
B: 80
R: 0
G: 112
B: 192
R: 255
G: 255
B: 255
R: 0
G: 0
B: 0
R: 255
G: 0
B: 0
R: 1
G: 40
B: 120
R: 0
G: 128
B: 0
Цвет текста
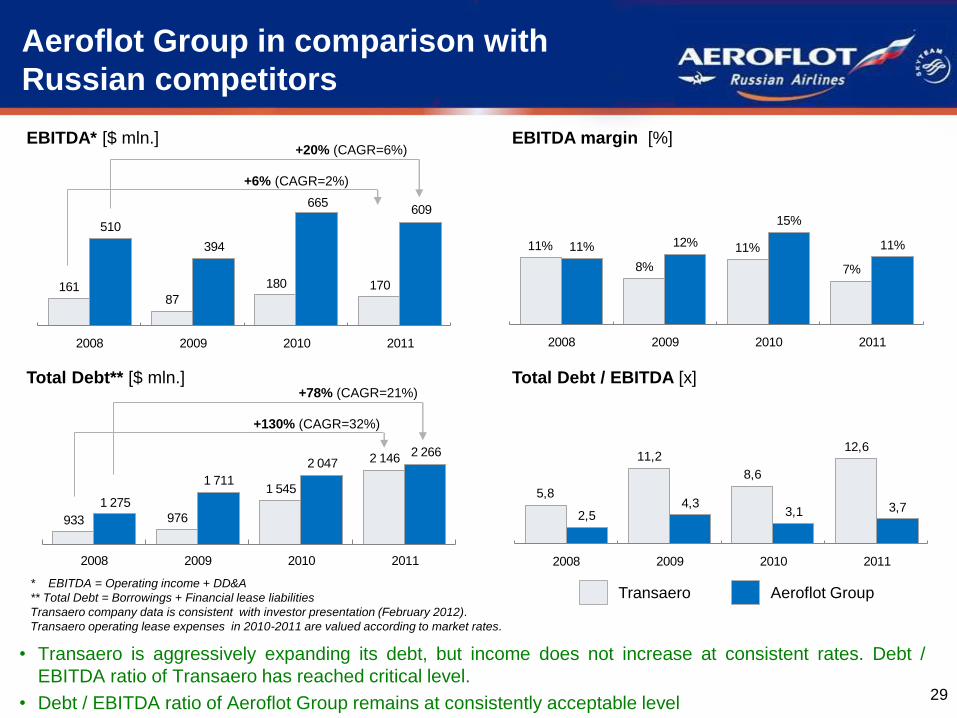
Aeroflot Group in comparison with
Russian competitors
• Transaero is aggressively expanding its debt, but income does not increase at consistent rates. Debt /
EBITDA ratio of Transaero has reached critical level.
• Debt / EBITDA ratio of Aeroflot Group remains at consistently acceptable level 29
EBITDA* [$ mln.] EBITDA margin [%]
Total Debt** [$ mln.] Total Debt / EBITDA [x]
* EBITDA = Operating income + DD&A
** Total Debt = Borrowings + Financial lease liabilities
Transaero company data is consistent with investor presentation (February 2012).
Transaero operating lease expenses in 2010-2011 are valued according to market rates.
161 87
180 170
510
394
665 609
2008 2009 2010 2011
933 976
1 545
2 146
1 275
1 711
2 047 2 266
2008 2009 2010 2011
11%
8%
11%
7%
11% 12%
15%
11%
2008 2009 2010 2011
5,8
11,2
8,6
12,6
2,54,3
3,1 3,7
2008 2009 2010 2011
+20% (CAGR=6%)
+6% (CAGR=2%)
+78% (CAGR=21%)
+130% (CAGR=32%)
Transaero Aeroflot Group
R: 182
G: 196
B: 204
R: 135
G: 157
B: 179
R: 59
G: 100
B: 135
Цвета заливки графиков и фигур
R: 22
G: 44
B: 66
R: 178
G: 178
B: 178
Цвет контура
R: 0
G: 176
B: 80
R: 0
G: 112
B: 192
R: 255
G: 255
B: 255
R: 0
G: 0
B: 0
R: 255
G: 0
B: 0
R: 1
G: 40
B: 120
R: 0
G: 128
B: 0
Цвет текста
Table of contents
1.Introduction
2.Market position of the Group
3.Operating highlights
4.Financial results
5.Conclusions
6.Subsidiary airlines
30
R: 182
G: 196
B: 204
R: 135
G: 157
B: 179
R: 59
G: 100
B: 135
Цвета заливки графиков и фигур
R: 22
G: 44
B: 66
R: 178
G: 178
B: 178
Цвет контура
R: 0
G: 176
B: 80
R: 0
G: 112
B: 192
R: 255
G: 255
B: 255
R: 0
G: 0
B: 0
R: 255
G: 0
B: 0
R: 1
G: 40
B: 120
R: 0
G: 128
B: 0
Цвет текста
Conclusions
• Twelve months of 2011 resulted in growth of main operating indicators. The actions taken to
refine the route network as well as wise revenue rates management speeded up the
operating and financial indicators growth during twelve months of 2011
• Revenue of Aeroflot rose by 22% compared to the same period in 2010, EBITDAR rose by
1%. Net profit of JSC "Aeroflot“ increased by 47%, while that of the Group increased by 94%
• The debt leverage of JSC “Aeroflot” and the Group is rather low. Following the
deconsolidation of JSC “Terminal” and consolidation of JSC “Rossiya Airlines”, JSC “SAT
Airlines”, JSC “Vladivostok Avia”, JSC “Orenburg Airlines” the Total Debt/EBITDA ratio
increased insignificantly to 3.6x
31
R: 182
G: 196
B: 204
R: 135
G: 157
B: 179
R: 59
G: 100
B: 135
Цвета заливки графиков и фигур
R: 22
G: 44
B: 66
R: 178
G: 178
B: 178
Цвет контура
R: 0
G: 176
B: 80
R: 0
G: 112
B: 192
R: 255
G: 255
B: 255
R: 0
G: 0
B: 0
R: 255
G: 0
B: 0
R: 1
G: 40
B: 120
R: 0
G: 128
B: 0
Цвет текста
Table of contents
1.Introduction
2.Market position of the Group
3.Operating highlights
4.Financial results
5.Conclusions
6.Subsidiary airlines
32
R: 182
G: 196
B: 204
R: 135
G: 157
B: 179
R: 59
G: 100
B: 135
Цвета заливки графиков и фигур
R: 22
G: 44
B: 66
R: 178
G: 178
B: 178
Цвет контура
R: 0
G: 176
B: 80
R: 0
G: 112
B: 192
R: 255
G: 255
B: 255
R: 0
G: 0
B: 0
R: 255
G: 0
B: 0
R: 1
G: 40
B: 120
R: 0
G: 128
B: 0
Цвет текста
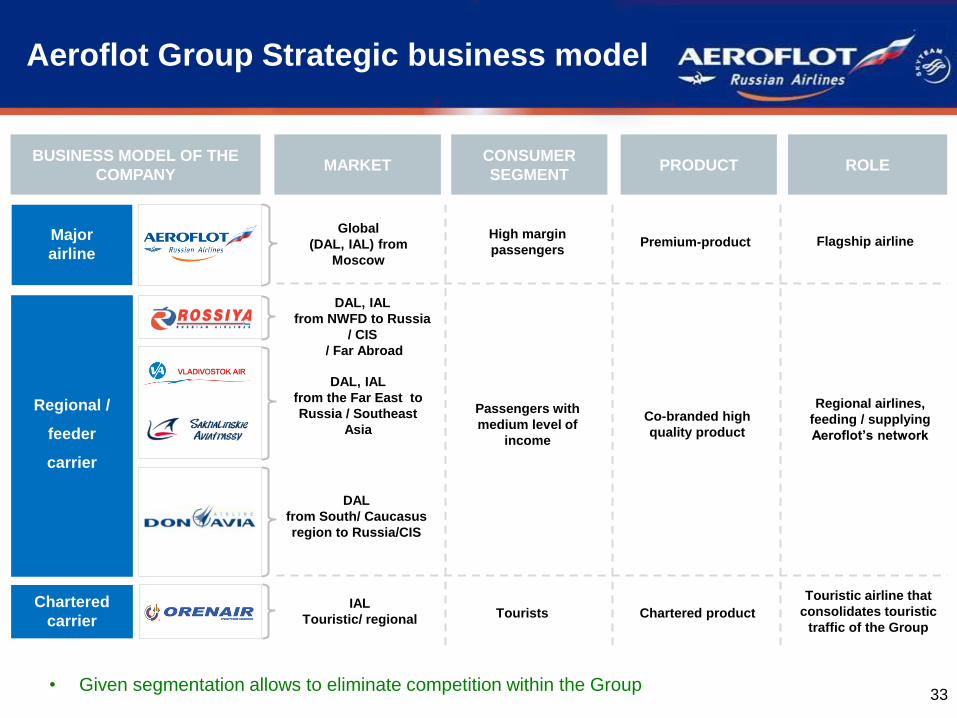
Aeroflot Group Strategic business model
• Given segmentation allows to eliminate competition within the Group
PRODUCT BUSINESS MODEL OF THE
COMPANY ROLE
CONSUMER
SEGMENT MARKET
Major
airline
High margin
passengers
Global
(DAL, IAL) from
Moscow
Premium-product Flagship airline
Regional /
feeder
carrier
Passengers with
medium level of
income
DAL, IAL
from NWFD to Russia
/ CIS
/ Far Abroad
Co-branded high
quality product
Regional airlines,
feeding / supplying
Aeroflot’s network
Chartered
carrier Tourists
IAL
Touristic/ regional Chartered product
Touristic airline that
consolidates touristic
traffic of the Group
DAL, IAL
from the Far East to
Russia / Southeast
Asia
DAL
from South/ Caucasus
region to Russia/CIS
.
33
R: 182
G: 196
B: 204
R: 135
G: 157
B: 179
R: 59
G: 100
B: 135
Цвета заливки графиков и фигур
R: 22
G: 44
B: 66
R: 178
G: 178
B: 178
Цвет контура
R: 0
G: 176
B: 80
R: 0
G: 112
B: 192
R: 255
G: 255
B: 255
R: 0
G: 0
B: 0
R: 255
G: 0
B: 0
R: 1
G: 40
B: 120
R: 0
G: 128
B: 0
Цвет текста
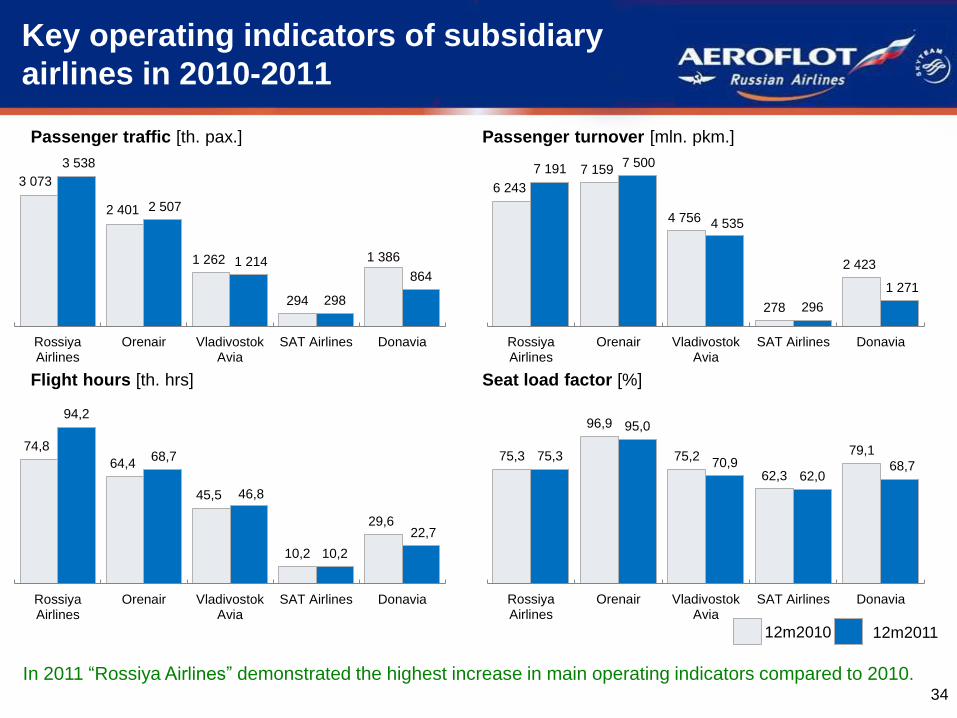
75,3
96,9
75,2
62,3
79,1 75,3
95,0
70,9 62,0
68,7
RossiyaAirlines
Orenair VladivostokAvia
SAT Airlines Donavia
12m2010 12m2011
Passenger traffic [th. pax.]
Flight hours [th. hrs] Seat load factor [%]
In 2011 “Rossiya Airlines” demonstrated the highest increase in main operating indicators compared to 2010.
Passenger turnover [mln. pkm.]
34
Key operating indicators of subsidiary
airlines in 2010-2011
3 073
2 401
1 262
294
1 386
3 538
2 507
1 214
298
864
RossiyaAirlines
Orenair VladivostokAvia
SAT Airlines Donavia
6 243
7 159
4 756
278
2 423
7 191 7 500
4 535
296
1 271
RossiyaAirlines
Orenair VladivostokAvia
SAT Airlines Donavia
74,8
64,4
45,5
10,2
29,6
94,2
68,7
46,8
10,2
22,7
RossiyaAirlines
Orenair VladivostokAvia
SAT Airlines Donavia
R: 182
G: 196
B: 204
R: 135
G: 157
B: 179
R: 59
G: 100
B: 135
Цвета заливки графиков и фигур
R: 22
G: 44
B: 66
R: 178
G: 178
B: 178
Цвет контура
R: 0
G: 176
B: 80
R: 0
G: 112
B: 192
R: 255
G: 255
B: 255
R: 0
G: 0
B: 0
R: 255
G: 0
B: 0
R: 1
G: 40
B: 120
R: 0
G: 128
B: 0
Цвет текста
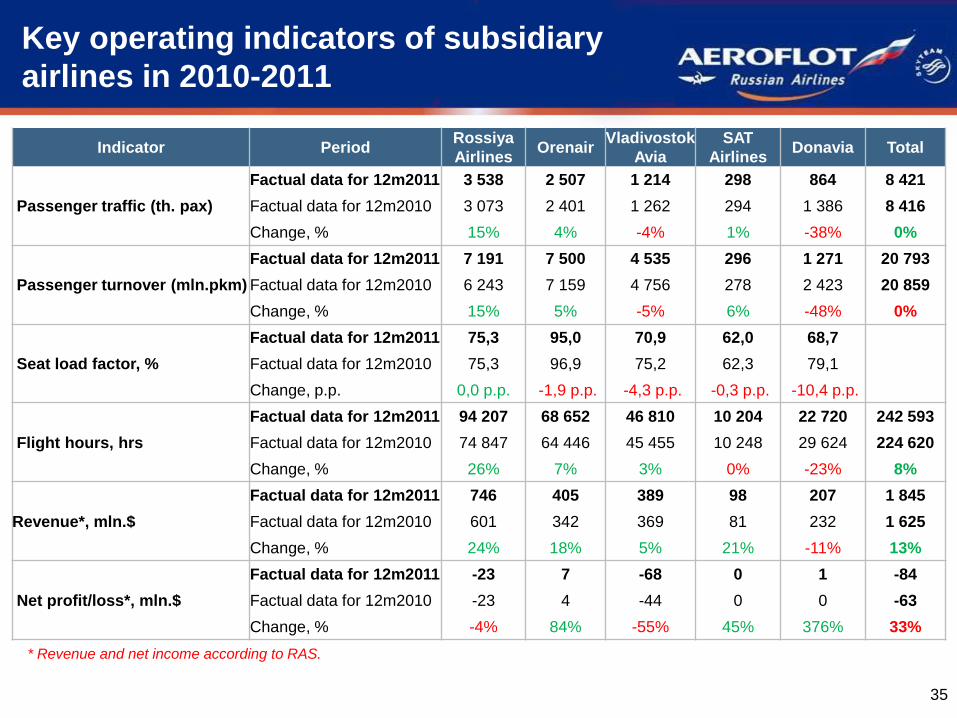
Key operating indicators of subsidiary
airlines in 2010-2011
35
* Revenue and net income according to RAS.
Indicator Period Rossiya
Airlines Orenair
Vladivostok
Avia
SAT
Airlines Donavia Total
Passenger traffic (th. pax)
Factual data for 12m2011 3 538 2 507 1 214 298 864 8 421
Factual data for 12m2010 3 073 2 401 1 262 294 1 386 8 416
Change, % 15% 4% -4% 1% -38% 0%
Passenger turnover (mln.pkm)
Factual data for 12m2011 7 191 7 500 4 535 296 1 271 20 793
Factual data for 12m2010 6 243 7 159 4 756 278 2 423 20 859
Change, % 15% 5% -5% 6% -48% 0%
Seat load factor, %
Factual data for 12m2011 75,3 95,0 70,9 62,0 68,7
Factual data for 12m2010 75,3 96,9 75,2 62,3 79,1
Change, p.p. 0,0 p.p. -1,9 p.p. -4,3 p.p. -0,3 p.p. -10,4 p.p.
Flight hours, hrs
Factual data for 12m2011 94 207 68 652 46 810 10 204 22 720 242 593
Factual data for 12m2010 74 847 64 446 45 455 10 248 29 624 224 620
Change, % 26% 7% 3% 0% -23% 8%
Revenue*, mln.$
Factual data for 12m2011 746 405 389 98 207 1 845
Factual data for 12m2010 601 342 369 81 232 1 625
Change, % 24% 18% 5% 21% -11% 13%
Net profit/loss*, mln.$
Factual data for 12m2011 -23 7 -68 0 1 -84
Factual data for 12m2010 -23 4 -44 0 0 -63
Change, % -4% 84% -55% 45% 376% 33%


![Wipro Ifrs Consol Financials Sep 2010- Audited[2]](https://static.fdocuments.net/doc/165x107/577d27a11a28ab4e1ea46701/wipro-ifrs-consol-financials-sep-2010-audited2.jpg)