
Aeroflot Group Consolidated financials (IFRS)...
35
Aeroflot Group Consolidated financials (IFRS) 12M2012 Moscow April 24, 2013 Speaker: Shamil Kurmashov Deputy Director General Commerce and Finance
-
Upload
duongtuyen -
Category
Documents
-
view
228 -
download
2
Transcript of Aeroflot Group Consolidated financials (IFRS)...

Aeroflot Group
Consolidated financials (IFRS)
12M2012
Moscow
April 24, 2013
Speaker:
Shamil Kurmashov
Deputy Director General
Commerce and Finance

Table of contents
1.Introduction
2.Market position of the Group
3.Operating highlights
4.Financial results
5.Conclusions
6.Appendix

Aeroflot Group key events of 2012
2
HIGHER TRAFFIC VOLUMES AND MARKET SHARE
• As a result of integration of four airlines in Aeroflot Group,
passenger turnover of the Group increased by 61.9%, passenger
traffic – by 67.6%.
• Aeroflot Group market share in Russian Civil Aviation amounted
to 37% in terms of passenger traffic and 38% in terms of
passenger turnover.
SECURITY
• Flight safety indicator amounted to 99.965% – this lands in the highest range
of indicators (99.900% - 100%) of the security rating scale.
• Inspection of the Transportation security office of Federal Agency for Air
Transportation of Russia was successfully passed as well as USA Federal
Aviation Administration rules compliance test.
• Inspections under the Safety Assessment of Foreign Aircraft (SAFA)
programme were carried out in the airports of European Civil Aviation
Conference participating states.
• ISO 9001:2008 Standard compliance audit of Aeroflot Group quality
management system was carried out.
IT AND INNOVATIVE DEVELOPMENT
• Mobile version of Company’s website was launched.
• Installation and use of Electronic Flight Bag (EFB) was launched.
• Second stage of a joint project with SAP on implementation of
innovative technologies in subsidiary companies, branches and
units of the Company started.
• MySirena charter carriage booking module was set into operation.
• International payment system WebMoney Transfer was
connected.
GROUP MANAGEMENT DEVELOPMENT
• Integration activities were carried out in JSC “Aeroflot” and subsidiary airlines
of the Group.
• Frequent flier programs of “Donavia” and “Vladivostok Air” were incorporated
into “Aeroflot Bonus” program.
• Deals on disposal of non-core assets: LLC “Aeroport Moscow” and CJSC
“Aeroflirst”, were executed.
EXPANSION AND FLEET MODERNIZATION
• 18 new aircraft were put into operation: eight Airbus A330, six
SSJ-100, three Airbus A321, one Airbus A320.
HIGHER LEVEL OF SERVICES
• No commission ticket payment technologies were enhanced.
• Сall-center in the Far East of Russia was created.
• “Aeroflot Bonus” program was improved.
• New tariff product “Russian Business Pass” was launched and “Business
Pass” product was improved.
• On-board services quality was improved.
TRAINING AND IMPROVEMENT OF PERSONNEL
QUALIFICATION, HR POLICY
• Contract for delivery of the new Airbus A330 full flight simulator in
2013 was signed.
• SSJ-100 full flight simulator was delivered.
• Aeroflot Aviation School expanded the range of training programs
and became the largest aviation training center in Russia and
CIS.
ROUTE NETWORK DEVELOPMENT
• In 2012 Aeroflot opened new scheduled and charter flights service to 23 new
destinations.
• Partial liberalization of the international aviation carriages has taken place
(more designated carriers and frequencies were assigned to a range of
European destinations).

Passenger and industry recognition
3
“WINGS OF RUSSIA” AWARD
«Airline of the Year – passenger carrier
on domestic routes in group I»,
«Airline of the Year – passenger carrier
on scheduled international routes»,
«Russian Company of the Year –
leader of passenger preference».
THE MOST PUNCTUAL RUSSIAN
CARRIER
According to the Federal Agency for Air
Transportation of Russia in 2012
Aeroflot completed 97% of flights on
schedule.
«COMPANY OF THE YEAR – 2012»
IN NOMINATION «AVIATION
TRANSPORT»
National award in business sphere.
HIGH RATING OF GROUND AND ON-
BOARD SERVICE
According to InSites Consulting
research among Sky Team alliance
passengers.
BEST RUSSIAN AIRLINE IN
TOURIST INDUSTRY
“Conde Nast Traveller Readers’ choice”
annual award.
«ABSOLUTE BRAND – 2012»
Aeroflot is a winner of the contest for
the most highly valued aviation brand
worth 1.308 bln US dollars.
«BEST COMPANY FOR BUSINESS
TRAVELLERS»
Russian Business Travel & MICE
Award.
“BEST AIRLINE FOR CIS
DESTINATIONS (INCLUDING
RUSSIA)»
«Travel.RU Star» Award.
TOP 10 BEST AUTHORIZED IATA
TRAINING CENTERS IN EUROPE
Aeroflot Aviation School is included in
Top 10 best authorized IATA training
centers in Europe.

Table of contents
1.Introduction
2.Market position of the Group
3.Operating highlights
4.Financial results
5.Conclusions
6.Appendix

23,2%
22,0 24,0 28,0 32,0 35,0 38,045,0 50,0 45,1
57,064,1
74,0
11,6 11,1 14,1 16,427,5
2001 2002 2003 2004 2005 2006 2007 2008 2009 2010 2011 2012
Source: TCH, Ministry of Transportation of Russia
Source: TCH Source: TCH
Market share of the Group for 12m2012
[% of passenger turnover]
Market share of the Group for 12m2012
[% of passenger traffic]
Passenger Traffic of Russian Civil Aviation (RCA)
[mln. pax]
Russian air transportation market
• Passenger traffic of RCA in 2012 amounted to 74.0 mln pax, exceeding the result of 2011 by 15.5%.
• Aeroflot Group Market Share in RCA in terms of passenger traffic amounted to 37% in 2012.
4
RCA Aeroflot Group share in RCA Aeroflot Group
24,6%
24,8%
25,6%
37,0%
*
* Including passenger traffic of integrated companies from 15.11.2011 to 31.12.2011
38,0 40,4
34,1
Total International Domestic
37,0 41,3
32,5
Total International Domestic

17,4
1,3 3,9
21,6
1,3 7,0
18,8
3,7 5,8
Aeroflot Group* АЕА** AAPA^
Available seat-kilometre (ASK) Passenger traffic (PAX) Passenger turnover (RPK)
Market position of Aeroflot Group in 2012
5
Passenger traffic [mln.pax] Passenger turnover [bln.pkm]
Growth rates of basic operating indicators
[%, 12m2012 to 12m2011]
Source: TCH Share in RCA
Source: АЕА, AAPA, Aeroflot estimates
* Proforma including the results of OJSC “Rossiya airlines”, JSC “SAT Airlines”, JSC “ORENAIR”, JSC ”Vladivostok Air” for 12 months 2011
** АЕА – Association of European Airlines (scheduled flights data)
^ AAPA – Association of Asia Pacific Airlines
• Substantial growth of operating indicators of Aeroflot Group is resulting from consolidation of SC “Rostec”
aviation assets.
• The growth pace in operational performance of Aeroflot Group exceeds the dynamics of АЕА and AAPA.
27,5
10,3 8,3 8,1
3,5
Aeroflot Group Transaero S7 Group UTair Group Ural Airlines
37%
14% 11% 11%
5%
74,6
41,0
17,6 15,4 9,5
Aeroflot Group Transaero S7 Group UTair Group Ural Airlines
38%
21%
9% 8%
5%

Table of contents
1.Introduction
2.Market position of the Group
3.Operating highlights
4.Financial results
5.Conclusions
6.Appendix

Route network efficiency
of JSC “Aeroflot” in 2012
6
• In 2012 route network was dynamically developing, flight frequency increased and the number of
destinations expanded.
• Connectivity ratio of Aeroflot own flights in 2012 increased by 17.2% and amounted to 10.96 (in 2011 -
9.35).
• Transfer passenger traffic in Company’s route network in 2012 grew by 35.7% compared to the results of
2011 and amounted to 5.7 mln. passengers, 32.6% of total passenger traffic in 2012.
• In 2012 scheduled flights to new destinations were added to Company’s route network: from Moscow to
Guangzhou (China), Bologna (Italy), Krakov (Poland), Stuttgart (Germany), Tenerife (Spain), Tallin
(Estonia), Vilnus (Lithuania), Miami (USA), Nizhnekamsk, Orenburg, Khabarovsk, Tomsk (Russia),
Dnepropetrovsk, Donetsk, Kharkov, Odessa (Ukraine); from Ekaterinburg to Larnaka (Cyprus). Charter
flights to Bergamo (Italy), Patras (Greece), Murcia (Spain), Reykjavik (Iceland), Turin (Italy), Varna
(Bulgaria), Jerez (Spain) were added in 2012.
Average week frequency per route Flights dynamics by region [%]
Routes 12m2011 12m2012 Change
Scheduled 10,4 10,9 4,8%
Charter 0,2 0,5 150,0%
International Scheduled 8,3 8,7 4,8%
Domestic Scheduled 16,2 17,5 8,0%
Medium-haul* 12,0 12,7 5,8%
Long-haul* 5,0 4,9 -2,0%
Total** 8,7 9,8 12,6%
* scheduled flights
** passenger flights including charter flights
-12,7
+26,0
+9,5
+23,0
+12,1
+23,0
+41,3
+22,5
Africa
North America
Middle East
Central America
Asia, Pacific
Russia
CIS
Europe

Fleet of the Group as of 31.12.12
7
* As of 31.12.2012 operation of this aircraft was terminated # As of 31.12 2012 operation of one aircraft was terminated
^ As of 31.12.2012 aircraft is in repair and will be transferred to the lessor
Type of aircraft Aeroflot Donavia Rossiya
Airlines
Orenair Vladivostok
Avia
SAT Airlines Total
Ilyushin Il-96-300 6 - - - - - 6
Tupolev Tu-154 - - 5* - - - 5
Antonov An-24 - - - - - 4# 4
Mil Mi-8 - - - - 3 1 4
Yakovlev Yak-40 - - - - 2 - 2
Total number of a/c owned 6 - 5 - 5 5 21
Airbus A-319 4 - 9 - - - 13
Airbus A-320 1 - - - - - 1
Airbus A-321 21 - - - - - 21
Airbus A-330 8 - - - - - 8
Boeing 737 - 3# - - - 2 5
Antonov An-148 - - 6 - - - 6
Tupolev Tu-204 - - - - 6 - 6
Total number of a/c under finance lease 34 3 15 - 6 2 60
SSJ 100 10 - - - - - 10
Airbus A-319 11 4 3 - - - 18
Airbus A-320 43 - 8 - 6 - 57
Airbus A-330 14 - - - 1^ - 15
Boeing B-737 - 3 1 24 - 1 29
Boeing B-767 7 - 3 - - - 10
Boeing B-777 - - - 3 - - 3
McDonnell Douglas MD-11 3 - - - - - 3
DHC 8 Series 300 - - - - - 4 4
DHC 8 Series 200 - - - - - 2 2
Antonov An-12 - - - - - 1 1
Total number of a/c under operating lease 88 7 15 27 7 8 152
Total number of aircraft 128 10 35 27 18 15 233
• The Group is renewing aircraft fleet, substituting phased off aircraft with modern fuel-efficient aircraft.
• 67% of the Group's aircraft were under operating lease agreements, 26% – under financial lease.

330
316
2011 2012
431392
313 319 308
2008 2009 2010 2011 2012
306,7 286,3327,1
394,3
460,7
2008 2009 2010 2011 2012
Fuel efficiency
8
• During the last four years flight hours of JSC “Aeroflot” increased on average 11% annually. Cumulative
flight hours of Aeroflot Group companies increased by 13% in 2012.
• Specific fuel consumption of JSC “Aeroflot” during the last four years decreased on average by 8%
annually. At Aeroflot Group level specific fuel consumption decreased by 4% in 2012.
• Fuel efficiency of JSC “Aeroflot” and Aeroflot Group fleet consistently improves on the back of increase in
flight hours.
Flight Hours [ths. hrs]
Specific fuel consumption [gr/tkm]
CAGR = 11%
638,8
721,4
2011 2012
JSC “Aeroflot” Aeroflot Group*
+13%
JSC “Aeroflot” Aeroflot Group* * Proforma including the results of OJSC “Rossiya airlines”, JSC “SAT Airlines”, JSC “ORENAIR”, JSC ”Vladivostok Air” for 12 months 2011
CAGR = - 8,0%
-4%
+17%
-3%
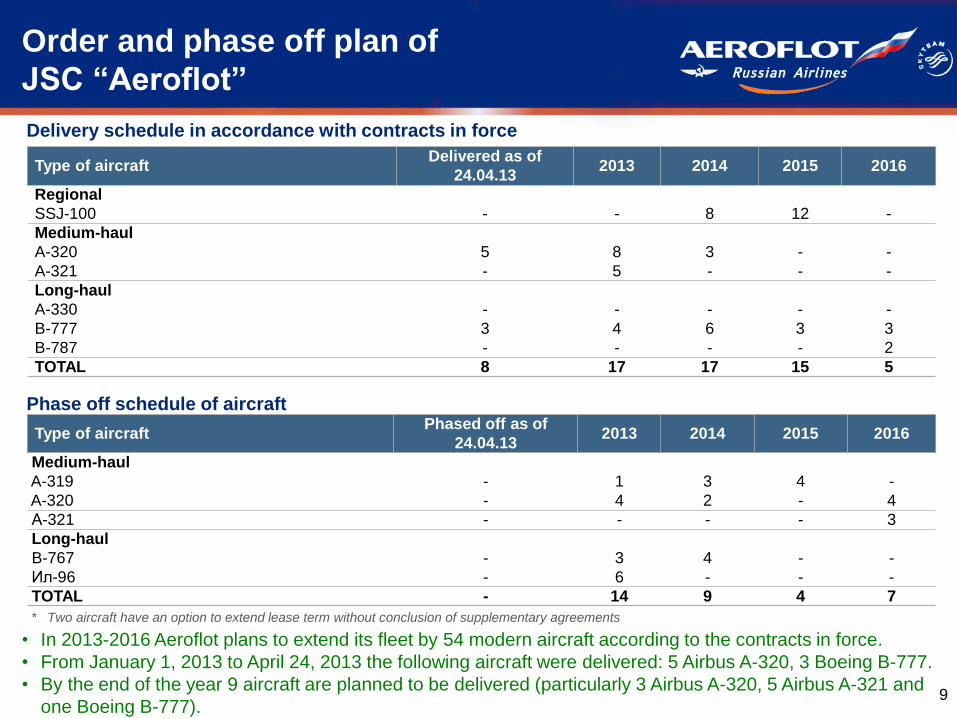
Order and phase off plan of
JSC “Aeroflot”
9
Delivery schedule in accordance with contracts in force
Phase off schedule of aircraft
* Two aircraft have an option to extend lease term without conclusion of supplementary agreements
Type of aircraft Delivered as of
24.04.13 2013 2014 2015 2016
Regional
SSJ-100 - - 8 12 -
Medium-haul
A-320 5 8 3 - -
A-321 - 5 - - -
Long-haul
A-330 - - - - -
B-777 3 4 6 3 3
B-787 - - - - 2
TOTAL 8 17 17 15 5
Type of aircraft Phased off as of
24.04.13 2013 2014 2015 2016
Medium-haul
A-319 - 1 3 4 -
A-320 - 4 2 - 4
А-321 - - - - 3
Long-haul
B-767 - 3 4 - -
Ил-96 - 6 - - -
TOTAL - 14 9 4 7
• In 2013-2016 Aeroflot plans to extend its fleet by 54 modern aircraft according to the contracts in force.
• From January 1, 2013 to April 24, 2013 the following aircraft were delivered: 5 Airbus A-320, 3 Boeing B-777.
• By the end of the year 9 aircraft are planned to be delivered (particularly 3 Airbus A-320, 5 Airbus A-321 and
one Boeing B-777).

1,00 0,80
1,16 0,99
JSC "Aeroflot" Aeroflot Group
Headcount and labor productivity
Passenger turnover/Average
headcount [mln.pkm/units]
Passenger traffic/Average
headcount [ths.pax/units]
2011
2012
13% 20% 24%
Labor productivity
Revenue/Average headcount
[$ ths./units]
20% 12%
16%
• The highest increase in headcount was registered in Aeromar company due to opening of a branch
in St.-Petersburg.
• Labour productivity of both JSC “Aeroflot” and Aeroflot Group significantly increased.
Headcount 31.12.11 31.12.12 % change
Aeroflot 15 500 16 418 5,9%
Aeromar 2 288 2 938 28,4%
Rossiya airlines 3 312 3 493 5,5%
ORENAIR 2 227 2 366 6,2%
Vladivostok Air 2 180 1 519 -30,3%
SAT Airlines 785 773 -1,5%
Donavia 1 234 1 063 -13,9%
Aerofirst 632 717 13,4%
Sherotel 276 257 -6,9%
Aerofot-Finance 4 4 0,0%
TOTAL 28 438 29 548 3,9%
10
2,95
2,24
3,33 2,69
JSC "Aeroflot" Aeroflot Group
329 261
395
293
JSC "Aeroflot" Aeroflot Group

70,9
73,4
75,0 76,3
74,9 77,5
83,4
84,4
81,0
78,5
74,3
72,0 72,0 73,2
74,6 75,2
72,3
79,2
85,6
86,8
84,2
78,2
76,0
73,1 73,2
76,0
3 123 2 889
3 275 3 339
3 588 3 960
4 570 4 529
4 115 3 787
4 230
4 824
4 879
4 518
5 100 5 381
5 833
6 972
7 896 8 141
7 510
6 560
5 980 5 848
4 371 3 622
4 259 4 624
5 104 6 058
6 933 7 098
6 249
5 449 4 822
5 928
5 418
4 403
3 935 4 364 4 378
4 790 5 110
5 478 5 369 5 079 4 824 5 696
6 776
6 168
6 834 7 156
8 065
8 800 9 219 9 382
8 920 8 386
7 867 8 005
6 172 5 116
5 809 6 222
6 797
7 701 8 232 8 343
7 674
7 031 6 573 6 704
8 097
7 128
Operating indicators of Aeroflot Group
• The majority of operating indicators of the Group exceed prior year figures. High operating indicators were
achieved owing to both organic and non-organic growth. 11
Passenger traffic
[ths. pax]
Seat load factor
[%]
Passenger turnover
[mln. pkm]
Passenger capacity
[mln. ask]
* Pro forma including results of integrated companies 2011 2011* 2012
1 063 1 005 1 157 1 203
1 315 1 417
1 609 1 577 1 459 1 338
1 551
1 770 1 745 1 620
1 842 1 984
2 244
2 649
2 979 3 073
2 803
2 389
2 101 2 044
1 530 1 322
1 558 1 687
1 846
2 216
2 503 2 564
2 290
1 980
1 770
2 022 1 883
2013

Revenue rates
12
Yield: PAX revenue / RPK
[US cents / pkm]
RASK: PAX revenue / ASK
[US cents / ask]
Cargo yield: Cargo revenue / CTK
[US cents / tkm]
Yield of the Group
[US cents / pkm]
RASK of the Group
[US cents / ask]
Cargo yield of the Group
[US cents / pkm]
2011 2012
8% 9% -
1% 3% 0,3%
In 2012 revenue rates of JSC “Aeroflot” increased and remained practically flat at the Group level. Upon that
at the Group level revenue rates increased on domestic routes along with a slight decrease on international
routes (mainly due to a small reduction on European routes from 12.5 to 12.1 cents).
8,7
9,8
8,3
10,5
International Domestic
6,7
7,6
6,6
8,1
International Domestic
26,7
41,8
24,8
46,7
International Domestic
6,9 7,0 7,5
7,1
JSC "Aeroflot" Aeroflot Group
8,9 9,1 9,6
9,1
JSC "Aeroflot" Aeroflot Group
29,6 30,0 30,6 30,1
JSC "Aeroflot" Aeroflot Group

Aeroflot Group* operating indicators
dynamics by region
• Following the approved strategy of strengthening positions on domestic routes and popular tourist
destinations, Aeroflot significantly increased its long-haul transportation capacities.
• Given strengthening positions on American markets temporary excess of capacity growth rate over turnover
growth rate is observed. 13
[%, 2012 vs 2011]
* Proforma including the results of OJSC “Rossiya airlines”, JSC “SAT
Airlines”, JSC “ORENAIR”, JSC ”Vladivostok Air” for 12 months 2011
+28,9% +30,8%
-1,1%
RPK ASK SLF
America
+16,7% +16,4%
+0,2%
RPK ASK SLF
Europe
+15,2% +15,0%
+0,1%
RPK ASK SLF
Russia and CIS
+18,4%
+11,9%
+4,7%
RPK ASK SLF
Middle East and Africa
+21,4% +16,7%
+3,0%
RPK ASK SLF
Asia

278
364
5 23 1 8
49
4 110
6 247
575 409 62 48
1 043
Traffic revenue of Aeroflot Group from
scheduled flights by region
14
Revenue from scheduled passengers carriages
[$ mln.]
Revenue from scheduled cargo carriages
[$ mln.]
52% 31%
• The substantial growth in revenue from scheduled passenger carriages is primarily secured by higher
volume of passenger carriages following the consolidation of acquired airlines.
• The main drivers of passenger carriages volume growth of the Group are Russia, Europe and Asia.

Amid increased market volatility on the back of unfolding European
crisis Aeroflot follows a prudent risk management policy and hedges
its exposure to currency volatility (EUR weakening), higher fuel
prices and higher interest rates (LIBOR linked finance lease
payments).
Aeroflot entered a number of transactions, covering 53% of 2013F
open EUR position:
– According to 3-year transaction terms on EUR/RUB, Aeroflot
receives monthly compensation in case EUR exchange rate
moves lower than the level comfortable for the Company, but
Aeroflot has to pay compensation to the counterparties in case
EUR strengthens at the expiration of the contract. Possible losses
are compensated by higher converted revenue of the Company.
– According to 1-year transactions terms on EUR/USD, Aeroflot
receives monthly compensation in case lower EUR exchange rate,
in the meantime possible losses connected to stronger EUR
exchange rate are compensated by higher converted revenue of
the Company.
– Potential losses on all the transactions are limited.
In autumn 2012 Aeroflot entered a number of transactions in order to
hedge fuel price increase for the period of 3 years. In case oil prices
increase the Company receives monthly compensation, in the
meantime Aeroflot will have to pay compensation to the banks in case
of lower oil prices only at the expiration of the contract. Such losses
are compensated by lower fuel costs for the Company. Currently c19%
of annual consumption (2013F) of the Company is hedged.
Currently c30% of LIBOR linked finance lease payments are
hedged by means of converting floating rate to fixed rate.
Source: Aeroflot data, Bloomberg
Market risk management: currency,
interest rate risk, fuel price hedging
Mechanism of the long-term currency risk hedging
transaction
Launch
A
B
D
C
Aeroflot receives monthly
compensation during 3-year term
Aeroflot pays at
expiration
3 years
1,20
1,25
1,30
1,35
1,40
1,45
1,50
38
39
40
41
42
43
44
авг 10 фев 11 сен 11 апр 12 окт 12 май 13
EUR/RUB
EUR/USD
EUR dynamics in 2011–2013
The strategy is aimed to mitigate the high level of market
volatility of EUR
Aeroflot hedged 53% of open position in EUR (2013F), 19% of 2013F fuel consumption and 30% of LIBOR
linked finance lease payments
Aug-10 Feb-11 Sep-11 Apr-12 Oct-12 May-13
15

Hedged
revenue structure, 2012
RUB 48%
Source: Aeroflot data, Bloomberg
Currency risk management at
JSC “Aeroflot”
Costs structure, 2013F
Others
3%
RUB
40%
EUR
6%
Revenue structure, 2013F
USD.
20%
EUR
48%
RUB
32%
USD.
51%
Hedged
revenue structure, 2013F
USD 38%
EUR 26%
RUB 36%
RUB
27%
USD and
oth. 23%
EUR
50% EUR
8%
RUB
62%
USD and
oth. 30%
Costs structure, 2012 Revenue structure, 2012
Effective currency risk hedging allowed to lower the effective share of EUR in revenue structure converging it
with costs structure 16
EUR
29%
USD and
oth. 23%

Table of contents
1.Introduction
2.Market position of the Group
3.Operating highlights
4.Financial results
5.Conclusions
6.Appendix

Key financials
• Revenue of JSC "Aeroflot“ for 12 months of 2012 increased by 28% compared to 12 months of 2011,
revenue of the Group increased by 51%. Substantial increase in revenue at the Group level was due to
aviation assets consolidation.
• Net income of JSC “Aeroflot” for 12 month of 2012 decreased by 55%, at the Group level – by 66%.
• Change in net income of the Group in 12 months of 2012 in comparison with the corresponding period of
2011 was caused by absence of one-off effects - income from disposal of investments in subsidiaries and
affiliates in 2011.
• Impact on Group profitability was caused by consolidation of airlines purchased in 2011, which currently
undergo integration process.
17
Index unit
JSC “Aeroflot” Aeroflot Group
12m2011 12m2012 change 12m2011 12m2012 change
Revenue $ mln. 4 686 6 000 28% 5 378 8 138 51%
Operating costs $ mln. 4 247 5 628 33% 4 990 7 780 56%
EBITDAR* $ mln. 957 977 2% 1 024 1 238 21%
EBITDA** $ mln. 626 604 -4% 646 671 4%
Operating income $ mln. 439 372 -15% 388 358 -8%
Net income $ mln. 508 230 -55% 491 166 -66%
EBITDAR margin % 20% 16% -4 p.p. 19% 15% -4 p.p.
EBITDA margin % 13% 10% -3 p.p. 12% 8% -4 p.p.
* EBITDAR = EBITDA + Operating lease expenses
** EBITDA = Operating income + Amortization + Customs duties

912 1 020
278 364
4 188
2 680
27 107
6 754
Group’s revenue factorial analysis
18
Revenue of the Group
[$ mln] Traffic
volume Air carriage tariff Others
Other income 12%
Σ 5 378 Σ 8 138 Total revenue of the Group 51% 12m2011 12m2012
Freight traffic 31%
Passenger traffic 61%
The substantial increase in Aeroflot Group’s revenue was caused primarily by the growing volume of carriage
due to consolidation of purchased airlines’ assets and optimization of route network of JSC “Aeroflot”.

230
166
17 11 7
18 10 1 1
140 67
107
25 4
44
22
Structure of the Group’s net income
19
Elements of Aeroflot Group’s net income
[$ mln]
• The total loss of OJSC “Rossiya airlines”, JSC ”Vladivostok Air”, JSC “ORENAIR” and JSC “SAT Airlines”
amounted to $203 mln. Currently integrated companies undergo cost-cutting procedures and activities to
reach break-even point at the operating income level.
• Aeromar and Sherotel remain profitable. Aerofirst also showed positive financial results at net income
level.
**
∑= -$203 mln. ***
^
*
* Including one-off items: $57 mln. loss from write off of deferred tax assets and $48 mln. gain from changes to finance lease agreements
** Including one-off items: $31mln. loss from early phase off of А330 and $17 mln loss from write off of deferred tax asset
*** Recovery of provision for AR of Vladivostok Air at consolidation stage
^ Including the result of associated companies, other elimination of intercompany balance, result from disposal of companies

491
166
2 680 108
203 20 6
27 815
372
1 604
425 97
1
Factorial analysis of the Group’s net
income
20
Adjustments to the Group’s net income
[$ mln]
* The fact of absence of disposal of companies in 2012 compared to 2011.
** Including effect from lower interest expenses following Terminal deconsolidation.
• Substantial increase in revenue and operating costs of the Group was caused by consolidation of
purchased subsidiary companies’ assets.
• Lower net income of the Group in 12 months of 2012 in comparison to the corresponding period of 2011
was caused by substantial income from disposal of investments in subsidiaries and affiliates in 2011
(CJSC “Nordavia”, "Moscow" Insurance Company“, "TZK "Sheremetyevo“, JSC “Terminal”).
2761 2791

Factorial analysis of the net income of
JSC “Aeroflot
21
Adjustments to the net income of JSC “Aeroflot”
[$ mln]
* Income from disposal of investments in subsidiaries and affiliates in 2011 including CJSC “Nordavia”,
"Moscow" Insurance Company“, "TZK "Sheremetyevo“ and JSC “Terminal”
• The main factor which positively influenced increase in income was higher volume of carriage. Carriage
tariff and other revenue also increased.
• Higher volume of carriage also resulted in increase in operating costs.
• Changes in net income of JSC “Aeroflot” in 12 months of 2012 in comparison to the corresponding period
of 2011 was caused by substantial income from disposal of investments in subsidiaries and affiliates in
2011 as well as operating income related to exemption from customs duties and changes in tax
provisions. Also negative influence was caused by losses from derivatives revaluation. Positive influence
was caused by positive currency translation differences.
1314 1382
508
230
819
400 95
105
304
101 977
229 7 57 22

646
553
671
746 44
31
40 53
EBITDA 2011 One-off gainfrom customsduties write off
Tax provisionsrecovery
AdjustedEBITDA 2011
EBITDA 2012 Goodwill write off А-330 contract cancellation
AdjustedEBITDA 2012
EBITDA of the Group excluding
one-off effects
22
Aeroflot Group EBITDA analysis 12m2012 vs. 12m2011 [$ mln]
Aeroflot Group EBITDA increased by 35% in 2012 compared to 2011 excluding one-off items.
+35%

Operating income of the main
subsidiaries
23
12m2011
Operating income / loss of the subsidiaries
[$ mln]
12m2012
• CJSC “Rossiya Airlines”, JSC “ORENAIR”, JSC ”Vladivostok Air” and JSC “SAT Airlines” registered
operating losses for 12 months of 2012.
• Donavia increased operating profit from $8.1 mln. to $15.8 mln.
• Aerofirst reached break-even point with operating income totaling $13.2 mln.
• Aeromar and Sherotel continue to deliver positive profitability,
8,1 17,0
8,0
(3,4)
15,8
(35,8)
(18,5)
(103,7)
(3,7)
24,0
7,4 13,2
Donavia Rossiya Airlines ORENAIR Vladivostok Air SAT Airlines Aeromar Sherotel Aerofirst

• The debt leverage of Aeroflot Group remains at stable level.
• Debt leverage dynamics and Total debt / EBITDA indicator dynamics is conditioned by higher finance
lease volume due to new aircraft deliveries and SC “Rostec” integrating companies debt consolidation.
TOTAL DEBT / EBITDA* [x]
Debt leverage of Aeroflot Group
24
NET DEBT / EBITDA* [x]
Aeroflot Group JSC “Aeroflot” * EBITDA = Operating profit + DD&A + Customs duties
For 6 and 9 months indicators EBITDA is annualized.
Indicators Unit JSC “Aeroflot” Aeroflot Group
31.12.11 31.12.12 change 31.12.11 31.12.12 change
Borrowings $ mln. 513 471 -8% 767 706 -8%
Finance lease liabilities $ mln. 896 1 334 49% 1 500 1 882 25%
Pension liabilities $ mln. 12 14 17% 12 15 25%
Customs duties $ mln. 2 - -100% 18 19 6%
Total debt $ mln. 1 423 1 819 28% 2 297 2 622 14%
Cash and short term investments $ mln. 456 519 14% 414 501 21%
Net Debt $ mln. 967 1 300 34% 1 883 2 121 13%
4,4
3,02,9
3,1
3,63,8 3,9 3,9
2,21,9
1,7 1,8
2,3 2,3
2,83,0
31.12.09 31.12.10 30.06.11 30.09.11 31.12.11 30.06.12 30.09.12 31.12.12
4,1
2,1
1,7
2,3
2,9 2,8 2,93,2
2,0
0,9
0,3
0,9
1,5 1,41,8
2,2
31.12.09 31.12.10 30.06.11 30.09.11 31.12.11 30.06.12 30.09.12 31.12.12

11% 10%
5,5%
10% 8% 8%
5,6%
14%
Aeroflot Group DeutscheLufthansa
Air France-KLM Turkish Airlines
Aeroflot Group in comparison
with foreign competitors
25
12m2011
Total Debt / EBITDA [x] EBITDA margin [%]
* Financial and operating indicators for the period from January, 1 till December, 31
** EBITDA = Operating income + DD&A
*** Total Debt = Borrowings + Financial lease liabilities
12m2012
Source: Bloomberg, Aeroflot data for 2012 according to IFRS
• Revenue of the Group increased by 51% due to consolidation of SC “Rostec” airline assets. Lufthansa
and Air France demonstrated decline of revenue. Moreover Aeroflot Group consistently demonstrates one
of the highest EBITDA margins.
• Operating indicators of the Group rose at substantially higher growth rates than those of European
competitors.
Indicators unit 12m2011* 12m2012* change 12m2011* 12m2012* change 12m2011* 12m2012* change 12m2011* 12m2012* change
Financial indicators Revenue $ mln. 5 378 8 138 51% 40 009 38 750 -3% 33 923 32 961 -3% 7 065 8 283 17% EBITDA** $ mln. 609 627 3% 3 922 3 174 -19% 1 871 1 862 0% 688 1 154 68%
Net income $ mln. 491 166 -66% -18 1 273 >100% -1 126 -1 533 36% 11 630 >100%
Total Debt*** $ mln. 2 266 2 588 14% 8 491 9 380 10% 13 684 14 855 9% 4 199 4 858 16%
Operating indicators Passenger turnover bln.pkm 46 75 63% 200 205 2% 217 224 3% 59 75 27% Passenger capacity bln.ask 60 96 60% 258 260 1% 265 269 2% 81 96 19% Seat load factor % 77% 78% +1 p.p. 78% 79% +1 p.p. 82% 83% +1 p.p. 73% 78% +5 p.p.
3,7
2,2
7,3
6,1
4,1 3,0
8,0
4,2
Aeroflot Group DeutscheLufthansa
Air France-KLM Turkish Airlines
Table of contents
1.Introduction
2.Market position of the Group
3.Operating highlights
4.Financial results
5.Conclusions
6.Appendix

Conclusions
26
• In 12 months of 2012 the main operating indicators increased compared to the
corresponding period of previous year.
• Passenger traffic increased due to optimization of Aeroflot route network and consolidation
of OJSC “Rossiya airlines”, JSC “SAT Airlines”, JSC “ORENAIR”, JSC ”Vladivostok Air”
assets.
• Revenue of the Group increased by 51%. Higher revenue from scheduled passenger flights
was driven by increase in volume of carriage of the Group in Russia, Europe and Asia.
• Aeroflot Group EBITDA increased by 35% in 2012 compared to 2011 excluding one-off
items.
• Total debt / EBITDA ratio of the Group remains at a stable level of 3.9. Total debt / EBITDA
ratio of JSC “Aeroflot” amounts to 3.0. Net debt / EBITDA ratio totaled 2.2 and 3.2 at JSC
“Aeroflot” standalone and at the Group level respectively.

Table of contents
1.Introduction
2.Market position of the Group
3.Operating highlights
4.Financial results
5.Conclusions
6.Appendix

12m2011 12m2012
Passenger traffic [ths. pax]
Flight hours [ths. hrs] Seat load factor [%]
Passenger turnover [mln. pkm]
27
Key operating indicators of
subsidiary airlines
In 2012 all subsidiaries except SAT Airlines and Vladivostok Air showed increase in passenger traffic. Increase
in operating indicators of ORENAIR is worth highlighting, passenger traffic rose by 27%, passenger turnover –
by 40%.
3 537
2 507
1 214
298
864
4 209
3 194
1 162
265
986
RossiyaAirlines
ORENAIR VladivostokAir
SAT Airlines Donavia
7 191 7 500
4 535
296 1 271
8 761
10 505
3 134
251 1 434
RossiyaAirlines
ORENAIR VladivostokAir
SAT Airlines Donavia
94,2
68,7
47,7
11,1 22,7
107,7
81,0
38,8
9,6
23,6
RossiyaAirlines
ORENAIR VladivostokAir
SAT Airlines Donavia
75,3 83,4
70,9 65,1 68,7
77,5 85,7
67,3 60,0
69,0
RossiyaAirlines
ORENAIR VladivostokAir
SAT Airlines Donavia

Key operating indicators of
subsidiary airlines
28
* According to IFRS
Indicator Период Россия Оренэйр Владивост
ок Авиа САТ Донавиа Итого
Passenger traffic (th. pax)
Factual data for 2012 4 209 3 194 1 162 265 986 9 816
Factual data for 2011 3 537 2 507 1 214 298 864 8 420
Change, % 19% 27% -4% -11% 14% 17%
Passenger turnover (mln.pkm)
Factual data for 2012 8 761 10 505 3 134 251 1 434 24 085
Factual data for 2011 7 191 7 500 4 535 296 1 271 20 793
Change, % 22% 40% -31% -15% 13% 16%
Seat load factor, %
Factual data for 2012 77,5 85,7 67,3 60,0 69,0
Factual data for 2011 75,3 83,4 70,9 65,1 68,7
Change, % +2,2 p.p. +2,3 p.p. -3,6 p.p. -5,1 p.p. -0,3 p.p.
Flight hours, hrs
Factual data for 2012 107 698 80 954 38 838 9 625 23 582 260 697
Factual data for 2011 94 207 68 652 47 729 11 121 22 720 244 429
Change, % 14% 18% -19% -13% 4% 7%
Revenue*, $ mln. Factual data for 2012 900 567 336 94 233 2 130
Net profit/loss*, $ mln. Factual data for 2012 -67 -25 -107 -4 17 -186

Operating indicators
29
Indicator Unit JSC “Aeroflot” Aeroflot Group
12m2011 12m2012 change 12m2011 12m2012 change
Passenger turnover mln. pkm 42 021 50 533 20% 46 077 74 617 62%
International routes 28 646 34 954 22% 30 577 50 280 64%
Domestic routes 13 375 15 579 16% 15 501 24 337 57%
Passenger capacity mln. ask 54 195 64 880 20% 60 004 95 598 59%
International routes 37 510 45 586 22% 40 065 63 851 59%
Domestic routes 16 685 19 295 16% 19 939 31 747 59%
Tonne-kilometers mln. tkm 4 691 5 669 21% 5 072 7 926 56%
International routes 3 295 4 054 23% 3 472 5 446 57%
Domestic routes 1 395 1 615 16% 1 601 2 480 55%
Passenger traffic th. pax 14 174 17 656 25% 16 391 27 472 68%
International routes 8 679 10 707 23% 9 428 15 963 69%
Domestic routes 5 495 6 949 26% 6 963 11 508 65%
Cargo and mail carried tonnes 160 596 193 949 21% 168 451 223 772 33%
International routes 120 263 147 750 23% 121 464 153 117 26%
Domestic routes 40 334 46 199 15% 46 987 70 655 50%
Seat load factor % 77,5% 77,9% +0,4 p.p. 76,8% 78,1% +1,3 p.p.
International routes 76,4% 76,7% +0,3 p.p. 76,3% 78,7% +2,4 p.p.
Domestic routes 80,2% 80,7% +0,5 p.p. 77,7% 76,7% -1,0 p.p.
Flight hours hours 394 341 460 734 17% 461 309 721 431 56%
• In 2012 Aeroflot demonstrated positive dynamics of the main operating indicators compared to 2011.
• Substantial increase in operating indicators of the Group was caused by consolidation of SC “Rostec”
airline assets.


![Wipro Ifrs Consol Financials Sep 2010- Audited[2]](https://static.fdocuments.net/doc/165x107/577d27a11a28ab4e1ea46701/wipro-ifrs-consol-financials-sep-2010-audited2.jpg)