A New Air Traffic Flow Management User-Driven ...
22
Research Article A New Air Traffic Flow Management User-Driven Prioritisation Process for Low Volume Operator in Constraint: Simulations and Results Sergio Ruiz , Laurent Guichard, Nadine Pilon , and Kris Delcourte DECMA/RTD/NET, EUROCONTROL Experimental Centre (EEC), Br´ etigny-sur-Orge, France Correspondence should be addressed to Sergio Ruiz; [email protected] Received 31 July 2018; Accepted 24 February 2019; Published 30 April 2019 Academic Editor: Yuchuan Du Copyright © 2019 Sergio Ruiz et al. is is an open access article distributed under the Creative Commons Attribution License, which permits unrestricted use, distribution, and reproduction in any medium, provided the original work is properly cited. is document presents a new potential feature for the User Driven Prioritisation Process (UDPP) concept to give access and flexibility to Airspace Users (AUs) when they operate a low number of flights involved in a particular hotspot, a.k.a., Low Volume Users in Constraint (LVUC). Capacity constraints and congestion in the Air Traffic Management system impose delay to flights that cause large costs on airlines and passengers alike, with no significant capacity increases expected in the near-nor medium- term. Current UDPP features such as Enhanced Slot Swapping can increase flexibility for AUs to adapt their operations during capacity constrained situations. However, AUs are oſten impacted in their flight schedules by constraints that only affect a reduced number of flights, thus being in a situation of reduced flexibility—or no flexibility at all—to prioritise those flights. Some AUs are more vulnerable to this problem because they typically operate a low number of flights, e.g., business aviation. e new method proposed, named Flexible Credits for LVUC (FCL), is based on the use of “credits”, as a virtual currency, to increase the flexibility of LVUCs irrespective of the number of flights operated or affected by delay. FCL aims at facilitating the smooth coordination between AUs during the optimisation of their operations across multiple constraints and over the time. An initial set of simulations performed under credible conditions are presented to preliminarily analyse the feasibility and limitations of the method and to shed light on future research aspects. A first empirical evidence is given in this paper showing that increasing flexibility for LVUCs is possible without jeopardising equity. 1. Introduction e Air Traffic Flow and Capacity Management (ATFCM) Function of the air traffic management system aims at protecting airport and airspace sector operational capacities from excessive traffic during periods of saturated levels of traffic. For that purpose, if a significant imbalance between forecasted traffic and available capacity is predicted, a.k.a., hotspot, the ATFCM may impose delays or other measures on certain flights before they depart to maintain the operational safety level [1, 2]. e ATFCM measures that consist of applying predeparture ATFCM delays to the flights are denoted in Europe as traffic regulations [1] and in the US as ground delay programs [3]. In the current ATFCM paradigm, the delay imposed may cause flight cancellations and delay costs that impact the Airspace Users (AUs) through numerous cost elements (fuel, maintenance, crew, plus passenger “hard” and “soſt” costs [4–6]). Since profitability in air transport industry is very sensitive to cost variations (profit margins were in 2017 around 7%, but they might be as low as 1-2% when fuel prices are high) [7, 8], the AUs would like more flexibility, i.e., the ability to accommodate their changing business priorities into the air traffic management system, to reduce the “impact of delay” (cost of delay) during irregular operations. However, under the current paradigm, the AUs are most of the time passive/reactive agents that have little influence on the slot allocation process. To achieve additional flexibility for AUs to adapt their operations in a more cost-efficient manner, SESAR envi- sioned the development of the User Driven Prioritisation Process (UDPP) [9, 10]. UDPP is a concept that embraces several mechanisms/features, some of them at different matu- rity levels of development, to give flexibility to the AU to Hindawi Journal of Advanced Transportation Volume 2019, Article ID 1208279, 21 pages https://doi.org/10.1155/2019/1208279
Transcript of A New Air Traffic Flow Management User-Driven ...

Research ArticleA New Air Traffic Flow Management User-DrivenPrioritisation Process for Low Volume Operator in ConstraintSimulations and Results
Sergio Ruiz Laurent Guichard Nadine Pilon and Kris Delcourte
DECMARTDNET EUROCONTROL Experimental Centre (EEC) Bretigny-sur-Orge France
Correspondence should be addressed to Sergio Ruiz sergioruizeurocontrolint
Received 31 July 2018 Accepted 24 February 2019 Published 30 April 2019
Academic Editor Yuchuan Du
Copyright copy 2019 Sergio Ruiz et al This is an open access article distributed under the Creative Commons Attribution Licensewhich permits unrestricted use distribution and reproduction in any medium provided the original work is properly cited
This document presents a new potential feature for the User Driven Prioritisation Process (UDPP) concept to give access andflexibility to Airspace Users (AUs) when they operate a low number of flights involved in a particular hotspot aka Low VolumeUsers in Constraint (LVUC) Capacity constraints and congestion in the Air Traffic Management system impose delay to flightsthat cause large costs on airlines and passengers alike with no significant capacity increases expected in the near-nor medium-term Current UDPP features such as Enhanced Slot Swapping can increase flexibility for AUs to adapt their operations duringcapacity constrained situations However AUs are often impacted in their flight schedules by constraints that only affect a reducednumber of flights thus being in a situation of reduced flexibilitymdashor no flexibility at allmdashto prioritise those flights Some AUs aremore vulnerable to this problem because they typically operate a low number of flights eg business aviation The new methodproposed named Flexible Credits for LVUC (FCL) is based on the use of ldquocreditsrdquo as a virtual currency to increase the flexibilityof LVUCs irrespective of the number of flights operated or affected by delay FCL aims at facilitating the smooth coordinationbetween AUs during the optimisation of their operations across multiple constraints and over the time An initial set of simulationsperformed under credible conditions are presented to preliminarily analyse the feasibility and limitations of the method and toshed light on future research aspects A first empirical evidence is given in this paper showing that increasing flexibility for LVUCsis possible without jeopardising equity
1 Introduction
The Air Traffic Flow and Capacity Management (ATFCM)Function of the air traffic management system aims atprotecting airport and airspace sector operational capacitiesfrom excessive traffic during periods of saturated levels oftraffic For that purpose if a significant imbalance betweenforecasted traffic and available capacity is predicted akahotspot the ATFCMmay impose delays or other measures oncertain flights before they depart to maintain the operationalsafety level [1 2] The ATFCM measures that consist ofapplying predeparture ATFCM delays to the flights aredenoted in Europe as traffic regulations [1] and in the US asground delay programs [3]
In the current ATFCM paradigm the delay imposedmay cause flight cancellations and delay costs that impactthe Airspace Users (AUs) through numerous cost elements
(fuel maintenance crew plus passenger ldquohardrdquo and ldquosoftrdquocosts [4ndash6]) Since profitability in air transport industry isvery sensitive to cost variations (profit margins were in 2017around 7 but they might be as low as 1-2 when fuelprices are high) [7 8] the AUs would like more flexibility iethe ability to accommodate their changing business prioritiesinto the air traffic management system to reduce the ldquoimpactof delayrdquo (cost of delay) during irregular operations Howeverunder the current paradigm the AUs are most of the timepassivereactive agents that have little influence on the slotallocation process
To achieve additional flexibility for AUs to adapt theiroperations in a more cost-efficient manner SESAR envi-sioned the development of the User Driven PrioritisationProcess (UDPP) [9 10] UDPP is a concept that embracesseveral mechanismsfeatures some of them at differentmatu-rity levels of development to give flexibility to the AU to
HindawiJournal of Advanced TransportationVolume 2019 Article ID 1208279 21 pageshttpsdoiorg10115520191208279
2 Journal of Advanced Transportation
bull How to give flexibility to Low Volume Users in Constraint(LVUCs) ie AUs with a few flights (eg 3 or less) whilepreserving equity for the rest of the AUs
time
2 flights 1 flight
Figure 1 Illustration of the need to give access and flexibility toLVUCs
redistribute the delay across its fleet through prioritisation offlights with high economic value over flights with relative lowcost of delay With UDPP the AUs have more opportunitiesto get their most important flights ie typically the oneswith greater impact on their all-day schedule to be scheduledback on track Through a reduction of delay in their mostimportant flights the AUs can often be able to satisfytheir most important time-constraints in the schedule (egconnecting flights curfews crew constraints among others)Thanks to such flexibility cancellations and delay-inducedcost for freightmdashincluding reactionary delay costsmdashcan bereduced substantially On the other hand for UDPP equityis the main constraint ie the actions of one AU shall notgenerate a direct negative impact on another AUrsquos flights (egnot increasing the delay of anotherrsquos flights)
UDPP concept is currently under development and newfeatures are being progressively incorporated aiming to fulfildifferent operational requirements and implementation con-straints Some of these features have already been proposedand validated with different levels of maturity such asEnhanced Slot Swapping which was validated in 2015 interms of impact on equity and acceptability by the AUsand ATFCM and have been deployed to operations in May2017 Other less mature features are still under developmentand are being validated such as the ones explained by NPilon et al [10] However these UDPP features are especiallyavailable for AUs that have several flightsslots in a hotspota condition that will only occur at those airports where theyhavemany flights scheduled in short periods typically at theirbase airports Unfortunately AUs are not always in the idealsituation of having low priority flights (flights with enoughmargins andor relatively low economic value) in positionsnearby their most impacted flights (the high priority ones)so that they might not be able to swap their positions Atypical situation of lack of flexibility is when an AU has asmall number of flights affected in a hotspot (eg 3 or less)In that case the AU is called an LVUC (Low Volume User inConstraint) [11]
Figure 1 illustrates the lack of flexibility that AUs mayexperience if they are LVUCs at a given hotspot In the figureit is shown that AUs with a large number of flights can use thecurrent UDPP features based on slot swapping between theirown fleet while two LVUCs in the example cannot one AUhas two flights in the sequence but if those are too far fromeach other they may be non-swappable the other LVUC has
only one flight which makes it totally impossible for that AUto have access to the UDPP features based on slot swapping
Based on the analysis of all the European airport regula-tions in 20 consecutiveAIRAC cycles (roughly one year and ahalf from Jan 2016 to July 2017 ie AIRACs from 1601 to 1707taken from EUROCONTROLrsquos Demand Data Repository)we have found that (a) the proportion of LVUCs in dailyhotspots is large being more than 23 of the AUs typicallyaffected by regulations since a typical regulation affects 9 AUsin average it means that 6 of these AUs would be LVUCssee Figure 2 and (b) all AUs are often LVUCs in 85 ofthe regulations inwhichAUs are involved (typically hundredsevery day for most commercial airlines) they typically haveonly a few flights (see Figure 3) meaning that in mostregulations the affected AUs will find their flexibility stronglylimited
Such problem is worse for those AUs that often operatejust a few flights since they have little flexibility and mayeven never be able to prioritise their relatively importantflights (eg business aviation is especially vulnerable to thatproblem)This is considered to be inequitable from the accessKPA point of view Therefore there is a need to explore newfeatures in UDPP to enable more flexibility for all the AUs inparticular for LVUCs
This paper introduces the problem of lack of flexibilityof LVUCs for using UDPP and presents a new potentialUDPP feature as a solution the Flexible Credits for LVUCs(FCL) developed under the SESAR PJ07 project (OptimisedAirspace Users Operations) The study in this paper has aspecial focus on the design phase for reaching operational fea-sibility of the concept with a potential for future deploymentAn early assessment through fast time simulations has beenconducted and is also presented in this paper to preliminaryexplore the potential operational feasibility and limitations ofthe proposed mechanism
The rest of the paper unfolds as follows Section 2discusses the state of the art and the research gaps approachedby this paper Section 3 presents the FCL model Section 4discusses the preparation of the simulations and scenariosSection 5 shows the case studies and results Section 6contains the conclusions and identifies future work lines InAppendix a brief description of the optimisation model usedin the simulations is provided
2 State of the Art
21 Classical and Modern Literature about CollaborativeDecision-Making in Slot Allocation ATFCM slots currentlyfollow the First Planned First Served (FPFS) method iesorting the flights by the estimated time of arrival at or over(ETAETO) the constrained airport or sector according tothe information present in the filed flight plans and assigningthe slots in such order This procedure is sometimes calledRation-By-Schedule (RBS) [12] FPFS is widely accepted bythe AUs because it preserves the original sequence of flights(considered fair) and it is well accepted today in ATFCMoperations because it minimises the total delay in a regulation[12 13] However although this policy was proven to be effec-tive for the resolution of demand and capacity imbalances
Journal of Advanced Transportation 3
1206
482
284
175
138
962
6752
1234
56gt6
Number of flights
Typical regulation (9 AUs)bull 6 AUs with 1 flightbull 1 AU with 2 flightsbull 1 AU with 3 to 6 flightsbull 1 AU with gt 6 flights
1234
Figure 2 Statistically typical regulationhotspot in terms of number of AUs and number of flights per AU
0
20
40
60
80
100
1 2 3 4 5 6 gt6
Frequency of AUs with certain number of flightsduring regulations
Frequency of number of flightsAccum
LVUC statisticsPercentage of Regulations in which AUs have
1 flight in regulations 6728 (Ac 6728)
2 flights in regulations 1312 (Ac 8040)
3 flights in regulations 508 (Ac 8548)
4 flights in regulations 286 (Ac 8834)
5 flights in regulations 180 (Ac 9014)
6 flights in regulations 128 (Ac 9142)
gt 6 flights in regulations 858 (Ac10000)
Figure 3 Statistically typical AU in terms of percentage of regulationshotspots in which the AU has a certain number of flights
(hotspots) it typically does not lead to an optimal allocation ofthe ATFCM slots in terms of costs for the AUs [14 15] Due tothe level of saturation in both the European and US airspacesa massive number of flights receive ATFCM delays every daywhich causes important operational disruptions and costs tothe Airspace Users (AUs) the airports and passengers [4 5]Similar congestion issues are also faced todaymdashor will be innext yearsmdashin other countries due to the worldwide increaseof traffic especially in Asia [4 16 17]
In a real operational environment the AUs are in thebest position to take business decisions on their own flightsbecause they have the required internal (and typically private)information for this reason different collaborative decision-making (CDM) processes have been studied in the lastdecades to allow the AUs to participate in the ATFCMdecision loop [2 15 18 19] as an essential strategy tominimise the impacts of deteriorated operations on all suchstakeholders [20 21] The network and the airports can also
be benefited fromAUs optimising their own operations sincethe reactionary delay is minimised and the adherence toairport slots increased [21] In Europe the CDM philosophyis the backbone of the UDPP concept
Some early developments under CDM include the alloca-tion of arrival capacity to the airlines according to the proce-dure RBS [12] See Figure 4This procedure has improved thecollaboration between airlines and ATCFM Function withrespect to the previous paradigm in which the flights weresequenced giving priority to themost recent estimated time ofarrival As a result airlines do not forfeit a slot by reporting adelay or a cancelation which was the case prior to the CDMimprovement thus the accuracy of information about delaysand cancelations has increased significantly [12]
An important concept introduced with the CDM phi-losophy is the concept of ldquopropertyrdquo by which each AUhas total control over the slots allocated to their flights byFPFSRBS mechanism It means that AUs have flexibility to
4 Journal of Advanced Transportation
Ration by Schedule
SubstitutionsCancellations Compression
ATFCM FunctionFlight slot assignments
AirlinesSchedule adjustments
ATFCM FunctionSlot exchange
Figure 4 Classical CDM architecture
exchangesubstitute the flights allocated to the slots withoutinvading the allocations of competing companies (and thenequity is preserved) [11]The trade-off between efficiency andequity is well known and has become an important topic fordiscussion in the last years [11 15 19]
The procedure for inter-airline slot exchange under CDMis calledCompression [12]This procedure seeks tomaximizein a fair and equitable manner the utilization of the availableairport capacity during hotpot situations If a flight allocatedto a slot is cancelled the concept of ldquopriorityrdquo is taken intoaccount by the system which will try to allocate first thoseflights of the AU that owns the vacant slot On this basis moreadvanced inter-airline slot exchange mechanisms have beenexplored to increase the efficiency but these new approachesare not today in operations eg the ones proposed bySchefers et al [14] by Vossen and Ball [19] or by Ivanov etal [21]
In Europe the slot swapping concept has also beenadopted by UDPP with some particularities to adapt it to theEuropean context and with some operational enhancementsdeveloped under the SESAR programme To increase theflexibility for AUs the Enhanced Slot Swapping has refinedsome of the low-level operational and implementation ruleseg allowing multislot swapping instead of multiple binaryslot swaps [9] In addition some functionalities to enhancethe level of usability and automation of the optimisationprocesses that are controlled by the AUs have been developedand partially validated such as the Fleet Delay Apportion-ment concept In this concept the AU can send a prioritylist to the ATFCM system so that the system will allocatethe flights of the AU according to the list and not accordingto the FPFSRBS rule [9] Further evolutions built on thetop of slot swapping concept were developed in the SelectiveFlight Protection feature of UDPP [9] With such a featurethe AU can ask ATFCM to reduce the delay of a selectedflight by increasing the delay of another flight placed earlierin the sequence This has as advantage that the AU doesnot need to request multiple slot swaps to reach the desiredresult Another advantage is that the AU does not sacrificeflights if there is the flight protection requested that cannotbe implemented It can happen for instance that a hole in thesequence generated by a flight releasing a slot cannot be filledwith another flight If the system cannot reduce the delay ofthe protected flight then the extra delays requested for theearlier flights are not implemented Similar advantages canbe achieved with the Slot Credit Substitution implemented inUSA [3]
22 Identification of Research Gaps Lack of Flexibility for LowVolume Operators In all the above mechanisms AUs can
adjust their schedules by substituting and cancelling flightsThe equity is preserved because there is no negative impactto flights of other AUs when slot swapping is used betweenflights of the same AU If compression is applied on the otherhand (eg after a cancellation of a flight) it typically maygenerate a positive impact to other flights often to the flightsof the owner of the cancelled flight and quite often to flights ofother AUs too However none of the above mechanisms hasbeendesigned to give flexibility to LVUCs thus all of them failfor that purpose Indeed up to the best of our knowledge noprevious approach has been addressing the needs of LVUCswhile it is keymdashcompulsory in Europe indeedmdashfrom thepoint of view of ldquoaccess and equityrdquo to find a new feature thatallows the LVUCs to participate to the UDPP mechanism
S Ruiz et al [11] showed that due to the nature of theproblem (lack of available ldquoownedrdquo slots by LVUCs) it may benecessary to relax the equity constraints (no impact to others)at least momentarily in some situations However the impactgenerated by these new features for LVUCs to other flightsmight be negligible and thus acceptable by others or mightnot be negligible but still accepted by others if they can obtainsome direct benefits as a kind of compensation (see Figure 5)eg using the same mechanism when they are LVUCs in ahotspot or if they are compensated with some better slotsfor some of their high-priority flights in exchange yet in thesame hotspot or in the long-term after multiple hotspotsThe compensation should not be necessarily given by exactlythe same AU that causes the impact but rather others cancompensate the negative impact What is important is that inthe long-term all theAUs should have no significant deviationfrom their baseline delay ie no significant deviation fromthe total FPFS delay they would have gotten at the end of thereference period if UDPP was not enabled (equity should bepreserved in the long term eg after 1 year) and that the neteconomic impact is positive for all AUs
A survey reported by Crown Consulting Inc (M Ballet al) [22] concluded that market mechanisms presentpromising characteristics to achieve the many objectives ofNextGen (or SESAR) while giving flexibility to the AUs andimproving the economic efficiency of the air transportationindustry Due to the lack of acceptability of the AUs to paymoney directly a system of ldquocreditsrdquomdashreferred to as PriorityPoints in the report citedmdashunderstood as a virtual currencywithout monetary value could be developed to increase thelevel of coordination between AUs and facilitate complex slotexchanges between AUs so that efficient and equitable slotsequences can be found
Many advanced slot allocation mechanisms have beenproposed by researchers with the aim of optimising the slotallocation process such as mechanisms based on game the-ory auctions combinatorial auctions market mechanismsand a system based on credits eg [13 14 19 21 23ndash25] How-ever a large set of these methods have the handicap of beingtoo difficult to implement in real operational environmentsandor too complex to be operated by human operatorsTherefore the mechanism developed for LVUCs should bebased on simplicity of design and usage eg long iterativenegotiation processes should be avoided to avoid generatingtoo much workload to the flight dispatchers S Ruiz et al [11]
Journal of Advanced Transportation 5
Flexibility(for cost optimisation)
Impact to others(before compensation)
NoUDPP
UDPP Flexibility vs Equity relationship
Accepted NI to becompensated in long term
Accepted NI to becompensated in short term
Positive Impact NegligibleNegative
Impact (NI)not compensated
No impact
Others
More Flexibility but m
ore difficult to prove Equity
(Slot Swapping)
(SFP)
(FDR)
(UDPP for LVUCs)
Current UDPP
Exploring new features
impact to other AUs
Figure 5 Conceptual relationship between flexibility and equity
showed some early findings based on mathematical analysissuggesting that it might be possible to find a systemwith suchcharacteristics This paper builds on the top of such findingsas explained in the following sections and presents the firstempirical evidence that increased access to flexibility mightbe possible for LVUCs without jeopardising equity
3 Flexible Credits for LVUCs (FCL) A NewUDPP Feature
31 Overview of the Mechanism The Flexible Credits forLVUCs (FCL) is a new UDPP feature built upon the existingcollaborative decision-making mechanisms that will allowthe AUs to participate in the reallocation of slots FCL isconsidered as an extension and complementary to otherUDPP features such as the Enhanced Slot Swapping (ESS) orthe Selective Flight Protection (SFP)
The new proposed mechanism is based on the use ofdelay credits (DCs) a virtual currency without monetaryvalue that can be used by LVUCs to enhance their flexibilityfor redistributing delays among their flights To make itoperationally acceptable for AUs the FCL feature aims atfacilitating the smooth coordination between AUs for theoptimisation of their operations during hotspots
The mechanism follows a ration-by-effort principle ieaiming at keeping a fair balance between the delay saved andgiven to othersThus DCs can be earned and accumulated byAUs when they are LVUCs only if they accept extra delay intheir low-priority flights This will reduce the delay to flightsof other AUs DCs will be used in the right proportion toreduce the delay of their high-priority flights One importantcharacteristic of the proposed mechanism is that credits canbe transferred from one hotspot to another so LVUCs can
increase their chances to prioritise their flights even whenthey only operate 1 flight in a hotspot LVUCs can decide atany moment if credits are fully or partially transferred fromone hotspot to another or alternatively can be used in thesame hotspot (in case that the LVUC hasmore than one flightin a hotspot)
Business aviation operators usually have few flightsinvolved in a given hotspot so they will benefit greatly fromthe introduction of this newmechanism For instance an AUoperating just one flight may accept more delay in a hotspotwhen its flight is far from its operational margins (in suchsituation its cost of delay is relatively low) Giving up part ofits operational margins will help other AUs to reduce theirdelays and in exchange the AU will earn some credits thathe will be able to use in future hotspots to reduce the overallcost when his flight is impacted severely by delay (beyond theoperational margins)
Consider the illustrative case in Figure 6 in which anLVUC has only one flight (FL001) in Hotspot 1 and one flight(FL002) in Hotspot 2 In both cases the AU cannot improvehis situation (lower the cost impact of delay) with the currentEnhanced Slot Swapping FDR nor SFP features Howeverwith FCL the AU could have access to UDPP and couldsubstantially improve his situation Note that in this examplethe flight FL001 has a certain amount of delay (D1) that couldbe increased due to the operational margins available withrelatively low impact in terms of cost Accepting the extradelay (D1rsquogtD1) theAU is giving up his position and reducingthe delay (positive impact) of the AUs between the originaland the new sequence positionTheAU can then be rewardedfor this with an amount of delay credits proportional to theextra delay accepted (in this document 1 DC = 1 minute ofdelay) In Hotspot 2 the LVUC could use the credits available
6 Journal of Advanced Transportation
Hotspot 1
Hotspot 2
Advanced UDPP features are needed to give access to LVUCs
Flexible Credits for LVUCsslot exchange among AUsand in multiple hotspots)
FL001 ++ DelayFL002 -- Delay
FL002
FL001
D2
D1
Hotspot 1
Hotspot 2
FL002
FL001
D2rsquo
D1rsquo
Figure 6 Illustration of an LVUC exchanging delay and credits between two hotspots
timePositive impact to others
(-3 min less per flight)Negative impact to others(+3 min more per flight)
Flight 2Baselinebull Delay 50 minbull Cost of delay 1000euro
Aer FCLbull Delay 26 min (-24 min)bull Cost of delay 500euro (-500euro)
Flight 1Baselinebull Delay 30 minbull Cost of delay 500euro
Aer FCLbull Delay 54 min (+ 24 min)bull Cost of delay 700euro (+200euro)
Total LVUCrsquos delay and costBaselinebull Delay 80 minbull Cost of delay 1500euro
Aer FCLbull Delay 80 min (same total delay)bull Cost of delay 1200euro (-300euro)
+24 minutes -24 minutes
Figure 7 Illustration of an LVUC exchanging delay and credits in the same hotspot
from Hotspot 1 because flight FL002 has an amount of delayD2 that has an important impact in terms of costs for theLVUC After using part or all of the credits available theAU can reduce the delay for that flight from D2 to D2rsquowhich is an amount of delay within the operational marginsavailable for that flight and therefore with marginal cost ofdelay The AUs between the baseline and the new positionare impacted negatively but with just one position in thesequence (typically it means 2 or 3 minutes or less of extradelay)
The consideration of an AU as a LVUC may change indifferent hotspots according to the circumstances thereforeeven large airlines can often be considered as LVUCs inmany hotspots (typically in hotspots at airports in whichthey operate a few flights) The access to FCL and LVUCrules to any AUmdashin those hotspots in which the AU canbe considered as LVUCmdashcan help to accept some degree ofinequity in favour of LVUCs at some moment in time (butwith equity compensated over time)
Another example is illustrated in Figure 7 The sequencein the example is dominated in presence by two AUs thatare not LVUCs represented by sticks coloured in green andblue whereas there is a LVUCwith only two flights identifiedin the sequence in orange The example illustrates how theLVUC can reduce the total impact of delay (costs) in the samehotspot by increasing +24 minutes the delay of flight 1 toobtain 24 delay credits and then reducing the delay of flight2 by giving the 24 credits gotten previously In this example a
20 of cost reduction could be achieved due to the nonlinearrelationship between the fleet cost structure and its delayThe impact on other flights can be considered negligible (3minutes of extra delay per flight if impacted) accordingto the AU experts that have reviewed such figures (furtherresearch will be conducted to fully validate such assumption)
32 FCL Rules to Preserve Equity under High FlexibilityConditions In FCL high flexibility is given to LVUCs tominimise their own global delay costs ie the LVUC hasfull freedom to transfer its total baseline delay (ie initialATFCM delay) among its flights and to exchange freely flightsequence positionswith otherAUswhile only being subject totwo particular equity constraints (1)AUrsquos total baseline delaycannot be reduced and (2) the Maximum Negative Impactof Time (MNIT) for individual flights in a hotspot must berespected
The main rules of FCL are defined as follows
(1) Any AU with a given number of flights (3 or lessis considered as an initial proposal) in a hotspot isconsidered as LVUC in the context of such a hotspot(note perhaps other criteria might be used in thefuture to determine whether an AU is an LVUC ina given hotspot eg the AUsrsquo share of flights in thehotspot but such a concept requires further research)
(2) Any LVUC in a hotspot can save credits obtained byincreasing the delay in some flights (thus giving better
Journal of Advanced Transportation 7
sequence positions to other AUs) and use them inthat particular hotspot or keep them to use in futurehotspots
(3) Any LVUC in a hotspot can use Leftover OperationalCredits (LOCs) obtained in the past to protect flightsin the current hotspot LOCs could be weighted upto take into account the differences of the hotspotsin terms of duration and severity so that the equityamong AUs can be preserved (out of the scope of thisresearch though)
(4) LVUCs can request any target place in the sequence(eg corresponding to the optimal delay allocationfor that flight) irrespective of where and when theefforts were done to obtain the credits (note that thisrule applies only for LVUCs which by definitionare expected to have less flexibility than other AUs itmay occur that in a particular hotspot the only flightavailable for a suspension could be in positions afterthe one that is tactically important for the LVUC)
(5) TheAUsrsquo total delay at the end of the reference period(eg 1 year) must be the same (or near the same) asthe baseline delay (delay without UDPP eg FPFS)
(6) The Maximum Negative Impact of Time (MNIT)represents the maximum minutes of additional delaythat LVUCs can cause to a flight of another AULVUCs might be unable to protect and reduce thedelay for a particular flight if the MNIT has beenreached for any of the flights it affects
(7) All the requests will be sorted by the requested timeand will be integrated in the sequence in FIFO orderand by minimising the impact to others No emptypositions should be found in the sequence (compres-sion) and requests that could generate impact greaterthan MNIT will be allocated to the nearest feasiblesolution
33 Assumptions and Principles of the Mechanism The pro-posed method is based on the following assumptions
(i) All transactions of credits and slots exchanges willbe initiated through the Airport or ATFCM actortriggering the UDPP mechanism which will act as abroker and supervisor
(ii) AUs must be consistent and accept any consequencederived from their own decisions
(iii) Regarding the NM and the CFL system one minuteof delay will be considered as having the same ldquovaluerdquofor all the flights (ie 1 minute delay = 1 DC) (note tohave more control on equity aspects future researchmay consider different value of delay depending onthe position in the sequence and the level of delayalready allocated to such position)
(iv) No negative delays are allowed during the slot real-location (this could be relaxed later but for themoment this assumption is taken for the sake ofsimplification)
(v) No uncertainty associated with the new slot allo-cations planned during UDPP is considered (ieConfidence Index = 1)
(vi) Having credits is useful and positive for the AUs sincecredits provide flexibility to adapt the operations tochanging and unforeseen conditions AUs must con-tribute to the network with something in exchangeeg assuming extra delays for some flights under aregulation to give their sequence positions to otherAUs
(vii) No loss of value or expiry of credits is currentlyconsidered (although this may be reviewed later)
(viii) AUs are able to and have the necessary information(eg historical records) to make decisions involv-ing different hotspots over the time thus makinga stochasticprobabilistic management of delay andmanagement of impact of delay
(ix) The FCL decisions should be made and supervisedcarefully by expert human operators that will ensurethe stability of the system and the application of goodpractice (ie automation shall only be provided tosupport human decision-making and control)
(x) If an AU sends no sequence position request fora given participating flight it is assumed that it iswilling to take advantage of any delay reductionopportunity for such flight (this assumption is con-sistent with the assumptions behind the compressionalgorithm detailed by T bossen and M Ball [12])
(xi) FCL can coexist with the FDR and SFP features thatwill be used by non-LVUC operators
(xii) Special care should be taken when extending thevalidity of the credits through different hotspotsas the severity duration or the flights involved aredifferent in each situation Hence the credits shouldnot have the same value in all hotspots This is out ofthe scope of this research but in future research anequivalence factor could be developed to update thenumber of credits to transfer credits fromone hotspotto another being equitable for the AUs involved egassociating the number of credits given or requestedaccording to the amount of delay associated with thepositions released or taken
4 Preparation of the Simulations
41 User Delay Optimisation Model (UDOM)Used in the Sim-ulations In order to generate trustworthy evidence throughsimulations it is necessary to approximate the expecteddecisions potentially made by LVUCs using FCL with regardto the management of delay For that purpose the User DelayOptimisation Model (UDOM) presented by S Ruiz et al [11]has been used A summary of the model together with anextension to include some implementation aspects can befound in Appendix
42 Description of the Traffic Scenario The scenario usedfor the case study has been previously used in some UDPP
8 Journal of Advanced Transportation
Flights ETA CTA FPFS Baseline delay UCTA FCL Delay UDPP Diff DelaysOA3 5896D 1216 1215 0 1215 0 0HUB 8384 1216 1218 2 1218 2 0Empty 1221 1221 0 1221 0 0LC2 2213 1226 1224 0 1224 0 0Empty 1227 1227 0 1227 0 0HUB 9757 1231 1230 0 1230 0 0LC1 311 1231 1233 2 1233 2 0HUB 6068 1236 1236 0 1236 0 0HUB 5701 1236 1239 0 1239 0 0HUB 6612 1236 1242 6 1242 6 0HUB 5229 1238 1245 7 1245 7 0LC2 6426 1241 1248 7 1248 7 0HUB 1988 1246 1251 5 1251 5 0OA2 320D 1249 1254 5 1254 5 0HUB 4325 1251 1257 6 1257 6 0LC1 2612 1251 1300 9 1300 9 0HUB 3422 1256 1303 7 1303 7 0HUB 8106 1256 1306 10 1306 10 0HUB 9359 1302 1309 7 1309 7 0HUB 9293 1303 1312 9 1312 9 0OA8 6731 1305 1315 10 1315 10 0OA5 727D 1306 1318 12 1318 12 0HUB 5126 1306 1321 15 1321 15 0LC1 4740 1306 1324 18 1324 18 0HUB 9649 1307 1327 20 1327 20 0OA1 5626 1316 1330 14 1330 14 0HUB 9173 1317 1333 16 1333 16 0HUB 9423 1318 1336 18 1336 18 0HUB 5366 1319 1339 20 1339 20 0HUB 4009 1319 1342 23 1342 23 0HUB 8488 1321 1345 24 1345 24 0HUB 4025 1322 1348 26 1348 26 0HUB 1723 1326 1351 25 1351 25 0HUB 5084 1327 1354 27 1354 27 0HUB 4624 1328 1357 29 1357 29 0HUB 1654 1328 1400 32 1400 32 0OA8 4205 1333 1403 30 1403 30 0HUB 9873 1334 1406 32 1406 32 0HUB 3784 1338 1409 31 1409 31 0LC2 2413 1339 1412 33 1412 33 0HUB 5912 1346 1415 29 1415 29 0LC1 1592 1346 1418 32 1418 32 0HUB 1746 1346 1421 35 1421 35 0LC2 2315 1346 1424 38 1424 38 0LC1 6825 1347 1427 40 1427 40 0HUB 6434 1347 1430 43 1430 43 0OA1 318 1347 1433 46 1433 46 0HUB 4321 1348 1436 48 1436 48 0HUB 761 1348 1439 51 1439 51 0
HUB 6242 1351 1442 51 1442 51 0HUB 8150 1351 1445 54 1445 54 0LC2 2119 1354 1448 54 1448 54 0HUB 591 1355 1451 56 1451 56 0HUB 5618 1400 1454 54 1454 54 0LC2 8387 1402 1457 55 1457 55 0OA8 8611 1404 1500 56 1500 56 0LC2 5206 1404 1503 59 1503 59 0LC1 7103 1406 1506 60 1506 60 0OA3 2151 1410 1509 59 1509 59 0OA8 8667 1411 1512 61 1512 61 0LC1 1105 1416 1515 59 1515 59 0HUB 3749 1424 1518 54 1518 54 0LC2 2373 1424 1521 57 1521 57 0LC2 532 1426 1524 58 1524 58 0OA5 108 1426 1527 61 1527 61 0OA1 192 1436 1530 54 1530 54 0OA1 1714 1441 1533 52 1533 52 0OA6 7277 1456 1536 40 1536 40 0HUB 3535 1456 1539 43 1539 43 0HUB 8114 1506 1542 36 1542 36 0LC2 6219 1506 1545 39 1545 39 0OA8 356 1508 1548 40 1548 40 0HUB 6065 1509 1551 42 1551 42 0OA6 1107 1516 1554 38 1554 38 0HUB 4033 1516 1557 41 1557 41 0HUB 8308 1519 1600 41 1600 41 0OA1 414 1531 1603 32 1603 32 0HUB 6072 1534 1606 32 1606 32 0HUB 5723 1541 1609 28 1609 28 0HUB 8639 1542 1612 30 1612 30 0HUB 5622 1546 1615 29 1615 29 0LC1 1844 1548 1618 30 1618 30 0OA1 824 1552 1621 29 1621 29 0LC2 1052 1556 1624 28 1624 28 0HUB 8374 1556 1627 31 1627 31 0LC2 9998 1557 1630 33 1630 33 0HUB 8498 1603 1633 30 1633 30 0HUB 8214 1606 1636 30 1636 30 0OA4 8655 1606 1639 33 1639 33 0HUB 8635 1615 1642 27 1642 27 0HUB 1729 1615 1645 30 1645 30 0OA2 101D 1621 1648 27 1648 27 0HUB 5815 1621 1651 30 1651 30 0OA6 955 1633 1654 21 1654 21 0OA5 680D 1636 1657 21 1657 21 0OA6 2033 1646 1700 14 1700 14 0HUB 771 1648 1701 13 1701 13 0OA8 8223 1651 1702 11 1702 11 0
Figure 8 Schedule list with ETAs CTAs and calculated delays
validation exercises and has been slightly adapted for thepurpose of this new research It is based on historical trafficdemand of 96 flights at a coordinated airport from 1215 to1700 approximately
Figure 8 shows the schedule list in detail showing theExpected Time of Arrival (ETA) planned for each flightthe new Controlled Time of Arrival (CTA) assigned byFPFS policy (CTA FPFS) and the calculated delay alsothe new user-preferred CTA after the application of FCLprioritizations (UCTA FCL) and the calculated delay Thelast column shows for each flight the difference in the delayallocated by FPFS and ESFP mechanisms Note that ESFPtakes as a baseline the same policy applied at a given airportin this case FPFS thus at the beginning there is no differencein the baseline delay
Figure 9 shows the evolution of the delay in the hotspotwhich is directly correlated with the number of positions 119896119894that a flight i is far from its original position in the sequence(delay is proportional to the number of positions and the sizein time of each position in the sequence)
Table 1 shows the distribution of flights and delay perAirspaceUser Note that delay is distributed among AUs after
aggregating the delay of all their flights as a direct proportionof the share of flights A certain degree of concentration ofsome flights has been identified after analysing the flightpositions especially for the user HUB and LC2 In thisparticular case HUB has many of its flights in positions withlow delay and LC2 has the flights concentrated in positionssubject to relatively long delay
Note that some AUs have three or less flights in thesequence and therefore they can be considered as LVUCs
43 Description of the Cost Model Used and Its Parameterisa-tion A simplified cost model has been taken into account inthe simulations to quantify the impact of delay on flights Thecosts of delay for flights have been modelled with a quadraticfunction as follows
119888 (119889) = 12057621198892 (1)
Using a quadratic model instead of more realistic nons-mooth and nonconvex utility curves is a strong simplification(see Figure 16) that cannot be made in all the contextsto generate reliable evidence However for the purpose of
Journal of Advanced Transportation 9
0
10
20
30
40
50
60
70
1 3 5 7 9 11 13 15 17 19 21 23 25 27 29 31 33 35 37 39 41 43 45 47 49 51 53 55 57 59 61 63 65 67 69 71 73 75 77 79 81 83 85 87 89 91 93 95 97 99
Min
utes
(del
ay) o
r flig
hts
posit
ions
(Ki)
Positionsflights
Ki and Delay per each flight
Ki (flights)Delay (minutes)
Figure 9 Ki and delay per flight
Table 1 Distribution of flights and delay per AU
AU name Total flights of flightsBaselinedelay(min)
of B Delay Baseline Cost(euro) of B Costs
HUB 52 5417 1316 4874 -29283 4504LC1 8 833 248 919 -4735 728LC2 12 1250 421 1559 -12471 1918OA1 6 625 227 841 -7178 1104OA2 2 208 27 100 -425 065OA3 2 208 59 219 -1131 174OA4 1 104 33 122 -811 125OA5 3 313 73 270 -2632 405OA6 4 417 99 367 -1658 255OA7 0 000 0 000 0 000OA8 6 625 197 730 -4691 722
96 2700 -65017
this research such simplification brings more advantagesthan disadvantages For instance it eases the analyticalstudymdashwith UDOMmdashof the dominant strategies of the AUsfollowed during the optimal redistribution of their delay andthus to anticipate the expected dynamics in the system whichis the main purpose of this research The emergent dynamicsof the system will be analysed under the hypothetical what-if scenario in which some AUs are allowed to optimisethe allocation of their delay by redistributing under high-flexibility conditions their baseline delay among their con-strained flights It should be noted that the underlying systemdynamics should be similar either with the simplified modelor with more realistic utility curves since these dynamicsdepend mostly on the trends driven by the AUsrsquo dominantstrategies Such simplified approach also allows calculatinga first-order approximation to the cost reduction potentialin relative terms (absolute realistic cost figures are hardlydifficult to find due to their privacy nature and their strategicvalue for airlines) For a more refined study of the potentialbenefits for the AUs it may be necessary to adopt realisticnonsmooth curves and the approached with nonsmooth
optimisation techniques (see eg G Stojkovic et al [26] orR Hoffman [27])
Each flight of the scenario has been randomly parame-terised with different sensitivities to delay ie with different120576 (aka elasticity) The assignation of epsilonselasticitiesfor each flight has been done randomly following a uniformprobabilistic distribution bounded within the range 120576 isin[minus2 minus05] All the flights had the same probability to get anyvalue of elasticity within such range In practice it meansthat all the flights were assigned costs as a function of theirdelay within the maximum and minimum range illustratedin Table 2
Such approximation of AUs costs is not fully representa-tive of the high level of complexity of the actual cost structures(eg different types and sizes of knock-on delay impacts)However the approach is considered valid at this maturitylevel to observe the potential benefits andor impacts ofFCL when flights and AUs with heterogeneous cost curvescoexist in the same hotspot The purpose is to early assessthe potential feasibility of the FCL concept to enable theobservation of potential emergent dynamics and to start
10 Journal of Advanced Transportation
Flights Baseline delay Epsilon Baseline cost Optimal tau Delay request Optimal cost DiffOA3 5896D 0 -134 0 0 0 0 000HUB 8384 2 -15 -3 0 2 -3 000
Empty 0 -185 0 0 0 0 000LC2 2213 0 -135 0 0 0 0 000
Empty 0 -186 0 0 0 0 000HUB 9757 0 -051 0 0 0 0 000LC1 311 2 -155 -3 0 2 -3 000
HUB 6068 0 -163 0 0 0 0 000HUB 5701 0 -097 0 0 0 0 000HUB 6612 6 -169 -30 0 6 -30 000HUB 5229 7 -195 -48 0 7 -48 000LC2 6426 7 -07 -17 0 7 -17 000HUB 1988 5 -139 -17 0 5 -17 000OA2 320D 5 -138 -17 0 5 -17 000HUB 4325 6 -154 -28 0 6 -28 000LC1 2612 9 -144 -58 12 21 -325 -26706HUB 3422 7 -193 -47 11 18 -298 -25060HUB 8106 10 -123 -61 18 28 -467 -40591HUB 9359 7 -131 -32 19 26 -439 -40677HUB 9293 9 -17 -69 11 20 -338 -26933OA8 6731 10 -159 -79 16 26 -546 -46613OA5 727D 12 -119 -86 23 35 -739 -65318HUB 5126 15 -162 -182 6 21 -355 -17263LC1 4740 18 -081 -131 20 38 -578 -44724HUB 9649 20 -088 -176 19 39 -653 -47731OA1 5626 14 -101 -99 38 52 -1361 -126191HUB 9173 16 -102 -131 17 33 -564 -43308HUB 9423 18 -113 -183 12 30 -509 -32571HUB 5366 20 -182 -364 -1 19 -316 4811HUB 4009 23 -142 -376 1 24 -405 -2928HUB 8488 24 -071 -204 24 48 -810 -60525HUB 4025 26 -104 -352 7 33 -553 -20128HUB 1723 25 -2 -625 -8 17 -287 33754HUB 5084 27 -139 -507 -3 24 -414 9305HUB 4624 29 -058 -244 29 58 -991 -74734HUB 1654 32 -133 -681 -7 25 -432 24870OA8 4205 30 -165 -742 -5 25 -526 21671HUB 9873 32 -157 -804 -10 22 -366 43765HUB 3784 31 -171 -822 -11 20 -336 48545LC2 2413 33 -143 -779 2 35 -874 -9565HUB 5912 29 -087 -366 10 39 -661 -29498LC1 1592 32 -055 -282 24 56 -852 -57031HUB 1746 35 -15 -919 -12 23 -383 53548LC2 2315 38 -079 -570 25 63 -1583 -101218LC1 6825 40 -115 -920 -13 27 -407 51256HUB 6434 43 -16 -1479 -22 21 -359 111988OA1 318 46 -192 -2031 -19 27 -716 131547
HUB 4321 48 -112 -1290 -18 30 -513 77693HUB 761 51 -051 -663 15 66 -1127 -46402
HUB 6242 51 -105 -1366 -19 32 -548 81799HUB 8150 54 -2 -2916 -37 17 -287 262854LC2 2119 54 -084 -1225 6 60 -1488 -26364HUB 591 56 -061 -956 0 56 -942 1400
HUB 5618 54 -066 -962 -3 51 -871 9120LC2 8387 55 -112 -1694 -10 45 -1116 57773OA8 8611 56 -094 -1474 -12 44 -923 55099LC2 5206 59 -103 -1793 -10 49 -1214 57891LC1 7103 60 -056 -1008 -5 55 -837 17130OA3 2151 59 -065 -1131 0 59 -1131 000OA8 8667 61 -096 -1786 -18 43 -904 88238LC1 1105 59 -087 -1514 -24 35 -539 97567HUB 3749 54 -194 -2829 -37 17 -296 253217LC2 2373 57 -114 -1852 -13 44 -1097 75524LC2 532 58 -12 -2018 -16 42 -1042 97655OA5 108 61 -128 -2381 -28 33 -687 169453OA1 192 54 -133 -1939 -15 39 -1033 90568
OA1 1714 52 -112 -1514 -5 47 -1227 28701OA6 7277 40 -101 -808 -12 28 -408 40004HUB 3535 43 -098 -906 -8 35 -587 31937HUB 8114 36 -194 -1257 -19 17 -296 96077LC2 6219 39 -2 -1521 -14 25 -625 89589OA8 356 40 -072 -576 18 58 -1205 -62893
HUB 6065 42 -071 -626 6 48 -810 -18351OA6 1107 38 -072 -520 2 40 -572 -5244HUB 4033 41 -107 -899 -9 32 -537 36203HUB 8308 41 -099 -832 -7 34 -581 25138OA1 414 32 -175 -896 -2 30 -785 11057
HUB 6072 32 -129 -660 -6 26 -446 21481HUB 5723 28 -119 -466 0 28 -483 -1664HUB 8639 30 -088 -396 9 39 -653 -25731HUB 5622 29 -087 -366 10 39 -661 -29498LC1 1844 30 -182 -819 -13 17 -257 56155OA1 824 29 -166 -698 3 32 -828 -12998LC2 1052 28 -182 -713 -1 27 -687 2650HUB 8374 31 -142 -682 -7 24 -405 27744LC2 9998 33 -053 -289 32 65 -1120 -83104HUB 8498 30 -076 -342 15 45 -756 -41446HUB 8214 30 -14 -630 -6 24 -411 21935OA4 8655 33 -149 -811 0 33 -811 000HUB 8635 27 -129 -470 -1 26 -446 2454HUB 1729 30 -072 -324 17 47 -795 -47124OA2 101D 27 -112 -408 0 27 -408 000HUB 5815 30 -139 -625 -6 24 -414 21189OA6 955 21 -1 -220 8 29 -412 -19154
OA5 680D 21 -075 -165 5 26 -254 -8813OA6 2033 14 -112 -110 2 16 -143 -3360HUB 771 13 -08 -68 1 14 -78 -1080
OA8 8223 11 -055 -33 0 11 -33 000
Figure 10 Schedule list with delay costs and optimal delay requested per flight (case study 1)
Table 2 Distribution of flights and delay per AU
Minutes of delayLow costflight
(120576 = minus05)High costflight(120576 = minus2)
1st minute 025euro 1euro10 minutes 25euro 100euro20 minutes 100euro 400euro30 minutes 225euro 900euro40 minutes 400euro 1600euro50 minutes 625euro 2500euro60 minutes 900euro 3600euro70 minutes 1225euro 4900euro
quantifying the potential benefits of flexibility for the LVUCsand for the rest of the AUs
Table 1 shows the baseline delay and baseline costs perAU Note that since the elasticities were randomly assignedto flights it was already expected that AUs had a proportionof costs similar to the share of delay
5 Case Studies and Results
The following three case studies were simulated and analysedwith the purpose of generating early empirical evidence aboutthe potential feasibility and limitations of the FCL method
Case study 1 answers the question of whether the FCL featurecan be used by all the AUs and for all the flights in a hotspotcase study 2 sheds light on whether the FCL mechanismcould generate acceptable outcomes with a reduced numberof flights using the mechanism in a single hotspot (3 flightswas considered appropriate by a panel of AUs experts as astarting point for the analysis) case study 3 illustrates anexample similar to case study 2 but including delay creditsthat are assumed to be transferred from past hotspots
51 Case Study 1 All the AUs Using the FCL System A firstquestion that seems relevant to answer is whether the highflexibility conditions given by FCL could be used by all theAUs and not only by those considered LVUCs in a givenhotspot This question was preliminary discussed by S Ruizet al in [11] After that several AU experts showed interest inexploring the possibility of using FCL by all the AUs ie notonly for LVUCs This case study explores this idea
Figure 10 shows the requested optimal delay changes(taus) calculated with UDOM as well as the impact of thedelay change on each flight For convenience it has beenassumed that only the flights in and after the position offlight LC1 2612 a flight that has 9 minutes of delay could beincluded in the FCL optimisation ie the AUs could not useFCL to change the position of those flights earlier than flightLC1 2612
Table 3 shows the aggregated impact on the costs perAU Note that in relative terms all the AUs can optimise
Journal of Advanced Transportation 11
Table 3 Potential cost reductions per AU using UDOM (case study 1)
AU name Total flights Baseline delay Baseline cost Optimal cost Diff Cost ReducHUB 52 1316 -29283 -23007 6276 2143LC1 8 248 -4735 -3799 936 1978LC2 12 421 -12471 -10863 1608 1290OA1 6 227 -7178 -5951 1227 1709OA2 2 27 -425 -425 0 000OA3 2 59 -1131 -1131 0 000OA4 1 33 -811 -811 0 000OA5 3 73 -2632 -1679 953 3621OA6 4 99 -1658 -1536 122 739OA7 0 0 0 0 0 000OA8 6 197 -4691 -4136 555 1183
96 2700 -65017 -53339
0
1
2
3
4
5
6Slots requests aer UDOM
121
512
21
122
712
33
123
912
45
125
112
57
130
313
09
131
513
21
132
713
33
133
913
45
135
113
57
140
314
09
141
514
21
142
714
33
143
914
45
145
114
57
150
315
09
151
515
21
152
715
33
153
915
45
155
115
57
160
316
09
161
516
21
162
716
33
163
916
45
165
116
57
170
1
Figure 11 Slots requested by AUs after using UDOM (case study 1)
their costs in similar proportions and it is worthy to pointout that the AU with more potential for cost reduction hasonly 3 flights (an LVUC) The potential for cost reduction inthis scenario for the AUs has been found within the rangeof approximately 7 up to 36 (average cost reduction ofaround 17) The potential for cost reduction depends onthe cost structure of the flights in the hotspot and on theamount of delay allocated by the baseline sequence to eachof the flights Also it must be observed that some AUsmdashOA2OA3 OA4 and OA7mdashcannot minimise their costs In thecase ofOA2OA3 andOA4 they have indeed just one of theirflights in the hotspot (OA2 and OA3 have another flight butwere not candidates for using FCL since they are consideredto be out of the hotspot) thus they cannot exchange delaybetween their flights The use of credits with validity over thetime could be used for giving flexibility to those AUs
Figure 11 shows the slots demanded by the AUs with theaim of optimising their own costs It can be observed in thefigure that the demand is more or less evenly distributedThepresence of holes (slots not demanded) which are also spreadmore or less evenly along the sequence is a consequenceof the random distribution of cost structures (with differentepsilons randomly assigned) together with the effect of theequity rule that forces the AUs to release slots in exchange
of better slots for their relatively more expensive flightsNevertheless due to the need to allocate one flight to eachavailable sequence position the flights have been sorted byrequested slot time and then they have been compressed toavoid empty slots and to optimise capacity
Figure 12 is an evidence of complex dynamics and inter-AUs demand incompatibilities emerging after trying to joinall the individual requests in a single sequence The figureshows at each sequence position the difference in minutesbetween the allocated position and the one requested Ingeneral it can be expected that less delay than the onerequested (negative values in the chart) will have positiveimpact on AUs which is advantageous for those flights Inthe middle of the sequence due to the limited capacity withrespect to new demand for slots some flights can be foundthat requested less delay but that will receive more delay thanrequested (they will be placed at later positions) Thereforedue to the incompatibilities of the many AUs requests someflights are getting less delay (and less cost) and some moredelay (and more cost) Table 4 shows the total effect in thetotal cost supported by the AUs while Table 5 shows the newdistribution of delay per AU It can be noted that some AUsare significantly worse-off in terms of delays and costs aftertrying to optimise their costs through the FCL mechanism
12 Journal of Advanced Transportation
minus20
minus15
minus10
minus5
0
5
10
15
20
121
512
21
122
712
33
123
912
45
125
112
57
130
313
09
131
513
21
132
713
33
133
913
45
135
113
57
140
314
09
141
514
21
142
714
33
143
914
45
145
114
57
150
315
09
151
515
21
152
715
33
153
915
45
155
115
57
160
316
09
161
516
21
162
716
33
163
916
45
165
116
57
170
1
Deviation of slots requested aer compression
Figure 12 Deviation of slots requested after compression (case study 1)
Table 4 Effect of sequence compression on the AUs actual costs (case study 1)
AU name Baselinecost
Optimalcost
Diff(optim-base)
Reduc Actual costDiff(actual -base)
Reduc
HUB -29283 -23007 6276 2143 -21624 7659 2615LC1 -4735 -3799 936 1978 -4361 374 790LC2 -12471 -10863 1608 1290 -14785 -2314 -1856OA1 -7178 -5951 1227 1709 -7999 -821 -1144OA2 -425 -425 0 000 -340 86 2014OA3 -1131 -1131 0 000 -1927 -796 -7032OA4 -811 -811 0 000 -543 268 3306OA5 -2632 -1679 953 3621 -1783 849 3225OA6 -1658 -1536 122 739 -1706 -48 -291OA7OA8 -4691 -4136 555 1183 -4678 13 027
52 Case Study 2 LVUCs with up to 3 Flights in the Hotspot(SingleHotspot Optimisation) In this case study the purposeis to assess the benefits of enabling FLC mechanism only forLVUCs that have up to three flights The impact to others isalso assessed As shown in Figure 13 only OA2 OA3 O4and OA5 are LVUCs in this hotspot scenario Note that OA3and OA4 have 1 flight each in the hotspot (OA3 has anotherflight in the scenario but is placed before the hotspot) OA2has 2 flights and OA5 has 3 flights In the figure they canbe found highlighted with different colours The optimaldelay requests found with UDOM for those AUs can also befound in the figure together with the cost variation for thoseflights
In this case study optimisation is only allowed withinthe hotspot ie AUs cannot optimise their delay throughoutmultiple hotspots Thus the LVUCs with one single flightOA3 andOA4will not have flexibility tominimise the impactof their baseline delay
Figure 14 shows the changes in the sequence after theimplementation of the LVUCs requests It can be observedthat the maximum impact on individual flights of other AUshas been 3 minutes (corresponding in this scenario to onesequence position)
Table 6 shows the aggregated variation of delay for thedifferent AUs which in the light of the figures and afterconsultation with a panel of operational experts (whichincluded AUs representatives) it can be considered as negli-gible impact Note that LC2 is the AU receiving more delayie 9 minutes with no more than 3 minutes per flight Noteas well that OA2 and OA5 have the same delay as the baseline(no impact)
In terms of costs Table 7 shows that OA2 and OA5 couldpotentially optimise their costs to figures that are quite closeto what UDOM found ie 2234 of cost reduction for OA2(who expected a 2561 of cost reduction) and 3838 ofcost reduction for OA6 (who aimed at reducing the cost in3621)
Regarding the impact on the rest of the AUs somerelatively small variations can be observed in Table 7 Itmust be pointed out that variation of 1-2 of cost couldbe considered as very huge impacts in reality however tointerpret the results of this simulation exercises it mustbe reminded that flights typically operate with some tol-erances that makes the flight costs to be typically not sosensitive to an extra minute of delay (the quadratic coststructure is most likely not representing well the impact to
Journal of Advanced Transportation 13
Table 5 Effect of sequence compression on the distribution of delay (case study 1)
AU name Total flights Baseline delay Assigned delay Difference Avg DelayHUB 52 1385 1283 102 2663LC1 8 250 259 -9 3125LC2 12 461 524 -63 3842OA1 6 227 260 -33 3783OA2 2 32 29 3 1600OA3 2 59 77 -18 2950OA4 1 33 27 6 3300OA5 3 94 79 15 3133OA6 4 113 110 3 2825OA7 0 0 0 0 000OA8 6 208 214 -6 3467
96 2862 2862 0
Flights Baseline delay Epsilon Baseline cost Optimal tau Delay request Optimal cost DiffOA3 5896D 0 -134 0 0 0 0 0HUB 8384 2 -15 -3 0 2 -3 0
Empty 0 -185 0 0 0 0 0LC2 2213 0 -135 0 0 0 0 0
Empty 0 -186 0 0 0 0 0HUB 9757 0 -051 0 0 0 0 0LC1 311 2 -155 -3 0 2 -3 0
HUB 6068 0 -163 0 0 0 0 0HUB 5701 0 -097 0 0 0 0 0HUB 6612 6 -169 -30 0 6 -30 0HUB 5229 7 -195 -48 0 7 -48 0LC2 6426 7 -07 -17 0 7 -17 0HUB 1988 5 -139 -17 0 5 -17 0OA2 320D 5 -138 -17 9 14 -142 -125HUB 4325 6 -154 -28 0 6 -28 0LC1 2612 9 -144 -58 0 9 -58 0HUB 3422 7 -193 -47 0 7 -47 0HUB 8106 10 -123 -61 0 10 -61 0HUB 9359 7 -131 -32 0 7 -32 0HUB 9293 9 -17 -69 0 9 -69 0OA8 6731 10 -159 -79 0 10 -79 0OA5 727D 12 -119 -86 23 35 -739 -653HUB 5126 15 -162 -182 0 15 -182 0LC1 4740 18 -081 -131 0 18 -131 0HUB 9649 20 -088 -176 0 20 -176 0OA1 5626 14 -101 -99 0 14 -99 0HUB 9173 16 -102 -131 0 16 -131 0HUB 9423 18 -113 -183 0 18 -183 0HUB 5366 20 -182 -364 0 20 -364 0HUB 4009 23 -142 -376 0 23 -376 0HUB 8488 24 -071 -204 0 24 -204 0HUB 4025 26 -104 -352 0 26 -352 0HUB 1723 25 -2 -625 0 25 -625 0HUB 5084 27 -139 -507 0 27 -507 0HUB 4624 29 -058 -244 0 29 -244 0HUB 1654 32 -133 -681 0 32 -681 0OA8 4205 30 -165 -742 0 30 -742 0HUB 9873 32 -157 -804 0 32 -804 0HUB 3784 31 -171 -822 0 31 -822 0LC2 2413 33 -143 -779 0 33 -779 0HUB 5912 29 -087 -366 0 29 -366 0LC1 1592 32 -055 -282 0 32 -282 0HUB 1746 35 -15 -919 0 35 -919 0LC2 2315 38 -079 -570 0 38 -570 0LC1 6825 40 -115 -920 0 40 -920 0HUB 6434 43 -16 -1479 0 43 -1479 0OA1 318 46 -192 -2031 0 46 -2031 0
HUB 4321 48 -112 -1290 0 48 -1290 0HUB 761 51 -051 -663 0 51 -663 0
HUB 6242 51 -105 -1366 0 51 -1366 0HUB 8150 54 -2 -2916 0 54 -2916 0LC2 2119 54 -084 -1225 0 54 -1225 0HUB 591 56 -061 -956 0 56 -956 0
HUB 5618 54 -066 -962 0 54 -962 0LC2 8387 55 -112 -1694 0 55 -1694 0OA8 8611 56 -094 -1474 0 56 -1474 0LC2 5206 59 -103 -1793 0 59 -1793 0LC1 7103 60 -056 -1008 0 60 -1008 0OA3 2151 59 -065 -1131 0 59 -1131 0OA8 8667 61 -096 -1786 0 61 -1786 0LC1 1105 59 -087 -1514 0 59 -1514 0HUB 3749 54 -194 -2829 0 54 -2829 0LC2 2373 57 -114 -1852 0 57 -1852 0LC2 532 58 -12 -2018 0 58 -2018 0OA5 108 61 -128 -2381 -28 33 -687 1695OA1 192 54 -133 -1939 0 54 -1939 0
OA1 1714 52 -112 -1514 0 52 -1514 0OA6 7277 40 -101 -808 0 40 -808 0HUB 3535 43 -098 -906 0 43 -906 0HUB 8114 36 -194 -1257 0 36 -1257 0LC2 6219 39 -2 -1521 0 39 -1521 0OA8 356 40 -072 -576 0 40 -576 0
HUB 6065 42 -071 -626 0 42 -626 0OA6 1107 38 -072 -520 0 38 -520 0HUB 4033 41 -107 -899 0 41 -899 0HUB 8308 41 -099 -832 0 41 -832 0OA1 414 32 -175 -896 0 32 -896 0
HUB 6072 32 -129 -660 0 32 -660 0HUB 5723 28 -119 -466 0 28 -466 0HUB 8639 30 -088 -396 0 30 -396 0HUB 5622 29 -087 -366 0 29 -366 0LC1 1844 30 -182 -819 0 30 -819 0OA1 824 29 -166 -698 0 29 -698 0LC2 1052 28 -182 -713 0 28 -713 0HUB 8374 31 -142 -682 0 31 -682 0LC2 9998 33 -053 -289 0 33 -289 0HUB 8498 30 -076 -342 0 30 -342 0HUB 8214 30 -14 -630 0 30 -630 0OA4 8655 33 -149 -811 0 33 -811 0HUB 8635 27 -129 -470 0 27 -470 0HUB 1729 30 -072 -324 0 30 -324 0OA2 101D 27 -112 -408 -9 18 -175 234HUB 5815 30 -139 -625 0 30 -625 0OA6 955 21 -1 -220 0 21 -220 0
OA5 680D 21 -075 -165 5 26 -254 -88OA6 2033 14 -112 -110 0 14 -110 0HUB 771 13 -08 -68 0 13 -68 0
OA8 8223 11 -055 -33 0 11 -33 0
Figure 13 Schedule list with delay costs and optimal delay requested per flight (case study 2)
others) In addition it is assumed that the AUs that arenot LVUCs may participate in other UDPP features (egthrough Enhanced Slot Swapping FDRSFP or others) thusoptimising their costs and most likely compensating therelatively small impacts received from LVUCs that usedFCL
53 Case Study 3 LVUCs with up to 3 Flights in the Hotspot(Multiple Hotspot Optimisation) To illustrate the impact ofLVUCs optimising over the time (multiple hotspots) letus assume that OA3 and OA4 can reduce the delay oftheir flights because they made efforts in other hotspots(ie they increased the delay for some of their flightsthus reducing the delay to flights of other AUs) In thepaper of S Ruiz et al [11] the reader can find examples of
how the UDOM can be adapted to optimise the costs ofoperations by managing delay over the time across multiplehotspots
For the purpose of this case study let us assume that inthe same situation as shown in previous case study 2 theLVUCsOA3 andOA4want to reduce the delay of their flightsin 18 minutes each (six sequence positions in this hotspotscenario) It is assumed that proportional efforts were doneby suchAUs in the past in order to have the right for reducingtheir delay in this occasion
Figure 15 shows the new sequence situation after theimplementation of all the LVUCs requests It can be notedthat in this case a maximum delay impact of 6 minutes hasbeen found in some flights (the flight of OA3 and the flightOA5 108 overcome the same three flights thus generating an
14 Journal of Advanced Transportation
Flights ETA CTA FPFS Baseline delay UCTA FCL Delay UDPP Diff DelaysOA3 5896D 1216 1215 0 1215 0 0HUB 8384 1216 1218 2 1218 2 0Empty 1221 1221 0 1221 0 0LC2 2213 1226 1224 0 1224 0 0Empty 1227 1227 0 1227 0 0HUB 9757 1231 1230 0 1230 0 0LC1 311 1231 1233 2 1233 2 0HUB 6068 1236 1236 0 1236 0 0HUB 5701 1236 1239 0 1239 0 0HUB 6612 1236 1242 6 1242 6 0HUB 5229 1238 1245 7 1245 7 0LC2 6426 1241 1248 7 1248 7 0HUB 1988 1246 1251 5 1251 5 0HUB 4325 1251 1257 6 1254 3 3LC1 2612 1251 1300 9 1257 6 3OA2 320D 1249 1254 5 1300 11 -6HUB 3422 1256 1303 7 1303 7 0HUB 8106 1256 1306 10 1306 10 0HUB 9359 1302 1309 7 1309 7 0HUB 9293 1303 1312 9 1312 9 0OA8 6731 1305 1315 10 1315 10 0HUB 5126 1306 1321 15 1318 12 3LC1 4740 1306 1324 18 1321 15 3HUB 9649 1307 1327 20 1324 17 3OA1 5626 1316 1330 14 1327 11 3HUB 9173 1317 1333 16 1330 13 3HUB 9423 1318 1336 18 1333 15 3HUB 5366 1319 1339 20 1336 17 3OA5 727D 1306 1318 12 1339 33 -21HUB 4009 1319 1342 23 1342 23 0HUB 8488 1321 1345 24 1345 24 0HUB 4025 1322 1348 26 1348 26 0HUB 1723 1326 1351 25 1351 25 0HUB 5084 1327 1354 27 1354 27 0HUB 4624 1328 1357 29 1357 29 0HUB 1654 1328 1400 32 1400 32 0OA8 4205 1333 1403 30 1403 30 0HUB 9873 1334 1406 32 1406 32 0HUB 3784 1338 1409 31 1409 31 0LC2 2413 1339 1412 33 1412 33 0HUB 5912 1346 1415 29 1415 29 0LC1 1592 1346 1418 32 1418 32 0HUB 1746 1346 1421 35 1421 35 0LC2 2315 1346 1424 38 1424 38 0LC1 6825 1347 1427 40 1427 40 0HUB 6434 1347 1430 43 1430 43 0OA1 318 1347 1433 46 1433 46 0HUB 4321 1348 1436 48 1436 48 0HUB 761 1348 1439 51 1439 51 0
HUB 6242 1351 1442 51 1442 51 0HUB 8150 1351 1445 54 1445 54 0LC2 2119 1354 1448 54 1448 54 0HUB 591 1355 1451 56 1451 56 0HUB 5618 1400 1454 54 1454 54 0LC2 8387 1402 1457 55 1457 55 0OA5 108 1426 1527 61 1500 34 27OA8 8611 1404 1500 56 1503 59 -3LC2 5206 1404 1503 59 1506 62 -3LC1 7103 1406 1506 60 1509 63 -3OA3 2151 1410 1509 59 1512 62 -3OA8 8667 1411 1512 61 1515 64 -3LC1 1105 1416 1515 59 1518 62 -3HUB 3749 1424 1518 54 1521 57 -3LC2 2373 1424 1521 57 1524 60 -3LC2 532 1426 1524 58 1527 61 -3OA1 192 1436 1530 54 1530 54 0OA1 1714 1441 1533 52 1533 52 0OA6 7277 1456 1536 40 1536 40 0HUB 3535 1456 1539 43 1539 43 0HUB 8114 1506 1542 36 1542 36 0LC2 6219 1506 1545 39 1545 39 0OA8 356 1508 1548 40 1548 40 0HUB 6065 1509 1551 42 1551 42 0OA6 1107 1516 1554 38 1554 38 0HUB 4033 1516 1557 41 1557 41 0HUB 8308 1519 1600 41 1600 41 0OA1 414 1531 1603 32 1603 32 0HUB 6072 1534 1606 32 1606 32 0HUB 5723 1541 1609 28 1609 28 0HUB 8639 1542 1612 30 1612 30 0HUB 5622 1546 1615 29 1615 29 0LC1 1844 1548 1618 30 1618 30 0OA1 824 1552 1621 29 1621 29 0LC2 1052 1556 1624 28 1624 28 0HUB 8374 1556 1627 31 1627 31 0LC2 9998 1557 1630 33 1630 33 0HUB 8498 1603 1633 30 1633 30 0HUB 8214 1606 1636 30 1636 30 0OA4 8655 1606 1639 33 1639 33 0OA2 101D 1621 1648 27 1642 21 6HUB 8635 1615 1642 27 1645 30 -3HUB 1729 1615 1645 30 1648 33 -3HUB 5815 1621 1651 30 1651 30 0OA6 955 1633 1654 21 1654 21 0OA6 2033 1646 1700 14 1657 11 3HUB 771 1648 1701 13 1700 12 1OA5 680D 1636 1657 21 1701 25 -4OA8 8223 1651 1702 11 1702 11 0
Figure 14 Impact of LVUC decision-making on the sequence and on the delay of flights (case study 2)
Table 6 Effect of sequence compression on the distribution of delay (case study 2)
AU name Total flights Baseline delay Assigned delay Difference VariationHUB 52 1385 1375 10 072LC1 8 250 250 0 000LC2 12 461 470 -9 -195OA1 6 227 224 3 132OA2 2 32 32 0 0OA3 2 59 62 -3 -508OA4 1 33 33 0 0OA5 3 94 92 2 213OA6 4 113 110 3 265OA7 0 0 0 0 000OA8 6 208 214 -6 -288
96 2862 2862 0
impact of two sequence positions ie 6 minutes for someflights)
Tables 8 and 9 show similar figures as in case study 2for delay and cost impacts After consultation in an expertpanel workshop (which included AUs representatives) it wasconcluded the impact on delay caused by LVUCs using FCLcould again be considered negligible whereas the impact to
other in terms of costs is not conclusive due to the simpli-fications done in the cost curves of flights OA2 and OA5could optimise their costs in the same order of magnitude ascalculated by UDOM The figures shown for OA3 and OA4are not taking into account the cost of the efforts done in thepast hotspots to have flexibility in the studied hotspot It isexpected however that they should be able to reduce their
Journal of Advanced Transportation 15
Flights ETA CTA FPFS Baseline delay UCTA FCL Delay UDPP Diff DelaysOA3 5896D 1216 1215 0 1215 0 0HUB 8384 1216 1218 2 1218 2 0Empty 1221 1221 0 1221 0 0LC2 2213 1226 1224 0 1224 0 0Empty 1227 1227 0 1227 0 0HUB 9757 1231 1230 0 1230 0 0LC1 311 1231 1233 2 1233 2 0HUB 6068 1236 1236 0 1236 0 0HUB 5701 1236 1239 0 1239 0 0HUB 6612 1236 1242 6 1242 6 0HUB 5229 1238 1245 7 1245 7 0LC2 6426 1241 1248 7 1248 7 0HUB 1988 1246 1251 5 1251 5 0HUB 4325 1251 1257 6 1254 3 3LC1 2612 1251 1300 9 1257 6 3OA2 320D 1249 1254 5 1300 11 -6HUB 3422 1256 1303 7 1303 7 0HUB 8106 1256 1306 10 1306 10 0HUB 9359 1302 1309 7 1309 7 0HUB 9293 1303 1312 9 1312 9 0OA8 6731 1305 1315 10 1315 10 0HUB 5126 1306 1321 15 1318 12 3LC1 4740 1306 1324 18 1321 15 3HUB 9649 1307 1327 20 1324 17 3OA1 5626 1316 1330 14 1327 11 3HUB 9173 1317 1333 16 1330 13 3HUB 9423 1318 1336 18 1333 15 3HUB 5366 1319 1339 20 1336 17 3OA5 727D 1306 1318 12 1339 33 -21HUB 4009 1319 1342 23 1342 23 0HUB 8488 1321 1345 24 1345 24 0HUB 4025 1322 1348 26 1348 26 0HUB 1723 1326 1351 25 1351 25 0HUB 5084 1327 1354 27 1354 27 0HUB 4624 1328 1357 29 1357 29 0HUB 1654 1328 1400 32 1400 32 0OA8 4205 1333 1403 30 1403 30 0HUB 9873 1334 1406 32 1406 32 0HUB 3784 1338 1409 31 1409 31 0LC2 2413 1339 1412 33 1412 33 0HUB 5912 1346 1415 29 1415 29 0LC1 1592 1346 1418 32 1418 32 0HUB 1746 1346 1421 35 1421 35 0LC2 2315 1346 1424 38 1424 38 0LC1 6825 1347 1427 40 1427 40 0HUB 6434 1347 1430 43 1430 43 0OA1 318 1347 1433 46 1433 46 0HUB 4321 1348 1436 48 1436 48 0HUB 761 1348 1439 51 1439 51 0
HUB 6242 1351 1442 51 1442 51 0HUB 8150 1351 1445 54 1445 54 0LC2 2119 1354 1448 54 1448 54 0HUB 591 1355 1451 56 1451 56 0OA3 2151 1410 1509 59 1454 44 15HUB 5618 1400 1454 54 1457 57 -3LC2 8387 1402 1457 55 1500 58 -3OA5 108 1426 1527 61 1503 37 24OA8 8611 1404 1500 56 1506 62 -6LC2 5206 1404 1503 59 1509 65 -6LC1 7103 1406 1506 60 1512 66 -6OA8 8667 1411 1512 61 1515 64 -3LC1 1105 1416 1515 59 1518 62 -3HUB 3749 1424 1518 54 1521 57 -3LC2 2373 1424 1521 57 1524 60 -3LC2 532 1426 1524 58 1527 61 -3OA1 192 1436 1530 54 1530 54 0OA1 1714 1441 1533 52 1533 52 0OA6 7277 1456 1536 40 1536 40 0HUB 3535 1456 1539 43 1539 43 0HUB 8114 1506 1542 36 1542 36 0LC2 6219 1506 1545 39 1545 39 0OA8 356 1508 1548 40 1548 40 0HUB 6065 1509 1551 42 1551 42 0OA6 1107 1516 1554 38 1554 38 0HUB 4033 1516 1557 41 1557 41 0HUB 8308 1519 1600 41 1600 41 0OA1 414 1531 1603 32 1603 32 0HUB 6072 1534 1606 32 1606 32 0HUB 5723 1541 1609 28 1609 28 0HUB 8639 1542 1612 30 1612 30 0HUB 5622 1546 1615 29 1615 29 0LC1 1844 1548 1618 30 1618 30 0OA4 8655 1606 1639 33 1621 15 18OA1 824 1552 1621 29 1624 32 -3LC2 1052 1556 1624 28 1627 31 -3HUB 8374 1556 1627 31 1630 34 -3LC2 9998 1557 1630 33 1633 36 -3HUB 8498 1603 1633 30 1636 33 -3HUB 8214 1606 1636 30 1639 33 -3OA2 101D 1621 1648 27 1642 21 6HUB 8635 1615 1642 27 1645 30 -3HUB 1729 1615 1645 30 1648 33 -3HUB 5815 1621 1651 30 1651 30 0OA6 955 1633 1654 21 1654 21 0OA6 2033 1646 1700 14 1657 11 3HUB 771 1648 1701 13 1700 12 1OA5 680D 1636 1657 21 1701 25 -4OA8 8223 1651 1702 11 1702 11 0
Figure 15 Impact of LVUC decision-making on the sequence and on the delay of flights (case study 3)
Table 7 Effect of sequence compression on the AUs actual costs (case study 2)
AU name Baselinecost
Optimalcost
Diff(optim - base)
Reduc(optim - base) Actual cost Diff
(actual - base) Reduc
(actual - base)HUB -29283 -29283 0 000 -29438 -155 -053LC1 -4735 -4735 0 000 -4924 -189 -399LC2 -12471 -12471 0 000 -13072 -601 -482OA1 -7178 -7178 0 000 -7140 38 053OA2 -425 -317 109 2561 -330 95 2234OA3 -1131 -1131 0 000 -1249 -118 -1043OA4 -811 -811 0 000 -811 0 000OA5 -2632 -1679 953 3621 -1622 1010 3838OA6 -1658 -1658 0 000 -1616 42 253OA7OA8 -4691 -4691 0 000 -5033 -342 -729
totalmdashover the timemdashcosts in the same order of magnitudeas OA2 and OA5
6 Discussion of the Simulation Results
With the current FCL rules and due to the complex inter-actions and emergent dynamics between the different AUs
prioritisations it cannot be guaranteed that the resulting FCLsequence will have a positive or neutral impact on the AUscosts In the light of the results (see case study 1) it seemsquite unlikely that all the AUs can use FCL in its currentform Further research needs to be done to investigate newstrategies and rules that will allow to develop solutions withpositive cost reduction for all the AUsThe FCL feature seems
16 Journal of Advanced Transportation
Table 8 Effect of sequence compression on the distribution of delay (case study 3)
AU name Total flights Baseline delay Assigned delay Difference VariationHUB 52 1385 1387 -2 -014LC1 8 250 253 -3 -120LC2 12 461 482 -21 -456OA1 6 227 227 0 000OA2 2 32 32 0 0OA3 2 59 44 15 2542OA4 1 33 15 18 5455OA5 3 94 95 -1 -106OA6 4 113 110 3 265OA7 0 0 0 0 000OA8 6 208 217 -9 -433
96 2862 2862 0
Table 9 Effect of sequence compression on the AUs actual costs (case study 3)
AU name Baselinecost
Optimalcost
Diff(optim -base)
Reduc(optim -base)
Actual costDiff(actual -base)
Reduc(actual -base)
HUB -29283 -29283 0 000 -29890 -607 -207LC1 -4735 -4735 0 000 -5033 -297 -627LC2 -12471 -12471 0 000 -13674 -1203 -965OA1 -7178 -7178 0 000 -7292 -114 -159OA2 -425 -317 109 2561 -330 95 2234OA3 -1131 -1131 0 000 -629 502 4438OA4 -811 -811 0 000 -168 644 7934OA5 -2632 -1679 953 3621 -1758 874 3320OA6 -1658 -1658 0 000 -1616 42 253OA7OA8 -4691 -4691 0 000 -5204 -513 -1093
to be a good mechanism to give access for LVUCs with 3flights or less In addition it deserves special mention thatfor those LVUCs with only 1 flight the FCL mechanism wasable to give access to UDPP (ie flexibility) through multiplehotspots thus guaranteeing access and equity of UDPP
For a reduced number of LVUCs using the FCL theexpected impact to other AUs can in general be considerednegligible (to be further confirmed with operational expertsafter the analysis of many more cases) while the benefitsfor the LVUCs using FCL may be notably large In additionit can be assumed that themdashnegligiblemdashimpact that LVUCsin a hotspot could generate to other non-LVUCs flightscould be easily compensated by the important cost reductionsthat such non-LVUCs could achieve through access to otherUDPP features (eg Enhanced Slot Swapping) In additionaccording to the results of the statistical analysis (Figure 3)most of theAUs are LVUCs quite often in 85 of the hotspotsthat affect their flights therefore the AUs that are not LVUCsin a specific hotspot scenario could potentially be benefitedfrom the FCLs feature in other hotspots in which they mightbe LVUCs
The hotspot scenario used in the simulated case studiesis quite typical in terms of duration severity and number
of AUs and LVUCs affected therefore it is expected that acertain degree of extrapolation of the results to other hotspotsituations is possible
Finally the case studies considered that LVUCs are theAUs with amaximum number of flights caught in the hotspotequal to three Such definition of LVUC was preliminaryagreed through discussion with a panel of AUs and oper-ational experts However in the light of this early resultsa sensitivity analysis should be conducted with multiplerealistic scenarios in different conditions and with differentAUs involved to determine which should be the number offlights that could use FCL in each hotspot while preservingequity over time
7 Conclusions and Future Work
The FCL mechanism has shown good properties to giveeffective access for LVUCs to UDPP In particular it has beenfound that (a) a LVUC can find for each of his flights theoptimal amount of delay minutes that should be increased ordecreased in order to minimise his total costs (b) a LVUCcan obtain delay credits by accepting extra delay (amountof extra delay controlleddecided by the LVUC) and use the
Journal of Advanced Transportation 17
d (delay)
Utility
d (delay)
Utility
Continuous model(simplification)
U(d) =
2d2 + U0
foralld ge 0 U0 gt 0 lt 0
5050
Ursquo0 Ursquo0
Different U0 and to model different carriers
Figure 16 Approximation of the utility function as a continuous quadratic function
credits in the same hotspot (if the LVUC has more than oneflight) or save the credits and use them in future hotspots (ieLVUCs are able to optimise their operations over the time)and (c) the FCL rules are simple and the level of coordinationrequired is very efficient so the LVUCs and the rest of theAUs can concentrate on optimising their own operations
FCL cannot be usedmdashin its current form of baseline rulesand principlesmdashby AUs in a hotspot that are not LVUCsdue to the likeliness of emerging inequities However earlyevidence showed that equity could be preserved over the timeif the number of flights being prioritised with FCL and themaximum negative impact allowed to other flights is limitedat each hotspot The precise definition of these parameters tocontrol the trade-off between flexibility and equity requiresfurther research Three flights could be recommended as astarting point to determine whether an AU is an LVUC ina hotspot while six minutes of additional negative impact atsome flights could be considered in principle negligible by theAUs
For the flights that are not allowed to use FCL in a hotspotthe AUs could use the other UDPP features based on slotswapping since such mechanisms can guarantee full equityover the time (ldquoequityrdquo understood as nodirect negative delayimpact to others) and may likely provide enough flexibilityto the AUs when they are not LVUCs Nevertheless all theAUs are often LVUCsmdasheven the largest airlinesmdashin manyregulations that occur every day Therefore the possibility toinclude all the AUsmdashirrespective of the number of flightsoperated per daymdashusing FCL when they are LVUCs in ahotspot is recommended since it may contribute to reducethe cost for all theAUs and possibly increase the predictabilityand robustness of fleet schedules (eg for a hub carriera single flight delayed in a remotenon-hub airport couldhave a knock-on impact on the hub connections and causedisruption on the full-dayrsquos operations) Further research isneeded to determine whether special rules may apply for AUsthat are always LVUCs eg Business Aviation
Further research and validation is required to determinethe exact number of flights that could use FCL in any hotspotwithout jeopardising equity over the time and to bring theFCL concept towards higher levels of maturity
Appendix
A User Delay Optimisation Model (UDOM)
A1 Definitions and Assumptions One of the main assump-tions in UDOM is that the AUs taking part in the system canbe modelled as utility maximising ie the major objective ofeach AU is to maximise its utility function Therefore AUsare assumed to have a utility function which is dependingon several variables such as the delay cost structure of eachflight
Utility is an important concept in economics and gametheory because it represents satisfaction experienced by theconsumer of a good (seeH Varian [28]) In the context of thisdocument the concept of ldquoutilityrdquo will be understood as thevalue perceived by a particular AU if a given slot is allocatedto a particular flight operated Without loss of generality inthis document it is assumed that utility is directly relatedto economic profits obtained by the AUs for operating theirflights however the concept of utility may also include anytype of operational constraints knownby the flight dispatcherand any indirect economic or non-economic type of benefitsor costs
Table 10 describes all the mathematical symbols that willbe used in the model formulation
A2 Mathematical Representation of the Utility or DelayCost Functions for Flights A utility function for a singleflight U(t) can be represented analytically as a continuousquadratic function as it can be observed in Figure 16 Ifnegative delay is not considered (simplification) the utility asa function of the delay d assigned to a flight can be expressedas
119880 (119889) = 12057621198892 + 1198800 forall119889 ge 0
12059710158401198801205971015840119889 = 120583119889 = 120576119889 le 01205971015840101584011988012059710158401015840119889 = 120576 lt 0
(A1)
18 Journal of Advanced Transportation
Table 10 Description of model parameters and variables
Symbol Range Descriptiond [0 +infin) Delay of a flight (d0 means d=0)1198800 [0 +infin) Max utility of a flight when its d=0
N [0 +infin) Number of flights operated by an AU in the referenceperiod
120576119894 (minusinfin +infin)Elasticity of the utility function of flight i Used tomodel in a simplified way (continuous model) differentoperational flight margins
120588119894 [0 1] Probability of a flight i for being affecteddelayed by ahotspot
120575119894 [0 +infin) Average delay expected for flight i in the route operated(ie typical delay from hotspots on that route)
119889119894 [0 +infin) Baseline (random) delay for flight i120591119894 (minusinfin +infin) Delay shift to increase or reduce the delay of flight i119889lowast119894 [0 +infin) Optimal delay for flight i in the actual hotspot
1198891015840119894 (minusinfin +infin) Shifted delay ie delay difference between the optimaldelay and the baseline delay for flight i
where 120576 is the elasticity of the utility function 120583119889 the marginalutility and 1198800 the maximum utility in case of no delayallocated to that flight It is assumed for the sake of simplicitythat every single flight has a maximum utility when thedelay d is zero at a certain slot and the utility is thenprogressively decreasing as far as the delay is increasingSince the elasticity is negative any delay incurred by aflight will cause a reduction on the utility perceived bythe AU for this flight Utility will be negative if the costof delay has become greater than the maximum economicvalue expected for that flight if operated on time Differentrevenue and cost structures can be modelled by changing theparameters thus they can be adapted to different types ofAUsrsquo type of activity (low cost HUB business aviation orothers)
In reality utility functions are unknown and may be non-linear and nonconvex (the cost functions as well) Howeverin this document it is assumed for the sake of simplicity thatevery single flight has a maximum utility when the delay dis zero at a certain slot and the utility is then progressivelydecreasing as far as the delay is increasing Utility will benegative if the cost of delay has become greater than themaximum economic value expected for that flight if operatedon time
A3 UDOM for N Flights and Multiple Hotspots The useddelay optimisation model can be expressed for N flights ofthe same AU each of those flights characterised by a differentelasticity 120576119894 and affected by delays with different probabilities120588119894 and with a particular and different expected delay 120575119894 foreach of them
max1205911 120591119873
119880 =119873
sum119894=1
119880119894 (1198890) (1 minus 120588119894) +119873
sum119894=1
119880119894 (120575119894 + 120591119894) (120588119894)
st119873
sum119894=1
120591119894 = 0(A2)
After some mathematical development (eg using multipli-ers of Lagrange) the optimal delay shift for each flight i canbe expressed by
120591lowast119894 =sum119873119895=1 120575119895
sum119873119895=1 (120576119894120588119894120576119895120588119895)minus 120575119894 (A3)
Further explanations about how this equation has been devel-oped can be found in Section A4 where the UDOM modelwill be extended with inequality constraints to consider theduration of the hotspot
Figure 17 illustrates an example in which an LVUC has 3flights F1 F2 and F3 each one with amaximum utility of 500monetary units if theywere not delayedThe three flights havebeen originally allocated to some ATFCM slots that generateto them 5 12 and 20 minutes of delay respectively Eachof the flights has different cost structure and thus differentsensitivityelasticity to delay ie 1205761198911 = minus2 1205761198912 = minus10 and1205761198913 = minus9 The baseline delay utility can be calculated as
119880119861119863 = 1198801198911 (5) + 1198801198911 (12) + 1198801198911 (20)= 474 minus 220 minus 1300 = minus1045 (A4)
After computing the optimal delay allocation with UDOMthe LVUC would request a slot with 21 minutes of extra delayfor flight F1 and a delay reduction of 7 and 14 minutes forflights F2 and F3 respectively Note that the total delay forthe LVUC is the same The optimised utility is
119880lowast119880119863 = 1198801198911 (5 + 21) + 1198801198911 (12 minus 7) + 1198801198911 (20 minus 14)= minus176 + 375 + 338 = +537 (A5)
illustrating the change in utility for the AU and comparingthemaximumutility affordable (no delay) Figure 18 expectedutility if the baseline FPFS sequence is applied and theoptimised sequence if the LVUC is allowed to use FCL
Journal of Advanced Transportation 19
d (delay)
d (delay)
d (delay)
F1 Utility
F2 Utility
F3 Utility
d (delay)
d (delay)
d (delay)
F1 Utility
F2 Utility
F3 Utility
D1 = 5rsquo
D2 = 12rsquo
D3 = 20rsquo
D1 = 5rsquo
D2 = 12rsquo
D3 = 20rsquo
D1 = 26rsquo
D2 = 5rsquo
D3 = 11rsquo
Sum of all delay shis equals zero
Optimised sequence
Optimised sequence
Optimised sequence
U0 = 500
U0 = 500
U0 = 500
U0 = 500
U0 = 500
U0 = 500
f1 = minus2
f2 = minus10
f3 = minus9
f1 = minus2
f2 = minus10
f3 = minus9
lowastf1 asymp 21
lowastf2 asymp minus7
lowastf3 asymp minus14
1 (hotspot is actually happening) =
rArr actual delay is used instead of average historic delay
Figure 17 Example of optimal delay redistribution using UDOM
t
Optimized expected utility (UDPP)
Maximum affordable utility (no delay)
Expected utility (FPFS)
1500
minus1045
537
0+ΔU
534
Figure 18 Change in utility after optimisation
A4 Implementation Aspects and Generalisation of UDOMwith Inequality Constraints (KKT Conditions) The methodof Lagrange multipliers allows solving convex optimisationproblems subject to equality constraints as presented in(A3) However for implementing and running simulationswith realistic hotspot scenarios some extra inequality con-straints are needed in particular the hotspot time-windowboundaries If these constraints are not included in themodelin some cases the AUs with flights close to the boundariesof the hotspot could request after optimising their delaywith UDOM slots that were beyond these boundariesthus leading to nonfeasible results in practice In order toincorporate the hotspot boundary constraints a new set ofinequality constraints is needed
The mathematical model to optimise becomes
max120591119894
119891 (120591) =119873
sum119894
119880119894 (120575119894 + 120591119894) 120588119894
119904119905 119892 (120591) =119873
sum119894
120591119894 = 0
h1119894 (120591) minus 120591119894 le 119868119879119894h2119894 (120591) 120591119894 le 119865119879119894
(A6)
where 119880119894 is the utility function of flight i (119880(119889) = (1205762)1198892 +1198800) 120575119894 120591119894 and 120588119894 are respectively the delay allocated to flight ithe delay shift (variable of control) that the AU can decide tooptimise his costs and the probability of that flight for beingdelayed 119868119879119894 and 119865119879119894 are the new parameters with respectto the basic UDOM shown in the paper which are 119868119879119894 thedistance in time between the slot allocated to flight i andthe initial time of the hotspot and 119865119879119894 the distance in timebetween the slot allocated to flight i and the final time of thehotspot
The Karush-Kuhn-Tucker (KKT) conditions allow gen-eralising the method of Lagrange multipliers to includeinequality constraints Let a generic optimisation problem beexpressed as follows (vector form)
20 Journal of Advanced Transportation
max119909
119891 (119909)119904119905 119892 (119909) = 0
h (119909) le 0(A7)
Any optimal solution for the above problem must fulfil thefollowing four KKT conditions
(1) Stationarity
nabla119891 (119909) + 120582119892 (119909) + 120583ℎ (119909) = 0 (A8)
(2) Primal Feasibility
119892 (119909lowast) = 0h (119909lowast) le 0 (A9)
(3) Dual Feasibility
120582 ge 0 (A10)
(4) Complementary Slackness
120582119892 (119909lowast) = 0 (A11)
In practice the resolution of problems with KKT conditionsare often solved with recursive algorithms The fourth condi-tion forces the solution to be at the boundary of an inequalityconstraint when an optimal solution would be beyond suchboundary in case that such inequality constraint would notbe present in the problem
Taking the above into account the UDOM model canbe generalised with the KKT conditions by applying thefollowing recursive algorithm
(1) Let 120579 be the total excess delay of the AU out ofthe hotspot boundaries calculated as follows (notethe inequality constraints are incorporated in thecalculation of 120579)
120579 = sum119894
120579119894 forall120579119894 =
119868119879119894 minus 120591119894 if 120591119894 lt 119865119879119894120591119894 minus 119865119879119894 if 120591119894 gt 1198651198791198940 otherwise
(A12)
The recursive algorithmmust be initialised with 120579 = 0(assume no excess before the first trialiteration)
(2) Find the optimal solution for the general UDOM-KKT problem which can be expressed as
max120591119894
119891 (120591) =119873
sum119894
119880119894 (120575119894 + 120591119894) 120588119894
119904119905 119892 (120591) 119873
sum119894
120591119894 = 120579(A13)
(3) Calculate 120579 with (A11)(4) For any flight i with 120579119894 gt 0 (ie for each flight it
checks if the optimal solution found in previous stepsrequires slots that are out of the hotspot boundaries)do the following
(a) Set the solutionposition for flights with excessat the boundary (ie they will request the firstor the last slots in the hotspot)
(b) Remove these flights from the optimisationin the next iterations (they already have beenassigned a solution)
(5) Repeat steps (2) (3) and (4) until 120579 = 0 (120579 must bezero for any feasible solution)
Note that the Lagrange condition for optimality nabla119891(119909) =120582nabla119892(119909) applied to the general UDOM-KKT problem in(A12) generates the following system of equations (dualproblem)
[[[[[[[
1205761 (1205751 + 1205911) 1205881 minus 120582
120576119899 (120575119899 + 120591119899) 120588119899 minus 1205821205911 + + 120591119899 minus 120579
]]]]]]]
(A14)
Once the system of equations is solved the optimal delay perflight can be found
120591lowast119894 =sum119873119895 120575119895 + 120579
sum119873119895 (120576119894120588119894120576119895120588119895)minus 120575119894 (A15)
If 120579 = 0 in the first iteration (ie all the optimalrequestedslots are within the hotspot boundaries) the solution isexactly the same as in (A3) ie the normal UDOM (noUDOM-KKT) And if 120579 gt 0 the delay excess generatedby flights that have been assigned to the boundaries ofthe hotspot will be shared among the flights of the AUaccording to the relative importancecost structure of eachflight (indeed in the same proportion as the total delay isreallocated by the AU among his flights) Therefore once therecursive algorithm converges to 120579 = 0 the KKT conditionscan be satisfied meaning that an optimal solution for the AUhas been found
Data Availability
Theflight list data and cost parameterisations used to supportthe findings of this study are included within the article
Conflicts of Interest
The authors declare that they have no conflicts of interest
References
[1] EUROCONTROL ldquoATFCMUsers Manualrdquo Ed 221 2018
Journal of Advanced Transportation 21
[2] M O Ball C Chen R Hoffman and T Vossen ldquoCollaborativeDecision Making in Air Traffic Management Current andFuture Research Directionsrdquo in New Concepts and Methods inAir Traffic Management Transportation Analysis pp 17ndash30Springer Berlin Heidelberg Berlin Germany 2001
[3] FAA ldquoInterface control document for substitutions duringground delay programs ground stops and airspace flow pro-gramsrdquo Version 31 2007
[4] EUROCONTROL ldquoPerformance Review Report an assess-ment of air traffic management in Europe during the calendaryear 2017rdquo 2017
[5] Univerity of Westminster ldquoEuropean airline delay cost refer-ence values - updated and extended valuesrdquo Ed 41 2015
[6] D Xiaoxu H Minghua W Tian and H Liu ldquoModeling con-gestion propagation in multistage schedule within an airportnetworkrdquo Journal of Advanced Transportation vol 2018 ArticleID 6814348 11 pages 2018
[7] IATA ECONOMICS ldquoProfitability and the air transport valuechainrdquo IATA ECONOMICS N∘10 2013
[8] IATA ECONOMICS ldquoAnnual review 2018rdquo 2018[9] ldquoSESAR P070604 UDPP Step 2 V1 OSED Partners EURO-
CONTROL AA AF-Group DLH-Group EBAA ELFAAIAOPA SAS IATArdquo 2013
[10] N Pilon S Ruiz A Bujor A Cook and L Castelli ImprovedFlexibility and Equity for Airspace Users during Demand-Capacity Imbalance - An Introduction to The User-Driven Pri-oritisation Process Sixth SESAR InnovationDays DelftNether-lands 2016
[11] S Ruiz L Guichard and N Pilon Optimal Delay Allocationunder High Flexibility Conditions during Demand-CapacityImbalance SESAR Innovation Days 2017
[12] T Vossen and M Ball ldquoOptimisation and mediated barteringmodels for ground delay programsrdquo Naval Research Logisticsvol 53 no 1 pp 75ndash90 2006
[13] L Castelli R Pesenti and A Ranieri ldquoThe design of a marketmechanism to allocate air traffic flow management slotsrdquoTransportation Research Part C Emerging Technologies vol 19no 5 pp 931ndash943 2011
[14] N Schefers J J Ramos Gonzalez P Folch and J LMunoz-Gamarra ldquoA constraint programming model with timeuncertainty for cooperative flight departuresrdquo TransportationResearch Part C Emerging Technologies vol 96 pp 170ndash1912018
[15] R Jovanovic O Babic V Toic and V Tosic ldquoPricing to recon-cile predictability efficiency and equity in ATMrdquo in Proceedingsof the 11th USAEurope ATM RampD Seminar vol 2015 Lisbon
[16] A Harada T Ezaki T Wakayama and K Oka ldquoAir traffic effi-ciency analysis of airliner scheduled flights using collaborativeactions for renovation of air traffic systems open datardquo Journalof Advanced Transportation vol 2018 Article ID 2734763 14pages 2018
[17] T Kistan A Gardi R Sabatini S Ramasamy and E Batuwan-gala ldquoAn evolutionary outlook of air traffic flow managementtechniquesrdquo Progress in Aerospace Sciences vol 88 pp 15ndash422017
[18] A R Odoni L Bianco and G Szego ldquoThe flow managementproblem in air traffic controlrdquo in Flow Control of CongestedNetworks Springer Berlin Germany 1987
[19] M Ball G Donohue and K Hoffman ldquoAuctions for the safeefficient and equitable allocation of airspace system resourcesrdquoin Combinatorial Auctions P Cramton Y Shoham and RSteinberg Eds pp 507ndash538 MIT Press Cambridge 2005
[20] R H CoaseThe Problem of Social Cost 1960[21] N Ivanov F Netjasov R Jovanovic S Starita and A Strauss
ldquoAir Traffic Flow Management slot allocation to minimizepropagated delay and improve airport slot adherencerdquo Trans-portation Research Part A Policy and Practice vol 95 pp 183ndash197 2017
[22] ldquoCrown Consluting Inc (for NextGen) Flight Priority DeepDive Final Reportrdquo 2011
[23] V Krishna AuctionTheory Academic Press 2nd edition 2009[24] R Gibbons Game Theory for Applied Economists Princeton
University Press Princeton NJ USA 1992[25] S J Rassenti V L Smith and R L Bulfin ldquoA Combinatorial
Auction Mechanism for Airport Time Slot Allocationrdquo RANDJournal of Economics vol 13 no 2 p 402 1982
[26] G Stojkovic F Soumis J Desrosiers and M M Solomon ldquoAnoptimization model for a real-time flight scheduling problemrdquoTransportation Research Part A Policy and Practice vol 36 no9 pp 779ndash788 2002
[27] R L Hoffman Integer Programming Models for Ground- Hold-ing in Air Traffic FlowManagement Department ISR 1997
[28] H Varian Intermediate Microeconomics A Modern ApproachW W Norton amp Company 2009
International Journal of
AerospaceEngineeringHindawiwwwhindawicom Volume 2018
RoboticsJournal of
Hindawiwwwhindawicom Volume 2018
Hindawiwwwhindawicom Volume 2018
Active and Passive Electronic Components
VLSI Design
Hindawiwwwhindawicom Volume 2018
Hindawiwwwhindawicom Volume 2018
Shock and Vibration
Hindawiwwwhindawicom Volume 2018
Civil EngineeringAdvances in
Acoustics and VibrationAdvances in
Hindawiwwwhindawicom Volume 2018
Hindawiwwwhindawicom Volume 2018
Electrical and Computer Engineering
Journal of
Advances inOptoElectronics
Hindawiwwwhindawicom
Volume 2018
Hindawi Publishing Corporation httpwwwhindawicom Volume 2013Hindawiwwwhindawicom
The Scientific World Journal
Volume 2018
Control Scienceand Engineering
Journal of
Hindawiwwwhindawicom Volume 2018
Hindawiwwwhindawicom
Journal ofEngineeringVolume 2018
SensorsJournal of
Hindawiwwwhindawicom Volume 2018
International Journal of
RotatingMachinery
Hindawiwwwhindawicom Volume 2018
Modelling ampSimulationin EngineeringHindawiwwwhindawicom Volume 2018
Hindawiwwwhindawicom Volume 2018
Chemical EngineeringInternational Journal of Antennas and
Propagation
International Journal of
Hindawiwwwhindawicom Volume 2018
Hindawiwwwhindawicom Volume 2018
Navigation and Observation
International Journal of
Hindawi
wwwhindawicom Volume 2018
Advances in
Multimedia
Submit your manuscripts atwwwhindawicom
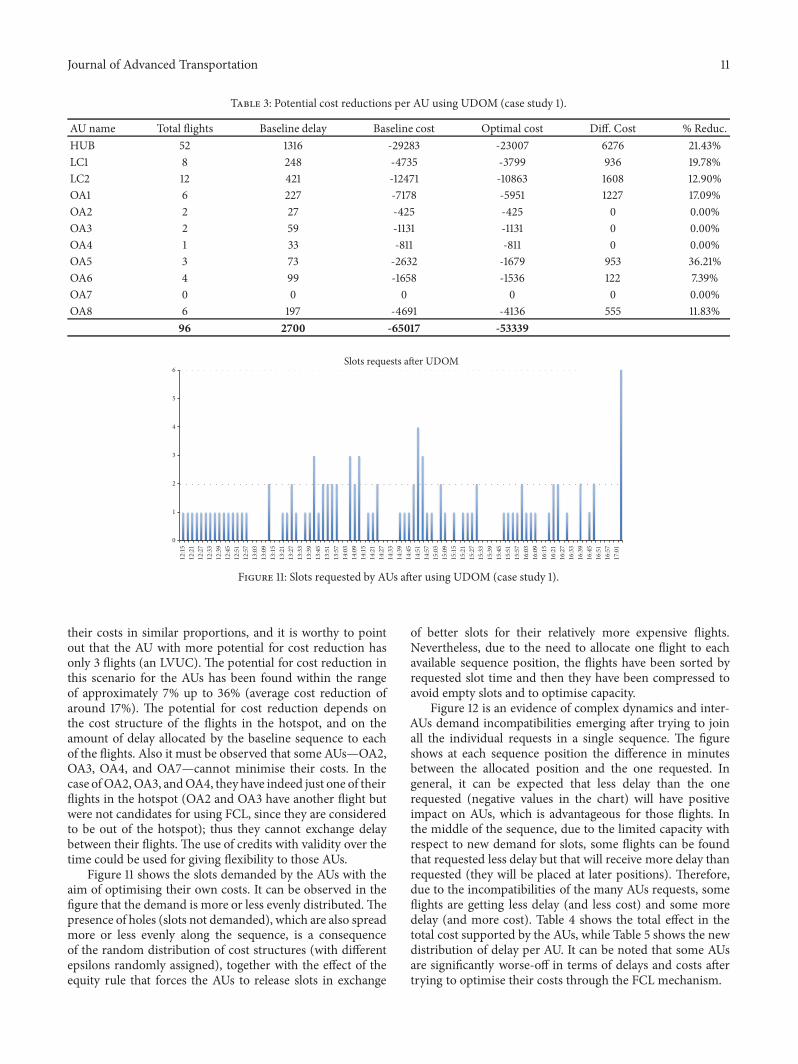

International Journal of
AerospaceEngineeringHindawiwwwhindawicom Volume 2018
RoboticsJournal of
Hindawiwwwhindawicom Volume 2018
Hindawiwwwhindawicom Volume 2018
Active and Passive Electronic Components
VLSI Design
Hindawiwwwhindawicom Volume 2018
Hindawiwwwhindawicom Volume 2018
Shock and Vibration
Hindawiwwwhindawicom Volume 2018
Civil EngineeringAdvances in
Acoustics and VibrationAdvances in
Hindawiwwwhindawicom Volume 2018
Hindawiwwwhindawicom Volume 2018
Electrical and Computer Engineering
Journal of
Advances inOptoElectronics
Hindawiwwwhindawicom
Volume 2018
Hindawi Publishing Corporation httpwwwhindawicom Volume 2013Hindawiwwwhindawicom
The Scientific World Journal
Volume 2018
Control Scienceand Engineering
Journal of
Hindawiwwwhindawicom Volume 2018
Hindawiwwwhindawicom
Journal ofEngineeringVolume 2018
SensorsJournal of
Hindawiwwwhindawicom Volume 2018
International Journal of
RotatingMachinery
Hindawiwwwhindawicom Volume 2018
Modelling ampSimulationin EngineeringHindawiwwwhindawicom Volume 2018
Hindawiwwwhindawicom Volume 2018
Chemical EngineeringInternational Journal of Antennas and
Propagation
International Journal of
Hindawiwwwhindawicom Volume 2018
Hindawiwwwhindawicom Volume 2018
Navigation and Observation
International Journal of
Hindawi
wwwhindawicom Volume 2018
Advances in
Multimedia
Submit your manuscripts atwwwhindawicom