9M2014 FINANCIAL RESULTS
16
9M2014 RESULTS PRESENTATION 9 December, 2014
-
Upload
mechel- -
Category
Economy & Finance
-
view
4.620 -
download
0
Transcript of 9M2014 FINANCIAL RESULTS
9M2014 RESULTS PRESENTATION 9 December, 2014
DISCLAIMER
This presentation does not constitute or form part of and should not be construed as,
an offer to sell or issue or the solicitation of an offer to buy or acquire securities of
Mechel OAO (Mechel) or any of its subsidiaries in any jurisdiction or an inducement to
enter into investment activity. No part of this presentation, nor the fact of its
distribution, should form the basis of, or be relied on in connection with, any contract
or commitment or investment decision whatsoever. Any purchase of securities should
be made solely on the basis of information Mechel files from time to time with the U.S.
Securities and Exchange Commission. No representation, warranty or undertaking,
express or implied, is made as to, and no reliance should be placed on, the fairness,
accuracy, completeness or correctness of the information or the opinions contained
herein. None of the Mechel or any of its affiliates, advisors or representatives shall
have any liability whatsoever (in negligence or otherwise) for any loss howsoever
arising from any use of this presentation or its contents or otherwise arising in
connection with the presentation.
This presentation may contain projections or other forward-looking statements
regarding future events or the future financial performance of Mechel, as defined in
the safe harbor provisions of the U.S. Private Securities Litigation Reform Act of 1995.
We wish to caution you that these statements are only predictions and that actual
events or results may differ materially. We do not intend to update these statements.
We refer you to the documents Mechel files from time to time with the U.S. Securities
and Exchange Commission, including our Form 20-F. These documents contain and
identify important factors, including those contained in the section captioned “Risk
Factors” and “Cautionary Note Regarding Forward-Looking Statements” in our Form
20-F, that could cause the actual results to differ materially from those contained in
our projections or forward-looking statements, including, among others, the
achievement of anticipated levels of profitability, growth, cost and synergy of our
recent acquisitions, the impact of competitive pricing, the ability to obtain necessary
regulatory approvals and licenses, the impact of developments in the Russian
economic, political and legal environment, volatility in stock markets or in the price of
our shares or ADRs, financial risk management and the impact of general business
and global economic conditions.
The information and opinions contained in this document are provided as at the date
of this presentation and are subject to change without notice
2
FINANCIAL HIGHLIGHTS
9M 2014 HIGHLIGHTS
4
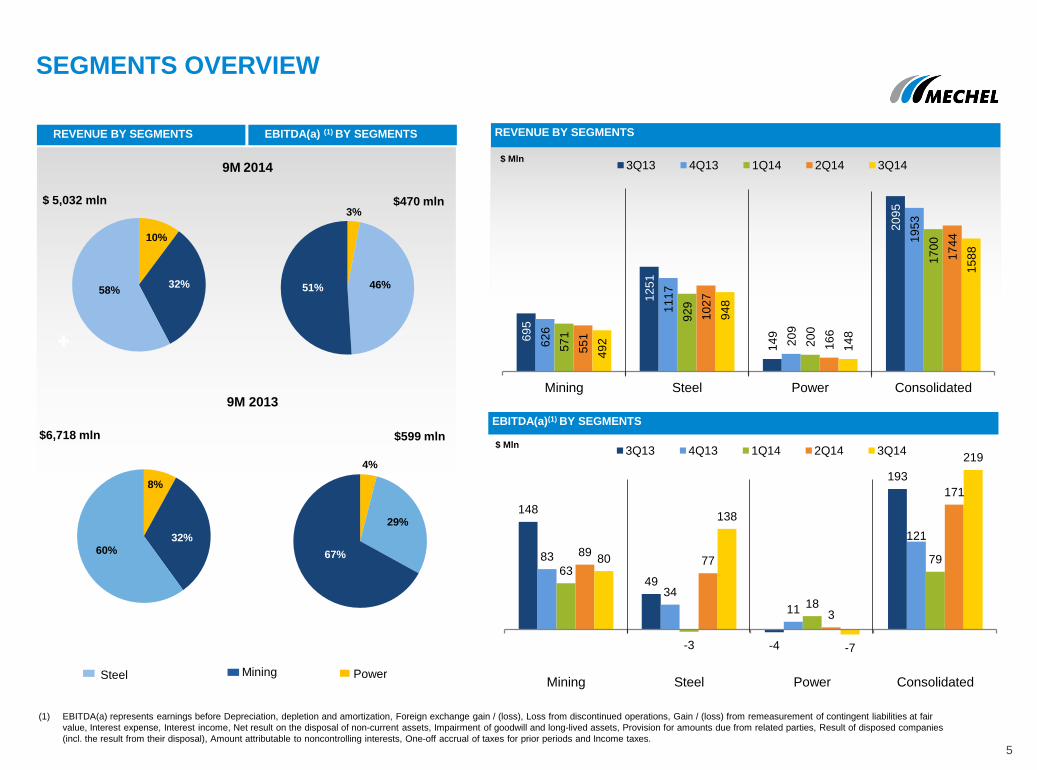
In 3Q 2014 metallurgical coal market was rather stable but prices were at their lows.
Long steel products market looked better with some price increase on domestic market compared to 2Q 2014.
Export sales amounted to 33% of total Revenue for 9M 2014 period with mining segment being the largest
contributor to export sales.
On a stable Revenue structure, share of Steel segment in Consolidated EBITDA increased from 29% in 9M 2013 to 45% in 9M 2014.
Gross margin increased from 30% in 9M 2013 to 35% in 9M 2014.
Net debt (excluding finance lease liabilities) amounted to $7.8 bln as of September 30, 2014. In 3Q 2014 Net
debt decreased by 9% due to ruble depreciation and partial redemption of bonds.
In 3Q 2014 bottom line affected by $551 mln of FX loss primarily due to loan revaluation.
But adjusted Net loss decreased 90% q-o-q.
In 3Q 2014 operating income grew to $107 mln on adjusted basis net of one-off accruals (Impairment of
goodwill and long-lived assets, provision for amounts due from related parties, loss on write-off of PPE and
additional taxes) compared with adjusted operating income of $41 mln in 2Q 2014.
148
49
-4
193
83
34
11
121
63
-3
18
79 89
77
3
171
80
138
-7
219
Mining Steel Power Consolidated
3Q13 4Q13 1Q14 2Q14 3Q14
69
5
12
51
14
9
20
95
62
6
11
17
20
9
19
53
57
1
92
9
20
0
17
00
55
1
10
27
16
6
17
44
49
2
94
8
14
8
15
88
Mining Steel Power Consolidated
3Q13 4Q13 1Q14 2Q14 3Q14
10%
32% 58%
8%
32%
60%
SEGMENTS OVERVIEW
REVENUE BY SEGMENTS
$ Mln
(1) EBITDA(a) represents earnings before Depreciation, depletion and amortization, Foreign exchange gain / (loss), Loss from discontinued operations, Gain / (loss) from remeasurement of contingent liabilities at fair
value, Interest expense, Interest income, Net result on the disposal of non-current assets, Impairment of goodwill and long-lived assets, Provision for amounts due from related parties, Result of disposed companies
(incl. the result from their disposal), Amount attributable to noncontrolling interests, One-off accrual of taxes for prior periods and Income taxes.
5
Steel Mining Power
EBITDA(a)(1) BY SEGMENTS
3%
46% 51%
9M 2014
4%
29%
67%
9M 2013
REVENUE BY SEGMENTS
$ Mln
EBITDA(a) (1) BY SEGMENTS
$ 5,032 mln $470 mln
$6,718 mln $599 mln
MINING SEGMENT
6
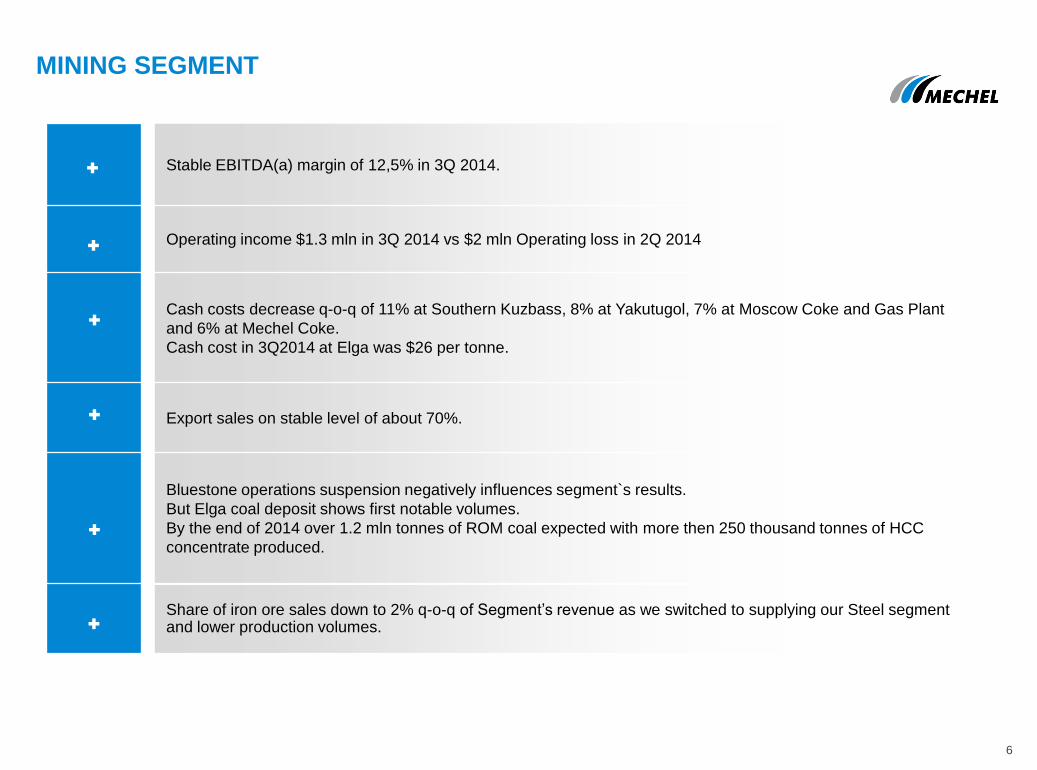
Stable EBITDA(a) margin of 12,5% in 3Q 2014.
Operating income $1.3 mln in 3Q 2014 vs $2 mln Operating loss in 2Q 2014
Cash costs decrease q-o-q of 11% at Southern Kuzbass, 8% at Yakutugol, 7% at Moscow Coke and Gas Plant
and 6% at Mechel Coke.
Cash cost in 3Q2014 at Elga was $26 per tonne.
Export sales on stable level of about 70%.
Bluestone operations suspension negatively influences segment`s results.
But Elga coal deposit shows first notable volumes.
By the end of 2014 over 1.2 mln tonnes of ROM coal expected with more then 250 thousand tonnes of HCC
concentrate produced.
Share of iron ore sales down to 2% q-o-q of Segment’s revenue as we switched to supplying our Steel segment and lower production volumes.
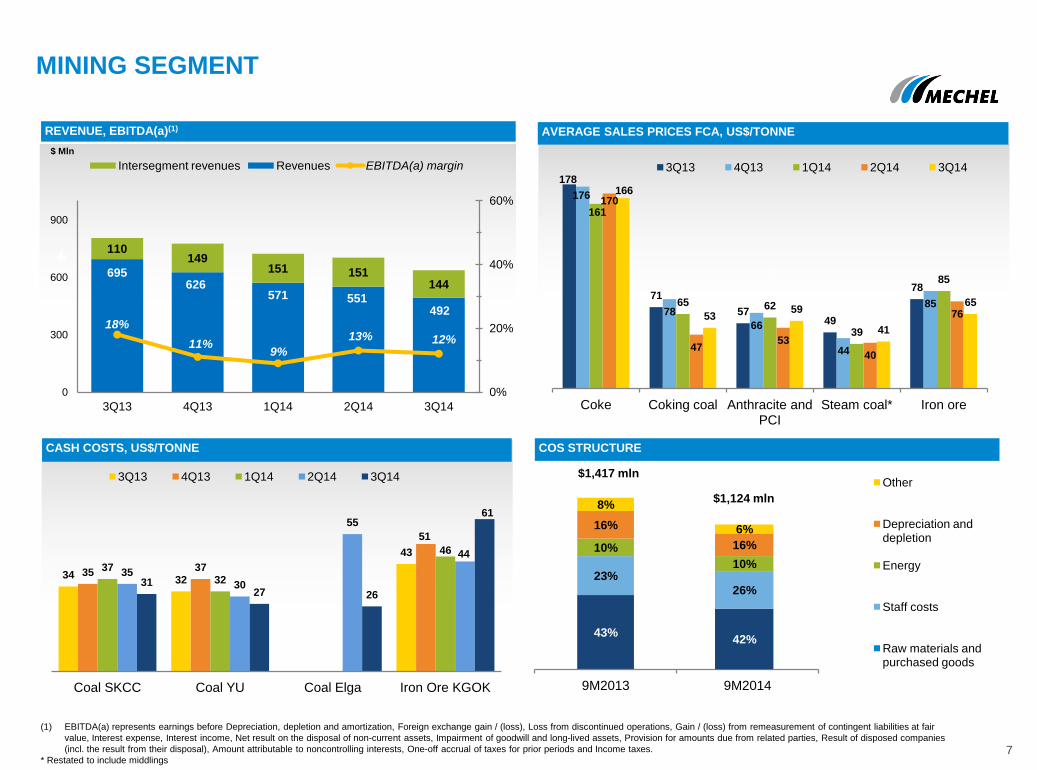
43%
23%
10%
16%
8%
9M2013 9M2014
Other
Depreciation and depletion
Energy
Staff costs
Raw materials and purchased goods
42%
26%
10%
16%
6%
34 32
43
35 37
51
37 32
46
35 30
55
44
31 27 26
61
Coal SKCC Coal YU Coal Elga Iron Ore KGOK
3Q13 4Q13 1Q14 2Q14 3Q14
695 626
571 551 492
110 149
151 151 144
18%
11% 9%
13% 12%
0%
20%
40%
60%
0
300
600
900
3Q13 4Q13 1Q14 2Q14 3Q14
Intersegment revenues Revenues EBITDA(a) margin
0.
MINING SEGMENT
CASH COSTS, US$/TONNE
7
REVENUE, EBITDA(a)(1)
(1) EBITDA(a) represents earnings before Depreciation, depletion and amortization, Foreign exchange gain / (loss), Loss from discontinued operations, Gain / (loss) from remeasurement of contingent liabilities at fair
value, Interest expense, Interest income, Net result on the disposal of non-current assets, Impairment of goodwill and long-lived assets, Provision for amounts due from related parties, Result of disposed companies
(incl. the result from their disposal), Amount attributable to noncontrolling interests, One-off accrual of taxes for prior periods and Income taxes.
* Restated to include middlings
AVERAGE SALES PRICES FCA, US$/TONNE
COS STRUCTURE
$1,417 mln
$1,124 mln
178
71
57 49
78
176
78
66
44
85
161
65 62
39
85
170
47 53
40
76
166
53 59
41
65
Coke Coking coal Anthracite and PCI
Steam coal* Iron ore
3Q13 4Q13 1Q14 2Q14 3Q14
$ Mln
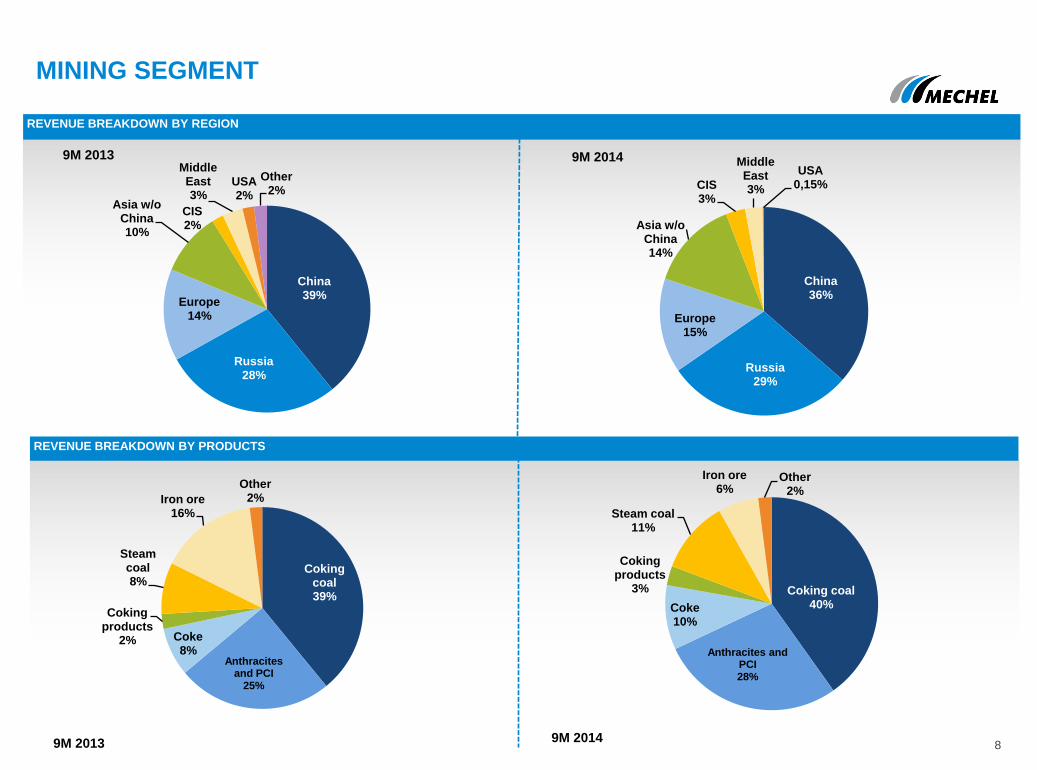
Coking coal 40%
Anthracites and PCI 28%
Coke 10%
Coking products
3%
Steam coal 11%
Iron ore 6%
Other 2%
Coking coal 39%
Anthracites and PCI
25%
Coke 8%
Coking products
2%
Steam coal 8%
Iron ore 16%
Other 2%
China 39%
Russia 28%
Europe 14%
Asia w/o China 10%
CIS 2%
Middle East 3%
USA 2%
Other 2%
MINING SEGMENT
8
REVENUE BREAKDOWN BY REGION
REVENUE BREAKDOWN BY PRODUCTS
9M 2013 9M 2014
9M 2013 9M 2014
China 36%
Russia 29%
Europe 15%
Asia w/o China 14%
CIS 3%
Middle East 3%
USA 0,15%
STEEL SEGMENT
9
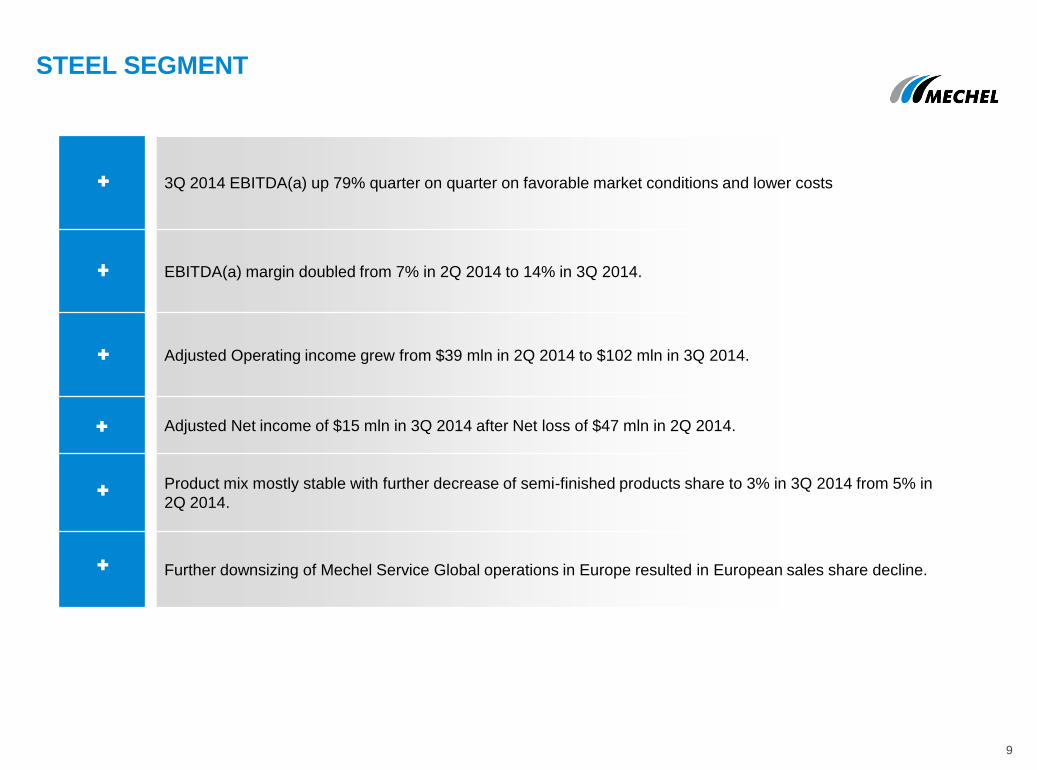
3Q 2014 EBITDA(a) up 79% quarter on quarter on favorable market conditions and lower costs
EBITDA(a) margin doubled from 7% in 2Q 2014 to 14% in 3Q 2014.
Adjusted Operating income grew from $39 mln in 2Q 2014 to $102 mln in 3Q 2014.
Adjusted Net income of $15 mln in 3Q 2014 after Net loss of $47 mln in 2Q 2014.
Product mix mostly stable with further decrease of semi-finished products share to 3% in 3Q 2014 from 5% in
2Q 2014.
Further downsizing of Mechel Service Global operations in Europe resulted in European sales share decline.
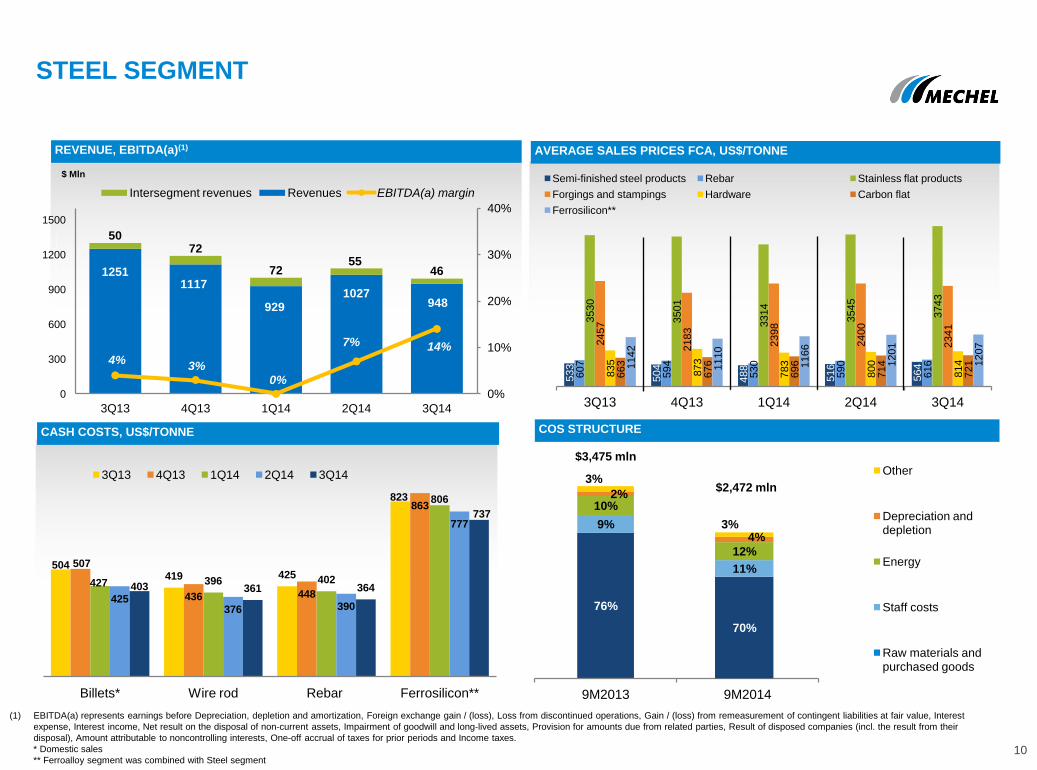
504 419 425
823
507
436 448
863
427 396 402
806
425 376 390
777
403 361 364
737
Billets* Wire rod Rebar Ferrosilicon**
3Q13 4Q13 1Q14 2Q14 3Q14
1251 1117
929 1027
948
50 72
72 55
46
4% 3%
0%
7% 14%
0%
10%
20%
30%
40%
0
300
600
900
1200
1500
3Q13 4Q13 1Q14 2Q14 3Q14
Intersegment revenues Revenues EBITDA(a) margin
533
504
488
516
564
607
594
530
590
616
3530
3501
3314
3545
3743
2457
2183
2398
2400
2341
835
873
783
800
814
663
676
696
714
721
1142
1110
1166
1201
1207
3Q13 4Q13 1Q14 2Q14 3Q14
Semi-finished steel products Rebar Stainless flat products
Forgings and stampings Hardware Carbon flat
Ferrosilicon**
76%
9%
10% 2%
3%
9M2013 9M2014
Other
Depreciation and depletion
Energy
Staff costs
Raw materials and purchased goods
70%
11%
12%
4% 3%
STEEL SEGMENT
10
CASH COSTS, US$/TONNE
REVENUE, EBITDA(a)(1)
$ Mln
(1) EBITDA(a) represents earnings before Depreciation, depletion and amortization, Foreign exchange gain / (loss), Loss from discontinued operations, Gain / (loss) from remeasurement of contingent liabilities at fair value, Interest
expense, Interest income, Net result on the disposal of non-current assets, Impairment of goodwill and long-lived assets, Provision for amounts due from related parties, Result of disposed companies (incl. the result from their
disposal), Amount attributable to noncontrolling interests, One-off accrual of taxes for prior periods and Income taxes.
* Domestic sales
** Ferroalloy segment was combined with Steel segment
AVERAGE SALES PRICES FCA, US$/TONNE
COS STRUCTURE
$3,475 mln
$2,472 mln
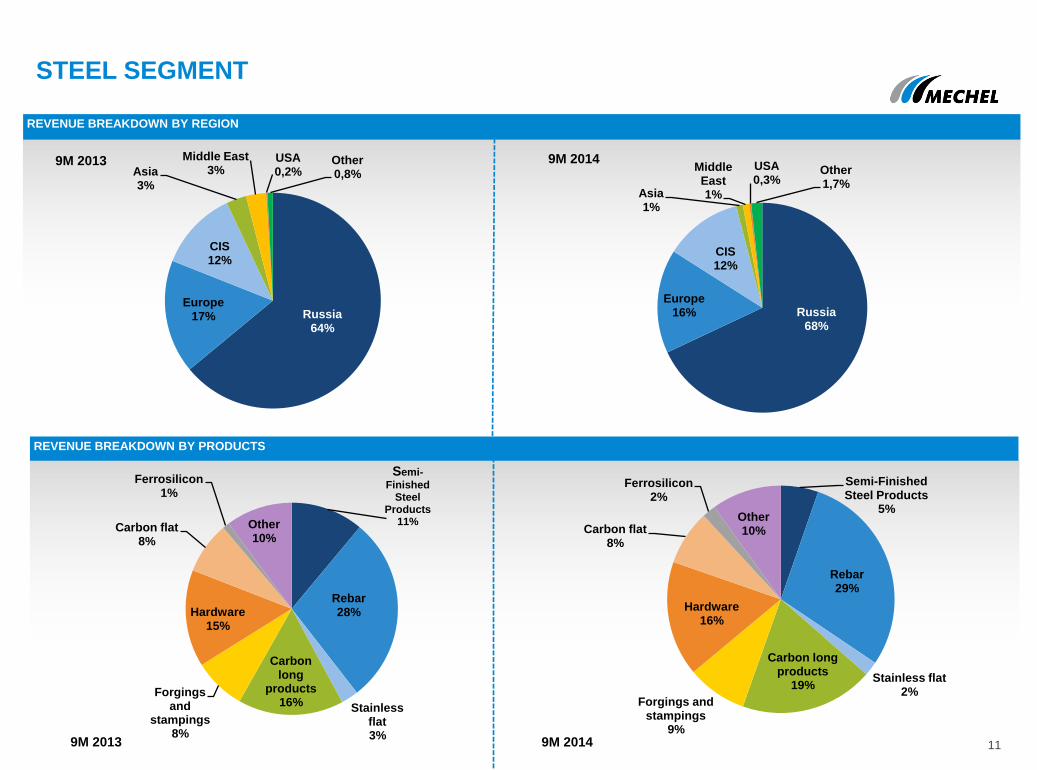
Semi-Finished Steel Products
5%
Rebar 29%
Stainless flat 2%
Carbon long products
19%
Forgings and stampings
9%
Hardware 16%
Carbon flat 8%
Ferrosilicon 2%
Other 10%
Semi-
Finished Steel
Products 11%
Rebar 28%
Stainless flat 3%
Carbon long
products 16%
Forgings and
stampings 8%
Hardware 15%
Carbon flat 8%
Ferrosilicon 1%
Other 10%
Russia 64%
Europe 17%
CIS 12%
Asia 3%
Middle East 3%
USA 0,2%
Other 0,8%
Russia 68%
Europe 16%
CIS 12%
Asia 1%
Middle East 1%
USA 0,3%
Other 1,7%
STEEL SEGMENT
11
REVENUE BREAKDOWN BY REGION
REVENUE BREAKDOWN BY PRODUCTS
9M 2014 9M 2013
9M 2014 9M 2013
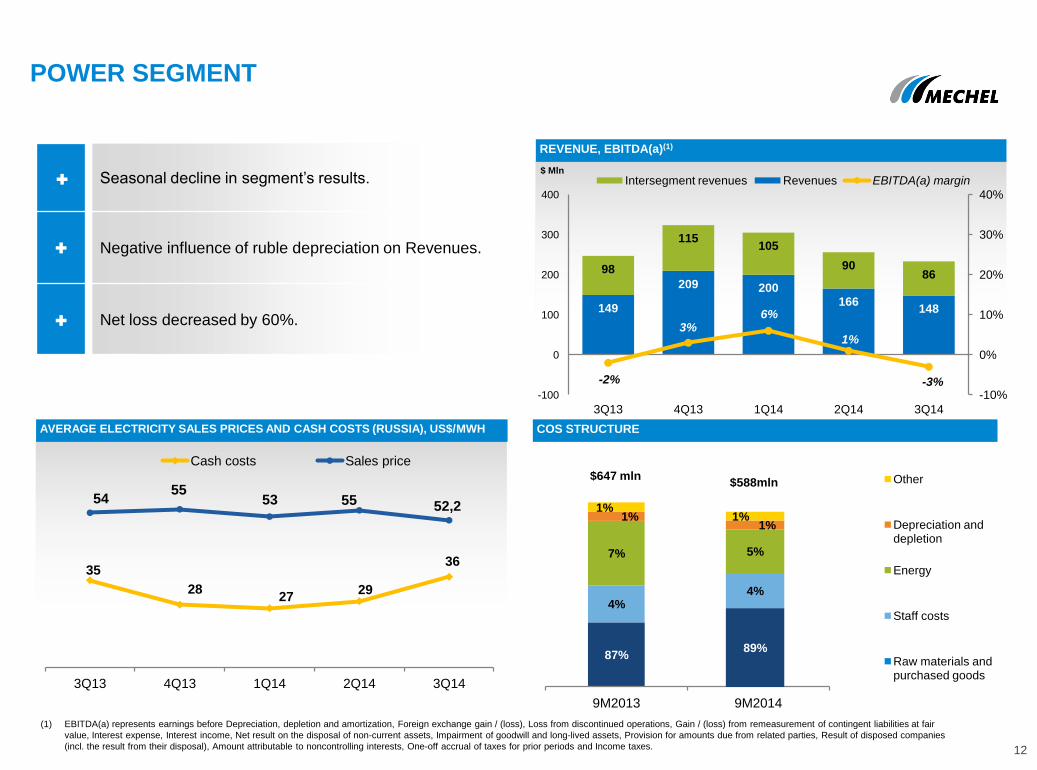
87%
4%
7%
1% 1%
9M2013 9M2014
Other
Depreciation and depletion
Energy
Staff costs
Raw materials and purchased goods
89%
4%
5%
1% 1%
POWER SEGMENT
12
AVERAGE ELECTRICITY SALES PRICES AND CASH COSTS (RUSSIA), US$/MWH
REVENUE, EBITDA(a)(1)
$ Mln
(1) EBITDA(a) represents earnings before Depreciation, depletion and amortization, Foreign exchange gain / (loss), Loss from discontinued operations, Gain / (loss) from remeasurement of contingent liabilities at fair
value, Interest expense, Interest income, Net result on the disposal of non-current assets, Impairment of goodwill and long-lived assets, Provision for amounts due from related parties, Result of disposed companies
(incl. the result from their disposal), Amount attributable to noncontrolling interests, One-off accrual of taxes for prior periods and Income taxes.
COS STRUCTURE
$647 mln $588mln
Seasonal decline in segment’s results.
Negative influence of ruble depreciation on Revenues.
Net loss decreased by 60%. 149
209 200 166
148
98
115 105
90 86
-2%
3% 6%
1%
-3% -10%
0%
10%
20%
30%
40%
-100
0
100
200
300
400
3Q13 4Q13 1Q14 2Q14 3Q14
Intersegment revenues Revenues EBITDA(a) margin
35
28 27
29
36
54 55
53 55 52,2
3Q13 4Q13 1Q14 2Q14 3Q14
Cash costs Sales price
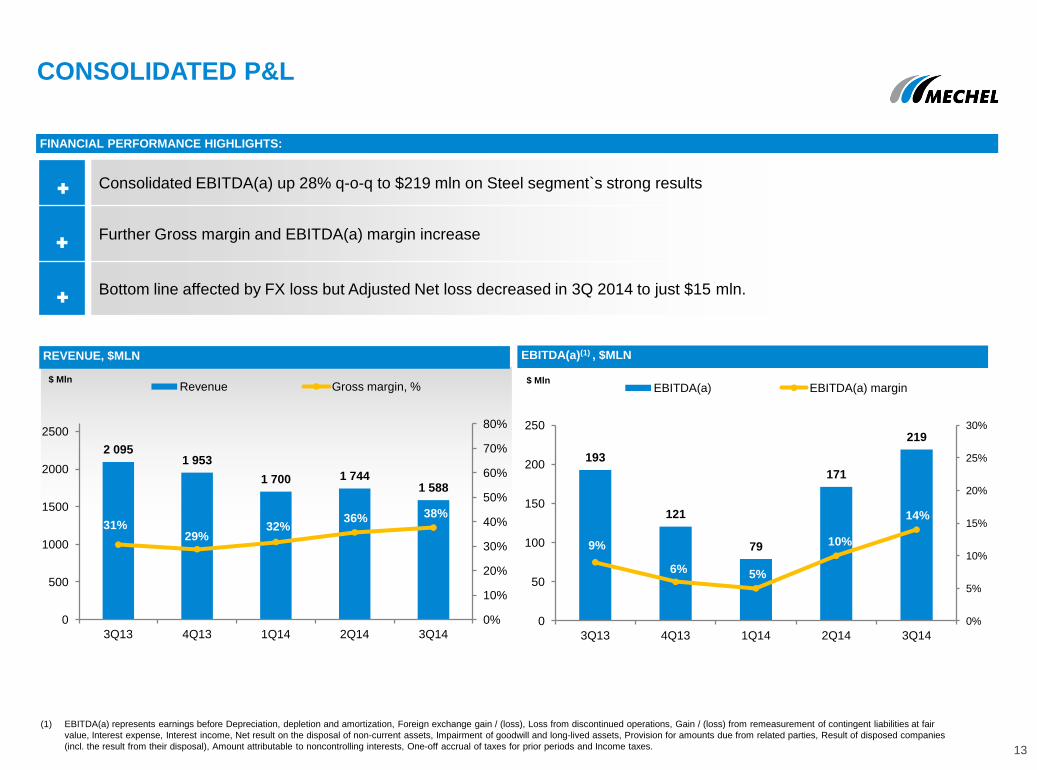
CONSOLIDATED P&L
13
REVENUE, $MLN
FINANCIAL PERFORMANCE HIGHLIGHTS:
$ Mln $ Mln
(1) EBITDA(a) represents earnings before Depreciation, depletion and amortization, Foreign exchange gain / (loss), Loss from discontinued operations, Gain / (loss) from remeasurement of contingent liabilities at fair
value, Interest expense, Interest income, Net result on the disposal of non-current assets, Impairment of goodwill and long-lived assets, Provision for amounts due from related parties, Result of disposed companies
(incl. the result from their disposal), Amount attributable to noncontrolling interests, One-off accrual of taxes for prior periods and Income taxes.
Consolidated EBITDA(a) up 28% q-o-q to $219 mln on Steel segment`s strong results
Further Gross margin and EBITDA(a) margin increase
Bottom line affected by FX loss but Adjusted Net loss decreased in 3Q 2014 to just $15 mln.
2 095 1 953
1 700 1 744 1 588
31% 29%
32% 36% 38%
0%
10%
20%
30%
40%
50%
60%
70%
80%
0
500
1000
1500
2000
2500
3Q13 4Q13 1Q14 2Q14 3Q14
Revenue Gross margin, %
193
121
79
171
219
9%
6% 5%
10%
14%
0%
5%
10%
15%
20%
25%
30%
0
50
100
150
200
250
3Q13 4Q13 1Q14 2Q14 3Q14
EBITDA(a) EBITDA(a) margin
EBITDA(a)(1) , $MLN
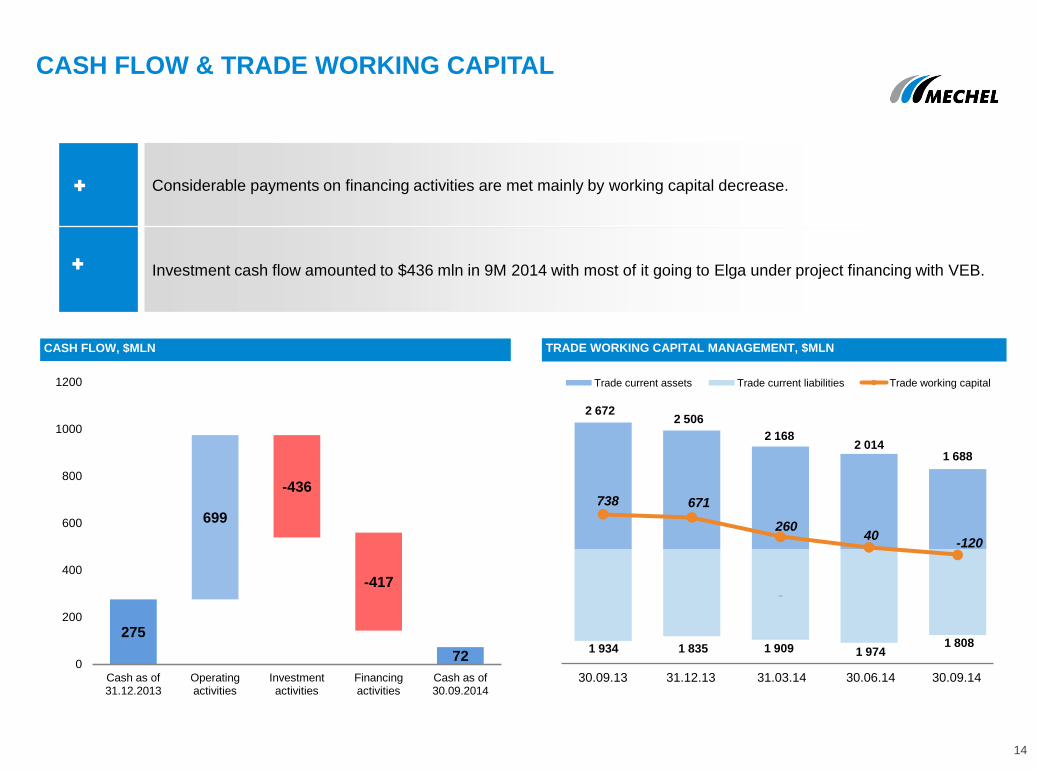
CASH FLOW & TRADE WORKING CAPITAL
14
CASH FLOW, $MLN
Considerable payments on financing activities are met mainly by working capital decrease.
Investment cash flow amounted to $436 mln in 9M 2014 with most of it going to Elga under project financing with VEB.
TRADE WORKING CAPITAL MANAGEMENT, $MLN
275
72
699
-436
-417
0
200
400
600
800
1000
1200
Cash as of 31.12.2013
Operating activities
Investment activities
Financing activities
Cash as of 30.09.2014
738 671
260 40
-120
Trade current assets Trade current liabilities Trade working capital
1 934 1 835 1 909 1 974 1 808
2 672 2 506
2 168 2 014
1 688
30.09.13 31.12.13 31.03.14 30.06.14 30.09.14
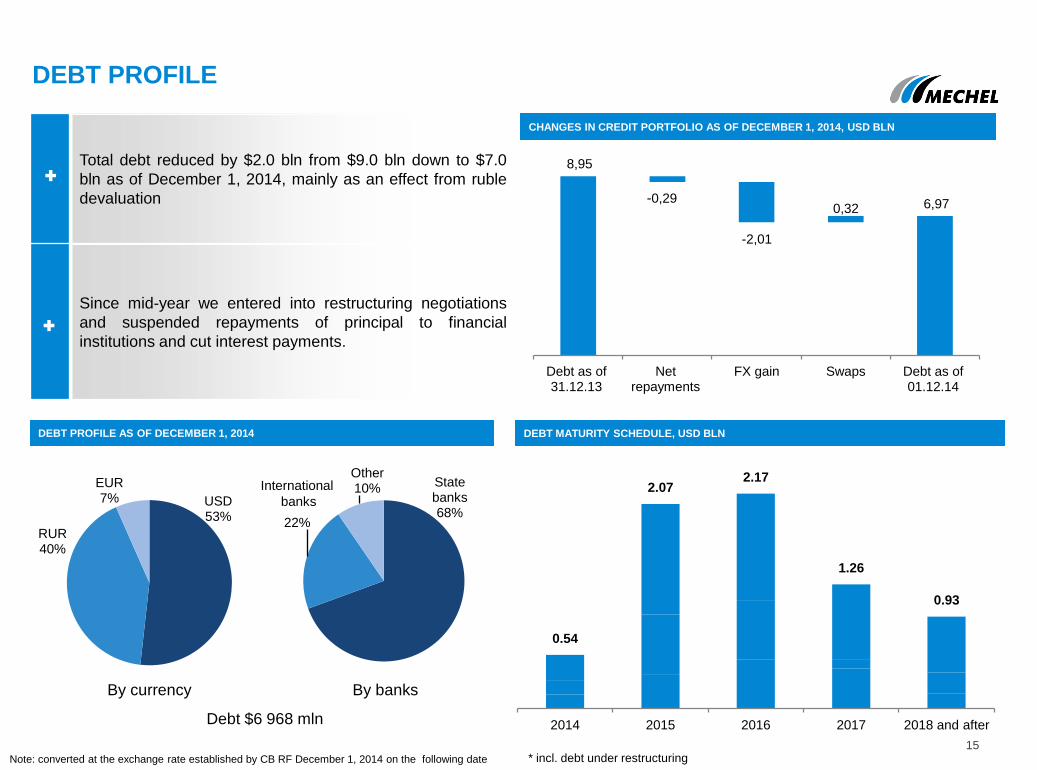
State banks 68%
22%
Other 10% International
banks
Total debt reduced by $2.0 bln from $9.0 bln down to $7.0
bln as of December 1, 2014, mainly as an effect from ruble
devaluation
Since mid-year we entered into restructuring negotiations
and suspended repayments of principal to financial
institutions and cut interest payments.
DEBT PROFILE
DEBT MATURITY SCHEDULE, USD BLN
CHANGES IN CREDIT PORTFOLIO AS OF DECEMBER 1, 2014, USD BLN
DEBT PROFILE AS OF DECEMBER 1, 2014
By currency By banks
15
0.54
2.07 2.17
1.26
0.93
2014 2015 2016 2017 2018 and after
* incl. debt under restructuring
Debt $6 968 mln
Note: converted at the exchange rate established by CB RF December 1, 2014 on the following date
8,95
0,29
2,01
0,32 6,97
Debt as of 31.12.13
Net repayments
FX gain Swaps Debt as of 01.12.14
-0,29
-2,01
USD 53%
RUR 40%
EUR 7%
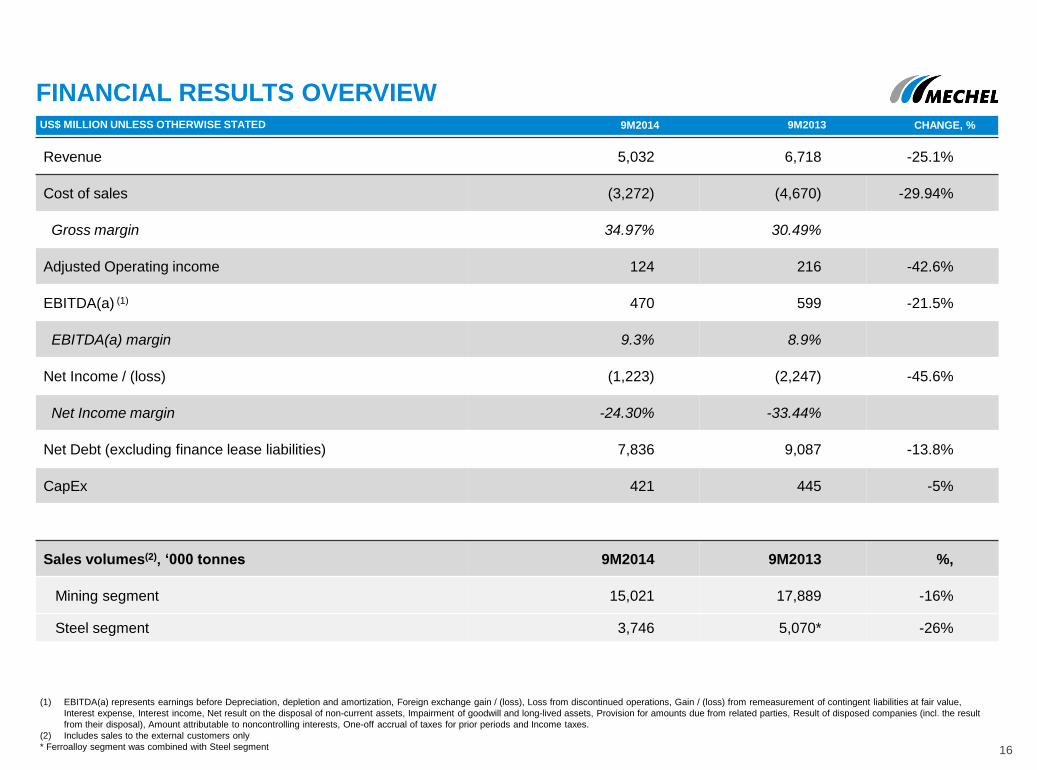
Revenue 5,032 6,718 -25.1%
Cost of sales (3,272) (4,670) -29.94%
Gross margin 34.97% 30.49%
Adjusted Operating income 124 216 -42.6%
EBITDA(a) (1) 470 599 -21.5%
EBITDA(a) margin 9.3% 8.9%
Net Income / (loss) (1,223) (2,247) -45.6%
Net Income margin -24.30% -33.44%
Net Debt (excluding finance lease liabilities) 7,836 9,087 -13.8%
CapEx 421 445 -5%
Sales volumes(2), ‘000 tonnes 9M2014 9M2013 %,
Mining segment 15,021 17,889 -16%
Steel segment 3,746 5,070* -26%
FINANCIAL RESULTS OVERVIEW
(1) EBITDA(a) represents earnings before Depreciation, depletion and amortization, Foreign exchange gain / (loss), Loss from discontinued operations, Gain / (loss) from remeasurement of contingent liabilities at fair value,
Interest expense, Interest income, Net result on the disposal of non-current assets, Impairment of goodwill and long-lived assets, Provision for amounts due from related parties, Result of disposed companies (incl. the result
from their disposal), Amount attributable to noncontrolling interests, One-off accrual of taxes for prior periods and Income taxes.
(2) Includes sales to the external customers only
* Ferroalloy segment was combined with Steel segment
US$ MILLION UNLESS OTHERWISE STATED 9M2014 9M2013 CHANGE, %
16