
TCS Financial Results
27
1 Copyright © 2014 Tata Consultancy Services Limited TCS Financial Results Quarter II FY 2014 - 15 October 16, 2014
-
Upload
trinhquynh -
Category
Documents
-
view
219 -
download
0
Transcript of TCS Financial Results
1 Copyright © 2014 Tata Consultancy Services Limited
TCS Financial Results
Quarter II FY 2014 - 15
October 16, 2014
2
Disclaimer
Certain statements in this release concerning our future prospects are forward-looking statements. Forward-looking statements by their nature involve a number of risks and uncertainties that could cause actual results to differ materially from market expectations. These risks and uncertainties include, but are not limited to our ability to manage growth, intense competition among Indian and overseas IT services companies, various factors which may affect our cost advantage, such as wage increases or an appreciating Rupee, our ability to attract and retain highly skilled professionals, time and cost overruns on fixed-price, fixed-time frame contracts, client concentration, restrictions on immigration, our ability to manage our international operations, reduced demand for technology in our key focus areas, disruptions in telecommunication networks, our ability to successfully complete and integrate potential acquisitions, liability for damages on our service contracts, the success of the companies in which TCS has made strategic investments, withdrawal of governmental fiscal incentives, political instability, legal restrictions on raising capital or acquiring companies outside India, unauthorized use of our intellectual property and general economic conditions affecting our industry. TCS may, from time to time, make additional written and oral forward-looking statements, including our reports to shareholders. These forward-looking statements represent only the Company’s current intentions, beliefs or expectations, and any forward-looking statement speaks only as of the date on which it was made. The Company assumes no obligation to revise or update any forward-looking statements.
3
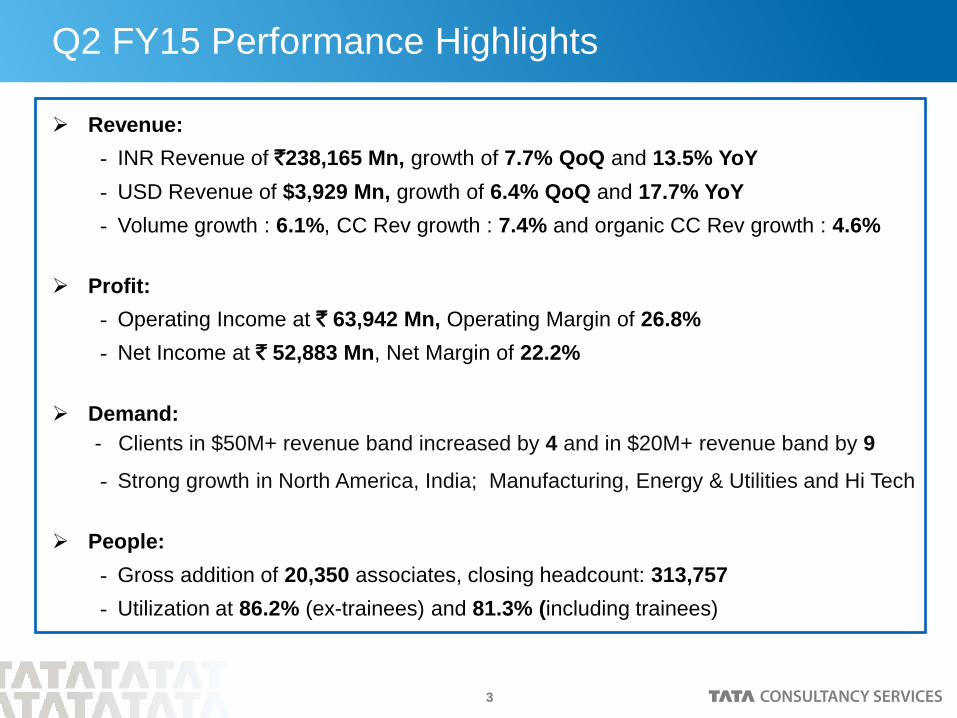
Q2 FY15 Performance Highlights
Revenue:
INR Revenue of `238,165 Mn, growth of 7.7% QoQ and 13.5% YoY
USD Revenue of $3,929 Mn, growth of 6.4% QoQ and 17.7% YoY
Volume growth : 6.1%, CC Rev growth : 7.4% and organic CC Rev growth : 4.6%
Profit:
Operating Income at ` 63,942 Mn, Operating Margin of 26.8%
Net Income at ` 52,883 Mn, Net Margin of 22.2%
Demand:
- Clients in $50M+ revenue band increased by 4 and in $20M+ revenue band by 9
Strong growth in North America, India; Manufacturing, Energy & Utilities and Hi Tech
People:
Gross addition of 20,350 associates, closing headcount: 313,757
Utilization at 86.2% (ex-trainees) and 81.3% (including trainees)
4
Click to edit Master title style Financial Performance
5
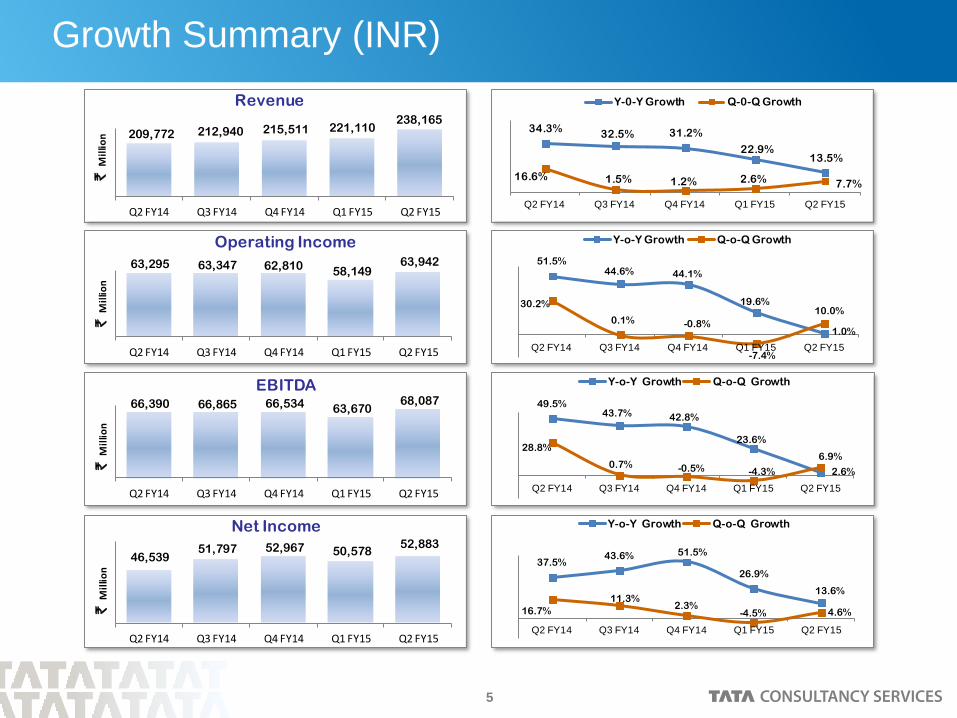
Growth Summary (INR)
34.3%32.5% 31.2%
22.9%13.5%
16.6% 1.5% 1.2% 2.6% 7.7%
Q2 FY14 Q3 FY14 Q4 FY14 Q1 FY15 Q2 FY15
Y-0-Y Growth Q-0-Q Growth
51.5%44.6% 44.1%
19.6%
1.0%
30.2%
0.1% -0.8%
-7.4%
10.0%
Q2 FY14 Q3 FY14 Q4 FY14 Q1 FY15 Q2 FY15
Y-o-Y Growth Q-o-Q Growth
49.5%43.7% 42.8%
23.6%
2.6%
28.8%
0.7% -0.5% -4.3%
6.9%
Q2 FY14 Q3 FY14 Q4 FY14 Q1 FY15 Q2 FY15
Y-o-Y Growth Q-o-Q Growth
37.5%43.6% 51.5%
26.9%
13.6%
16.7%
11.3%2.3%
-4.5% 4.6%
Q2 FY14 Q3 FY14 Q4 FY14 Q1 FY15 Q2 FY15
Y-o-Y Growth Q-o-Q Growth
209,772 212,940 215,511 221,110 238,165
Q2 FY14 Q3 FY14 Q4 FY14 Q1 FY15 Q2 FY15
Revenue`
Mil
lion
63,295 63,347 62,810 58,149
63,942
Q2 FY14 Q3 FY14 Q4 FY14 Q1 FY15 Q2 FY15
Operating Income
`M
illio
n
66,390 66,865 66,534 63,670 68,087
Q2 FY14 Q3 FY14 Q4 FY14 Q1 FY15 Q2 FY15
EBITDA
`M
illio
n
46,539 51,797 52,967 50,578
52,883
Q2 FY14 Q3 FY14 Q4 FY14 Q1 FY15 Q2 FY15
Net Income
`M
illio
n
6
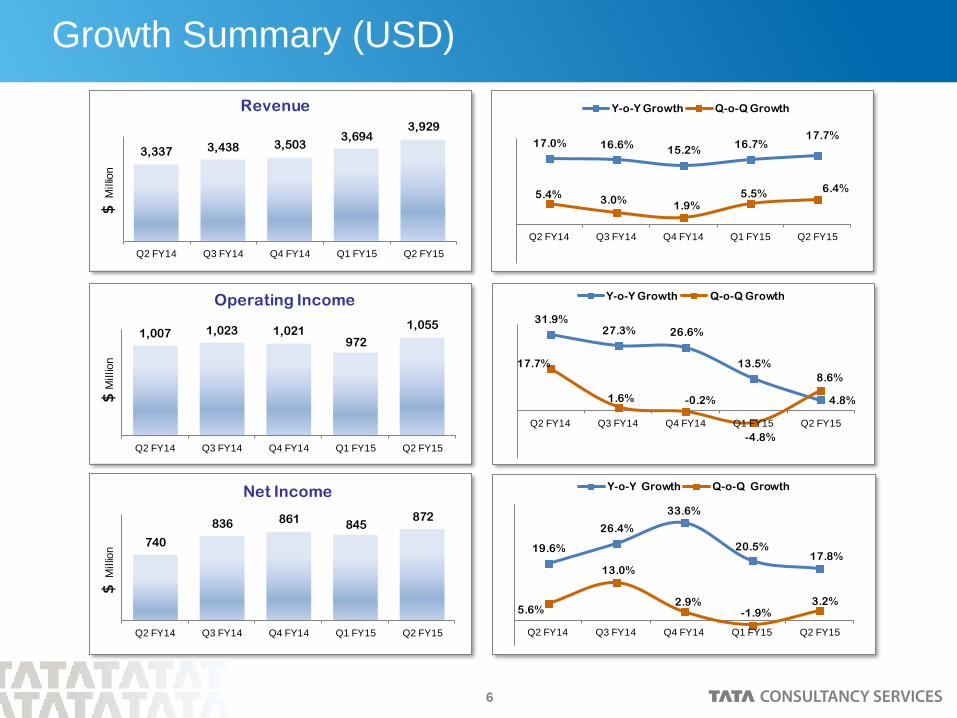
Growth Summary (USD)
3,337 3,438 3,5033,694
3,929
Q2 FY14 Q3 FY14 Q4 FY14 Q1 FY15 Q2 FY15
Revenue$
Millio
n
1,007 1,023 1,021972
1,055
Q2 FY14 Q3 FY14 Q4 FY14 Q1 FY15 Q2 FY15
Operating Income
$M
illio
n
740
836 861845
872
Q2 FY14 Q3 FY14 Q4 FY14 Q1 FY15 Q2 FY15
Net Income
$M
illio
n
17.0% 16.6%15.2%
16.7%17.7%
5.4%3.0%
1.9%5.5%
6.4%
Q2 FY14 Q3 FY14 Q4 FY14 Q1 FY15 Q2 FY15
Y-o-Y Growth Q-o-Q Growth
31.9%27.3% 26.6%
13.5%
4.8%
17.7%
1.6% -0.2%
-4.8%
8.6%
Q2 FY14 Q3 FY14 Q4 FY14 Q1 FY15 Q2 FY15
Y-o-Y Growth Q-o-Q Growth
19.6%
26.4%
33.6%
20.5%17.8%
5.6%
13.0%
2.9%-1.9%
3.2%
Q2 FY14 Q3 FY14 Q4 FY14 Q1 FY15 Q2 FY15
Y-o-Y Growth Q-o-Q Growth

7
Operational Performance
8
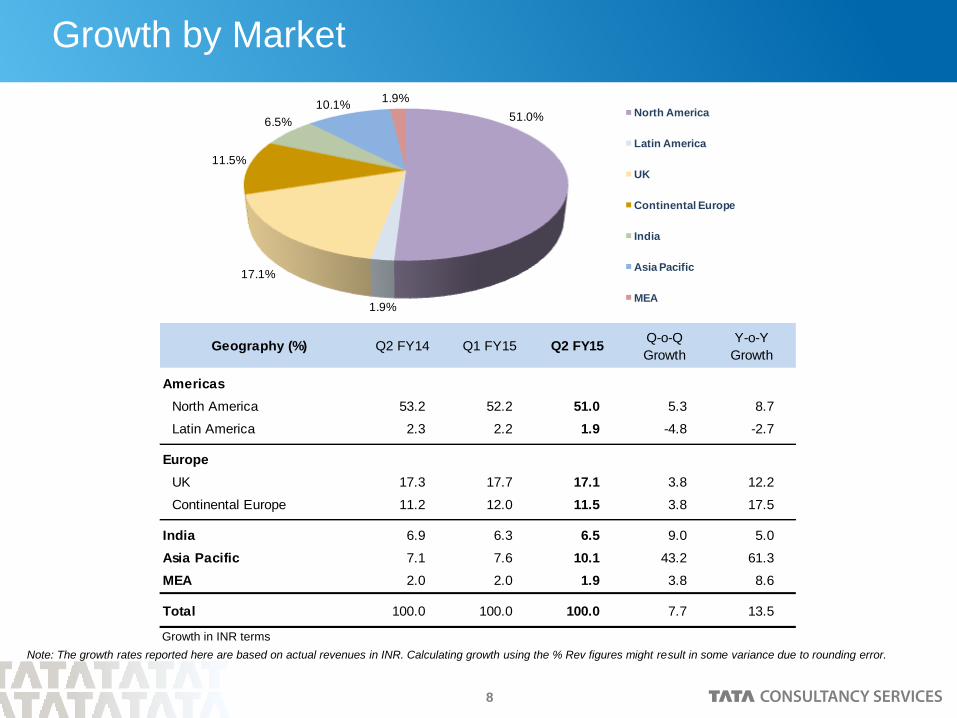
Growth by Market
Note: The growth rates reported here are based on actual revenues in INR. Calculating growth using the % Rev figures might result in some variance due to rounding error.
Growth in INR terms
51.0%
1.9%
17.1%
11.5%
6.5%
10.1%1.9%
North America
Latin America
UK
Continental Europe
India
Asia Pacific
MEA
Geography (%) Q2 FY14 Q1 FY15 Q2 FY15Q-o-Q
Growth
Y-o-Y
Growth
Americas
North America 53.2 52.2 51.0 5.3 8.7
Latin America 2.3 2.2 1.9 -4.8 -2.7
Europe
UK 17.3 17.7 17.1 3.8 12.2
Continental Europe 11.2 12.0 11.5 3.8 17.5
India 6.9 6.3 6.5 9.0 5.0
Asia Pacific 7.1 7.6 10.1 43.2 61.3
MEA 2.0 2.0 1.9 3.8 8.6
Total 100.0 100.0 100.0 7.7 13.5
9
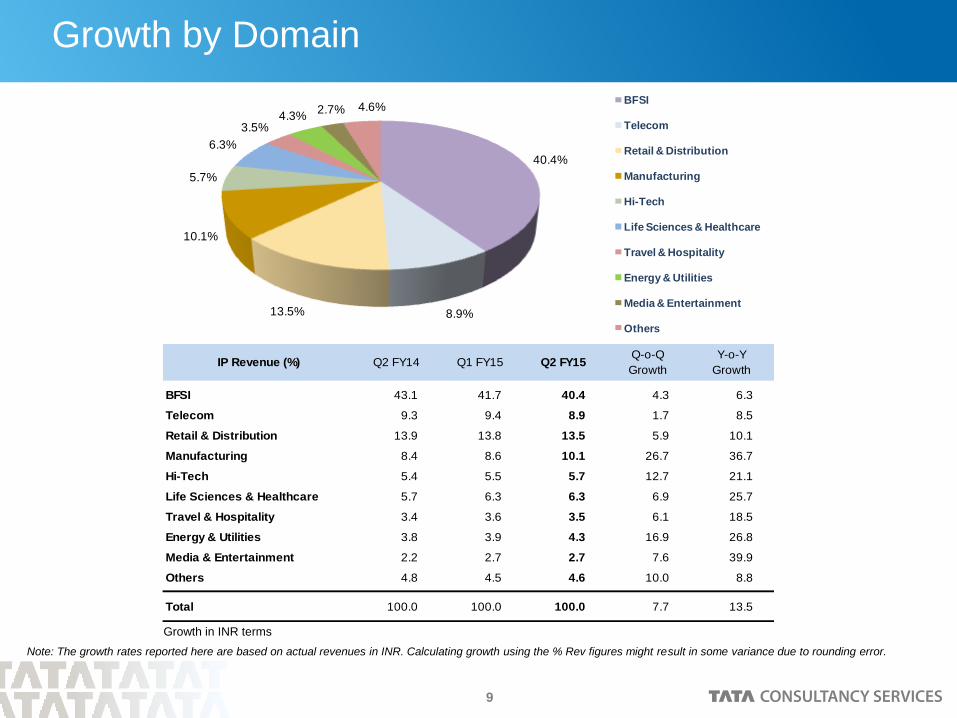
Growth by Domain
Note: The growth rates reported here are based on actual revenues in INR. Calculating growth using the % Rev figures might result in some variance due to rounding error.
Growth in INR terms
40.4%
8.9%13.5%
10.1%
5.7%
6.3%
3.5%4.3%
2.7% 4.6%BFSI
Telecom
Retail & Distribution
Manufacturing
Hi-Tech
Life Sciences & Healthcare
Travel & Hospitality
Energy & Utilities
Media & Entertainment
Others
IP Revenue (%) Q2 FY14 Q1 FY15 Q2 FY15Q-o-Q
Growth
Y-o-Y
Growth
BFSI 43.1 41.7 40.4 4.3 6.3
Telecom 9.3 9.4 8.9 1.7 8.5
Retail & Distribution 13.9 13.8 13.5 5.9 10.1
Manufacturing 8.4 8.6 10.1 26.7 36.7
Hi-Tech 5.4 5.5 5.7 12.7 21.1
Life Sciences & Healthcare 5.7 6.3 6.3 6.9 25.7
Travel & Hospitality 3.4 3.6 3.5 6.1 18.5
Energy & Utilities 3.8 3.9 4.3 16.9 26.8
Media & Entertainment 2.2 2.7 2.7 7.6 39.9
Others 4.8 4.5 4.6 10.0 8.8
Total 100.0 100.0 100.0 7.7 13.5
10
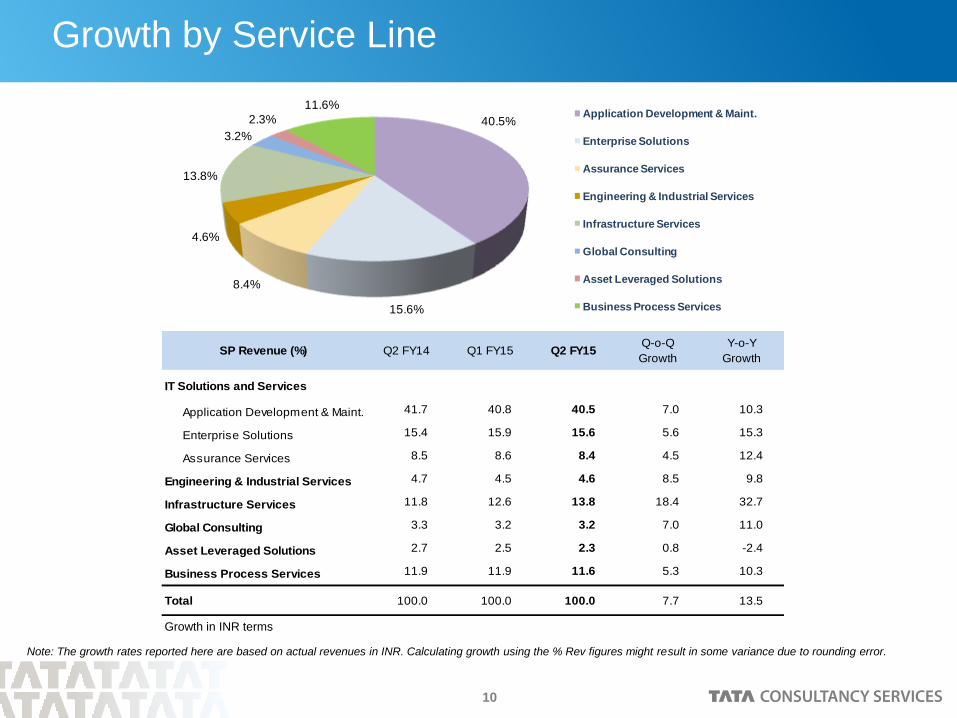
Growth by Service Line
Note: The growth rates reported here are based on actual revenues in INR. Calculating growth using the % Rev figures might result in some variance due to rounding error.
Growth in INR terms
40.5%
15.6%
8.4%
4.6%
13.8%
3.2%
2.3%
11.6%Application Development & Maint.
Enterprise Solutions
Assurance Services
Engineering & Industrial Services
Infrastructure Services
Global Consulting
Asset Leveraged Solutions
Business Process Services
SP Revenue (%) Q2 FY14 Q1 FY15 Q2 FY15Q-o-Q
Growth
Y-o-Y
Growth
IT Solutions and Services
Application Development & Maint. 41.7 40.8 40.5 7.0 10.3
Enterprise Solutions 15.4 15.9 15.6 5.6 15.3
Assurance Services 8.5 8.6 8.4 4.5 12.4
Engineering & Industrial Services 4.7 4.5 4.6 8.5 9.8
Infrastructure Services 11.8 12.6 13.8 18.4 32.7
Global Consulting 3.3 3.2 3.2 7.0 11.0
Asset Leveraged Solutions 2.7 2.5 2.3 0.8 -2.4
Business Process Services 11.9 11.9 11.6 5.3 10.3
Total 100.0 100.0 100.0 7.7 13.5
11
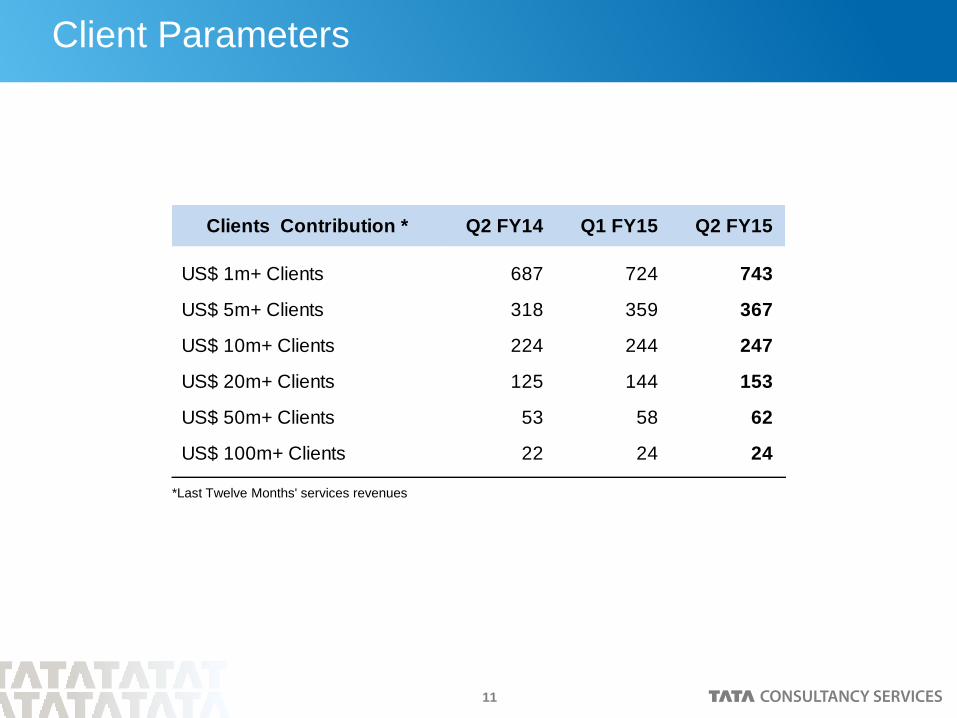
Client Parameters
US$ 1m+ Clients 687 724 743
US$ 5m+ Clients 318 359 367
US$ 10m+ Clients 224 244 247
US$ 20m+ Clients 125 144 153
US$ 50m+ Clients 53 58 62
US$ 100m+ Clients 22 24 24
Q1 FY15Clients Contribution * Q2 FY15Q2 FY14
*Last Twelve Months' services revenues
12
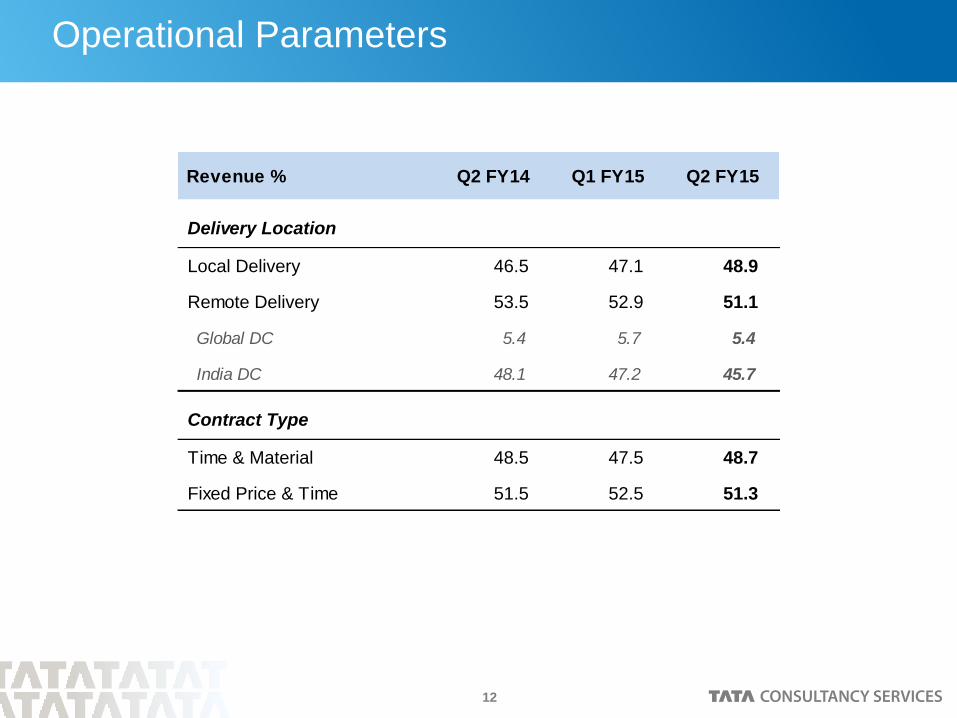
Operational Parameters
Delivery Location
Local Delivery 46.5 47.1 48.9
Remote Delivery 53.5 52.9 51.1
Global DC 5.4 5.7 5.4
India DC 48.1 47.2 45.7
Contract Type
Time & Material 48.5 47.5 48.7
Fixed Price & Time 51.5 52.5 51.3
Revenue % Q2 FY15Q2 FY14 Q1 FY15
13
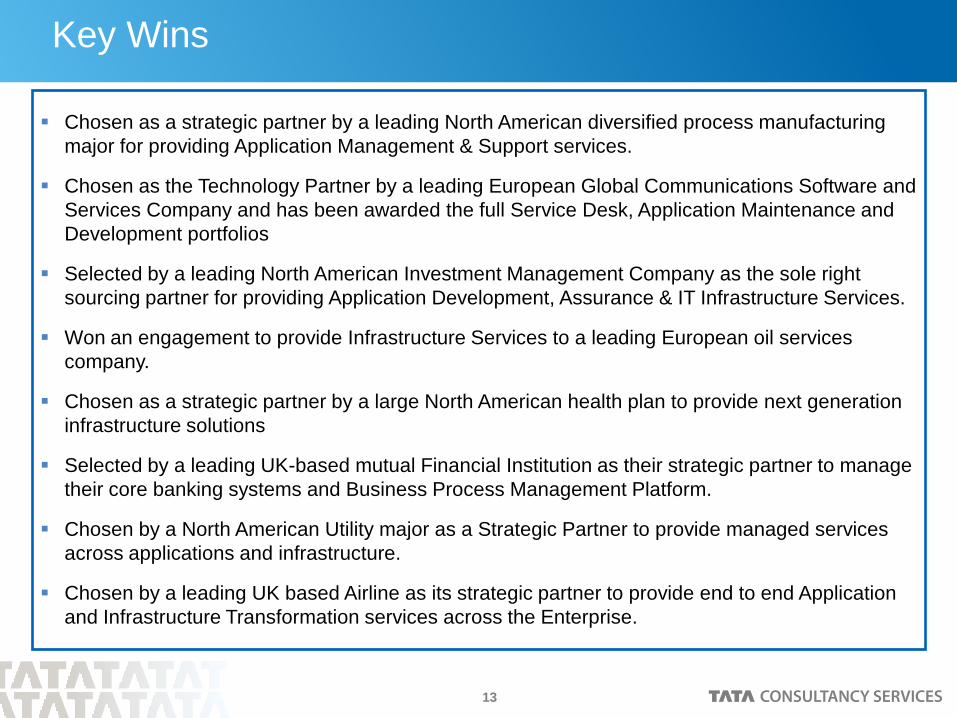
Key Wins
Chosen as a strategic partner by a leading North American diversified process manufacturing
major for providing Application Management & Support services.
Chosen as the Technology Partner by a leading European Global Communications Software and
Services Company and has been awarded the full Service Desk, Application Maintenance and
Development portfolios
Selected by a leading North American Investment Management Company as the sole right
sourcing partner for providing Application Development, Assurance & IT Infrastructure Services.
Won an engagement to provide Infrastructure Services to a leading European oil services
company.
Chosen as a strategic partner by a large North American health plan to provide next generation
infrastructure solutions
Selected by a leading UK-based mutual Financial Institution as their strategic partner to manage
their core banking systems and Business Process Management Platform.
Chosen by a North American Utility major as a Strategic Partner to provide managed services
across applications and infrastructure.
Chosen by a leading UK based Airline as its strategic partner to provide end to end Application
and Infrastructure Transformation services across the Enterprise.

14
Click to edit Master title style Human Resources
15
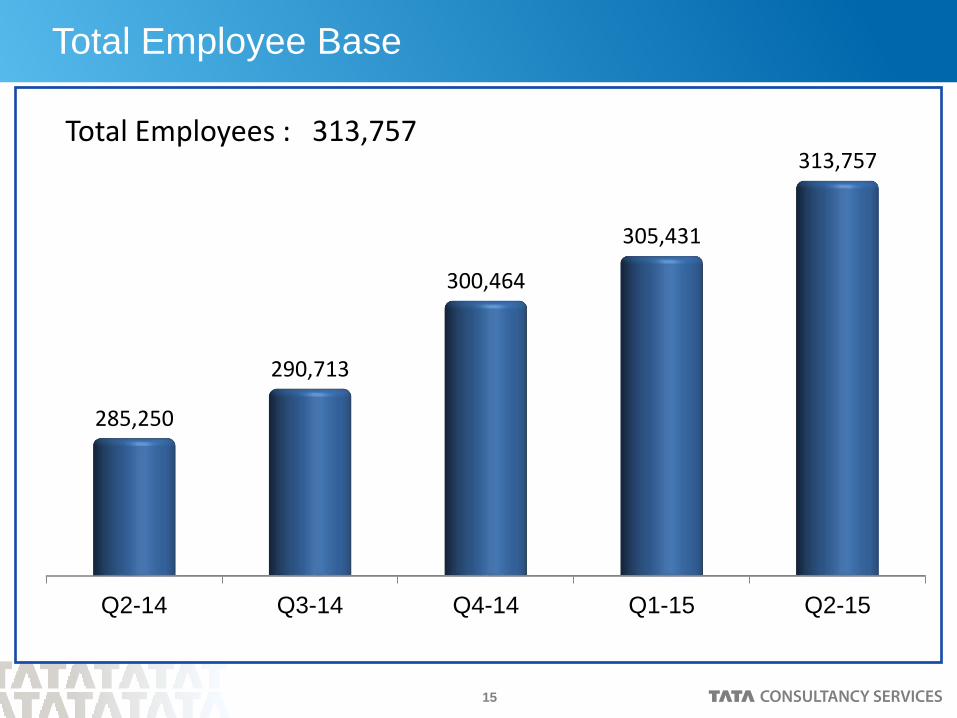
Total Employee Base
Q2-14 Q3-14 Q4-14 Q1-15 Q2-15
285,250
290,713
300,464
305,431
313,757 Total Employees : 313,757
16
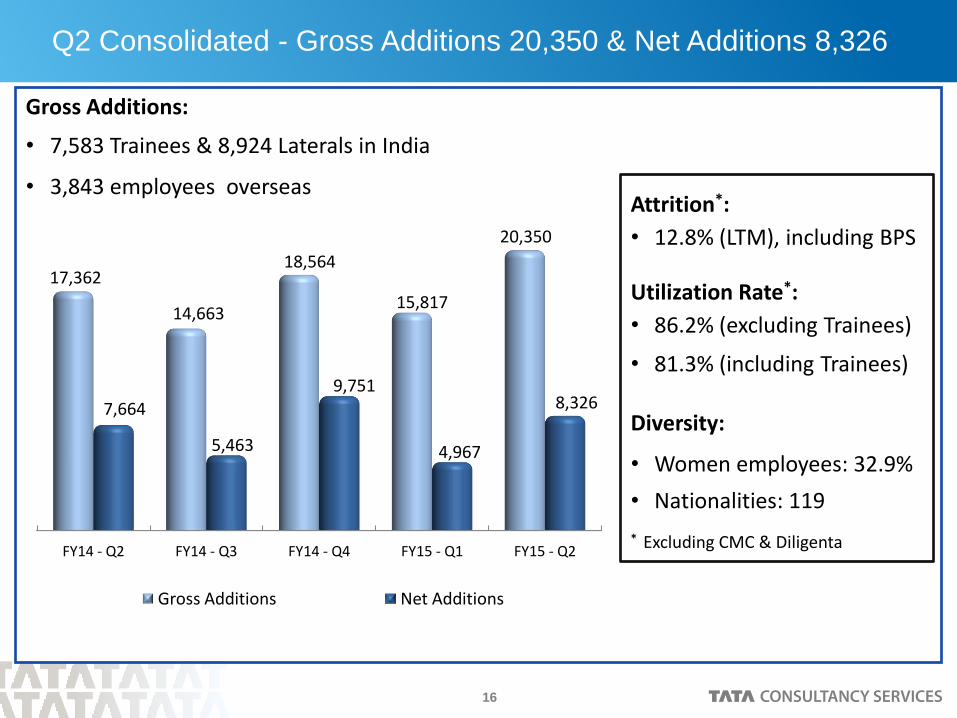
Q2 Consolidated - Gross Additions 20,350 & Net Additions 8,326
Gross Additions:
• 7,583 Trainees & 8,924 Laterals in India
• 3,843 employees overseas
FY14 - Q2 FY14 - Q3 FY14 - Q4 FY15 - Q1 FY15 - Q2
17,362
14,663
18,564
15,817
20,350
7,664
5,463
9,751
4,967
8,326
Gross Additions Net Additions
Attrition*:
• 12.8% (LTM), including BPS
Utilization Rate*:
• 86.2% (excluding Trainees)
• 81.3% (including Trainees)
Diversity:
• Women employees: 32.9%
• Nationalities: 119
* Excluding CMC & Diligenta
17
Click to edit Master title style Annexure
18
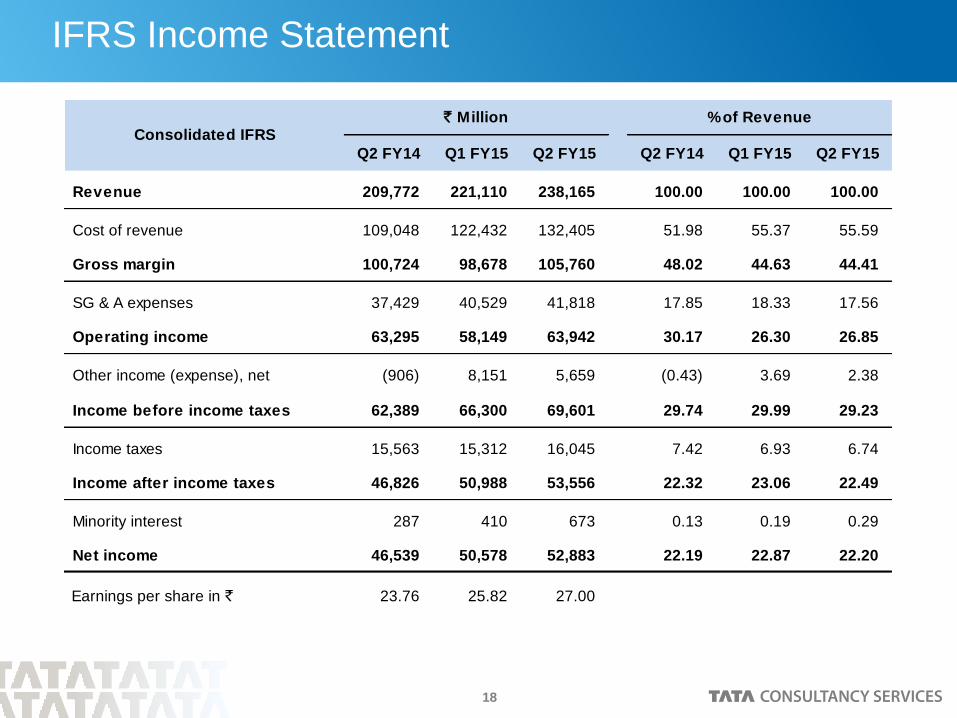
IFRS Income Statement
Q2 FY14 Q1 FY15 Q2 FY15 Q2 FY14 Q1 FY15 Q2 FY15
Revenue 209,772 221,110 238,165 100.00 100.00 100.00
Cost of revenue 109,048 122,432 132,405 51.98 55.37 55.59
Gross margin 100,724 98,678 105,760 48.02 44.63 44.41
SG & A expenses 37,429 40,529 41,818 17.85 18.33 17.56
Operating income 63,295 58,149 63,942 30.17 26.30 26.85
Other income (expense), net (906) 8,151 5,659 (0.43) 3.69 2.38
Income before income taxes 62,389 66,300 69,601 29.74 29.99 29.23
Income taxes 15,563 15,312 16,045 7.42 6.93 6.74
Income after income taxes 46,826 50,988 53,556 22.32 23.06 22.49
Minority interest 287 410 673 0.13 0.19 0.29
Net income 46,539 50,578 52,883 22.19 22.87 22.20
Earnings per share in ` 23.76 25.82 27.00
Consolidated IFRS` Million % of Revenue
19
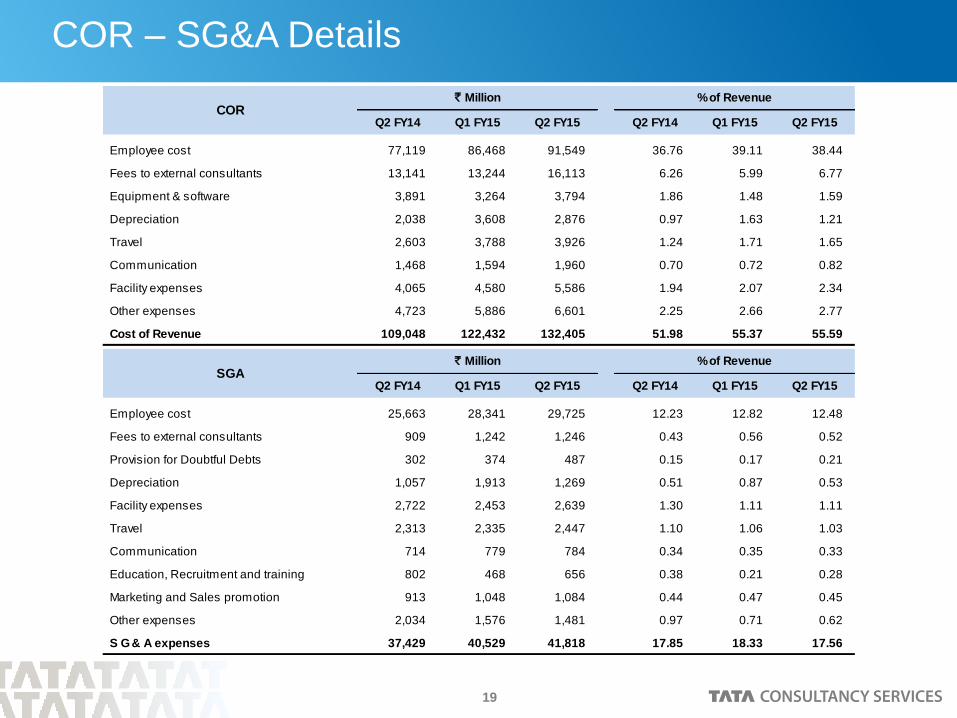
COR – SG&A Details
Q2 FY14 Q1 FY15 Q2 FY15 Q2 FY14 Q1 FY15 Q2 FY15
Employee cost 77,119 86,468 91,549 36.76 39.11 38.44
Fees to external consultants 13,141 13,244 16,113 6.26 5.99 6.77
Equipment & software 3,891 3,264 3,794 1.86 1.48 1.59
Depreciation 2,038 3,608 2,876 0.97 1.63 1.21
Travel 2,603 3,788 3,926 1.24 1.71 1.65
Communication 1,468 1,594 1,960 0.70 0.72 0.82
Facility expenses 4,065 4,580 5,586 1.94 2.07 2.34
Other expenses 4,723 5,886 6,601 2.25 2.66 2.77
Cost of Revenue 109,048 122,432 132,405 51.98 55.37 55.59
Q2 FY14 Q1 FY15 Q2 FY15 Q2 FY14 Q1 FY15 Q2 FY15
Employee cost 25,663 28,341 29,725 12.23 12.82 12.48
Fees to external consultants 909 1,242 1,246 0.43 0.56 0.52
Provision for Doubtful Debts 302 374 487 0.15 0.17 0.21
Depreciation 1,057 1,913 1,269 0.51 0.87 0.53
Facility expenses 2,722 2,453 2,639 1.30 1.11 1.11
Travel 2,313 2,335 2,447 1.10 1.06 1.03
Communication 714 779 784 0.34 0.35 0.33
Education, Recruitment and training 802 468 656 0.38 0.21 0.28
Marketing and Sales promotion 913 1,048 1,084 0.44 0.47 0.45
Other expenses 2,034 1,576 1,481 0.97 0.71 0.62
S G & A expenses 37,429 40,529 41,818 17.85 18.33 17.56
COR
SGA
` Million
` Million
% of Revenue
% of Revenue
20
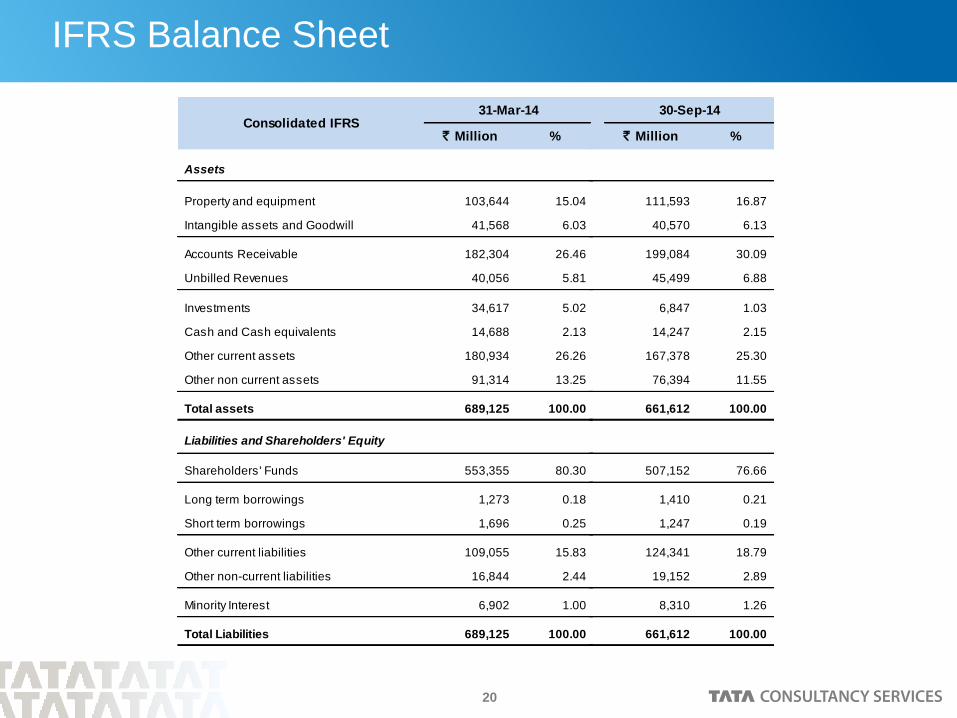
IFRS Balance Sheet
` Million %
Assets
Property and equipment 103,644 15.04
Intangible assets and Goodwill 41,568 6.03
Accounts Receivable 182,304 26.46
Unbilled Revenues 40,056 5.81
Investments 34,617 5.02
Cash and Cash equivalents 14,688 2.13
Other current assets 180,934 26.26
Other non current assets 91,314 13.25
Total assets 689,125 100.00
Liabilities and Shareholders' Equity
Shareholders' Funds 553,355 80.30
Long term borrowings 1,273 0.18
Short term borrowings 1,696 0.25
Other current liabilities 109,055 15.83
Other non-current liabilities 16,844 2.44
Minority Interest 6,902 1.00
Total Liabilities 689,125 100.00
Consolidated IFRS31-Mar-14
` Million %
111,593 16.87
40,570 6.13
199,084 30.09
45,499 6.88
6,847 1.03
14,247 2.15
167,378 25.30
76,394 11.55
661,612 100.00
507,152 76.66
1,410 0.21
1,247 0.19
124,341 18.79
19,152 2.89
8,310 1.26
661,612 100.00
30-Sep-14
21
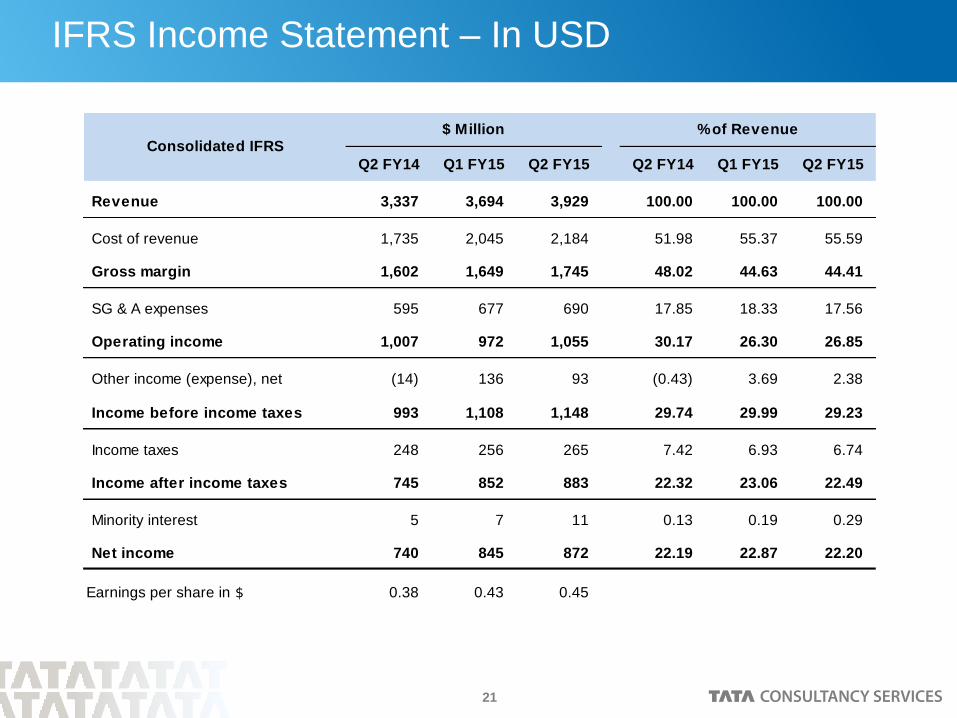
Q2 FY14 Q1 FY15 Q2 FY15 Q2 FY14 Q1 FY15 Q2 FY15
Revenue 3,337 3,694 3,929 100.00 100.00 100.00
Cost of revenue 1,735 2,045 2,184 51.98 55.37 55.59
Gross margin 1,602 1,649 1,745 48.02 44.63 44.41
SG & A expenses 595 677 690 17.85 18.33 17.56
Operating income 1,007 972 1,055 30.17 26.30 26.85
Other income (expense), net (14) 136 93 (0.43) 3.69 2.38
Income before income taxes 993 1,108 1,148 29.74 29.99 29.23
Income taxes 248 256 265 7.42 6.93 6.74
Income after income taxes 745 852 883 22.32 23.06 22.49
Minority interest 5 7 11 0.13 0.19 0.29
Net income 740 845 872 22.19 22.87 22.20
Earnings per share in $ 0.38 0.43 0.45
Consolidated IFRS$ Million % of Revenue
IFRS Income Statement – In USD
22
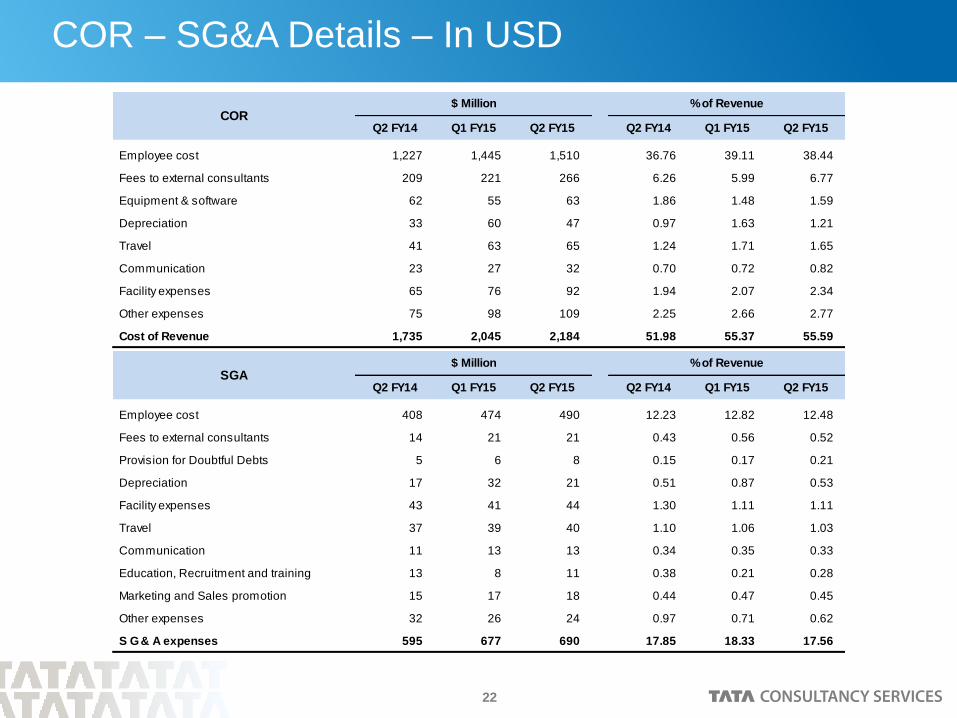
COR – SG&A Details – In USD
Q2 FY14 Q1 FY15 Q2 FY15 Q2 FY14 Q1 FY15 Q2 FY15
Employee cost 1,227 1,445 1,510 36.76 39.11 38.44
Fees to external consultants 209 221 266 6.26 5.99 6.77
Equipment & software 62 55 63 1.86 1.48 1.59
Depreciation 33 60 47 0.97 1.63 1.21
Travel 41 63 65 1.24 1.71 1.65
Communication 23 27 32 0.70 0.72 0.82
Facility expenses 65 76 92 1.94 2.07 2.34
Other expenses 75 98 109 2.25 2.66 2.77
Cost of Revenue 1,735 2,045 2,184 51.98 55.37 55.59
Q2 FY14 Q1 FY15 Q2 FY15 Q2 FY14 Q1 FY15 Q2 FY15
Employee cost 408 474 490 12.23 12.82 12.48
Fees to external consultants 14 21 21 0.43 0.56 0.52
Provision for Doubtful Debts 5 6 8 0.15 0.17 0.21
Depreciation 17 32 21 0.51 0.87 0.53
Facility expenses 43 41 44 1.30 1.11 1.11
Travel 37 39 40 1.10 1.06 1.03
Communication 11 13 13 0.34 0.35 0.33
Education, Recruitment and training 13 8 11 0.38 0.21 0.28
Marketing and Sales promotion 15 17 18 0.44 0.47 0.45
Other expenses 32 26 24 0.97 0.71 0.62
S G & A expenses 595 677 690 17.85 18.33 17.56
$ Million % of RevenueCOR
SGA$ Million % of Revenue
23
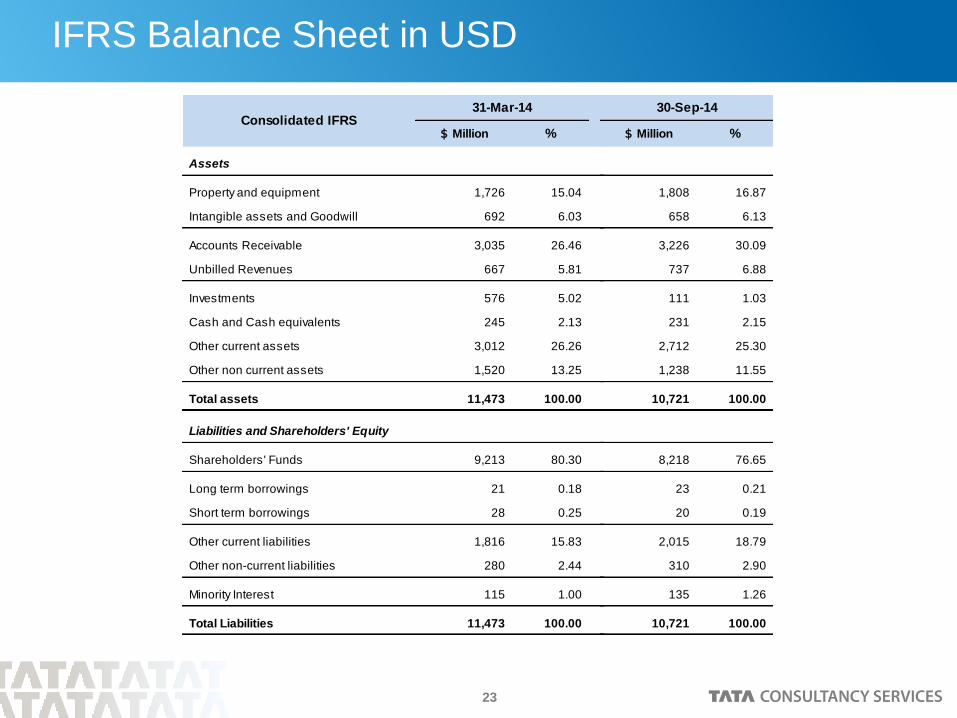
IFRS Balance Sheet in USD
$ Million %
Assets
Property and equipment 1,726 15.04
Intangible assets and Goodwill 692 6.03
Accounts Receivable 3,035 26.46
Unbilled Revenues 667 5.81
Investments 576 5.02
Cash and Cash equivalents 245 2.13
Other current assets 3,012 26.26
Other non current assets 1,520 13.25
Total assets 11,473 100.00
Liabilities and Shareholders' Equity
Shareholders' Funds 9,213 80.30
Long term borrowings 21 0.18
Short term borrowings 28 0.25
Other current liabilities 1,816 15.83
Other non-current liabilities 280 2.44
Minority Interest 115 1.00
Total Liabilities 11,473 100.00
31-Mar-14Consolidated IFRS
$ Million %
1,808 16.87
658 6.13
3,226 30.09
737 6.88
111 1.03
231 2.15
2,712 25.30
1,238 11.55
10,721 100.00
8,218 76.65
23 0.21
20 0.19
2,015 18.79
310 2.90
135 1.26
10,721 100.00
30-Sep-14
24
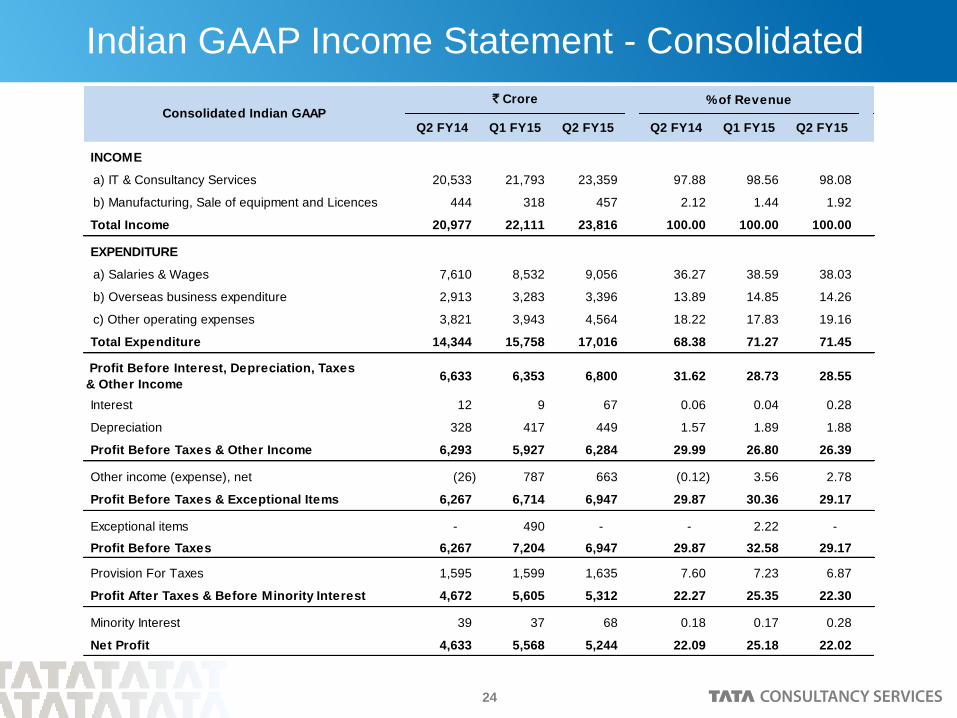
Indian GAAP Income Statement - Consolidated
Q2 FY14 Q1 FY15 Q2 FY15 Q2 FY14 Q1 FY15 Q2 FY15
INCOME
a) IT & Consultancy Services 20,533 21,793 23,359 97.88 98.56 98.08
b) Manufacturing, Sale of equipment and Licences 444 318 457 2.12 1.44 1.92
Total Income 20,977 22,111 23,816 100.00 100.00 100.00
EXPENDITURE
a) Salaries & Wages 7,610 8,532 9,056 36.27 38.59 38.03
b) Overseas business expenditure 2,913 3,283 3,396 13.89 14.85 14.26
c) Other operating expenses 3,821 3,943 4,564 18.22 17.83 19.16
Total Expenditure 14,344 15,758 17,016 68.38 71.27 71.45
Profit Before Interest, Depreciation, Taxes
& Other Income 6,633 6,353 6,800 31.62 28.73 28.55
Interest 12 9 67 0.06 0.04 0.28
Depreciation 328 417 449 1.57 1.89 1.88
Profit Before Taxes & Other Income 6,293 5,927 6,284 29.99 26.80 26.39
Other income (expense), net (26) 787 663 (0.12) 3.56 2.78
Profit Before Taxes & Exceptional Items 6,267 6,714 6,947 29.87 30.36 29.17
Exceptional items - 490 - - 2.22 -
Profit Before Taxes 6,267 7,204 6,947 29.87 32.58 29.17
Provision For Taxes 1,595 1,599 1,635 7.60 7.23 6.87
Profit After Taxes & Before Minority Interest 4,672 5,605 5,312 22.27 25.35 22.30
Minority Interest 39 37 68 0.18 0.17 0.28
Net Profit 4,633 5,568 5,244 22.09 25.18 22.02
Consolidated Indian GAAP ` Crore % of Revenue
25
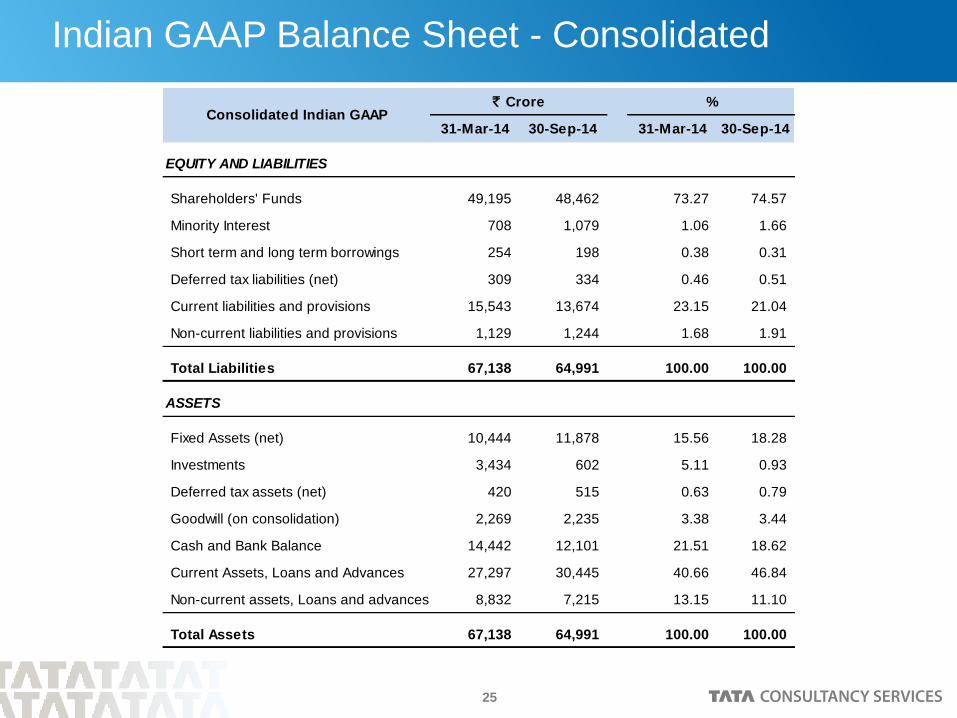
Indian GAAP Balance Sheet - Consolidated
31-Mar-14 30-Sep-14 31-Mar-14 30-Sep-14
EQUITY AND LIABILITIES
Shareholders' Funds 49,195 48,462 73.27 74.57
Minority Interest 708 1,079 1.06 1.66
Short term and long term borrowings 254 198 0.38 0.31
Deferred tax liabilities (net) 309 334 0.46 0.51
Current liabilities and provisions 15,543 13,674 23.15 21.04
Non-current liabilities and provisions 1,129 1,244 1.68 1.91
Total Liabilities 67,138 64,991 100.00 100.00
ASSETS
Fixed Assets (net) 10,444 11,878 15.56 18.28
Investments 3,434 602 5.11 0.93
Deferred tax assets (net) 420 515 0.63 0.79
Goodwill (on consolidation) 2,269 2,235 3.38 3.44
Cash and Bank Balance 14,442 12,101 21.51 18.62
Current Assets, Loans and Advances 27,297 30,445 40.66 46.84
Non-current assets, Loans and advances 8,832 7,215 13.15 11.10
Total Assets 67,138 64,991 100.00 100.00
Consolidated Indian GAAP%` Crore
26
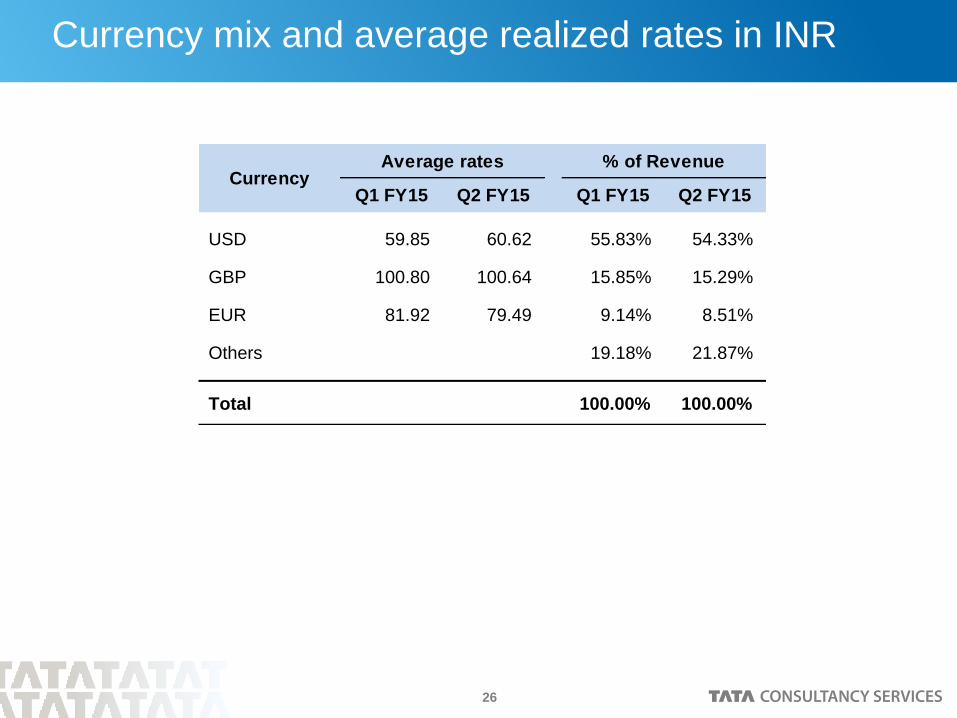
Currency mix and average realized rates in INR
Q1 FY15 Q2 FY15 Q1 FY15 Q2 FY15
USD 59.85 60.62 55.83% 54.33%
GBP 100.80 100.64 15.85% 15.29%
EUR 81.92 79.49 9.14% 8.51%
Others 19.18% 21.87%
Total 100.00% 100.00%
CurrencyAverage rates % of Revenue
Thank You
IT Services
Business Solutions
Consulting


