
Financial and Operating Results Supplementary Financial ...
32
` Financial and Operating Results Supplementary Financial Information Sun Life Financial Inc. (unaudited) For the period ended June 30, 2021
Transcript of Financial and Operating Results Supplementary Financial ...
`
Financial and Operating ResultsSupplementary Financial Information
Sun Life Financial Inc. (unaudited)For the period ended June 30, 2021
Page Page
Non-IFRS Financial Measures 1 Asset Management 16
Financial Highlights 2-3Asia 18
Consolidated Financial Statements Local Markets 19Statements of Operations 4 International Hubs 20Sources of Earnings 4
Corporate 21U.K. and Corporate Support 22
Statements of Equity and Capital 6 LICAT Ratio – Sun Life Assurance Company of Canada 6 InvestmentsDiluted Earnings per Share Reconciliation 7 Debt and Equity Securities 23
Properties, Mortgages & Loans and Derivatives 24Segmented Results (Business Groups & Associated Business Units) Sources of Earnings 25-26
Canada 8 Expenses Individual Insurance & Wealth 9 Operating Expenses, Commissions and Other Expenses 27 Group Benefits 10 Interest Expense 27 Group Retirement Services 11
Financial StrengthU.S. 12-13 Financial Strength and Debt Ratings 28 Group Benefits 14 In-Force Management 15 General Information 29
i
Statements of Financial Position 5
SUPPLEMENTARY FINANCIAL INFORMATIONTABLE OF CONTENTS
MFS 17
Reporting Changes
Effective January 1, 2021, the methodology for Assets Under Management (AUM) was updated for SLC Management with respect to certain real estate and investment-grade fixed income products to add uncalled capital commitments not previously included. This will align SLC Management's AUM with market conventions applied across asset classes. We have updated prior period amounts for all quarters of 2020 to reflect this change in methodology. Subsequent to the fourth quarter of 2020, increases and decreases in all capital raising, including uncalled capital commitments and fund leverage, for the aforementioned products will be reflected in gross flows, outflows and net flows as applicable. Gross flows is a component of managed fund sales and total wealth sales. Client distributions from the sale of underlying assets in closed-end funds will no longer be reported in net flows. Details can be found on pages 2, 3 and 16. Other changes reflect: (i) a change in Value of New Business (VNB) that reflects a change in the timing of recognition of U.S. group policies sold or renewed with an effective date of January 1, which will recognize VNB for these policies in the prior year rather than the first quarter, to align with the timing of U.S. renewals and reported insurance sales; and (ii) a change in Sources of Earnings presentation between expected profit on in-force business and the impact of new business for SLF U.S. Group Benefits, such that expected profit for U.S. group policies includes previously classified new business gains, aligning group business sources of earnings reporting across business groups.
Basis of Presentation
All amounts in this document are presented in millions of Canadian dollars unless otherwise indicated. Sun Life Financial Inc., together with its subsidiaries and joint ventures, are collectively referred to as “the Company”, “Sun Life”, “we”, “our” and “us”. We prepare our unaudited Interim Consolidated Financial Statements using International Financial Reporting Standards (“IFRS”), the accounting requirements of the Office of the Superintendent of Financial Institutions ("OSFI") and in accordance with the International Accounting Standard ("IAS") 34 Interim Financial Reporting . Reported net income (loss) refers to common shareholders' net income (loss) determined in accordance with IFRS.
Diluted Earnings per Share – UnderlyingUnder IFRS, diluted earnings per share (“EPS”) include the impact of dilution from the Sun Life ExchangEable Capital Securities ("SLEECS"). Diluted underlying EPS excludes the impact of these convertible securities. No adjustment is reflected for periods in which the SLEECS conversion would have caused an anti-dilutive result. Additional detail on the calculation of diluted EPS can be found on page 7.
Constant Currency MeasuresConstant currency measures are calculated using the average currency and period end rates, as appropriate, in effect in the comparable period. Constant currency measures are non-IFRS financial measures. See Use of Non-IFRS Financial Measures and Reconciliation of Non-IFRS Financial Measures in our interim Management's Discussion & Analysis ("MD&A") .
Other AdjustmentsAcquisition, Integration and Restructuring
In Q2 and Q1 2021, amounts relate to acquisition costs for the BentallGreenOak acquisition ("BGO acquisition"), the acquisition of InfraRed Capital Partners ("InfraRed acquisition"), and the Crescent Capital Group acquisition ("Crescent acquisition"), which include the unwinding of the discount for Other financial liabilities of $13 million post tax and $14 million post tax, respectively. There was also a restructuring charge of $57 million post tax in the first quarter of 2021 related to our strategy for our workspace and redefining the role of the office.
In Q1 2020, amounts include acquisition costs for the BGO acquisition, which includes the unwinding of the discount for the put option and deferred payments liability of $10 million post tax. As a result of various projects to simplify our organizational structure and drive efficiencies, we also recorded a restructuring charge of $28 million post tax and $20 million post tax in Q1 2020 and Q4 2020, respectively. Amounts also include acquisition costs for the BGO acquisition and InfraRed acquisition, which includes the unwinding of the discount for the put option and deferred payments liability of $11 million post tax in Q2 2020 and Q3 2020 and $15 million post tax in Q4 2020.
In Q1 2019, acquisition, integration and restructuring costs related to integration costs of the U.S. Employee Benefits business. In Q2 2019, acquisition, integration and restructuring costs included $5 million post tax acquisition costs relating to the merger of Bentall Kennedy and GreenOak. In Q3 2019, acquisition, integration and restructuring costs predominantly reflected acquisition costs in SLC Management related to the acquisition of a majority stake in BGO. In Q4 2019, acquisition, integration and restructuring costs included $16 million post tax in acquisition costs relating to our acquisition of a majority stake in BGO and InfraRed. As part of our focus on advancing our Client Strategy, we also recorded a restructuring charge of $25 million post tax in the fourth quarter of 2019, primarily related to severance costs, as a result of various intiatives to simplify our organizational structure and drive efficiencies.
Tax Rate ChangesOn June 10, 2021, the UK Finance Act was signed into law, increasing the corporate tax rate from 19% to 25%, which will take effect for future tax periods beginning April 1, 2023 ("UK Tax Rate Change"). As a result, reported net income decreased by $11 million in the second quarter, which was comprised of a loss of $21 million on the remeasurement of deferred tax liabilities in SLC Management in Asset Management, partially offset by a gain of $10 million from the remeasurement of deferred tax assets in the U.K. in Corporate. Refer to section C - Profitability - 5 - Income taxes in the Quarterly 2021 MD&A for additional details.
ii
Non-IFRS Financial MeasuresSun Life Financial Inc. ("Sun Life" or the “Company”,"we", "our" and "us") prepares annual and interim financial statements using IFRS. We report certain financial information that are not based on IFRS (“non-IFRS financial measures”), as we believe that these measures provide information that is useful to investors in understanding our performance and facilitate a comparison of our quarterly and full year results from period to period. Non-IFRS financial measures do not have any standardized meaning and may not be comparable with similar measures used by other companies. For certain non-IFRS financial measures, there are no directly comparable amounts under IFRS. Non-IFRS financial measures should not be viewed in isolation from or as alternatives to measures of financial performance determined in accordance with IFRS. Additional information concerning non-IFRS financial measures and reconciliations to the closest IFRS measures are included in the Company’s annual and interim MD&A and the Supplementary Financial Information packages that are available on www.sunlife.com under Investors – Financial results and reports.
Underlying net income (loss) and financial measures based on underlying net income (loss), including underlying EPS or underlying loss per share, and underlying return on equity ("ROE"), are non-IFRS financial measures. Underlying net income (loss) removes from reported net income (loss) the impacts of the following items in our results under IFRS and when removed assist in explaining our results from period to period: (a) market-related impacts that differ from our best estimate assumptions, which include: (i) impacts of returns in equity markets, net of hedging, for which our best estimate assumptions are approximately 2% per quarter. This also includes the impact of the basis risk inherent in our hedging program, which is the difference between the return on underlying funds of products that provide benefit guarantees and the return on the derivative assets used to hedge those benefit guarantees; (ii) the impacts of changes in interest rates in the reporting period and on the value of derivative instruments used in our hedging programs including changes in credit and swap spreads, and any changes to the assumed fixed income reinvestment rates in determining the actuarial liabilities; and (iii) the impacts of changes in the fair value of investment properties in the reporting period; (b) assumption changes and management actions, which include: (i) the impacts of revisions to the methods and assumptions used in determining our liabilities for insurance contracts and investment contracts; and (ii) the impacts on insurance contracts and investment contracts of actions taken by management in the current reporting period, referred to as management actions which include, for example, changes in the prices of in-force products, new or revised reinsurance on in-force business, and material changes to investment policies for assets supporting our liabilities; and (c) other adjustments, which include: (i) certain hedges in Canada that do not qualify for hedge accounting - this adjustment enhances the comparability of our net income from period to period, as it reduces volatility to the extent it will be offset over the duration of the hedges; (ii) fair value adjustments on MFS's share-based payment awards that are settled with MFS’s own shares and accounted for as liabilities and measured at fair value each reporting period until they are vested, exercised and repurchased - this adjustment enhances the comparability of MFS’s results with publicly traded asset managers in the United States; (iii) acquisition, integration and restructuring costs; and (iv) other items that are unusual or exceptional in nature. All factors discussed in this document that impact our underlying net income are also applicable to reported net income. All EPS measures in this document refer to fully diluted EPS, unless otherwise stated. Underlying EPS exclude the dilutive impacts of convertible instruments.
Sun Life uses the following non-IFRS financial measures: (1) ROE. IFRS does not prescribe the calculation of ROE and therefore a comparable measure under IFRS is not available. To determine reported ROE and underlying ROE, respectively, reported net income (loss) and underlying net income (loss) is divided by the total weighted average common shareholders’ equity for the period and the quarterly ROE is annualized; (2) Financial leverage ratio. This total debt to total capital ratio is a ratio of debt plus preferred shares and other equity instruments to total capital, where debt consists of all capital qualifying debt securities, which represent subordinated debt and innovative capital instruments;(3) Dividend payout ratio. This is the ratio of dividends paid per share to diluted reported and underlying EPS, respectively, for the period;(4) Value of New Business (“VNB”). VNB represents the present value of our best estimate of future distributable earnings, net of the cost of capital, from new business contracts written in a particular time period, except new business in our Asset Management pillar. The assumptions used in the calculations are generally consistent with those used in the valuation of our insurance contract liabilities except that discount rates used approximate theoretical return expectations of an equity investor. Capital required is based on the higher of Sun Life Assurance's Life Insurance Capital Adequacy Test ("LICAT") operating target and local (country specific) operating target capital. VNB is a useful metric to evaluate the present value created from new business contracts. There is no directly comparable IFRS measure;(5) Pre-tax net operating profit margin ratio for MFS. This ratio is a measure of the profitability of MFS, which excludes the impact of fair value adjustments on MFS’s share-based payment awards, investment income and certain commission expenses that are offsetting. These commission expenses are excluded in order to neutralize the impact these items have on the pre-tax net operating profit margin ratio and have no impact on the profitability of MFS. There is no directly comparable IFRS measure;
(6) Pre-tax gross operating profit margin ratio for MFS. This ratio excludes the impact of fair value adjustments on MFS’s share-based payment awards and investment income. There is no directly comparable IFRS measure;
(7) After-tax profit margin for U.S. Group Benefits. This ratio assists in explaining our results from period to period and is a measure of profitability that expresses U.S. employee benefits and medical stop-loss underlying net income (loss) as a percentage of net premiums. This ratio is calculated by dividing underlying net income (loss) by net premiums for the trailing four quarters. There is no directly comparable IFRS measure; and
(8) Impact of foreign exchange translation. Several IFRS and non-IFRS financial measures are presented on a constant currency adjusted basis to exclude the impacts of foreign exchange translation. These measures are calculated using the average or period end foreign exchange rates, as appropriate, in effect at the date of the comparative period.
Sun Life also uses the following non-IFRS financial measures for which there are no comparable financial measures in IFRS:(1) administrative services only (“ASO”) premium and deposit equivalents, mutual fund sales, managed fund sales, individual insurance sales, group insurance sales and total premiums and deposits; (2) assets under management (“AUM”), mutual fund assets, managed fund assets, other AUM, and assets under management and under administration; and(3) MFS pro forma diluted EPS impact, which illustrates the impact on the Company's diluted earnings per share for the period assuming the MFS liability for share-based compensation is settled in the shares of Sun Life.
Sources of EarningsSources of earnings is an alternative presentation of our Consolidated Statements of Operations that identifies and quantifies various sources of income. The Company is required to disclose its sources of earnings by its principal regulator, the Office of the Superintendent of Financial Institutions.
Sun Life 1
2020 2019 2018Q2 Q1 Q4 Q3 Q2 Q1 Q4 Q3 Q2
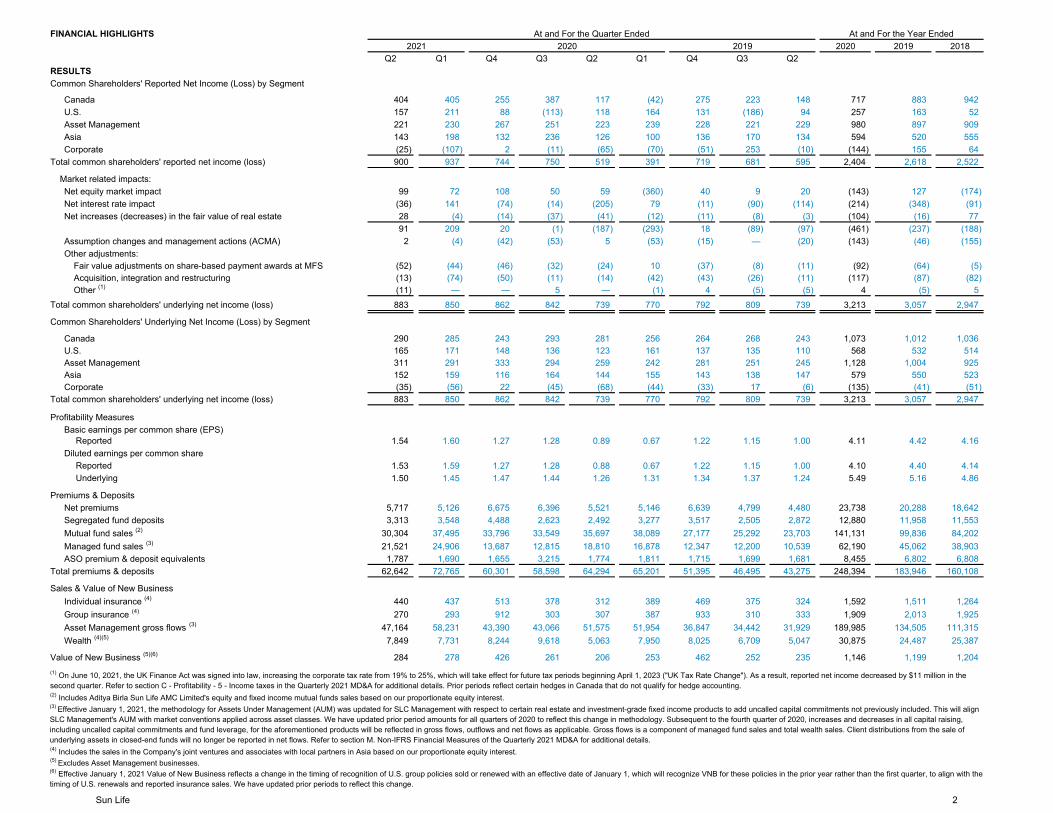
404 405 255 387 117 (42) 275 223 148 717 883 942157 211 88 (113) 118 164 131 (186) 94 257 163 52221 230 267 251 223 239 228 221 229 980 897 909143 198 132 236 126 100 136 170 134 594 520 555(25) (107) 2 (11) (65) (70) (51) 253 (10) (144) 155 64900 937 744 750 519 391 719 681 595 2,404 2,618 2,522
99 72 108 50 59 (360) 40 9 20 (143) 127 (174)(36) 141 (74) (14) (205) 79 (11) (90) (114) (214) (348) (91)28 (4) (14) (37) (41) (12) (11) (8) (3) (104) (16) 7791 209 20 (1) (187) (293) 18 (89) (97) (461) (237) (188)
2 (4) (42) (53) 5 (53) (15) — (20) (143) (46) (155)
(52) (44) (46) (32) (24) 10 (37) (8) (11) (92) (64) (5)(13) (74) (50) (11) (14) (42) (43) (26) (11) (117) (87) (82)(11) — — 5 — (1) 4 (5) (5) 4 (5) 5883 850 862 842 739 770 792 809 739 3,213 3,057 2,947
290 285 243 293 281 256 264 268 243 1,073 1,012 1,036165 171 148 136 123 161 137 135 110 568 532 514311 291 333 294 259 242 281 251 245 1,128 1,004 925152 159 116 164 144 155 143 138 147 579 550 523(35) (56) 22 (45) (68) (44) (33) 17 (6) (135) (41) (51)883 850 862 842 739 770 792 809 739 3,213 3,057 2,947
Reported 1.54 1.60 1.27 1.28 0.89 0.67 1.22 1.15 1.00 4.11 4.42 4.16
Reported 1.53 1.59 1.27 1.28 0.88 0.67 1.22 1.15 1.00 4.10 4.40 4.14Underlying 1.50 1.45 1.47 1.44 1.26 1.31 1.34 1.37 1.24 5.49 5.16 4.86
5,717 5,126 6,675 6,396 5,521 5,146 6,639 4,799 4,480 23,738 20,288 18,6423,313 3,548 4,488 2,623 2,492 3,277 3,517 2,505 2,872 12,880 11,958 11,553
30,304 37,495 33,796 33,549 35,697 38,089 27,177 25,292 23,703 141,131 99,836 84,20221,521 24,906 13,687 12,815 18,810 16,878 12,347 12,200 10,539 62,190 45,062 38,903
1,787 1,690 1,655 3,215 1,774 1,811 1,715 1,699 1,681 8,455 6,802 6,80862,642 72,765 60,301 58,598 64,294 65,201 51,395 46,495 43,275 248,394 183,946 160,108
440 437 513 378 312 389 469 375 324 1,592 1,511 1,264270 293 912 303 307 387 933 310 333 1,909 2,013 1,925
47,164 58,231 43,390 43,066 51,575 51,954 36,847 34,442 31,929 189,985 134,505 111,3157,849 7,731 8,244 9,618 5,063 7,950 8,025 6,709 5,047 30,875 24,487 25,387
284 278 426 261 206 253 462 252 235 1,146 1,199 1,204(1) On June 10, 2021, the UK Finance Act was signed into law, increasing the corporate tax rate from 19% to 25%, which will take effect for future tax periods beginning April 1, 2023 ("UK Tax Rate Change"). As a result, reported net income decreased by $11 million in the second quarter. Refer to section C - Profitability - 5 - Income taxes in the Quarterly 2021 MD&A for additional details. Prior periods reflect certain hedges in Canada that do not qualify for hedge accounting.
(6) Effective January 1, 2021 Value of New Business reflects a change in the timing of recognition of U.S. group policies sold or renewed with an effective date of January 1, which will recognize VNB for these policies in the prior year rather than the first quarter, to align with the timing of U.S. renewals and reported insurance sales. We have updated prior periods to reflect this change.
At and For the Year Ended
Asia Asset Management U.S. Canada
Common Shareholders' Reported Net Income (Loss) by SegmentRESULTS
2020At and For the Quarter Ended
Total common shareholders' reported net income (loss)Corporate
2019
Assumption changes and management actions (ACMA)
Group insurance (4)
(5) Excludes Asset Management businesses.
(4) Includes the sales in the Company's joint ventures and associates with local partners in Asia based on our proportionate equity interest.
Common Shareholders' Underlying Net Income (Loss) by Segment
CanadaU.S.Asset ManagementAsiaCorporate
Total common shareholders' underlying net income (loss)
Wealth (4)(5)
Value of New Business (5)(6)
Total premiums & deposits
Sales & Value of New BusinessIndividual insurance (4)
Total common shareholders' underlying net income (loss)
FINANCIAL HIGHLIGHTS
Market related impacts:
Net increases (decreases) in the fair value of real estateNet interest rate impactNet equity market impact
2021
Other (1)
(3) Effective January 1, 2021, the methodology for Assets Under Management (AUM) was updated for SLC Management with respect to certain real estate and investment-grade fixed income products to add uncalled capital commitments not previously included. This will align SLC Management's AUM with market conventions applied across asset classes. We have updated prior period amounts for all quarters of 2020 to reflect this change in methodology. Subsequent to the fourth quarter of 2020, increases and decreases in all capital raising, including uncalled capital commitments and fund leverage, for the aforementioned products will be reflected in gross flows, outflows and net flows as applicable. Gross flows is a component of managed fund sales and total wealth sales. Client distributions from the sale of underlying assets in closed-end funds will no longer be reported in net flows. Refer to section M. Non-IFRS Financial Measures of the Quarterly 2021 MD&A for additional details.
Profitability Measures
(2) Includes Aditya Birla Sun Life AMC Limited's equity and fixed income mutual funds sales based on our proportionate equity interest.
Fair value adjustments on share-based payment awards at MFSAcquisition, integration and restructuring
Other adjustments:
ASO premium & deposit equivalents
Premiums & DepositsNet premiumsSegregated fund depositsMutual fund sales (2)
Asset Management gross flows (3)
Basic earnings per common share (EPS)
Diluted earnings per common share
Managed fund sales (3)
Sun Life 2
2020 2019 2018Q2 Q1 Q4 Q3 Q2 Q1 Q4 Q3 Q2
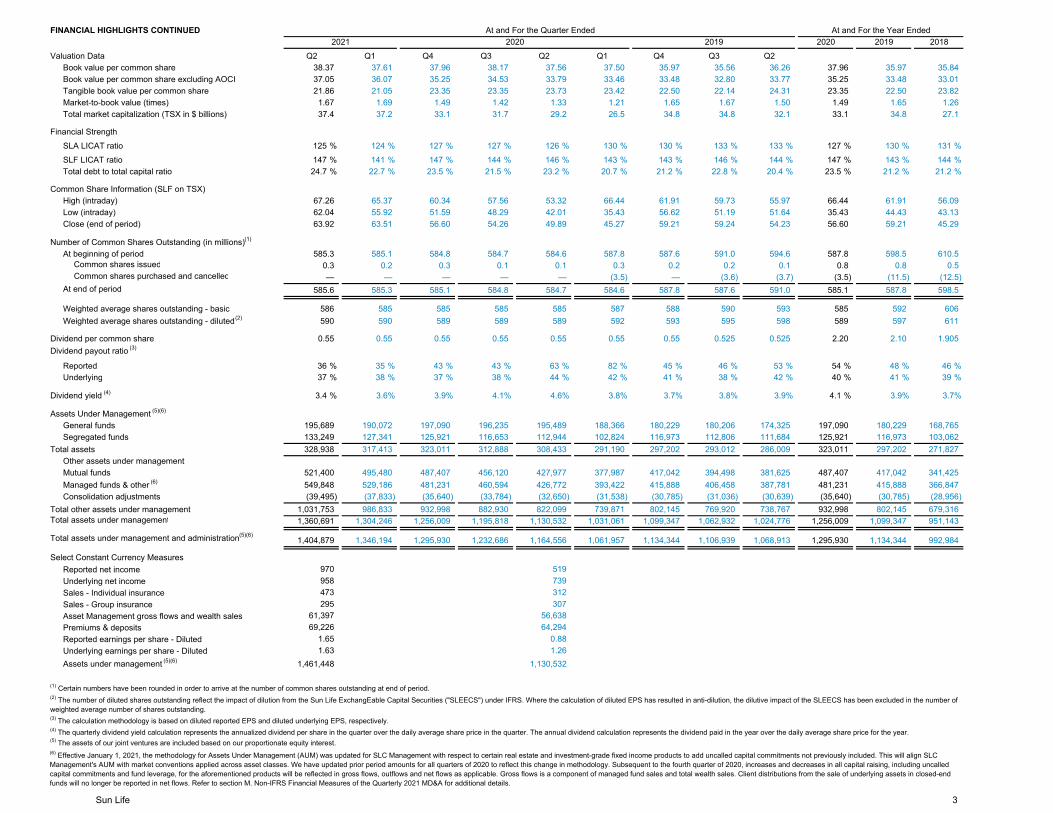
38.37 37.61 37.96 38.17 37.56 37.50 35.97 35.56 36.26 37.96 35.97 35.8437.05 36.07 35.25 34.53 33.79 33.46 33.48 32.80 33.77 35.25 33.48 33.0121.86 21.05 23.35 23.35 23.73 23.42 22.50 22.14 24.31 23.35 22.50 23.82
1.67 1.69 1.49 1.42 1.33 1.21 1.65 1.67 1.50 1.49 1.65 1.2637.4 37.2 33.1 31.7 29.2 26.5 34.8 34.8 32.1 33.1 34.8 27.1
125 % 124 % 127 % 127 % 126 % 130 % 130 % 133 % 133 % 127 % 130 % 131 %147 % 141 % 147 % 144 % 146 % 143 % 143 % 146 % 144 % 147 % 143 % 144 %24.7 % 22.7 % 23.5 % 21.5 % 23.2 % 20.7 % 21.2 % 22.8 % 20.4 % 23.5 % 21.2 % 21.2 %
67.26 65.37 60.34 57.56 53.32 66.44 61.91 59.73 55.97 66.44 61.91 56.0962.04 55.92 51.59 48.29 42.01 35.43 56.62 51.19 51.64 35.43 44.43 43.1363.92 63.51 56.60 54.26 49.89 45.27 59.21 59.24 54.23 56.60 59.21 45.29
585.3 585.1 584.8 584.7 584.6 587.8 587.6 591.0 594.6 587.8 598.5 610.5 Common shares issued 0.3 0.2 0.3 0.1 0.1 0.3 0.2 0.2 0.1 0.8 0.8 0.5 Common shares purchased and cancelled — — — — — (3.5) — (3.6) (3.7) (3.5) (11.5) (12.5)
585.6 585.3 585.1 584.8 584.7 584.6 587.8 587.6 591.0 585.1 587.8 598.5
586 585 585 585 585 587 588 590 593 585 592 606 590 590 589 589 589 592 593 595 598 589 597 611
0.55 0.55 0.55 0.55 0.55 0.55 0.55 0.525 0.525 2.20 2.10 1.905
36 % 35 % 43 % 43 % 63 % 82 % 45 % 46 % 53 % 54 % 48 % 46 %Underlying 37 % 38 % 37 % 38 % 44 % 42 % 41 % 38 % 42 % 40 % 41 % 39 %
3.4 % 3.6% 3.9% 4.1% 4.6% 3.8% 3.7% 3.8% 3.9% 4.1 % 3.9% 3.7%
195,689 190,072 197,090 196,235 195,489 188,366 180,229 180,206 174,325 197,090 180,229 168,765133,249 127,341 125,921 116,653 112,944 102,824 116,973 112,806 111,684 125,921 116,973 103,062328,938 317,413 323,011 312,888 308,433 291,190 297,202 293,012 286,009 323,011 297,202 271,827
521,400 495,480 487,407 456,120 427,977 377,987 417,042 394,498 381,625 487,407 417,042 341,425549,848 529,186 481,231 460,594 426,772 393,422 415,888 406,458 387,781 481,231 415,888 366,847(39,495) (37,833) (35,640) (33,784) (32,650) (31,538) (30,785) (31,036) (30,639) (35,640) (30,785) (28,956)
1,031,753 986,833 932,998 882,930 822,099 739,871 802,145 769,920 738,767 932,998 802,145 679,3161,360,691 1,304,246 1,256,009 1,195,818 1,130,532 1,031,061 1,099,347 1,062,932 1,024,776 1,256,009 1,099,347 951,143
Total assets under management and administration (5)(6)1,404,879 1,346,194 1,295,930 1,232,686 1,164,556 1,061,957 1,134,344 1,106,939 1,068,913 1,295,930 1,134,344 992,984
970 519958 739473 312295 307
61,397 56,63869,226 64,294
1.65 0.881.63 1.26
1,461,448 1,130,532
2020
Mutual funds
Consolidation adjustmentsTotal other assets under management Total assets under management
Other assets under managementTotal assets
Total debt to total capital ratio
Low (intraday)Close (end of period)
2021
(3) The calculation methodology is based on diluted reported EPS and diluted underlying EPS, respectively.
Market-to-book value (times)Total market capitalization (TSX in $ billions)
Financial Strength
Dividend per common share
At and For the Year Ended
(1) Certain numbers have been rounded in order to arrive at the number of common shares outstanding at end of period.(2) The number of diluted shares outstanding reflect the impact of dilution from the Sun Life ExchangEable Capital Securities ("SLEECS") under IFRS. Where the calculation of diluted EPS has resulted in anti-dilution, the dilutive impact of the SLEECS has been excluded in the number of weighted average number of shares outstanding.
Dividend yield (4)
Managed funds & other (6)
Select Constant Currency Measures
Reported earnings per share - Diluted
Assets under management (5)(6)
At and For the Quarter Ended
Reported net income
Sales - Individual insuranceSales - Group insuranceAsset Management gross flows and wealth sales
General fundsSegregated funds
Valuation DataBook value per common shareBook value per common share excluding AOCI
Assets Under Management (5)(6)
2019FINANCIAL HIGHLIGHTS CONTINUED
Tangible book value per common share
Reported
SLA LICAT ratio
(6) Effective January 1, 2021, the methodology for Assets Under Management (AUM) was updated for SLC Management with respect to certain real estate and investment-grade fixed income products to add uncalled capital commitments not previously included. This will align SLC Management's AUM with market conventions applied across asset classes. We have updated prior period amounts for all quarters of 2020 to reflect this change in methodology. Subsequent to the fourth quarter of 2020, increases and decreases in all capital raising, including uncalled capital commitments and fund leverage, for the aforementioned products will be reflected in gross flows, outflows and net flows as applicable. Gross flows is a component of managed fund sales and total wealth sales. Client distributions from the sale of underlying assets in closed-end funds will no longer be reported in net flows. Refer to section M. Non-IFRS Financial Measures of the Quarterly 2021 MD&A for additional details.
Number of Common Shares Outstanding (in millions) (1)
SLF LICAT ratio
High (intraday)Common Share Information (SLF on TSX)
Dividend payout ratio (3)
Weighted average shares outstanding - diluted (2)Weighted average shares outstanding - basic
At end of period
At beginning of period
Underlying earnings per share - Diluted
Underlying net income
(4) The quarterly dividend yield calculation represents the annualized dividend per share in the quarter over the daily average share price in the quarter. The annual dividend calculation represents the dividend paid in the year over the daily average share price for the year.
Premiums & deposits
(5) The assets of our joint ventures are included based on our proportionate equity interest.
Sun Life 3
2020 2019 2018Q2 Q1 Q4 Q3 Q2 Q1 Q4 Q3 Q2
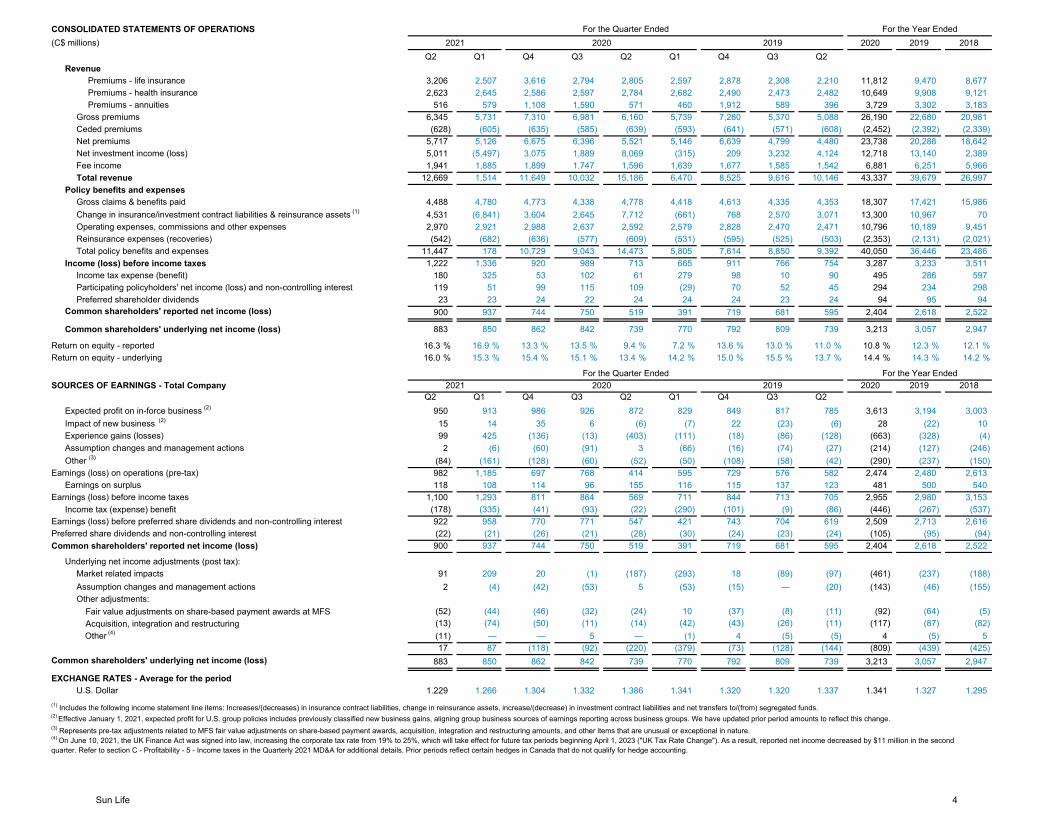
3,206 2,507 3,616 2,794 2,805 2,597 2,878 2,308 2,210 11,812 9,470 8,6772,623 2,645 2,586 2,597 2,784 2,682 2,490 2,473 2,482 10,649 9,908 9,121
516 579 1,108 1,590 571 460 1,912 589 396 3,729 3,302 3,1836,345 5,731 7,310 6,981 6,160 5,739 7,280 5,370 5,088 26,190 22,680 20,981(628) (605) (635) (585) (639) (593) (641) (571) (608) (2,452) (2,392) (2,339)
5,717 5,126 6,675 6,396 5,521 5,146 6,639 4,799 4,480 23,738 20,288 18,6425,011 (5,497) 3,075 1,889 8,069 (315) 209 3,232 4,124 12,718 13,140 2,3891,941 1,885 1,899 1,747 1,596 1,639 1,677 1,585 1,542 6,881 6,251 5,966
12,669 1,514 11,649 10,032 15,186 6,470 8,525 9,616 10,146 43,337 39,679 26,997
4,488 4,780 4,773 4,338 4,778 4,418 4,613 4,335 4,353 18,307 17,421 15,9864,531 (6,841) 3,604 2,645 7,712 (661) 768 2,570 3,071 13,300 10,967 702,970 2,921 2,988 2,637 2,592 2,579 2,828 2,470 2,471 10,796 10,189 9,451(542) (682) (636) (577) (609) (531) (595) (525) (503) (2,353) (2,131) (2,021)
11,447 178 10,729 9,043 14,473 5,805 7,614 8,850 9,392 40,050 36,446 23,4861,222 1,336 920 989 713 665 911 766 754 3,287 3,233 3,511
180 325 53 102 61 279 98 10 90 495 286 597119 51 99 115 109 (29) 70 52 45 294 234 29823 23 24 22 24 24 24 23 24 94 95 94
900 937 744 750 519 391 719 681 595 2,404 2,618 2,522
883 850 862 842 739 770 792 809 739 3,213 3,057 2,947
16.3 % 16.9 % 13.3 % 13.5 % 9.4 % 7.2 % 13.6 % 13.0 % 11.0 % 10.8 % 12.3 % 12.1 %16.0 % 15.3 % 15.4 % 15.1 % 13.4 % 14.2 % 15.0 % 15.5 % 13.7 % 14.4 % 14.3 % 14.2 %
2020 2019 2018Q2 Q1 Q4 Q3 Q2 Q1 Q4 Q3 Q2
950 913 986 926 872 829 849 817 785 3,613 3,194 3,00315 14 35 6 (6) (7) 22 (23) (6) 28 (22) 1099 425 (136) (13) (403) (111) (18) (86) (128) (663) (328) (4)2 (6) (60) (91) 3 (66) (16) (74) (27) (214) (127) (246)
(84) (161) (128) (60) (52) (50) (108) (58) (42) (290) (237) (150)982 1,185 697 768 414 595 729 576 582 2,474 2,480 2,613118 108 114 96 155 116 115 137 123 481 500 540
1,100 1,293 811 864 569 711 844 713 705 2,955 2,980 3,153(178) (335) (41) (93) (22) (290) (101) (9) (86) (446) (267) (537)922 958 770 771 547 421 743 704 619 2,509 2,713 2,616(22) (21) (26) (21) (28) (30) (24) (23) (24) (105) (95) (94)900 937 744 750 519 391 719 681 595 2,404 2,618 2,522
91 209 20 (1) (187) (293) 18 (89) (97) (461) (237) (188)2 (4) (42) (53) 5 (53) (15) — (20) (143) (46) (155)
(52) (44) (46) (32) (24) 10 (37) (8) (11) (92) (64) (5)(13) (74) (50) (11) (14) (42) (43) (26) (11) (117) (87) (82)(11) — — 5 — (1) 4 (5) (5) 4 (5) 517 87 (118) (92) (220) (379) (73) (128) (144) (809) (439) (425)
883 850 862 842 739 770 792 809 739 3,213 3,057 2,947
1.229 1.266 1.304 1.332 1.386 1.341 1.320 1.320 1.337 1.341 1.327 1.295
Gross premiums
Total revenuePolicy benefits and expenses
Total policy benefits and expenses
Gross claims & benefits paidChange in insurance/investment contract liabilities & reinsurance assets (1)
CONSOLIDATED STATEMENTS OF OPERATIONS(C$ millions)
Revenue
For the Quarter Ended20192020
Earnings (loss) before preferred share dividends and non-controlling interest
EXCHANGE RATES - Average for the period
(2) Effective January 1, 2021, expected profit for U.S. group policies includes previously classified new business gains, aligning group business sources of earnings reporting across business groups. We have updated prior period amounts to reflect this change.(3) Represents pre-tax adjustments related to MFS fair value adjustments on share-based payment awards, acquisition, integration and restructuring amounts, and other items that are unusual or exceptional in nature.
U.S. Dollar
Acquisition, integration and restructuringFair value adjustments on share-based payment awards at MFS
Common shareholders' reported net income (loss)
Underlying net income adjustments (post tax):
(1) Includes the following income statement line items: Increases/(decreases) in insurance contract liabilities, change in reinsurance assets, increase/(decrease) in investment contract liabilities and net transfers to/(from) segregated funds.
Assumption changes and management actions
Common shareholders' underlying net income (loss)
Other (4)
(4) On June 10, 2021, the UK Finance Act was signed into law, increasing the corporate tax rate from 19% to 25%, which will take effect for future tax periods beginning April 1, 2023 ("UK Tax Rate Change"). As a result, reported net income decreased by $11 million in the second quarter. Refer to section C - Profitability - 5 - Income taxes in the Quarterly 2021 MD&A for additional details. Prior periods reflect certain hedges in Canada that do not qualify for hedge accounting.
SOURCES OF EARNINGS - Total Company
Fee income
Income (loss) before income taxesIncome tax expense (benefit)
Operating expenses, commissions and other expensesReinsurance expenses (recoveries)
Preferred shareholder dividendsCommon shareholders' reported net income (loss)
Expected profit on in-force business (2)
Impact of new business (2)
Other adjustments:
Experience gains (losses)
Other (3)
Market related impacts
Assumption changes and management actions
Preferred share dividends and non-controlling interest
Earnings (loss) before income taxesEarnings on surplus
Income tax (expense) benefit
Earnings (loss) on operations (pre-tax)
Ceded premiumsNet premiumsNet investment income (loss)
Premiums - life insurancePremiums - health insurancePremiums - annuities
For the Year Ended2021
Common shareholders' underlying net income (loss)
Return on equity - reported
Participating policyholders' net income (loss) and non-controlling interest
For the Quarter Ended2019
For the Year Ended
Return on equity - underlying
20202021
Sun Life 4
2020 2019 2018Q2 Q1 Q4 Q3 Q2 Q1 Q4 Q3 Q2
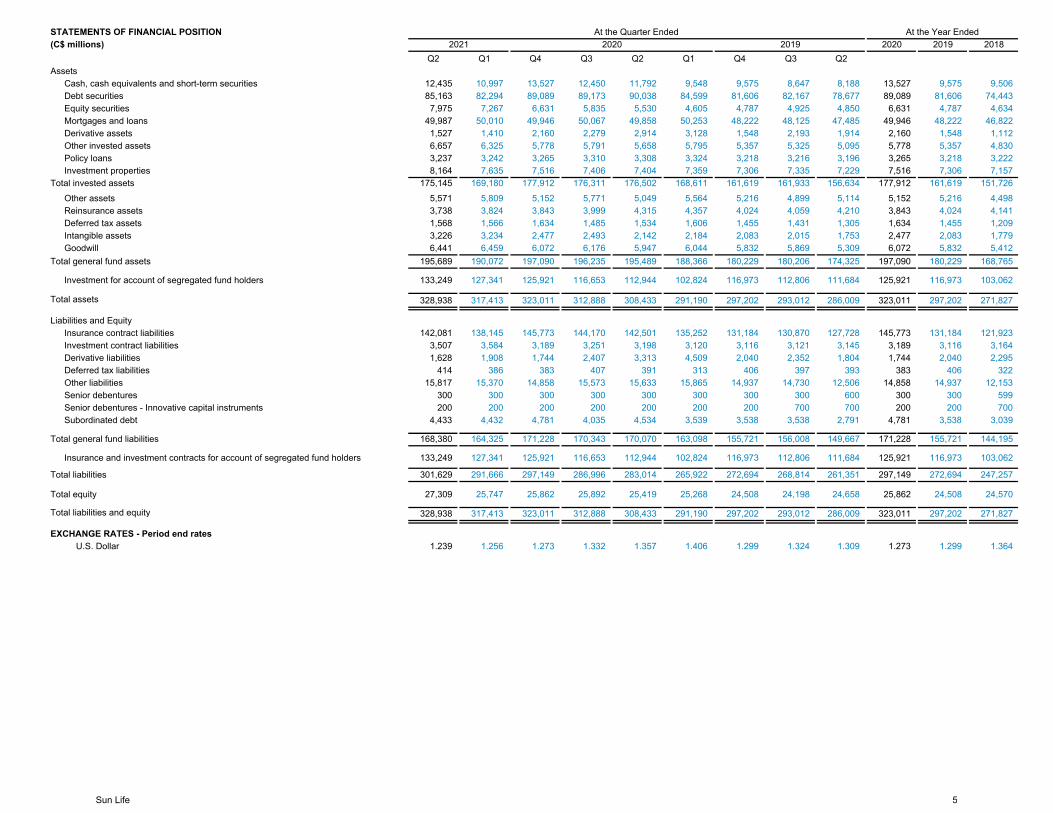
12,435 10,997 13,527 12,450 11,792 9,548 9,575 8,647 8,188 13,527 9,575 9,50685,163 82,294 89,089 89,173 90,038 84,599 81,606 82,167 78,677 89,089 81,606 74,4437,975 7,267 6,631 5,835 5,530 4,605 4,787 4,925 4,850 6,631 4,787 4,634
49,987 50,010 49,946 50,067 49,858 50,253 48,222 48,125 47,485 49,946 48,222 46,8221,527 1,410 2,160 2,279 2,914 3,128 1,548 2,193 1,914 2,160 1,548 1,1126,657 6,325 5,778 5,791 5,658 5,795 5,357 5,325 5,095 5,778 5,357 4,8303,237 3,242 3,265 3,310 3,308 3,324 3,218 3,216 3,196 3,265 3,218 3,2228,164 7,635 7,516 7,406 7,404 7,359 7,306 7,335 7,229 7,516 7,306 7,157
175,145 169,180 177,912 176,311 176,502 168,611 161,619 161,933 156,634 177,912 161,619 151,7265,571 5,809 5,152 5,771 5,049 5,564 5,216 4,899 5,114 5,152 5,216 4,4983,738 3,824 3,843 3,999 4,315 4,357 4,024 4,059 4,210 3,843 4,024 4,1411,568 1,566 1,634 1,485 1,534 1,606 1,455 1,431 1,305 1,634 1,455 1,2093,226 3,234 2,477 2,493 2,142 2,184 2,083 2,015 1,753 2,477 2,083 1,7796,441 6,459 6,072 6,176 5,947 6,044 5,832 5,869 5,309 6,072 5,832 5,412
195,689 190,072 197,090 196,235 195,489 188,366 180,229 180,206 174,325 197,090 180,229 168,765
133,249 127,341 125,921 116,653 112,944 102,824 116,973 112,806 111,684 125,921 116,973 103,062
328,938 317,413 323,011 312,888 308,433 291,190 297,202 293,012 286,009 323,011 297,202 271,827
142,081 138,145 145,773 144,170 142,501 135,252 131,184 130,870 127,728 145,773 131,184 121,9233,507 3,584 3,189 3,251 3,198 3,120 3,116 3,121 3,145 3,189 3,116 3,1641,628 1,908 1,744 2,407 3,313 4,509 2,040 2,352 1,804 1,744 2,040 2,295
414 386 383 407 391 313 406 397 393 383 406 32215,817 15,370 14,858 15,573 15,633 15,865 14,937 14,730 12,506 14,858 14,937 12,153
300 300 300 300 300 300 300 300 600 300 300 599200 200 200 200 200 200 200 700 700 200 200 700
4,433 4,432 4,781 4,035 4,534 3,539 3,538 3,538 2,791 4,781 3,538 3,039
168,380 164,325 171,228 170,343 170,070 163,098 155,721 156,008 149,667 171,228 155,721 144,195
Insurance and investment contracts for account of segregated fund holders 133,249 127,341 125,921 116,653 112,944 102,824 116,973 112,806 111,684 125,921 116,973 103,062
301,629 291,666 297,149 286,996 283,014 265,922 272,694 268,814 261,351 297,149 272,694 247,257
27,309 25,747 25,862 25,892 25,419 25,268 24,508 24,198 24,658 25,862 24,508 24,570
328,938 317,413 323,011 312,888 308,433 291,190 297,202 293,012 286,009 323,011 297,202 271,827
1.239 1.256 1.273 1.332 1.357 1.406 1.299 1.324 1.309 1.273 1.299 1.364
At the Year Ended
Insurance contract liabilities
Total assets
Liabilities and Equity
Total general fund assets
Investment for account of segregated fund holders
Reinsurance assetsDeferred tax assetsIntangible assetsGoodwill
2020At the Quarter Ended
2021
Total liabilities
Total liabilities and equity
EXCHANGE RATES - Period end ratesU.S. Dollar
Total equity
Subordinated debt
Total general fund liabilities
Investment contract liabilitiesDerivative liabilities
Other liabilitiesSenior debenturesSenior debentures - Innovative capital instruments
Deferred tax liabilities
Derivative assetsOther invested assetsPolicy loans
AssetsCash, cash equivalents and short-term securitiesDebt securitiesEquity securitiesMortgages and loans
Investment propertiesTotal invested assets
Other assets
STATEMENTS OF FINANCIAL POSITION(C$ millions) 2019
Sun Life 5
2020 2019 2018Q2 Q1 Q4 Q3 Q2 Q1 Q4 Q3 Q2
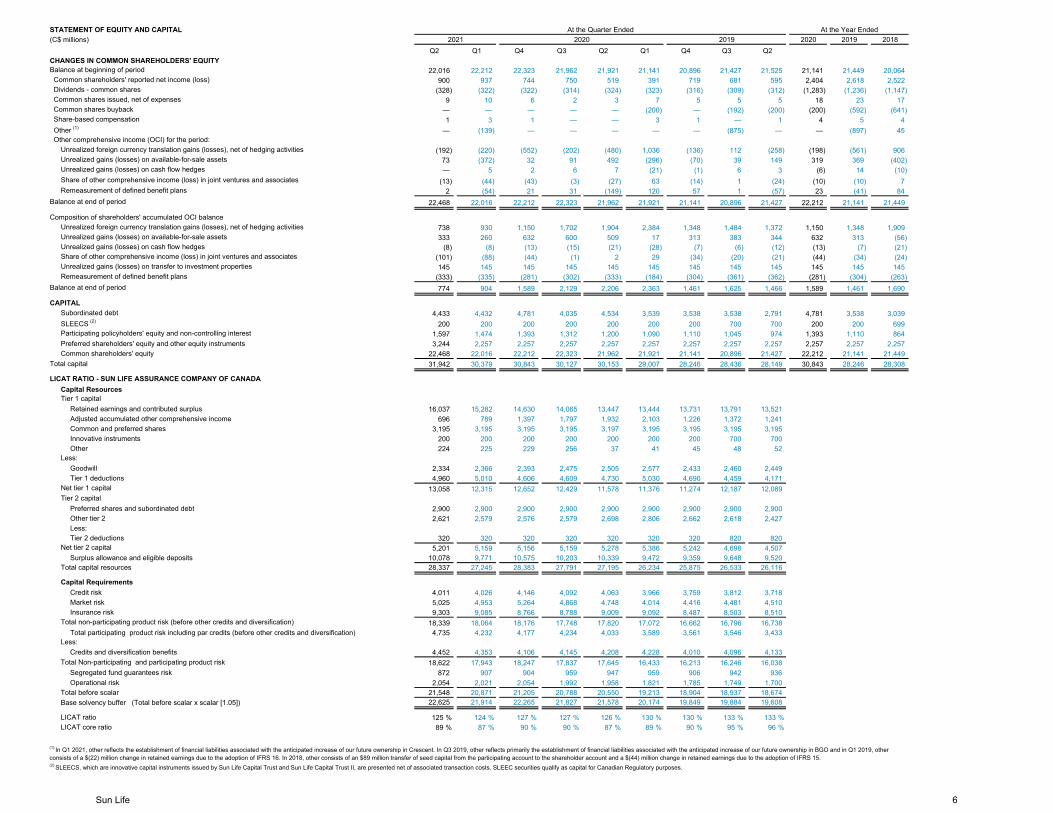
22,016 22,212 22,323 21,962 21,921 21,141 20,896 21,427 21,525 21,141 21,449 20,064900 937 744 750 519 391 719 681 595 2,404 2,618 2,522
(328) (322) (322) (314) (324) (323) (316) (309) (312) (1,283) (1,236) (1,147)9 10 6 2 3 7 5 5 5 18 23 17
— — — — — (200) — (192) (200) (200) (592) (641)1 3 1 — — 3 1 — 1 4 5 4
— (139) — — — — — (875) — — (897) 45
(192) (220) (552) (202) (480) 1,036 (136) 112 (258) (198) (561) 90673 (372) 32 91 492 (296) (70) 39 149 319 369 (402)— 5 2 6 7 (21) (1) 6 3 (6) 14 (10)
(13) (44) (43) (3) (27) 63 (14) 1 (24) (10) (10) 72 (54) 21 31 (149) 120 57 1 (57) 23 (41) 84
22,468 22,016 22,212 22,323 21,962 21,921 21,141 20,896 21,427 22,212 21,141 21,449
738 930 1,150 1,702 1,904 2,384 1,348 1,484 1,372 1,150 1,348 1,909333 260 632 600 509 17 313 383 344 632 313 (56)
(8) (8) (13) (15) (21) (28) (7) (6) (12) (13) (7) (21)(101) (88) (44) (1) 2 29 (34) (20) (21) (44) (34) (24)145 145 145 145 145 145 145 145 145 145 145 145
(333) (335) (281) (302) (333) (184) (304) (361) (362) (281) (304) (263)774 904 1,589 2,129 2,206 2,363 1,461 1,625 1,466 1,589 1,461 1,690
4,433 4,432 4,781 4,035 4,534 3,539 3,538 3,538 2,791 4,781 3,538 3,039200 200 200 200 200 200 200 700 700 200 200 699
1,597 1,474 1,393 1,312 1,200 1,090 1,110 1,045 974 1,393 1,110 864Preferred shareholders' equity and other equity instruments 3,244 2,257 2,257 2,257 2,257 2,257 2,257 2,257 2,257 2,257 2,257 2,257Common shareholders' equity 22,468 22,016 22,212 22,323 21,962 21,921 21,141 20,896 21,427 22,212 21,141 21,449
31,942 30,379 30,843 30,127 30,153 29,007 28,246 28,436 28,149 30,843 28,246 28,308
Retained earnings and contributed surplus 16,037 15,282 14,630 14,065 13,447 13,444 13,731 13,791 13,521Adjusted accumulated other comprehensive income 696 789 1,397 1,797 1,932 2,103 1,226 1,372 1,241Common and preferred shares 3,195 3,195 3,195 3,195 3,197 3,195 3,195 3,195 3,195Innovative instruments 200 200 200 200 200 200 200 700 700Other 224 225 229 256 37 41 45 48 52
Goodwill 2,334 2,366 2,393 2,475 2,505 2,577 2,433 2,460 2,449Tier 1 deductions 4,960 5,010 4,606 4,609 4,730 5,030 4,690 4,459 4,171
13,058 12,315 12,652 12,429 11,578 11,376 11,274 12,187 12,089
Preferred shares and subordinated debt 2,900 2,900 2,900 2,900 2,900 2,900 2,900 2,900 2,900Other tier 2 2,621 2,579 2,576 2,579 2,698 2,806 2,662 2,618 2,427Less: Tier 2 deductions 320 320 320 320 320 320 320 820 820
5,201 5,159 5,156 5,159 5,278 5,386 5,242 4,698 4,507Surplus allowance and eligible deposits 10,078 9,771 10,575 10,203 10,339 9,472 9,359 9,648 9,520
28,337 27,245 28,383 27,791 27,195 26,234 25,875 26,533 26,116
Credit risk 4,011 4,026 4,146 4,092 4,063 3,966 3,759 3,812 3,718Market risk 5,025 4,953 5,264 4,868 4,748 4,014 4,416 4,481 4,510Insurance risk 9,303 9,085 8,766 8,788 9,009 9,092 8,487 8,503 8,510
18,339 18,064 18,176 17,748 17,820 17,072 16,662 16,796 16,738Total participating product risk including par credits (before other credits and diversification) 4,735 4,232 4,177 4,234 4,033 3,589 3,561 3,546 3,433
Credits and diversification benefits 4,452 4,353 4,106 4,145 4,208 4,228 4,010 4,096 4,133Total Non-participating and participating product risk 18,622 17,943 18,247 17,837 17,645 16,433 16,213 16,246 16,038
Segregated fund guarantees risk 872 907 904 959 947 959 906 942 936Operational risk 2,054 2,021 2,054 1,992 1,958 1,821 1,785 1,749 1,700
Total before scalar 21,548 20,871 21,205 20,788 20,550 19,213 18,904 18,937 18,674Base solvency buffer (Total before scalar x scalar [1.05]) 22,625 21,914 22,265 21,827 21,578 20,174 19,849 19,884 19,608
LICAT ratio 125 % 124 % 127 % 127 % 126 % 130 % 130 % 133 % 133 %LICAT core ratio 89 % 87 % 90 % 90 % 87 % 89 % 90 % 95 % 96 %
(2) SLEECS, which are innovative capital instruments issued by Sun Life Capital Trust and Sun Life Capital Trust II, are presented net of associated transaction costs. SLEEC securities qualify as capital for Canadian Regulatory purposes.
(1) In Q1 2021, other reflects the establishment of financial liabilities associated with the anticipated increase of our future ownership in Crescent. In Q3 2019, other reflects primarily the establishment of financial liabilities associated with the anticipated increase of our future ownership in BGO and in Q1 2019, other consists of a $(22) million change in retained earnings due to the adoption of IFRS 16. In 2018, other consists of an $89 million transfer of seed capital from the participating account to the shareholder account and a $(44) million change in retained earnings due to the adoption of IFRS 15.
(C$ millions)At the Quarter Ended
Balance at end of period
Share of other comprehensive income (loss) in joint ventures and associates
Unrealized gains (losses) on available-for-sale assets
STATEMENT OF EQUITY AND CAPITAL
Unrealized foreign currency translation gains (losses), net of hedging activities
Unrealized gains (losses) on transfer to investment properties
Unrealized gains (losses) on cash flow hedges
Remeasurement of defined benefit plans
Other (1)
Other comprehensive income (OCI) for the period:Unrealized foreign currency translation gains (losses), net of hedging activities
Dividends - common shares
CHANGES IN COMMON SHAREHOLDERS' EQUITYBalance at beginning of period
2019At the Year Ended
20202021
Common shares issued, net of expenses Common shares buyback Share-based compensation
Common shareholders' reported net income (loss)
Capital ResourcesTier 1 capital
Share of other comprehensive income (loss) in joint ventures and associates Remeasurement of defined benefit plans
Unrealized gains (losses) on cash flow hedges
Unrealized gains (losses) on available-for-sale assets
Balance at end of period
Composition of shareholders' accumulated OCI balance
LICAT RATIO - SUN LIFE ASSURANCE COMPANY OF CANADA
Participating policyholders' equity and non-controlling interest
Total capital
CAPITALSubordinated debtSLEECS (2)
Total capital resources
Capital Requirements
Total non-participating product risk (before other credits and diversification)
Less:
Less:
Net tier 1 capitalTier 2 capital
Net tier 2 capital
Sun Life 6
2020 2019 2018Q2 Q1 Q4 Q3 Q2 Q1 Q4 Q3 Q2
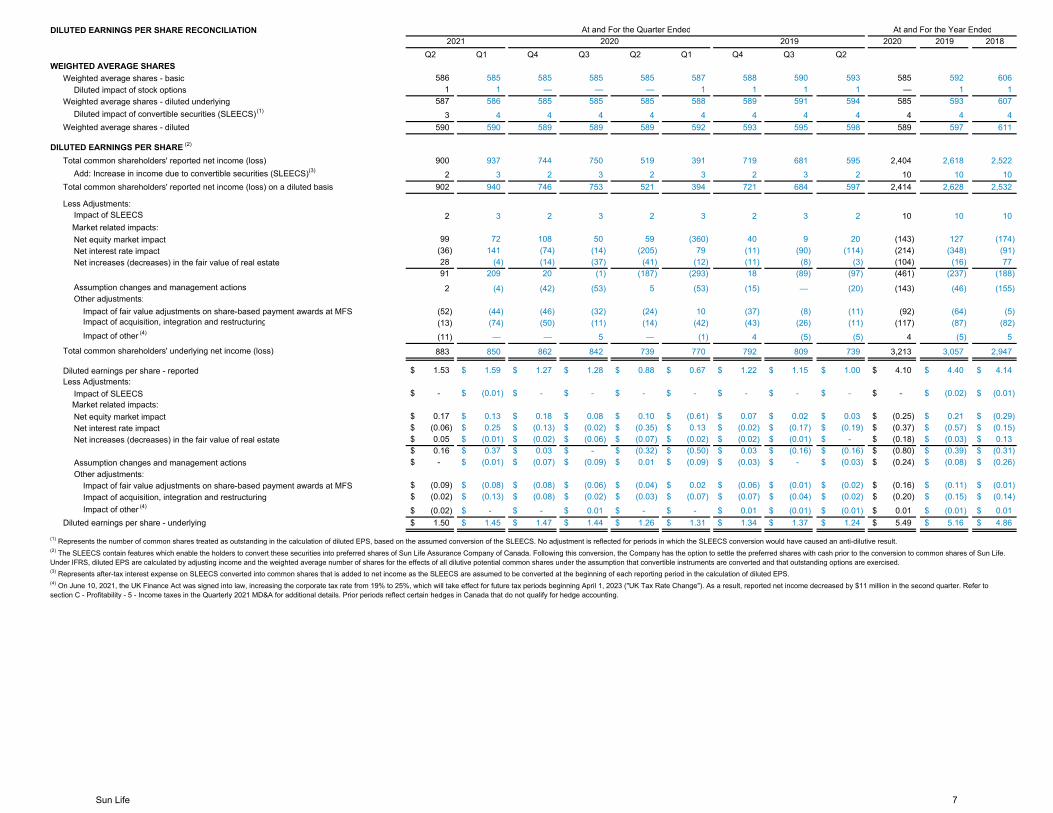
586 585 585 585 585 587 588 590 593 585 592 606Diluted impact of stock options 1 1 — — — 1 1 1 1 — 1 1
587 586 585 585 585 588 589 591 594 585 593 607Diluted impact of convertible securities (SLEECS) (1) 3 4 4 4 4 4 4 4 4 4 4 4
590 590 589 589 589 592 593 595 598 589 597 611
900 937 744 750 519 391 719 681 595 2,404 2,618 2,522Add: Increase in income due to convertible securities (SLEECS) (3) 2 3 2 3 2 3 2 3 2 10 10 10
902 940 746 753 521 394 721 684 597 2,414 2,628 2,532
Impact of SLEECS 2 3 2 3 2 3 2 3 2 10 10 10
Net equity market impact 99 72 108 50 59 (360) 40 9 20 (143) 127 (174)Net interest rate impact (36) 141 (74) (14) (205) 79 (11) (90) (114) (214) (348) (91)Net increases (decreases) in the fair value of real estate 28 (4) (14) (37) (41) (12) (11) (8) (3) (104) (16) 77
91 209 20 (1) (187) (293) 18 (89) (97) (461) (237) (188)Assumption changes and management actions 2 (4) (42) (53) 5 (53) (15) — (20) (143) (46) (155)Other adjustments:
Impact of fair value adjustments on share-based payment awards at MFS (52) (44) (46) (32) (24) 10 (37) (8) (11) (92) (64) (5)Impact of acquisition, integration and restructuring (13) (74) (50) (11) (14) (42) (43) (26) (11) (117) (87) (82)Impact of other (4) (11) — — 5 — (1) 4 (5) (5) 4 (5) 5
883 850 862 842 739 770 792 809 739 3,213 3,057 2,947
1.53$ 1.59$ 1.27$ 1.28$ 0.88$ 0.67$ 1.22$ 1.15$ 1.00$ 4.10$ 4.40$ 4.14$
Impact of SLEECS -$ (0.01)$ -$ -$ -$ -$ -$ -$ -$ -$ (0.02)$ (0.01)$
Net equity market impact 0.17$ 0.13$ 0.18$ 0.08$ 0.10$ (0.61)$ 0.07$ 0.02$ 0.03$ (0.25)$ 0.21$ (0.29)$ Net interest rate impact (0.06)$ 0.25$ (0.13)$ (0.02)$ (0.35)$ 0.13$ (0.02)$ (0.17)$ (0.19)$ (0.37)$ (0.57)$ (0.15)$ Net increases (decreases) in the fair value of real estate 0.05$ (0.01)$ (0.02)$ (0.06)$ (0.07)$ (0.02)$ (0.02)$ (0.01)$ -$ (0.18)$ (0.03)$ 0.13$
0.16$ 0.37$ 0.03$ -$ (0.32)$ (0.50)$ 0.03$ (0.16)$ (0.16)$ (0.80)$ (0.39)$ (0.31)$ Assumption changes and management actions -$ (0.01)$ (0.07)$ (0.09)$ 0.01$ (0.09)$ (0.03)$ -$ (0.03)$ (0.24)$ (0.08)$ (0.26)$ Other adjustments:
Impact of fair value adjustments on share-based payment awards at MFS (0.09)$ (0.08)$ (0.08)$ (0.06)$ (0.04)$ 0.02$ (0.06)$ (0.01)$ (0.02)$ (0.16)$ (0.11)$ (0.01)$ Impact of acquisition, integration and restructuring (0.02)$ (0.13)$ (0.08)$ (0.02)$ (0.03)$ (0.07)$ (0.07)$ (0.04)$ (0.02)$ (0.20)$ (0.15)$ (0.14)$ Impact of other (4) (0.02)$ -$ -$ 0.01$ -$ -$ 0.01$ (0.01)$ (0.01)$ 0.01$ (0.01)$ 0.01$
1.50$ 1.45$ 1.47$ 1.44$ 1.26$ 1.31$ 1.34$ 1.37$ 1.24$ 5.49$ 5.16$ 4.86$
(4) On June 10, 2021, the UK Finance Act was signed into law, increasing the corporate tax rate from 19% to 25%, which will take effect for future tax periods beginning April 1, 2023 ("UK Tax Rate Change"). As a result, reported net income decreased by $11 million in the second quarter. Refer to section C - Profitability - 5 - Income taxes in the Quarterly 2021 MD&A for additional details. Prior periods reflect certain hedges in Canada that do not qualify for hedge accounting.
Diluted earnings per share - underlying
Less Adjustments:
(1) Represents the number of common shares treated as outstanding in the calculation of diluted EPS, based on the assumed conversion of the SLEECS. No adjustment is reflected for periods in which the SLEECS conversion would have caused an anti-dilutive result.(2) The SLEECS contain features which enable the holders to convert these securities into preferred shares of Sun Life Assurance Company of Canada. Following this conversion, the Company has the option to settle the preferred shares with cash prior to the conversion to common shares of Sun Life. Under IFRS, diluted EPS are calculated by adjusting income and the weighted average number of shares for the effects of all dilutive potential common shares under the assumption that convertible instruments are converted and that outstanding options are exercised.(3) Represents after-tax interest expense on SLEECS converted into common shares that is added to net income as the SLEECS are assumed to be converted at the beginning of each reporting period in the calculation of diluted EPS.
Market related impacts:
Market related impacts:
Total common shareholders' underlying net income (loss)
Diluted earnings per share - reported
Weighted average shares - basic
Weighted average shares - diluted underlying
DILUTED EARNINGS PER SHARE (2)
Total common shareholders' reported net income (loss)
At and For the Year Ended
Less Adjustments:
Total common shareholders' reported net income (loss) on a diluted basis
DILUTED EARNINGS PER SHARE RECONCILIATION At and For the Quarter Ended
Weighted average shares - diluted
WEIGHTED AVERAGE SHARES
201920202021
Sun Life 7
2020 2019 2018Q2 Q1 Q4 Q3 Q2 Q1 Q4 Q3 Q2
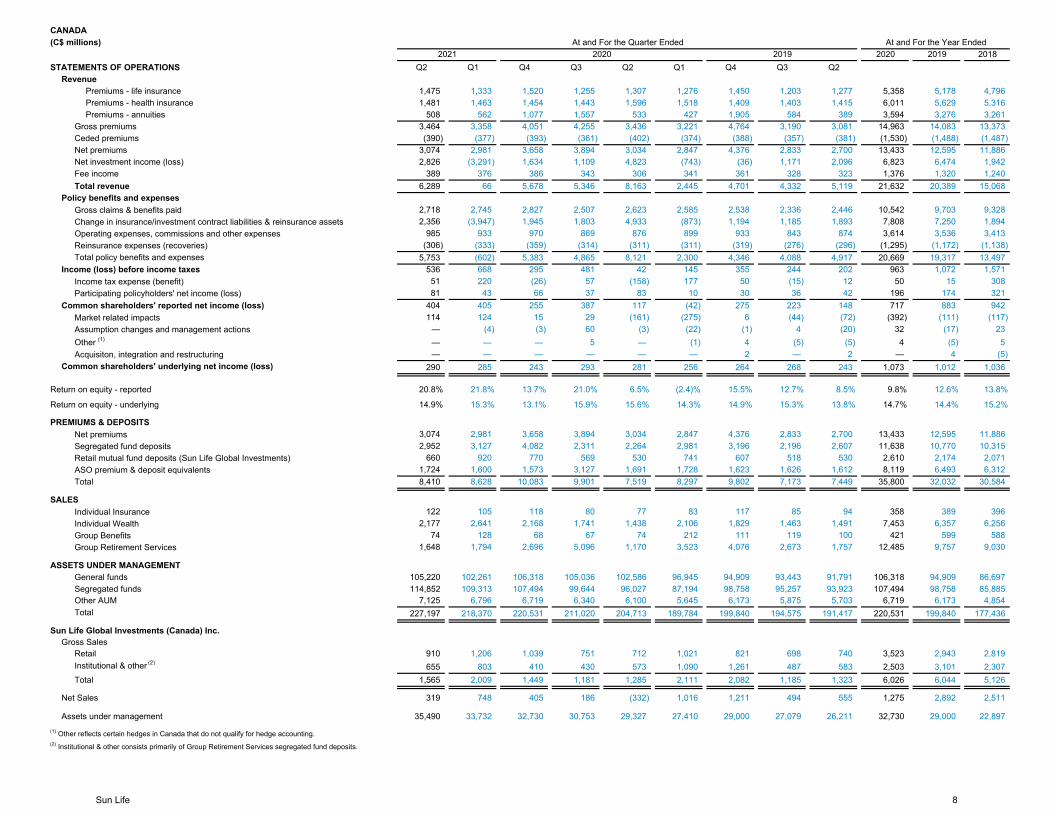
1,475 1,333 1,520 1,255 1,307 1,276 1,450 1,203 1,277 5,358 5,178 4,7961,481 1,463 1,454 1,443 1,596 1,518 1,409 1,403 1,415 6,011 5,629 5,316
508 562 1,077 1,557 533 427 1,905 584 389 3,594 3,276 3,2613,464 3,358 4,051 4,255 3,436 3,221 4,764 3,190 3,081 14,963 14,083 13,373(390) (377) (393) (361) (402) (374) (388) (357) (381) (1,530) (1,488) (1,487)
3,074 2,981 3,658 3,894 3,034 2,847 4,376 2,833 2,700 13,433 12,595 11,8862,826 (3,291) 1,634 1,109 4,823 (743) (36) 1,171 2,096 6,823 6,474 1,942
389 376 386 343 306 341 361 328 323 1,376 1,320 1,2406,289 66 5,678 5,346 8,163 2,445 4,701 4,332 5,119 21,632 20,389 15,068
2,718 2,745 2,827 2,507 2,623 2,585 2,538 2,336 2,446 10,542 9,703 9,3282,356 (3,947) 1,945 1,803 4,933 (873) 1,194 1,185 1,893 7,808 7,250 1,894
985 933 970 869 876 899 933 843 874 3,614 3,536 3,413(306) (333) (359) (314) (311) (311) (319) (276) (296) (1,295) (1,172) (1,138)
5,753 (602) 5,383 4,865 8,121 2,300 4,346 4,088 4,917 20,669 19,317 13,497536 668 295 481 42 145 355 244 202 963 1,072 1,57151 220 (26) 57 (158) 177 50 (15) 12 50 15 30881 43 66 37 83 10 30 36 42 196 174 321
404 405 255 387 117 (42) 275 223 148 717 883 942114 124 15 29 (161) (275) 6 (44) (72) (392) (111) (117)
— (4) (3) 60 (3) (22) (1) 4 (20) 32 (17) 23— — — 5 — (1) 4 (5) (5) 4 (5) 5— — — — — — 2 — 2 — 4 (5)
290 285 243 293 281 256 264 268 243 1,073 1,012 1,036
20.8% 21.8% 13.7% 21.0% 6.5% (2.4)% 15.5% 12.7% 8.5% 9.8% 12.6% 13.8%
14.9% 15.3% 13.1% 15.9% 15.6% 14.3% 14.9% 15.3% 13.8% 14.7% 14.4% 15.2%
3,074 2,981 3,658 3,894 3,034 2,847 4,376 2,833 2,700 13,433 12,595 11,8862,952 3,127 4,082 2,311 2,264 2,981 3,196 2,196 2,607 11,638 10,770 10,315
660 920 770 569 530 741 607 518 530 2,610 2,174 2,0711,724 1,600 1,573 3,127 1,691 1,728 1,623 1,626 1,612 8,119 6,493 6,3128,410 8,628 10,083 9,901 7,519 8,297 9,802 7,173 7,449 35,800 32,032 30,584
122 105 118 80 77 83 117 85 94 358 389 3962,177 2,641 2,168 1,741 1,438 2,106 1,829 1,463 1,491 7,453 6,357 6,256
74 128 68 67 74 212 111 119 100 421 599 5881,648 1,794 2,696 5,096 1,170 3,523 4,076 2,673 1,757 12,485 9,757 9,030
105,220 102,261 106,318 105,036 102,586 96,945 94,909 93,443 91,791 106,318 94,909 86,697114,852 109,313 107,494 99,644 96,027 87,194 98,758 95,257 93,923 107,494 98,758 85,885
7,125 6,796 6,719 6,340 6,100 5,645 6,173 5,875 5,703 6,719 6,173 4,854227,197 218,370 220,531 211,020 204,713 189,784 199,840 194,575 191,417 220,531 199,840 177,436
Gross SalesRetail 910 1,206 1,039 751 712 1,021 821 698 740 3,523 2,943 2,819Institutional & other (2) 655 803 410 430 573 1,090 1,261 487 583 2,503 3,101 2,307Total 1,565 2,009 1,449 1,181 1,285 2,111 2,082 1,185 1,323 6,026 6,044 5,126
Net Sales 319 748 405 186 (332) 1,016 1,211 494 555 1,275 2,892 2,511
Assets under management 35,490 33,732 32,730 30,753 29,327 27,410 29,000 27,079 26,211 32,730 29,000 22,897
Group Benefits
Return on equity - reported
Return on equity - underlying
PREMIUMS & DEPOSITSNet premiumsSegregated fund deposits
Individual Wealth
Retail mutual fund deposits (Sun Life Global Investments)ASO premium & deposit equivalentsTotal
SALESIndividual Insurance
(1) Other reflects certain hedges in Canada that do not qualify for hedge accounting.
Group Retirement Services
ASSETS UNDER MANAGEMENT General fundsSegregated fundsOther AUMTotal
Sun Life Global Investments (Canada) Inc.
Common shareholders' underlying net income (loss)
Total policy benefits and expensesIncome (loss) before income taxes
Income tax expense (benefit)Participating policyholders' net income (loss)
Common shareholders' reported net income (loss)Market related impactsAssumption changes and management actionsOther (1)
Acquisiton, integration and restructuring
Reinsurance expenses (recoveries)
Premiums - annuitiesGross premiumsCeded premiumsNet premiumsNet investment income (loss)Fee incomeTotal revenue
Policy benefits and expensesGross claims & benefits paidChange in insurance/investment contract liabilities & reinsurance assetsOperating expenses, commissions and other expenses
(2) Institutional & other consists primarily of Group Retirement Services segregated fund deposits.
Premiums - health insurance
CANADA(C$ millions)
STATEMENTS OF OPERATIONSRevenue
Premiums - life insurance
At and For the Quarter Ended2019
At and For the Year Ended20202021
Sun Life 8
2020 2019 2018Q2 Q1 Q4 Q3 Q2 Q1 Q4 Q3 Q2
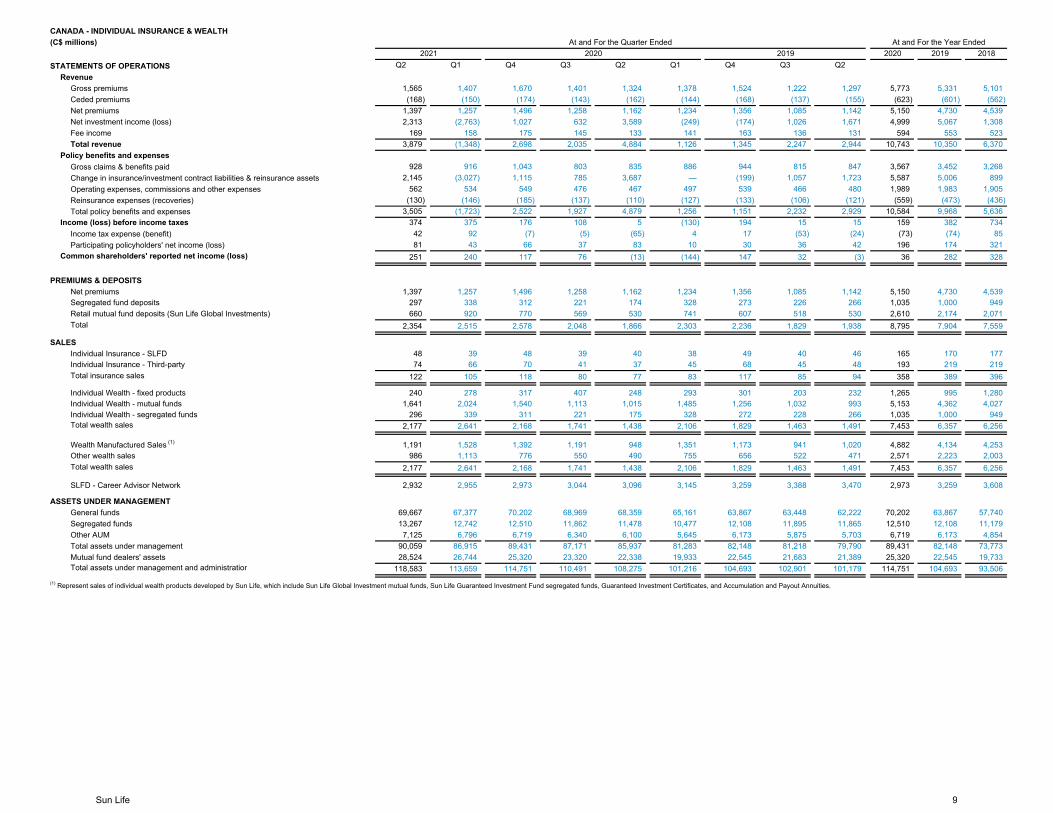
1,565 1,407 1,670 1,401 1,324 1,378 1,524 1,222 1,297 5,773 5,331 5,101(168) (150) (174) (143) (162) (144) (168) (137) (155) (623) (601) (562)
1,397 1,257 1,496 1,258 1,162 1,234 1,356 1,085 1,142 5,150 4,730 4,5392,313 (2,763) 1,027 632 3,589 (249) (174) 1,026 1,671 4,999 5,067 1,308
169 158 175 145 133 141 163 136 131 594 553 5233,879 (1,348) 2,698 2,035 4,884 1,126 1,345 2,247 2,944 10,743 10,350 6,370
928 916 1,043 803 835 886 944 815 847 3,567 3,452 3,2682,145 (3,027) 1,115 785 3,687 — (199) 1,057 1,723 5,587 5,006 899
562 534 549 476 467 497 539 466 480 1,989 1,983 1,905(130) (146) (185) (137) (110) (127) (133) (106) (121) (559) (473) (436)
3,505 (1,723) 2,522 1,927 4,879 1,256 1,151 2,232 2,929 10,584 9,968 5,636374 375 176 108 5 (130) 194 15 15 159 382 73442 92 (7) (5) (65) 4 17 (53) (24) (73) (74) 8581 43 66 37 83 10 30 36 42 196 174 321
251 240 117 76 (13) (144) 147 32 (3) 36 282 328
1,397 1,257 1,496 1,258 1,162 1,234 1,356 1,085 1,142 5,150 4,730 4,539297 338 312 221 174 328 273 226 266 1,035 1,000 949660 920 770 569 530 741 607 518 530 2,610 2,174 2,071
2,354 2,515 2,578 2,048 1,866 2,303 2,236 1,829 1,938 8,795 7,904 7,559
48 39 48 39 40 38 49 40 46 165 170 17774 66 70 41 37 45 68 45 48 193 219 219
122 105 118 80 77 83 117 85 94 358 389 396
240 278 317 407 248 293 301 203 232 1,265 995 1,2801,641 2,024 1,540 1,113 1,015 1,485 1,256 1,032 993 5,153 4,362 4,027
296 339 311 221 175 328 272 228 266 1,035 1,000 9492,177 2,641 2,168 1,741 1,438 2,106 1,829 1,463 1,491 7,453 6,357 6,256
1,191 1,528 1,392 1,191 948 1,351 1,173 941 1,020 4,882 4,134 4,253986 1,113 776 550 490 755 656 522 471 2,571 2,223 2,003
2,177 2,641 2,168 1,741 1,438 2,106 1,829 1,463 1,491 7,453 6,357 6,256
2,932 2,955 2,973 3,044 3,096 3,145 3,259 3,388 3,470 2,973 3,259 3,608
69,667 67,377 70,202 68,969 68,359 65,161 63,867 63,448 62,222 70,202 63,867 57,74013,267 12,742 12,510 11,862 11,478 10,477 12,108 11,895 11,865 12,510 12,108 11,1797,125 6,796 6,719 6,340 6,100 5,645 6,173 5,875 5,703 6,719 6,173 4,854
90,059 86,915 89,431 87,171 85,937 81,283 82,148 81,218 79,790 89,431 82,148 73,77328,524 26,744 25,320 23,320 22,338 19,933 22,545 21,683 21,389 25,320 22,545 19,733
118,583 113,659 114,751 110,491 108,275 101,216 104,693 102,901 101,179 114,751 104,693 93,506
At and For the Year Ended
Total assets under management and administration
Individual Wealth - fixed productsIndividual Wealth - mutual fundsIndividual Wealth - segregated fundsTotal wealth sales
SLFD - Career Advisor Network
ASSETS UNDER MANAGEMENT General fundsSegregated fundsOther AUMTotal assets under managementMutual fund dealers' assets
Wealth Manufactured Sales (1)
Other wealth salesTotal wealth sales
Income (loss) before income taxesIncome tax expense (benefit)Participating policyholders' net income (loss)
Total insurance sales
PREMIUMS & DEPOSITSNet premiumsSegregated fund depositsRetail mutual fund deposits (Sun Life Global Investments)Total
SALESIndividual Insurance - SLFDIndividual Insurance - Third-party
CANADA - INDIVIDUAL INSURANCE & WEALTH(C$ millions)
STATEMENTS OF OPERATIONSRevenue
201920202021At and For the Quarter Ended
(1) Represent sales of individual wealth products developed by Sun Life, which include Sun Life Global Investment mutual funds, Sun Life Guaranteed Investment Fund segregated funds, Guaranteed Investment Certificates, and Accumulation and Payout Annuities.
Net investment income (loss)
Gross premiumsCeded premiumsNet premiums
Common shareholders' reported net income (loss)
Fee incomeTotal revenue
Policy benefits and expensesGross claims & benefits paidChange in insurance/investment contract liabilities & reinsurance assetsOperating expenses, commissions and other expensesReinsurance expenses (recoveries)Total policy benefits and expenses
Sun Life 9
2020 2019 2018Q2 Q1 Q4 Q3 Q2 Q1 Q4 Q3 Q2
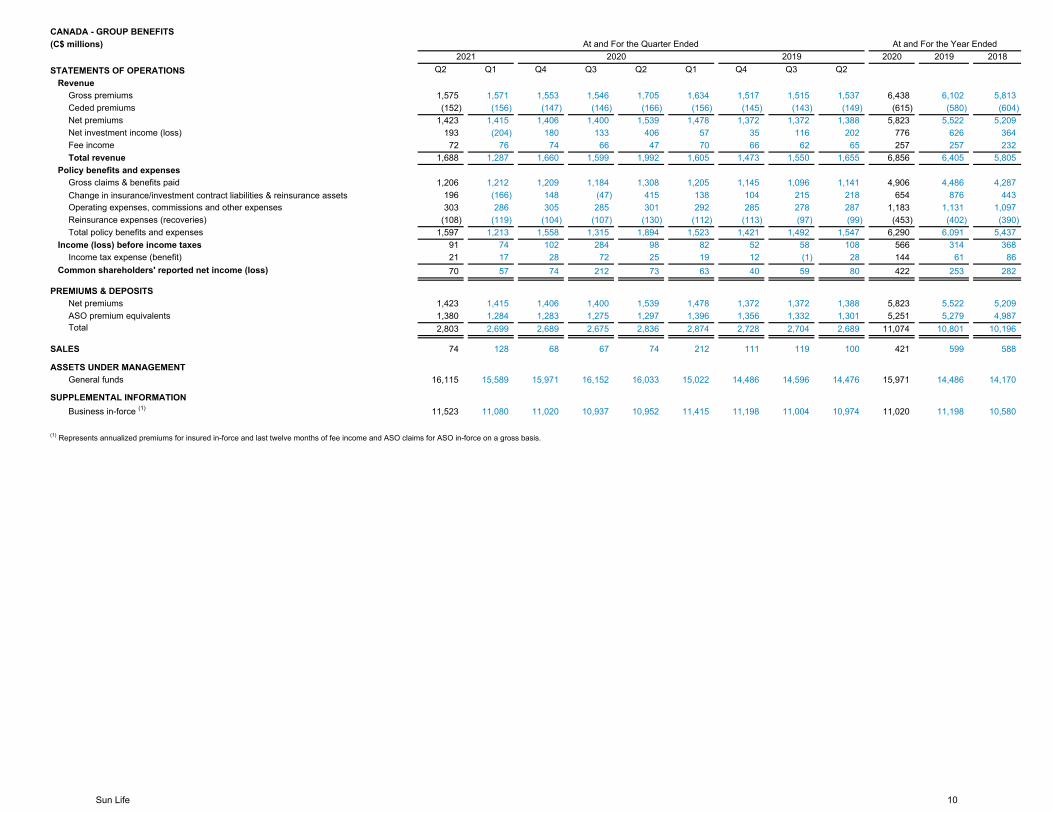
1,575 1,571 1,553 1,546 1,705 1,634 1,517 1,515 1,537 6,438 6,102 5,813(152) (156) (147) (146) (166) (156) (145) (143) (149) (615) (580) (604)
1,423 1,415 1,406 1,400 1,539 1,478 1,372 1,372 1,388 5,823 5,522 5,209193 (204) 180 133 406 57 35 116 202 776 626 364
72 76 74 66 47 70 66 62 65 257 257 2321,688 1,287 1,660 1,599 1,992 1,605 1,473 1,550 1,655 6,856 6,405 5,805
1,206 1,212 1,209 1,184 1,308 1,205 1,145 1,096 1,141 4,906 4,486 4,287196 (166) 148 (47) 415 138 104 215 218 654 876 443303 286 305 285 301 292 285 278 287 1,183 1,131 1,097
(108) (119) (104) (107) (130) (112) (113) (97) (99) (453) (402) (390)1,597 1,213 1,558 1,315 1,894 1,523 1,421 1,492 1,547 6,290 6,091 5,437
91 74 102 284 98 82 52 58 108 566 314 36821 17 28 72 25 19 12 (1) 28 144 61 8670 57 74 212 73 63 40 59 80 422 253 282
1,423 1,415 1,406 1,400 1,539 1,478 1,372 1,372 1,388 5,823 5,522 5,2091,380 1,284 1,283 1,275 1,297 1,396 1,356 1,332 1,301 5,251 5,279 4,9872,803 2,699 2,689 2,675 2,836 2,874 2,728 2,704 2,689 11,074 10,801 10,196
74 128 68 67 74 212 111 119 100 421 599 588
16,115 15,589 15,971 16,152 16,033 15,022 14,486 14,596 14,476 15,971 14,486 14,170
11,523 11,080 11,020 10,937 10,952 11,415 11,198 11,004 10,974 11,020 11,198 10,580
Income tax expense (benefit)
Net premiumsNet investment income (loss)Fee incomeTotal revenue
Policy benefits and expensesGross claims & benefits paidChange in insurance/investment contract liabilities & reinsurance assetsOperating expenses, commissions and other expensesReinsurance expenses (recoveries)Total policy benefits and expenses
Income (loss) before income taxes
(1) Represents annualized premiums for insured in-force and last twelve months of fee income and ASO claims for ASO in-force on a gross basis.
Common shareholders' reported net income (loss)
PREMIUMS & DEPOSITSNet premiumsASO premium equivalentsTotal
SUPPLEMENTAL INFORMATION
SALES
ASSETS UNDER MANAGEMENTGeneral funds
Business in-force (1)
Ceded premiums
CANADA - GROUP BENEFITS(C$ millions)
STATEMENTS OF OPERATIONSRevenue
Gross premiums
At and For the Quarter Ended2019
At and For the Year Ended20202021
Sun Life 10
2020 2019 2018Q2 Q1 Q4 Q3 Q2 Q1 Q4 Q3 Q2
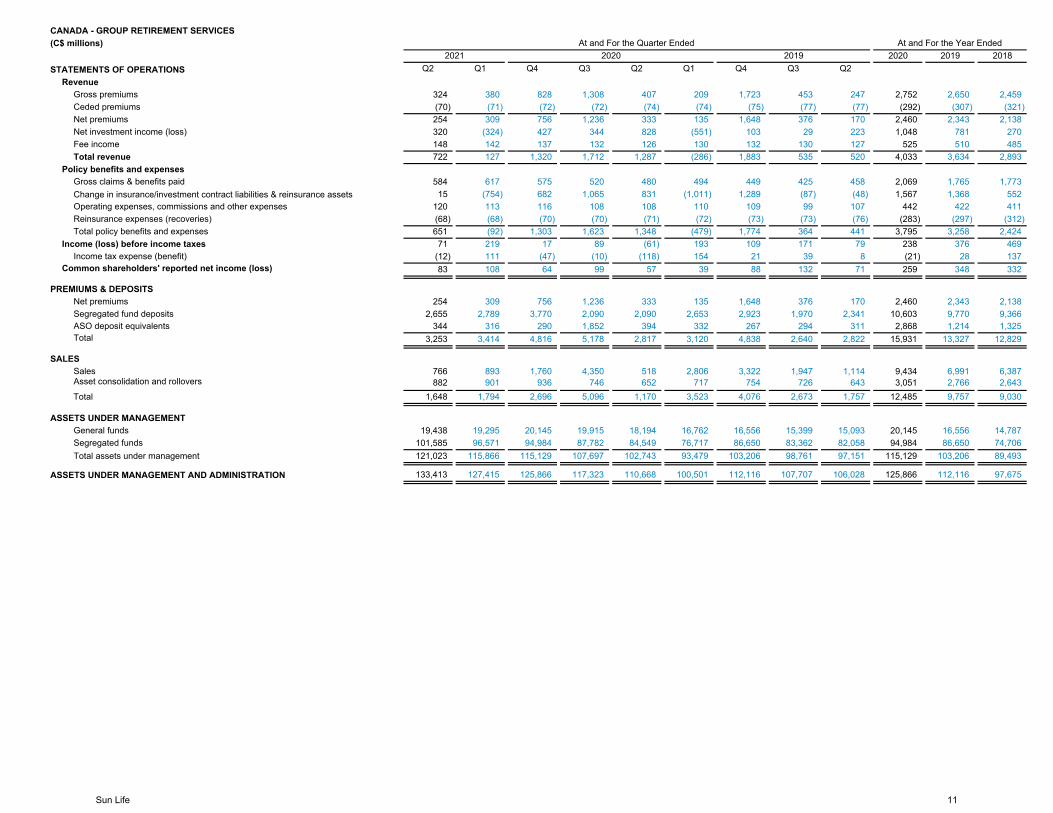
324 380 828 1,308 407 209 1,723 453 247 2,752 2,650 2,459(70) (71) (72) (72) (74) (74) (75) (77) (77) (292) (307) (321)254 309 756 1,236 333 135 1,648 376 170 2,460 2,343 2,138320 (324) 427 344 828 (551) 103 29 223 1,048 781 270148 142 137 132 126 130 132 130 127 525 510 485722 127 1,320 1,712 1,287 (286) 1,883 535 520 4,033 3,634 2,893
584 617 575 520 480 494 449 425 458 2,069 1,765 1,77315 (754) 682 1,065 831 (1,011) 1,289 (87) (48) 1,567 1,368 552
120 113 116 108 108 110 109 99 107 442 422 411(68) (68) (70) (70) (71) (72) (73) (73) (76) (283) (297) (312)651 (92) 1,303 1,623 1,348 (479) 1,774 364 441 3,795 3,258 2,424
71 219 17 89 (61) 193 109 171 79 238 376 469(12) 111 (47) (10) (118) 154 21 39 8 (21) 28 13783 108 64 99 57 39 88 132 71 259 348 332
254 309 756 1,236 333 135 1,648 376 170 2,460 2,343 2,1382,655 2,789 3,770 2,090 2,090 2,653 2,923 1,970 2,341 10,603 9,770 9,366
344 316 290 1,852 394 332 267 294 311 2,868 1,214 1,3253,253 3,414 4,816 5,178 2,817 3,120 4,838 2,640 2,822 15,931 13,327 12,829
766 893 1,760 4,350 518 2,806 3,322 1,947 1,114 9,434 6,991 6,387882 901 936 746 652 717 754 726 643 3,051 2,766 2,643
Total 1,648 1,794 2,696 5,096 1,170 3,523 4,076 2,673 1,757 12,485 9,757 9,030
19,438 19,295 20,145 19,915 18,194 16,762 16,556 15,399 15,093 20,145 16,556 14,787101,585 96,571 94,984 87,782 84,549 76,717 86,650 83,362 82,058 94,984 86,650 74,706121,023 115,866 115,129 107,697 102,743 93,479 103,206 98,761 97,151 115,129 103,206 89,493
133,413 127,415 125,866 117,323 110,668 100,501 112,116 107,707 106,028 125,866 112,116 97,675
ASSETS UNDER MANAGEMENTGeneral fundsSegregated fundsTotal assets under management
ASSETS UNDER MANAGEMENT AND ADMINISTRATION
Asset consolidation and rollovers
Common shareholders' reported net income (loss)
PREMIUMS & DEPOSITSNet premiumsSegregated fund depositsASO deposit equivalentsTotal
SALESSales
Income tax expense (benefit)
Net premiumsNet investment income (loss)Fee incomeTotal revenue
Policy benefits and expensesGross claims & benefits paidChange in insurance/investment contract liabilities & reinsurance assetsOperating expenses, commissions and other expensesReinsurance expenses (recoveries)Total policy benefits and expenses
Income (loss) before income taxes
Ceded premiums
CANADA - GROUP RETIREMENT SERVICES(C$ millions)
STATEMENTS OF OPERATIONSRevenue
Gross premiums
At and For the Quarter Ended2019
At and For the Year Ended20202021
Sun Life 11
2020 2019 2018Q2 Q1 Q4 Q3 Q2 Q1 Q4 Q3 Q2
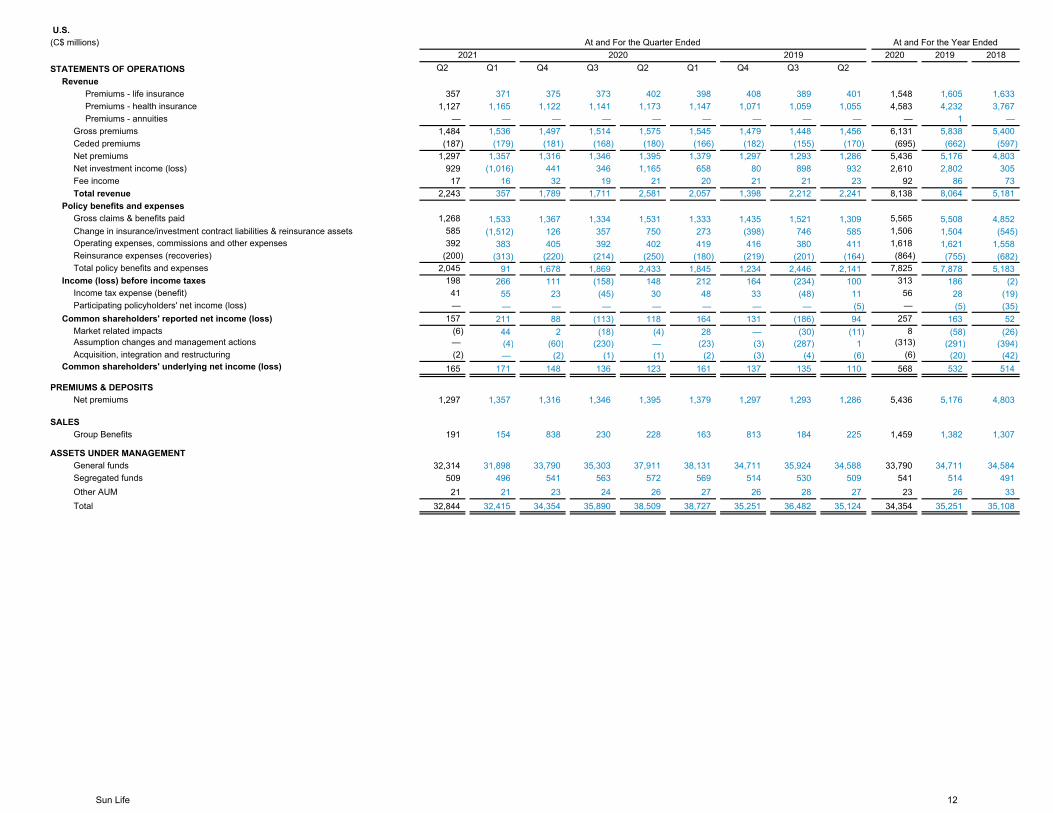
357 371 375 373 402 398 408 389 401 1,548 1,605 1,6331,127 1,165 1,122 1,141 1,173 1,147 1,071 1,059 1,055 4,583 4,232 3,767
— — — — — — — — — — 1 —1,484 1,536 1,497 1,514 1,575 1,545 1,479 1,448 1,456 6,131 5,838 5,400(187) (179) (181) (168) (180) (166) (182) (155) (170) (695) (662) (597)
1,297 1,357 1,316 1,346 1,395 1,379 1,297 1,293 1,286 5,436 5,176 4,803929 (1,016) 441 346 1,165 658 80 898 932 2,610 2,802 305
17 16 32 19 21 20 21 21 23 92 86 732,243 357 1,789 1,711 2,581 2,057 1,398 2,212 2,241 8,138 8,064 5,181
1,268 1,533 1,367 1,334 1,531 1,333 1,435 1,521 1,309 5,565 5,508 4,852585 (1,512) 126 357 750 273 (398) 746 585 1,506 1,504 (545)392 383 405 392 402 419 416 380 411 1,618 1,621 1,558
(200) (313) (220) (214) (250) (180) (219) (201) (164) (864) (755) (682)2,045 91 1,678 1,869 2,433 1,845 1,234 2,446 2,141 7,825 7,878 5,183
198 266 111 (158) 148 212 164 (234) 100 313 186 (2)41 55 23 (45) 30 48 33 (48) 11 56 28 (19)— — — — — — — — (5) — (5) (35)
157 211 88 (113) 118 164 131 (186) 94 257 163 52(6) 44 2 (18) (4) 28 — (30) (11) 8 (58) (26)— (4) (60) (230) — (23) (3) (287) 1 (313) (291) (394)(2) — (2) (1) (1) (2) (3) (4) (6) (6) (20) (42)
165 171 148 136 123 161 137 135 110 568 532 514
1,297 1,357 1,316 1,346 1,395 1,379 1,297 1,293 1,286 5,436 5,176 4,803
191 154 838 230 228 163 813 184 225 1,459 1,382 1,307
32,314 31,898 33,790 35,303 37,911 38,131 34,711 35,924 34,588 33,790 34,711 34,584509 496 541 563 572 569 514 530 509 541 514 491
21 21 23 24 26 27 26 28 27 23 26 3332,844 32,415 34,354 35,890 38,509 38,727 35,251 36,482 35,124 34,354 35,251 35,108
Common shareholders' reported net income (loss)
SALESGroup Benefits
Assumption changes and management actions
Income (loss) before income taxesIncome tax expense (benefit)Participating policyholders' net income (loss)
Acquisition, integration and restructuringCommon shareholders' underlying net income (loss)
Other AUM
ASSETS UNDER MANAGEMENTGeneral fundsSegregated funds
PREMIUMS & DEPOSITSNet premiums
Total
Policy benefits and expenses
Reinsurance expenses (recoveries)
Gross claims & benefits paid
Operating expenses, commissions and other expenses
Gross premiumsPremiums - annuities
2019At and For the Year Ended
20202021
Total policy benefits and expenses
Market related impacts
(C$ millions) U.S.
STATEMENTS OF OPERATIONS
At and For the Quarter Ended
RevenuePremiums - life insurancePremiums - health insurance
Total revenue
Change in insurance/investment contract liabilities & reinsurance assets
Ceded premiumsNet premiumsNet investment income (loss)Fee income
Sun Life 12
2020 2019 2018Q2 Q1 Q4 Q3 Q2 Q1 Q4 Q3 Q2
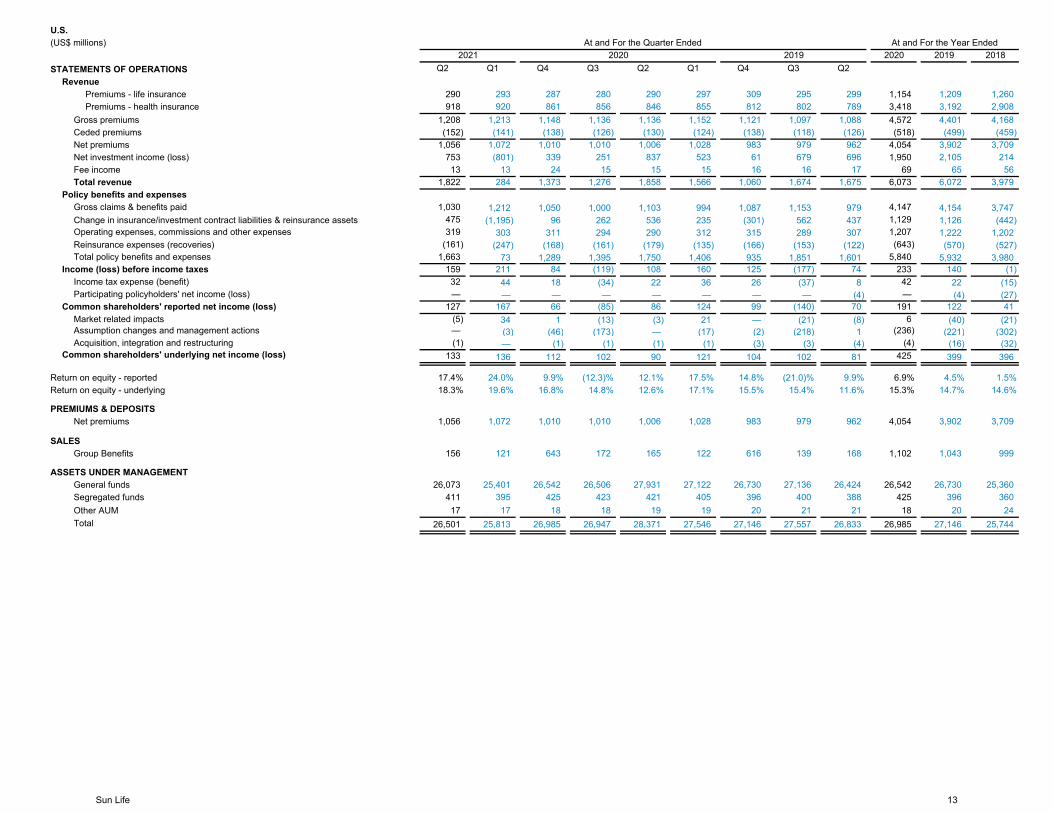
290 293 287 280 290 297 309 295 299 1,154 1,209 1,260918 920 861 856 846 855 812 802 789 3,418 3,192 2,908
1,208 1,213 1,148 1,136 1,136 1,152 1,121 1,097 1,088 4,572 4,401 4,168(152) (141) (138) (126) (130) (124) (138) (118) (126) (518) (499) (459)
1,056 1,072 1,010 1,010 1,006 1,028 983 979 962 4,054 3,902 3,709753 (801) 339 251 837 523 61 679 696 1,950 2,105 21413 13 24 15 15 15 16 16 17 69 65 56
1,822 284 1,373 1,276 1,858 1,566 1,060 1,674 1,675 6,073 6,072 3,979
1,030 1,212 1,050 1,000 1,103 994 1,087 1,153 979 4,147 4,154 3,747475 (1,195) 96 262 536 235 (301) 562 437 1,129 1,126 (442)319 303 311 294 290 312 315 289 307 1,207 1,222 1,202
(161) (247) (168) (161) (179) (135) (166) (153) (122) (643) (570) (527)1,663 73 1,289 1,395 1,750 1,406 935 1,851 1,601 5,840 5,932 3,980
159 211 84 (119) 108 160 125 (177) 74 233 140 (1)32 44 18 (34) 22 36 26 (37) 8 42 22 (15)— — — — — — — — (4) — (4) (27)
127 167 66 (85) 86 124 99 (140) 70 191 122 41(5) 34 1 (13) (3) 21 — (21) (8) 6 (40) (21)— (3) (46) (173) — (17) (2) (218) 1 (236) (221) (302)(1) — (1) (1) (1) (1) (3) (3) (4) (4) (16) (32)
133 136 112 102 90 121 104 102 81 425 399 396
17.4% 24.0% 9.9% (12.3)% 12.1% 17.5% 14.8% (21.0)% 9.9% 6.9% 4.5% 1.5%18.3% 19.6% 16.8% 14.8% 12.6% 17.1% 15.5% 15.4% 11.6% 15.3% 14.7% 14.6%
1,056 1,072 1,010 1,010 1,006 1,028 983 979 962 4,054 3,902 3,709
156 121 643 172 165 122 616 139 168 1,102 1,043 999
26,073 25,401 26,542 26,506 27,931 27,122 26,730 27,136 26,424 26,542 26,730 25,360411 395 425 423 421 405 396 400 388 425 396 36017 17 18 18 19 19 20 21 21 18 20 24
26,501 25,813 26,985 26,947 28,371 27,546 27,146 27,557 26,833 26,985 27,146 25,744
ASSETS UNDER MANAGEMENTGeneral fundsSegregated fundsOther AUM Total
SALESGroup Benefits
Return on equity - reportedReturn on equity - underlying
PREMIUMS & DEPOSITSNet premiums
Market related impactsAssumption changes and management actions Acquisition, integration and restructuring
Common shareholders' underlying net income (loss)
Gross claims & benefits paidChange in insurance/investment contract liabilities & reinsurance assets
Participating policyholders' net income (loss)Common shareholders' reported net income (loss)
Operating expenses, commissions and other expensesReinsurance expenses (recoveries)Total policy benefits and expenses
Income (loss) before income taxesIncome tax expense (benefit)
Net premiumsNet investment income (loss)Fee incomeTotal revenue
Policy benefits and expenses
Premiums - health insuranceGross premiumsCeded premiums
STATEMENTS OF OPERATIONSRevenue
U.S.
Premiums - life insurance
At and For the Quarter Ended(US$ millions)2019
At and For the Year Ended20202021
Sun Life 13

2020 2019 2018Q2 Q1 Q4 Q3 Q2 Q1 Q4 Q3 Q2
1,099 1,099 1,033 1,025 1,020 1,031 992 980 965 4,109 3,904 3,641(48) (46) (47) (42) (44) (41) (44) (38) (38) (174) (158) (136)
1,051 1,053 986 983 976 990 948 942 927 3,935 3,746 3,50581 (24) 67 67 173 (42) 49 84 84 265 320 9424 24 33 24 24 24 24 24 26 105 99 93
1,156 1,053 1,086 1,074 1,173 972 1,021 1,050 1,037 4,305 4,165 3,692
756 806 744 676 739 752 695 880 717 2,911 2,945 2,71528 (97) 13 53 108 (110) (3) (41) 20 64 17 (220)
297 294 289 275 277 292 283 278 285 1,133 1,135 1,124(52) (62) (58) (51) (53) (61) (35) (63) (37) (223) (170) (203)
1,029 941 988 953 1,071 873 940 1,054 985 3,885 3,927 3,416127 112 98 121 102 99 81 (4) 52 420 238 27627 24 22 24 22 21 17 — 11 89 51 59
100 88 76 97 80 78 64 (4) 41 331 187 217
1,051 1,053 986 983 976 990 948 942 927 3,935 3,746 3,505
8,328 7,968 7,967 7,958 7,951 7,758 7,848 7,948 7,926 7,967 7,848 7,704
68 87 205 96 62 74 191 72 62 437 388 43188 34 438 76 103 48 425 67 106 665 655 568
156 121 643 172 165 122 616 139 168 1,102 1,043 999
2,439 2,440 2,391 2,327 2,365 2,371 2,374 2,398 2,409 2,391 2,374 2,3852,274 2,245 2,161 2,093 2,076 2,032 1,912 1,845 1,826 2,161 1,912 1,6314,713 4,685 4,552 4,420 4,441 4,403 4,286 4,243 4,235 4,552 4,286 4,016
8.5% 8.1% 8.0% 7.8% 7.5% 6.8% 7.3% 7.2% 7.3% 8.0% 7.3% 6.7%
(2) The after-tax profit margin is calculated on underlying net income as a percentage of net premiums on a trailing four-quarters basis.
(1) Represents annualized premiums for insured in-force and premium equivalent annualized fee income for ASO in-force on a gross basis.
U.S. - GROUP BENEFITS At and For the Quarter Ended
AFTER-TAX PROFIT MARGIN (2)
Fee incomeTotal revenue
Policy benefits and expensesGross claims & benefits paidChange in insurance/investment contract liabilities & reinsurance assets
Medical Stop-Loss
SALES
Income (loss) before income taxes
Employee Benefits (1)
PREMIUMS & DEPOSITS
Income tax expense (benefit)
Employee Benefits
Operating expenses, commissions and other expensesReinsurance expenses (recoveries)Total policy benefits and expenses
ASSETS UNDER MANAGEMENTGeneral Funds
Common shareholders' reported net income (loss)
Net premiums
Net investment income (loss)
(US$ millions)2019
At and For the Year Ended
STATEMENTS OF OPERATIONSRevenue
Gross premiumsCeded premiumsNet premiums
20202021
TotalMedical Stop-Loss
Total
BUSINESS IN-FORCE
Sun Life 14
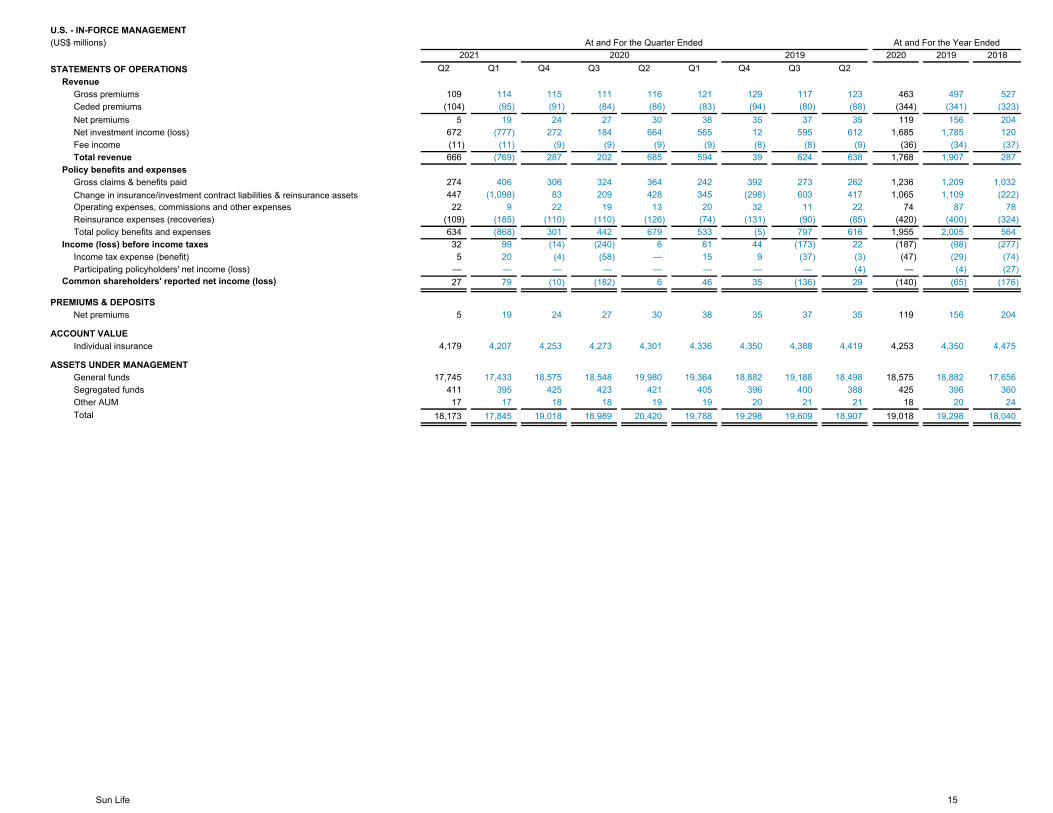
2020 2019 2018Q2 Q1 Q4 Q3 Q2 Q1 Q4 Q3 Q2
109 114 115 111 116 121 129 117 123 463 497 527(104) (95) (91) (84) (86) (83) (94) (80) (88) (344) (341) (323)
5 19 24 27 30 38 35 37 35 119 156 204672 (777) 272 184 664 565 12 595 612 1,685 1,785 120(11) (11) (9) (9) (9) (9) (8) (8) (9) (36) (34) (37)666 (769) 287 202 685 594 39 624 638 1,768 1,907 287
274 406 306 324 364 242 392 273 262 1,236 1,209 1,032447 (1,098) 83 209 428 345 (298) 603 417 1,065 1,109 (222)22 9 22 19 13 20 32 11 22 74 87 78
(109) (185) (110) (110) (126) (74) (131) (90) (85) (420) (400) (324)634 (868) 301 442 679 533 (5) 797 616 1,955 2,005 56432 99 (14) (240) 6 61 44 (173) 22 (187) (98) (277)5 20 (4) (58) — 15 9 (37) (3) (47) (29) (74)
— — — — — — — — (4) — (4) (27)27 79 (10) (182) 6 46 35 (136) 29 (140) (65) (176)
5 19 24 27 30 38 35 37 35 119 156 204
4,179 4,207 4,253 4,273 4,301 4,336 4,350 4,388 4,419 4,253 4,350 4,475
17,745 17,433 18,575 18,548 19,980 19,364 18,882 19,188 18,498 18,575 18,882 17,656411 395 425 423 421 405 396 400 388 425 396 36017 17 18 18 19 19 20 21 21 18 20 24
18,173 17,845 19,018 18,989 20,420 19,788 19,298 19,609 18,907 19,018 19,298 18,040
Segregated fundsOther AUMTotal
ACCOUNT VALUEIndividual insurance
ASSETS UNDER MANAGEMENTGeneral funds
Income tax expense (benefit)Participating policyholders' net income (loss)
Common shareholders' reported net income (loss)
PREMIUMS & DEPOSITSNet premiums
Change in insurance/investment contract liabilities & reinsurance assetsOperating expenses, commissions and other expensesReinsurance expenses (recoveries)Total policy benefits and expenses
Income (loss) before income taxes
Gross claims & benefits paid
U.S. - IN-FORCE MANAGEMENT
Gross premiumsCeded premiums
(US$ millions)
Net premiums
Revenue
Net investment income (loss)Fee incomeTotal revenue
STATEMENTS OF OPERATIONS
Policy benefits and expenses
At and For the Quarter Ended2019
At and For the Year Ended20202021
Sun Life 15
2020 2019 2018Q2 Q1 Q4 Q3 Q2 Q1 Q4 Q3 Q2
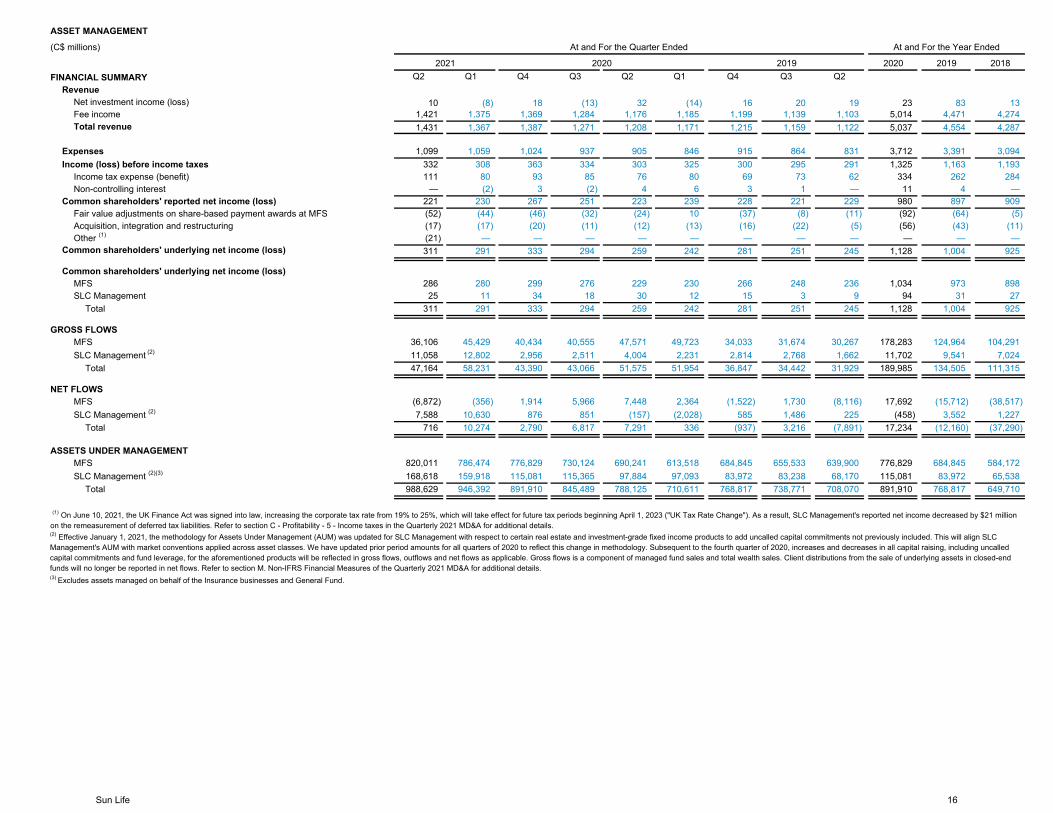
10 (8) 18 (13) 32 (14) 16 20 19 23 83 131,421 1,375 1,369 1,284 1,176 1,185 1,199 1,139 1,103 5,014 4,471 4,2741,431 1,367 1,387 1,271 1,208 1,171 1,215 1,159 1,122 5,037 4,554 4,287
1,099 1,059 1,024 937 905 846 915 864 831 3,712 3,391 3,094332 308 363 334 303 325 300 295 291 1,325 1,163 1,193111 80 93 85 76 80 69 73 62 334 262 284
— (2) 3 (2) 4 6 3 1 — 11 4 —221 230 267 251 223 239 228 221 229 980 897 909(52) (44) (46) (32) (24) 10 (37) (8) (11) (92) (64) (5)(17) (17) (20) (11) (12) (13) (16) (22) (5) (56) (43) (11)(21) — — — — — — — — — — —311 291 333 294 259 242 281 251 245 1,128 1,004 925
286 280 299 276 229 230 266 248 236 1,034 973 89825 11 34 18 30 12 15 3 9 94 31 27
Total 311 291 333 294 259 242 281 251 245 1,128 1,004 925
GROSS FLOWS36,106 45,429 40,434 40,555 47,571 49,723 34,033 31,674 30,267 178,283 124,964 104,29111,058 12,802 2,956 2,511 4,004 2,231 2,814 2,768 1,662 11,702 9,541 7,024
Total 47,164 58,231 43,390 43,066 51,575 51,954 36,847 34,442 31,929 189,985 134,505 111,315
NET FLOWS(6,872) (356) 1,914 5,966 7,448 2,364 (1,522) 1,730 (8,116) 17,692 (15,712) (38,517)7,588 10,630 876 851 (157) (2,028) 585 1,486 225 (458) 3,552 1,227
Total 716 10,274 2,790 6,817 7,291 336 (937) 3,216 (7,891) 17,234 (12,160) (37,290)
ASSETS UNDER MANAGEMENT 820,011 786,474 776,829 730,124 690,241 613,518 684,845 655,533 639,900 776,829 684,845 584,172168,618 159,918 115,081 115,365 97,884 97,093 83,972 83,238 68,170 115,081 83,972 65,538
Total 988,629 946,392 891,910 845,489 788,125 710,611 768,817 738,771 708,070 891,910 768,817 649,710
(1) On June 10, 2021, the UK Finance Act was signed into law, increasing the corporate tax rate from 19% to 25%, which will take effect for future tax periods beginning April 1, 2023 ("UK Tax Rate Change"). As a result, SLC Management's reported net income decreased by $21 million on the remeasurement of deferred tax liabilities. Refer to section C - Profitability - 5 - Income taxes in the Quarterly 2021 MD&A for additional details.
Non-controlling interest
Fee income
Common shareholders' reported net income (loss)
Expenses
SLC Management (2)
Common shareholders' underlying net income (loss)
Common shareholders' underlying net income (loss)
Fair value adjustments on share-based payment awards at MFS
SLC Management
MFS
Acquisition, integration and restructuringOther (1)
At and For the Year Ended
MFSSLC Management (2)(3)
MFSSLC Management (2)
Income (loss) before income taxes
Total revenue
Income tax expense (benefit)
2021
(3) Excludes assets managed on behalf of the Insurance businesses and General Fund.
Revenue
(2) Effective January 1, 2021, the methodology for Assets Under Management (AUM) was updated for SLC Management with respect to certain real estate and investment-grade fixed income products to add uncalled capital commitments not previously included. This will align SLC Management's AUM with market conventions applied across asset classes. We have updated prior period amounts for all quarters of 2020 to reflect this change in methodology. Subsequent to the fourth quarter of 2020, increases and decreases in all capital raising, including uncalled capital commitments and fund leverage, for the aforementioned products will be reflected in gross flows, outflows and net flows as applicable. Gross flows is a component of managed fund sales and total wealth sales. Client distributions from the sale of underlying assets in closed-end funds will no longer be reported in net flows. Refer to section M. Non-IFRS Financial Measures of the Quarterly 2021 MD&A for additional details.
MFS
Net investment income (loss)
ASSET MANAGEMENT
FINANCIAL SUMMARY
(C$ millions) At and For the Quarter Ended
20192020
Sun Life 16
2020 2019 2018Q2 Q1 Q4 Q3 Q2 Q1 Q4 Q3 Q2
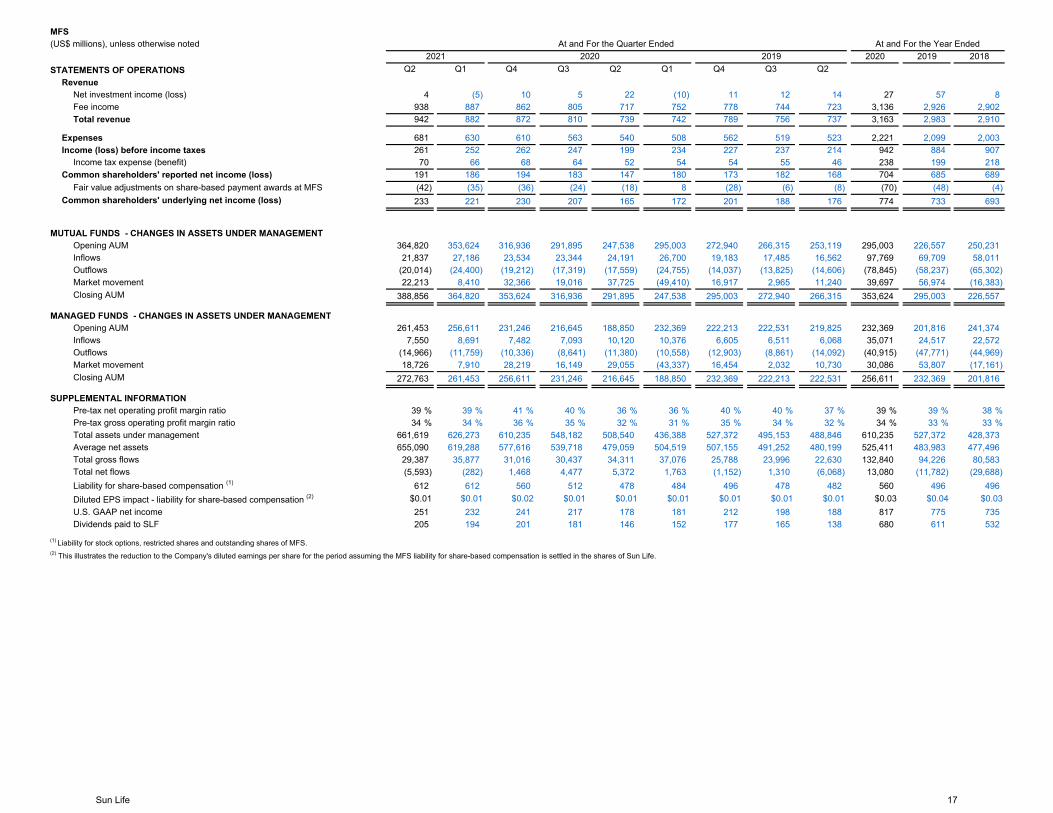
4 (5) 10 5 22 (10) 11 12 14 27 57 8938 887 862 805 717 752 778 744 723 3,136 2,926 2,902942 882 872 810 739 742 789 756 737 3,163 2,983 2,910
681 630 610 563 540 508 562 519 523 2,221 2,099 2,003261 252 262 247 199 234 227 237 214 942 884 907
70 66 68 64 52 54 54 55 46 238 199 218191 186 194 183 147 180 173 182 168 704 685 689(42) (35) (36) (24) (18) 8 (28) (6) (8) (70) (48) (4)233 221 230 207 165 172 201 188 176 774 733 693
364,820 353,624 316,936 291,895 247,538 295,003 272,940 266,315 253,119 295,003 226,557 250,23121,837 27,186 23,534 23,344 24,191 26,700 19,183 17,485 16,562 97,769 69,709 58,011
(20,014) (24,400) (19,212) (17,319) (17,559) (24,755) (14,037) (13,825) (14,606) (78,845) (58,237) (65,302)22,213 8,410 32,366 19,016 37,725 (49,410) 16,917 2,965 11,240 39,697 56,974 (16,383)
388,856 364,820 353,624 316,936 291,895 247,538 295,003 272,940 266,315 353,624 295,003 226,557
261,453 256,611 231,246 216,645 188,850 232,369 222,213 222,531 219,825 232,369 201,816 241,3747,550 8,691 7,482 7,093 10,120 10,376 6,605 6,511 6,068 35,071 24,517 22,572
(14,966) (11,759) (10,336) (8,641) (11,380) (10,558) (12,903) (8,861) (14,092) (40,915) (47,771) (44,969)18,726 7,910 28,219 16,149 29,055 (43,337) 16,454 2,032 10,730 30,086 53,807 (17,161)
272,763 261,453 256,611 231,246 216,645 188,850 232,369 222,213 222,531 256,611 232,369 201,816
39 % 39 % 41 % 40 % 36 % 36 % 40 % 40 % 37 % 39 % 39 % 38 %34 % 34 % 36 % 35 % 32 % 31 % 35 % 34 % 32 % 34 % 33 % 33 %
661,619 626,273 610,235 548,182 508,540 436,388 527,372 495,153 488,846 610,235 527,372 428,373655,090 619,288 577,616 539,718 479,059 504,519 507,155 491,252 480,199 525,411 483,983 477,496
29,387 35,877 31,016 30,437 34,311 37,076 25,788 23,996 22,630 132,840 94,226 80,583(5,593) (282) 1,468 4,477 5,372 1,763 (1,152) 1,310 (6,068) 13,080 (11,782) (29,688)
612 612 560 512 478 484 496 478 482 560 496 496$0.01 $0.01 $0.02 $0.01 $0.01 $0.01 $0.01 $0.01 $0.01 $0.03 $0.04 $0.03 251 232 241 217 178 181 212 198 188 817 775 735205 194 201 181 146 152 177 165 138 680 611 532
Pre-tax gross operating profit margin ratio
Average net assetsTotal assets under management
Dividends paid to SLF
(2) This illustrates the reduction to the Company's diluted earnings per share for the period assuming the MFS liability for share-based compensation is settled in the shares of Sun Life.
Total gross flowsTotal net flowsLiability for share-based compensation (1)
Diluted EPS impact - liability for share-based compensation (2)
U.S. GAAP net income
(1) Liability for stock options, restricted shares and outstanding shares of MFS.
OutflowsMarket movementClosing AUM
SUPPLEMENTAL INFORMATIONPre-tax net operating profit margin ratio
Market movementClosing AUM
Opening AUMMANAGED FUNDS - CHANGES IN ASSETS UNDER MANAGEMENT
Inflows
Common shareholders' underlying net income (loss)
Opening AUMInflowsOutflows
MUTUAL FUNDS - CHANGES IN ASSETS UNDER MANAGEMENT
ExpensesIncome (loss) before income taxes
Income tax expense (benefit)Common shareholders' reported net income (loss)
Fair value adjustments on share-based payment awards at MFS
Revenue
MFS
Net investment income (loss)Fee incomeTotal revenue
(US$ millions), unless otherwise noted
STATEMENTS OF OPERATIONS
At and For the Quarter Ended2019
At and For the Year Ended20202021
Sun Life 17
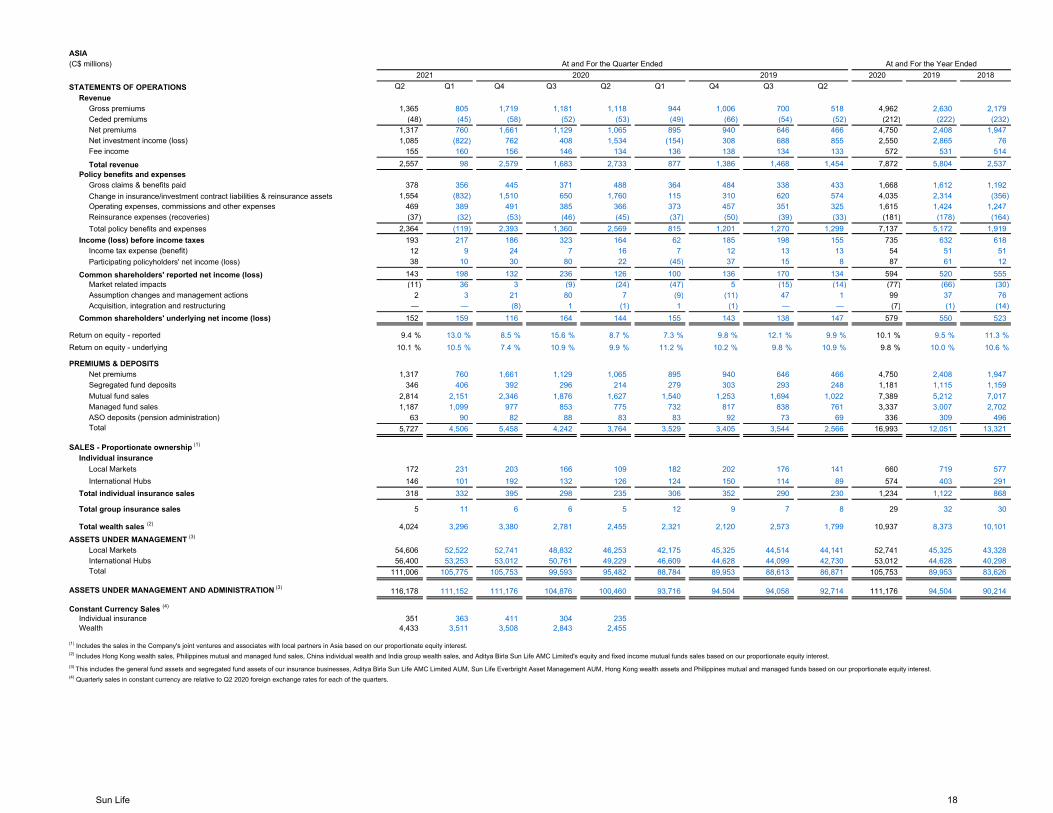
2020 2019 2018Q2 Q1 Q4 Q3 Q2 Q1 Q4 Q3 Q2
1,365 805 1,719 1,181 1,118 944 1,006 700 518 4,962 2,630 2,179 (48) (45) (58) (52) (53) (49) (66) (54) (52) (212) (222) (232)
1,317 760 1,661 1,129 1,065 895 940 646 466 4,750 2,408 1,947 1,085 (822) 762 408 1,534 (154) 308 688 855 2,550 2,865 76
155 160 156 146 134 136 138 134 133 572 531 514 2,557 98 2,579 1,683 2,733 877 1,386 1,468 1,454 7,872 5,804 2,537
378 356 445 371 488 364 484 338 433 1,668 1,612 1,192 1,554 (832) 1,510 650 1,760 115 310 620 574 4,035 2,314 (356)
469 389 491 385 366 373 457 351 325 1,615 1,424 1,247 (37) (32) (53) (46) (45) (37) (50) (39) (33) (181) (178) (164)
2,364 (119) 2,393 1,360 2,569 815 1,201 1,270 1,299 7,137 5,172 1,919 193 217 186 323 164 62 185 198 155 735 632 618
12 9 24 7 16 7 12 13 13 54 51 51 38 10 30 80 22 (45) 37 15 8 87 61 12
143 198 132 236 126 100 136 170 134 594 520 555 (11) 36 3 (9) (24) (47) 5 (15) (14) (77) (66) (30)
2 3 21 80 7 (9) (11) 47 1 99 37 76 — — (8) 1 (1) 1 (1) — — (7) (1) (14)
152 159 116 164 144 155 143 138 147 579 550 523
9.4 % 13.0 % 8.5 % 15.6 % 8.7 % 7.3 % 9.8 % 12.1 % 9.9 % 10.1 % 9.5 % 11.3 %10.1 % 10.5 % 7.4 % 10.9 % 9.9 % 11.2 % 10.2 % 9.8 % 10.9 % 9.8 % 10.0 % 10.6 %
1,317 760 1,661 1,129 1,065 895 940 646 466 4,750 2,408 1,947 346 406 392 296 214 279 303 293 248 1,181 1,115 1,159
2,814 2,151 2,346 1,876 1,627 1,540 1,253 1,694 1,022 7,389 5,212 7,017 1,187 1,099 977 853 775 732 817 838 761 3,337 3,007 2,702
63 90 82 88 83 83 92 73 69 336 309 496 5,727 4,506 5,458 4,242 3,764 3,529 3,405 3,544 2,566 16,993 12,051 13,321
172 231 203 166 109 182 202 176 141 660 719 577 146 101 192 132 126 124 150 114 89 574 403 291318 332 395 298 235 306 352 290 230 1,234 1,122 868
5 11 6 6 5 12 9 7 8 29 32 30
4,024 3,296 3,380 2,781 2,455 2,321 2,120 2,573 1,799 10,937 8,373 10,101
54,606 52,522 52,741 48,832 46,253 42,175 45,325 44,514 44,141 52,741 45,325 43,32856,400 53,253 53,012 50,761 49,229 46,609 44,628 44,099 42,730 53,012 44,628 40,298
111,006 105,775 105,753 99,593 95,482 88,784 89,953 88,613 86,871 105,753 89,953 83,626
116,178 111,152 111,176 104,876 100,460 93,716 94,504 94,058 92,714 111,176 94,504 90,214
351 363 411 304 2354,433 3,511 3,508 2,843 2,455
Income tax expense (benefit)
2020At and For the Year Ended
Total individual insurance sales
Total group insurance sales
STATEMENTS OF OPERATIONSRevenue
2019
PREMIUMS & DEPOSITSNet premiums
2021
Total wealth sales (2)
Net investment income (loss)
Gross premiumsCeded premiumsNet premiums
Common shareholders' reported net income (loss)
Fee income
Total revenuePolicy benefits and expenses
Gross claims & benefits paidChange in insurance/investment contract liabilities & reinsurance assetsOperating expenses, commissions and other expenses
Individual insuranceLocal Markets International Hubs
Return on equity - underlying
(4) Quarterly sales in constant currency are relative to Q2 2020 foreign exchange rates for each of the quarters.
Wealth
Return on equity - reported
Assumption changes and management actions
Individual insurance
ASSETS UNDER MANAGEMENT AND ADMINISTRATION (3)
Constant Currency Sales (4)
Acquisition, integration and restructuring
Segregated fund depositsMutual fund sales Managed fund sales
Common shareholders' underlying net income (loss)
ASSETS UNDER MANAGEMENT (3)
Local Markets
(1) Includes the sales in the Company's joint ventures and associates with local partners in Asia based on our proportionate equity interest. (2) Includes Hong Kong wealth sales, Philippines mutual and managed fund sales, China individual wealth and India group wealth sales, and Aditya Birla Sun Life AMC Limited's equity and fixed income mutual funds sales based on our proportionate equity interest.(3) This includes the general fund assets and segregated fund assets of our insurance businesses, Aditya Birla Sun Life AMC Limited AUM, Sun Life Everbright Asset Management AUM, Hong Kong wealth assets and Philippines mutual and managed funds based on our proportionate equity interest.
TotalInternational Hubs
ASO deposits (pension administration)Total
SALES - Proportionate ownership (1)
Participating policyholders' net income (loss)
Total policy benefits and expensesIncome (loss) before income taxes
Market related impacts
Reinsurance expenses (recoveries)
ASIA(C$ millions) At and For the Quarter Ended
Sun Life 18
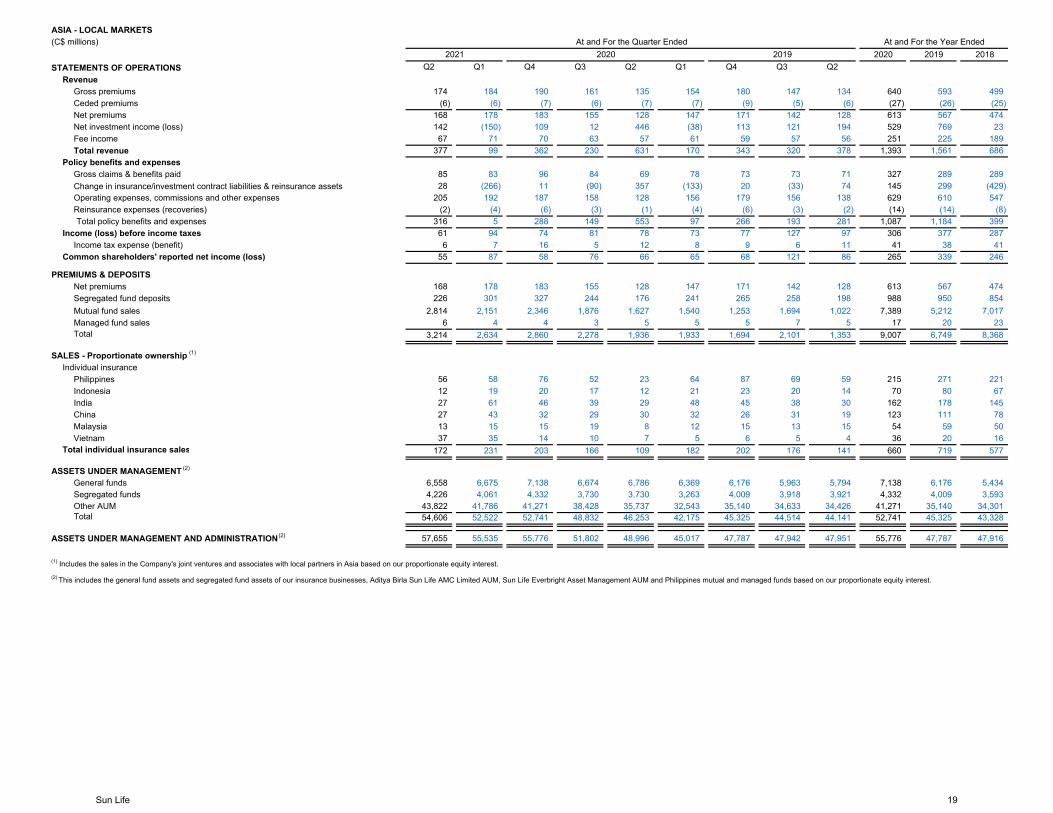
2020 2019 2018Q2 Q1 Q4 Q3 Q2 Q1 Q4 Q3 Q2
174 184 190 161 135 154 180 147 134 640 593 499(6) (6) (7) (6) (7) (7) (9) (5) (6) (27) (26) (25)
168 178 183 155 128 147 171 142 128 613 567 474142 (150) 109 12 446 (38) 113 121 194 529 769 2367 71 70 63 57 61 59 57 56 251 225 189
377 99 362 230 631 170 343 320 378 1,393 1,561 686
85 83 96 84 69 78 73 73 71 327 289 28928 (266) 11 (90) 357 (133) 20 (33) 74 145 299 (429)
205 192 187 158 128 156 179 156 138 629 610 547(2) (4) (6) (3) (1) (4) (6) (3) (2) (14) (14) (8)
Total policy benefits and expenses 316 5 288 149 553 97 266 193 281 1,087 1,184 39961 94 74 81 78 73 77 127 97 306 377 2876 7 16 5 12 8 9 6 11 41 38 41
55 87 58 76 66 65 68 121 86 265 339 246
168 178 183 155 128 147 171 142 128 613 567 474226 301 327 244 176 241 265 258 198 988 950 854
2,814 2,151 2,346 1,876 1,627 1,540 1,253 1,694 1,022 7,389 5,212 7,0176 4 4 3 5 5 5 7 5 17 20 23
3,214 2,634 2,860 2,278 1,936 1,933 1,694 2,101 1,353 9,007 6,749 8,368
56 58 76 52 23 64 87 69 59 215 271 22112 19 20 17 12 21 23 20 14 70 80 6727 61 46 39 29 48 45 38 30 162 178 14527 43 32 29 30 32 26 31 19 123 111 7813 15 15 19 8 12 15 13 15 54 59 5037 35 14 10 7 5 6 5 4 36 20 16
172 231 203 166 109 182 202 176 141 660 719 577
6,558 6,675 7,138 6,674 6,786 6,369 6,176 5,963 5,794 7,138 6,176 5,4344,226 4,061 4,332 3,730 3,730 3,263 4,009 3,918 3,921 4,332 4,009 3,593
43,822 41,786 41,271 38,428 35,737 32,543 35,140 34,633 34,426 41,271 35,140 34,30154,606 52,522 52,741 48,832 46,253 42,175 45,325 44,514 44,141 52,741 45,325 43,328
57,655 55,535 55,776 51,802 48,996 45,017 47,787 47,942 47,951 55,776 47,787 47,916
ChinaMalaysiaVietnam
Total individual insurance sales
(1) Includes the sales in the Company's joint ventures and associates with local partners in Asia based on our proportionate equity interest.(2) This includes the general fund assets and segregated fund assets of our insurance businesses, Aditya Birla Sun Life AMC Limited AUM, Sun Life Everbright Asset Management AUM and Philippines mutual and managed funds based on our proportionate equity interest.
ASSETS UNDER MANAGEMENT (2)
General fundsSegregated fundsOther AUMTotal
ASSETS UNDER MANAGEMENT AND ADMINISTRATION (2)
SALES - Proportionate ownership (1)
Individual insurancePhilippinesIndonesiaIndia
Net premiumsSegregated fund depositsMutual fund sales Managed fund salesTotal
Income (loss) before income taxesIncome tax expense (benefit)
Common shareholders' reported net income (loss)
PREMIUMS & DEPOSITS
Gross claims & benefits paidChange in insurance/investment contract liabilities & reinsurance assetsOperating expenses, commissions and other expensesReinsurance expenses (recoveries)
STATEMENTS OF OPERATIONSRevenue
Total revenuePolicy benefits and expenses
Net premiumsNet investment income (loss)Fee income
Gross premiumsCeded premiums
(C$ millions)ASIA - LOCAL MARKETS
At and For the Quarter Ended2019
At and For the Year Ended20202021
Sun Life 19
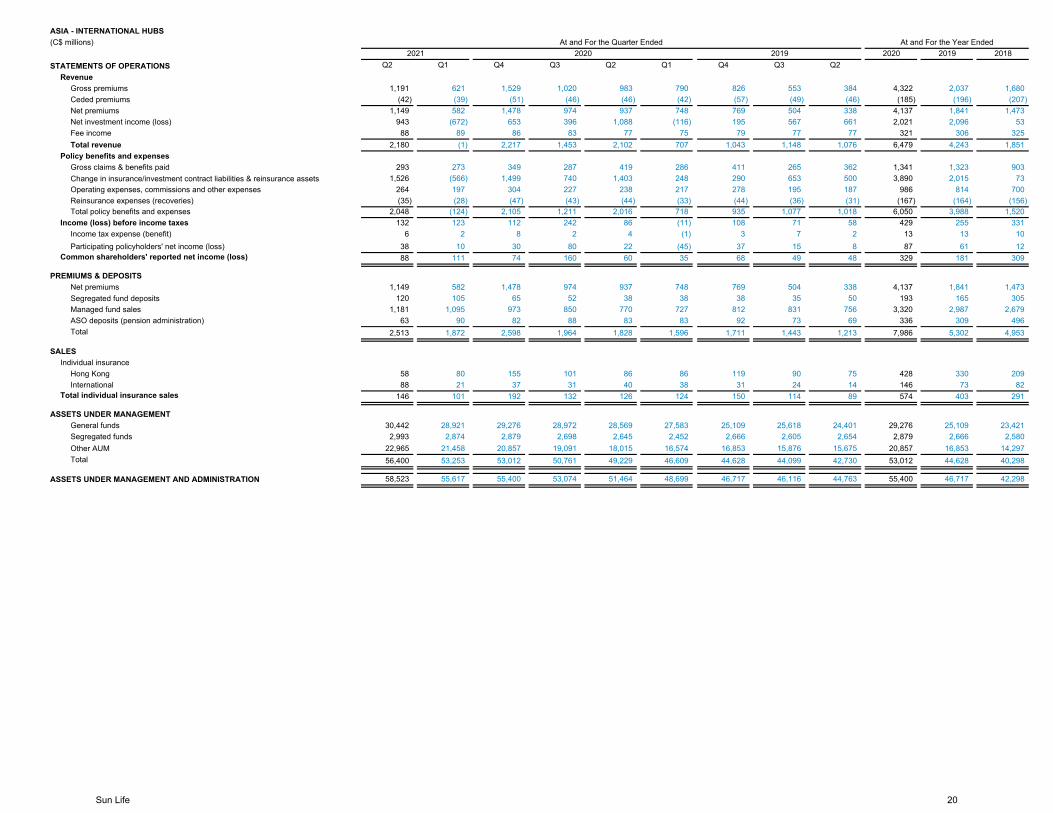
2020 2019 2018Q2 Q1 Q4 Q3 Q2 Q1 Q4 Q3 Q2
1,191 621 1,529 1,020 983 790 826 553 384 4,322 2,037 1,680(42) (39) (51) (46) (46) (42) (57) (49) (46) (185) (196) (207)
1,149 582 1,478 974 937 748 769 504 338 4,137 1,841 1,473943 (672) 653 396 1,088 (116) 195 567 661 2,021 2,096 5388 89 86 83 77 75 79 77 77 321 306 325
2,180 (1) 2,217 1,453 2,102 707 1,043 1,148 1,076 6,479 4,243 1,851
293 273 349 287 419 286 411 265 362 1,341 1,323 9031,526 (566) 1,499 740 1,403 248 290 653 500 3,890 2,015 73
264 197 304 227 238 217 278 195 187 986 814 700(35) (28) (47) (43) (44) (33) (44) (36) (31) (167) (164) (156)
2,048 (124) 2,105 1,211 2,016 718 935 1,077 1,018 6,050 3,988 1,520132 123 112 242 86 (11) 108 71 58 429 255 331
6 2 8 2 4 (1) 3 7 2 13 13 1038 10 30 80 22 (45) 37 15 8 87 61 1288 111 74 160 60 35 68 49 48 329 181 309
1,149 582 1,478 974 937 748 769 504 338 4,137 1,841 1,473120 105 65 52 38 38 38 35 50 193 165 305
1,181 1,095 973 850 770 727 812 831 756 3,320 2,987 2,67963 90 82 88 83 83 92 73 69 336 309 496
2,513 1,872 2,598 1,964 1,828 1,596 1,711 1,443 1,213 7,986 5,302 4,953
58 80 155 101 86 86 119 90 75 428 330 20988 21 37 31 40 38 31 24 14 146 73 82
146 101 192 132 126 124 150 114 89 574 403 291
30,442 28,921 29,276 28,972 28,569 27,583 25,109 25,618 24,401 29,276 25,109 23,4212,993 2,874 2,879 2,698 2,645 2,452 2,666 2,605 2,654 2,879 2,666 2,580
22,965 21,458 20,857 19,091 18,015 16,574 16,853 15,876 15,675 20,857 16,853 14,29756,400 53,253 53,012 50,761 49,229 46,609 44,628 44,099 42,730 53,012 44,628 40,298
58,523 55,617 55,400 53,074 51,464 48,699 46,717 46,116 44,763 55,400 46,717 42,298
Hong KongInternational
Individual insurance
Total revenuePolicy benefits and expenses
TotalASO deposits (pension administration)
Total individual insurance sales
ASSETS UNDER MANAGEMENT AND ADMINISTRATION
ASIA - INTERNATIONAL HUBS
Total
ASSETS UNDER MANAGEMENTGeneral fundsSegregated funds
Change in insurance/investment contract liabilities & reinsurance assetsGross claims & benefits paid
Common shareholders' reported net income (loss)Participating policyholders' net income (loss)
PREMIUMS & DEPOSITSNet premiums
SALES
Total policy benefits and expensesIncome (loss) before income taxes
Income tax expense (benefit)
Operating expenses, commissions and other expenses
(C$ millions)
STATEMENTS OF OPERATIONSRevenue
At and For the Quarter Ended At and For the Year Ended20202021
Gross premiumsCeded premiums
Reinsurance expenses (recoveries)
2019
Other AUM
Net premiumsNet investment income (loss)Fee income
Segregated fund depositsManaged fund sales
Sun Life 20
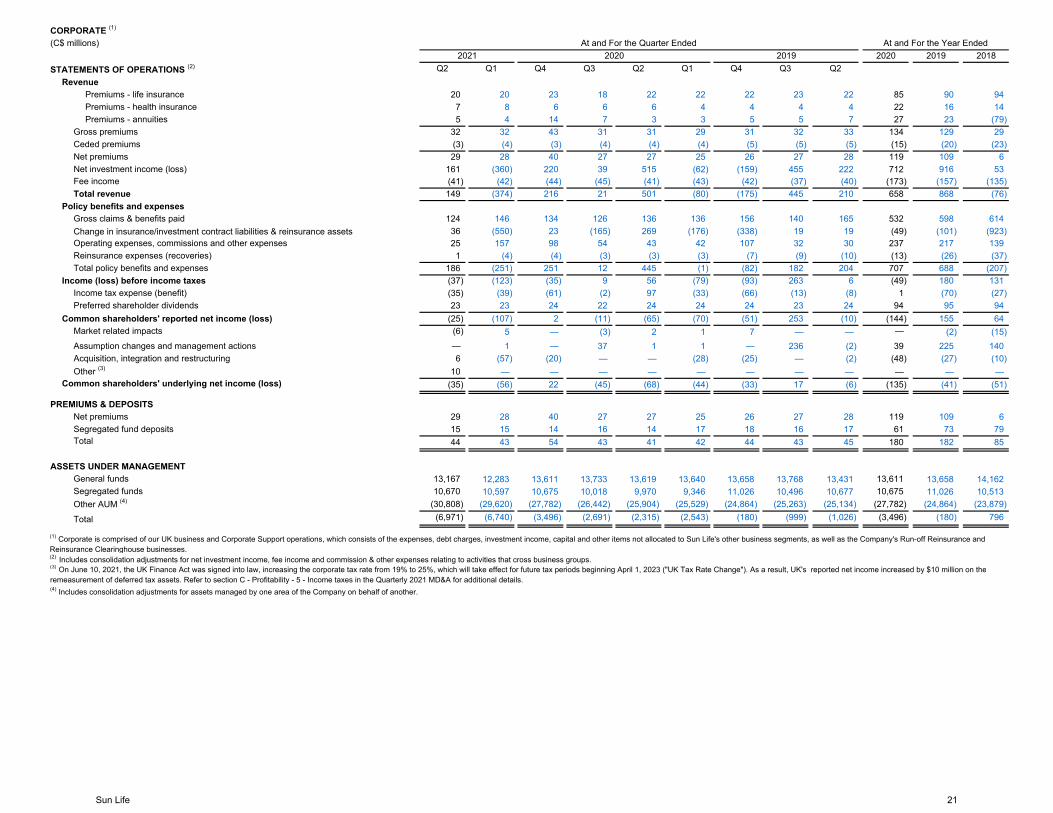
2020 2019 2018Q2 Q1 Q4 Q3 Q2 Q1 Q4 Q3 Q2
20 20 23 18 22 22 22 23 22 85 90 947 8 6 6 6 4 4 4 4 22 16 145 4 14 7 3 3 5 5 7 27 23 (79)
32 32 43 31 31 29 31 32 33 134 129 29(3) (4) (3) (4) (4) (4) (5) (5) (5) (15) (20) (23)29 28 40 27 27 25 26 27 28 119 109 6
161 (360) 220 39 515 (62) (159) 455 222 712 916 53(41) (42) (44) (45) (41) (43) (42) (37) (40) (173) (157) (135)149 (374) 216 21 501 (80) (175) 445 210 658 868 (76)
124 146 134 126 136 136 156 140 165 532 598 61436 (550) 23 (165) 269 (176) (338) 19 19 (49) (101) (923)25 157 98 54 43 42 107 32 30 237 217 139
1 (4) (4) (3) (3) (3) (7) (9) (10) (13) (26) (37)186 (251) 251 12 445 (1) (82) 182 204 707 688 (207)(37) (123) (35) 9 56 (79) (93) 263 6 (49) 180 131(35) (39) (61) (2) 97 (33) (66) (13) (8) 1 (70) (27)23 23 24 22 24 24 24 23 24 94 95 94
(25) (107) 2 (11) (65) (70) (51) 253 (10) (144) 155 64(6) 5 — (3) 2 1 7 — — — (2) (15)— 1 — 37 1 1 — 236 (2) 39 225 1406 (57) (20) — — (28) (25) — (2) (48) (27) (10)
10 — — — — — — — — — — —(35) (56) 22 (45) (68) (44) (33) 17 (6) (135) (41) (51)
29 28 40 27 27 25 26 27 28 119 109 615 15 14 16 14 17 18 16 17 61 73 7944 43 54 43 41 42 44 43 45 180 182 85
13,167 12,283 13,611 13,733 13,619 13,640 13,658 13,768 13,431 13,611 13,658 14,16210,670 10,597 10,675 10,018 9,970 9,346 11,026 10,496 10,677 10,675 11,026 10,513
(30,808) (29,620) (27,782) (26,442) (25,904) (25,529) (24,864) (25,263) (25,134) (27,782) (24,864) (23,879)(6,971) (6,740) (3,496) (2,691) (2,315) (2,543) (180) (999) (1,026) (3,496) (180) 796
2021
General fundsSegregated fundsOther AUM (4)
Assumption changes and management actions
Total revenue
Other (3)
Income (loss) before income taxes
Acquisition, integration and restructuring
Market related impacts
Income tax expense (benefit)Preferred shareholder dividends
Common shareholders' reported net income (loss)
Common shareholders' underlying net income (loss)
PREMIUMS & DEPOSITS
CORPORATE (1)
(C$ millions)
Premiums - health insurancePremiums - annuities
STATEMENTS OF OPERATIONS (2)
RevenuePremiums - life insurance
2020At and For the Year EndedAt and For the Quarter Ended
Total policy benefits and expenses
Gross premiums
2019
Policy benefits and expensesGross claims & benefits paidChange in insurance/investment contract liabilities & reinsurance assetsOperating expenses, commissions and other expenses Reinsurance expenses (recoveries)
Ceded premiumsNet premiumsNet investment income (loss)Fee income
(3) On June 10, 2021, the UK Finance Act was signed into law, increasing the corporate tax rate from 19% to 25%, which will take effect for future tax periods beginning April 1, 2023 ("UK Tax Rate Change"). As a result, UK's reported net income increased by $10 million on theremeasurement of deferred tax assets. Refer to section C - Profitability - 5 - Income taxes in the Quarterly 2021 MD&A for additional details.
(1) Corporate is comprised of our UK business and Corporate Support operations, which consists of the expenses, debt charges, investment income, capital and other items not allocated to Sun Life's other business segments, as well as the Company's Run-off Reinsurance and Reinsurance Clearinghouse businesses.(2) Includes consolidation adjustments for net investment income, fee income and commission & other expenses relating to activities that cross business groups.
(4) Includes consolidation adjustments for assets managed by one area of the Company on behalf of another.
Net premiums
Total
Segregated fund depositsTotal
ASSETS UNDER MANAGEMENT
Sun Life 21
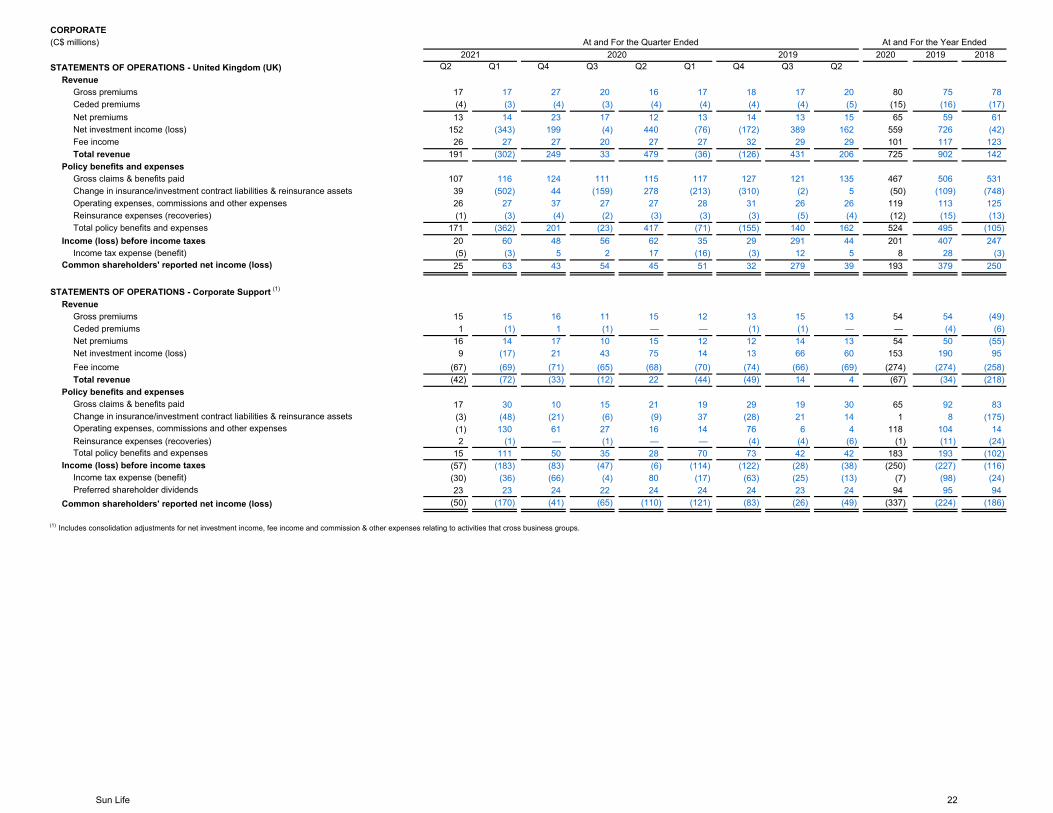
2020 2019 2018Q2 Q1 Q4 Q3 Q2 Q1 Q4 Q3 Q2
17 17 27 20 16 17 18 17 20 80 75 78(4) (3) (4) (3) (4) (4) (4) (4) (5) (15) (16) (17)13 14 23 17 12 13 14 13 15 65 59 61
152 (343) 199 (4) 440 (76) (172) 389 162 559 726 (42)26 27 27 20 27 27 32 29 29 101 117 123
191 (302) 249 33 479 (36) (126) 431 206 725 902 142
107 116 124 111 115 117 127 121 135 467 506 53139 (502) 44 (159) 278 (213) (310) (2) 5 (50) (109) (748)26 27 37 27 27 28 31 26 26 119 113 125(1) (3) (4) (2) (3) (3) (3) (5) (4) (12) (15) (13)
171 (362) 201 (23) 417 (71) (155) 140 162 524 495 (105)20 60 48 56 62 35 29 291 44 201 407 247(5) (3) 5 2 17 (16) (3) 12 5 8 28 (3)25 63 43 54 45 51 32 279 39 193 379 250
15 15 16 11 15 12 13 15 13 54 54 (49)1 (1) 1 (1) — — (1) (1) — — (4) (6)
16 14 17 10 15 12 12 14 13 54 50 (55)9 (17) 21 43 75 14 13 66 60 153 190 95
(67) (69) (71) (65) (68) (70) (74) (66) (69) (274) (274) (258)(42) (72) (33) (12) 22 (44) (49) 14 4 (67) (34) (218)
17 30 10 15 21 19 29 19 30 65 92 83(3) (48) (21) (6) (9) 37 (28) 21 14 1 8 (175)(1) 130 61 27 16 14 76 6 4 118 104 142 (1) — (1) — — (4) (4) (6) (1) (11) (24)
15 111 50 35 28 70 73 42 42 183 193 (102)(57) (183) (83) (47) (6) (114) (122) (28) (38) (250) (227) (116)(30) (36) (66) (4) 80 (17) (63) (25) (13) (7) (98) (24)23 23 24 22 24 24 24 23 24 94 95 94
(50) (170) (41) (65) (110) (121) (83) (26) (49) (337) (224) (186)
CORPORATE(C$ millions)
Preferred shareholder dividends
Net investment income (loss)Fee income Total revenue
Policy benefits and expensesGross claims & benefits paidChange in insurance/investment contract liabilities & reinsurance assets
Reinsurance expenses (recoveries)Total policy benefits and expenses
Income (loss) before income taxesIncome tax expense (benefit)
Operating expenses, commissions and other expenses
Common shareholders' reported net income (loss)
(1) Includes consolidation adjustments for net investment income, fee income and commission & other expenses relating to activities that cross business groups.
Fee incomeTotal revenue
STATEMENTS OF OPERATIONS - United Kingdom (UK)Revenue
Gross premiumsCeded premiumsNet premiums
At and For the Quarter Ended At and For the Year Ended2019
Operating expenses, commissions and other expensesChange in insurance/investment contract liabilities & reinsurance assets
Net investment income (loss)
Policy benefits and expenses
2020
Gross claims & benefits paid
Net premiums
Reinsurance expenses (recoveries)Total policy benefits and expenses
Income (loss) before income taxesIncome tax expense (benefit)
Common shareholders' reported net income (loss)
STATEMENTS OF OPERATIONS - Corporate Support (1)
RevenueGross premiumsCeded premiums
2021
Sun Life 22
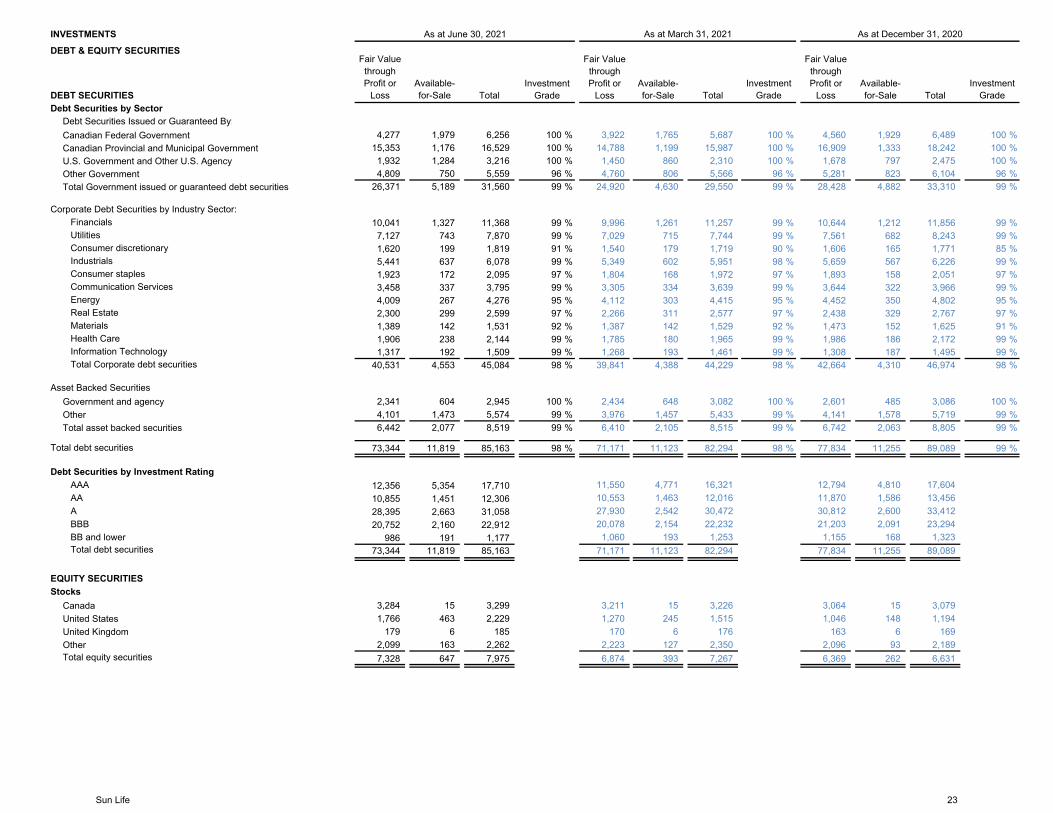
Debt Securities Issued or Guaranteed By:Canadian Federal Government 4,277 1,979 6,256 100 % 3,922 1,765 5,687 100 % 4,560 1,929 6,489 100 %Canadian Provincial and Municipal Government 15,353 1,176 16,529 100 % 14,788 1,199 15,987 100 % 16,909 1,333 18,242 100 %U.S. Government and Other U.S. Agency 1,932 1,284 3,216 100 % 1,450 860 2,310 100 % 1,678 797 2,475 100 %Other Government 4,809 750 5,559 96 % 4,760 806 5,566 96 % 5,281 823 6,104 96 %Total Government issued or guaranteed debt securities 26,371 5,189 31,560 99 % 24,920 4,630 29,550 99 % 28,428 4,882 33,310 99 %
10,041 1,327 11,368 99 % 9,996 1,261 11,257 99 % 10,644 1,212 11,856 99 %7,127 743 7,870 99 % 7,029 715 7,744 99 % 7,561 682 8,243 99 %1,620 199 1,819 91 % 1,540 179 1,719 90 % 1,606 165 1,771 85 %5,441 637 6,078 99 % 5,349 602 5,951 98 % 5,659 567 6,226 99 %1,923 172 2,095 97 % 1,804 168 1,972 97 % 1,893 158 2,051 97 %3,458 337 3,795 99 % 3,305 334 3,639 99 % 3,644 322 3,966 99 %4,009 267 4,276 95 % 4,112 303 4,415 95 % 4,452 350 4,802 95 %2,300 299 2,599 97 % 2,266 311 2,577 97 % 2,438 329 2,767 97 %1,389 142 1,531 92 % 1,387 142 1,529 92 % 1,473 152 1,625 91 %1,906 238 2,144 99 % 1,785 180 1,965 99 % 1,986 186 2,172 99 %1,317 192 1,509 99 % 1,268 193 1,461 99 % 1,308 187 1,495 99 %
40,531 4,553 45,084 98 % 39,841 4,388 44,229 98 % 42,664 4,310 46,974 98 %
Government and agency 2,341 604 2,945 100 % 2,434 648 3,082 100 % 2,601 485 3,086 100 %Other 4,101 1,473 5,574 99 % 3,976 1,457 5,433 99 % 4,141 1,578 5,719 99 %Total asset backed securities 6,442 2,077 8,519 99 % 6,410 2,105 8,515 99 % 6,742 2,063 8,805 99 %
73,344 11,819 85,163 98 % 71,171 11,123 82,294 98 % 77,834 11,255 89,089 99 %
12,356 5,354 17,710 11,550 4,771 16,321 12,794 4,810 17,60410,855 1,451 12,306 10,553 1,463 12,016 11,870 1,586 13,45628,395 2,663 31,058 27,930 2,542 30,472 30,812 2,600 33,41220,752 2,160 22,912 20,078 2,154 22,232 21,203 2,091 23,294
986 191 1,177 1,060 193 1,253 1,155 168 1,32373,344 11,819 85,163 71,171 11,123 82,294 77,834 11,255 89,089
Canada 3,284 15 3,299 3,211 15 3,226 3,064 15 3,079United States 1,766 463 2,229 1,270 245 1,515 1,046 148 1,194United Kingdom 179 6 185 170 6 176 163 6 169Other 2,099 163 2,262 2,223 127 2,350 2,096 93 2,189Total equity securities 7,328 647 7,975 6,874 393 7,267 6,369 262 6,631
EQUITY SECURITIESStocks
AAAAAABBBBB and lowerTotal debt securities
Debt Securities by Investment Rating
IndustrialsConsumer staplesCommunication Services EnergyReal Estate MaterialsHealth CareInformation Technology Total Corporate debt securities
Asset Backed Securities
Total debt securities
TotalInvestment
Grade
Fair Value through Profit or
LossAvailable-for-Sale
Fair Value through Profit or
Loss
Consumer discretionary
Available-for-SaleDEBT SECURITIES
Debt Securities by Sector
Corporate Debt Securities by Industry Sector:Financials Utilities
INVESTMENTS As at June 30, 2021 As at March 31, 2021 As at December 31, 2020
DEBT & EQUITY SECURITIESFair Value
through Profit or
LossAvailable-for-Sale Total
Investment GradeTotal
Investment Grade
Sun Life 23
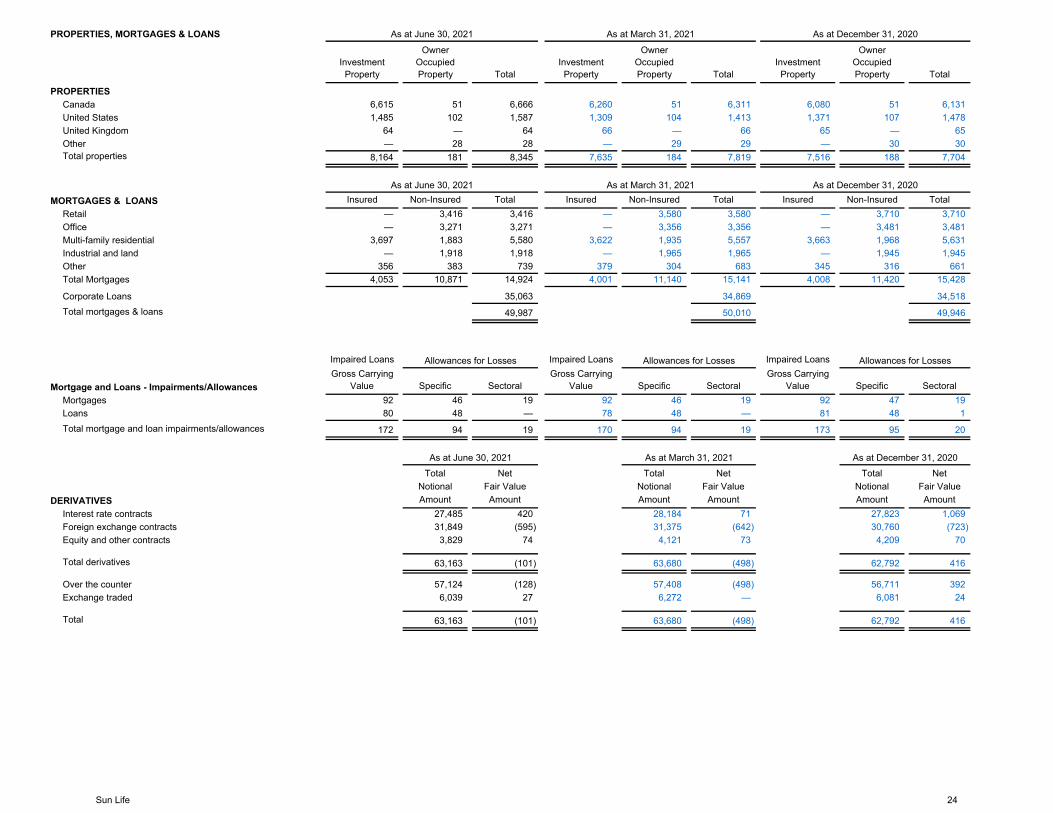
Investment Property
Owner Occupied Property Total
Investment Property
Owner Occupied Property Total
Investment Property
Owner Occupied Property Total
6,615 51 6,666 6,260 51 6,311 6,080 51 6,1311,485 102 1,587 1,309 104 1,413 1,371 107 1,478
64 — 64 66 — 66 65 — 65— 28 28 — 29 29 — 30 30
8,164 181 8,345 7,635 184 7,819 7,516 188 7,704
Insured Non-Insured Total Insured Non-Insured Total Insured Non-Insured Total— 3,416 3,416 — 3,580 3,580 — 3,710 3,710— 3,271 3,271 — 3,356 3,356 — 3,481 3,481
3,697 1,883 5,580 3,622 1,935 5,557 3,663 1,968 5,631— 1,918 1,918 — 1,965 1,965 — 1,945 1,945
356 383 739 379 304 683 345 316 6614,053 10,871 14,924 4,001 11,140 15,141 4,008 11,420 15,428
35,063 34,869 34,518
49,987 50,010 49,946
Impaired Loans Impaired Loans Impaired LoansGross Carrying
Value Specific SectoralGross Carrying
Value Specific SectoralGross Carrying
Value Specific Sectoral92 46 19 92 46 19 92 47 1980 48 — 78 48 — 81 48 1
172 94 19 170 94 19 173 95 20
Total Net Total Net Total NetNotional Fair Value Notional Fair Value Notional Fair ValueAmount Amount Amount Amount Amount Amount
27,485 420 28,184 71 27,823 1,06931,849 (595) 31,375 (642) 30,760 (723)3,829 74 4,121 73 4,209 70
63,163 (101) 63,680 (498) 62,792 416
57,124 (128) 57,408 (498) 56,711 3926,039 27 6,272 — 6,081 24
63,163 (101) 63,680 (498) 62,792 416
Exchange traded
Total
DERIVATIVESInterest rate contractsForeign exchange contractsEquity and other contracts
Total derivatives
Over the counter
LoansTotal mortgage and loan impairments/allowances
As at June 30, 2021 As at March 31, 2021 As at December 31, 2020
Allowances for Losses Allowances for Losses Allowances for Losses
PROPERTIES, MORTGAGES & LOANS As at June 30, 2021
Mortgage and Loans - Impairments/AllowancesMortgages
Multi-family residentialIndustrial and landOtherTotal Mortgages
Corporate LoansTotal mortgages & loans
As at March 31, 2021 As at December 31, 2020
Office
CanadaUnited StatesUnited KingdomOtherTotal properties
As at March 31, 2021 As at December 31, 2020
MORTGAGES & LOANSRetail
As at June 30, 2021
PROPERTIES
Sun Life 24
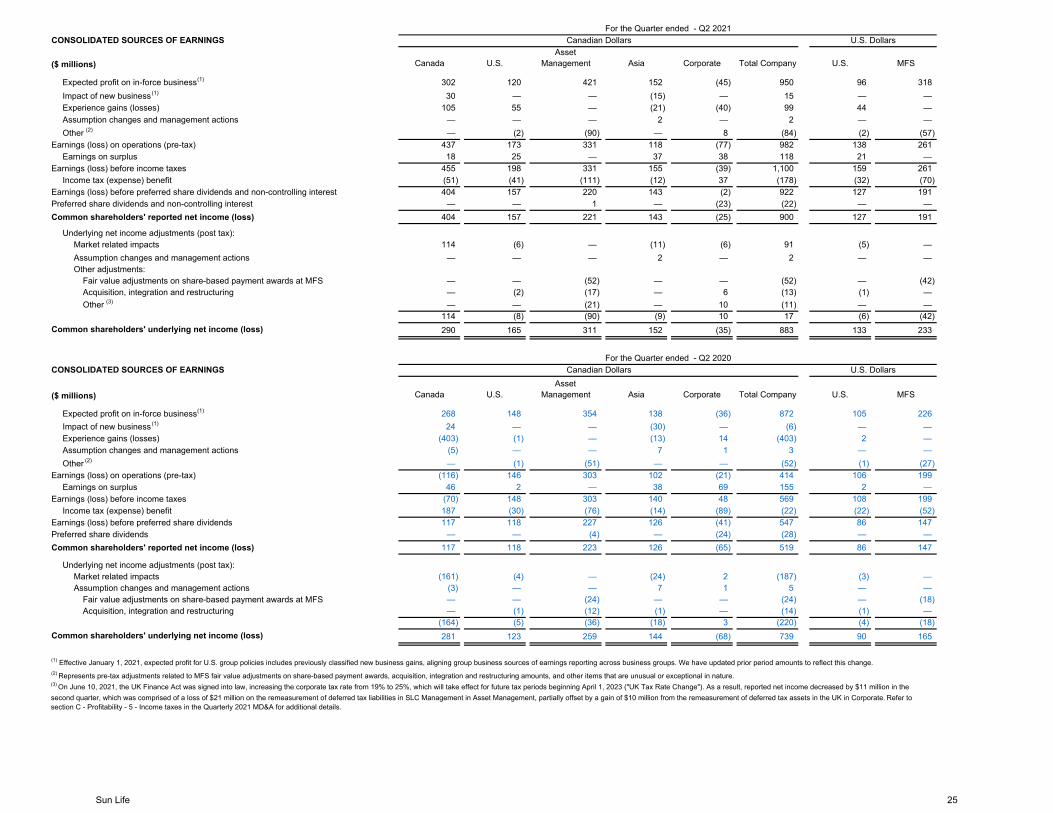
Canada U.S.Asset
Management Asia Corporate Total Company U.S. MFS
302 120 421 152 (45) 950 96 31830 — — (15) — 15 — —
105 55 — (21) (40) 99 44 —— — — 2 — 2 — —— (2) (90) — 8 (84) (2) (57)
437 173 331 118 (77) 982 138 26118 25 — 37 38 118 21 —
455 198 331 155 (39) 1,100 159 261(51) (41) (111) (12) 37 (178) (32) (70)404 157 220 143 (2) 922 127 191
— — 1 — (23) (22) — —404 157 221 143 (25) 900 127 191
114 (6) — (11) (6) 91 (5) —— — — 2 — 2 — —
— — (52) — — (52) — (42)— (2) (17) — 6 (13) (1) —— — (21) — 10 (11) — —
114 (8) (90) (9) 10 17 (6) (42)290 165 311 152 (35) 883 133 233
Canada U.S.Asset
Management Asia Corporate Total Company U.S. MFS
268 148 354 138 (36) 872 105 22624 — — (30) — (6) — —
(403) (1) — (13) 14 (403) 2 —(5) — — 7 1 3 — —— (1) (51) — — (52) (1) (27)
(116) 146 303 102 (21) 414 106 19946 2 — 38 69 155 2 —
(70) 148 303 140 48 569 108 199187 (30) (76) (14) (89) (22) (22) (52)117 118 227 126 (41) 547 86 147
— — (4) — (24) (28) — —117 118 223 126 (65) 519 86 147
(161) (4) — (24) 2 (187) (3) —(3) — — 7 1 5 — —— — (24) — — (24) — (18)— (1) (12) (1) — (14) (1) —
(164) (5) (36) (18) 3 (220) (4) (18)281 123 259 144 (68) 739 90 165
($ millions)
Expected profit on in-force business (1)
Impact of new business (1)
Experience gains (losses) Assumption changes and management actions
For the Quarter ended - Q2 2021CONSOLIDATED SOURCES OF EARNINGS Canadian Dollars U.S. Dollars
Other (2)
Earnings (loss) on operations (pre-tax)Earnings on surplus
Earnings (loss) before income taxesIncome tax (expense) benefit
Earnings (loss) before preferred share dividends and non-controlling interest
Assumption changes and management actions Other adjustments:
Earnings (loss) on operations (pre-tax)Earnings on surplus
Fair value adjustments on share-based payment awards at MFSAcquisition, integration and restructuringOther (3)
Common shareholders' underlying net income (loss)
Common shareholders' reported net income (loss)
Underlying net income adjustments (post tax):Market related impacts
Preferred share dividends and non-controlling interest
For the Quarter ended - Q2 2020CONSOLIDATED SOURCES OF EARNINGS Canadian Dollars U.S. Dollars
Other (2)
($ millions)
Expected profit on in-force business (1)
Impact of new business (1)
Experience gains (losses) Assumption changes and management actions
Earnings (loss) before income taxesIncome tax (expense) benefit
Earnings (loss) before preferred share dividends Preferred share dividends Common shareholders' reported net income (loss)
Underlying net income adjustments (post tax):Market related impactsAssumption changes and management actions
(2) Represents pre-tax adjustments related to MFS fair value adjustments on share-based payment awards, acquisition, integration and restructuring amounts, and other items that are unusual or exceptional in nature.
(1) Effective January 1, 2021, expected profit for U.S. group policies includes previously classified new business gains, aligning group business sources of earnings reporting across business groups. We have updated prior period amounts to reflect this change.
Fair value adjustments on share-based payment awards at MFSAcquisition, integration and restructuring
Common shareholders' underlying net income (loss)
(3) On June 10, 2021, the UK Finance Act was signed into law, increasing the corporate tax rate from 19% to 25%, which will take effect for future tax periods beginning April 1, 2023 ("UK Tax Rate Change"). As a result, reported net income decreased by $11 million in the second quarter, which was comprised of a loss of $21 million on the remeasurement of deferred tax liabilities in SLC Management in Asset Management, partially offset by a gain of $10 million from the remeasurement of deferred tax assets in the UK in Corporate. Refer to section C - Profitability - 5 - Income taxes in the Quarterly 2021 MD&A for additional details.
Sun Life 25
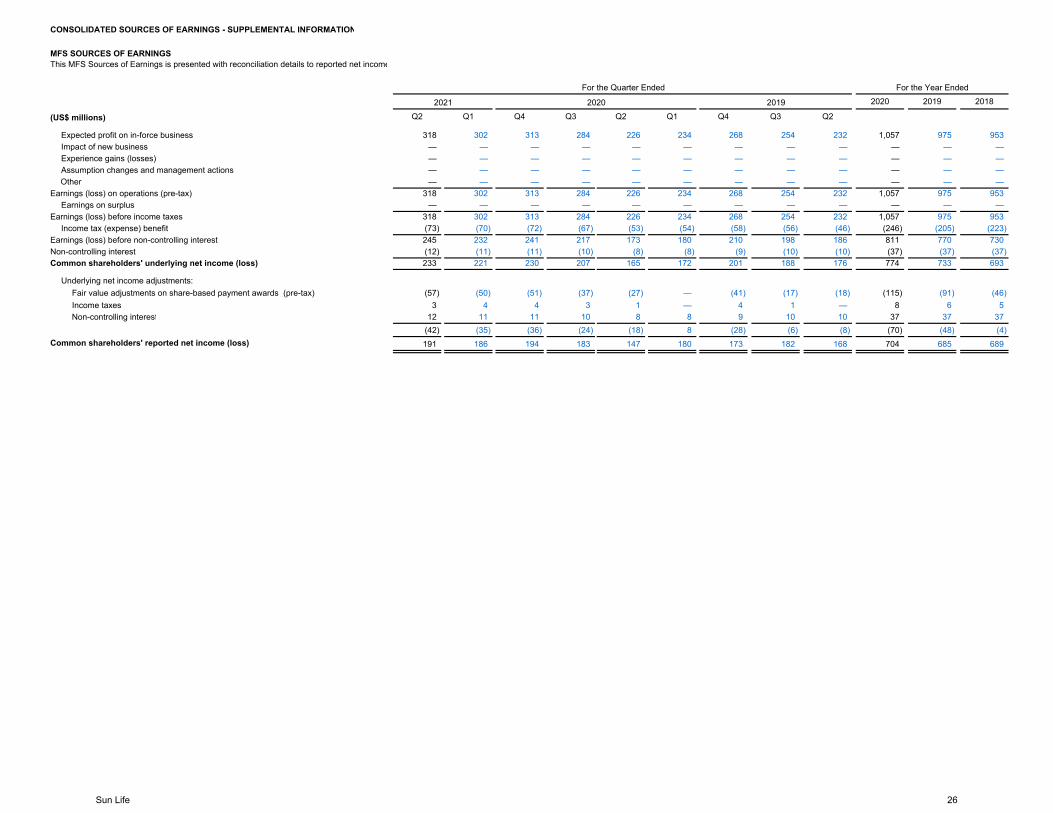
CONSOLIDATED SOURCES OF EARNINGS - SUPPLEMENTAL INFORMATION
MFS SOURCES OF EARNINGSThis MFS Sources of Earnings is presented with reconciliation details to reported net income
2020 2019 2018
Q2 Q1 Q4 Q3 Q2 Q1 Q4 Q3 Q2
318 302 313 284 226 234 268 254 232 1,057 975 953— — — — — — — — — — — —— — — — — — — — — — — —— — — — — — — — — — — —— — — — — — — — — — — —
318 302 313 284 226 234 268 254 232 1,057 975 953— — — — — — — — — — — —
318 302 313 284 226 234 268 254 232 1,057 975 953(73) (70) (72) (67) (53) (54) (58) (56) (46) (246) (205) (223)245 232 241 217 173 180 210 198 186 811 770 730(12) (11) (11) (10) (8) (8) (9) (10) (10) (37) (37) (37)233 221 230 207 165 172 201 188 176 774 733 693
(57) (50) (51) (37) (27) — (41) (17) (18) (115) (91) (46)3 4 4 3 1 — 4 1 — 8 6 5
Non-controlling interest 12 11 11 10 8 8 9 10 10 37 37 37(42) (35) (36) (24) (18) 8 (28) (6) (8) (70) (48) (4)191 186 194 183 147 180 173 182 168 704 685 689
(US$ millions)
For the Quarter Ended
2019
For the Year Ended
20202021
Fair value adjustments on share-based payment awards (pre-tax)
Common shareholders' reported net income (loss)
Earnings on surplusEarnings (loss) before income taxes
Income tax (expense) benefitEarnings (loss) before non-controlling interestNon-controlling interest Common shareholders' underlying net income (loss)
Income taxes
Underlying net income adjustments:
Earnings (loss) on operations (pre-tax)
Expected profit on in-force business Impact of new businessExperience gains (losses)Assumption changes and management actionsOther
Sun Life 26
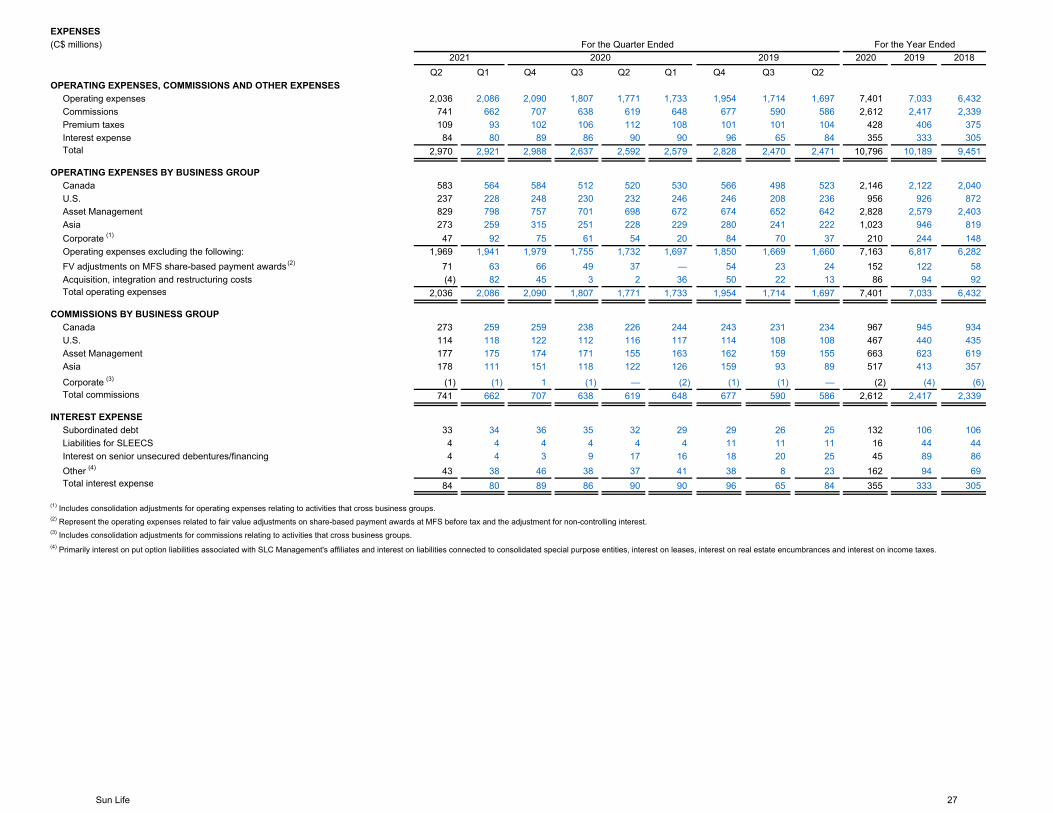
2020 2019 2018Q2 Q1 Q4 Q3 Q2 Q1 Q4 Q3 Q2
OPERATING EXPENSES, COMMISSIONS AND OTHER EXPENSES2,036 2,086 2,090 1,807 1,771 1,733 1,954 1,714 1,697 7,401 7,033 6,432
741 662 707 638 619 648 677 590 586 2,612 2,417 2,339109 93 102 106 112 108 101 101 104 428 406 37584 80 89 86 90 90 96 65 84 355 333 305
2,970 2,921 2,988 2,637 2,592 2,579 2,828 2,470 2,471 10,796 10,189 9,451
583 564 584 512 520 530 566 498 523 2,146 2,122 2,040237 228 248 230 232 246 246 208 236 956 926 872829 798 757 701 698 672 674 652 642 2,828 2,579 2,403273 259 315 251 228 229 280 241 222 1,023 946 81947 92 75 61 54 20 84 70 37 210 244 148
1,969 1,941 1,979 1,755 1,732 1,697 1,850 1,669 1,660 7,163 6,817 6,28271 63 66 49 37 — 54 23 24 152 122 58(4) 82 45 3 2 36 50 22 13 86 94 92
2,036 2,086 2,090 1,807 1,771 1,733 1,954 1,714 1,697 7,401 7,033 6,432
273 259 259 238 226 244 243 231 234 967 945 934114 118 122 112 116 117 114 108 108 467 440 435177 175 174 171 155 163 162 159 155 663 623 619178 111 151 118 122 126 159 93 89 517 413 357
(1) (1) 1 (1) — (2) (1) (1) — (2) (4) (6)741 662 707 638 619 648 677 590 586 2,612 2,417 2,339
33 34 36 35 32 29 29 26 25 132 106 1064 4 4 4 4 4 11 11 11 16 44 444 4 3 9 17 16 18 20 25 45 89 86
43 38 46 38 37 41 38 8 23 162 94 6984 80 89 86 90 90 96 65 84 355 333 305
Corporate (3)
EXPENSES(C$ millions)
Acquisition, integration and restructuring costsTotal operating expenses
Total
Operating expenses excluding the following:FV adjustments on MFS share-based payment awards (2)
CanadaU.S.Asset Management Asia
OPERATING EXPENSES BY BUSINESS GROUP
Corporate (1)
For the Year Ended
Interest expense
Operating expensesCommissionsPremium taxes
For the Quarter Ended2020 20192021
Other (4)
Total interest expense
COMMISSIONS BY BUSINESS GROUP
U.S.
(4) Primarily interest on put option liabilities associated with SLC Management's affiliates and interest on liabilities connected to consolidated special purpose entities, interest on leases, interest on real estate encumbrances and interest on income taxes.
(3) Includes consolidation adjustments for commissions relating to activities that cross business groups.
(1) Includes consolidation adjustments for operating expenses relating to activities that cross business groups.(2) Represent the operating expenses related to fair value adjustments on share-based payment awards at MFS before tax and the adjustment for non-controlling interest.
Liabilities for SLEECSInterest on senior unsecured debentures/financing
Total commissions
INTEREST EXPENSESubordinated debt
Canada
Asset ManagementAsia
Sun Life 27
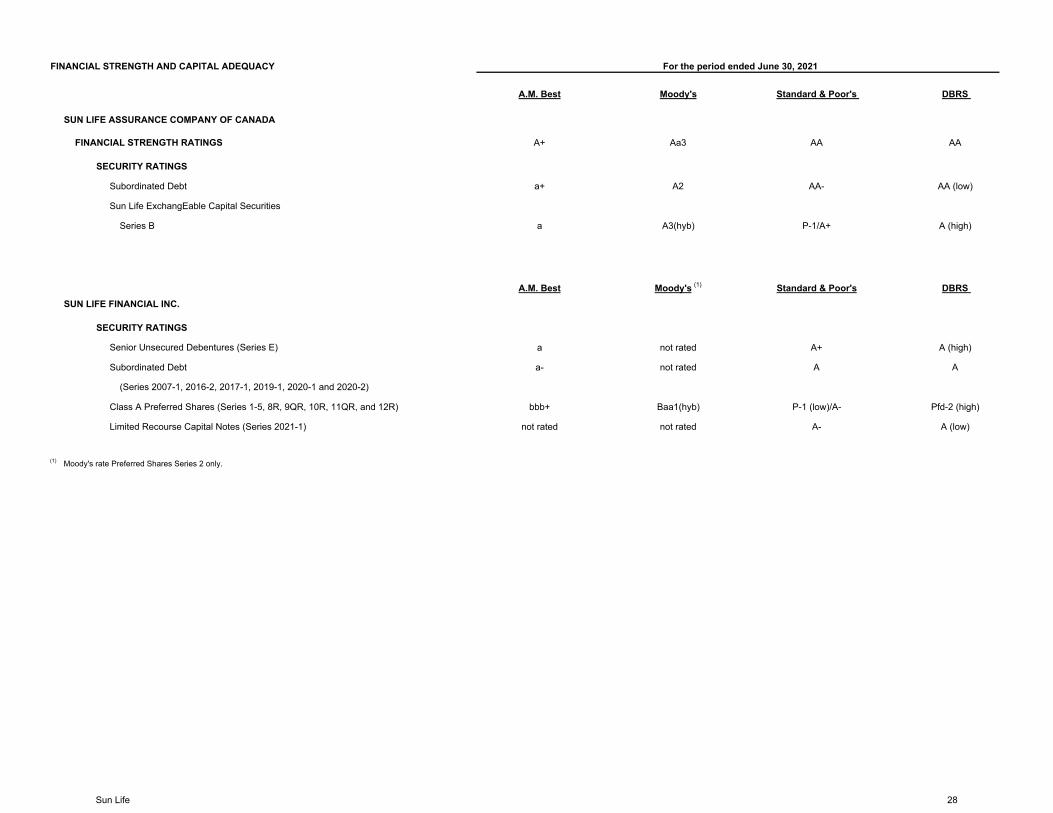
FINANCIAL STRENGTH AND CAPITAL ADEQUACY
A.M. Best Moody's Standard & Poor's DBRS
SUN LIFE ASSURANCE COMPANY OF CANADA
FINANCIAL STRENGTH RATINGS A+ Aa3 AA AA
SECURITY RATINGS
Subordinated Debt a+ A2 AA- AA (low)
Sun Life ExchangEable Capital Securities
Series B a A3(hyb) P-1/A+ A (high)
A.M. Best Moody's (1) Standard & Poor's DBRS SUN LIFE FINANCIAL INC.
SECURITY RATINGS
Senior Unsecured Debentures (Series E) a not rated A+ A (high)
Subordinated Debt a- not rated A A
(Series 2007-1, 2016-2, 2017-1, 2019-1, 2020-1 and 2020-2)
Class A Preferred Shares (Series 1-5, 8R, 9QR, 10R, 11QR, and 12R) bbb+ Baa1(hyb) P-1 (low)/A- Pfd-2 (high)
Limited Recourse Capital Notes (Series 2021-1) not rated not rated A- A (low)
(1) Moody's rate Preferred Shares Series 2 only.
For the period ended June 30, 2021
Sun Life 28
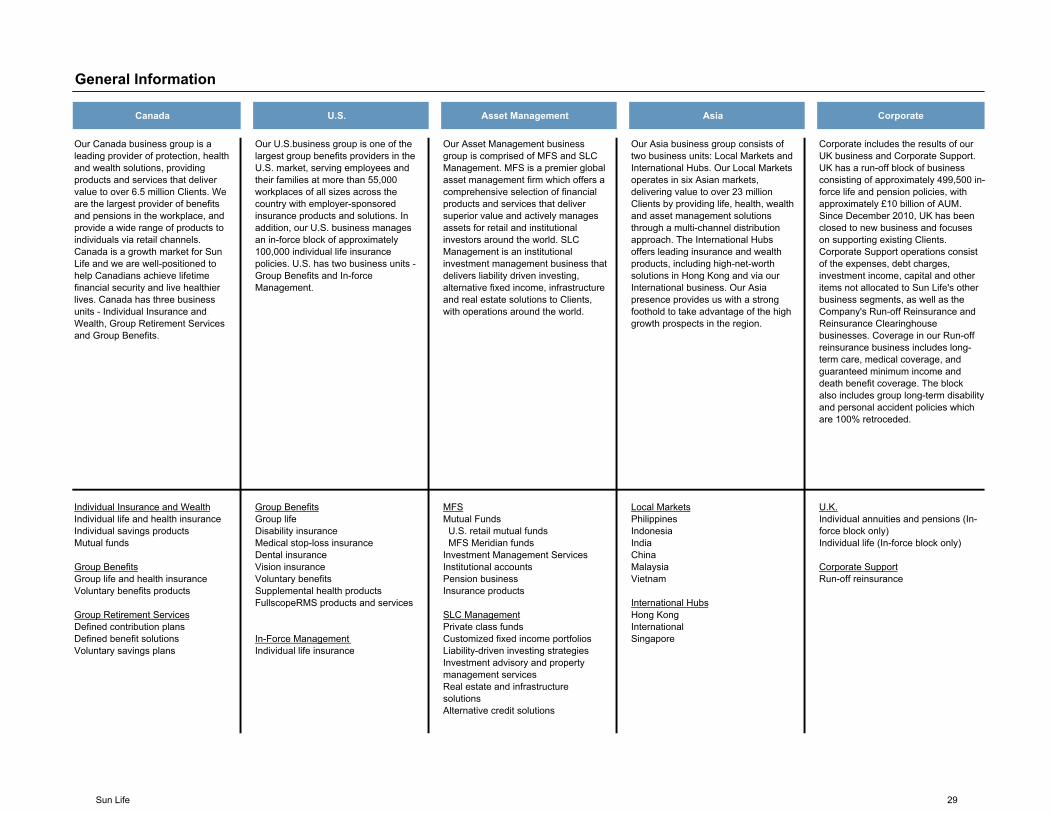
General Information
Canada U.S. Asset Management Asia Corporate
Our Canada business group is a leading provider of protection, health and wealth solutions, providing products and services that deliver value to over 6.5 million Clients. We are the largest provider of benefits and pensions in the workplace, and provide a wide range of products to individuals via retail channels. Canada is a growth market for Sun Life and we are well-positioned to help Canadians achieve lifetime financial security and live healthier lives. Canada has three business units - Individual Insurance and Wealth, Group Retirement Services and Group Benefits.
Our U.S.business group is one of the largest group benefits providers in the U.S. market, serving employees and their families at more than 55,000 workplaces of all sizes across the country with employer-sponsored insurance products and solutions. In addition, our U.S. business manages an in-force block of approximately 100,000 individual life insurance policies. U.S. has two business units - Group Benefits and In-force Management.
Our Asset Management business group is comprised of MFS and SLC Management. MFS is a premier global asset management firm which offers a comprehensive selection of financial products and services that deliver superior value and actively manages assets for retail and institutional investors around the world. SLC Management is an institutional investment management business that delivers liability driven investing, alternative fixed income, infrastructure and real estate solutions to Clients, with operations around the world.
Our Asia business group consists of two business units: Local Markets and International Hubs. Our Local Markets operates in six Asian markets, delivering value to over 23 million Clients by providing life, health, wealth and asset management solutions through a multi-channel distribution approach. The International Hubs offers leading insurance and wealth products, including high-net-worth solutions in Hong Kong and via our International business. Our Asia presence provides us with a strong foothold to take advantage of the high growth prospects in the region.
Corporate includes the results of our UK business and Corporate Support. UK has a run-off block of business consisting of approximately 499,500 in-force life and pension policies, with approximately £10 billion of AUM. Since December 2010, UK has been closed to new business and focuses on supporting existing Clients. Corporate Support operations consist of the expenses, debt charges, investment income, capital and other items not allocated to Sun Life's other business segments, as well as the Company's Run-off Reinsurance and Reinsurance Clearinghouse businesses. Coverage in our Run-off reinsurance business includes long-term care, medical coverage, and guaranteed minimum income and death benefit coverage. The block also includes group long-term disabilityand personal accident policies which are 100% retroceded.
Individual Insurance and WealthIndividual life and health insuranceIndividual savings productsMutual funds Group BenefitsGroup life and health insuranceVoluntary benefits products Group Retirement ServicesDefined contribution plansDefined benefit solutionsVoluntary savings plans
Group BenefitsGroup life Disability insuranceMedical stop-loss insuranceDental insuranceVision insuranceVoluntary benefitsSupplemental health productsFullscopeRMS products and services
In-Force Management Individual life insurance
MFSMutual Funds U.S. retail mutual funds MFS Meridian fundsInvestment Management ServicesInstitutional accountsPension businessInsurance products SLC ManagementPrivate class fundsCustomized fixed income portfoliosLiability-driven investing strategiesInvestment advisory and property management servicesReal estate and infrastructure solutionsAlternative credit solutions
Local MarketsPhilippinesIndonesiaIndiaChina MalaysiaVietnam
International HubsHong Kong InternationalSingapore
U.K.Individual annuities and pensions (In-force block only)Individual life (In-force block only)
Corporate SupportRun-off reinsurance
Sun Life 29


