UK’s 2050 Pathways Analysis and Impact on Policy Robert T. Watson Defra 24 th April 2012.

2050 Pathways AnalysisJuly 2010


i
Table of contents
Foreword 1
Executive summary 3
Part 1: Introduction and overview 5
1. Backgroundandapproachto2050analysis 6
2. Illustrativepathways 15
3. Callforevidencequestions 44
Part 2: Detailed sectoral trajectories 47
A. Lightingandappliances 48
B. Transport 58
C. Industry 76
D. Spaceheating,hotwaterandcooling 94
E. Agricultureandlanduse 125
F. Bioenergyandwaste 147
G. Nuclear 167
H. FossilfuelCarbonCaptureandStorage 174
I. Onshorewind 182
J. Offshorewind 188
K. Tidalrange 195
L. Waveenergyandtidalstream 201
M.Microgenerationofelectricity 212
N. Geothermalelectricitygeneration 221
O. Hydropower 224
P. Electricitybalancing 227
Q. Negativeemissions 236
R. Electricityimports 241
Annex A: Cost assumptions 244


1
Foreword
We are committed to reducing greenhouse gas emissions in the UK by at least 80% by 2050, relative to 1990 levels. When we take into account the expected levels of population growth over the period, that means that each person in the UK will need to have a carbon footprint that is about one fifth the size of their current footprint. DECC and other departments have been working hard with stakeholders to work out what this means for the country, for the energy sector and other major emitting sectors, and for individuals.
When we look ahead as far as 2050 there are inevitably major uncertainties. For example, it is not possible to accurately predict which low carbon technologies will flourish and which will fail, what the mix of our low carbon electricity generation will look like, or exactly how behaviours and infrastructure will have changed or will need to change over the intervening period. This challenge is not restricted to the UK – right across the world people will be going through a low carbon revolution and the direction that other nations take will affect the opportunities, technologies, fuels, skills and supply chains available to the UK.
Yet despite the difficulties in looking so far ahead, a successful shift to a low carbon economy requires a clear direction and early action: investors and consumers require confidence to act; large building and infrastructure projects require long term planning; new technology takes time to reach commercial deployment; and behaviours change gradually. Power stations typically have a lifespan of around 40 years, and a passenger aeroplane can be in service for over 30 years. We need to make sure that we understand the long term implications of today’s investment decisions.
The analysis in this 2050 Pathways Analysis report presents a framework through which to consider some of the choices and trade-offs which we will have to make over the next forty years. It shows that it is possible for us to meet the 80% emissions reduction target domestically in a range of ways, and the online 2050 Pathways Calculator allows people to explore the combinations of effort which meet the emissions target while matching energy supply and demand. The route to 2050 will not be easy: we know that very substantial changes will be required across a wide range of sectors and across many aspects of our lives, even though we do not yet know the precise detail of these changes.
This report presents a range of different pathways to 2050. None of these is a preferred route and the exercise is not about choosing a pathway out to 2050 today – such a task would not be feasible as there are too many unknowns. It would be like asking someone in 1970 to predict the impact of mobile telephones and the internet. But the illustrative pathways facilitate a discussion about the long term options available. They also point to a set of long term ‘good bet’ actions which appear to be common to a number of the possible pathways. Although the rationale for moving to a low carbon pathway is not to reduce energy costs, the analysis indicates that low carbon energy generation can actually be less expensive than conventional energy generation under the highest fossil fuel price scenarios. Given the inherent uncertainty in predicting the likely price

2
Pathways to 2050
of fossil fuels over forty years, it is significant that the low carbon pathways reduce our exposure to the risk of high fossil fuel prices.
Creating a low carbon economy will require the consent and participation of citizens. The publication of this Call for Evidence and the launch of the online 2050 Pathways Calculator allows the public to engage in the debate about how we achieve our goals and ensure that our efforts add up to what is required.
Chris HuhneSecretary of State for Energy and Climate Change

3
Executive summary
RationaleThe UK faces major choices about how to move to a secure, low carbon economy over the period to 2050. Should we do more to cut demand, or rely more on increasing and decarbonising the energy supply? How will we produce our electricity? Which technologies will we adopt?
Approach 2050 pathways is a tool to help policymakers, the energy industry and the public understand these choices. For each sector of the economy, four trajectories have been developed, ranging from little or no effort to reduce emissions or save energy (level 1) to extremely ambitious changes that push towards the physical or technical limits of what can be achieved (level 4).
PathwaysThe 2050 Pathways Calculator – available on the DECC website - allows users to develop their own combination of levels of change to achieve an 80% reduction in greenhouse gas emissions by 2050, while ensuring that energy supply meets demand.
This report describes six different illustrative pathways to show the varied routes to 2050, ranging from a pathway that requires significant effort across all sectors to pathways with only a minimal contribution from particular sectors, such as renewables, bioenergy, nuclear or carbon capture and storage, and a pathway with less action on energy efficiency. None of them represents a preferred option.
Uncertainties and common themesThe pathways differ substantially. They also illustrate uncertainties and trade-offs. For example, the availability of sustainable bioenergy resources and the degree of global competition for them is hard to predict; and we cannot know which new and unproven technologies will succeed. However, there are several common messages emerging from the pathways:
●● Ambitious per capita energy demand reduction is needed. The greater the constraints on low carbon energy supply, the greater the reduction in demand will need to be.
●● A substantial level of electrification of heating, transport and industry is needed.
●● Electricity supply may need to double, and will need to be decarbonised.
●● A growing level of variable renewable generation increases the challenge of balancing the electricity grid.

4
Pathways to 2050
●● Sustainable bioenergy is a vital part of the low carbon energy system in sectors where electrification is unlikely to be practical, such as long haul freight transport and aviation and some industrial high-grade heating processes.
●● The pathways also show an ongoing need for fossil fuels in our energy mix, although their precise long term role will depend on a range of issues such as the development of carbon capture and storage.
●● Emissions from agriculture, waste, industrial processes and international transport make up a small proportion of emissions today, but by 2050, if no action were taken, emissions from these sectors alone would exceed the maximum level of emissions for the whole economy.
Next steps: call for evidenceCreating a low carbon economy will require the consent and participation of citizens given the scale and pace of change required. Government can play a leadership role, but transforming our economy will require a coalition of citizens, business, and the energy industry. That is why over the next 10 weeks we will be gathering evidence to test and refine the model, before engaging the public more widely in the 2050 work.
This work is not about choosing a pathway to 2050 today – such a task would not be feasible given the major unknowns and timeframe involved. However, this analysis enables us to better manage some significant long term uncertainties, and helps us to avoid making long term decisions that are incompatible with meeting our 2050 emissions target.

55
Part 1
Introduction and overview

6
1.Backgroundandapproachto2050analysis
WhytheanalysiswasdoneClimate change is a major threat to our common future. The UK has a commitment to reduce its greenhouse gas emissions by at least 80% by 2050 relative to 1990 levels and carbon budgets have been set down in law to make sure the UK stays on track.1 We will need to achieve these emissions reductions while at the same time safeguarding energy security so that supply meets demand and the lights stay on, and while ensuring that the UK is able to take up the economic opportunities presented by global decarbonisation.
The analysis in this report presents a framework with which to explore a range of potential pathways from today to 2050 and to consider some of the difficult choices and trade-offs which we will have to make. This report is published as a Call for Evidence; alongside this, the detailed model – the 2050 Pathways Calculator – which underlies the analysis, has been published on the DECC website, as well as a user-friendly version of the model.2 This Call for Evidence marks the start of a period of discussion and we welcome suggestions on how to refine the analysis and the approach. Around a hundred stakeholders have already been involved in the development of the sectoral trajectories which underpin this analysis. The responses to this Call for Evidence will feed in to a refinement of our analysis and the publication of an updated 2050 Pathways Calculator in the autumn. The 2050 analysis will be one source of information used in determining the UK’s fourth carbon budget.
By 2008, the UK had already reduced greenhouse gas emissions by 22% from 1990 levels. We have five-year carbon budgets set out to 2022 – the first beginning in 2008 – which set us on a trajectory to our longer term target, and by summer 2011 the UK is required to set the level of the fourth carbon budget (2023–2027).3 However beyond 2020 there are many uncertainties about the shape of the emissions reduction trajectory, the relative contribution of different sectors, the potential for energy imports and the use of international carbon credits.4 The further ahead we look, the more difficult it becomes to predict the technologies that might facilitate decarbonisation, the amount of energy we will need to produce, the costs and benefits of taking any particular action and the availability of resources both here and abroad.
1 Thisisan80%reductioningreenhousegasemissionsfromthe‘1990baseline’(asdefinedintheClimateChangeAct,whichmeans1990forcarbondioxide,methaneandnitrousoxideand1995forhydrofluorocarbons,perfluorocarbonsandsulphurhexafluoride).Notallsectorsarenecessarilyrequiredtoreduceemissionsby80%andemissionscutswithintheUK energy systemmayhavetobegreaterthan80%ifemissionsfromothersectors,suchasagricultureandindustrialprocesses,arehardertoachieve.
2 http://www.decc.gov.uk/en/content/cms/what_we_do/lc_uk/2050/2050.aspx.3 TherequirementisintheClimateChangeAct.4 InternationalemissionscreditsareamechanismbywhichdevelopedcountriessuchastheUKcan
payforemissionsreductionstotakeplaceindevelopingcountries,andcounttheseagainstdomestictargets.Thisreliesonthefactthatgreenhousegaseshavethesameimpactregardlessofwhereintheworldtheyareemitted,butabatementindevelopingcountriescanbecheaperthanindevelopedcountries.
7
Background and approach to 2050 analysis
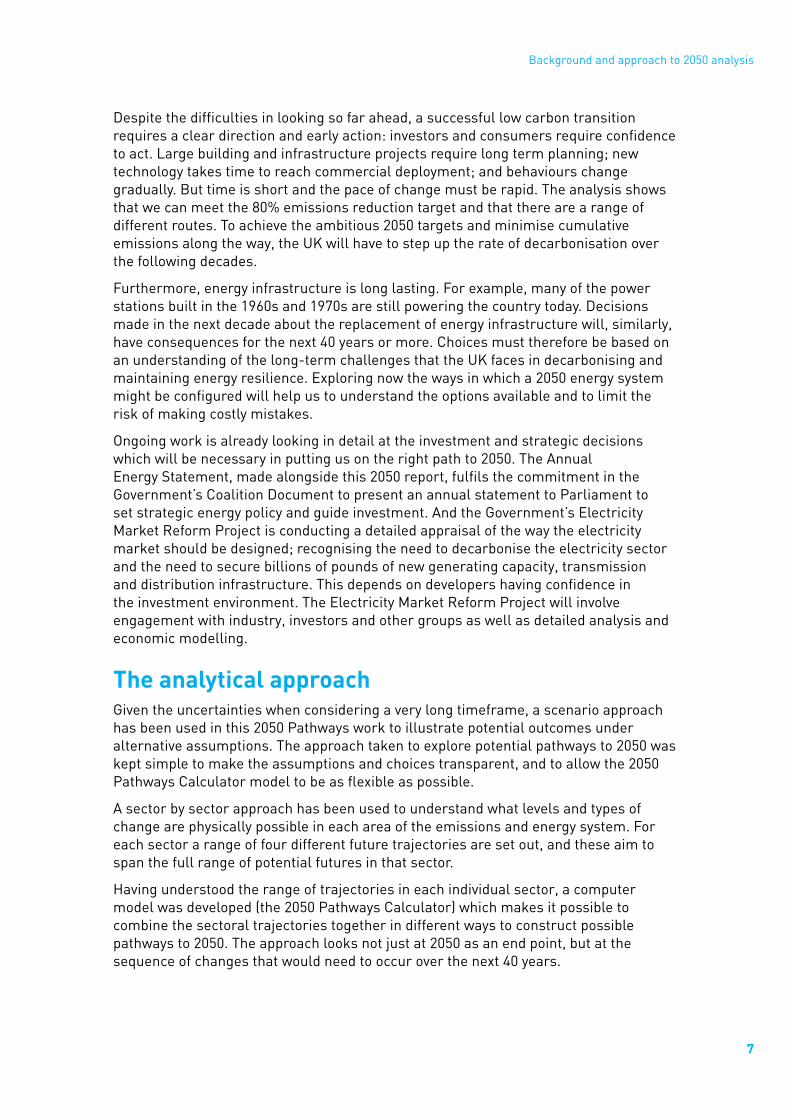
Despite the difficulties in looking so far ahead, a successful low carbon transition requires a clear direction and early action: investors and consumers require confidence to act. Large building and infrastructure projects require long term planning; new technology takes time to reach commercial deployment; and behaviours change gradually. But time is short and the pace of change must be rapid. The analysis shows that we can meet the 80% emissions reduction target and that there are a range of different routes. To achieve the ambitious 2050 targets and minimise cumulative emissions along the way, the UK will have to step up the rate of decarbonisation over the following decades.
Furthermore, energy infrastructure is long lasting. For example, many of the power stations built in the 1960s and 1970s are still powering the country today. Decisions made in the next decade about the replacement of energy infrastructure will, similarly, have consequences for the next 40 years or more. Choices must therefore be based on an understanding of the long-term challenges that the UK faces in decarbonising and maintaining energy resilience. Exploring now the ways in which a 2050 energy system might be configured will help us to understand the options available and to limit the risk of making costly mistakes.
Ongoing work is already looking in detail at the investment and strategic decisions which will be necessary in putting us on the right path to 2050. The Annual Energy Statement, made alongside this 2050 report, fulfils the commitment in the Government’s Coalition Document to present an annual statement to Parliament to set strategic energy policy and guide investment. And the Government’s Electricity Market Reform Project is conducting a detailed appraisal of the way the electricity market should be designed; recognising the need to decarbonise the electricity sector and the need to secure billions of pounds of new generating capacity, transmission and distribution infrastructure. This depends on developers having confidence in the investment environment. The Electricity Market Reform Project will involve engagement with industry, investors and other groups as well as detailed analysis and economic modelling.
The analytical approach Given the uncertainties when considering a very long timeframe, a scenario approach has been used in this 2050 Pathways work to illustrate potential outcomes under alternative assumptions. The approach taken to explore potential pathways to 2050 was kept simple to make the assumptions and choices transparent, and to allow the 2050 Pathways Calculator model to be as flexible as possible.
A sector by sector approach has been used to understand what levels and types of change are physically possible in each area of the emissions and energy system. For each sector a range of four different future trajectories are set out, and these aim to span the full range of potential futures in that sector.
Having understood the range of trajectories in each individual sector, a computer model was developed (the 2050 Pathways Calculator) which makes it possible to combine the sectoral trajectories together in different ways to construct possible pathways to 2050. The approach looks not just at 2050 as an end point, but at the sequence of changes that would need to occur over the next 40 years.
8
Pathways to 2050
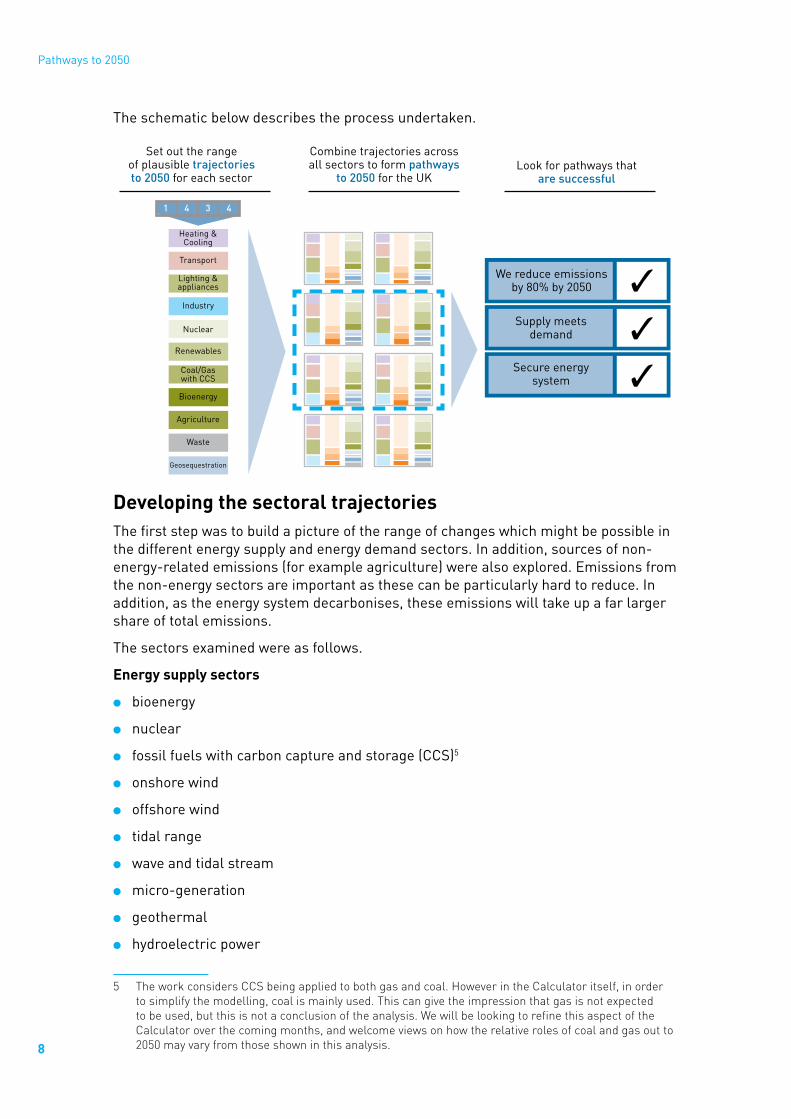
The schematic below describes the process undertaken.
Developing the sectoral trajectoriesThe first step was to build a picture of the range of changes which might be possible in the different energy supply and energy demand sectors. In addition, sources of non-energy-related emissions (for example agriculture) were also explored. Emissions from the non-energy sectors are important as these can be particularly hard to reduce. In addition, as the energy system decarbonises, these emissions will take up a far larger share of total emissions.
The sectors examined were as follows.
Energy supply sectors
●● bioenergy
●● nuclear
●● fossil fuels with carbon capture and storage (CCS)5
●● onshore wind
●● offshore wind
●● tidal range
●● wave and tidal stream
●● micro-generation
●● geothermal
●● hydroelectric power
5 TheworkconsidersCCSbeingappliedtobothgasandcoal.HoweverintheCalculatoritself,inordertosimplifythemodelling,coalismainlyused.Thiscangivetheimpressionthatgasisnotexpectedtobeused,butthisisnotaconclusionoftheanalysis.WewillbelookingtorefinethisaspectoftheCalculatoroverthecomingmonths,andwelcomeviewsonhowtherelativerolesofcoalandgasoutto2050mayvaryfromthoseshowninthisanalysis.
Set out the range of plausible trajectories to 2050 for each sector
Combine trajectories across all sectors to form pathways
to 2050 for the UKLook for pathways that
are successful
1 434
Heating &Cooling
Geosequestration
Transport
Lighting &appliances
Industry
Nuclear
Renewables
Coal/Gaswith CCS
Bioenergy
Agriculture
Waste
We reduce emissions by 80% by 2050
Supply meets demand
Secure energy system
�
�
�

9
Background and approach to 2050 analysis
The detailed analysis focuses on low carbon energy supply sectors, but the implications for coal, gas and oil use are also explored. We do not set out a range of trajectories for these fossil fuels, as they are assumed in this model to be available from domestic and global sources in the quantities required. The model uses these fuels after having used all the low carbon energy available in each pathway.
Energy demand sectors
●● lighting and appliances
●● transport
●● industry
●● heating and cooling
Non-energy sectors
●● waste
●● agriculture (noting that there is some energy demand from agriculture)
●● industrial processes
●● land use, land use change and forestry
●● negative emissions6
In each sector, up to four trajectories were developed for the types of changes that might be seen.7 These are designed to cover a broad range of possibilities and to test the boundaries of what might be possible. They are intended to reflect the whole range of potential futures that might be experienced in that sector. They are illustrative and are not based on assumptions about future policy and its impacts, and should not be interpreted as such.
The trajectories developed have drawn on existing work as well as input from a large number of experts in businesses, NGOs, technical fields, and academics, through workshops and other discussions. Several hundred stakeholders have so far been involved in the analysis, and about 100 of those experts took part in detailed discussions about the trajectories. A diverse range of views and expertise has been included and we are grateful for the input we have so far received. This is only the start of the conversation and we hope that this Call for Evidence will provide even more detailed input into the analysis. The list of questions and the instructions for how to participate in the Call for Evidence can be found on page 44. We are keen to refine this analysis in the light of new evidence.
The section below describes how the trajectories were defined and developed. The work aimed to achieve a level of consistency across the different sectors in terms of ‘level of change’, so that a ‘level 2’ effort in one sector would be broadly comparable to a ‘level 2’ effort elsewhere. Although by necessity this is something of a subjective judgement – particularly when comparing very different sectors, for example offshore wind power and thermal comfort levels in buildings. Part 2 below gives a full explanation of how each trajectory was developed and what assumptions were made in shaping them in each sector.
6 Negativeemissionstechnologiesaimtoremovecarbondioxidedirectlyfromtheatmosphere,forexampleviaburningbiomassinCCSpowerstations.
7 Insomesectors,additionalchoicescanbemadeabouttechnologiesorconversionprocesses.Forinternationalshipping,onlyonetrajectoryisavailable.

10
Pathways to 2050
The energy supply sectorsThe energy supply trajectories examine different energy generation sectors. These trajectories have been presented as four levels of potential roll-out of energy supply infrastructure (levels 1–4), representing increasing levels of effort. The levels depend on the lead time and build rate of new energy infrastructure, and different assumptions about how quickly and on what scale the infrastructure can be rolled out. The higher levels also depend on improvements in technology, such as floating wind turbines and carbon capture and storage. The build rates will in practice depend not only on the physical possibilities, but also on investment decisions by the companies involved, as well as wider international developments and public acceptance.
●● Level 1: assumes little or no attempt to decarbonise or change or only short run efforts; and that unproven low carbon technologies are not developed or deployed.
●● Level 2: describes what might be achieved by applying a level of effort that is likely to be viewed as ambitious but reasonable by most or all experts. For some sectors this would be similar to the build rate expected with the successful implementation of the programmes or projects currently in progress.
●● Level 3: describes what might be achieved by applying a very ambitious level of effort that is unlikely to happen without significant change from the current system; it assumes significant technological breakthroughs.
●● Level 4: describes a level of change that could be achieved with effort at the extreme upper end of what is thought to be physically plausible by the most optimistic observer. This level pushes towards the physical or technical limits of what can be achieved.
It should be recognised that even at level 2, the consequences of pursuing this effort across several different sectors in parallel will place a high demand on supply chains and skills, especially given that other countries are likely to be undertaking concurrent infrastructure changes.
In addition to the domestic supply sectors, the analysis also sets out some international dimensions, including four levels of potential bioenergy imports and four levels of electricity imports.
The energy demand and non-energy sectorsThe demand sectors explore several different drivers of change. The primary drivers of change are summarised below. Where these factors can be considered as changing levels of effort or ambition, these are described in the analysis as levels 1–4 on a similar basis to the supply side sectors. Where the changes described reflect a choice rather than a scale (for example choices of fuel or technology), they are described as trajectories A, B, C, D; these choices cannot be compared between sectors.
The demand trajectories have been developed to be consistent with two key input assumptions: 0.5% per year growth in population, based on the central scenario of the Office of National Statistics; and 2.5% growth in the UK GDP to reflect HM Treasury’s assumption for long term growth. Different actual rates of population and GDP growth would have potentially significant impacts on the level of effort required to reach 80% emissions reductions.

11
Background and approach to 2050 analysis
In determining the trajectories, several factors are considered:
●● Levels of behavioural and lifestyle change: reductions in energy demand and emissions through changes such as wasting less food; accepting lower average room temperatures in winter; and transport mode shifts, such as from private to public transport.
●● Levels of technological improvement and change: the development and penetration of less carbon intensive technologies, such as LED lighting or ground source heat pumps; technological advance such as new industrial processes; and improvements in the efficiency of existing technologies. More ambitious trajectories may be dependent on the successful deployment of technologies still in development.
●● Different technological or fuel choices: technological and fuel choices that are not directly related to ambition levels; examples include choices between district heating or ground source heat pumps, or between fuel cells and batteries for cars.
●● Structural change: reflects possible changes in the structure of the economy, for example a decline or resurgence in manufacturing.
The sectoral trajectories as defined above have been entered into a computer model – the 2050 Pathways Calculator – which then allows users of the model to combine the sectoral trajectories in different ways. For the given trajectory choices, the Calculator displays how that combination compares against the emissions target and energy supply needs. The 2050 Pathways Calculator has been published on the DECC website alongside this report, as well as a user-friendly version of the model – the 2050 online tool.8
The 2050 Pathways Calculator has been used to explore a range of pathways that meet our aims on energy and climate change. Six purely illustrative pathways plus a high carbon reference case are described below. There are a large number of potential pathways – just a small number of these are set out below to illustrate some key themes.
How the analysis can be usedWhile this analysis helps us look ahead, there are some limitations to the approach. It is not possible to predict the future and none of the pathways that this analysis produces or describes is an optimal or preferred route. In particular, the pathways contained in this document do not prejudge the decision on the level of the fourth carbon budget (2023–2027) that has to be made by summer 2011. The aim of this 2050 pathways analysis is to demonstrate the scale of the changes that will be required, and the choices and trade-offs which are likely to be available to us as a society.
It is a model based on physical limits, not cost optimisationUnlike some other approaches, this 2050 Pathways analysis does not adopt a cost optimisation approach – ie, the Pathways Calculator does not identify the least costly way of meeting the 2050 target. The aim instead is to look at what might be practically and physically deliverable in each sector over the next 40 years under different assumptions. The Calculator then allows users of the tool to explore their own choices.
8 http://www.decc.gov.uk/en/content/cms/what_we_do/lc_uk/2050/2050.aspx.

12
Pathways to 2050
Cost is of course one critical dimension when making such a choice, and the cost implications for large scale electricity generation in different pathways are described below as an illustration. Other criteria such as public acceptability, land use impacts, wider environmental impacts, practical deliverability, technological risk, international dependency, business investment behaviour, and fiscal, competitive and socio-economic and welfare impacts would also be important in understanding which of the potential pathways to 2050 is most desirable and most deliverable.
In exploring pathways, it is important to bear in mind that the ‘level 4’ sectoral trajectories represent heroic levels of effort or change, and as a result it might be expected that the trade-offs associated with a pathway containing level 4 ambition in one or more sectors would be particularly difficult.
Understanding the role of the economy in the pathwaysThe level of GDP growth is a fixed input assumption in the model (2.5% per annum). Meaning that, in those sectors where the level of change is understood to be influenced by GDP, such as transport demand, the trajectories were developed to reflect that assumption. The model does not capture potential positive and negative feedback impacts on the economy from the levels of effort implied by the pathways.
There could be benefits to a low carbon transition beyond helping to mitigate climate change. Across the world, governments and industries are looking for the technologies that can help them to decarbonise. There are valuable opportunities for British businesses to develop and manufacture these products and associated services, for both domestic and international consumption. The low carbon and environmental goods and services sector was worth £3.2 trillion in 2008–09 and employed approximately 910,000 people in the UK.9 The sector is the world’s sixth largest by turnover value. However, other countries are also investing in order to take up the global opportunities on offer in the light of increasing efforts to reduce emissions in order to tackle climate change. To capitalise on these opportunities, the UK will need to act fast and effectively to secure competitive advantage in emerging low carbon technologies and markets. Although there are opportunities in the transition, there would also be costs on business, and it is not clear to what extent low carbon jobs will be additional to existing jobs.
The model has a UK focusThe model looks specifically at the UK. It also includes trajectories for potential international imports of bioenergy and electricity. The international context will have a strong steer on what happens in the UK in terms of the development, supply and price of new technologies, skills and fuels. This work does not attempt to assess what shape these international developments will take.
This 2050 analysis does not consider the role that international emissions credits might play in helping the UK to achieve emissions cuts cost-effectively.10 However, the Pathways Calculator tool is flexible and users of the model could in theory aim for a higher or lower emissions target than the one the UK is committed to achieving.
9 BIS(2009)Low Carbon and Environmental Goods and Services: an industry analysis update for 2008–09.www.bis.gov.uk
10 InternationalemissionscreditsareamechanismbywhichdevelopedcountriessuchastheUKcanpayforemissionsreductionstotakeplaceindevelopingcountries,andcounttheseagainstdomestictargets.Thisreliesonthefactthatgreenhousegaseshavethesameimpactregardlessofwhereintheworldtheyareemitted,butabatementindevelopingcountriescanbecheaperthanindevelopedcountries.

13
Background and approach to 2050 analysis
The pathways presented in this report achieve the full 80% cuts within the UK. The model includes emissions from international aviation and shipping assigned to the UK even though these are emissions not currently part of the 2050 target.
The model does not take account of the emissions from growing biofuels abroad, from electricity generated in other countries or from the overseas manufacture of products which the UK imports, as our 2050 emissions target excludes these emissions. If the UK were to rely increasingly on imports of food, fuel, and products, it would become even more important to consider the potential global emissions impacts.
The interactions between sectorsGiven the need to ensure that the functioning and content of the model is manageable, it has been necessary to keep it as simple as possible. Therefore, the 2050 Pathways Calculator model does not itself make ‘intelligent’ judgments about which trajectories in different sectors can sensibly be combined together: the users of the model must themselves make these judgements. A few examples of combinations unlikely to be plausible include:
●● very high levels of both solar PV and solar thermal at the same time – because in practice these technologies may be competing for the same roof space;
●● a thriving manufacturing industry and high levels of additional construction at the same time as a reducing demand for freight transport;
●● generating electricity through non-thermal processes, while at the same time rolling out use of district heating.11
Similarly, the model does not account for all possible feedbacks between trajectory levels in different sectors. Changes in one sector might be expected to have a knock-on effect in another sector, and not all of these are reflected in the Pathways Calculator.
Understanding energy security through the modelAs well as aiming for the 80% emissions target, the model allows users to explore implications for managing energy supply and demand. For example, the electricity system must be continually balanced to match supply and demand. The model tests the ability of the system to meet increased demands for electricity during a five-day period of light winds and low temperatures, which can occur typically during settled periods of weather in winter. Large areas of Europe can be affected by these ‘anticyclonic blocking events’.
In order to simplify the modelling process, the Calculator assumes that any new, unabated generation is provided by gas fired power stations, and all the CCS-fitted generation is assumed to be coal fired. Because of this assumption, pathways with significant CCS plant will show high coal consumption and low gas consumption in later years. The balance between coal and gas for these pathways is determined by the simplified modelling assumption, and is not a conclusion of the analysis. In reality, it may become possible to fit CCS to gas fired plant.
11 Thiswouldthenrequireheattobegeneratedbyheat-onlyboilers,eliminatingtheefficienciesobtainedfromtechnologiessuchasCombinedHeatandPower;theCalculatordoesnotcapturethisdetail.

14
Pathways to 2050
The trajectories are not projections based on policy decisionsAlthough this analysis takes a detailed look at what might be possible to achieve over the next 40 years, it does not set out what policy decisions would be required to deliver such a future. A detailed policy roadmap covering such a long timeframe would be neither possible nor plausible. Instead we have described the shape of trajectories as they might be experienced on the ground under the assumptions of the associated levels.
The Climate Change Act 2008, which sets our 2050 target, introduced the concept of ‘carbon budgets’. A carbon budget is the total quantity of emissions that can be emitted by the UK over a five-year period. The first three carbon budgets (2008–2012, 2013–2017, 2018–2022) were set in 2009 and require emissions in these budget periods to be reduced by 22%, 28% and 34% respectively, below 1990 levels. Carbon budgets need to be set three carbon budget periods in advance, to give long term certainty and to set an appropriate pathway to our 2050 target. The fourth carbon budget, running from 2023 to 2027, needs to be set by the middle of 2011, and the independent Committee on Climate Change will be giving its advice on the level of the budget by the end of this year.
The timeframe of the transition and the role of different groupsThis model is primarily focused on the 2050 timeframe. However it also provides a picture of the transition during the interim years. It is worth noting that this transition will need to happen over a long timeframe with key decision points along the way. Although it is not necessary or indeed possible to make all these changes immediately, it is also the case that large scale infrastructure takes many years to plan, design and build, and that behaviour change is usually a gradual process, and so the UK should take the opportunity to consider options sooner rather than later.
All sections of society will need to play a part in creating a low carbon economy. In the Coalition Agreement the Government committed to a radical redistribution of power away from Westminster and Whitehall to individuals, neighbourhoods, communities, local institutions and local government across the nation. So that, wherever possible, people take control of the decisions that affect their lives. This commitment means that developing and implementing local approaches to climate change and energy policy design and development is important. Consequently, a major consideration is what individuals, neighbourhoods and communities can do to tackle climate change and energy needs by themselves if the right incentives are in place and bureaucracy removed. Climate change is a good example where individuals, communities and neighbourhoods that come together to develop innovative solutions can make a difference. There is clearly a role for central government in major projects but climate change also needs to be tackled from the bottom up, by individuals acting together in their diverse communities to solve problems. Government needs to enable people to act by putting in place the right incentives and enabling the creative power of people to solve problems. This Call for Evidence is an early move towards building a consensus across society about the potential options for a way forward and considering the roles that different parts of society will play in the transition.
This work is not about Government or the public choosing a pathway to 2050 today. Such a task would not be feasible – there is too much which is not yet known about the future. But this work starts to give us a better understanding of where the ‘good bet’ actions might lie, and it can be used to help us to understand the timing of future decision points. While this analysis does not set out a single roadmap to 2050, it better enables us to manage some significant uncertainties.

15
2. Illustrative pathways
Six purely illustrative pathways showing different potential directions of travel are described below. They combine different types and levels of change across sectors, to achieve an 80% reduction in greenhouse gas emissions by 2050, while ensuring that energy supply meets demand. These are just some of the range of plausible pathways to 2050 that can be explored with this analysis.
It is not possible to predict the future and none of the pathways that this analysis illustrates is a preferred route. By taking into account realistic constraints and considering different plausible contributions from all the different sectors that contribute to the UK’s greenhouse gas emissions, the pathways illustrate some of the ways in which it is possible to allocate effort across sectors, such that the UK as a whole achieves its goals.
The pathways take into account emissions from the supply and use of energy, as well as emissions from agriculture, waste, industrial processes, carbon capture technologies, land use, land use change and forestry.12 The 2050 analysis takes into account the possible drivers and constraints that affect different sectors, such as economic growth, population growth, technical potential, roll-out rates, land availability and ecological sensitivity.
‘Successful’ pathways are those that achieve an 80% reduction in greenhouse gas emissions by 2050, while ensuring that energy supply meets demand and energy is secure. Pathways would also need to ensure that cumulative emissions remain within the level likely to be allowed by future carbon budgets and this 2050 analysis does not prejudge future decisions on the level of carbon budgets, such as the fourth carbon budget.
This 2050 Pathways Analysis focuses on pathways that meet the key emissions and energy supply objectives, but before setting a long term course, further detailed analysis of the wider impacts and implications would be needed, for example, cost-effectiveness, public acceptability, and environmental sustainability.
A selection of pathwaysThe six pathways presented here show some different perspectives on how the target could be met. While the level of ambition in each sector varies between pathways, they aim to minimise extreme ambition in any one sector and the associated trade-offs. They all achieve an 80% emissions target while ensuring that energy supply meets demand.
12 Forillustrativepurposes,emissionsfrominternationalaviationandshippinghavebeenincludedinthepathwayspresented.However,onlydomestictransportiscurrentlyincludedintheUK’scarbonbudgets,becausethereisnointernationallyagreedframeworkforallocatinginternationalaviationandshippingemissionstonations.Aviationemissionsarehoweverboundintothe2020EUleveltargetsthroughthesector’sparticipationintheEUEmissionsTradingSystem.UndertheClimateChangeAct2008,theGovernmentmusteitherincludetheseemissionsincarbonbudgetsbytheendof2012orreporttoParliamentonwhytheyhavenotbeenincluded.

16
Pathways to 2050
●● Pathway Alpha illustrates a pathway with largely balanced effort across all sectors, based on physical and technical ambition. In this pathway, there would be a concerted effort to reduce overall energy demand; an equivalent level of effort from three large scale sources of low carbon electricity (renewables, nuclear, and fossil-fuel power stations with carbon capture and storage); and a concerted effort to produce and import sustainable bioenergy.
●● Pathway Beta looks at what could happen if we were not able to generate electricity using carbon capture and storage technology.
●● Pathway Gamma looks at what could happen if no new nuclear plant were built.
●● Pathway Delta looks at what could happen if only minimal new renewable electricity capacity were built.
●● Pathway Epsilon looks at what could happen if supplies of bioenergy were limited.
●● Pathway Zeta looks at what could happen if there were little behaviour change on the part of consumers and businesses.
●● The reference case: this pathway assumes that there is little or no attempt to decarbonise, and that new technologies do not materialise. This pathway does not meet the emissions targets and would not ensure that a reliable and diverse source of energy was available to meet demand – it would leave us very vulnerable to energy security of supply shocks.
The pathways are chosen to show a range of illustrative futures. Pathways Beta to Zeta show what could happen, not what would happen, if a key technology or lever were to be unavailable. The pathways below try to illustrate this wide range of futures, while at the same time minimising the need for extreme effort in any one sector (the level 4s), while aiming to avoid incompatible combinations of trajectories, and while taking account of the balancing requirements of the electricity grid. Many other pathway combinations are possible. These pathways do not reflect policy decisions and are not projections.

17
Illustrative pathways
Pathway AlphaThis pathway reflects effort spread across all sectors.
0
500
1000
1500
2000
2500
3000
3500Energy demand
2007
2010
TWh
/ yea
r
2045
2030
2020
2050
2040
2035
2025
2015
� Lighting and appliances � Heating and cooling � Industry � Transport
0
200
400
600
800
1000
1200Electricity generation
2007
2010
CO2e
/ ye
ar (%
of 1
990)
2045
2030
2020
2050
2040
2035
2025
2015
� Electricity imports � Non-thermal renewable generation � Nuclear power � Combustion + CCS � Unabated thermal generation
0
500
1000
1500
2000
2500
3000
3500
4000Primary supply
2007
2010
TWh
/ yea
r
2045
2030
2020
2050
2040
2035
2025
2015
� Agriculture, waste and biomatter imports � Environmental heat � Nuclear, solar, wind, tide, wave, geothermal, hydro � Fossil fuel
Emissions (% of base year)
2007
2010
TWh
/ yea
r
2045
2030
2020
2050
2040
2035
2025
2015
� International aviation and shipping � Waste � Land use, Land use change and forestry� Agriculture � Industrial process � Fuel combustion� Bioenergy credit � Carbon capture � Total
2050 Target
-40%
-20%
0%
20%
40%
60%
80%
100%

18
Pathways to 2050
In this pathway, all sectors would help make the transition to a low carbon economy.
This would require increasing and sustained investment in low carbon electricity generation. Among other distributed generation technologies, three main low carbon generation options (renewables, nuclear and fossil fuels with CCS) would be rolled out between now and 2050.
Despite a slight reduction in overall energy demand, demand for electricity would double by 2050, as a result of electrification of much of industry, heating and transport. Decarbonisation of generation would mean that all of the UK’s electricity would come from low carbon sources by the 2040s, making significant use of the UK’s wind resources, onshore and offshore, while keeping wind deployment well within the estimated limits that account for land use, sea use, ecological sensitivity and proximity constraints. It also assumes that we build new nuclear plant at a rate of 1.2 GW a year, and that carbon capture and storage on fossil fuel plants is successful and rolled out at a rate of 1.5 GW a year after 2030.
This pathway would also make use of the UK’s available bioenergy resources. Against the backdrop of growing demand for food and the need to increase food production sustainably through improving productivity and competitiveness in the UK, EU and beyond, and without impacting on areas of outstanding natural beauty, we would make use of 10% of UK land for energy crops. The UK would also import an amount of bioenergy equivalent to half of the UK’s projected market share of global bioenergy by 2050, based on IEA figures. The majority of this bioenergy would be co-fired in CCS power stations.
The pathway encompasses a thriving UK industrial sector, in which industry would make use of low carbon technologies that significantly reduce emissions and improve efficiency.
People would use the more energy-efficient lighting and appliances that are available today. Homes and buildings that are currently standing would be better insulated, with insulation measures being installed at a steady pace until 2050. New homes and buildings would be built to a very high standard to better maintain comfortable indoor temperatures, requiring less fuel for heating, and average internal temperatures would rise by just 0.5 degrees by 2050. By 2050, up to 30–60% of domestic heat demand would be met by electric technologies and most of the remainder would come from district heating connected to large power stations.
The pathway assumes that vehicles would continue to become more efficient out to 2050, and there would be breakthroughs in battery technology facilitating the introduction of significant numbers of electric and plug-in hybrid electric vehicles, such that by 2050, 60% of mileage was covered in electric and plug-in hybrid vehicles. It also assumes that there are substantial numbers of fuel cell vehicles, covering about 20% of mileage by 2050. More rail would be electrified and we would see modal shifts of freight to rail and water where these are viable options, with the share of freight travelling by road decreasing on today’s levels.
Energy supply would meet energy demand overall and come from diverse sources. For the occasional cold periods when there is little wind, back-up would be through an increase in storage, interconnection with the continent and flexible demand together with 2 GW of fossil-fuel-fired back-up generation which would be inactive for most of the year.
19
Illustrative pathways
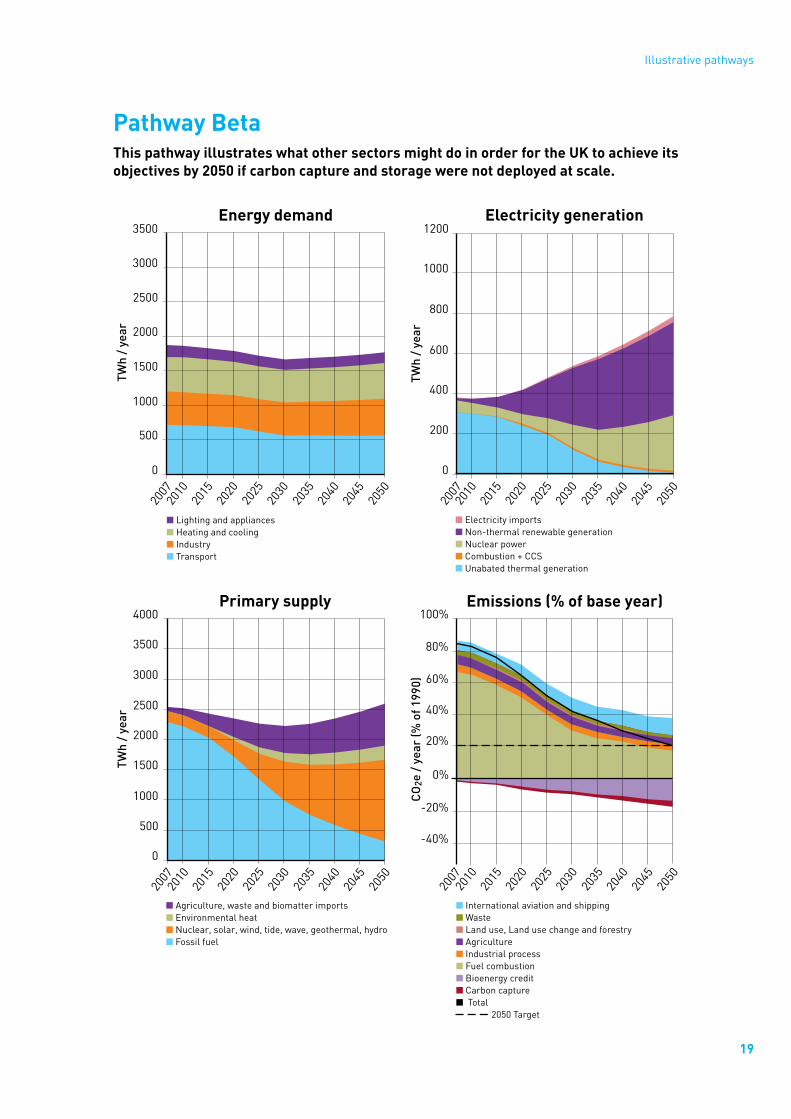
Pathway BetaThis pathway illustrates what other sectors might do in order for the UK to achieve its objectives by 2050 if carbon capture and storage were not deployed at scale.
0
500
1000
1500
2000
2500
3000
3500Energy demand
2007
2010
TWh
/ yea
r
2045
2030
2020
2050
2040
2035
2025
2015
� Lighting and appliances � Heating and cooling � Industry � Transport
0
200
400
600
800
1000
1200Electricity generation
2007
2010
CO2e
/ ye
ar (%
of 1
990)
2045
2030
2020
2050
2040
2035
2025
2015
� Electricity imports � Non-thermal renewable generation � Nuclear power � Combustion + CCS � Unabated thermal generation
0
500
1000
1500
2000
2500
3000
3500
4000Primary supply
2007
2010
TWh
/ yea
r
2045
2030
2020
2050
2040
2035
2025
2015
� Agriculture, waste and biomatter imports � Environmental heat � Nuclear, solar, wind, tide, wave, geothermal, hydro � Fossil fuel
Emissions (% of base year)
2010
TWh
/ yea
r
2045
2030
2020
2050
2040
2035
2025
2015
2007
� International aviation and shipping � Waste � Land use, Land use change and forestry� Agriculture � Industrial process � Fuel combustion� Bioenergy credit � Carbon capture � Total
2050 Target
0%
100%
80%
60%
40%
20%
-20%
-40%

20
Pathways to 2050
In this pathway, it is assumed that carbon capture and storage demonstration plants are implemented before 2018, but that no further CCS plants are built.
In order to meet electricity needs without CCS, it is assumed we very significantly increase effort in offshore wind. We also significantly increase bioenergy imports, such that the UK would import an amount of bioenergy equivalent to its entire projected market share by 2050, based on IEA figures. This bioenergy would mostly be used as liquid biofuels.
Under this pathway, we increase effort on reducing energy demand from domestic lighting, appliances and cooking, for example, by replacing all lights with LEDs, and using more efficient appliances. There would be greater efficiencies in the aviation sector.
Because of the large amount of renewables in this pathway, the challenges of balancing the electricity grid in the event of a five-day peak in heating and a drop in wind are more substantial. We would need a very significant increase in energy storage capacity, demand shifting and interconnection, together with 5 GW of fossil-fuel-powered stand-by generation that would be inactive for most of the year.

21
Illustrative pathways
Pathway GammaThis pathway addresses what might be done in other sectors if new nuclear plant were not built in Britain.
0
500
1000
1500
2000
2500
3000
3500Energy demand
2007
2010
TWh
/ yea
r
2045
2030
2020
2050
2040
2035
2025
2015
� Lighting and appliances � Heating and cooling � Industry � Transport
0
200
400
600
800
1000
1200Electricity generation
2007
2010
CO2e
/ ye
ar (%
of 1
990)
2045
2030
2020
2050
2040
2035
2025
2015
� Electricity imports � Non-thermal renewable generation � Nuclear power � Combustion + CCS � Unabated thermal generation
0
500
1000
1500
2000
2500
3000
3500
4000Primary supply
2007
2010
TWh
/ yea
r
2045
2030
2020
2050
2040
2035
2025
2015
� Agriculture, waste and biomatter imports � Environmental heat � Nuclear, solar, wind, tide, wave, geothermal, hydro � Fossil fuel
Emissions (% of base year)
2010
TWh
/ yea
r
2045
2030
2020
2050
2040
2035
2025
2015
2007
0%
100%
80%
60%
40%
20%
-20%
-40%
� International aviation and shipping � Waste � Land use, Land use change and forestry� Agriculture � Industrial process � Fuel combustion� Bioenergy credit � Carbon capture � Total
2050 Target

22
Pathways to 2050
In this pathway, it is assumed that no new nuclear plants are built.
In order to meet electricity needs without new nuclear, it is assumed that compared to Pathway Alpha, we significantly increase effort from onshore and offshore wind and from distributed solar PV (the equivalent of 5.4 square metres of panels per person by 2050). Imports of bioenergy are significantly increased compared to Pathway Alpha, such that the UK would import an amount of bioenergy equivalent to its entire projected market share by 2050, based on IEA figures. Energy demand is reduced in both the domestic and commercial sectors from lighting, appliances and cooking. As in Pathway Beta, efficiencies are seen in the aviation sector.
Even more than in Pathway Beta, the challenges of balancing the electricity grid are very substantial: we would need an extremely substantial increase in storage, demand shifting and interconnection.

23
Illustrative pathways
Pathway DeltaThis pathway addresses what might be done in other sectors if we did not continue to build new renewable electricity generation.
0
500
1000
1500
2000
2500
3000
3500Energy demand
2007
2010
TWh
/ yea
r
2045
2030
2020
2050
2040
2035
2025
2015
� Lighting and appliances � Heating and cooling � Industry � Transport
0
200
400
600
800
1000
1200Electricity generation
2007
2010
CO2e
/ ye
ar (%
of 1
990)
2045
2030
2020
2050
2040
2035
2025
2015
� Electricity imports � Non-thermal renewable generation � Nuclear power � Combustion + CCS � Unabated thermal generation
0
500
1000
1500
2000
2500
3000
3500
4000Primary supply
2007
2010
TWh
/ yea
r
2045
2030
2020
2050
2040
2035
2025
2015
� Agriculture, waste and biomatter imports � Environmental heat � Nuclear, solar, wind, tide, wave, geothermal, hydro � Fossil fuel
Emissions (% of base year)
2010
TWh
/ yea
r
2045
2030
2020
2050
2040
2035
2025
2015
2007
0%
100%
80%
60%
40%
20%
-20%
-40%
� International aviation and shipping � Waste � Land use, Land use change and forestry� Agriculture � Industrial process � Fuel combustion� Bioenergy credit � Carbon capture � Total
2050 Target

24
Pathways to 2050
In this pathway, it is assumed that no new renewables are built.
In order to meet electricity needs without renewables, it is assumed that we significantly increase effort in nuclear generation (from 57 TWh of electricity in 2007 to 633 TWh of electricity in 2050). Imports of bioenergy are significantly increased compared to Pathway Alpha, such that the UK would import an amount of bioenergy equivalent to its entire projected market share by 2050, based on IEA figures projecting future growth of bioenergy production.
Energy demand is reduced significantly across more sectors: in homes, the average temperature decreases by 0.5 degrees centigrade from the 2007 winter average, using smarter room heating controls; and insulation would be much more comprehensive: for example, 70% of appropriate dwellings would install solid wall insulation. This pathway also assumes that the UK sequesters 1 MtCO2 per year, through for example biochar, chalk or bio cement. As in the previous pathways, efficiencies are seen in the aviation sector and demand reductions from domestic lighting, appliances and cooking.
Without renewables in the system, it is easier to balance the electricity grid and no additional back-up capacity beyond what exists today is required.

25
Illustrative pathways
Pathway EpsilonThis pathway addresses what might be done in other sectors if only small levels of bioenergy were available.
0
500
1000
1500
2000
2500
3000
3500Energy demand
2007
2010
TWh
/ yea
r
2045
2030
2020
2050
2040
2035
2025
2015
� Lighting and appliances � Heating and cooling � Industry � Transport
0
200
400
600
800
1000
1200Electricity generation
2007
2010
CO2e
/ ye
ar (%
of 1
990)
2045
2030
2020
2050
2040
2035
2025
2015
� Electricity imports � Non-thermal renewable generation � Nuclear power � Combustion + CCS � Unabated thermal generation
0
500
1000
1500
2000
2500
3000
3500
4000Primary supply
2007
2010
TWh
/ yea
r
2045
2030
2020
2050
2040
2035
2025
2015
� Agriculture, waste and biomatter imports � Environmental heat � Nuclear, solar, wind, tide, wave, geothermal, hydro � Fossil fuel
Emissions (% of base year)
2010
TWh
/ yea
r
2045
2030
2020
2050
2040
2035
2025
2015
2007
� International aviation and shipping � Waste � Land use, Land use change and forestry� Agriculture � Industrial process � Fuel combustion� Bioenergy credit � Carbon capture � Total
2050 Target
0%
100%
80%
60%
40%
20%
-20%
-40%

26
Pathways to 2050
In this pathway, it is assumed that current trends and drivers in domestic agricultural production continue, such that 5% of land in the UK is used for biocrops. It assumes that we access half of UK projected market share of global bioenergy by 2050. According to the 2050 Pathways Calculator, it is not possible to meet our targets and energy needs with no bioenergy available.
With such low levels of bioenergy available, our energy needs are met by significantly increasing solar thermal energy provision compared to Pathway Alpha, such that all suitable buildings get approximately 30% of their hot water from solar thermal installations. In order to reduce our total energy need, extremely high levels of electrification of heating and transport are assumed: all car and van travel is powered by electricity by 2050; and all heating may need to be provided through electric heating technologies. The demand side changes are similar to Pathway Alpha in domestic and commercial appliances; and domestic and commercial heating, hot water and cooling.
The balancing challenge is also similar to that in Pathway Alpha.

27
Illustrative pathways
Pathway ZetaThis pathway addresses what might be done in other sectors if there was minimal behavioural change.
0
500
1000
1500
2000
2500
3000
3500Energy demand
2007
2010
TWh
/ yea
r
2045
2030
2020
2050
2040
2035
2025
2015
� Lighting and appliances � Heating and cooling � Industry � Transport
0
200
400
600
800
1000
1200Electricity generation
2007
2010
CO2e
/ ye
ar (%
of 1
990)
2045
2030
2020
2050
2040
2035
2025
2015
� Electricity imports � Non-thermal renewable generation � Nuclear power � Combustion + CCS � Unabated thermal generation
0
500
1000
1500
2000
2500
3000
3500
4000Primary supply
2007
2010
TWh
/ yea
r
2045
2030
2020
2050
2040
2035
2025
2015
� Agriculture, waste and biomatter imports � Environmental heat � Nuclear, solar, wind, tide, wave, geothermal, hydro � Fossil fuel
Emissions (% of base year)
2010
TWh
/ yea
r
2045
2030
2020
2050
2040
2035
2025
2015
2007
� International aviation and shipping � Waste � Land use, Land use change and forestry� Agriculture � Industrial process � Fuel combustion� Bioenergy credit � Carbon capture � Total
2050 Target
0%
100%
80%
60%
40%
20%
-20%
-40%

28
Pathways to 2050
In this pathway, it is assumed that no effort is made to adapt behaviours in response to the threat of climate change and energy security concerns. This means that no efforts are made to change heating and cooling comfort levels or thermal efficiency and insulation levels in either domestic or commercial buildings. This pathway also assumes that no effort is made to reduce demand or improve the efficiency of appliances, lighting and cooking. Transport demand is assumed to rise, as in all pathways, but here private car transport continues to significantly dominate travel choices with relatively little mode shift to cycling or public transport, and the freight and aviation sectors undergo little change.
The targets are met through extremely high levels of electrification of heating, transport, industry and appliances. In order to generate enough electricity to meet needs, all generation technologies need to play a part, and offshore wind is significantly increased relative to Pathway Alpha. Electricity imports are significantly higher (70 TWh compared to 5.2 TWh net imports in 2007). We would also need to use some bioenergy, and we would make use of 10% of UK land for energy crops, and import an amount of bioenergy equivalent to half of the UK’s projected market share of global bioenergy by 2050.
The balancing challenge is similar to Pathway Beta.

29
Illustrative pathways
The reference case pathway
0
500
1000
1500
2000
2500
3000
3500Energy demand
2007
2010
TWh
/ yea
r
2045
2030
2020
2050
2040
2035
2025
2015
� Lighting and appliances � Heating and cooling � Industry � Transport
0
200
400
600
800
1000
1200Electricity generation
2007
2010
CO2e
/ ye
ar (%
of 1
990)
2045
2030
2020
2050
2040
2035
2025
2015
� Electricity imports � Non-thermal renewable generation � Nuclear power � Combustion + CCS � Unabated thermal generation
0
500
1000
1500
2000
2500
3000
3500
4000Primary supply
2007
2010
TWh
/ yea
r
2045
2030
2020
2050
2040
2035
2025
2015
� Agriculture, waste and biomatter imports � Environmental heat� Nuclear, solar, wind, tide, wave, geothermal, hydro � Fossil fuel
Emissions
2010
TWh
/ yea
r
2045
2030
2020
2040
2035
2025
2015
2007
0%
100%
80%
60%
40%
20%
-20%
-40%
2050
� International aviation and shipping � Waste � Land use, Land use change and forestry� Agriculture � Industrial process � Fuel combustion� Bioenergy credit � Carbon capture � Total
2050 Target

30
Pathways to 2050
The above successful pathways all require a degree of effort in different sectors. For comparison we present a baseline pathway, where there would be little or no attempt to decarbonise, and where no significant new technologies are deployed at scale. Under such a scenario, with no policy effort, total emissions would only fall by around 16% from 1990 levels, far short of the 2050 target.
Despite the lack of effort to decarbonise, emissions are still lower than in 1990 because of the emissions reductions that had already been made between 1990 and 2010.

31
Illustrative pathways
Summary of the selection of levels and trajectories for the different pathways
Alpha: cross-sector effort
Beta: low CCS
Gamma: low
nuclear
Delta: low renewables
Epsilon: low
bioenergy
Zeta: low behaviour
change
Reference case: high
carbon
Combustion + CCS
2 1 2 2 2 2 1
Nuclear power 2 2 1 3 2 2 1
Onshore wind 2 2 3 1 2 2 1
Offshore wind 2 3 3 1 2 3 1
Hydroelectric 2 2 2 1 1 2 1
Marine 2 2 2 1 1 2 1
Geothermal 2 2 2 1 1 2 1
Distributed solar PV
2 2 3 1 1 2 1
Distributed solar thermal
2 2 1 1 3 2 1
Micro wind 2 2 2 1 1 2 1
Biomatter to fuel conversion
B C A A B B A
Bioenergy imports
2 3 3 3 2 2 1
Agriculture C C C C A C A
Waste arising C B C C C C A
Marine algae 2 2 2 2 1 2 1
Electricity imports / exports
1 2 2 1 1 3 1
Storage, demand shifting, backup
2 3 4 1 2 3 1
Domestic space heating and hot water
(i) Heating/ cooling comfort level
2 2 2 3 2 1 1
(ii) Housing thermal efficiency
2 2 2 3 2 1 1
(iii) Electrification level
C C C C D D A
(iv) Non-electric fuel direction
C C C C D C A

32
Pathways to 2050
Alpha: cross-sector effort
Beta: low CCS
Gamma: low
nuclear
Delta: low renewables
Epsilon: low
bioenergy
Zeta: low behaviour
change
Reference case: high
carbon
Commercial heating and cooling
(i) Heat/cooling demand
2 2 2 2 2 1 1
(ii) Electrification level
C C C C D D A
(iii) Non-electric fuel direction
C C C C D C A
Domestic lighting, appliances, and cooking
i) Demand/ Efficiency
2 3 3 3 2 1 1
(ii) Technology pathway
B B B B B B A
Commercial lighting, appliances, and catering
(i) Demand/ Efficiency
2 2 3 2 2 1 1
(ii) Technology pathway
B B B B B B A
Industrial processes
C C C C D C A
Domestic passenger transport
(i) Behaviour 2 2 2 2 2 1 1
(ii) Electrification C C C C D D A
Domestic freight 2 2 2 2 3 1 1
International aviation
1 2 2 2 2 1 1
International shipping
1 1 1 1 1 1 1
Geosequestration 1 1 1 2 2 1 1

33
Illustrative pathways
Figure 1: A summary of energy supply and energy demand in 2050 across the illustrative pathways
There are of course other pathways that achieve the UK’s emissions target. We are keen for others to explore the alternative plausible pathways, using the 2050 online calculater tool.
We have explored some common messages from the pathways illustrated above.
0
500
1000
1500
2000
2500
3000
3500
4000
FEDCBAR0
500
1000
1500
2000
2500
3000
3500
4000
3000
Supp
ly o
f pri
mar
y en
ergy
in 2
050
(TW
h/ye
ar)
Dem
and
for
ener
gy in
205
0 (T
Wh/
year
)
� Oil and petroleum products� Natural gas� Coal� Nuclear fission� Waste� Biomass (domestic)� Biomass (imports)� Solar� Environmental heat� Wind� Hydro� Wave� Tidal� Geothermal� Electricity imports
� Industry� Heating and cooling (homes)� Heating and cooling (commercial)� Lighting and appliances (commercial)� Lighting and appliances (homes)� Road transport� Rail transport� Shipping (domestic)� Shipping (international)� Aviation (domestic)� Aviation (international)� Agriculture� Geosequestration� Electricity exports� Losses

34
Pathways to 2050
Common messages from the pathwaysThrough exploring some of the different possible ways to achieve an 80% emissions reduction, this work has drawn out some common elements of the plausible pathways and explored the implications and uncertainties associated with different choices. It reveals the scale and pace of change that is required and some of the key decisions that will be faced. Below, some of the implications of the illustrative pathways are set out.
Ambitious per capita energy demand reduction is needed. In these illustrative pathways, total energy demand in 2050 ranges from 10% above to 45% below 2007 levels, even though over the 40 year period the population grows by 25%, the number of households by 50% and GDP by almost 200%. The greater the constraints on supplies of low carbon energy, the greater the ambition on demand reduction through energy saving and efficiency will need to be. Only one of the pathways presented in this report sees an increase in total energy demand, Pathway Zeta. As a result of failing to reduce demand for energy in this pathway, the UK would need to see very significant ambition in all supply sectors to generate enough electricity.
A substantial level of electrification of heating, transport and industry is needed. Decarbonised electricity can be used for a wide range of activities, often with high efficiency compared to other fuels, and can be scaled up to meet demand. It therefore makes sense to switch to electricity where this is practical, despite the major technological and engineering challenges involved. For heating, other technologies (for example, using heat from power stations, and solar thermal technologies) may also be required. In road transport, biofuels may play a role and fuel cells may also be a long-term contributor, particularly for sectors that are hard to electrify. However, some degree of electrification appears to be critical—analysis of alternative pathways shows that failing to at least partially electrify heating and transport would make the emissions target undeliverable unless very substantial demand reductions and technological breakthroughs were made and extremely large amounts of bioenergy were available.
Electricity supply needs to be decarbonised, while supply may need to double. The use of electricity for significant parts of the industry, heating and transport sectors would mean that demand for electricity would be likely to rise, even as overall energy use declines.
●● This would require substantial, sustained investment in low carbon electricity generation technologies, beyond current levels.
●● The transmission grid would need to become bigger and more sophisticated. It would draw in electricity from a wider range of providers, likely to include offshore wind turbines and electricity imports. A greater number of interconnections to neighbouring countries may be of mutual benefit in smoothing variable renewable supplies and increasing access to competitively priced sources of electricity.
●● Electrification of industry, transport and heating systems may potentially double overall electricity demand. The distribution network would need to become bigger and smarter to enable this.
A growing level of variable renewable generation increases the challenge of balancing the electricity grid. Potential growth of peak loads, combined with the expansion of inflexible or variable low carbon generation sources, such as wind power, would present challenges for the management of electricity networks. Demand-side flexibility could help by providing consumers with new incentives to shift demand to

35
Illustrative pathways
better match electricity generation. But either significant storage, interconnection and other balancing technologies are likely to be required, or we would need to rely on extra back-up capacity.
Sustainable bioenergy is a vital part of a low carbon energy system. There are energy demands – such as industrial high grade heating processes, long-haul road freight journeys and aviation – where electrification is unlikely to be practical. However, it is not feasible to continue using solely fossil fuels in all of these sectors and achieve an 80% emissions cut, without using international credits. In these sectors sustainable bioenergy currently offers the only plausible option for domestic action. Working towards establishing sustainable bioenergy supply chains will be an important activity in the coming years. In all practical pathways explored through the analysis, some level of sustainable bioenergy is required to reach the 2050 target. In some pathways the use of bioenergy with carbon capture and storage (BECCS) is important. This is where bioenergy is burnt to produce electricity and the carbon dioxide released is captured and stored, which can lead to a net reduction in carbon dioxide in the atmosphere. This has a potentially large greenhouse gas benefit, but is dependent on the ability to use CCS with biomass – which has not yet been proven at scale.
Reduction in emissions from agriculture, waste, industrial processes and international transport will be necessary by 2050. In addition to emissions from the energy sector, greenhouse gases are emitted by livestock, waste, soils and industrial processes. If no action were taken to reduce emissions from agriculture, waste, and industrial processes, as well as those from international aviation and shipping (which are not currently included in the 2050 target, but are included in the 2050 Pathways Calculator), then these sectors alone would exceed the maximum level of emissions allowable for the whole economy under an 80% cut.
Fossil fuels continue to play a role. The pathways show an ongoing need for fossil fuels in our energy mix, although the precise long term role of oil, coal and gas will depend on a range of issues, such as development of CCS.
Uncertainties and trade-offs presented by the pathwaysAs well as a set of common conclusions, the pathways analysis also identifies some areas of uncertainty, where it is not yet clear what developments will take place, or what the optimal choice would be. Key areas of uncertainty are described below.
The shape of future energy infrastructures. Different low carbon pathways present different implications for the infrastructures required. In order to facilitate a low carbon pathway there will be important decisions to make in the coming years on creating, extending or upgrading the electricity networks, electricity interconnectors, transport infrastructures, the gas grid, oil and petroleum infrastructures, CCS pipelines, bioenergy infrastructure and heating infrastructures. In particular:
●● Upgrades in electricity transmission and distribution networks need to plan to allow for growth in electricity demand.
●● The long term future of the gas distribution network is uncertain, and the network could have diminishing use if a decline in the use of fossil gas is not offset by use of biogas. The long term future of this asset during the transition to a low carbon UK needs to be better understood.

36
Pathways to 2050
The precise 2050 electricity generation mix. A range of electricity-generating technologies could contribute to the 2050 supply mix:
●● The highest potential contributions come from wind, nuclear and fossil fuels with CCS. Smaller but potentially important contributions could be made from other renewable sources.
●● There remain some technological uncertainties around many low carbon electricity generating technologies, which emphasises the need for a portfolio approach.
●● As described above, a growing level of variable renewable generation would place greater emphasis on sources of supply and demand flexibility and storage. The level of need and balance of solutions will be influenced by market arrangements, incentives and technological development, but are likely to include:
higher levels of interconnection with neighbouring countries to allow fluctuations in demand and supply to be smoothed across a number of countries;
new storage technologies, such as large scale batteries; and
smart or flexible demand, such as off-peak charging of electric vehicles.
Availability of sustainable bioenergy. Some bioenergy will be important to achieving the UK’s emissions target, but the extent of sustainable bioenergy resources, and the potential for their expansion, are uncertain. There is likely to be competition for bioenergy resources globally and from a number of sectors.13 The utilisation of both domestically produced and imported bioenergy will require careful monitoring of the associated emissions arising from its cultivation and transportation, and the impacts of direct and indirect land use change, the potential air quality and health impacts of production processes and usage, the effects on local livelihoods and natural ecosystems of large scale bioenergy cultivation, and impacts on global food prices. Given the current uncertainty associated with future levels of sustainable bioenergy, it is not yet clear how constrained bioenergy resources should be used most effectively and efficiently within the UK energy system. Also, when considering infrastructure that would use sustainable bioenergy, the UK should continue to assess the risk of locking-in a sub-optimal use of limited bioenergy resources.
International dynamics. The direction that other nations take will affect fuel and resource demand, availability and price, supply chains for key technologies, and technological development. UK decisions need to respond to shifting global priorities and events, to be resilient to developments and to maximise UK business opportunities. As well as in the area of low carbon technologies, international developments will be particularly influential in four fuel sectors:
●● Sustainable bioenergy: availability will depend increasingly on technological and supply chain development, and global sustainability criteria, as well as demand from other countries.
●● Oil: production and use will decline substantially in our energy mix by 2050, but use of oil is likely to remain an important fuel for some sectors, and an important feedstock for manufacturing. Indeed the decline in UK oil production is such that under some scenarios our need for oil imports may be higher in 2050 than today.
13 Theremayalsobecompetingdemandsforbiomassresourcesfornon-energyusessuchasconstructionandchemicalfeedstocks.

37
Illustrative pathways
●● Gas: will remain an important fuel for many years to come, but its precise long term role will depend on developments such as the viability of CCS at scale.
●● Coal: use of coal will decline substantially in our energy mix by 2050, and its use in the transition will also depend on CCS developments
To deal with this, the UK will need to build on its range of policies to promote the development and deployment of energy efficiency policies and low carbon technologies internationally, promote price stability via efficient and transparent markets and encourage investment in essential fossil fuels production. The UK will also need to continue working with its partners in Europe to ensure that further progress is made on the functioning and integration of EU energy markets, the diversity of the routes and sources of the EU’s energy supplies, and the move to a low carbon economy.
The availability, cost and public acceptability of international credits will influence the level of abatement needed in the UK. Purchase of credits reduces the level of action needed in the UK, by paying for equivalent emissions reductions abroad.
Technological uncertainties. Each of the pathways is reliant upon the development and innovation of a range of technologies. Some of these technologies have been demonstrated but require scaling up; other technologies are more speculative and to some extent unproven. It is not possible to predict exactly how this range of technologies will develop over the next 40 years and surprises will occur – both successes and failures. Some of the most critical areas of technological uncertainty include:
●● low carbon heating technologies–several technologies have potential but few have so far been deployed on a wide-scale in the UK;
●● low carbon road vehicles, with breakthroughs anticipated in both battery and fuel cell technologies;
●● ‘second generation’ biofuels processes, which require development and scaling up;
●● CCS, which is yet to be demonstrated at a commercial scale on a power station. The full extent of geological CO2 storage is still to be proven;
●● hydrogen,14 which may have potential in the long term to offer flexibility to the power sector and provide a low carbon fuel to segments of transport demand;
●● negative emissions technologies are currently highly uncertain.
Environmental impacts. Cutting greenhouse gas emissions is a key part of protecting our local and global environment. However, the deployment of low carbon energy on the scale needed presents some tensions with other environmental objectives. For example:
●● offshore wind turbines might affect the marine environment and onshore turbines may be at odds with landscape character;
●● wave and tidal power could affect sensitive marine and coastal habitats; and
●● the production of bioenergy can have implications for biodiversity domestically and internationally and food supplies and its use can affect air quality.
14 Hydrogendoeshoweverneedtobegeneratedusinglowcarbonenergy(suchaslowcarbonelectricity)anditsgenerationinvolvesefficiencylosses.
38
Pathways to 2050
A successful pathway for decarbonising our economy will need to involve an acceptable balance between those tensions and, where feasible, solutions which bring multiple environmental benefits.
Understanding the cost implicationsThe 2050 Pathways Analysis explores the physical and technical limits of what can be delivered within each sector over the next 40 years. But in evaluating different pathways, there are a range of implications which are important to understand. One critical implication is the cost of each pathway.
Providing a comprehensive estimate of the costs of decarbonisation out to 2050 is very challenging. First, it is impossible to predict accurately how fuel and technology costs will develop over such a long period. Costs will necessarily depend on the assumptions on fuel prices, technology development and the paths taken by other countries. And in some sectors the technological solutions required to allow the necessary emissions reductions are not yet known. Second, many of the wider impacts of the move to a low carbon economy are very difficult to quantify, for example those on security of supply, the wider environment and people’s behaviours.
Cost estimates from other studiesOther published studies have attempted to cost decarbonisation. The studies are not directly comparable to this 2050 Pathways Analysis, but they provide a high level picture of the magnitude of costs which people are anticipating over the long term. These studies suggest that the costs of decarbonising are manageable, though they are sensitive to assumptions about the future costs of technologies and fossil fuel prices, and also the underlying structures of the models.
A recent Ofgem study suggested that around £200 billion of investment in the UK’s energy infrastructure is necessary over the coming decade to 2020.15 Looking beyond 2020, the uncertainties surrounding the cost projections increase. Nonetheless, Lord Stern’s review suggested a macro-economic cost of around 1% of global GDP by 2050 to stabilise global emissions: less than the costs of the environmental impacts of failing to act.16 Previous DECC analysis has reached similar conclusions, for example analysis published in 200917 found that an 80% 2050 UK emissions target meant that UK GDP is 0.85% lower in 2050 than in the baseline. A joint study by some leading organisations has recently costed 2050 pathways for the European Union.18 This concluded that under a series of assumptions, for the EU as a whole, the cost of electricity and overall economic growth in the decarbonised pathways would be comparable to the baseline over the period 2010–2050.19
15 Ofgem(2009)Project Discovery,2009.ThisfiguresexcludesinvestmentinUKContinentalShelfoilandgasproduction.
16 Stern,N(2006)The Economics of Climate Change.17 DECC(2009)The UK Low Carbon Transition Plan: National strategy for climate change and energy18 McKinsey&Company,KEMA,ImperialCollegeLondon,OxfordEconomicsandtheEuropeanClimate
Foundation.http://www.roadmap2050.eu/19 Theassumptionsincluded:industryconsensuslearningratesforthosetechnologies;increased
emissionreductioneffortsintherestoftheworld;marketdemandforlowcarboninvestments;IEAprojectionsforfossilfuelprices;asignificantexpansionofgridinterconnectionbetweenandacrossregionsinEurope;andanaveragecarbonpriceofatleast€20–30pertCO2eover40years.

39
Illustrative pathways
Costs in the large scale power generation sectorThe large scale power generation sector is one of the areas where some of the biggest changes are required, and we have carried out some initial costs analysis to explore the implications of the illustrative pathways for costs in this sector. The analysis which follows is necessarily partial. It is not attempting to provide a full picture of the trade-offs between different pathways. Given inherent uncertainties around future costs of technologies and fuels, and the limitations of the approach, these cost estimates cannot claim to be accurate projections of what actual costs would be. It is particularly difficult to assess the likely future cost of technologies still in early stages of development. The analysis does not attempt to cost the choices made in other sectors beyond the large scale generation sector. However, it is possible to draw some preliminary and tentative high level conclusions for the electricity sector from this analysis.
Approach
Drawing on published cost estimates for different generation technologies and fossil fuel price assumptions,20 the physical resource costs to society of building and operating the required power generation and the associated infrastructure costs have been estimated for each 2050 Pathway. All costs are expressed in 2009 prices.21
This analysis includes the following costs:
●● physical capital (build) costs;
●● fixed and variable operating costs;
●● fuel costs;
●● nuclear decommissioning and waste costs; and
●● infrastructure costs (the electricity transmission and distribution network, interconnectors and storage).
It does not include:
●● Financing costs: capital intensive technology is often financed from debt and/or equity, incurring a financing cost (such as interest payments on debt). These costs are excluded from this analysis because of the difficulty of estimating the future financing costs and the required rate of return of each technology. Low carbon technologies tend to be more capital-intensive than fossil fuel technologies, meaning their costs of finance are higher; this means that relative costs of the low carbon pathways would be higher if finance costs were included.
●● The costs of carbon (for example EU ETS allowances) have been excluded at this stage to enable a clear comparison between the reference pathway where little effort is made to reduce emissions and the low carbon pathways. Including the costs of carbon would mean that the reference pathway would be higher cost.
20 Theseassumptionsaresetoutintheannex.21 WherecostsarepresentedinPresentValueterms,theyhavebeendiscountedbackto2010using
standardGreenBookdiscountratestoreflecttheincreasedvaluesocietyattachestopresent,asopposedtofuture,consumption.

40
Pathways to 2050
●● The costs of imported electricity: some pathways involve importing electricity. It is unclear how much this electricity will cost and for this reason the costs have been excluded from the analysis. Including them would increase the relative costs of those pathways which include significant amounts of electricity imports.
●● Research and development (R&D) costs: the rates of technology deployment imply that significant investment is needed in R&D. However, these costs are very difficult to estimate. Many low carbon technologies are less mature technologically than fossil fuel technologies, such that higher levels of R&D spending will be required to make them more competitive. This means that the relative costs for the low carbon technology pathways would likely be higher if these costs were included.
●● Behavioural change costs: the direct costs of changing people’s behaviour (for example, through information campaigns to encourage people to use less electricity) have not been estimated, or the welfare costs implied by changes in behaviour (for example, through changes in patterns of electricity use). Moving to a low carbon economy will require more behavioural change than if we make little effort to decarbonise, meaning that the relative costs of the low carbon pathways would be higher if these costs were included.
●● Macro-economic costs: we have not quantified what the pathways mean for adjustments in the wider macro economy, or for its resilience to shocks such as oil and gas price spikes, that have in the past caused recessions, business failures and job losses.
Moreover, the analysis does not take into account potential benefits from particular technologies – for example, in relation to security of supply, innovation or wider economic benefits. Therefore a focus purely on physical resource costs does not truly reflect the trade-offs involved with different technological choices.
Technology costs are apportioned over time broadly according to when they are incurred by society. For example, the costs of building a power plant are spread over the years of construction and the operating costs over the years of operation. This differs from those studies which apply a levelised cost approach and thereby effectively spread the costs of construction over the years of operation. Although a levelised cost approach more accurately reflects when the generator would actually pay back the costs of construction (ie, through selling the energy produced to consumers), the method used here more accurately reflects when resources are actually used, providing a better picture of the size of resources the economy needs to make available and when.
The findings
Shift from expenditure on fuel to expenditure on capital
One key feature of the low carbon pathways is their costs profile. Most low carbon generation technologies involve greater upfront capital costs but much lower operating (particularly fuel) costs than conventional power plants such as gas. Therefore, compared to the reference case, each of the illustrative pathways involves a shift from expenditure on fuel (primarily gas) to upfront expenditure on capital (building low carbon power plants).
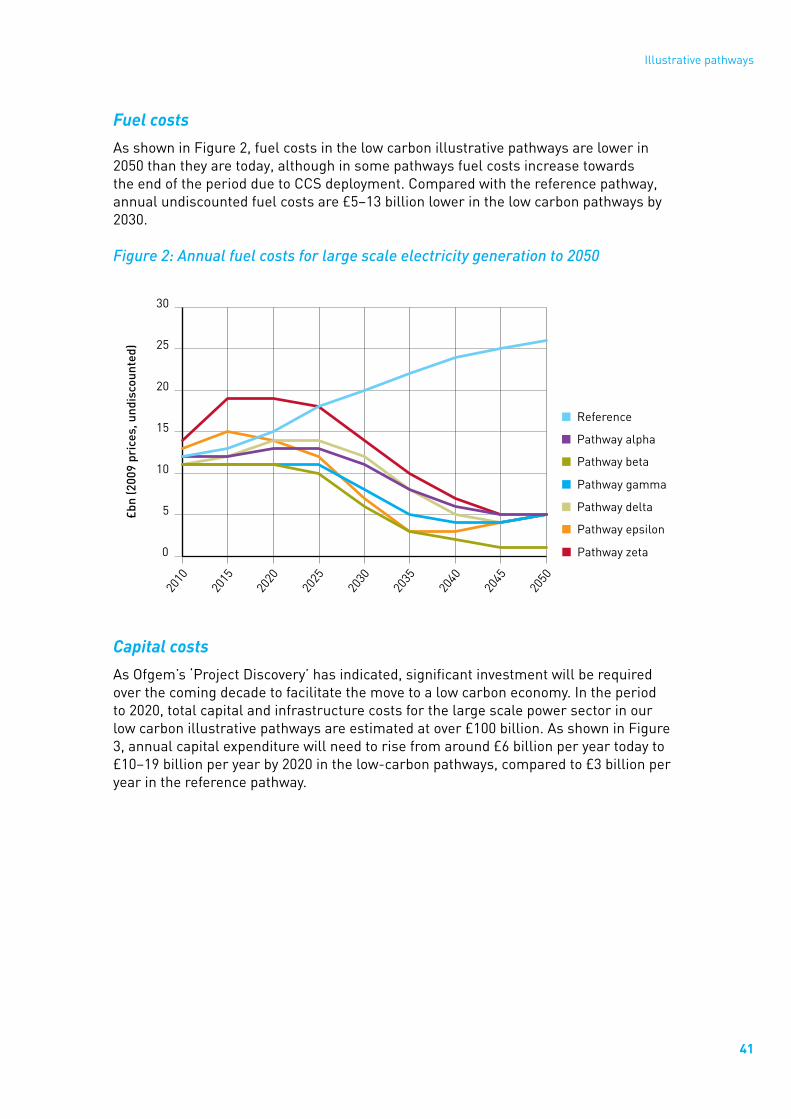
41
Illustrative pathways
Fuel costs
As shown in Figure 2, fuel costs in the low carbon illustrative pathways are lower in 2050 than they are today, although in some pathways fuel costs increase towards the end of the period due to CCS deployment. Compared with the reference pathway, annual undiscounted fuel costs are £5–13 billion lower in the low carbon pathways by 2030.
Figure 2: Annual fuel costs for large scale electricity generation to 2050
Capital costs
As Ofgem’s ‘Project Discovery’ has indicated, significant investment will be required over the coming decade to facilitate the move to a low carbon economy. In the period to 2020, total capital and infrastructure costs for the large scale power sector in our low carbon illustrative pathways are estimated at over £100 billion. As shown in Figure 3, annual capital expenditure will need to rise from around £6 billion per year today to £10–19 billion per year by 2020 in the low-carbon pathways, compared to £3 billion per year in the reference pathway.
0
5
10
15
20
25
30
2040
2050
2035
2030
2025
2020
2015
2010
� Pathway gamma
� Pathway delta
� Pathway epsilon
� Pathway zeta
£bn
(200
9 pr
ices
, und
isco
unte
d)
� Reference
� Pathway alpha
� Pathway beta
2045

42
Pathways to 2050
Figure 3: Annual capital costs for large scale electricity generation to 2050
Costs projections depend very heavily on fossil fuel price assumptions
The relative costs of the high and low carbon pathways depend very heavily on the assumptions made about fossil fuel prices. Figure 4 presents the costs on a per MWh basis under different fossil fuel price assumptions. In the reference case for example, the average cost per MWh under low fossil fuel prices is just under £40/MWh. This rises to nearly £60/MWh under central fossil fuel prices, over £70/MWh under high fossil fuel prices, and just under £85/MWh in a world of high-high fossil fuel prices.
The chart shows that most of the low carbon pathways are less costly than the reference pathway under high-high fossil fuel price assumptions; similar costs to the reference pathway under high fossil fuel price assumptions; around £6–11/MWh more expensive than the reference pathway under central fossil fuel price assumptions; and around £20/MWh more expensive than the reference pathway under low fossil fuel price assumptions. Although the rationale for moving to a low carbon pathway is not to reduce energy costs, the analysis indicates that low carbon energy generation can actually be less expensive than conventional energy generation under the highest fossil fuel price scenarios. Given the inherent uncertainty in predicting the likely price of fossil fuels over 40 years, it is significant that the low carbon pathways reduce our exposure to the risk of high fossil fuel prices.
The figures used represent the total (discounted22) gross physical costs (ie, excluding benefits) to 2050 divided by the total (discounted) amount of electricity generated and cannot therefore be taken as indications of what electricity prices would be in each of the pathways. As explained previously, these numbers do not include any wider benefits. Electricity prices will depend on the market framework in place and will also include a number of costs not covered here, including carbon prices, financing costs, and taxes.
22 DiscountedusingstandardHMTGreenBooksocialdiscountrates.
0.0
7.5
15.0
22.5
30.0
2040
2045
2035
2030
2025
2020
2015
2010
� Pathway gamma
� Pathway delta
� Pathway epsilon
� Pathway zeta
£bn
(200
9 pr
ices
, und
isco
unte
d)
� Reference
� Pathway alpha
� Pathway beta

43
Illustrative pathways
Figure 4: Average gross cost per megawatt-hour of the illustrative pathways in 2050
Differences between the pathways
It should be noted that the pathways are illustrative – we have shown ways of meeting the target and balancing energy supply and demand under different assumptions, but these pathways are not the only way, or the cheapest way, of doing so. When constructing pathways, we have made choices across a wide range of sectors and technologies. For example, in Pathway Beta we have restricted CCS and filled the gap by increasing offshore and onshore wind. It is important to note that other options would also be available – the choices in each pathway are illustrative only.
Next steps for understanding the cost implicationsThis initial costs analysis begins to explore the implications of the illustrative pathways for costs in the large scale power generation sector. Since the power generation sector is only one part of the total costs picture, these costs do not tell us whether one pathway costs more or less than another in total. But over the coming months, we will explore the implications of the illustrative pathways for costs in other sectors, in order to build up a fuller picture of the cost implications of alternative pathways.
0
20
40
60
80
100
� Low fossil fuel prices� Central fossil fuel prices� High fossil fuel prices� High-high fossil fuel prices
Reference Gamma(low nuclear)
Beta(low CCS)
Alpha(spread)
Delta(low renewables)
Zeta(low behaviour
change)
Epsilon(low bioenergy)
Aver
age
cost
, £M
Wh,
dis
coun
ted
Pathway
44
3. Call for evidence questions
List of questionsWhen responding to questions, please provide all appropriate evidence to support statements and assumptions. The questions which follow refer to: the assumptions made for each sector set out in detail in the sectoral chapters in Part 2 of the report; the Excel model ‘the 2050 Pathways Calculator’; or the findings as set out in Part 1 above.
1. Scope of model:
(a) Are there any low carbon technologies or processes or major demand-side options which are not currently included within the scope of the model but that you consider should be in future?
2. Scope of sectors:
(a) Does the range of alternative levels of ambition presented for each sector cover the full range of credible futures? If not, what evidence suggests that the range of scenarios should be broader than those presented?
(b) Do the intermediate levels of ambition (levels 2 and 3) provided for each sector illustrate a useful set of choices, or should they be moved up or down?
(c) The 2050 Pathways Calculator currently describes alternative directions of travel rather than different levels for some sectors where changes reflect a choice rather than a scale. Is this a suitable approach and clear to users?
3. Input assumptions and methodologies:
(a) For each sector, are the input assumptions and the methodologies applied to those input assumptions reasonable?
As regards specific sectors:
(b) Are the bioenergy conversion routes used in the model accurate, or are there more efficient routes for converting raw biomass into fuels?
(c) Can the model’s assumptions on wave resource be improved, for example regarding the length of wave farms, their distance from shore, the efficiency of devices, constraints from other ocean users, and other assumptions?
(d) Can the model’s assumptions on tidal stream resource be improved, for example regarding the method for assessing the resource at specific locations, and the scaling up of individual devices into an array?
(e) Is there any evidence that would help build an understanding of the potential impact of long term spatial development on transport demand, and how could this be accounted for in the model?
45
Call for evidence questions
(f) Due to uncertainties in the evidence base on energy demand and associated emissions, the model currently sets out only one level of ambition for the future UK share of international shipping. Is there any evidence you could contribute to help build a greater understanding of the potential shipping trajectories?
(g) Could the relative roles of coal and gas out to 2050 vary from the assumptions shown in this work, and if so, how?
4. Common implications and uncertainties:
(a) The introduction to the report sets out some of the implications and uncertainties common to the illustrative pathways. Does this list cover the key commonalities? If not, please identify other common implications and uncertainties and provide evidence as to why these are key conclusions from the analysis.
5. Impact of pathways:
(a) What criteria should be taken into account in understanding the impact and relative attractiveness of pathways?
6. Cost analysis:
(a)Can you suggest a methodology by which the wider cost implications of choosing one pathway over another could be accurately reflected, and any relevant findings from such an approach?
7. Future improvements to model:
(a) Do you have any further suggestions for refining the 2050 Pathways Calculator?
(b) Could the 2050 Pathways Calculator be improved to reflect the fact that the level of ambition for some sectors will depend on local preferences? Could the Pathways Calculator be improved such that the inherent degree of individual and local choice in a chosen pathway were clear?
How to respond to the call for evidenceThe Department of Energy and Climate Change (DECC) invites comments on the issues set out in this Call for Evidence covering the whole of the UK. Representations from all interested parties are invited and a list of questions is set out above. Respondents are requested to clearly label all responses with the relevant number(s) of the question(s) which they aim to address. The deadline for responses to the Call for Evidence is 5 October 2010. Responses should be submitted online at the following location http://www.decc.gov.uk/en/content/cms/what_we_do/lc_uk/2050/2050.aspx.
Other versions of this document in Braille, other languages or audio-cassette can be made available on request. This includes a Welsh version.
It is intended that responses will be made public. If you do not wish all or part of your response (including your identity) to be made public, please state in your response which parts you wish us to keep confidential. However, information provided in response to this consultation, including personal information, may be subject to publication or disclosure in accordance with the access to information regimes (these are primarily the Freedom of Information Act 2000 (FOIA), the Data Protection Act 1998 (DPA) and the Environmental Information Regulations 2004). If you want information that you provide to be treated as confidential, please be aware that, under the FOIA,

46
Pathways to 2050
there is a statutory Code of Practice with which public authorities must comply and which deals, amongst other things, with obligations of confidence.
In view of this it would be helpful if you could explain to us why you regard the information you have provided as confidential. If we receive a request for disclosure of the information we will take full account of your explanation, but we cannot give an assurance that confidentiality can be maintained in all circumstances. An automatic confidentiality disclaimer generated by your IT system will not, of itself, be regarded as binding on the Department. The Department will process your personal data in accordance with the DPA and in the majority of circumstances this will mean that your personal data will not be disclosed to third parties.
Enquiries to: 2050 Pathways Call for Evidence CoordinatorDepartment of Energy and Climate Change 3 Whitehall Place, London SW1A 2AW Email: [email protected]
Issued on: 27 July 2010 Respond by: 5 October 2010
Next stepsThe Government intends to use the responses to help refine the analysis underpinning the 2050 Pathways Calculator. An updated version of the Calculator will be made available in autumn 2010. This will help inform discussions of the long term decisions faced by the UK. The analysis will also be one source of evidence used by the Government in determining the UK’s fourth carbon budget, for the period 2023–2027.
This work is not about Government or the public choosing a pathway to 2050 today. Such as task would not be feasible – there is too much which is not yet known about the future, for example: which technologies will develop and which will fail, the relative future costs of different options, the international developments which could steer the choice. However, this work does start to give us a good understanding of where the ‘good bet’ actions might lie, insofar as some requirements appear to be common to most of the plausible pathways to 2050. The analysis can be used to understand how decisions today might be closing off options in the future and it will allow us to understand the timing of future decision points. For example, understanding when we will have a good idea about whether a specific technology is viable and what that implies for the pathway options still available. Although this analysis does not set out a single roadmap to 2050, it better enables us to manage some significant uncertainties and helps us as a society to explore the choices likely to be available.

47
Part 2
Detailed sectoral trajectories

48
Section A: Lighting and appliances
ContextOwnership of lighting and appliances such as refrigerators, ovens, televisions and computers has increased significantly over the past 40 years. Most (more than 90%) of the fuel demand for these technologies is met by electricity, while the rest is mainly met by gas.23 Unless the supply of this fuel is decarbonised, or we reduce demand for energy for these products, their use will continue to contribute considerably to the UK’s greenhouse gas emissions.
Innovative technologies could significantly improve the energy efficiency of lighting and appliances and the way we use them. For example, televisions or computer monitors that automatically dim when no-one is using them could help save electricity in our homes, schools, shops and offices; lighting that detects motion in a room and turns on or off in response is already in use in some buildings; and smart meters show how much energy we use in our homes, thereby helping us to identify sources of energy wastage. It may be that at some point in the future, our homes, offices, vehicles and heaters are equipped with technologies that communicate as one integrated system, helping us to use energy more efficiently across the board.
While we can reasonably expect substantial improvements in the energy efficiency of these products, and in technologies that help us manage our use of them, it is impossible to predict accurately all technologies that will be invented by 2050, let alone how quickly they can be rolled out or which of those could significantly reduce energy demand by 2050. For this analysis, we consider technologies that are either already available or could be expected in the next 10 years.
Sector segmentation usedFor this analysis, we consider domestic lighting and appliances and non-domestic lighting and appliances separately. The broad range of products that are used in these sectors are categorised according to Energy Consumption in the UK 2009.24 Domestic products include consumer electronics, home computing, cold appliances, wet appliances and lighting. Non-domestic products include lighting, catering and computing, with other appliances grouped in a separate category.
23 DepartmentofEnergyandClimateChange,Energy Consumption in the UK 2009,Table3.10andTable5.6.
24 http://www.decc.gov.uk/en/content/cms/statistics/publications/ecuk/ecuk.aspx

49
Section A: Lighting and appliances
Drivers and enablersAmong other factors, the number of households and non-domestic buildings in the UK is a key driver of energy consumption for lights and appliances. Across this project we have assumed that:
●● households will grow in line with projections to 2031 (provided by the Department for Communities and Local Government). These projections imply an annual growth rate of about 1%. In this analysis, this growth rate is assumed to continue to 2050.25
●● non-domestic properties currently number 1.8 million. We have assumed that this number grows by 1% per year. 26
Lights and appliances in our homesOwnership of consumer electronics (such as televisions, DVD players and game consoles) and home computing equipment has increased rapidly since the late 1970s. Electricity use for these technologies per household has increased almost six-fold since the 1970s.27
However, we have already made significant progress in using more energy-efficient lighting and appliances in our homes. The use of less energy intensive products helps to reduce energy bills, and as such they are attractive purchases. In addition, product policy helps to reduce energy wastage by promoting the sales of the more energy efficient products. While electricity use for consumer electronics and home computing has increased significantly since the 1970s, this increase has been largely compensated by a decrease in energy use for other home lighting and technologies.
For example, only about half of the bulbs in our homes are now standard inefficient incandescent light bulbs – a significant decrease from 90% in 1970.28 In addition, over the past 20 years, despite the increase in population, the amount of energy used for cooking has dropped very slightly (about 3% in total). This trend could continue as, for example, increasing efficiency of cooking appliances offsets any increasing demand caused by the rise in population.
Overall, although we own about 45% more lights and appliances per household than we did in 1990, the amount of energy used for these products has increased by only 2% per household over the same period.29 Energy consumption for lighting and appliances per household has therefore been largely stable since about 1990.
But we can still make further improvements. Many of these technologies can be replaced relatively easily and new, highly efficient technologies are already available or are in the pipeline.
25 http://www.communities.gov.uk/housing/housingresearch/housingstatistics/26 TheCarbonTrust(2009)Building the Future, Today,page7.27 DepartmentofEnergyandClimateChange,Energy Consumption in the UK 2009, Table3.3and3.10.28 DepartmentofEnergyandClimateChange,Energy Consumption in the UK 2009,Table3.10.29 DepartmentofEnergyandClimateChange,Energy Consumption in the UK 2009,Tables3.6,3.10
and3.11.

50
Pathways to 2050
Figure A1: Energy consumption for lighting and appliances per household since 199030
Lighting and cold appliances – such as refrigerators – represent the greatest opportunities for savings in this sector. There is also some potential to save energy by changing the way we use lights and appliances without significantly affecting our quality of life – for example, by turning off lights when we are not using them. Analysis suggests that we could save up to 15% of our energy consumption by managing the use of lights and appliances more effectively.31
Consumer electronics and home computing present the biggest challenges to reducing energy demand in the domestic sector. Ownership of these products is likely to continue to rise over the next 40 years. For example, televisions account for the largest share of the energy used by consumer electronics, and their number in households is expected to rise by 21% between now and 2020.32 However, technological developments, such as new display technologies, reducing standby consumption and reducing on-power consumption, could curb increases in demand for electricity for these products.33
30 DepartmentofEnergyandClimateChange,Energy Consumption in the UK 2009,Table3.7and3.10.
31 Darby,S(2006)The Effectiveness of Feedback on Energy Consumption, A Review for DEFRA of the Literature on Metering, Billing and Direct Displays,http://www.eci.ox.ac.uk/research/energy/downloads/smart-metering-report.pdf
32 DepartmentforEnvironment,FoodandRuralAffairs(2009)Consultation document on Saving Energy through Better Products and Appliances,page36,http://www.defra.gov.uk/corporate/consult/energy-using-products/index.htm
33 DepartmentforEnvironment,FoodandRuralAffairs(2009)Consultation document on Saving Energy through Better Products and Appliances,pages37–41,85,http://www.defra.gov.uk/corporate/consult/energy-using-products/index.htm
0
500
1000
1500
2000
2500
3000
3500
400019
90
2005
2000
1995
kWh
per
year
/hou
seho
ld
� Cooking
� Consumer electronics and
home computing
� Cold and wet appliances
� Lighting

51
Section A: Lighting and appliances
Lights and appliances for non-domestic useIn addition to what is used in our homes, a wide range of needs are met through lighting and appliances in other sectors such as hotels, restaurants, shops, commercial offices, schools and gyms. The technologies that are used in these non-domestic sectors range from traffic lights, office computers and printers to walk-in cool rooms and low-temperature cabinets in supermarkets.
Figure A2: Consumption of energy for lighting and appliances in non-domestic sectors in 200934
As with domestic lighting and appliances, there is considerable potential for further savings in the non-domestic sector. This sector is clearly diverse with different kinds of buildings using different kinds of technologies. New, more efficient technologies will generate different amounts of energy savings for different sectors. In general, however, given the potential of new technologies in the pipeline, and the frequency with which some appliances are upgraded, savings are likely mostly to affect consumption of energy for lighting, cold appliances and computing.
The non-domestic lighting and appliances sector presents opportunities for relatively quick, significant reductions in demand. In many of these buildings (for example, retail stores, commercial offices, etc), the environment and equipment are controlled and monitored by a central monitoring system or facilities team. It is therefore possible for technologies in many of these locations to be updated on a large scale in an efficient way and without considerable disruption. Improving the technologies used by a number
34 DepartmentofEnergyandClimateChange,Energy Consumption in the UK 2009,Table5.6.
� Other
� Computing
� Lighting
� Catering0
5
10
15
20
25
30
Health
Gover
nmen
t
Other
Comm
unicatio
n and t
ransp
ort
Sport
and l
eisure
Comm
ercia
l offi
ces
Educa
tion
War
ehou
ses
Hotel
and c
ater
ing
Retail
TWh
per
year

52
Pathways to 2050
of people in a large building would in general reduce demand more rapidly than it would in, for example, an average-sized household.
Technologies to reduce energy consumption while servicing demandMany technologies that are currently available or can be expected in the near term could reduce energy consumption for lighting and appliances over the coming years, even with the expected increases in ownership of products, population, households and non-domestic properties.
For example, Compact Fluorescent Lamps (CFLs), the most commonly used ‘energy saving light bulbs’ use about a quarter of the energy of standard tungsten bulbs. Energy saving halogen light bulbs use about 30% less electricity than standard halogen bulbs and Light Emitting Diodes (LEDs) currently use about a tenth of the electricity of conventional bulbs.35
New backlighting technologies and variable brightness control could double the efficiency of liquid crystal display (LCD) televisions. Likewise, the efficiency of plasma technology for plasma televisions is expected to double over the next few years.
Some products, such as computer monitors and televisions, consume electric power while they are left on standby or even when they are switched off and plugged in. For some products this power enables useful features such as responsiveness to remote control, but in other products it does not offer any such advantages. The amount of un-used power that these products draw could be reduced further through technological enhancements.
In addition, vacuum insulated panels on cold appliances such as fridge-freezers could significantly improve the thermal performance of these appliances and thereby reduce the energy they use.36
These technological developments, along with many others, could reduce overall energy consumption for lighting and appliances considerably, while still servicing demand.
Implications for heating and coolingThe use of more efficient products could have an effect on other energy uses. Inefficient lights, computing equipment and poorly insulated ovens, for example, emit heat, which consequently warms our homes and buildings. Sometimes this heat is useful to maintain a comfortable indoor temperature. At other times the additional heat is not necessary and we use other technologies (such as air-conditioners) to bring the temperature back to comfortable levels.
As the efficiency of products improves, the amount of heat generated by lights and appliances will drop. When this heat is not useful to maintain comfortable temperatures, improving the efficiency of lights and appliances will have the additional benefit of there being less need for energy for cooling. In cases where this heat is used,
35 http://www.energysavingtrust.org.uk/Resources/Features/Features-archive/;seealsoEnvironmentalChangeInstitute,UniversityofOxford(2007)Home Truths: A Low Carbon Strategy to Reduce UK Housing Emissions by 80%,page26,Table3.3.
36 EnvironmentalChangeInstitute,UniversityofOxford(2005)40% House,http://www.eci.ox.ac.uk/research/energy/downloads/40house/40house.pdf

53
Section A: Lighting and appliances
the comfortable temperatures in our homes and buildings would need to be maintained in other ways. This is addressed in the analysis on heating and cooling in Section D.
Levels for domestic lighting and appliancesFigure A3: Trajectories for domestic lighting and appliances under four levels
of change
Level 1If we do not make much effort to reduce demand further in this sector, a hypothetical trajectory describing the amount of energy that we might need for lighting and appliances in our homes could involve the following:
●● Total demand for energy for lighting could stabilise at today’s levels as efficiency levels continue to improve as they have in the past.37
●● Demand for energy for cold and wet appliances, such as refrigerators and washing machines, could increase very slightly in line with historic trends.
●● Demand for energy for consumer electronics and home computing could increase by 50% by 2050.38
●● Demand for energy for cooking could remain stable at current levels, in line with historic trends.
There may be no significant change in the way we manage our use of lighting or appliances.
37 Demandforelectricityforlightinghasincreasedbyonly0.1%peryearsince1990.Source:Energy Consumption in the UK 2009,DECC,Table3.10.
38 SeeDefra(2009)Consultation document on Saving Energy through Better Products and Applianceshttp://www.defra.gov.uk/corporate/consult/energy-using-products/index.htm,pages39,85.
� Level 1
� Level 2
� Level 3
� Level 40
20
40
60
80
100
120
2007
2040
2045
2035
2030
2025
2020
2015
2010
2050
TWh
per
year

54
Pathways to 2050
This would result in total energy demand for domestic lighting and appliances increasing by about 20% by 2050.
Level 2We could potentially keep total demand for energy for lighting and appliances stable at today’s levels despite increases in population, GDP and households. For example:
●● Total demand for electricity for lighting could be reduced by 30%. This could be done by, for example, replacing all lights that are not LEDs and that are not fluorescent strip lights with CFLs (with average efficiency of 50 lumens/watt) by 2050.39
●● We could replace all cold and wet appliances with more efficient appliances (for example, washing machines and dishwashers with limited standby consumption), reducing demand per household by about a third by 2030. With the expected increase in households, total demand for cold and wet appliances in 2050 would then be stable on today’s levels.
●● We could limit the increase in consumption for consumer electronics and home computing to 40% (as opposed to 50%) by, for example, reducing the off-mode power consumption of some consumer electronic products, reducing the on-mode power consumption of simple set top boxes, and using auto power down technologies with TVs and set top boxes when in standby for a certain length of time.
●● We could improve the performance of cooking appliances, particularly ovens and hobs, such that each household uses about 40% less energy by 2050 (representing a decrease in demand of 10% in total).40
●● With the help of smart meters and other technologies, we could manage the use of lights and appliances in our homes (for example, turning lights and appliances off when we are not using them) such that we reduce total demand by 5%.
Level 3We could potentially even reduce total demand by 35% on today’s levels. For example:
●● We could replace all lights with today’s best practice LEDs (about 100 lumens/watt) by 2050.41
●● We could replace cold and wet appliances with increasingly efficient appliances, so that overall we use 10% less electricity for these products by 2050.
39 EnvironmentalChangeInstitute,UniversityofOxford(2007)Home Truths: A Low Carbon Strategy to reduce UK Housing Emissions by 80%,page26.Thisachievesa73%reductioninconsumptionvsastandardlightbulbof14lumens/wattanda50%reductioninconsumptionvsahalogenat25lumens/watt.OwnershipistakenfromDECC’sEnergy Consumption in the UK 2009,Table3.10.
40 SeeDepartmentforEnvironment,FoodandRuralAffairs(2009)Consultation document on Saving Energy through Better Products and Appliances,http://www.defra.gov.uk/corporate/consult/energy-using-products/index.htm,page124.
41 MacKay,DavidJC(2009)Sustainable Energy – without the hot air,UITCambridge,page58,andEnvironmentalChangeInstitute,UniversityofOxford(2007)Home Truths: A Low Carbon Strategy to Reduce UK Housing Emissions by 80% by 2050,page26.Thisachievesan86%reductioninconsumptionvsastandardlightbulbof14lumens/watt,a75%reductioninconsumptionvsahalogenat25lumens/watt,a50%reductioninconsumptionvsaCFLat50lumens/wattanda30%reductioninconsumptionvsfluorescentstriplightingat70lumens/watt.OwnershipistakenfromDECC’sEnergy Consumption in the UK 2009,Table3.10.
55
Section A: Lighting and appliances
●● Through ambitious efficiency improvements we could reduce consumption for consumer electronics and home computing by 35%. These improvements could include TVs that are equipped with technology that detects when no-one is viewing the screen and dims it accordingly; further improvements in the minimum efficiency levels of external power supply units; further reductions in standby consumption; and further improvements in the efficiencies of computers.
●● In addition, we could manage our use of these appliances better such that we use 10% less energy.
Level 4At the extreme end, we could possibly halve demand. For example:
●● We could replace all lights with extremely efficient lights (such as LEDs at 150 lumens/watt) by 2050.42
●● We could replace all cold appliances with extremely efficient cold appliances by 2050 (each appliance uses about 80% less energy through technological improvements).43
●● When replacing our consumer electronics and home computing products, we could adopt only the best practice products until 2050.
We could use 15% less energy through more careful use of lighting and appliances.
42 EnvironmentalChangeInstitute,UniversityofOxford(2007)Home Truths: A Low Carbon Strategy to Reduce UK Housing Emissions by 80% by 2050,page26.Theseare“expectedtobecommercialin10years[sic] time,alreadyinthelaboratory”.Theyachievea91%reductioninconsumptionvs.astandardlightbulbof14lumens/watt,a83%reductioninconsumptionvs.ahalogenat25lumens/watt,a67%reductioninconsumptionvs.aCFLat50lumens/wattanda53%reductioninconsumptionvs.fluorescentstriplightingat70lumens/watt.Ownershipistakenfrom Energy Consumption in the UK 2009,Table3.10.
43 EnvironmentalChangeInstitute,UniversityofOxford(2005)40% House,page49.Perhouseholdconsumptionforcoldappliancesdropsby81%,assumingthatnewchestfreezersreduceconsumptionon2007levelsby85%(perappliance),newfridge-freezersreduceconsumptionby81%,newrefrigeratorsreduce2007consumptionby74%andnewuprightfreezersreduce2007consumptionby82%.OwnershipistakenfromDECC’sEnergy Consumption in the UK 2009,Table3.10.
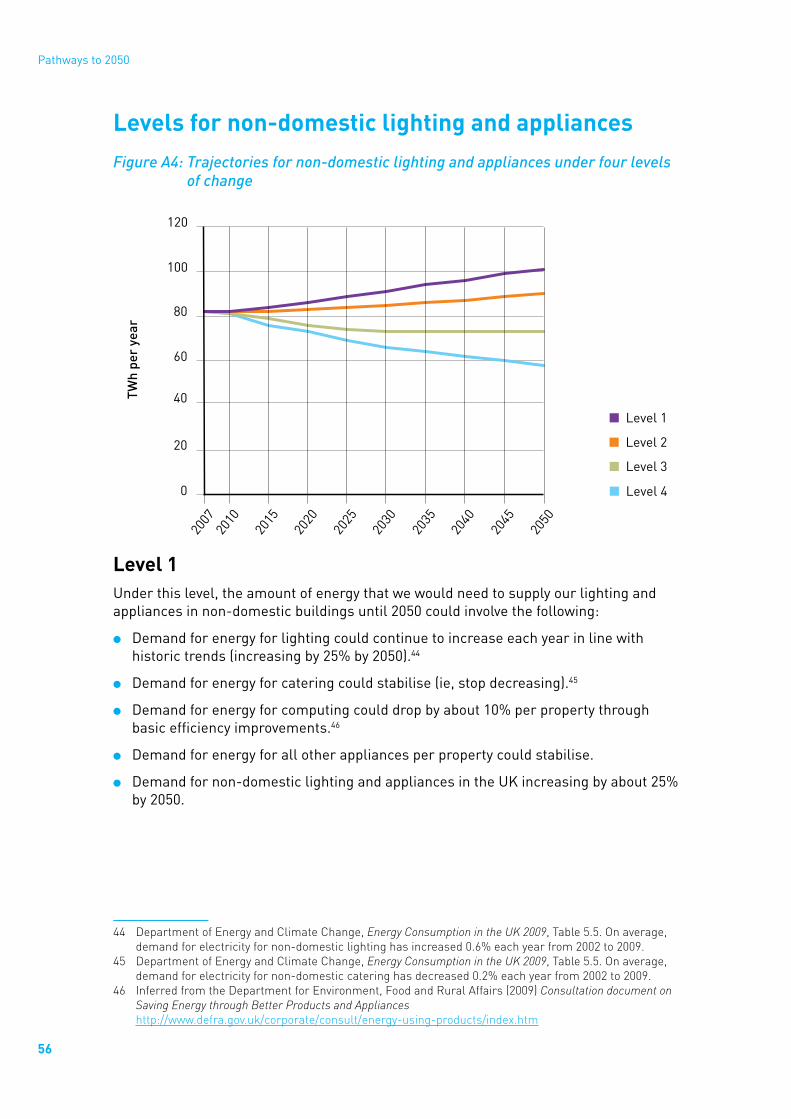
56
Pathways to 2050
Levels for non-domestic lighting and appliancesFigure A4: Trajectories for non-domestic lighting and appliances under four levels
of change
Level 1Under this level, the amount of energy that we would need to supply our lighting and appliances in non-domestic buildings until 2050 could involve the following:
●● Demand for energy for lighting could continue to increase each year in line with historic trends (increasing by 25% by 2050).44
●● Demand for energy for catering could stabilise (ie, stop decreasing).45
●● Demand for energy for computing could drop by about 10% per property through basic efficiency improvements.46
●● Demand for energy for all other appliances per property could stabilise.
●● Demand for non-domestic lighting and appliances in the UK increasing by about 25% by 2050.
44 DepartmentofEnergyandClimateChange,Energy Consumption in the UK 2009,Table5.5.Onaverage,demandforelectricityfornon-domesticlightinghasincreased0.6%eachyearfrom2002to2009.
45 DepartmentofEnergyandClimateChange,Energy Consumption in the UK 2009,Table5.5.Onaverage,demandforelectricityfornon-domesticcateringhasdecreased0.2%eachyearfrom2002to2009.
46 InferredfromtheDepartmentforEnvironment,FoodandRuralAffairs(2009)Consultation document onSaving Energy through Better Products and Applianceshttp://www.defra.gov.uk/corporate/consult/energy-using-products/index.htm
� Level 1
� Level 2
� Level 3
� Level 40
20
40
60
80
100
120
2007
2040
2045
2035
2030
2025
2020
2015
2010
2050
TWh
per
year

57
Section A: Lighting and appliances
Level 2We could possibly go further and limit the increase in total UK demand for non-domestic lighting and appliances to 10%. For example:
●● Demand for energy for catering could continue to decrease in line with historic trends through, for example, the use of more efficient refrigeration appliances (such as vacuum insulated panels).
●● We could limit the increase in UK demand for energy for non-domestic computing to 10% by, for example, shifting from desktop PCs (which consume the most in-use energy in ICT) to laptops and increased sharing of high consumption devices.
●● We could reduce demand for energy for lighting by 30% per property through the increased use of CFLs.
Level 3Total UK demand for non-domestic lighting and appliances could be reduced by about 10% by 2050. For example:
●● Demand for energy for catering could be reduced by a fifth by 2050 through further efficiency improvements.
●● Demand for energy for lighting per property could halve by 2050 through, for example, the increased use of LEDs instead of other, less efficient lighting technologies and through the use of motion detective lighting.
●● Through increasing adoption of more efficient technologies, we could reduce energy demand for computing by a quarter by 2050.
Level 4At the extreme end, we could reduce demand in this sector by 30%. For example:
●● For commercial lighting, LEDs could be introduced over time, reaching 90% of the stock by 2050. New lighting installations on major roads could be more efficient high pressure sodium (HPS) lamps and new installations on residential roads could be more efficient ceramic metal halides. This could help reduce demand for lighting by more than 50% by 2050.
●● Demand for energy for catering could drop by a quarter by 2050 through the use of current or future best practice products. This would involve implementing measures such as defrost on demand technology for low temperature cabinets, reducing refrigerant leakage and improving designs of refrigeration systems (for example, designing a system to exploit low ambient temperatures).
Demand for energy for computing could drop by 70% by 2050 through extremely ambitious efficiency measures.47
47 DepartmentforEnvironment,FoodandRuralAffairs(2009)Consultation document on Saving Energy through Better Products and Appliancespage82http://www.defra.gov.uk/corporate/consult/energy-using-products/index.htm

58
Section B: Transport
ContextDomestic transport currently accounts for 21% of the UK’s greenhouse gas emissions.48
Recent forecasts suggest that, largely as a result of anticipated improvements in new car fuel efficiency and increased uptake of biofuels, domestic transport emissions are likely to be around 15% lower by 2020 compared to 2008.49 It is of course important to think beyond 2020, but looking to the long term introduces significant uncertainties. In the analysis contained in this report, these uncertainties have been illustrated through the range of levels shown.
Transport plays a fundamental role in supporting our economy and quality of life. As individuals, we rely on the opportunities created by transport, such as access to jobs, healthcare, education, goods and services and of course seeing family and friends. And transport plays a vital role in facilitating economic activity through: enabling a highly mobile and flexible labour market; transporting goods and people efficiently and reliably around the country; and enabling the UK to play a leading role in the international market place for high value goods and services.
Most domestic passenger travel is for four key purposes: in 2008 leisure trips accounted for 40% of distance travelled; getting to and from work 19%; shopping 13%; and business travel 9%.50 The majority of personal travel is currently by car, accounting for 84% of distance travelled per year (2007).51
Since the 1970s, on average the number of trips people make and the time per trip have remained broadly constant, but the length of those trips has increased by around 50%,52 indicating that journeys can be made more quickly. Evidence is beginning to suggest that some of the drivers and enablers of this trend towards trip lengthening will gradually weaken over time.
Freight shows an increasing trend, but in contrast to historical trends since the late 1990s, activity (measured in tonne kilometres) appears to have decoupled from economic growth: UK GDP increased by 32% between 1997 and 2007 yet the quantity of freight moved by all modes rose by just 11%.53 There are a range of factors that might have contributed to this recently observed trend and it is not yet clear whether it will continue into the future. This uncertainty has been reflected in the freight transport activity levels below.
Transport’s energy use and carbon emissions are closely linked to the level of travel activity, but are also influenced by other important factors. These include the mode
48 DECC2008finalUKfigureshttp://www.decc.gov.uk/en/content/cms/statistics/climate_change/gg_emissions/uk_emissions/2008_final/2008_final.aspx
49 DECCEnergyandEmissionsprojections,http://www.decc.gov.uk/en/content/cms/statistics/projections/projections.aspx
50 DepartmentforTransport(2009)NationalTravelSurveydata2008,TableC4.1b,page28.51 DepartmentforTransport(2009)TransportStatisticsGreatBritain2009,Table1.1.52 From4.7milesto7.0miles,DepartmentforTransport(2009)NationalTransportSurvey2008,Table2.1.53 ONSTransportStatisticsGreatBritain(2009),Table4.1.

59
Section B: Transport
of travel chosen to make a given journey (car, van, bus, rail, walking, cycling, freight mode, motorcycling and air travel); the efficiency of the vehicle (how much fuel is required per mile); how the vehicle is powered (petrol, diesel, electricity etc); the carbon content of the fuel used and behavioural factors such as occupancy and how efficiently the vehicle is driven (such as the extent of ‘eco-driving’).
Transport technology has made significant advances over the last two to three decades. New car fuel efficiency has improved 22% since 1995,54 with average new car CO2 emissions in 2009 at 150g CO2 per vehicle kilometre in the UK. Approximately 40% of the rail network (in track miles) is currently electrified. Electric traction accounts for a little under half of passenger miles operated and around 5% of freight train mileage.55 With the current carbon content of UK electricity, an electric train emits around 24%56 less carbon per passenger kilometre than a diesel train; intercity trains emit on average 49g CO2 per passenger kilometre.57 This compares with an average for cars of 128g CO2 per passenger kilometre, assuming an average number of passengers.58
Improvements in efficiency are not, however, evident across all modes. Evidence suggests that between 1997 and 2008, bus fuel efficiency actually fell by around 21%.59 This worsening is mainly due to buses becoming heavier and meeting higher consumer expectations such as air conditioning, as well as tighter standards on air quality and accessibility, resulting in a fuel penalty.
Drivers and enablersDriversThere are several key drivers of travel activity in the UK. Population, GDP and the costs of travel are the main drivers, but other factors including the location of economic activity; population growth; land use and population density; household wealth; the weather; topography of the landscape; and local amenities have a substantial influence on both how much people travel, and how they travel. Looking at averages can mask the complexities.
For consistency across this analysis, the transport levels described below have been developed assuming that population grows in line with the ONS projections at on average 0.5% per year60 and that GDP grows on average at around 2.5% per annum. A relaxation of these assumptions would allow a wider range of potential transport scenarios for 2050 to be developed. The levels of transport activity were developed following a review of a wide range of published studies and discussions with stakeholders. As far as possible, they reflect stakeholder views of how the nature and level of travel activity could vary under alternative assumptions to 2050. They have been developed with a view to maintaining consistency with the assumptions on population and GDP in this analysis, as key drivers of travel.
54 SMMTdataUKNewCarRegistrationsbyCO2Performance2004AnnualReportandDVLAvehiclelicensingstatistics2009,Table18.
55 NetworkRUS,Electrification,NetworkRail,October2009.http://www.networkrail.co.uk56 DfTanalysis.57 DfTRailNetworkModellingFramework(NMF)dataandNationalRailTrendYearbook2008/09,Officeof
RailRegulation.58 DefraCompanyReportingGuidelines,2009.Averagecarloadsarecurrently1.58peoplepercar
(averageoflast5years,NTS2008,Table7.3).59 DfTBusServiceOperatorGrantclaimsandTransportStatisticsGreatBritain(2008).60 NotethattheDfT’stransportmodelsrelyonTEMPROpopulationforecastswhicharederivedfromONS
projectionsofpopulationresidentinhouseholds.

60
Pathways to 2050
It is recognised that alternative views of travel activity have been published, some involving much more significant reductions in overall travel than has been illustrated in this report. But such studies did not typically assess the extent to which the measures required to bring about very significant behaviour change may impact on GDP.61 Within this report, the analysis has sought to illustrate behaviour changes that might be expected to be consistent with the underlying assumed GDP growth, including radical mode shift away from the car towards public transport; significantly higher cycling levels; significantly lower car use relative to the baseline; higher public transport and car occupancy; and lower overall travel due to, for example, some trips perhaps being replaced by IT links or people working at home.
As transport is an enabler of other activities in the economy there are strong interactions with other sectors, which, due to the nature of scenario analysis, have not always been possible to capture. For example, a significant amount of freight is used to move energy production materials (coal, oil etc) and construction materials.62 Trajectories in other sectors of this report may imply changes in freight requirements that are not reflected here.
In some cases, a behavioural or technology change may have unintended consequences that have not been possible to take fully into account in this scenario analysis; there is therefore no feedback of efficiency improvements into the activity scenarios shown (ie, no ‘rebound effects’). Such effects are important to recognise, and if policies aimed at delivering emissions reductions are to succeed they may require complementary action or policies to ‘lock-in’ the full benefits.
EnablersEmissions reductions are enabled through a combination of demand- and supply-side transport actions, and depend on actions in other sectors.
To enable the technology changes described in the levels below to take place, the right conditions would need to be in place. This would include, for example, technological breakthroughs carried through to deployment; conducive relative costs between different fuels and vehicles; supportive policy frameworks with public acceptance; and consumer confidence in using new technologies. There are potentially very significant energy savings to be made through vehicle efficiency improvements between now and 2050.
The pathways show the potential importance of electrifying much of road and rail surface passenger transport. Delivery of this depends on a wide range of factors combining. For example:
●● the key perceived barriers to electric vehicle uptake would need to be overcome or significantly reduced, including a rapid decrease in the costs of batteries;
●● technology improvements which allow increased driving range between charging;
●● the roll out of plug-in-hybrids as an intermediate or synergistic step to greater electric vehicle and fuel cell vehicle uptake;
61 Forexample,theUKEnergyResearchCentre(UKERC)report(2009)‘Makingthetransitiontoasecureandlowcarbonenergysystem’,looksata‘LifestyleChange’scenario.
62 Forexample,in2008,46%ofrailfreighttonnekilometresweretotransportcoaloroil/petroleum.

61
Section B: Transport
●● the most extreme levels of electrification discussed below would require significant investments in electric vehicle charging and other complementary infrastructure, and the possible effects on the grid would need to be accounted for (see Section P on electricity balancing); and
●● the provision of adequate electric rail infrastructure.
Further challenges would need to be overcome for other low carbon fuels and power sources, such as fuel cells, to play a role. Electric vehicles are closer to market today than fuel cell vehicles, and to enable fuel cell vehicles to play a part, improvements in the fuel cells would need to be made for them to become cost-effective options for the mass market. They would also require the relevant fuel distribution infrastructure.
The analysis set out in Section F suggests it is unlikely that sufficient sustainable biofuel would be available, either from domestic sources or from the UK’s share of global imports, to power the entire transport sector in the UK and bioenergy is likely to be required in others sectors as well as transport. However, it could be particularly important in road haulage vehicles, particularly for long haul operations, and in aviation fuel. This would require changes in vehicle design and the associated fuel infrastructure. The international nature of aviation means the changes in aviation fuel would require international efforts as well as UK action.
Similarly, to enable changes to transport activity as set out in the levels below, a range of policy interventions, investments and behavioural changes would be required to reverse trends in travel over the past five decades and deliver radical modal shifts with increasing levels of public transport use, walking and cycling. Incentives could be provided through the policy framework, information provision, and regulation, for example. Additional investment in transport infrastructure, facilities, and complementary investment and policy would be part of this process.
Strong growth in rail use would require new infrastructure and capacity provision, particularly on the already-busy parts of the network. The higher levels of demand on public transport illustrated in the more ambitious levels below would be likely to require more dense networks and additional capacity as well as complementary infrastructure such as interchanges and waiting facilities. Land use change could help ensure that public transport, buses in particular, is a commercially viable and attractive option. Bus networks tend to be more effective in dense urban areas.
To enable significant growth in cycling, lifestyle change would be required, accompanied by additional infrastructure and cycling facilities and a supportive policy framework, along with complementary measures, for example a re-allocation of road space.
Changes to driving behaviour could also result in emissions reductions. Car sharing has the effect of allowing the same passenger distance to be travelled, but in fewer vehicle miles.63 Such car sharing may be difficult to achieve in some locations given the variations in travel patterns, and it would require a supportive policy framework.
63 Averageoccupancyacrossthetrajectoriesrangesfromthecurrentoccupancyrate,ofanaverageof1.58,toaround1.66(ie,5%higher)thanthenationalaveragelevel.

62
Pathways to 2050
Eco-driving64 reduces the energy required to travel a given distance by appropriate vehicle maintenance and more efficient driving practices.65
A reduction in the overall distance travelled could possibly be enabled by spatial planning and land use changes, primarily through shortening trips. This could include, for example, the replacement of some trips by IT and ‘virtual’ activity.
Sector segmentation used For the purposes of this analysis, transport activity has been split into UK passenger transport (including domestic aviation); UK freight transport (including domestic shipping); and international aviation and shipping. Only domestic transport is currently included in the UK’s carbon budgets, because there is no internationally agreed framework for allocating international aviation and shipping emissions to nations. However, the Government is required to take into account emissions from international aviation and international shipping when setting the UK’s carbon budgets.66
To convey the development of transport over time under different assumptions, the illustrative levels below look out to 2050. These levels do not in any way represent the Government’s view of how transport will or should develop over time; they are merely illustrative ‘what-if’ futures for the purposes of this analysis only, and have been discussed with a wide range of stakeholders.
To represent the development of transport under the different levels, three different factors can be varied:
●● travel activity, both in terms of overall amount of travel and travel mode (mileage travelled by walking, cycling, car, van, bus, rail, motorcycling, heavy goods vehicles, shipping and air travel);
●● changes in technology and power source (the use of internal combustion engines, hybrid vehicles and electric vehicles; the use of diesel or electric rail); and
●● changes in efficiency (more efficient vehicles and improving freight vehicle utilisation and changes in occupancy rates).
Levels for domestic passenger transport
Level 1
Passenger transport activity
Under level 1, travel activity in terms of overall mobility and mode shares is consistent with past trends broadly continuing but with growth in demand slowing over time, as certain drivers of demand growth such as car ownership are expected to have a gradually weakening relationship with income. It is assumed that the implied average number of people per vehicle (occupancy rate) is the same as today, i.e. an average of 9 passengers per bus, 1.6 people per car and 1 person per van. Emissions from
64 Eco-drivingisdrivingbehaviourwhichavoidsunnecessaryfuelconsumptionbyforexampleavoidingunnecessarybrakingandaccelerating,keepingtyresinflatedtooptimallevelsandminimisingtheuseofauxiliaryequipment.
65 Eco-drivinghasbeenreflectedbyillustratinga3%reductioninfuelperkm,aswasusedinDepartmentforTransport(2009)Low Carbon Transport: A Greener Future,basedonevidenceoflongtermpotential.
66 Section10oftheClimateChangeAct.

63
Section B: Transport
domestic aviation are those associated with flights that take off and land within the UK. Domestic aviation activity (and efficiency) reflects the ‘likely scenario’ developed by the Committee on Climate Change in its advice to Government published in December 2009.67 Figure B1 below shows a comparison of transport modes under the different levels.
Technology
For cars and vans, this would mean internal combustion engines (ICEs) continue to dominate these fleets. By 2050, plug-in hybrid electric vehicles (PHEVs) would cover 20% of the distance travelled by cars and vans, and fully electric vehicles (EVs) would cover only a small proportion of travel (2.5% of distance). See Figure B2 for a comparison of technology roll-out under the different levels. For buses, the majority of the fleet remains ICE vehicles and the share of ICE-hybrids is assumed to continue to grow at current trends, based on current purchase rates of ICE-hybrid buses, ending up with a roughly 60–40 split in the distance covered by these two types of vehicles respectively, with a handful of trial electric buses (see Figure B3 for a comparison). For rail, the share between diesel and electric trains would stay much as it is today (around 36% of rail seat miles are diesel, and 64% electric) – see Figure B4 for a comparison.
Efficiency
Efficiency improvements include some engine advances and other vehicle improvements such as light-weighting and downsizing. The trajectories show only one level of change in car and van efficiency rates, in order to keep the model manageable. The efficiency improvements included are ambitious and can be seen in Figure B5. ICE cars and vans show an average 54% improvement by 2050; EVs improve by 37%, and PHEVs by 50% by 2050. All types of buses (ICE, ICE-hybrid and full electric), have a 31% efficiency improvement by 2050 – see Figure B6. On rail, efficiency remains constant at current levels across all years.
Level 2
Passenger transport activity
This assumes some ‘smarter choices’ policies to encourage a shift from car use to other modes. No ‘rebound effect’ is considered, as a policy mechanism is assumed to lock-in the benefits. The implied average number of people per vehicle is as Level 1 for cars and vans, but a third higher, at 12, for buses. Transport activity growth is assumed to slow after 2035. (See figure B1 for a comparison of transport modes under the different levels). Domestic aviation activity (and efficiency) reflects the CCC’s ‘likely scenario’. To make the Calculator model manageable, only one trajectory is shown for domestic aviation emissions, and this is the same across all levels.
67 CommitteeonClimateChange(December2009)Meeting the UK Aviation target – options for reducing emissions to 2050,http://www.theccc.org.uk/reports/aviation-report.ItshouldbenotedthattheCommittee’sanalysisassumedacontinuationofthepoliciessetoutintheAirTransportWhitePaper(2003),http://webarchive.nationalarchives.gov.uk/+/http://www.dft.gov.uk/about/strategy/whitepapers/air/executivesummary.

64
Pathways to 2050
Technology
By 2050 the majority of car and van distance travelled is in PHEVs (54%) with ICE vehicles still significant (35%), and a modest proportion of pure EVs (10%) and fuel cell vehicles, FCV, (1%). In terms of fleet share, EVs make up a larger proportion of the fleet than under level 1 (more like 20% in this level), but it is assumed that they will mostly be used for shorter journeys. This assumes a supportive policy framework along with relevant supporting infrastructure and a reduction in battery cost. An increased share of ICE-hybrid buses is expected, envisaging 20% being ICE-hybrid by 2020 and reaching 34% in 2022. It is then assumed the share of ICE-hybrid buses continues at this rate of growth, which is rapid due to the assumption that economies of scale in hybrid bus production are achieved. By 2050, all ICE buses are replaced by ICE-hybrids, with only a handful of electric buses. There is a small increase in electrification of rail, which includes the following electrification schemes: Great Western Main Line, Liverpool to Manchester and North West triangle.
Efficiency
For cars and vans and buses this is the same as level 1. Compared to level 1, by 2050 rail efficiency is 6% and 7% higher respectively for electric and diesel traction. This efficiency improvement is achieved through a range of measures such as driver training and energy metering.
Level 3
Passenger transport activity
Under level 3, significant mode shifts would be seen by 2050, with public transport, walking and cycling accounting for almost a quarter of all distance covered by 2050, and distance travelled as a car driver or passenger accounting for around three quarters. A shift would be seen towards greater car sharing, and the average number of bus passengers per vehicle rises to 18. Car travel would be around 9% lower by 2050 than in level 2, with bus use 50% higher than in level 2, tripling between 2010 and 2050; rail demand would be 40% higher than in level 2, growing by almost 80% between 2010 and 2050. Cycling would be 8% higher in level 3 than level 2, growing 140% between 2010 and 2050. Domestic aviation activity (and efficiency) reflects the CCC’s ‘likely scenario’.
Technology
There is a substantial switch away from ICEs so that by 2050 these account for only 20% of distance by cars and vans (and are mostly hybridised), and a big uptake in distance by PHEVs (32%) and EVs (28%). There is also a significant amount of distance accounted for by FCVs (20%). It should be noted that most plug-in hybrid distance is driven electrically by 2050, and again the electric fleet share is higher than the distance share. This assumes significant reductions in battery costs, hydrogen technology costs and the availability of infrastructure to support EVs and FCVs. The last ICE buses are replaced by 2030, and by 2050 78% of bus distance is ICE-hybrid, and 22% is electric. For rail, the share between diesel and electric switches more substantially to electricity, reflecting a mid-point between level 2 and full electrification by 2050.

65
Section B: Transport
Efficiency
Cars, vans and buses are as level 1. On rail, by 2050 the diesel train fleet is 40% more efficient on average than current designs and the electric fleet is 30% more efficient. These efficiencies are assumed to be delivered through both technical improvements to rolling stock – lighter designs, more efficient engines and motors – as well as through more efficient management of train movements (for example by reducing unnecessary stopping and starting).
Level 4
Passenger transport activity
Reflecting the availability of alternatives to travel, this level assumes a 5% reduction in total distance travelled in 2050, compared to levels 2 and 3. This reflects a combination of factors, including some very long trips being replaced by teleconferencing, a shortening of trips if people shop or undertake recreational activities more locally, or perhaps take opportunities to work at home.
Level 4 shows a radical mode shift such that public transport and cycling account for 36% of all distance travelled by 2050, and travel by car as a driver or passenger accounts for 62%. Within this, the implied average car occupancy is assumed to increase to reflect a greater level of car sharing. By 2050, cycling use relative to car use would be approaching that currently seen in the Netherlands, and UK mode shares would reflect far lower reliance on the car. Despite population growth over the period, car use (passenger miles) would be 5% lower in 2050 than in 2010, with public transport and cycling absorbing the activity that might otherwise have been made using the car.
Overall activity would be 25% higher in 2050 than in 2010 compared to being 33% higher in level 1, and 31% higher in levels 2 and 3. For level 4 this would mean bus demand (passenger miles) would be over 3.3 times higher, with implied average passengers per bus the same as Level 3 (18 passengers); rail use (passenger miles) would more than double and cycling activity would increase 10-fold above 2010 levels. For this to be the case, public transport would need to be sufficiently attractive to passengers (in terms of price, service provision, comfort etc) to make it a viable way to travel; and the conditions for cycling on highways and cycle lanes conducive to very high willingness to cycle. In addition, a mechanism would need to be in place to ‘lock in’ the reductions in travel activity to prevent the reductions in trips due to IT and such simply being replaced by other trips. Domestic aviation activity (and efficiency) reflects the CCC’s ‘likely scenario’.
Technology
This represents the maximum of what is considered to be technologically feasible by 2050. The majority of the surface passenger transport system is electrified apart from buses, which have a roughly equal share of EVs and conventional hybridisation, potentially using alternative fuels where possible. The last ICE buses are replaced by 2030. Passenger cars are entirely EVs or powered by a breakthrough in fuel cell technology. This assumes significant reductions in battery costs, hydrogen technology costs and the availability of infrastructure to support such vehicles. ICE light duty vehicles are completely removed from the market. By 2050, around 80% of passenger car distance is powered by electricity, with the remainder accounted for by fuel cells

66
Pathways to 2050
(which could be acting as the range extender in PHEVs rather than an ICE range extender as in other plug-ins). The whole rail network is powered by electric traction.
Efficiency
Cars, vans and buses improve efficiency as in level 1. Rail efficiency improves as in level 3.
Notes
Walking is included within the analysis as a constant share of distance travelled (ie, it increases over time in line with overall activity). The time taken to walk places implies constraints on the extent to which this can increase significantly.
The levels cover the main technologies for use in light duty vehicles within the 2050 timeframe that have been highlighted by stakeholders or published in studies. It is possible that new technologies not yet in development may come through in this time, and that other fuels, such as synthetic fuels, may also play a part. For the purposes of this study, the levels reflect largely proven technologies as well as anticipated breakthroughs, for example in battery performance.
Figure B1: Percentage of passenger distance by mode in 2050 under four levels of change
� Pedal cycles
� Walking0%
20%
40%
60%
80%
100%
Leve
l 1
Leve
l 2
Leve
l 3
Leve
l 4
� Buses
� Cars, vans and motorcycles
� Domestic air travel
� Railways

67
Section B: Transport
Figure B2: Proportion of car and van distance travelled by different power sources in 2050, under four levels of change68
Figure B3: Proportion of bus distance travelled by different power sources in 2050, under four levels of change
68 Inlevel4thelightervehiclesusedinandaroundcitiesareassumedtobefullyelectricandrepresent50%ofthevehiclefleet,fuelcellpluginhybridsorfuelcellvehiclesrepresenttheremaining50%ofthefleet,andtendtobelargervehiclesdrivenmoreoftenandforlongerdistances.Onaveragethesevehiclesaredrivenusinghydrogen40%ofthetimeandelectricity50%ofthetime,althoughthiswillvaryconsiderablyforindividualvehiclesdependinguponvehicletypeanddrivingbehaviour.
� Plug-in hybrid ICE mode
� Fuel cell vehicle electric mode
� Plug-in electric mode
� Electric vehicle0%
20%
40%
60%
80%
100%Le
vel 1
Leve
l 2
Leve
l 3
Leve
l 4
� Internal combustion engine
� Fuel cell vehicle hydrogen
� Internal combustion engine
� Hybrid-electric vehicle
� Electric vehicle0%
20%
40%
60%
80%
100%
Leve
l 1
Leve
l 2
Leve
l 3
Leve
l 4

68
Pathways to 2050
Figure B4: Proportion of rail distance travelled by different power sources in 2050, under four levels of change
Figure B5: Efficiency improvements in the car and van fleet69
69 Thisassumesthatincreasinglyefficientvehiclesenterthefleetovertime,andthefleetturnoverrateis10%.
� Electric
� Diesel0%
20%
40%
60%
80%
100%
Leve
l 1
Leve
l 2
Leve
l 3
Leve
l 4
� Internal combustion engine
� Plug-in hybrid
� Electric vehicle
� Fuel cell vehicle0.0
0.2
0.4
0.6
0.8
2040
2045
2035
2030
2025
2020
2015
2010
2050
TWh
/ bn
vehi
cle-
km

69
Section B: Transport
Figure B6: Efficiency improvements in the bus fleet
Levels for freight transportFor domestic freight transport activity the levels have been based on DfT baseline projections, rolled out to future years, combined with similar work undertaken by Heriot-Watt University.70 The domestic shipping levels are based on the Department for Transport’s ‘Carbon Pathways Analysis’.71 This includes forecasts of CO2 emissions to 2022 based on bunker-fuel sales for UK domestic shipping. These forecasts have been extrapolated to 2050 using forecasts of tonnes- lifted at UK ports produced by MDS Transmodal for the Department for Transport.72
Level 1
Freight activity
The level of freight activity and mode share is based on DfT baseline projections rolled out to 2050. Under this level, road transport would make up 73% of distance, rail 9%, water 13% and pipeline 4%. For a comparison of freight mode shares under the different levels, see Figure B7.
70 McKinnon,ACandPiecyk,MI(2009)‘Logistics2050:RoadFreightTransportinaLowCarbonWorld’inSweeney,E(ed)Supply Chain Management and Logistics in a Volatile Global Environment,BlackhallPublishing,Dublin.GovernmentprojectionsbasedonNationalTransportModel,NationalRailFreightRouteUtilisationStrategy,andMDSTUKPortDemandForecast.
71 DfT(2008)Carbon Pathways Analysis – Informing Development of a Carbon Reduction Strategy for the Transport Sector,availableathttp://www.dft.gov.uk/pgr/sustainable/analysis.pdf
72 MDSTransmodal(2007)Update of UK Port Demand Forecasts to 2030 and Economic Value of Transhipment study,availableathttp://www.dft.gov.uk/pgr/shippingports/ports/portspolicyreview/207015_Final_Report_2.pdf
� Internal combustion engine bus
� Hybrid bus
� Electric bus0.0
0.5
1.0
1.5
2.0
2.5
3.0
3.5
4.0
2040
2045
2035
2030
2025
2020
2015
2010
2050
TWh
/ bn
vehi
cle
km

70
Pathways to 2050
Technology
Under level 1, almost all rail freight is powered by diesel trains as under today’s levels. All road haulage operations use internal combustion engines, and the uptake of readily available lower carbon technologies such as aerodynamic fairings or low rolling resistance tyres is minimal.
Efficiency
Road haulage and rail freight remain at current efficiency levels. Rigid and articulated heavy goods vehicles (HGVs) using ICEs have only a 2% efficiency improvement by 2050. Empty running of 27% is assumed by 2050.73 For a comparison of freight efficiency improvements under the different levels, see Figure B8.
Domestic shipping
CO2 emissions after 2022 were assumed to change in line with MDS Transmodal forecasts of (non-unitised74) domestic tonnes-lifted at UK ports to 2030. Between 2022 and 2030 this comprises a decline in tonnes-lifted of around 0.26% per annum. After 2030 it was assumed that the annual change in tonnes lifted forecast between 2025 and 2030 continues to apply. No fuel efficiency improvements were assumed.
Level 2
Freight activity
The level of freight activity is based on DfT baseline projections rolled out to 2050, but with the mode share based on current efforts to increase rail and water freight, rolled out to 2050. Mode share shifts lead to: road 66%, rail 11%, water 19% and pipeline 4%.
Technology
The share of electric rail freight is the same as under level 1. HGVs continue to be powered by ICEs.
Efficiency
Road haulage empty running falls to 22% by 2050. There is a significant increase in use of readily available lower carbon HGV technologies, for example aerodynamic fairings, low rolling resistance tyres and automated manual transmissions. Overall, ICE rigid HGVs have an efficiency improvement of 33% by 2050, and articulated HGVs (which use internal combustion engines) have an efficiency improvement of 36% by 2050. Rail freight efficiency improves for both diesel and electric traction by 22% by 2030 compared to current levels and it remains constant thereafter.
Domestic shipping
Domestic shipping increases its mode share, based on current efforts to increase rail and water freight, rolled out to 2050. Mode share shifts lead to 19% of freight activity being carried out by water.
73 ‘Emptyrunning’isdefinedasthedistancecoveredbyfreightvehicleswhilenotcarryinganyfreight,egafterhavingdeliveredalltheircargo
74 Non-unitisedtrafficcomprisesliquidbulk,drybulkandothergeneralcargo.

71
Section B: Transport
Level 3
Freight activity
The level of freight activity continues increasing at the same rate as for the previous decade, which is less than the historical relationship between GDP and freight activity. Note that as freight activity derives from demand for goods and raw materials (for example, for construction), it is unlikely this relationship would hold if activity in other sectors of the economy entailed the building of significant new infrastructure as demand for freight may increase. Mode share is: road 58%, rail 19%, water 19% and pipeline 4%.
Technology
The share of electric rail freight increases to 53% by 2050. On road freight there is a significant increase in the use of less readily available lower carbon HGV technologies such as ICE hybrids, which offer substantial carbon savings.
Efficiency
Road haulage empty running falls to 17% by 2050. ICE rigid HGVs have an efficiency improvement of 53% by 2050, and articulated HGVs have an efficiency improvement of 53%. Rail freight efficiency improves by 40% by 2050 compared to current levels for diesel traction, and by 30% for electric traction.
Domestic shipping
The mode share for water remains at 19%.
Level 4
Freight activity
The level of freight activity continues increasing at the same rate as for the previous decade, which is less than the historical relationship between GDP and freight activity (and as stated under level 3, this would be unlikely to hold if activity in other sectors of the economy entailed the building of significant new infrastructure. Road mode share falls to 50% by 2050, with rail 23%, water 23% and pipeline 4%.
Technology
Rail freight is all electric. Road freight has greater reliance on hybridisation and alternative fuels, where technically possible. Some smaller trucks are electric.
Efficiency
Road haulage empty running falls to 17% by 2050 as in level 3. ICE rigid HGVs have a 53% improvement in efficiency, while electric rigid HGVs have a 39% efficiency improvement; articulated HGVs have a 63% improvement in efficiency. Rail freight efficiency assumptions are the same as under level 3.

72
Pathways to 2050
Domestic shipping
Modal share of water increases to 23% of freight activity. It was assumed that for all scenarios, fuel use will increase in direct relation to the change in the volume of goods moved by water.
Figure B7: Freight transport mode share in 2050, under four levels of change
Figure B8a: Energy use per kilometre by rigid HGVs under four levels of change
� Pipeline
� Waterway
� Rail
� Road0%
20%
40%
60%
80%
100%
%to
nne-
kilo
met
res
Leve
l 1
Leve
l 2
Leve
l 3
Leve
l 4
� Level 1 ICE
� Level 2 ICE
� Level 3 ICE
� Level 4 EV0.0
0.5
1.0
1.5
2.0
2.5
3.0
3.5
2040
2030
2020
2010
2050
TWh
/bill
ion
km

73
Section B: Transport
Figure B8b: Energy use per kilometre by articulated HGVs under four levels of change
Levels for international aviationThe levels of change for domestic and international aviation reflect the three scenarios developed by the Committee on Climate Change (CCC) in its advice to Government in December 2009.75 A comparison of the energy used under each of the different levels can be seen in Figure B9.
For the purpose of this 2050 analysis, international aviation emissions have been assigned to the UK on the basis of all flights departing from the UK, consistent with the methodology used by the CCC.
Level 1 - CCC Likely scenarioThis level reflects lower demand for aviation compared to the CCC’s reference case and carbon intensity improvements that are likely to be achieved given current policies, investment levels and the pace of technological advance.
●● Activity: This level does not specify a particular change in the level of aviation activity. The CCC estimates that its ‘Likely’ scenario would result in passenger demand of about 115% above 2005 levels.
●● Efficiency: This level assumes annual improvements in fleet fuel efficiency of 0.8% together with 10% biofuels penetration by 2050. It should be noted that the analysis underpinning this 2050 report does not assign biofuels to a specific demand sector such as aviation, and so the level here is not fully comparable with the CCC scenario.
75 CommitteeonClimateChange(2009)Meeting the UK Aviation target – options for reducing emissions to 2050,http://www.theccc.org.uk/reports/aviation-report
� Level 1 ICE
� Level 2 ICE
� Level 3 ICE
� Level 4 ICE0.0
0.5
1.0
1.5
2.0
2.5
3.0
3.5
2040
2030
2020
2010
2050
TWh
/bill
ion
km

74
Pathways to 2050
Level 2 – CCC Optimistic scenarioThis level requires a significant shift from current policy (for example, to high speed rail), an increase in the level of investment in new aircraft technologies and/or in the pace of fleet renewal, as well as improvements in the efficiency of air transport movements and operations so as to make a 1.0% per annum improvement in carbon efficiency attainable. It would also require the progress of biofuel technologies which would lead to a 20% penetration of biofuels, if compatible with our aims of sustainability.
●● Activity: This level does not specify a particular change in the level of aviation activity. The CCC estimates that this scenario would result in passenger demand of about 105% above 2005 levels.
●● Efficiency: This level assumes annual improvements in fleet fuel efficiency of 1.0% per annum and 20% biofuels penetration by 2050. The above caveat on biofuels also applies.
Level 3 – CCC Speculative scenario This level would require both technological breakthroughs and a significant increase in the pace of aircraft fuel efficiency improvements. In addition, it would require the development of sustainable biofuels which are currently speculative (such as biofuels from algae), or an evolution of global population, food demand and agricultural productivity which would make possible the sustainable and large scale use of current agricultural land and water to grow biofuel feedstocks.
●● Activity: This level does not specify a particular change in the level of aviation activity. The CCC estimates that this scenario would result in passenger demand of about 90% above 2005 levels.
●● Efficiency: This level assumes annual improvements in fleet fuel efficiency of 1.5% and biofuels penetration of 30% in 2050. The above caveat on biofuels also applies.
Figure B9: Total energy for international aviation under three levels of change
� Level 1
� Level 2
� Level 30
50
100
150
200
250
2007
2040
2045
2035
2030
2025
2020
2015
2010
2050
TWh

75
Section B: Transport
Levels for international shippingAs with international aviation, there is no globally agreed methodology for allocating emissions from international shipping to countries. For the purposes of this report, one illustrative scenario was used. The approach taken was to use the International Maritime Organization’s (2009)76 activity-based projections of CO2 emissions from international shipping globally to 2050, and to attribute a share of these emissions to the UK on the basis of estimates by the International Energy Agency.77 These estimates suggest that the UK’s share of the total CO2 emissions from international marine bunkers was around 1.2% in 2007. This percentage was assumed to be constant going forward.
Projections for the IMO’s ‘A1B’ (base) scenario were used. These assume that global fleet activity grows by around 3.3% per year, with aggregate improvements in efficiency (including speed reductions, operational measures and regulatory developments) of 39% in 2050 (compared to 2007). Some liquefied natural gas fuel penetration is also assumed. Figure B10 shows the associated estimate of total energy for UK international shipping out to 2050.
Figure B10: Total energy for UK international shipping under the level 1 trajectory
Unlike other sectors, only one level of change is shown. This is because there is little data available to inform understanding of potential changes to UK international shipping emissions, meaning it was not possible to present a range of changes.
76 IMO(2009)Second IMO GHG Study 2009,http://www.imo.org/Environment/mainframe.asp?topic_id=1823
77 IEA(2009)CO2 Emissions from Fuel Combustion, Highlights,http://www.iea.org/co2highlights/CO2highlights.pdf
0
50
100
150
2007
2040
2045
2035
2030
2025
2020
2015
2010
2050
TWh

76
Section C: Industry
ContextThe UK is the world’s sixth largest manufacturer,78 with a diverse industrial base spanning the manufacture of basic metals, food and drink, and cutting-edge composites. The UK manufacturing industry makes an important contribution to the economy and accounted for 12.4% of UK Gross Value Added in 2007.79
The transition to a low carbon economy represents a significant opportunity for the UK economy as a whole, and industry in particular. The Low Carbon and Environmental Goods and Services (LCEGS) sector already makes a significant contribution to the UK economy, worth over £112 billion in sales in 2008/9 (globally the 6th largest LCEGS market). The sector employs an estimated 910,000 people within the specialised sectors and wider supply chain and is forecast to achieve between 4 and 5% sales growth per annum to 2015/16. The global LCEGS market was £3.2 trillion in 2008/9 and is projected to grow on average at 4% annually over the next 5 years presenting global export opportunities as well as UK firms serving domestic needs.80
The transition also presents fundamental challenges. Industry is a major energy user and greenhouse gas emitter. In 2007, it produced 93 MtCO2e of greenhouse gas emissions (not including indirect emissions from use of electricity produced off-site) and demanded 408 TWh of energy, 15% and 21% percent of the UK respective totals.81 This is despite falls in output from some of the most energy intensive sectors, and significant efficiency improvements.
The trajectories described in this section explore possible levels of energy demand and emissions from industry. The majority of industrial emissions are produced by fuel combustion and can be reduced by improvements in energy efficiency. Energy consumption per unit of industrial output has fallen by 66% since 1970.82 Total industrial energy consumption has fallen by 51%, while industrial output has risen by 45%. These declines in energy intensity have been driven by the international competition these industries face and the need to achieve incremental efficiency improvements, as well as improvements with machinery and changes within the industrial base. More recently, the EU Emissions Trading System (ETS) and UK Climate Change Agreements (CCAs) have prompted a renewed focus on emissions. However, improvements in energy efficiency in most sectors are flattening out. Figure C1 illustrates the change in energy intensity of UK steel production between 1972 and 2008.
78 UnitedNationsNationalAccountsMainAggregatesDatabase,2008data(latestavailable).79 ONSBlueBook,2009edition.80 Innovas(2009,2010)LCEGS industry analysisavailableat:http://www.berr.gov.uk/policies/business-
sectors/low-carbon-business-opportunities/market-intelligence81 DUKES2009andUKGHGInventory(2009),usingthedefinitionofindustryadoptedbythe2050
calculatorwhichiswiderthantheDUKESdefinition(eg,itincludesblastfurnaceemissions).82 DigestofUnitedKingdomEnergyStatistics(DUKES),2009Edition,Table4.4.

77
Section C: Industry
Figure C1: Energy intensity in UK steel production (1972-2008)83
0
5
10
15
20
25
30
35
40
GJ p
er th
ousa
nd to
nnes
2005
2000
1995
1990
1985
1980
1975
The EU ETS covers CO2 emissions from power stations and energy-intensive industries. The system puts a price on carbon through the use of a cap and trade mechanism, which incentivises industry to invest in low carbon technologies and energy efficiency. The first phase (2005-07) was very much a learning-by-doing phase for participants.
For Phase II (2008-12) the cap was tightened, which is resulting in a marginally higher and more stable carbon price, making it more cost effective for industry to reduce emissions. However, the carbon price remains at fairly low levels and there are concerns that this is not providing a sufficient incentive for low carbon investment.
From Phase III (2013 onwards), the cap will be significantly tightened and the ETS will deliver emission reductions of 500 MtCO2e per year across the EU by 2020. If the EU adopts a higher mitigation target (ie a 30% reduction on 1990 emissions), then the ETS cap will be tightened further and the amount of emission reductions will increase.
In addition, the Climate Change Levy (CCL) has taxed the use of energy in industry, commerce and the public sector since 2001. Energy-intensive industries can obtain a discount from the Climate Change Levy, provided they meet challenging targets for improving their energy efficiency or reducing their carbon emissions. Climate Change Agreements (CCAs) set the terms under which eligible companies may claim the levy reduction.
From April 2010, the CRC (Carbon Reduction Commitment) Energy Efficiency scheme has operated a mandatory emissions reductions programme for organisations that are not covered by the ETS and Climate Change Agreements. This is designed to promote energy efficiency in large organisations.
83 EEF(2009)UKSteelKeyStatistics.

78
Pathways to 2050
Drivers and enablers Industrial emissions – both direct process and combustion emissions and indirect emissions from the use of non-decarbonised electricity – will be determined by the combination of future output levels and the emissions produced per unit of output. Emissions from freight are included within this report’s transport section and indirect emissions from the use of off-site electricity are accounted for within the electricity generation sections of this report. This section only considers direct industry emissions resulting from fuel combusted on site for energy as well as process emissions resulting from industrial chemical reactions. Emissions reductions for industry from using biofuels (rather than fossil fuels) for on-site energy are not factored into the industry section of the 2050 Pathways Calculator. Biofuel emissions savings are not assigned to specific sectors in the Calculator; instead, they are assigned to the UK emissions account as a whole.
The embedded emissions within imported raw materials and manufactured goods are not included within the 2050 Pathways Calculator, in accordance with the United Nations Framework Convention on Climate Change (UNFCCC) and UK carbon budget accounting systems. However, if the UK begins to shift towards importing more carbon intensive industrial outputs, the embedded emissions will clearly increase.
Key drivers of industrial emissions considered below are: energy intensity; process emissions intensity; carbon capture and storage (CCS); fuel switching; and production output levels.
Energy intensity The International Energy Agency reports that globally ‘the energy intensity of most industrial processes is at least 50% higher than the theoretical minimum determined by the laws of thermodynamics’.84 However, within the UK, the currently available cost-effective savings have already largely been made and a 50% reduction was considered unrealistic by many stakeholders consulted for this report.85 Scope for efficiency improvement remains, but the more radical shifts will require investments that go beyond the level of what is currently cost effective. In some sectors, substantial further reductions are likely to involve high levels of investment in new technologies, materials and processes.
If the costs of making such investments made these sectors uncompetitive relative to their international counterparts, purchasers of such products may be forced to turn to imports. This could, for example, mean that the high value pharmaceutical and specialist chemicals sectors begin importing base chemicals currently produced in the UK which have significant levels of embedded emissions from both their manufacture and transport.
Combined Heat and Power (CHP) will continue to contribute to declines in energy wastage. However, once the electricity grid has been decarbonised, onsite power production will no longer reduce emissions.86 Therefore, it has not been examined in detail in this report.
84 IEA(2006)Energy Technology Perspectives 2006 – Scenarios and Strategies to 2050.85 TwoworkshopsandanumberofbilateraldiscussionswereheldwithmembersoftheBusinessand
ClimateChangeGroup(BCEG)andtheManufacturers’ClimateChange(MCC)groupsinJanuary2010.86 ParsonsBrinckerhoff(2009)Mapping our low carbon path to 2050.

79
Section C: Industry
Process emissions intensitySome industrial sectors produce direct emissions from chemical reactions involved in their activities. These are more difficult to reduce. Substantial reductions in process emissions will require new techniques, such as electrolysis within the steel industry; use of inert anodes within aluminium production; and new catalysts within chemicals manufacturing. Most of these techniques are still in development and are therefore unlikely to be deployed until the latter part of the period to 2050. Technological advances will also be needed to find substitutes for naphtha and other oil and gas fractions used as raw materials within the chemicals industry.
Carbon Capture and StorageIndustrial CCS offers the potential to capture combustion and process emissions. CCS will be essential to minimise emissions in industries such as cement and steel, where viable alternatives to high-emitting processes are still a long way off. With a few exceptions87 however, it is not yet proven commercially and needs to overcome a number of technical and logistical challenges.
Technology
The technology for industrial CCS is less developed than in the power sector and its deployment is likely to lag behind by at least five years. CCS demonstration sites are being developed for the steel industry as part of the ULCOS project88 and research is taking place in other sectors, such as cement.89 Both pre- and post-combustion CCS are being investigated. However, significant technological issues remain unresolved.
Transport and storage
It is assumed that industrial CCS would use storage sites and transport networks developed primarily for the power sector. Some major industrial plants, such as the Scunthorpe steel plant, could be well placed to tap into proposed CCS pipelines and infrastructure hubs. The location of major cement plants could make it more difficult for onsite CCS to link into developing infrastructure. However, options such as rail transport may be available.
Investment
Both retrofitting existing plants and building new plants with CCS capacity will require a high level of investment and may be impractical for plants emitting less than about 0.1MtCO2e/year. CCS will also increase energy demand and operating costs.90 However, assuming that the research and development currently underway on lowering CCS cost
87 CO2isalreadycapturedwithinfertiliserproduction,butitiseitherventedorsoldforuseincarbonateddrinks.
88 TheUltraLowCarbonSteelmaking(ULCOS)projectisaconsortiumof48Europeancompanies.Itdevelopsandpilotsnewtechnologieswithinthesteelindustry,tocutemissionsby50%.www.ulcos.org
89 MineralProductsAssociation(2009)Carbon Capture and Storage (CCS) in the cement industry.ThisdocumentstatesthattheEuropeanCementResearchAssociation(ECRA)iscurrentlyundertakingresearchintoCCSwithinthecementindustry.
90 Pocklington,DandLeese,R(2009)Towards Zero Emission Production – Potential of Carbon Capture in Energy Intensive Industrystatesthatoxy-combustionCCScouldraisecementproductioncostsby24%.

80
Pathways to 2050
is successful, application of this technology to industrial CO2 sources could begin before 2030 and be widespread after that date.91
Fuel switching 28% of energy demanded by industry is in the form of electricity.92 In the longer term, an increase in the proportion of electricity demanded offers a key opportunity to reduce emissions. It is assumed that, in theory, most industrial energy could be supplied in the form of electricity, with the exception of some high-temperature heating processes.
There are also opportunities to switch to biomass fuels across all forms of heating, including a higher proportion of biomass in the highest temperature processes. Proportions of waste and biomass fuels are growing in many industries. For example, the paper industry makes use of waste paper pulp as an energy source and waste tyres are burned within some cement plants. However, the use of biomass feedstocks will be limited by their availability. Renewable fuels and waste can also increase overall energy demand due to the need to process these fuels prior to burning.
Sector segmentation usedUK industry is diverse. Different industrial sectors will follow their own pathways to 2050. The energy demand and emissions from different parts of industry will depend on how fast the sector grows or shrinks; the extent to which it has already improved its energy efficiency; the development and deployment of new technologies; market and policy drivers; plus a range of other factors. This analysis does not look at every sector and technology individually, but looks in more depth at the chemicals, metals and minerals sectors, due to their high energy and emissions intensity.
●● Chemicals and petrochemicals (excluding refineries): this sector includes the manufacture of pharmaceuticals, paints, plastics and fertilisers. It consumes high levels of energy and also uses oil and gas fractions, such as naphtha, as raw materials.
●● Metals: this sector includes iron, steel and aluminium production. In the 2050 Calculator, it also includes coke manufacture and blast furnaces, which are associated with the metals industry. The metals sector produces emissions from fuel combustion and energy use, and industrial processes. Proportionally, the aluminium industry is more energy intensive and the steel industry produces relatively higher levels of process emissions.
●● Minerals: emissions within this sector are dominated by the cement industry, which produces a high proportion of process emissions within the industry sector industry. Limestone and dolomite production also generate process emissions. The sector takes up only a small share of overall output, however.
●● Wider industry includes the production of food and drink, paper, textiles, construction, vehicles and a wide range of other products. This sector produces very
91 IPCCFourthAssessmentReport:ClimateChange2007.92 DigestofUnitedKingdomEnergyStatistics(DUKES).2007Edition,Table1.14,Summaryofindustrial
useoffuelforheat.

81
Section C: Industry
few process emissions directly93 but has the highest overall emissions from energy use.
Figures C2-C4 below show how proportions of total output, energy demand and process emissions vary across the sectors.
Figure C2: Percentage share of UK manufacturing output (2007)94
Gj p
er to
nne
13
11
4
73
� Chemicals
� Metals
� Minerals
� Wider industry
Figure C3: Energy consumption by UK industrial sector (2007)95
Ener
gy c
onsu
mpt
ion
(TW
h)
� Chemicals
� Metals
� Minerals
� Wider industry
0
100
200
300
400
500
93 However,itproducesanumberofproductscontainingF-gases,whichconstituteasignificantsourceofemissionsandwhicharecoveredinthewiderindustrysectionofthe2050PathwaysCalculator.
94 ONSBlueBook,2009Edition.95 DUKES2009Edition.

82
Pathways to 2050
Figure C4: UK Industrial process emissions by sector (2007)96
GH
G e
mis
sion
s (M
tC02
e)
0
5
10
15
20
� Chemicals
� Metals
� Minerals
The trajectoriesThe trajectories described below explore possible levels of energy demand and emissions from industry. The fastest reductions in industrial emissions would be achieved through a dramatic decline in output, but this would lead to greater imports of goods and a rise in embedded emissions.97 It would also have impacts on the wider economy (with macro-economical, fiscal and employment impacts). Therefore, trajectories A-C focus on potential reductions from a growing industry.
Trajectories A-D are not ordered to reflect a ramping up of effort. Instead, for each of the four industrial sectors, the report sets out high, medium and low output levels (described in detail in ‘Output assumptions’ below), and also three levels of energy and emissions intensity (described in detail in the ’Sector specific assumptions’ below). These are then combined in different ways to generate the four energy and emissions trajectories for industry up to 2050, as summarised in Table C1. Figures C5 and C6 illustrate the energy demand and emissions associated with the four trajectories respectively.
Table C1: Energy and emissions trajectories for industry
Lowoutput Mediumoutput Highoutput
Highest energy intensity and process emissions
X Trajectory A X
Medium energy intensity and process emissions
X Trajectory B X
Lowest energy intensity and process emissions
Trajectory D X Trajectory C
96 UKGHGInventory,NationalInventoryReport2009.F-gasesnotincludedasprocessemissionsinthischart.
97 Itwouldalsoleadtoariseinnetglobalemissions,assumingthatthegoodswereproducedincountrieswithmorecarbonintensiveprocessesandrequiretransporting.
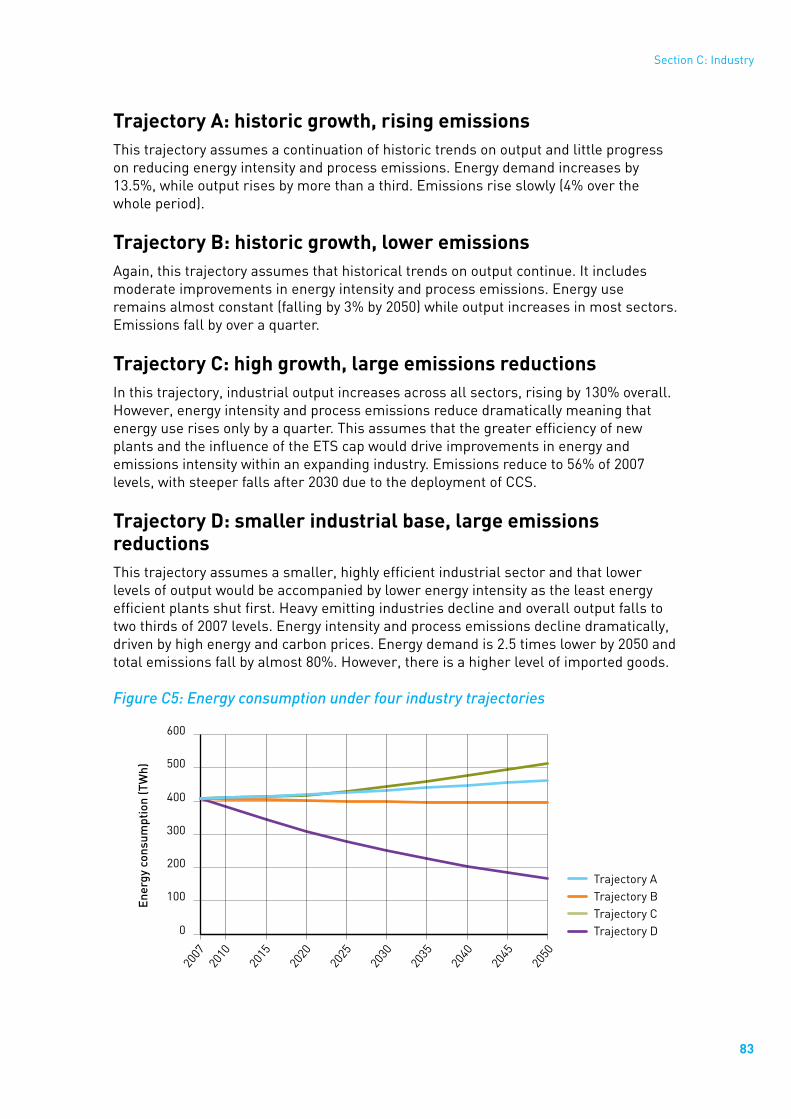
83
Section C: Industry
Trajectory A: historic growth, rising emissions This trajectory assumes a continuation of historic trends on output and little progress on reducing energy intensity and process emissions. Energy demand increases by 13.5%, while output rises by more than a third. Emissions rise slowly (4% over the whole period).
Trajectory B: historic growth, lower emissions Again, this trajectory assumes that historical trends on output continue. It includes moderate improvements in energy intensity and process emissions. Energy use remains almost constant (falling by 3% by 2050) while output increases in most sectors. Emissions fall by over a quarter.
Trajectory C: high growth, large emissions reductions In this trajectory, industrial output increases across all sectors, rising by 130% overall. However, energy intensity and process emissions reduce dramatically meaning that energy use rises only by a quarter. This assumes that the greater efficiency of new plants and the influence of the ETS cap would drive improvements in energy and emissions intensity within an expanding industry. Emissions reduce to 56% of 2007 levels, with steeper falls after 2030 due to the deployment of CCS.
Trajectory D: smaller industrial base, large emissions reductionsThis trajectory assumes a smaller, highly efficient industrial sector and that lower levels of output would be accompanied by lower energy intensity as the least energy efficient plants shut first. Heavy emitting industries decline and overall output falls to two thirds of 2007 levels. Energy intensity and process emissions decline dramatically, driven by high energy and carbon prices. Energy demand is 2.5 times lower by 2050 and total emissions fall by almost 80%. However, there is a higher level of imported goods.
Figure C5: Energy consumption under four industry trajectories
Ener
gy c
onsu
mpt
ion
(TW
h)
0
100
200
300
400
500
600
Trajectory ATrajectory BTrajectory CTrajectory D
2007
2050
2045
2040
2035
2030
2025
2020
2015
2010

84
Pathways to 2050
Figure C6: Emissions produced under four industry trajectories98
Emis
sion
s pr
oduc
ed (M
tCO
2e)
0
20
40
60
80
100
Trajectory ATrajectory BTrajectory CTrajectory D
2007
2050
2045
2040
2035
2030
2025
2020
2015
2010
A thriving, expanding industrial sector can reduce emissions levels. All trajectories, except trajectory A, see a decline in overall emissions.99 In trajectory C, output more than doubles, but emissions decline by 44%. Declines are driven by fuel switching, new industrial processes, energy efficiency improvements, CCS and also by higher growth rates within less intensive sectors. An 80% reduction in industrial emissions is achieved in trajectory D, but this relies on an overall fall in output. In this report we do not assume that all sectors need to reduce their emissions in equal measure, and we recognise that the industrial sector faces particular challenges.
In trajectories A – C, energy demand stays flat or rises moderately. It is only in trajectory D – where ambitious reductions in energy and emissions intensity are combined with a substantial decline in output across sectors – that we see a steep decline in demand for energy. It is difficult to achieve an overall decline in energy use while output grows in line with historical trends or above. Increases in output can be offset to a high degree by reductions in energy intensity. However, by the end of the period, the ‘high output’ trajectory C demands the most energy, despite ambitious reductions in energy intensity.
Output assumptionsAll industry trajectory assumptions below have been formed following discussions with representatives from industry,100 academics and analysis of relevant literature. A wide range of scenarios were proposed, reflecting different technological assumptions, approaches, scope and timescales.
The high, medium and low output assumptions that underpin the trajectories are set out below and aim to reflect the range of opinion and evidence encountered. These have been developed from analysis of historical trends from 1970-2008101 using a measure of
98 Includesf-gases.99 Notethatemissionssavingsfromburningbiomassarenotincluded.Thesewouldincreaseemissions
reductions.Indirectemissionsfromelectricityusearenotincluded.Thesewillbeminimalfrom2030-2050,assumingthatthegridhasbeenlargelydecarbonised.
100TwoworkshopsandanumberofbilateraldiscussionswereheldwithmembersoftheBusinessandClimateChangeGroup(BCEG)andtheManufacturers’ClimateChange(MCC)groupsinJanuary,2010.
101OfficeofNationalStatistics(ONS),GVAoutputindex.

85
Section C: Industry
Gross Value Added. This work assumes a constant rate of economic growth across different pathways. However, it is recognised that in reality, a shrinking industrial sector will have impacts on employment rates and the wider economy. A wide range of possible growth rates are considered – both positive and negative.
High outputThe highest output figures assume that UK industry is renewed by the transition to a low carbon economy. UK industry starts to ramp back up to achieve high levels of output growth seen in previous decades. Once the green industrial base is firmly established, wider industry’s industrial output growth squarely matches GDP growth to 2050. A high proportion of consumed goods are produced domestically. UK industry is able to compete on a level playing field, due to a global carbon price and/or ambitious international agreements on emissions. A healthy economy fuels a strong construction industry and a thriving wider manufacturing industry. UK chemicals firms take a leading role in developing low carbon chemical substitutes. Rising demand for new transport and energy infrastructure fuels demand for basic metal production.
Figure C7: High industrial output
0
50
100
150
200
250
2007
2025
2020
2015
Out
put (
Inde
x of
Gro
ss V
alue
Add
ed) Y
ear
2007
=100
� Wider industry
� Minerals
� Metals
2010
2030
2050
2045
2040
2035
� Chemicals
Wider industry
Assuming a return to the high growth rates of the 1980s and 1990s. 1.7% per year until 2025, then 2.5% to match the assumed GDP growth rate.
Minerals Assuming quick recovery from the 2008 recession and then continuation of 1980-2007 growth rates (1.4% per year).
Metals Assuming 1993-2008 growth rate (0.4% per year).
Chemicals Assuming growth at half of the 1970-2008 average annual growth rate (1.3% per year).103
102Therecenthistoricalgrowthrateis2.7%peryear,butthiswasfelttobetoohighbyrepresentativesoftheBusinessandClimateChangeEnergyGroup(BCEG),ataworkshopon07January2010.

86
Pathways to 2050
Medium outputThe medium output figures assume a continuation of historical trends, except within the chemicals industry.
Figure C8: Medium industrial output
0
25
50
75
100
125
150
2007
2025
2020
2015
Out
put (
Inde
x of
Gro
ss V
alue
Add
ed) Y
ear
2007
=100
2010
2030
2050
2045
2040
2035
� Wider industry
� Minerals
� Metals
� Chemicals
Wider industry
Assuming 1970-2008 trajectory continues (1.0% growth per year).
Minerals Assuming 1970 – 2008 trajectory continues (0.25% growth per year).
Metals Assuming 1970-2008 trajectory continues (-0.8% per year).
Chemicals Assuming that the chemicals industry hovers around the 2007 baseline.104
Low outputThis output assumption sets out the most pessimistic output trajectories for the different sectors. This might mean that the balance of the UK economy has continued to shift away from manufacturing, implying rising imports or reduced consumption levels. Declines in certain industries may also reflect substitution of products, such as a shift from steel to timber within the construction industry. The low output figures are likely to imply that increasing levels of emissions have been exported, as industries move outside the UK. This process would lead to a reduction in UK output, while leaving global emissions unchanged.
103Therecenthistoricalgrowthrateis2.7%peryear,butthiswasfelttobetoohighbyrepresentativesoftheBusinessandClimateChangeEnergyGroup(BCEG),ataworkshopon07January2010.

87
Section C: Industry
The minerals sector is largely driven by domestic demand for cement, and therefore by the health of the UK construction industry and wider economy. It is assumed that this demand would stay flat, even in a low output scenario (although demand may switch towards imports of both finished cement and clinker, which will make up any shortfall in UK production). Within the chemicals sector, the falls in output assume that declining petrochemical manufacture is not replaced with low carbon alternatives.
A smooth downward trend in output is assumed, though in practice this trend would be a series of marked steps relating to individual shifts in the industrial base.
Figure C9: Low industrial output
0
25
50
75
100
125
2007
2025
2020
2015
Out
put (
Inde
x of
Gro
ss V
alue
Add
ed) Y
ear
2007
=100
2010
2030
2050
2045
2040
2035
� Wider industry
� Minerals
� Metals
� Chemicals
Wider industry
Assuming a continuation of the decline seen over the past decade, following the 2000-2008 trajectory (-0.9% per year).
Minerals Assuming production hovers around the mean output for 1970-2008.
Metals Assuming significant decline in industry, replicating the decline from 1970-1995 (-1.2% per year).
Chemicals Assuming that a decline in petrochemical and ammonia industries takes output down to 1990 levels (at -1.1% per year).

88
Pathways to 2050
Assumptions on energy intensity and process emissionsThe assumptions below have been formed following discussions with representatives from industry,104 academics and through analysis of relevant literature. A wide range of scenarios were proposed, reflecting different technological assumptions, approaches, scope and timescales. The low, medium and high paths aim to reflect the range of opinion and evidence encountered.
Cross-cutting assumptions CCS
The challenges posed by CCS differ according to the process, size and location of different industries. However, due to the current uncertainties surrounding the technology, deployment rates and impact, a common range of capture rates has been assumed across the process emitting sectors.105 Within these it is assumed that CCS is fitted on larger steel, ammonia and cement plants. However, there are also opportunities for CCS on Combined Heat and Power plants and, for example, within the food and drink or pulp and paper industries. It is assumed that CCS will capture equal proportions of fuel combustion and process emissions. Table C2 gives the assumption made about CCS for each of the three levels of energy intensity and process emissions.
Table C2: CCS assumptions for the three levels of energy intensity and process emissions
Highest energy intensity and process emissions
No widespread use of CCS (perhaps due to lack of investment, technological failings or cost ineffectiveness).
Medium energy intensity and process emissions
CCS begins to roll out after 2025. By 2050, 24% of emissions in the metals, chemicals and minerals sectors are captured (assuming CCS captures 80% of emissions where installed).
Lowest energy intensity and process emissions
CCS is rolled out quickly after 2025. By 2050, 48% of emissions in the metals, chemicals and minerals sectors are captured (assuming CCS captures 80% of emissions where installed).
Fuel switching assumptions
In 2007, 19% of gas and 64% of solid fuel consumed by industry were used in high temperature processes.106 The lowest energy intensity and process emissions trajectories (C and D) assume that by 2050 almost all other energy is consumed in the form of electricity, and bioenergy from waste and non-waste sources makes up a high proportion of remaining gas and solid fuels. This shift implies that most space heating is provided by electric heat pumps and that most low temperature heating, separating and drying processes currently fuelled by oil and gas, shift to electricity.
104TwoworkshopsandanumberofbilateraldiscussionswereheldwithmembersoftheBusinessandClimateChangeGroup(BCEG)andtheManufacturers’ClimateChange(MCC)groupsinJanuary,2010.
105TheCommitteeonClimateChange(CCC)willproduceworklookingatindustrialCCSlaterintheyear.106DUKES2007figures,Table1.14.

89
Section C: Industry
The highest emissions intensity trajectory (A) assumes that there is no change in the balance of fuels to 2050, while the middle trajectory (B) assumes a moderate shift to electricity from 2030. Figure C10 shows the breakdown of energy demand in 2050 under each of the four trajectories.
Figure C10: Fuel breakdown by trajectory
Ener
gy d
eman
d by
fuel
type
(TW
h pe
r ye
ar)
� Heat
� Gas
� Liquid
� Solid
0
150
300
450
600
� Electricity (net)Baseline
(2007)D
(2050)C
(2050)B
(2050)A
(2050)
Trajectory and year

90
Pathways to 2050
Sector-specific assumptionsChemicals sector
The majority of the direct emissions from the chemical industry are in the form of CO2, the largest sources being the production of ethylene and other petrochemicals, ammonia for nitrogen-based fertilizers, and chlorine. These emissions are produced both by energy use and from venting and incineration of by-products.107
Opportunities to reduce emissions include broader energy saving measures set out for all sectors – on motors, more efficient use of compressed air and space heating. Sector-specific measures include improved membranes for separations, more selective catalysts for synthesis, increased recycling of plastics and polymers and greater process integration to reduce heating requirements.
The level of process emissions will depend on the extent to which substitute processes and new catalysts are developed and deployed – and the extent to which the sector develops biological substitutes for plastics, ammonia based fertilizers and others.
A move away from producing base and commodity chemicals, towards pharmaceuticals, consumer and speciality chemicals will have the effect of lowering average emissions intensity within the sector.108 The highest improvements assume that this shift has continued. However, these structural changes imply that emissions would have been exported abroad.
The IEA suggests that, globally, countries should aim to implement Best Potential Technology by 2025. They suggest that this would cut energy demand by around 10%.109 The highest emissions pathway assumes that these efficiency gains will be more difficult in the UK, as plants are already relatively efficient. Therefore, 10% reductions are achieved only by 2050.
Lowest intensity
Process emissions: 35% lower by 2050
Energy intensity: 50% lower by 2050
Medium intensity
Process emissions: 15% lower by 2050
Energy intensity: 25% lower by 2050
Highest intensity
Process emissions: No change
Energy intensity: 10% lower by 2050
107IPCCFourthAssessmentReport:ClimateChange2007.108Eurelectric(2007)The Role of Electricity: A New Path to Secure, Competitive Energy in a Carbon-
Constrained World.109InternationalEnergyAgency(2009)Technologies for a New Industrial Revolution (2009).

91
Section C: Industry
Metals sector
The metals sector includes the steel and aluminium industries.
Aluminium: Primary aluminium metal is produced by the electrolytic reduction of alumina in a highly energy-intensive process. In addition to the CO2 emissions associated with electricity generation, the process itself is greenhouse gas-intensive.110
Energy emissions can be reduced by improving operating procedures and more use of computer-control. Larger reductions in emissions can be achieved by upgrading older cell technology. Inert anodes promise to cut electricity demand by 20% and fuel use by 7% and to eliminate anode-related CO2 emissions.111 In the lowest intensity scenario, it is assumed that inert anodes have been successfully commercially deployed in at least one plant.
Steel: There remains some scope to further increase thermal efficiency through enhancing continuous production processes, increased recovery of waste energy and process gases, and efficient design of electric arc furnaces, for example scrap preheating, high-capacity furnaces, and fuel and oxygen injection.112 Better smelting technologies could bring longer term improvements. Recycling rates are already high, but could be raised marginally, particularly if demand begins to flatten out.113
Reducing process emissions will be challenging. Electrolysis has the potential to decarbonise steel production, but the technology is still in development.114 The lowest intensity scenario assumes that steel electrolysis is in use within some plants by 2050. The metals sector assumes modest reductions in energy intensity in recognition that further improvements will be challenging in this sector.
Lowest intensity
Process emissions: 25% lower by 2050
Energy intensity: 30% lower by 2050
Medium intensity
Process emissions: 10% lower by 2050
Energy intensity: 20% lower by 2050
Highest intensity
Process emissions: No change
Energy intensity: 10% lower by 2050
110IPCCFourthAssessmentReport:ClimateChange2007.111Eurelectric(2007)The Role of Electricity: A New Path to Secure, Competitive Energy in a Carbon-
Constrained World.112SetoutinIPCCFourthAssessmentReport:ClimateChange2007.TheIEA(2009)Technologies for a New
Industrial Revolutionsuggeststhatthesemeasurescouldimproveenergyintensityby20%atagloballevel.
113Allwood,JandCullen,J(2009)Steel, Aluminium and Carbon: Alternative strategies for meeting the 2050 Carbon Emission Targets,Cambridge.
114Ibid.

92
Pathways to 2050
Minerals sector
The minerals sector is dominated by the cement industry, although limestone and dolomite also produce significant process emissions. 60% of emissions within the cement industry are process emissions; the other direct emissions are from fuel combustion.
Process emissions within the cement industry come from limestone calcination within the kiln. They can be reduced by substituting carbon intensive clinker, an intermediate in cement manufacture, with other, lower carbon, materials with cementitious properties, such as slag or ash.
The industry has already reduced the clinker content of cement, but further clinker substitution or changes in the process will require lengthy testing to ensure that the cement meets building standards. Substantial process emission reductions are not therefore assumed to be possible until around 2030. The lowest intensity scenario assumes that a substantial proportion of cement production shifts to a low clinker, low energy cement, such as geopolymer or novacem by 2050 (although this may require raw materials to be imported).115
Some energy efficiency gains can be achieved by improvements within kilns and roller processes.116 The IEA suggests that a 27% reduction in demand for thermal fuels within the global industry is possible.117 The IEA’s ‘Cement Technology Roadmap’ expects an 18% decrease in thermal energy used per tonne of cement by 2050.118 Assumptions used here reflect a range of improvements in energy intensity (from 10–30% by 2050), reflecting different views.
Lowest intensity
Process emissions: 30% lower by 2050
Energy intensity: 30% lower by 2050
Medium intensity
Process emissions: 5% lower by 2050
Energy intensity: 20% lower by 2050
Highest intensity
Process emissions: No change
Energy intensity: 10% lower by 2050.119
115MineralProductsAssociationinput,followingworkshopwiththeManufacturers’ClimateChangeGroup,21January2010.
116Eurelectric(2007)The Role of Electricity: A New Path to Secure, Competitive Energy in a Carbon-Constrained Worldassumea3%decreaseinenergyintensityevery5yearsto2030.
117InternationalEnergyAgency(2009)Technologies for a New Industrial Revolution.118IEAandWorldBusinessCouncilforSustainableDevelopment(2009)Cement Technology Roadmap,
Carbon emissions reductions up to 2050.119Industryrepresentativesstressedthatscopeforfurtherenergyefficiencyimprovementsisverylimited.

93
Section C: Industry
Wider industry
Within wider industry, energy intensity will be reduced through diverse and incremental improvements that vary across different sectors and plants. This work does not attempt to quantify the opportunities presented by individual energy efficiency measures.
In the short term, improvements within the wider manufacturing industry can continue to be achieved through ensuring that operating and maintenance procedures maximise energy efficiency and by choosing optimal technology for motors, boilers, compressed air vents and other machinery.
Although improvements have been made, space heating, lighting and machinery can still be used more efficiently in many industries. Better use can be made of waste heat, through recycling, locating different parts of the process more closely together, or CHP. In the longer term, technological advances and new plants will be needed to continue improvements.
The IEA states that an annual reduction in energy demand of 1.3% per year is needed within industry in OECD countries, in order to meet global emissions targets.122 This is taken as the lowest intensity assumption.
Process emissions from wider manufacturing are minimal and are not considered here.
Lowest intensity
Energy intensity: 43% lower by 2050120
Medium intensity
Energy intensity: 24% lower by 2050121
Highest intensity
Energy intensity: 10% lower by 2030
120InternationalEnergyAgency(2009)Technologies for a New Industrial Revolution.121Ibid.122ParsonsBrinckerhoff(2009)Powering the Future: Mapping our low carbon path to 2050assumesa0.62%
paimprovementinoverallenergyefficiencyacrossindustry(basedonthemetalssectorhistoricalrateofimprovement).

94
Section D: Space heating, hot water and cooling
Context In 2007, fuel use for space heating and hot water in the domestic and service sectors amounted to 535 TWh. The domestic sector accounted for 78% of this and the service sector 22%.123 Energy used for cooling in the UK in 2007 is estimated at 9 TWh, almost all of which was used in the service sector.
Figure D1: Energy consumption in 2007
Ener
gy c
onsu
mpt
ion
in 2
007/
TWh
� Space heating
� Hot water
� Cooling
0
100
200
300
400
5000
75
150
225
300
Domestic sector Service sector
Figure D2: Direct emissions from the residential and service sectors in 2006 MtCO2
� Residential
� Commercial
� Public
10.78
81.95
11.20
123DepartmentofEnergyandClimateChange,Energy Consumption in the UK, July 2009,Table1.14.

95
Section D: Space heating,hot water and cooling
Over the past 40 years there has been a radical technology shift in the UK heat sector, with gas boilers rising from a low market share in 1970 to become the dominant heating technology. In the domestic sector this has been coupled with an increase in central heating, which has led to significant changes in the way homes are heated; for example, it is now common for all rooms in a household to be heated. Average internal temperatures in households have therefore risen from 12ºC in 1970 to 17.5°C in 2007.124 Increased heating system efficiency and uptake of insulation has however reduced the fuel demand for space heating and hot water that would otherwise have resulted from these increased comfort levels.
Energy use for cooling has progressively risen since 1970, largely driven by an increase in the number of air conditioned offices and shops.
The Government has an active programme underway to deliver energy savings in homes and non-domestic buildings, recognising the role of heat in terms of meeting emission reduction targets, fuel poverty and security of supply, particularly gas supply.
Sector segmentation usedThis section looks at both the overall demand for energy for heating and cooling and the technologies required to service that demand. The heat sector as discussed here comprises space heating, hot water and cooling for domestic and non-domestic buildings. Non-domestic buildings include buildings within the service sector but exclude buildings in the industrial sector.125 Synergies between industrial heat loads and other types of heat demand may lead to renewable and/or low carbon solutions that overlap between the two sectors.
In the following analysis, the energy demand for domestic and non-domestic sectors is examined separately, and different levels are set out for:
●● domestic internal temperature (the comfort level);
●● domestic thermal efficiency (level of insulation) based on a demolition rate, efficiency of new households, and the refurbishment rate of existing households;
●● domestic hot water demand;
●● domestic cooling demand;
●● non-domestic space heating demand;
●● non-domestic hot water demand; and
●● non-domestic cooling demand.
The heating, hot water and cooling demands presented in this report are all ‘service’ demands, representing the amount of heat required (for space heating or hot water), or the amount of heat that must be removed (for cooling). The heating and cooling technologies that could meet these demands are then examined. The fuel input required depends on both service demand and the efficiency of the technology
124DepartmentofEnergyandClimateChange,Energy Consumption in the UK 2009,Table3.16.OctobertoMarchaverage.
125Theservicesectorincorporatescommercialandpublicsectorbuildings.Heatfortheindustrialsector–thatneededforbothindustrialprocessheatandasmallamountofspaceheating–isincludedwithintheIndustrysector.HeatusedforcookingandcateringisaddressedunderLightsandAppliances,alongwithrefrigeration.

96
Pathways to 2050
Domestic space heating, hot water and coolingDrivers and enablersUK demand for domestic heating, hot water and cooling is driven by many factors, including internal temperature, the thermal efficiency of the building stock, the impact of incidental gains, numbers of households, refurbishment rates, demolition rates, and so on.
The average household’s internal temperature in winter was 17.5°C in 2007.126 The effect of average internal temperature is important because the reduction in space heating demand from even small drops in internal temperatures is significant: a 1°C reduction would reduce heating system energy demand by up to 10%. It may be possible to reduce average internal temperatures in households without adversely affecting the comfort of occupants, for example through greater control of the temperature in individual rooms, and avoiding the heating of buildings when they are unoccupied.
The fabric of a building (including its level of insulation) determines how efficient the building is at keeping warmth inside. The rate of heat lost from a household is proportional to the difference in internal and external temperature, and the thermal ‘leakiness’ of households. The ‘leakiness’ is quantified by the ‘Heat Loss Coefficient’ (HLC)127 which takes account of both fabric losses and ventilation losses. The amount of heat loss can be obtained by multiplying the rate of heat loss by the length of time it persists.
The future average HLC128 of the UK domestic stock in a given year is influenced by:
●● the demolition rate;
●● the new build rate;
●● the level of refurbishment in the remaining stock; and
●● new build fabric thermal efficiency standards.
Within this report, the demolition rate for the existing stock is assumed to be 0.1% per annum for each year to 2050. This equates to the demolition of 25,000 dwellings per annum; about twice the current rate.129 The current rate is low by historic standards – an historic high of 130,000 dwellings per annum occurred in the 1970s.130 However, there are implications for embodied energy, social acceptance and financial cost associated with increased demolition rates, which this project does not consider. The assumed demolition rate is based on current trends without any major demolition programmes, but with some scope for an increase in selective demolitions.
The new build rate assumed for dwellings is based on government demographic projections of households, given that the household is a reasonable proxy for the number of dwellings in terms of energy consumption. For 2031, this would mean just
126DepartmentofEnergyandClimateChange,Energy Consumption in the UK 2009,Table3.16.127TheunitsfortheHeatLossCoefficientareWatts/ºC.128ThecalculationofHLCinthisreporttakesintoaccountthedifferentagebandsandbuiltformswithin
theUKstockandisbasedontheGovernment’sStandardAssessmentProcedure(SAP)methodology.12940%HouseProjectbackgroundmaterialB:ForesightscenariosfortheUKdomesticsector(2005),
page16.13040%HouseProjectbackgroundmaterialB:ForesightscenariosfortheUKdomesticsector(2005),
page16.

97
Section D: Space heating,hot water and cooling
over 33 million households for the UK, implying an annual growth rate from 2007 of approximately 1% per annum.131 Projecting this growth rate results in 40.2 million UK households in 2050. Given the demolition rate of 0.1% assumed above, the new build rate assumed averages 1.1% per annum132 until 2050. The new build mix assumes a higher proportion of flats and a lower proportion of detached houses than in the existing stock because of expected demographic changes.133
As well as build rates and demolition rates, the extent of refurbishment is also an important factor in determining the efficiency of the stock. The level of refurbishment of the existing stock is based on different penetration levels of the following six measures:
●● solid wall insulation;
●● cavity wall insulation;
●● floor insulation;
●● super-glazing (equivalent to triple glazing);
●● loft insulation; and
●● draught-proofing.
The impact these measures can have is set out in Tables D1 and D2.
Table D1: Impact of insulation measures for domestic buildings
Measure135 AssumedaverageU-value(W/m2.°C)beforemeasure
AssumedaverageU-value(W/m2.°C)aftermeasure
Solid wall insulation 2.20 0.35
Cavity wall insulation 1.60 0.35
Floor insulation 0.60 0.16
Triple-glazing or equivalent
2.20 1.00
Loft insulation136 0.29 0.16
131DepartmentforCommunitiesandLocalGovernment(November2009)Household estimates and projections 1961-2031,Table401.
132Equivalenttoanaverageof285,000newbuilddwellingsperannum.Thenewbuildrateduringthe1990swasapproximately150,000newdwellingsperannum.Thehighestannualtotalof413,700newbuilddwellingsoccurredin1968(HouseofCommonsLibrary(1999)A Century of Change: Trends in UK Statistics since 1900,page12).
133Analysisinsupportof‘DefinitionofZeroCarbonHomes’ImpactAssessment,DepartmentforCommunitiesandLocalGovernment(July2009).
134Theinsulationandglazingmeasuresreduceheatlossthroughtheelementtowhichtheyareapplied(wall,floor,window,etc).Theselossesarequantifiedbythe‘U-value’,whichistherateofheatlossperunitareaoftheelement,perunittemperaturedifferenceacrosstheelement.
135Measureequivalenttotoppingupaloftwith145mmofmineralwoolinsulationto270mm.

98
Pathways to 2050
Table D2: Impact of draught-proofing for domestic buildings
Measure Assumedaverageairpermeability(m3/m2.
hr@50Pa)beforemeasure
Assumedaverageairpermeability(m3/m2.
hr@50Pa)aftermeasure
Draught-proofing137 15 5
The uptake of insulation measures in the domestic sector can in practice be limited by a number of factors. Consumers are sensitive to upfront costs, even when a measure is cost effective. The type of building ownership can affect take up, with private landlords having little incentive to invest in energy saving measures benefitting their tenants. There is a significant fraction of the population who do not take up measures regardless of how cost effective they are (estimated at 28% of the owner-occupier population).137
People can be put off by the disruption associated with some measures, for example floor insulation and internal solid wall insulation. In the case of internal solid wall insulation there can also be a significant loss of floor area.
The savings achieved by energy efficiency improvements can also be reduced by ‘comfort taking’, in which the measures partly support warmer internal temperatures rather than increased energy savings.
There are sources other than heating systems which help to heat buildings, known as incidental gains. These include solar radiation, hot water storage and pipework, cooking, lights and appliances, and people and pets (metabolic gains). Some of the heat provided from these sources is not useful because it contributes to warming when none is required, for example some of the solar gains during the summer. However, the effect of these heat sources is very significant within the UK domestic stock today: in 2006, the useful effect is estimated to have been more than half of the total domestic heating requirement.138
Owing to climate change, average external temperatures in the UK are expected to rise by approximately 2-2.5°C by 2050.139 This will reduce the need for heating in winter, but is likely to increase the need for air conditioning in warmer months.
In terms of domestic hot water demand, there has been a recent trend towards increased use of ‘higher-flow’ showers, increasing the demand for hot water for showering. This has been offset by increases in the efficiency of white goods that use hot water. With limited scope for further efficiency improvements in white goods, an increase in overall hot water use may soon start to emerge.140 Potential reductions in demand for hot water will be very dependent on consumer behaviour.
136Draught-proofingreducesheatlosses,anditseffectisquantifiedintermsoftheairpermeability.Airpermeabilityismeasuredbythevolumeofinternalairlosttotheoutsideenvironmentpersquaremetreofbuildingenvelopeataparticularpressurecondition(cubicmetrespersquaremetreperhouratacertainnumberofpascals).
137ElementEnergy(August2009)The uptake of energy efficiency in buildings,areporttotheCommitteeonClimateChange.
138BuildingReseachEstablishment(2008)Domestic Energy Factfile,page62.139UKClimateProjections2009(UKCP09),DepartmentfortheEnvironment,FoodandRuralAffairsand
theDepartmentofEnergyandClimateChangeunderlicencefromtheMetOffice,NewcastleUniversity,theUniversityofEastAngliaandtheProudmanOceanographicLaboratory.
140TheEnvironmentAgencyandtheEnergySavingTrust(April2009)Quantifying the energy and carbon effects of water savingFullTechnicalReport.

99
Section D: Space heating,hot water and cooling
Energy demand levels for domestic space heating, hot water, and cooling Four levels of change have been developed for each of the relevant variables, and these are set out below.
Level 1●● Internal temperature: Average internal temperature in UK households rises to 20ºC
by 2050, based on recent historic trends, stabilising in 2030. This represents a 2.5°C rise on the 2007 winter average.
●● Thermal efficiency:141 The average Heat Loss Coefficient for the UK domestic stock falls from 247 watts/°C per household in 2007 to around 190 watts/°C by 2050. There are some improvements to dwelling energy efficiency as modest levels of insulation are installed. The uptake of insulation measures shown in Table D3 has been assumed. New buildings are assumed to comply with current standards.142
●● Hot water demand: 50% increase in hot water consumption per household in 2050 relative to 2007. This reflects the impact of economic growth leading to an increased use of hot water, and a greater number of hot water using appliances.
●● Cooling demand: For level 1, it is assumed that every household in the UK has air conditioning by 2050, in response to increased wealth.143
Table D3: Level 1 take up of insulation measures
Measure NumberofUKhouseholds
receivingmeasures
Yearinstallationscomplete
Fractionof2007potential
addressedoncompletionof
rollout
Solid wall insulation (internal or external)
400,198 2011 5%
Cavity wall insulation 2,287,500 2050 25%
Floor insulation 3,570,000 2050 30%
Triple glazing equivalent 2,366,000 2022 10%
Loft insulation 1,116,665 2022 5%
Improved air-tightness 62,832 2009 0%
141ThepenetrationsfortheinsulationmeasuresareinpartbasedonworkfortheCommitteeonClimateChange,ElementEnergy,Theuptakeofenergyefficiencyinbuildings,areporttotheCommitteeonClimateChange(August2009).
142BuildingRegulations2000,PartL(ConservationofFuelandPower),asamended.143TotalUKdomesticcoolingdemandundereachlevelforeachyearto2050hasbeenevaluatedtaking
intoaccountprojectedgrowthindwellingnumbers,thechangeinaveragedwellingheatloss,projectedchangesinexternaltemperatureandtheeffectofchangestointernalgainsfromhotwaterheating,lightsandappliances.Acoolingsetpointataninternaltemperatureof23.5°Chasbeenassumed.

100
Pathways to 2050
Level 2●● Internal temperature: Average internal temperature in UK households rises to 18ºC
by 2050, representing a slight 0.5°C rise on the 2007 winter average by 2050.
●● Thermal efficiency: The average Heat Loss Coefficient for the UK domestic stock falls from 247 watts/°C in 2007 to around 170 watts/°C by 2050. Greater improvements to dwelling energy efficiency are made, as improved levels of insulation are installed. The uptake of insulation measures shown in Table D4 has been assumed. New build fabric standards are assumed to be equivalent to the Energy Saving Trust’s Advanced Practice Energy Efficiency standard, but with the air permeability standard relaxed to 3m3/m2.hr.144
●● Hot water demand: The level of hot water consumption per dwelling in 2050 is the same as in 2007.
●● Cooling demand: It is assumed that 67% of households install air conditioning by 2050.
Table D4: Level 2 take up of insulation measures
Measure NumberofUKhouseholds
receivingmeasures
Yearinstallationscomplete
Fractionof2007potential
addressedoncompletionof
rollout
Solid wall insulation (internal or external)
2,000,989 2022 25%
Cavity wall insulation 4,575,000 2022 50%
Floor insulation 5,355,000 2050 45%
Triple glazing equivalent 8,281,000 2050 35%
Loft insulation 6,699,990 2022 30%
Improved air-tightness 6,283,194 2020 25%
Level 3●● Internal temperature: Average internal temperature in UK households falls to 17ºC
by 2050, representing a slight 0.5°C decrease from the 2007 winter average.
●● Thermal efficiency: The average Heat Loss Coefficient for the UK domestic stock falls from 247 watts/°C per dwelling in 2007 to around 145 watts/°C by 2050. There are very significant improvements to dwelling energy efficiency within the existing domestic stock. The uptake of insulation measures shown in Table D5 has been assumed. As for level 2, new build fabric standards are assumed to be equivalent to
144Thenewbuildstandardassumedforlevels2and3isthemiddlespecification(SpecificationC-)ofthefiveconsideredintheDecember2009consultationonfabricefficiencystandardsforzerocarbonhomes(DepartmentforCommunitiesandLocalGovernment(December2009)Sustainable New Homes – The Road to Zero Carbon’. Consultation on the Code for Sustainable Homes and the Energy Efficiency standard for Zero Carbon Homes,page68).
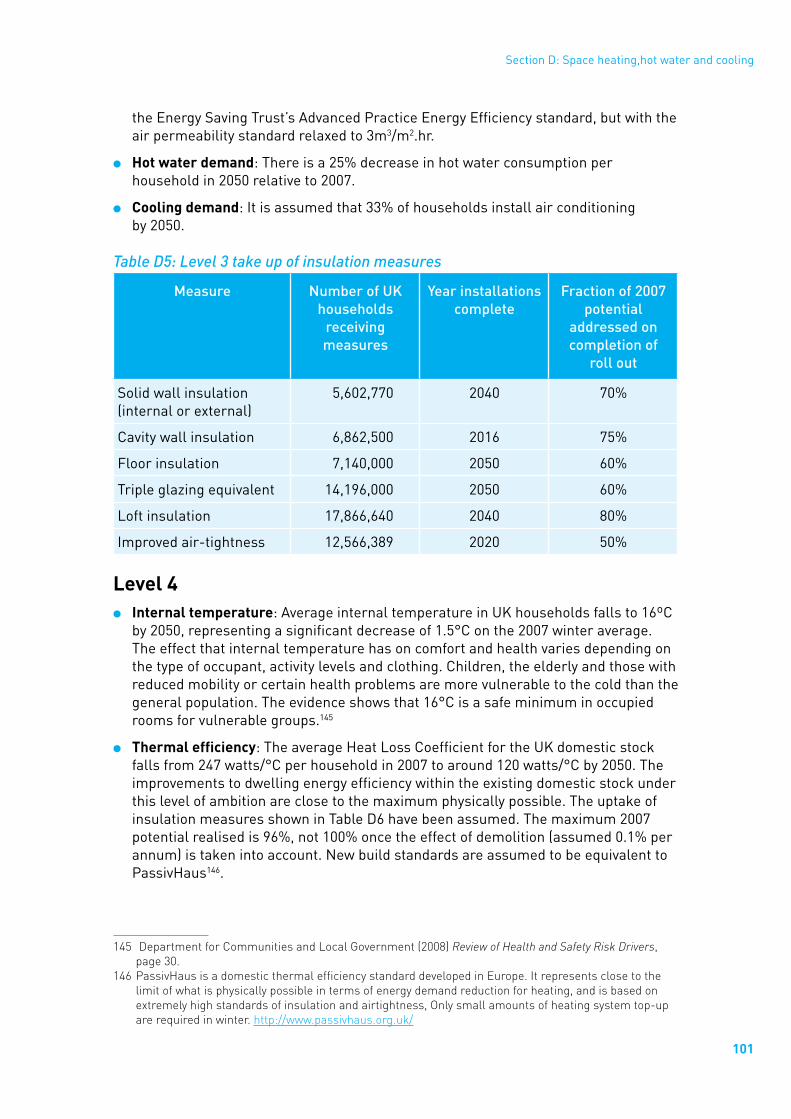
101
Section D: Space heating,hot water and cooling
the Energy Saving Trust’s Advanced Practice Energy Efficiency standard, but with the air permeability standard relaxed to 3m3/m2.hr.
●● Hot water demand: There is a 25% decrease in hot water consumption per household in 2050 relative to 2007.
●● Cooling demand: It is assumed that 33% of households install air conditioning by 2050.
Table D5: Level 3 take up of insulation measures
Measure NumberofUKhouseholds
receivingmeasures
Yearinstallationscomplete
Fractionof2007potential
addressedoncompletionof
rollout
Solid wall insulation (internal or external)
5,602,770 2040 70%
Cavity wall insulation 6,862,500 2016 75%
Floor insulation 7,140,000 2050 60%
Triple glazing equivalent 14,196,000 2050 60%
Loft insulation 17,866,640 2040 80%
Improved air-tightness 12,566,389 2020 50%
Level 4●● Internal temperature: Average internal temperature in UK households falls to 16ºC
by 2050, representing a significant decrease of 1.5°C on the 2007 winter average. The effect that internal temperature has on comfort and health varies depending on the type of occupant, activity levels and clothing. Children, the elderly and those with reduced mobility or certain health problems are more vulnerable to the cold than the general population. The evidence shows that 16°C is a safe minimum in occupied rooms for vulnerable groups.145
●● Thermal efficiency: The average Heat Loss Coefficient for the UK domestic stock falls from 247 watts/°C per household in 2007 to around 120 watts/°C by 2050. The improvements to dwelling energy efficiency within the existing domestic stock under this level of ambition are close to the maximum physically possible. The uptake of insulation measures shown in Table D6 have been assumed. The maximum 2007 potential realised is 96%, not 100% once the effect of demolition (assumed 0.1% per annum) is taken into account. New build standards are assumed to be equivalent to PassivHaus146.
145DepartmentforCommunitiesandLocalGovernment(2008)Review of Health and Safety Risk Drivers,page30.
146PassivHausisadomesticthermalefficiencystandarddevelopedinEurope.Itrepresentsclosetothelimitofwhatisphysicallypossibleintermsofenergydemandreductionforheating,andisbasedonextremelyhighstandardsofinsulationandairtightness,Onlysmallamountsofheatingsystemtop-uparerequiredinwinter.http://www.passivhaus.org.uk/

102
Pathways to 2050
●● Hot water demand: There is a 50% decrease in hot water consumption per household in 2050 relative to 2007. This is thought to be the limit that could be achieved with greater consumer awareness of hot water efficiency, and more water efficient fittings.
●● Cooling demand: It is assumed that no additional domestic air conditioning is used relative to today.
Table D6: Level 4 take up of insulation measures
Measure NumberofUKhouseholds
receivingmeasures
Yearinstallationscomplete
Fractionof2007potential
addressedoncompletionof
rollout
Solid wall insulation (internal or external)
7,659,250 2040 96%
Cavity wall insulation 8,755,936 2030 96%
Floor insulation 11,387,501 2050 96%
Triple glazing equivalent 22,641,032 2050 96%
Loft insulation 21,439,968 2040 96%
Improved air-tightness 24,050,381 2020 96%
Figure D3: Trajectories for total domestic heat demand under four levels of change
TWh
per
year
0
100
200
300
400
500
600
Level 1Level 2Level 3Level 4
2007
2050
2045
2040
2035
2030
2025
2020
2015
2010

103
Section D: Space heating,hot water and cooling
Figure D4: Trajectories for total domestic cooling demand under four levels of change
TWh
per
year
0
10
20
30
40
50
Level 1Level 2Level 3Level 4
2007
2050
2045
2040
2035
2030
2025
2020
2015
2010
Non-domestic space heating, hot water and coolingDrivers and enablers The non-domestic sector is highly fragmented, containing a wide range of building types with very different energy use patterns. For example, hotels and leisure centres have a relatively high fraction of energy use for hot water compared to other non-domestic building types, while offices and retail buildings have a relatively high need for cooling. The scope for demand reductions is therefore very specific to the type of non-domestic building considered.
General drivers of demand for space heating, hot water and cooling in the non-domestic sector include:
●● the number of non-domestic buildings (the 1.8 million non-domestic buildings in 2007 will grow to 2.7 million by 2050 assuming an annual growth rate of 1%);147
●● the level and rate of energy efficiency improvements to the existing non-domestic stock;
●● new build standards for non-domestic buildings;
●● the proportion of non-domestic floorspace which is air conditioned;148 and
●● increasing penetrations of information and communication (ICT) equipment.149
General constraints on reducing energy demand in the non-domestic sector include:
●● complex relationships of ownership, occupation and management, leading to split incentives for energy efficiency measures;
147TheCarbonTrust(December2009)Building the future today. The1%growthrateisassumedtoresultfromanewbuildrateof1.5%andademolitionrateof0.5%.
148In2007,therewere911millionsquaremetresofnon-domesticfloorspace,ofwhich27.5%wasairconditioned(TheCarbonTrust(December2009)Building the future todayreferringtodataprovidedbyHarryBruhns,UniversityCollegeLondon).
149Increasescoolingdemandduetoheatgains

104
Pathways to 2050
●● energy costs forming a relatively small fraction of the total costs of non-domestic building operation; and
●● inertia caused by the desire to avoid disruption and ongoing management time.
However, non-domestic refurbishments occur more frequently for domestic buildings, and these can represent a good opportunity to implement measures reducing energy demand.
Energy demand levels for non-domestic space heating, hot water, and cooling The rationale for the choices of levels was based on considering what the potential demand reductions are for new build non-domestic buildings. The extent to which these can be approached for existing buildings is then limited to site and orientation specific factors once it is recognised that the most radical refurbishments could involve complete replacement of the fabric envelope and building services systems, with only the structural core remaining intact. For these larger scale refurbishments it is recognised that the maximum rate of refurbishment will be lower.
Four levels of change have been developed for each of the demands, and these are set out below.
Level 1●● Space heating demand: It is assumed that there is little change in per building
space heating demand by 2050. New build standards remain as they were in 2006 and few large refurbishments occur.
●● Hot water demand: No change is assumed in per building hot water demand in the non-domestic sector.
●● Cooling demand: It is assumed that refurbishments tend to lead to the installation of air conditioning, and all new build is air conditioned, with the result that by 2050 all non-domestic floorspace in the UK is air-conditioned.
Level 2●● Space heating demand: Per building space heating demand in the non-domestic
sector drops by 20% by 2050, due to some improvement in average new build demand, some uptake of insulation measures in the existing stock, and behaviour change.
●● Hot water demand: A 10% reduction in average per building hot water demand is assumed.
●● Cooling demand: The 2050 penetration of air conditioning reaches 100% for office and retail units and increases by 50% elsewhere, leading to an overall penetration of 40% of non-domestic floor space in 2050. Some energy efficiency improvements reduce cooling demand by 20% for air conditioned buildings. New build is 100% air conditioned but with a 20% demand reduction over the average of the 2007 stock.

105
Section D: Space heating,hot water and cooling
Level 3●● Space heating demand: There is significant refurbishment of the existing stock
(including interventions in the building fabric), leading to a 30% reduction in per building service demand in the 2007 stock.
●● Hot water demand: A 20% reduction in average per building hot water demand relative to 2007 is assumed.
●● Cooling demand: The total fraction of non-domestic floor space with air-conditioning remains constant (c28%). All new build is also assumed to be air conditioned, but with a 50% demand reduction over the average of the existing stock.
Level 4●● Space heating demand: Refurbishment of the existing stock involves complete
replacement of the building fabric and building services, achieving a 40% reduction in per building service demand for space heating. New build achieves 90% reductions in space heating.
●● Hot water demand: A 30% reduction in average per building demand for hot water is achieved, relative to the 2007 average.
●● Cooling demand: The fraction of non-domestic floor space with air-conditioning is reduced by 50% due to increase in the use of passive cooling systems. Nearly all new build air conditioning is achieved through passive design measures, achieving a 90% reduction in cooling demand compared with an average air conditioned building within the existing stock in 2007.
Figure D5: Trajectories for total non-domestic heat demand under four levels of change
TWh
per
year
0
20
40
60
80
100
120
140
Level 1Level 2Level 3Level 4
2007
2050
2045
2040
2035
2030
2020
2010
2025
2015

106
Pathways to 2050
Figure D6: Trajectories for total non-domestic cooling demand under four levels of change
TWh
per
year
0
20
40
60
80
100
120
140
Level 1Level 2Level 3Level 4
2007
2050
2045
2040
2035
2030
2025
2010
2015
2015
Technology pathways
Specification of technology pathways for domestic and non-domestic heating and coolingIn order to meet the possible heating, hot water and cooling service demands evaluated above, a number of different technology pathways have been evaluated.
Heating technologies are diverse in terms of their suitability for different types of buildings and localities. They also have particular fuel and infrastructure requirements, and the extent to which these requirements can be met in the future is uncertain. The continued role of the gas grid is one strategic question which could alter the technology mix substantially depending on how it is resolved.150
The technology pathways examined therefore reflect the wide range of possible heating technology mixes that could result in 2050. They include some that have a heavy dominance of one heating technology, and some that have a more balanced mix, in order that the range of possible outcomes is reflected.
Within the 2050 Pathways Calculator the heating technology pathways are defined by the level of electrification and different mixes of the potential main non-electric fuel types (biomass, biogas and power station heat). The levels of electrification are summarised in Table D7.
150Inthelongtermitislikelythatnaturalgasboilerswillbephasedoutaspartofeffortstodecarboniseheating,largelyremovingtheneedforanaturalgasdistributionnetwork.Howevertheintroductionofbiomethaneasanalternativeheatingfuelcouldallowatleastsomepartsofthegasgridtoremaininuse.
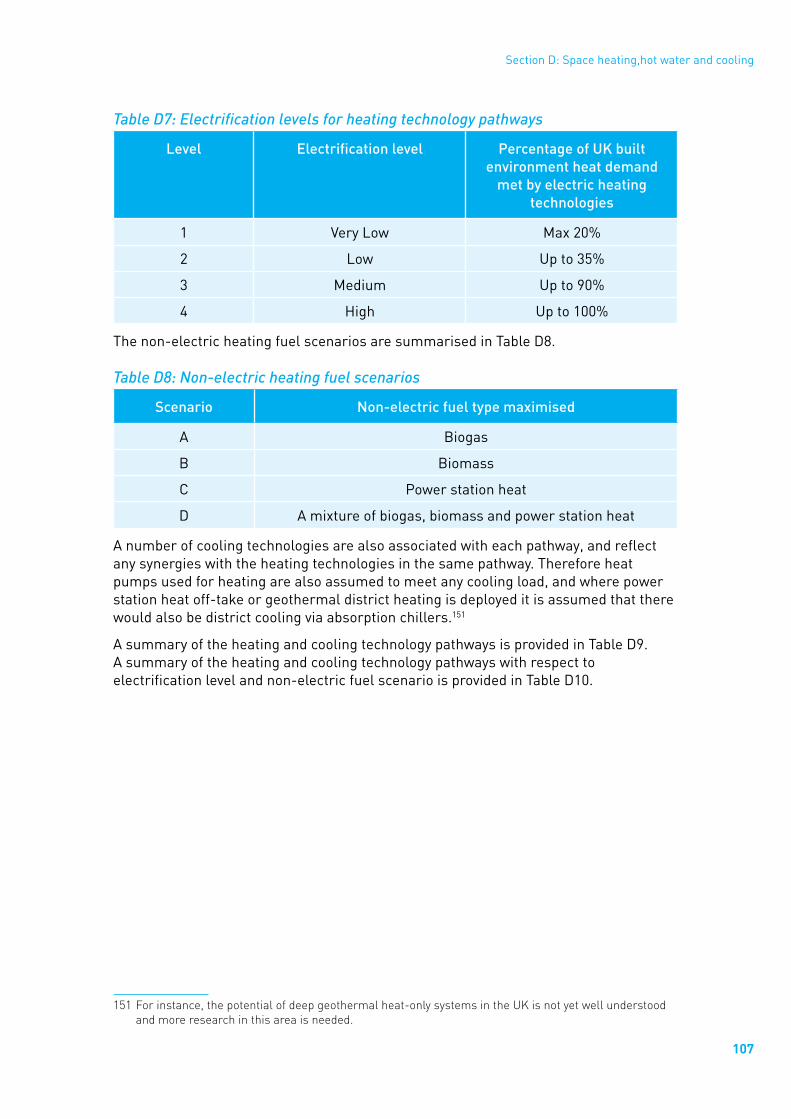
107
Section D: Space heating,hot water and cooling
Table D7: Electrification levels for heating technology pathways
Level Electrificationlevel PercentageofUKbuiltenvironmentheatdemand
metbyelectricheatingtechnologies
1 Very Low Max 20%
2 Low Up to 35%
3 Medium Up to 90%
4 High Up to 100%
The non-electric heating fuel scenarios are summarised in Table D8.
Table D8: Non-electric heating fuel scenarios
Scenario Non-electricfueltypemaximised
A Biogas
B Biomass
C Power station heat
D A mixture of biogas, biomass and power station heat
A number of cooling technologies are also associated with each pathway, and reflect any synergies with the heating technologies in the same pathway. Therefore heat pumps used for heating are also assumed to meet any cooling load, and where power station heat off-take or geothermal district heating is deployed it is assumed that there would also be district cooling via absorption chillers.151
A summary of the heating and cooling technology pathways is provided in Table D9. A summary of the heating and cooling technology pathways with respect to electrification level and non-electric fuel scenario is provided in Table D10.
151Forinstance,thepotentialofdeepgeothermalheat-onlysystemsintheUKisnotyetwellunderstoodandmoreresearchinthisareaisneeded.

108
Pathways to 2050
Table D9: Summary of heating and cooling technology pathways
Pathway Fueldependencein2050152
Heatingtechnologysplit
in2050153
Coolingtechnologysplit
in2050154
Notes
1 100% electric 60% ASHP
30% GSHP
10% resistive heating
100% electric air conditioners
Most demanding pathway in terms of heat pump innovation
High electric
2 80% electric
20% biomass
50% ASHP
30% GSHP
20% community scale biomass CHP
100% electric air conditioners
High electric, low biomass
3 85% electric
15% biogas
55% ASHP
30% GSHP
15% community scale biogas CHP155
100% electric air conditioners
High electric, low biogas
4 90% electric
3% power station heat off-take district heating
60% ASHP
30% GSHP
7% resistive heating
3% power station heat off-take district heating
97% electric air conditioners
3% absorption chillers
High electric, low district heating from power stations
5 80% biomass
20% electric
70% community scale biomass CHP
10% individual dwelling biomass boilers
20% GSHP
100% electric air conditioners
High biomass, low electric
152153154155
152%oftotalUKbuiltenvironmentheatdemandmetbydifferentfuels.153%oftotalUKbuiltenvironmentheatdemand.154%oftotalUKbuiltenvironmentcoolingdemand.155By2050,communityscalefuelcellscouldalsobeanalternativetogasCHP.

109
Section D: Space heating,hot water and cooling
Pathway Fueldependencein2050
Heatingtechnologysplit
in2050
Coolingtechnologysplit
in2050
Notes
6 68% biomass
24% biogas
7% power station heat off-take district heating
1% geothermal heating
63% community scale biomass CHP
5% individual building scale biomass boilers
24% Stirling engine micro-CHP156
7% power station heat off-take district heating
1% geothermal heating
92% electric air conditioners
8% absorption chillers
High biomass, medium district heating from power stations, medium biogas
7 49% biogas
43% biomass
7% power station heat off-take district heating
1% geothermal heating
30% community scale biogas CHP
19% Stirling engine micro-CHP
33% community scale biomass CHP
10% individual building scale biomass boilers
7% power station heat off-take district heating
1% geothermal heating
92% electric air conditioners
8% absorption chillers
Medium biomass, medium biogas, medium district heating from power stations
8 45% biomass
48% electric
7% power station heat off-take district heating
45% community scale biomass CHP
30% GSHP
18% ASHP
7% power station heat off-take district heating
92% electric air conditioners
7% absorption chillers
Medium biomass, medium electric, medium district heating from power stations
156Representinguseinlargerhousesandassumingfuelcellmicro-CHPhasnotbecomecommerciallyviable.

110
Pathways to 2050
Pathway Fueldependencein2050
Heatingtechnologysplit
in2050
Coolingtechnologysplit
in2050
Notes
9 80% biogas
20% electric
80% gas boilers
20% resistive heating
100% electric air conditioners
Little innovation in buildings
High biogas, low electric
10 63% biogas
30% electric
7% power station heat off-take district heating
33% community scale biogas CHP
20% fuel cell micro-CHP
10% Stirling engine micro-CHP
30% GSHP
20% power station heat off-take district heating
93% electric air conditioners
7% absorption chillers
High biogas, medium electric, medium power station district heating
11 90% biogas
10% electric
90% fuel cell micro-CHP
10% resistive heating
100% electric air conditioners
Fuel cell pathway
High biogas, low electric
12 39% biogas
28% biomass
25% electric
7% power station heat off-take district heating
1% geothermal heating
23% community scale biogas CHP
16% fuel cell micro-CHP
23% community scale biomass CHP
5% individual building scale biomass boilers
25% GSHP
7% power station heat off-take district heating
1% geothermal heating
92% electric air conditioners
8% absorption chillers
Medium biogas, medium biomass, medium electric, medium power station district heating

111
Section D: Space heating,hot water and cooling
Pathway Fueldependencein2050
Heatingtechnologysplit
in2050
Coolingtechnologysplit
in2050
Notes
13 88% electric
11% power station heat off-take district heating
1% geothermal district heating
30% GSHP
58% ASHP
11% power station heat off-take district heating
1% geothermal district heating
88% electric air conditioners
12% absorption chillers
High district heating, high electric, no biomass
14 40% biomass
34% electric
15% biogas
11% power station heat off-take district heating
25% community scale biomass CHP
15% individual building scale biomass boilers
20% GSHP
14% ASHP
15% community scale biogas CHP
11% power station heat off-take district heating
89% absorption chillers
11% electric air conditioners
High district heating from power stations, medium biomass, medium electric, low biogas
15 45% biomass
43% biogas
11% power station heat off-take district heating
1% geothermal heating
35% community scale biomass CHP
10% individual building scale biomass boilers
24% community scale biogas CHP
19% Stirling engine micro-CHP
11% power station heat off-take district heating
1% geothermal heating
88% electric air conditioners
12% absorption chillers
High district heating from power stations, medium biomass, medium biogas, no electric

112
Pathways to 2050
Pathway Fueldependencein2050
Heatingtechnologysplit
in2050
Coolingtechnologysplit
in2050
Notes
16 50% electric
30% biomass
13% biogas
7% power station heat off-take district heating
25% GSHP
25% ASHP
20% community scale biomass CHP
10% individual building scale biomass boilers
13% community scale biogas CHP
7% power station heat off-take district heating
93% electric air conditioners
7% absorption chillers
Medium power station district heating, medium electric, medium biomass, low biogas
Table D10: Summary of the heating and cooling technology pathways with respect to electrification level and primary non-electric fuel scenario
Summary of technology pathways
(iv) Primary non-electric source
(iii) Electrification level 1 Gas
2 Solid
3 District
4 Mixed/None
1 Very low 9 6 15 7
2 Low 11 5 14 12
3 Medium 10 8 13 16
4 High 3 2 4 1

113
Section D: Space heating,hot water and cooling
Trade-offs, constraints and contingencies for different heating technologiesElectric heating technologiesThe following electric heating technologies have been examined:
●● resistive heating;
●● ground source heat pumps; and
●● air source heat pumps.
The 2050 project divides heat pumps into air source heat pumps (ASHPs) and ground source heat pumps (GSHPs). Heat pumps can be used with either wet heating systems (for example, radiators) or dry heating systems (for example, forced air blowers). Heat pump efficiency is usually stated in terms of a Coefficient of Performance (‘CoP’), which is the ratio of useful heat output to electrical input.
The second law of thermodynamics limits the maximum CoP that can be achieved by a heat pump. The maximum CoP is dependent on the temperature difference between the cold body and the hot body. For building heating applications, this means that the CoP of the heat pump is reduced if the external temperature (of the ground sub-surface or air) is lower, or if a higher temperature needs to be achieved (for example, to heat hot water).
The variation of heat pump CoP with temperature has a number of implications if heat pumps are to be used for building heating applications.
Building fabric thermal performance
The rate of heat delivery required to maintain an adequately high internal temperature is dependent on the rate of heat loss from the building, which is in turn dependent on its levels of insulation and air-tightness. The first trade-off is therefore between insulation levels and the rate of heat delivery required. Although this is true for all heating systems, for heat pumps the variation in efficiency with delivered temperature makes this trade-off particularly acute.
●● Better insulating buildings enables heat pumps with a smaller power rating to be used. This is beneficial, as the size and cost of a heat pump increase as the rated power increases.
●● If buildings are well insulated then existing radiator systems could operate at lower temperatures and still meet the demand, which would improve CoPs.
●● The noise generated by ASHPs also increases as the rated power increases (for the same size of air to refrigerant heat exchanger). Quiet ASHPs are less likely to be constrained in their deployment, particularly in higher density areas where buildings are in close proximity to each other and there is a greater potential for cumulative noise to become a problem. Future technology improvement may reduce the noise associated with ASHPs.
●● Should electric heating achieve a high penetration in UK households, the smaller peaks in space heating demand associated with better insulated dwellings would help reduce the capacity of the electricity infrastructure required to meet peak heat demand, for example upgrades to local sub-stations and networks.

114
Pathways to 2050
Air-to-air versus air-to-water systems
Once the required rate of heat delivery is fixed, there is a choice of the type of heating system used to deliver the heat.
Air-to-air systems can consist of a centralised warm air fan unit with air ducting for supply to individual rooms. This would involve disruption on installation. Alternatively, refrigerant ducting can be run from the heat pump to small fan assisted heaters in each room. The refrigerant ducting required for this type of system is around 6 millimetres in diameter, greatly reducing the disruption associated with installation. Possible constraints on the uptake of air-to-air systems include fan noise in quiet rooms (such as bedrooms) and different perceptions of thermal comfort compared to radiator systems.
Radiator temperature and size for air-to-water systems
For space heating using wet systems, the rate at which heat is delivered to a room is dependent on both the temperature and surface area of the radiators. Most domestic radiator systems consist of wall mounted hot water radiators designed with a flow temperature of 82°C. A heat pump would be relatively inefficient at this high flow temperature, and so it would be desirable to use a radiator system running at a lower temperature.
The largest form of radiator is an underfloor heating system. This can run at a flow temperature of 35°C, enabling much improved CoPs for heat pump space heating to be achieved. However, underfloor heating systems would be difficult to retrofit into existing buildings due to the disruption and cost involved.
Heat pumps using radiators are much more likely to be installed in a retrofit market if they can supply the existing radiator system. If the original radiators were correctly sized for operation at 82°C, replacement radiators with a larger surface area would be needed to deliver heat at the same rate using lower temperatures. In practice, however, most central heating system radiators are significantly oversized, especially where insulation improvements have been carried out subsequently to the original installation. In many buildings it may therefore be possible to use the existing radiators operating at a lower temperature, with the heat pump operating at a reduced, but still acceptable, CoP.
If larger radiators are required, the radiators themselves can be replaced with double panel and/or finned versions, doubling the effective area, without the need to replace pipework. High temperature heat pump technology also has the potential to advance in future, enabling higher radiator temperatures to be achieved with a smaller sacrifice in CoP.
Variable flow temperature heat pumps are available where the flow temperature is reduced during lower demand periods thus improving the CoP.

115
Section D: Space heating,hot water and cooling
Hot water storage
A hot water tank is in practice required if heat pumps are to be used for heating water. Instantaneous water heating requires a large power output. For example, mixer showers typically require 20kW of heat;157 a hot tap around 10kW.158 Given the constraints currently associated with high power heat pumps, it would be impractical to supply this instantaneously. A hot water tank enables water to be heated over a longer period of time at a lower power rating. Hot water storage with electric water heating could also provide possibilities for demand side management as part of a smart electricity grid. However, the space requirement for hot water storage is likely to be a constraint in flats and other dwellings with combi boilers which do not already have a hot water cylinder.
Single-phase supply
Domestic electricity supply in the UK is generally single phase, unlike in Europe and America where it is usually three-phase. A heat pump compressor contains an induction motor. There are several advantages to running induction motors (such as those used to run heat pump compressors) on three-phase supply rather than one-phase supply:
●● greater efficiency;
●● less vibration;
●● longer motor lifetime; and
●● smaller starting currents (decreasing the disturbance to the local electricity supply).
Heat pumps using a single phase supply will therefore be somewhat less cost-effective than those using three phase supply. Variable speed drives can limit the problem of high starting current but currently increase the cost of the heat pump by around 30%.159
It is also generally the case that motors above 7.5kW in size can only operate on three-phase supply. This provides an upper limit of about 23kW on the thermal output from a domestic heat pump.160 However, the number of domestic properties with heat demands this large is thought to be small.
Commercial and public buildings in the UK generally have three-phase supplies, enabling optimal heat pump operation at lower cost.
157BasedonΔT=30°Candanaveragemixershowerflowrateof9litresperminute(MarketTransformationProgramme,2008).BNWAT28:Waterconsumptioninnewandexistinghomesversion1.0.ReferringtoWRcCP337).Electricshowersaretypicallyratedatabout10kWandhaveacorrespondinglyreducedflowrate.
158BasedonΔT=50°Candanaveragetapflowrateof3.5litresperminute(MarketTransformationProgramme,2008).BNDWTaps.Briefingnoterelatingtoprojectionsofinternaltapwaterconsumption).
159MitsubishiElectric.Classicheatpumps–ClassicMSeries–MSH-GA-VBHeatpumpR410A.Availablefrom:http://www.mitsubishi-aircon.co.uk/default.asp?url¼http%3A//www.mitsubishiaircon.co.uk/mitsubishi_electric.asp%3Fid%3D152762.
160AssumingthataCoPof3canbeachievedattimesofpeakdemand.

116
Pathways to 2050
Biogas technologiesWhen upgraded to biomethane, biogas has the potential for injection into the gas grid, allowing the continued use of at least parts of the gas grid. The gas-fired heating technologies used today could also continue in use, with little or no adapation required from consumers. This lack of demand-side barriers means that there is the potential for rapid uptake once the supply chain is established. This could help reduce cumulative carbon dioxide emissions.
Possible constraints on the use of biogas for heating include:
●● uncertain volumes of biomass and organic waste in the future;
●● a high demand pull from other sectors of the economy, particularly transport where use of biogas as a fuel is possible; and
●● injection into the high pressure transmission network may be problematic due to the higher concentration of oxygen compared to natural gas.161
Biomass technologiesBiomass is already used for heating in the UK in individual buildings and in a few community heating systems. Possible constraints to increased uptake for heating include:
●● general demand from other sectors of the economy using biomass, for example for biofuels production;
●● relatively high emissions of nitrous oxides and particulates from biomass combustion, which make it unsuitable for large scale deployment in areas with air quality constraints;162
●● the space requirements for fuel delivery and storage (particularly in urban areas); and
●● the carbon intensity of biomass transport. This may become increasingly significant in a carbon constrained world if the transport sector proves hard to decarbonise, though bulk transport by ship has a low carbon impact.
District heating from power stationsThis report assumes electrical generation efficiencies from nuclear power stations will typically be around 35%, with coal CCS and gas CCS power stations achieving higher efficiencies (up to 50%). Therefore, depending on the electricity generation mix, more than half of the primary energy input into UK power stations in 2050 could be converted into heat rather than electrcity. This section examines at a high level the constraints and trade-offs associated with taking heat from power stations, improving UK primary energy efficiency.
For a power station to provide hot water for a district heating network, steam must be extracted from an electricity generating turbine. The temperature of the steam required is relatively low, so the extraction point is at a late (lower temperature) stage of the
161NERAEconomicConsulting,EntecandElementEnergy(July2009)Renewable Heat Technologies for Carbon Abatement: Characteristics and Potential. A final report to the Committee on Climate Change.
162Theuseoflargerscalebiomassplantenablesabatementmeasurestobemorecost-effectivelyfitted,makingcommunityscaleschemespreferabletoindividualdwellinginstallationsinurbanareas.

117
Section D: Space heating,hot water and cooling
steam’s path through the turbine. This minimises the impact on the electricity output of the turbine, which drops slightly. The ratio of heat extracted to electricity sacrificed (known as the z-factor) is typically around 7 for district heating purposes. For higher temperature applications, the z-factor is lower as steam must be extracted at an earlier, higher temperature, point in the turbine, reducing the work that the steam does in the turbine.
The use of heat from large power stations to provide heating and hot water via a district heating network is likely to remain the most efficient use of primary fuel, even allowing for significant improvements in heat pump performance in the UK climate.
Constraints and contingencies for district heating from power stationsFrom the perspective of primary energy efficiency it would be desirable to maximise the use of power stations for district heating. However, there are several constraints on the use of power stations as heat sources for district heating networks. Given all these uncertainties, there is a need for strategic planning if district heating from power stations is to play a more significant role in the UK heating mix by 2050.
The need for a large heat network
District heating from power stations requires a large district heating network in order to deliver all the useful heat produced. This would have significant upfront capital costs and an uncertain heat load projection if installed in one pass. The capital cost and the uncertainty of future heat load would be reduced if there were already pre-existing smaller scale heat networks in the area, as these could then be connected to the larger network. The likely economic viability of power station heat off-take district heating in the future is therefore to some extent dependent on the number of smaller scale networks deployed in the near term.
Possible heat sources for smaller scale networks include gas-fired CHP in the near term (to 2030),163 and biomass CHP or biogas CHP in the longer term. Heat from waste incineration or pyrolysis CHP is also a possibility. However, the continued emission reduction benefit from gas CHP is time limited due to the projected decarbonisation of the electricity grid, and the supply of biomass and biogas for heating may be constrained by demand from other sectors of the economy. It is also possible that waste volumes will fall significantly as a result of waste reduction policies.
163ElectricityproducedfromaCHPunitdisplacesthatfromgeneratingcapacityswitchedonandoffinresponsestodemand(ie,themarginalgeneratingplant).ThemarginalelectricitygeneratingplantintheUKisprojectedtobeunabatedgasCCGTuntil2030(InterdepartmentalAnalysisGroup,January2010).

118
Pathways to 2050
The need for a back-up heat source
In common with other energy systems, heat sources for heat networks generally require a back-up heat source in the event that the primary source becomes unavailable. For example, gas CHP engines typically have a gas boiler back-up system. For economic reasons, it is also common for the back-up system to provide top-up heat to the network in order to meet the peak winter demand.
The fraction of heat delivered by the back-up system can be reduced to a minimum by achieving a heat demand profile with little seasonal variation (for example, that resulting from a mix of commercial and residential buildings), and the use of thermal storage to store the heat until needed. Increasing insulation levels, particularly within domestic buildings, will also help reduce the size of seasonal peaks in heat demand.
On connecting a heat network to a large power station, the need to build new back-up plant is mitigated by the fact that, in practice, smaller networks using smaller heat sources are likely to have built up in the area previously. On connection of the joined up network to the power station, the pre-existing infrastructure would provide the space and network connections for back-up heat sources embedded within the network.
It is also possible for one set of generating turbines to provide back-up for another. This is particularly true for gas CCGT power stations, which commonly have several smaller generating sets compared with coal generation and nuclear. However, this does not provide security of supply in the event that the heat main from the power station fails, unlike the embedded back-up described above.
The need for proximity of heat demand and heat supply
In order to maximise the economic potential for district heating from power stations, they would need to be sited near to large areas of high heat density, ie, large towns and cities. Gas fired CCGTs with CCS are likely have the greatest flexibility in siting, followed by coal CCS, and then nuclear.
Carbon Capture and Storage (CCS) may prove not to be viable at commercial scale, drastically reducing the number of thermal power stations (coal or gas) that may be available for heat off-take to 2050. If CCS does prove viable, the cost of carbon dioxide pipelines will be an extra factor in the siting of thermal power stations, and may tend to result in CCS power stations being located on the Eastern side of the United Kingdom, for access to storage sites under the North Sea.164
It seems likely that any further nuclear generating capacity will be located close to existing sites (and possibly new sites in remote locations). In this eventuality, only a limited number of sites would be able to provide district heating with a heat main of less than 50km in length. Public perceptions of district heating from nuclear power stations may also be negative.
It is therefore sensible to consider how heat demand and the availability of power stations could correlate in 2050. Long term strategic planning in relation to power station siting and the most suitable communities for heat networks is required if the optimal use of UK primary energy is to be achieved in 2050.
164ImperialCentreforEnergyPolicyandTechnology,ImperialCollegeandtheCentreforEnvironmentalStrategy,UniversityofSurrey(2010)Building a roadmap for heat: 2050 scenarios and heat delivery in the UK,page31.

119
Section D: Space heating,hot water and cooling
Heating technology packagesThe heating technology pathways are based on 18 heating technology packages. These are as defined in Table D11. The technology packages have been chosen in order to best reflect the range of conversion processes, fuel types, scales, and efficiencies that might become available in the UK between now and 2050. Each package has an efficiency or CoP defined for each of space heating and hot water, reflecting the difference between the two for some technologies (for example, heat pumps).
As an approximation it is assumed that the penetration of technology packages as a fraction of total UK built environment demand is the same as the fraction of UK households with installations. The reduced heat loss of higher density dwellings in urban areas (which would tend to lead to an overestimate of the fraction of heat supplied on an installations basis) is to some extent counteracted by the additional heat required for non-domestic buildings in these areas. A similar assumption is made for cooling technologies. This is a poor assumption in the case of GSHPs if residential cooling demand remains low relative to non-domestic demand, but is reasonable for all other cases.
There are a number of hard constraints on this process. Firstly, there is a global limit on the number of installations possible in a year. This has been set at 1.3 million installations per annum165 across all technologies. This possible maximum rate is assumed to rise in line with the number of buildings so that it reaches 2 million installations per annum in 2050. For each package there are also:
●● a maximum penetration (as a fraction of the number of UK houses); and
●● start year (a year sufficiently far into the future that the supply chain has been able to build up to install technologies at the maximum install rate).
The same approach is taken for cooling technologies, and the maximum installation rate for these is also assumed to be 1.3 million per annum.
It should be noted that the penetrations, installation rates and start years assumed here are based on a high level analysis which looks to a 2050 end point. They are not based on any analysis of what might be economic, and assume that any regulatory, uptake and technology barriers can be quickly overcome. The policy framework that currently exists for the deployment of renewable energy technologies to 2020 is based on a more detailed analysis of these extra complexities.
165In2009therewereapproximately100,000installersregisteredontheGasSafeRegister,withafurther30,000registeredunderassociatedCompetentPersonSchemes.Assuminga250dayworkingyear,thisimpliesapotentialnationalresourceof33.5millionperson-daysofinstallationsperannum.ThelargestnumberofcentralheatinginstallationsintheUK(1.308million)occurredinfor2002-2003,(DepartmentofEnergyandClimateChange,EnergyConsumption in the UK, July 2009,Table3.14).Itisthereforeassumedthat1.3millioninstallationsperannumacrossallheatingtechnologiesisareasonableupperlimitsubjecttosupplyside,demandsideandotherbarriersbeingovercome.
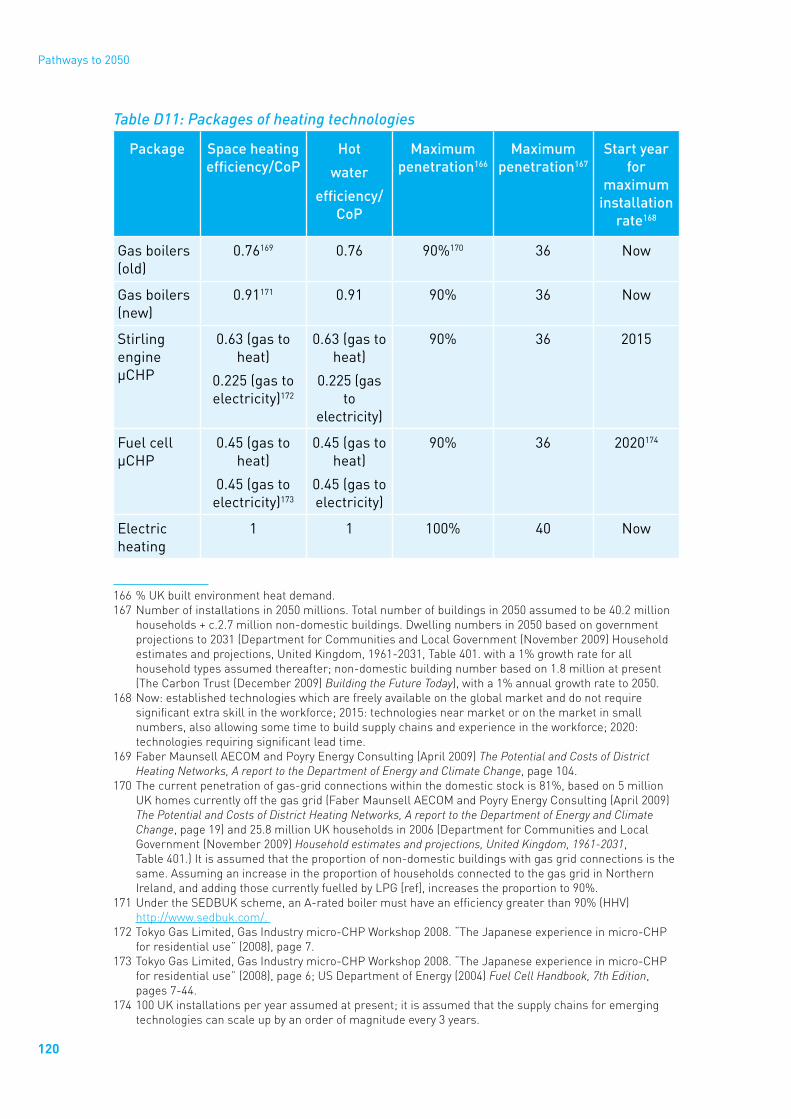
120
Pathways to 2050
Table D11: Packages of heating technologies
Package Spaceheatingefficiency/CoP
Hot
water
efficiency/CoP
Maximumpenetration166
Maximumpenetration167
Startyearfor
maximuminstallation
rate168
Gas boilers (old)
0.76169 0.76 90%170 36 Now
Gas boilers (new)
0.91171 0.91 90% 36 Now
Stirling engine µCHP
0.63 (gas to heat)
0.225 (gas to electricity)172
0.63 (gas to heat)
0.225 (gas to
electricity)
90% 36 2015
Fuel cell µCHP
0.45 (gas to heat)
0.45 (gas to electricity)173
0.45 (gas to heat)
0.45 (gas to electricity)
90% 36 2020174
Electric heating
1 1 100% 40 Now
166%UKbuiltenvironmentheatdemand.167Numberofinstallationsin2050millions.Totalnumberofbuildingsin2050assumedtobe40.2million
households+c.2.7millionnon-domesticbuildings.Dwellingnumbersin2050basedongovernmentprojectionsto2031(DepartmentforCommunitiesandLocalGovernment(November2009)Householdestimatesandprojections,UnitedKingdom,1961-2031,Table401.witha1%growthrateforallhouseholdtypesassumedthereafter;non-domesticbuildingnumberbasedon1.8millionatpresent(TheCarbonTrust(December2009)Building the Future Today),witha1%annualgrowthrateto2050.
168Now:establishedtechnologieswhicharefreelyavailableontheglobalmarketanddonotrequiresignificantextraskillintheworkforce;2015:technologiesnearmarketoronthemarketinsmallnumbers,alsoallowingsometimetobuildsupplychainsandexperienceintheworkforce;2020:technologiesrequiringsignificantleadtime.
169FaberMaunsellAECOMandPoyryEnergyConsulting(April2009)The Potential and Costs of District Heating Networks, A report to the Department of Energy and Climate Change,page104.
170Thecurrentpenetrationofgas-gridconnectionswithinthedomesticstockis81%,basedon5millionUKhomescurrentlyoffthegasgrid(FaberMaunsellAECOMandPoyryEnergyConsulting(April2009)The Potential and Costs of District Heating Networks, A report to the Department of Energy and Climate Change,page19)and25.8millionUKhouseholdsin2006(DepartmentforCommunitiesandLocalGovernment(November2009)Household estimates and projections, United Kingdom, 1961-2031,Table401.)Itisassumedthattheproportionofnon-domesticbuildingswithgasgridconnectionsisthesame.AssuminganincreaseintheproportionofhouseholdsconnectedtothegasgridinNorthernIreland,andaddingthosecurrentlyfuelledbyLPG[ref],increasestheproportionto90%.
171UndertheSEDBUKscheme,anA-ratedboilermusthaveanefficiencygreaterthan90%(HHV)http://www.sedbuk.com/.
172TokyoGasLimited,GasIndustrymicro-CHPWorkshop2008.“TheJapaneseexperienceinmicro-CHPforresidentialuse”(2008),page7.
173TokyoGasLimited,GasIndustrymicro-CHPWorkshop2008.“TheJapaneseexperienceinmicro-CHPforresidentialuse”(2008),page6;USDepartmentofEnergy(2004)Fuel Cell Handbook, 7th Edition,pages7-44.
174100UKinstallationsperyearassumedatpresent;itisassumedthatthesupplychainsforemergingtechnologiescanscaleupbyanorderofmagnitudeevery3years.

121
Section D: Space heating,hot water and cooling
Package Spaceheatingefficiency/CoP
Hot
water
efficiency/CoP
Maximumpenetration166
Maximumpenetration167
Startyearfor
maximuminstallation
rate168
Air Source Heat Pump (ASHP)
3175 2 100%176 40 2015
Ground Source Heat Pump (GSHP)
4177 3 29%
(all detached houses in all areas, plus
semi-detached and
terraced houses in rural and
lower density sub-urban
areas)
11.6 2015
Oil boilers 0.97178 0.97 74%
(all detached, semi-
detached and terraced houses)
29.6 Now
Individual biomass pellet boilers
0.87179 0.87 74%
(all detached, semi-
detached and terraced houses)
29.6 Now
175Staffell,I(April2009)A review of domestic heat pump coefficient of performance,page7.176NoisefrommultipleASHPsisconsideredlikelytobeproblematicinhighdensityareas,sothisis
contingentonfuturetechnologyimprovements.177Staffell,I(April2009)A review of domestic heat pump coefficient of performance,page7.178SeasonalefficiencyofboilersdatabaseUK.www.sedbuk.com179FaberMaunsellAECOMandPoyryEnergyConsulting(April2009)The Potential and Costs of District
Heating Networks, A report to the Department of Energy and Climate Change,page107.

122
Pathways to 2050
Package Spaceheatingefficiency/CoP
Hot
water
efficiency/CoP
Maximumpenetration166
Maximumpenetration167
Startyearfor
maximuminstallation
rate168
Biomass boiler community heating
0.87*0.9180 = 0.78
0.87*0.9 = 0.78
68%
(all households in
city centres and other
urban centres plus semi-detached houses, terraced
houses, and flats in higher
density suburban
areas)
27.2 Now
Gas CHP community heating. Gas within scope includes natural gas and biogas from anaerobic digestion or other processes
0.42181*0.9= 0.38 (gas to
delivered heat)
0.38 (gas to electrical energy)
0.42*0.9= 0.38
68%
(all households in
city centres and other
urban centres plus semi-detached houses, terraced
houses, and flats in higher
density suburban
areas)
27.2 Now
180Thefactorof0.9isintroducedtoreflect10%heatlossesintheheatnetworkforcommunityanddistrictschemes.
181FaberMaunsellAECOMandPoyryEnergyConsulting(April2009)The Potential and Costs of District Heating Networks, A report to the Department of Energy and Climate Change,page94.

123
Section D: Space heating,hot water and cooling
Package Spaceheatingefficiency/CoP
Hot
water
efficiency/CoP
Maximumpenetration166
Maximumpenetration167
Startyearfor
maximuminstallation
rate168
Biomass CHP community heating
0.63182*0.9= 0.57 (gas to
delivered heat)
0.17 (gas to electrical energy)
0.63*0.9= 0.57
68%
(all households in
city centres and other
urban centres plus semi-detached houses, terraced
houses, and flats in higher
density suburban
areas)
27.2 2015
Geothermal community heating
1%
(estimate of total UK
households near sources of geothermal
heat)
0.5 2020
Large power station heat-off take district heating.
Types of power station within scope include energy from waste, coal CCS and gas CCS plants.
Electricity lost from thermal
electricity generation plants in a
ratio of 1 unit of electricity for every 7
units of heat supplied
(z-factor = 7).
Electricity lost from thermal
electricity generation plants in a
ratio of 1 unit of
electricity for every 7
units of heat
supplied (z-factor =
7).
11% after optimising Pathway X
power station locations.
14.0 Now
182FaberMaunsellAECOMandPoyryEnergyConsulting(April2009)The Potential and Costs of District Heating Networks, A report to the Department of Energy and Climate Change,page99.

124
Pathways to 2050
Table D12: Packages of cooling technologies
Package SeasonalEnergy
EfficiencyRating
(SEER)183forcooling
Conversion Maximumpenetration
(%UKcoolingdemand)
Startyearformaximum
installationrate
Electric air conditioner (old)
2.5184 Electricity to Coolth 100% Now
Electric air conditioner (new)
6185 Electricity to Coolth 100% Now
Absorption chiller
0.7 Heat to Coolth 68% Now
Solar thermalSolar thermal has been modelled separately from other heating technology packages. This is because, unlike the other packages modelled, in the UK solar thermal is incapable of supplying the whole annual heat demand of a building (although the development of inter-seasonal heat stores might make this possible for some buildings). As an approximation it is assumed that solar thermal installations would only occur in non-flat domestic buildings to help meet hot water demand. Table D13 summarises the different levels of ambition modelled for solar thermal. The conversion efficiency (solar energy to heat) is assumed to be 50%.
Table D13: Trajectories for solar thermal under four levels of change
Domesticsolarthermalinstalledaream2(average,perhousehold)
Trajectory 2007 2010 2015 2020 2025 2030 2035 2040 2045 2050
1 – – – – – – – – – –
2 – 0.1 0.2 0.3 0.4 0.5 0.70 0.8 0.9 1.0
3 – 0.2 0.6 0.9 1.3 1.6 2.0 2.3 2.7 3.0
4 – 0.4 1.1 1.8 2.5 3.2 3.9 4.6 5.3 6.0
183Thisistheratioofannualcoolingdemandtotheannualelectricalenergyrequiredtomeetit.Itrepresentstheaverageefficiencyofanairconditioner.
184Withintheexistingstock,theaverageairconditionerisestimatedtohavingacoolingCoPofapproximately2.5(Tuohy(2009)‘RobustLowCarbonBuildings’Building Research and InformationVolume37,Issue4,pages433-445,page436;BuildingResearchEstablishment(2000)Local Cooling, Global Warming? UK Carbon Emissions from Air-Conditioning in the Next Two Decades,page4).
185Tuohy(2009)‘RobustLowCarbonBuildings’Building Research and InformationVolume37,Issue4,pages433-445,page436.

125
Section E: Agriculture and land use
ContextThis section explores the emissions and energy produced by agriculture and land use in the UK. In 2007, agriculture and changes in land use were responsible for around 7% of UK greenhouse gas (GHG) emissions.186 This section uses four different scenarios or trajectories that describe possible changes in agriculture and land use in response to different policy directions. It considers the possible impacts of such changes on food and bioenergy production, as well as other environmental impacts.
Within this sector, it is important to consider the global impacts of agricultural and land use change in the UK. In a scenario where less food is produced domestically, there would be an inevitable increase in UK reliance on food imports, which would mean that products, and their associated emissions, are produced elsewhere and could increase the overall carbon impact of UK consumption. Increased global demand for food and bioenergy can also lead to deforestation and other serious land use impacts abroad. Exporting emissions in these ways would not help to tackle climate change.
Over the past 50 years, land use has remained relatively constant but has become more intense. In England over the last 20 years, an average of 0.05% of agricultural land has changed use each year.187 Land use change may occur as a result of a complex interaction of drivers. Climate change is likely to influence the frequency and severity of flooding and drought episodes, which will affect how agriculture adapts at the regional level, resulting in the adoption of new practices or changing the crops grown. Farmers will exploit opportunities offered by climate change as well as managing risks to their businesses. The availability and uptake of new technology will influence the ability of farmers and land managers to adapt to climate change, which will influence the rate of land use change.
Over the next 40 years, pressure on land is likely to increase because of the effects of climate change,188 rising global population and food demand, demand for renewable energy (including bioenergy and wind) and carbon sequestration and increasing demand for housing and leisure space. With limited available land in the UK for crops and livestock, it is important that the conflicting pressures on future land use and agriculture and the associated implications over the next 40 years are explored to assess and identify the possible conflicts and trade-offs between land use choices.
This section sets out four trajectories that explore the implications of an emphasis on a particular policy direction. One of the trajectories is essentially a no change trajectory where current trends continue. Unlike most other sectors discussed in this report,
186UKGHGInventory(2009)Annual Report for Submission under the Framework Convention on Climate Change.
187BasedonDepartmentforCommunitiesandLocalGovernmentLandUseChangestatisticshttp://www.communities.gov.uk/planningandbuilding/planningbuilding/planningstatistics/livetables/landusechange/andDefraAgriculturallanduseestimates,AUKtable3.1https://statistics.defra.gov.uk/esg/publications/auk/2008/excel.asp
188Forexample,onrainfalllevelsandsoilquality.

126
Pathways to 2050
these trajectories are presented as different futures rather than as four increasing levels of ambition. These trajectories are not intended to represent policy options for the future. Rather, they represent plausible futures in order to identify and explore the potential land use changes and associated emissions, and consequences for other sectors. The purpose of the 2050 Pathways Calculator, and of these component trajectories, is to explore the possibilities and trade-offs involved of meeting our legally binding target of reducing emissions by 80% by 2050. This call for evidence looks to stimulate expert debate and the submission of further evidence to refine the initial agriculture and land use assumptions made in the Calculator (some of which are detailed here) and improve the assessment of land use change, resulting emissions and other consequences.
Drivers and enablersThe trajectories described below explore the potential levels of emissions and energy that could be produced under a range of agriculture and land use scenarios. To calculate possible energy and emissions production this report examines the key drivers and enablers: agricultural emissions (including from livestock and soils); land use, land use change and forestry; and bioenergy (from crops as well as agricultural and silvicultural residues).189
Compared to other sectors of the economy there is much greater scientific uncertainty in estimating emissions from agriculture and land use and predicting the effects of changing practices and drivers. For example, the amount of N2O released from spreading fertiliser can depend on soil type, the weather, and when and how the spreading was done. The Government is working with the research community to improve the UK’s inventory of GHGs within the agriculture and land use sector so that our future policies are guided by the best evidence available and so farmers and land managers are properly credited for improvements in farming practice.
Agricultural emissions The agricultural sector emitted over 43 MtCO2e of greenhouse gases in 2007190 and reducing these emissions poses a particularly difficult challenge. Most other sectors can look to technological solutions that, to a large extent, do not yet exist within agriculture. For example, there is no technology that can prevent cows from emitting methane (one of the most potent greenhouse gases) through their biological processes. Agricultural emissions are likely to produce a higher proportion of the UK’s greenhouse gas emissions as the rest of the UK decarbonises. Without abatement, the Pathways illustrated in this report show that agricultural emissions could comprise up to one third of the UK’s total permitted emissions in 2050.
However, substantial reductions in emissions have already occurred. Between 1990 and 2007, total GHG emissions from UK agriculture fell by 20%, of which CH4 by 17%; N2O by 23%; and CO2 by 16%. Much of this reduction was driven by declines in livestock numbers. There has been a 12% reduction in breeding cow numbers in the UK over the
189GovernmentOfficeforScience/Foresight(2010)Land Use Futures: Making the most of land in the 21st centuryprovidesagoodsummaryofdrivers,aswellassuggestanapproachtoeffective,longterm,landusemanagement.
190UKGHGInventory(2009)Annual Reportfor Submission under the Framework Convention on Climate Change.Thisfigureexcludesemissionsfromenergyusebytheagriculturesector.

127
Section E: Agriculture and land use
past decade.191 Reform of Common Agricultural Policy direct payments (formerly paid per head of livestock), has reduced the artificial incentives to keep more stock than required. This trend may continue.
Agricultural emissions comprise emissions from enteric fermentation, manure and soil management (see Box E1). In developing the assumptions for the trajectories in this section, detailed modelling of historical time series data such as wheat and barley outputs and yields and livestock numbers and yields, has been undertaken, including a literature review of reports on the future direction of agricultural production.192 Some of the changes in yields are substantial but are based on evidence about genetic potential. Assumptions to 2018 are largely based on the FAPRI-UK agricultural models.193 Despite the uncertainties surrounding soil emissions, the trajectories for this section also make assumptions about the potential to reduce emissions through better tillage and more efficient use of fertilisers. Changes to the climate will also impact on crop production.
The English Climate Change Task Force, comprising the National Farmers Union, Country Landowners Association and Agricultural Industries Confederation has committed to voluntary action to reduce greenhouse gas emissions by three million tonnes of CO2 equivalent by 2020.194 An action plan to meet the 2020 target was published in 2010.195 The plan targets emission reductions from farm-level efficiency gains. All of the trajectories for 2050 in this section assume that the sector meets its 2020 emissions reduction commitments. The assumptions described focus primarily on the changes that could happen within the sector in the 2020-2050 period.
Box E1: Drivers and trends for different sources of agricultural emissions
Enteric fermentation
The overall contribution that enteric fermentation makes to greenhouse gas emissions depends on the number of livestock and the emissions per animal. Livestock numbers have been in historic decline. In the future, demand for dairy and red meat, the degree of Common Agricultural Policy liberalisation and the competitiveness of the UK livestock industry will be the key drivers influencing livestock numbers.
Emissions per animal depend on the species and the system in which the animal is being reared. Livestock rearing is highly diverse in the UK, ranging from intensive indoor systems with a high level of management and compound feeding to hill farming, where nutrition is provided mainly by the natural environment. The scope for reducing emissions in a diverse industry varies widely. It is possible to reduce emissions from enteric fermentation in livestock through
191http://www.defra.gov.uk/evidence/statistics/foodfarm/landuselivestock/junesurvey/results.htm192TheseincludeEnglishFarmingandFoodPartnerships(2005)A study of long-term trends affecting the
farming industry;EnglishFarmingandFoodPartnerships(2005)Partners for success – a farm regulation and charging strategy;andADAS-UK(2007)Baseline Projections for Agriculture and implications for emissions to air and water.
193Patton,Metal(2010)Projecting Greenhouse Gas Emissions from Agriculture in England, Wales, Scotland and Northern Ireland: A Methodology using the FAPRIUK Modelling System.
194TheEnglishtargetsarerelevanttotheUKasawhole.TheGovernmentandthedevolvedadministrationsareworkingtoensurethatthedifferentpolicyapproachestoreducingemissionsineachpartoftheUKbenefitfromsharedresearchanddevelopment.
195AgricultureIndustryGHGActionPlan:FrameworkforAction,10February2010.

128
Pathways to 2050
diet. There is also evidence that some feed additives may help reduce methane, but it may not always be economic or practical to use these in farm-level situations. Selective breeding or changes to lower emitting breeds could have a role, but breeding decisions need to take into account a wide range of criteria, including production efficiency and consumer demand.
A focus on efficiency and realising the genetic potential of livestock will help reduce emissions per unit of production. For example, by optimising feed rations and enhancing health and welfare, it may be possible to reduce the time it takes for livestock to reach a finishing weight, thus the emissions per kilo of meat produced could be minimised.
Assumed rates of decline in enteric emissions intensity differ between the four agriculture and land use trajectories, and are detailed in the 2050 Pathways Calculator.
Manure
Manure emissions will also be driven by the number of livestock and by the amount of manure produced per animal.
Manure produces CH4 emissions when allowed to decompose anaerobically, and also N2O emissions when applied to the land. By changing manure management practices, manure emissions could be reduced – options include better storage, improved timing of application of manure to the land, and greater use of anaerobic digestion plants. The potential abatement from uptake of these practices is currently unknown and research is under way. It should be noted that manure management can involve a cost for farmers to put in place covers for slurry stores and anaerobic digestion plants. Anaerobic digestion plants may yield a return in terms of power generation if the livestock unit is big enough to sustain it.
Soil
The dominant source of agricultural N2O emissions is the breakdown of fertilisers and manures applied to the soils (33%), with significant contributions from indirect sources, notably from leaching and runoff (26%). Significant reductions to agricultural N2O emissions have been achieved since 1990,196 largely through more efficient use of fertilisers and reduced application to grasslands.197 The current methodology employed to estimate emissions of N2O from soil in the UK inventory is imprecise – soil characteristics, land use and fertiliser type are not currently differentiated and calculations are based on total tonnes of nitrogen applied. There is therefore much uncertainty around soil emissions. Approximate assumptions have been made within the trajectories for this section, but this remains an area where further work is needed to improve the analysis.
196Areductionfrom33to25MtofN2OinCO2equivalentfrom1990–2007(approximately24%).UKGHGInventory(2009)Annual Report for Submission under the Framework Convention on Climate Change.
197Overthelast10yearslargereductionsinapplicationratesofmineralNtograsslandshavebeenrecorded,whileapplicationratestoarablecropsremainedroughlyconstant.Source:Thomas(2008)TheBritish survey of fertiliser practice: fertiliser use on farm crops for crop year 2008,Defra,York,UK.

129
Section E: Agriculture and land use
Land use, land use change and forestry (LULUCF)Carbon sequestered within the soil may be released when it is disturbed. Land use and land use change is therefore associated with CO2 emissions, which can be substantial in organic soils. Some sources argue that soil emissions from planting short rotation coppice (SRC) crops on permanent grassland can, in certain circumstances, cancel out the emissions saved by burning biomass instead of fossil fuels.198 In contrast, SRC crops planted on land previously used for food crops can help to increase carbon stores, as the soil will no longer be tilled and fertilised every year (though if this leads to greater agricultural imports then this might means there is no positive impact on global soil emissions). There is also currently significant uncertainty about the contribution that grasslands and mixed farming methods can make to meeting the sector’s future emissions targets through soil carbon sequestration.
UK forests currently sequester more carbon than they emit, resulting in a net removal of CO2 from the atmosphere. However, UK forests are projected to soon become net emitters of CO2 as the large number of trees planted between the 1950s and 1980s mature and become available for harvesting.
Simplified estimates of LULUCF emissions are included in this report. More detailed analysis of LULUCF emissions up to 2050 will be developed during 2010.199 Land use change emissions from land converted to settlements have been assumed to remain constant.200 Emissions from land remaining and converted to cropland and grassland have been assumed to vary relative to the overall area of land assigned to these uses.201 Emissions from land converted to SRC crops have been assumed to be zero due to the uncertainties in this area.202 The Forestry Commission has provided estimates up to 2050 for forestry emissions under four different tree planting scenarios.
Domestic bioenergyThis section looks at specially grown bioenergy crops as well as agricultural and silvicultural by-products collected for bioenergy, including manure, straw and woodland residues (see Box E2).
The amount of energy available from bioenergy crops in the years to 2050 will be determined by the amount and type of land given over to the crops (itself determined by relative and absolute crop prices), as well as any assumed increases in yield. There is potential to produce a relatively significant amount of bioenergy domestically. However, above a certain level of production,203 bioenergy crops will begin to displace food
198EnvironmentAgency(2009)Minimising greenhouse gas emissions from biomass energy generation.199CentreforEcologyandHydrologyanalysisforDECC(forthcoming).200Therateofconversionoflandtosettlements(17khaperyear)followsthehistoricalaverageandis
assumedtoremainconstantoutto2050.Therefore,thelandusechangeemissionshavealsobeenassumedtoremainconstant.Since1990,emissionsfromlandchangedtosettlementshavedecreasedbyjustover10%,(UKGHGInventory(2009)Annual Reportfor Submission under the Framework Convention on Climate Change).Therefore,thisestimatemaybeconservative.
201UptohalfofLULUCFemissionsresultfromhistorical(pre-1990)landusechange.Therearesignificantannuallandusechangestoandfromcroplandandgrassland.Itisassumedthatasareasofcroplandand/orgrasslanddecline,theseannualchangesandwillalsoreduce.
202Forexample,E4Techstatesthatenergycropsplantedonpasturelandareassumedtobenotillandthereforenottohavelandusechangeemissions.(E4Tech(2009)Biomass supply curves for the UK.)
203Mostsourcesagreethat350khaormorecouldbegiventobioenergyproductionwithlittleornoimpactonfoodproduction.Forexample,RuralEconomyandLandUse(2009)Assessing the social, environmental and economic impacts of increasing rural land use under energy crops.

130
Pathways to 2050
production. This could increase net imports of food to the UK, increase the carbon footprint of UK food consumption and impact on global food prices. Bioenergy crop production can also have wider environmental impacts: on biodiversity, water resources, the visual landscape and through land use change emissions.
Box E2: Drivers and trends for different bioenergy sources
Bioenergy crops
The levels of bioenergy produced from specially grown crops will depend on the amount and type of land allocated to this purpose and on the yield per hectare, as well as the efficiency of the chosen energy conversion technology (see Section F of this report). This report looks at oil seed and starch grain crops (for example, oil seed rape and wheat) and other energy crops (primarily SRC and miscanthus). It is assumed that SRC and miscanthus crops are planted on the vast majority of land dedicated to bioenergy, and that farmers are incentivised to make a long term commitment through longer-term contracts. It is also assumed that some oil seed and starch grain crops continue to be used for bioenergy up to 2050, because some farmers could continue to be reluctant to commit to the longer harvesting cycles of SRC crops.
Yield increases of up to 1.5% pa are assumed on the basis that research is likely to identify higher yielding strains.204 Other factors such as weather, nutrient input, incidence of pests and disease and breeding will also contribute to changes in yield.
Manure
Energy available from manure will depend on the amount of manure produced and the proportion of this manure that is collected, as well as the efficiency of the energy conversion process. The amount of manure produced will be driven by the number of livestock and horses, the amount of manure produced per animal and the feeding regime.
At least 50% of manure produced is dropped in the fields during grazing. It is assumed that the maximum proportion of manure that can be collected for anaerobic digestion is 45%.205
Straw
Energy available from straw will depend on the amount of land cropped, the proportion of straw collected for energy and the quality of the feedstock. Straw can usefully be recycled as livestock bedding or ploughed back into the fields, however it is estimated that an average of three oven dried tonnes (odt) per hectare of straw per year are potentially available for energy use at present, without detracting from these uses.206 This also allows for the logistics of collection. The level of available straw is assumed to rise or fall with conventional cereals production.
204E4Tech(2009)Biomass supply curves for the UK,commissionedbyDECC,assumeannualincreasesof1-2%dependingonscenario.Whenextendingthetrajectoryoutto2050,amoremoderate1.5%perannumhasbeenusedasthemaximum.
205Forwetmanures,E4Techsupplycurvesassumethat1%iscurrentlyusedasafeedstockforAD,risingto10%in2010,50%in2015and100%in2020.Wetmanureavailableislessthan50%ofthetotalproduced.Therefore,45%isassumedtobethemaximumproportionoftotalmanuresenttoAD.Source:E4Tech(2009)Biomass supply curves for the UK..
206DTI,DfT,Defra(2007)UK Biomass Strategy,AnnexA.

131
Section E: Agriculture and land use
Woodland residues
This report assumes that forests are generally not grown for the specific purpose of producing wood for biomass. However, it assumes that thinnings and other wood residues from managed forests can be collected and used to produce energy, predominantly in the form of wood pellets or woodchip. The amount of wood residue available will again depend on the area of managed woodland and the proportion of residues collected. It is assumed that a higher proportion of newly planted forest will be managed woodland, and hence the proportion of harvesting residues used as a source of bio-energy will be higher.207 The energy content of woody species varies significantly, as does the energy required to convert it for use as a bioenergy feedstock.208
The trajectoriesFour trajectories have been developed for agriculture and land use in order to stimulate debate and a call for further evidence to develop 2050 scenarios further. These are summarised in Table E1.209
Table E1: Summary of the four agriculture and land use trajectories
Trajectory Description
A Current trends and drivers in agriculture and land use largely continue
B A trajectory where there is a policy priority to increase food production and the least focus on bioenergy crops and forestry
C Explores the possibility of securing lower emissions from the agriculture sector through significant investment in technology and knowledge transfer, as well as an increasing emphasis on bioenergy crop production and woodland creation
D A trajectory where there is a substantial policy priority to increase domestic bioenergy production, and carbon sequestration through extensive woodland creation
Figures E1, E2 and E3 illustrate the agricultural emissions, LULUCF emissions and bioenergy produced respectively of the four trajectories described in this section. The assumptions behind the four trajectories (A, B, C and D) are detailed in the 2050 Pathways Calculator, some of which are also described below.
207Readetal(2009)Combating Climate Change – A role for UK ForestsandForestryCommission(2007)A Woodfuel Strategy for England,bothsetoutplansforincreasedwoodlandresiduecollectionwithinnewandexistingwoodlands.
208TheForestryCommissionproducedestimatesoftheamountofadditionalwoodfuelthatcouldbeproducedfromnewwoodland.Assumptionsaboutwoodlandresiduesperhectare,fordifferenttypesoftreeandwoodlandmanagementsystem,areembeddedwithinthese.
209Thetrajectoriesweredetailedfollowing:detailedmodellingonthebasisofhistoricaltimeseriesdata(eg,wheatandbarleyoutputsandyields,livestocknumbersandyields),aliteraturereviewofreportsonthefuturedirectionofagriculturalproductionandexpertoptionwithinDefrathroughmeetingsandaworkshop.

132
Pathways to 2050
Trajectory C would result in the lowest agricultural greenhouse gas emissions (see Figure E1). However, by 2050, agricultural emisisons have fallen by only 26% from the 2007 baseline. This underlines the challenges of reducing emisisons in this sector where, despite assumed significant investment in technology to reduce emissions, the abatement potential of diverse and complex biological systems is currently believed to be limited (compared to many other sectors).
Figure E1: Agricultural emissions produced in the four trajectories
� Trajectory A
� Trajectory B
� Trajectory C
� Trajectory D0
10
20
30
40
50
2007
2040
2045
2035
2030
2025
2020
2015
2010
2050
Agri
cult
ural
em
issi
ons
(MtC
O 2e)
The shape of the LULUCF emissions trajectories (see Figure E2) illustrate a decline in removals of atmospheric CO2 through sequestration in growing forest biomass during the first part of the period. This is a result of the marked decline in afforestation since the 30,000 ha per year planting rates experienced in the 1970s to 1980s, coupled to these large areas of woodland approaching maturity and harvest. The current, low, rates of woodland creation will result in a rapid decline in the level of abatement provided by forest land up to 2020. This pattern is broadly the same across the devolved administrations, but is particularly marked in Scotland as a result of the large-scale planting from the 1950s to 1980s. High tree planting rates within trajectories C and D lead to increased removels through forestry from 2030, with trajectory D eventually bringing the LULUCF sector as a whole back down to negative emissions.
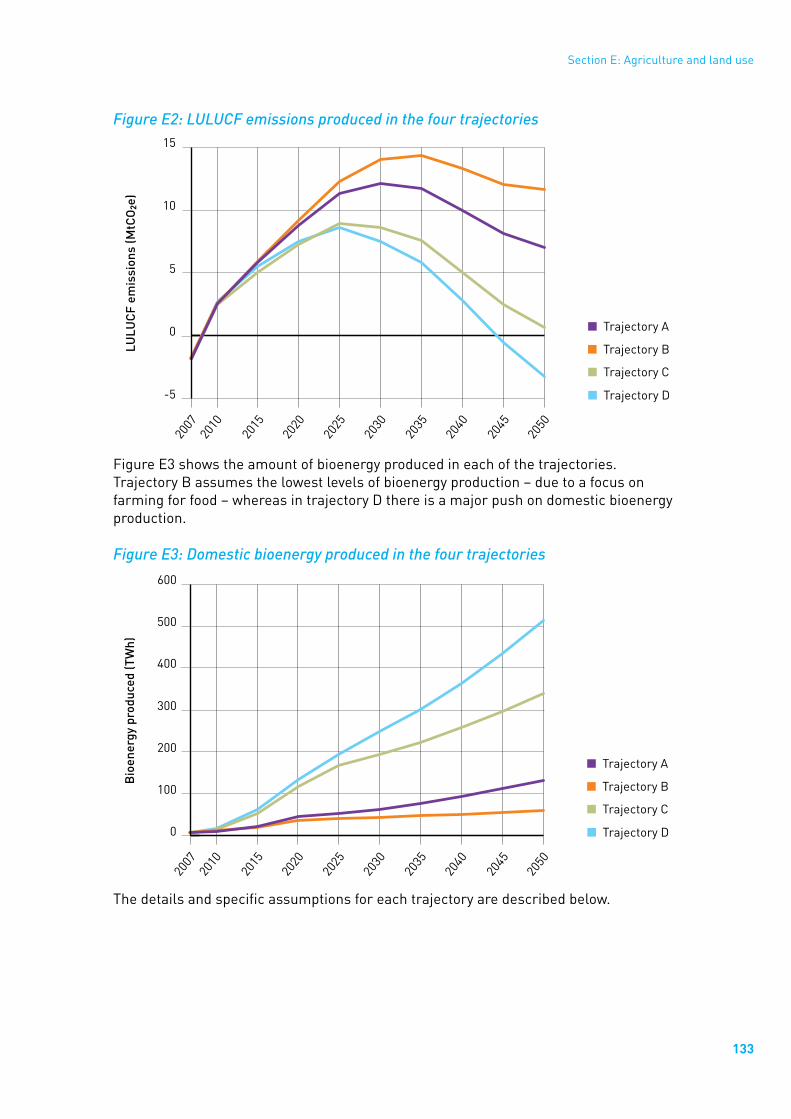
133
Section E: Agriculture and land use
Figure E2: LULUCF emissions produced in the four trajectories
� Trajectory A
� Trajectory B
� Trajectory C
� Trajectory D-5
0
5
10
15
2007
2040
2045
2035
2030
2025
2020
2015
2010
2050
LULU
CF e
mis
sion
s (M
tCO
2e)
Figure E3 shows the amount of bioenergy produced in each of the trajectories. Trajectory B assumes the lowest levels of bioenergy production – due to a focus on farming for food – whereas in trajectory D there is a major push on domestic bioenergy production.
Figure E3: Domestic bioenergy produced in the four trajectories
� Trajectory A
� Trajectory B
� Trajectory C
� Trajectory D0
100
200
300
400
500
600
2007
2040
2045
2035
2030
2025
2020
2015
2010
2050
Bio
ener
gy p
rodu
ced
(TW
h)
The details and specific assumptions for each trajectory are described below.

134
Pathways to 2050
Trajectory A Trajectory A describes a scenario where current trends and drivers in agriculture and land use largely continue.
Agriculture
This trajectory describes a scenario where the agriculture sector meets its 2020 emissions reductions target.210 Improvements in the efficiency of livestock and crop production result in a reduction of emissions per production unit, improving returns on-farm and realising the genetic potential of crops and livestock. However, some of these improvements flatten out later in the period. Population increases lead to a rise in demand for food. While there may be a modest shift towards reduced consumption of red meat and dairy products in a proportion of the population, overall demand remains high and export opportunities for red meat continue, or may increase as the industry positions itself to be a more competitive trading entity. Livestock numbers remain constant from 2007 levels. UK agriculture remains competitive and production keeps pace with the increase in UK population, with the proportion of consumed food that is produced domestically remaining constant. Figure E4 illustrates the breakdown of agricultural emissions in trajectory A.
Figure E4: Trajectory A agricultural emissions211
0
10
20
30
40
50
2007
2045
2030
2020
Agri
cult
ural
em
issi
ons
(MtC
O2e
)
� Fuel combustion
� Soil
� Manure
� Enteric fermentation
2050
2040
2035
2025
2015
2010
The following specific agricultural assumptions are made:
●● Livestock numbers remain constant.
●● Enteric emissions intensity per animal declines by 5% by 2050 as a result of improved animal nutrition, and other husbandry improvements that contribute to livestock meeting their genetic potential (optimising the emissions produced per production unit), for example effective management of common endemic diseases.
210Areductioninemissionsfromagricultureof3MtCO2e.211Excludingnetforestryemissions.

135
Section E: Agriculture and land use
●● Manure emissions intensity declines by 10% by 2050, through the implementation of improvement of manure management and application on-farm. Manure produced per animal increases by 0.2% per year due to improved nutrition that is supporting yield increases. And 25% of manure is collected for anaerobic digestion from 2020 onwards.212
●● Soil N2O emissions decline by 10% by 2050, through continued improvement in nutrient management practices on farm.
●● Crop production efficiency continues to increase with crop-breeding, soil management and pest control developments keeping up with climate change, with steadily incremental improvements in yields.
Bioenergy
As the area used for growing food crops declines by around 550kha by 2050, this land is instead used to grow bioenergy crops. Some temporary grassland (620 kha) is also converted. Bioenergy is also produced from the collection of manure, straw and woodland residues, with up to a quarter of these by-products used for energy by 2050. Figure E5 shows the amounts and breakdown of bioenergy in trajectory A.
Figure E5: Trajectory A bioenergy produced
0
30
60
90
120
150
2007
2045
2030
2020
Bio
ener
gy p
rodu
ced
(TW
h)
� Wet biomatter and waste
� Dry biomatter and waste
� Energy crops (second generation)
� Energy crops (first generation)
2050
2040
2035
2025
2015
2010
The following specific bioenergy assumptions are made:
●● Almost 1.2 million hectares (5% of UK) are used for growing bioenergy crops by 2050.213 The vast majority of these are woody crops such as short rotation willow. Yields increase by 1% per annum to 15 odt per hectare by 2050.
●● Proportions of manure, straw and woodland residues collected rises to 15-24%.
212ThisassumescollectionratesathalfthecollectionrateintheE4Techsupplycurves(2009).213EuropeanEnvironmentAgency(2006)How much bioenergy can Europe produce without harming the
environment?assumesthatby2020,theUKwillhave1.1mhectaresavailableforbioenergycropproduction.ThisfigureisquotedwithintheUKBiomassStrategy(DEFRA,2007).

136
Pathways to 2050
Land use
Figure E6 illustrates the land use changes that occur by 2050.
Figure E6: Trajectory A land use change
0
5
10
15
20
25
2007
2045
2030
2020
Land
use
(Mha
)
� Grassland, for 2nd generation energy crops
� Arable, for 2nd generation energy crops
� Arable, for 1st generation energy crops
� Arable, for food crops
2050
2040
2035
2025
2015
2010
� Other
� Forests
� Settlements
� Grassland, for livestock and fallow
Changesby2050
Food crops 550 kha of cropland changes to produce bioenergy instead of food. Overall cropland area remains constant.
Grassland Decreases by 1.3 million hectares which includes most temporary grasslands and other under-used pastures.
Forest Increases by 596 kha (15 kha per year)214
Settlement215 Increases by 731 kha (17 kha per year)
Trajectory BTrajectory B describes a scenario where there is a policy priority to increase food production and the least focus on bioenergy crops and forestry. It explores the highest levels of emissions that the agriculture and land use sector might produce.
Agriculture
Trajectory B assumes that UK food production outpaces UK population growth. This is likely to be driven by rising demand for food globally and by the UK’s comparative advantage in this sector. Food production remains the focus and there is little incentive to produce bioenergy, either from crops or agricultural by-products. Diets do not change much and demand for meat remains high. There is very little land use change.
214Thisassumesthatconventionallymanagedbroadleafandconiferwoodlandisplanted,withbroadleaf:coniferratiosremainingconstant.
215Settlementsincreaseinlinewithhistoricaltrends(assetoutintheGHGInventory,2009).

137
Section E: Agriculture and land use
Livestock numbers increase and emissions per animal reduce by only a little. Yield increases are high (up 85% by 2050), but continued use of fertilisers means that soil emissions improvements flatten out after 2020. Figure E7 illustrates the breakdown of agricultural emissions in trajectory B.
Figure E7: Trajectory B agricultural emissions216
0
10
20
30
40
50
2007
2045
2030
2020
Agri
cult
ural
em
issi
ons
(MtC
O2e
)
� Fuel combustion
� Soil
� Manure
� Enteric fermentation20
50
2040
2035
2025
2015
2010
The following specific agricultural assumptions are made:
●● Livestock numbers increase by 0.2% a year, a total of 10% by 2050.
●● Enteric emissions intensity per animal declines by 5% by 2050, as in trajectory A.
●● Manure emissions intensity decline by 5% by 2030 then flattens out. Manure per animal increases by 0.5% per year due to yield increases. And 25% of manure is collected for anaerobic digestion from 2020 onwards.217
●● Soil N2O emissions decline by 8% by 2020, through continued improvement in nutrient management practices on farms, then flatten out.
●● Crop production efficiency continues to increase with crop-breeding, soil management and pest control developments keeping up with climate change, with steadily incremental improvements in yields. Food crop yields grow at a faster rate than in trajectory A.
Bioenergy
Figure E8 shows the amounts and breakdown of bioenergy in trajectory B.
216Excludingnetforestryemissions.217ThisassumescollectionratesathalfthecollectionrateintheE4Techsupplycurves(2009).
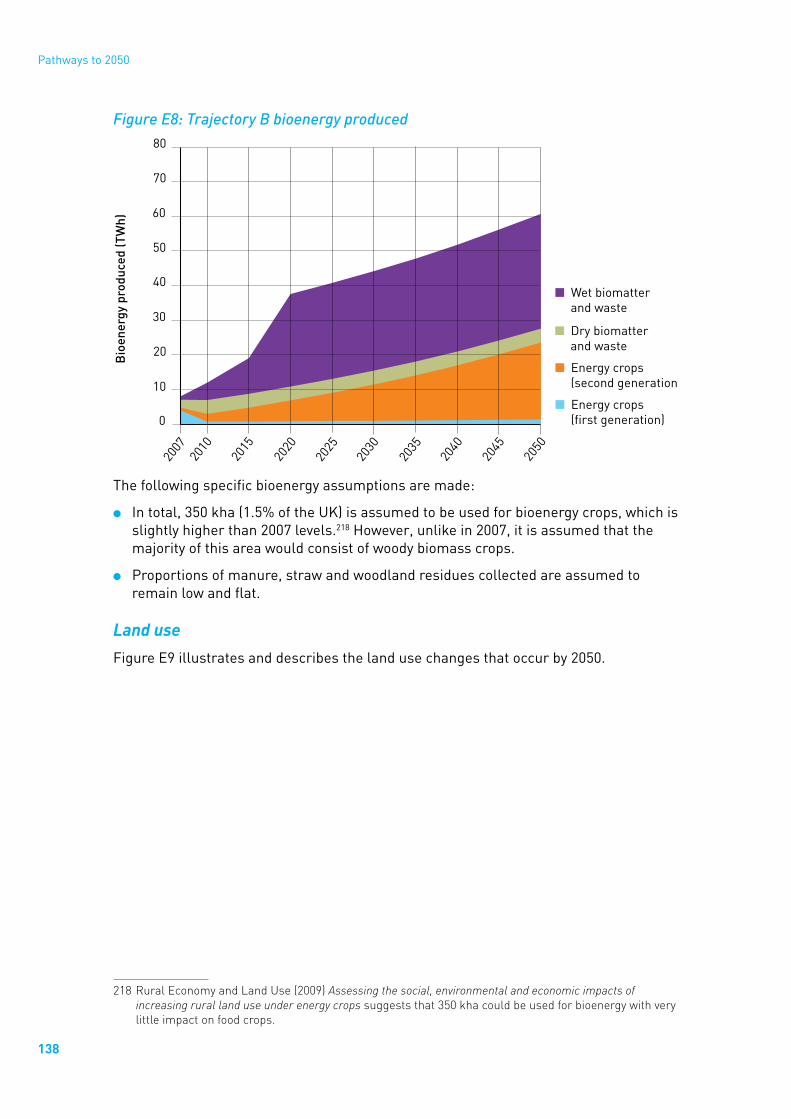
138
Pathways to 2050
Figure E8: Trajectory B bioenergy produced
0
10
20
30
40
50
60
70
80
2007
2045
2030
2020
Bio
ener
gy p
rodu
ced
(TW
h)
� Wet biomatter and waste
� Dry biomatter and waste
� Energy crops (second generation)
� Energy crops (first generation)
2050
2040
2035
2025
2015
2010
The following specific bioenergy assumptions are made:
●● In total, 350 kha (1.5% of the UK) is assumed to be used for bioenergy crops, which is slightly higher than 2007 levels.218 However, unlike in 2007, it is assumed that the majority of this area would consist of woody biomass crops.
●● Proportions of manure, straw and woodland residues collected are assumed to remain low and flat.
Land use
Figure E9 illustrates and describes the land use changes that occur by 2050.
218RuralEconomyandLandUse(2009)Assessing the social, environmental and economic impacts of increasing rural land use under energy cropssuggeststhat350khacouldbeusedforbioenergywithverylittleimpactonfoodcrops.

139
Section E: Agriculture and land use
Figure E9: Trajectory B land use change
0
5
10
15
20
2520
07
2045
2030
2020
Land
use
(Mha
)
� Arable, for food crops
2050
2040
2035
2025
2015
2010
� Other
� Forests
� Settlements
� Grassland, for livestock and fallow
� Grassland, for 2nd generation energy crops
� Arable, for 2nd generation energy crops
� Arable, for 1st generation energy crops
Changesby2050
Food crops Land for food crops and overall cropland remains constant
Grassland Decreases by 767 kha by 2050
Forest Increases by 294 kha (8.36 kha per year)219
Settlement220 Increases by 731 kha (17 kha per year)
Trajectory CTrajectory C explores the possibility of securing lower emissions from the agriculture sector through significant investment in technology and knowledge transfer, as well as an increasing emphasis on bioenergy crop production and woodland creation.
Agriculture
Trajectory C assumes high levels of investment in research and development to improve livestock and crop genetics and management systems, resulting in improvements in production efficiency and agricultural emissions. Technological advance results in declining enteric emissions from livestock and minimisation of soil emissions of N2O. Manure emissions decline by more than 90%, assuming that almost all manure decomposes aerobically on the land, or is collected for anaerobic digestion.
Livestock numbers decrease, partly in response to production efficiency being optimised due to uptake of new technologies resulting in yield improvements, and partly because demand for red meat and dairy products decreases as a result of a consumer shift to healthier diets. Land for food crops decreases by 0.9 million hectares
219Forestplantingratecontinuescurrenttrends.Thisassumesthatconventionallymanagedbroadleafandconiferwoodlandisplanted,withbroadleafconiferratiosremainingconstant.
220Settlementsincreaseinlinewithhistoricaltrends(assetoutintheGHGInventory,2009).

140
Pathways to 2050
from 2007, although overall food production still increases due to increasing yields (which rise 1.1% per year). This cropland is instead used to grow bioenergy crops. 1.9 million hectares of predominantly temporary grassland is also converted to bioenergy crop production and forestry by 2050. Figure E10 illustrates the breakdown of agricultural emissions in trajectory C.
Figure E10: Trajectory C agricultural emissions221
0
10
20
30
40
50
2007
2045
2030
2020
Agri
cult
ural
em
issi
ons
(MtC
O2e
)
� Fuel combustion
� Soil
� Manure
� Enteric fermentation
2050
2040
2035
2025
2015
2010
The following specific agricultural assumptions are made:
●● Livestock numbers decrease by 10% by 2050.
●● Enteric emissions intensity per animal declines by 15% by 2050 as a result of significant advances in technology, breeding, disease control and improved animal nutrition.
●● Manure emissions intensity declines by 15% by 2050, through the implementation of improvement of manure management and application technologies on-farm. Manure produced per animal increases by 0.2% per year due to improved nutrition that supports yield increases. And 45% of manure is collected for anaerobic digestion from 2020.222
●● Soil N2O emissions decline by 15% by 2050, through improvement in nutrient management and application technologies on-farm.
●● Crop production efficiency continues to increase with crop-breeding, soil management and pest control technologies keeping up with climate change.
221Excludingnetforestryemissions.222ThisassumescollectionratesinlinewiththecollectionrateintheE4Techsupplycurves(2009).

141
Section E: Agriculture and land use
Bioenergy
Trajectory C also assumes an increasing emphasis on bioenergy and high rates of woodland creation. Figure E11 shows the amounts and breakdown of bioenergy in trajectory C.
Figure E11: Trajectory C bioenergy produced
0
50
100
150
200
250
300
350
2007
2045
2030
2020
Bio
ener
gy p
rodu
ced
(TW
h)
� Wet biomatter and waste
� Dry biomatter and waste
� Energy crops (second generation)
� Energy crops (first generation) 20
50
2040
2035
2025
2015
2010
The following specific bioenergy assumptions are made:
●● By 2050, 2.4 million hectares (10% of the UK) are used to grow bioenergy crops.223 This assumes that bioenergy crops take the place of some food crops as yield increases allow the area cropped to decline. By 2050, 1.5 million hectares of arable cropland plus 0.9 million hectares of temporary grassland and other under-used land are used for growing bioenergy crops.
●● SRC yields increase by 1.5% per year, up to 19 odt per hectare by 2050.224
●● Maximum proportions of manure (45%), straw (all available) and woodland residues (80%) are collected from 2030.
Land use
Figure E12 illustrates and describes the land use changes that occur by 2050.
223E4TechBiomassSupplyCurves(2008)assumeyieldincreasesofupto2%perannum.Thereporttakesamoreconservativeassumption,of1.5%perannumbutappliesitforalongerperiod.2.4millionhectaresareassumedtobeavailableinforthcomingresearchbytheEnergyTechnologiesInstitute(ETI).Thefollowingreportcalculatesthatover3millionhectaresoflandinEnglandaresuitableformiscanthusgrowth–LovettAetal(2009)Land Use Implications of Increased Biomass Production Identified by GIS-Based Suitability and Yield Mapping for Miscanthus in England.
224Baseline2ndgenerationyieldsof10odtperhectareisaconservativeinterpretationofyieldaveragessetoutinBauen,Aetal(2009)Modelling supply and demand of bioenergy from short rotation coppice and miscanthus in the UK

142
Pathways to 2050
Figure E12: Trajectory C land use change
0
5
10
15
20
2520
07
2045
2030
2020
Land
use
(Mha
)
� Arable, for food crops
2050
2040
2035
2025
2015
2010
� Other
� Forests
� Settlements
� Grassland, for livestock and fallow
� Grassland, for 2nd generation energy crops
� Arable, for 2nd generation energy crops
� Arable, for 1st generation energy crops
Changesby2050
Food crops Overall cropland area remains constant. 1.2 mha of food cropland changes to bioenergy.
Grassland Decreases by 1.7 mha.
Forest Increases by 1 mha (23 kha per year)225
Settlement226 Increases by 731 kha (17 kha per year)
Trajectory D Trajectory D involves a substantial policy priority to increase domestic bioenergy production, and carbon sequestration through extensive woodland creation. The amount of land used to grow bioenergy crops rises to almost 4.2 million hectares by 2050. This is almost equivalent to the area of land currently used to grow food crops. An ambitious expansion in woodland coverage also means that trajectory D involves dramatic land use change. 30% of existing grassland is converted to either bioenergy crops, such as SRC or woodland and this drives reductions in livestock numbers.
Agriculture
30% of land currently used for food crops switches to bioenergy crop production. As in trajectory C, by 2050 almost all agricultural by-products are collected and turned into energy. Yield increases maximise levels of bioenergy and minimise impacts on food
225Forestisplantedat23.2khaperyear,asoutlinedinReadetal(2009)Combating Climate Change – A role for UK Forests.Thebreakdownoftreetypesalsofollowsthisreport,including1500ha/yrenergyforestsinEngland;theremainderconventionallymanagedwoodland(coniferandbroadleaf),includingbothmanaged‘farmwoodland’andnativewoodlandmanagedforbiodiversity(andnotwoodfuelortimberproduction).
226Settlementsincreaseinlinewithhistoricaltrends(assetoutintheGHGInventory,2009).
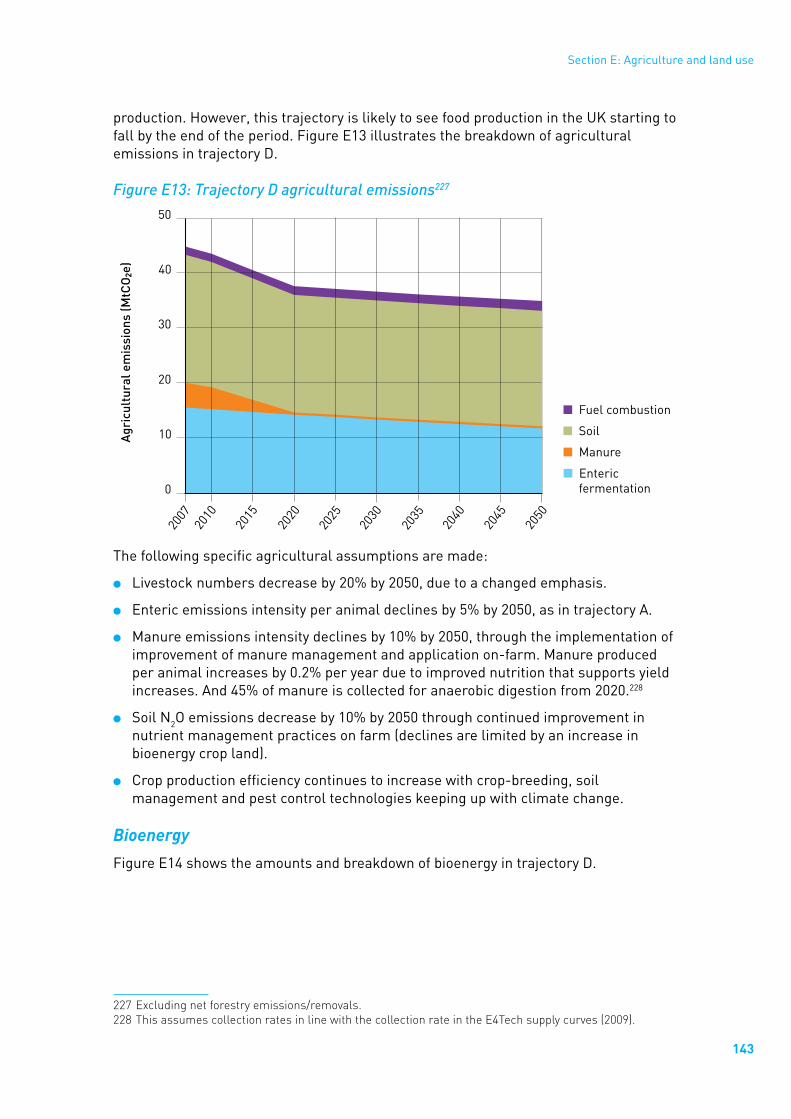
143
Section E: Agriculture and land use
production. However, this trajectory is likely to see food production in the UK starting to fall by the end of the period. Figure E13 illustrates the breakdown of agricultural emissions in trajectory D.
Figure E13: Trajectory D agricultural emissions227
0
10
20
30
40
50
2007
2045
2030
2020
Agri
cult
ural
em
issi
ons
(MtC
O 2e)
� Fuel combustion
� Soil
� Manure
� Enteric fermentation
2050
2040
2035
2025
2015
2010
The following specific agricultural assumptions are made:
●● Livestock numbers decrease by 20% by 2050, due to a changed emphasis.
●● Enteric emissions intensity per animal declines by 5% by 2050, as in trajectory A.
●● Manure emissions intensity declines by 10% by 2050, through the implementation of improvement of manure management and application on-farm. Manure produced per animal increases by 0.2% per year due to improved nutrition that supports yield increases. And 45% of manure is collected for anaerobic digestion from 2020.228
●● Soil N2O emissions decrease by 10% by 2050 through continued improvement in nutrient management practices on farm (declines are limited by an increase in bioenergy crop land).
●● Crop production efficiency continues to increase with crop-breeding, soil management and pest control technologies keeping up with climate change.
Bioenergy
Figure E14 shows the amounts and breakdown of bioenergy in trajectory D.
227Excludingnetforestryemissions/removals.228ThisassumescollectionratesinlinewiththecollectionrateintheE4Techsupplycurves(2009).

144
Pathways to 2050
Figure E14: Trajectory D bioenergy produced
0
100
200
300
400
500
60020
07
2045
2030
2020
Bio
ener
gy p
rodu
ced
(TW
h)
� Wet biomatter and waste
� Dry biomatter and waste
� Energy crops (second generation)
� Energy crops (first generation)
2050
2040
2035
2025
2015
2010
The following specific bioenergy assumptions are made:
●● Almost 4.2 million hectares (20% of UK) are used for growing bioenergy crops.229 100kha continues to be used for starch grain or oil seed bioenergy crops and the rest grows energy crops such as SRC or miscanthus.
●● SRC yields increase by 1.5% per year, up to 19 odt per hectare by 2050.230
●● Maximum proportions of manure (45%), straw and woodland residues (80%) are collected from 2030.
Land use
Figure E15 illustrates the land use changes that occur by 2050.
229Assessmentoftheavailabilityof‘marginal’and‘idle’landforbioenergycropproductioninEnglandandWales(FERAandADASforDECC,December2009)statesthatupto10.25millionhectaresoflandwasidentifiedinEnglandandWalesasbeingpotentiallyavailableforbioenergycropping(excludinggrade1land).However,theenvironmentalandlandscapeimpactsandtheconsequencesforfoodproductionhaveledtotheassumptionofa4.2millionhectarehighscenario.
230Baseline2ndgenerationyieldsof10odtperhectareisaconservativeinterpretationofyieldaveragessetoutinBauen,Aetal(2009)Modelling supply and demand of bioenergy from short rotation coppice and miscanthus in the UK.

145
Section E: Agriculture and land use
Figure E15: Trajectory D land use change
0
5
10
15
20
2520
07
2045
2030
2020
Land
use
(Mha
)
� Arable, for food crops
2050
2040
2035
2025
2015
2010
� Other
� Forests
� Settlements
� Grassland, for livestock and fallow
� Grassland, for 2nd generation energy crops
� Arable, for 2nd generation energy crops
� Arable, for 1st generation energy crops
Changesby2050
Food crops 1.2 m ha of food cropland given over to bioenergy. Overall cropland area remains constant.
Grassland Decreases by 4m ha. This involves the conversion of a significant proportion of permanent grassland.
Forest Increases by 1.4 m ha (34kha per year)231
Settlement232 Increases by 731 kha (17kha per year)
ConclusionsIt should be emphasised that the four trajectories described in this section are not intended to represent policy options. In order to explore future abatement potential from different land use and land management practices, which are inherently complex, it is necessary to explore scenarios that are significantly different from each other to identify key implications for this and other sectors in the run up to 2050. It is important to explore scenarios that involve dietary change or reductions in livestock numbers or food crop production areas (though offset to varying degrees through increases in yields) through a modelling process to inform future debate about the contribution that potential shifts in trends can make to reducing greenhouse emissions, against an increasing population, a finite land surface area and where the ability to produce food in certain regions will be affected by climate change.
It should also be recognised that there is significant uncertainty about the contribution of different components of agriculture and land use change to the release of greenhouse gases. While agriculture releases a disproportionate amount of nitrous
231ThebreakdownoftreeandforesttypesisaspertrajectoryC,butscaledupproportionally.232Settlementsincreaseinlinewithhistoricaltrends(assetoutintheUKGHGInventory,2009).

146
Pathways to 2050
oxide and methane compared to other sectors of the UK economy, they are an inevitable consequence of biological processes such as enteric fermentation and manure production in ruminant livestock, and of the use of fertilizers, although the levels of such greenhouse gases can be reduced to some extent through various practices. This uncertainty is being addressed through research to improve this part of the greenhouse gas inventory.
The trajectories illustrate that UK land area has a finite capacity to deliver a number of beneficial products – food, bioenergy and carbon sequestration. These cannot be considered in isolation to other important benefits, including landscape and biodiversity. A reduction in area dedicated to food production in favour of bioenergy increases reliance on food imports in order to sustain an increasing population, which could result in UK export of emissions if imported food cannot be produced efficiently. This has not been considered in detail in these trajectories, but does require further quantification and modelling in order to explore the implications.
While there is clearly scope to realise significant improvements in efficiencies in production to reduce emissions per unit of production, the initial analysis in this section suggests that the scope to reduce emissions in the agriculture and land use sectors may be limited compared to other sectors. This could mean that the proportion of UK emissions from agriculture is likely to increase towards 2050. The 2050 Pathways Calculator shows that this could mean agriculture makes up a significant proportion of allowed emissions in 2050. However, since this is based on incomplete data sets, it is important that understanding of this sector and abatement potential should be refined. The trajectories set out in this section are a useful starting point for inviting expert input via this call to evidence to improve the evidence base and refine input data, assumptions and methodologies before broadening the debate.

147
Section F: Bioenergy and waste
Bioenergy – contextBioenergy is a flexible resource, which through various conversion processes can be applied to meet a variety of types of energy demand, including transport, heat or power. However, bioenergy resources are limited, and the precise level of their future availability is uncertain. Deciding how best to use limited bioenergy resources is influenced in part by the comparative efficiency of the conversion processes which are used – minimising energy losses is clearly desirable. Another important factor is the relative value to the wider energy system of having bioenergy in one form or another. This latter factor will be influenced by developments elsewhere in the energy system. This section explains the framework through which the various possible uses of bioenergy were explored, and which led to four different types of choice in the 2050 Pathways Calculator in addition to the related choice in Section E regarding the amount of land to give over to bioenergy crops and woodland. This section does not set out a definitive ‘best’ use of bioenergy, which is dependent on a range of system-wide factors.
Sector segmentation usedBiomass resources can arise from a wide variety of sources, and can be used in a wide range of energy and other applications. This section describes the approach employed in the consideration of bioenergy for the 2050 Pathways Calculator.
Figure F1 is a schematic representation of the treatment of bioenergy resources and conversion processes within this analysis. The cultivation, collection and eventual deployment of bioenergy resources was considered to be affected by a total of five separate sets of trajectories or levels (highlighted in Figure F1): land use and agriculture trajectories (already considered in Section E of this report); as well as
1 waste trajectories;
2 algae levels;
3 bioenergy conversion route trajectories; and
4 imported biomass levels.

148
Pathways to 2050
Figure F1: Summary of biomass arising, inter-conversion and end use fuel destinations
Agriculture& land use (Section E)
Trajectories A–D
Bioenergy conversion processes
Trajectories A–D
Imported biomass
Levels 1–4
Dry biomass
Crops, straw, wood
Dry biomass Liquid
hydrocarbons
Solid hydrocarbons
Gaseous hydrocarbons
Wet biomass
Dry biomass
Wood, paper and other dry
waste
Wet biomass
Manure
Wet biomass
Food and garden waste
Algae
Levels 1–4
Waste
Trajectories A–C
Sewage and landfill gas
1st generation crops
1st generation conversion
ENER
GY E
ND
USE
S
The amount of biomass cultivated, collected or arising within the UK is described by land use and agriculture trajectories A-D (described in Section E) as well as:
1 waste trajectories A-C; and
2 algae levels 1-4.
The combination of these trajectories and levels selected in any pathway will produce an overall amount of domestically sourced biomass which can be used for energy. The majority of the biomass arising falls into one of two broad categories of raw biomass resources: dry biomass or wet biomass. In addition, they produce two further kinds of resource which can be directly used as fuels. The land use and agriculture trajectories produce liquid biofuels from ‘1st generation’ processes, and the waste trajectories produce biogas collected from landfills and sewage treatment works.
Raw wet and dry biomass resources are not directly usable as fuels, and must undergo conversion processes before they become usable as solid, liquid or gaseous hydrocarbons. The choice as to which biomass resources are converted into which of these three fuel types is made in an additional set of trajectories:

149
Section F: Bioenergy and waste
3 bioenergy conversion route trajectories A-D.
In addition to the domestically produced bioenergy resources, possible levels of imported biomass to the UK are quantified by:
4 imported biomass levels 1–4.
These imported resources are treated as already refined and usable fuels, and are assumed to be either solid hydrocarbons or liquid hydrocarbons (imports of biogas is not considered).
As Figure F1 shows, the combination of trajectories or levels selected through each of the five choices gives rise to different levels of biomass-based fuel available to the energy system, within the three broad fuel categories of solid, liquid or gaseous hydrocarbons. As distinct from fossil resources, the combustion of biomass resources in these categories are treated as ‘zero-carbon’ in the analysis.
The biomass fuels being made available through these trajectories will be used by end-use technologies in a variety of sectors – for example, industrial processes or aircraft. The trajectories and levels described in this section account only for the quantities of biomass-based fuel which accumulates within the three broad fuel categories (solid, liquid, gaseous). These trajectories do not include choices about the final use of biomass fuels within particular end-use technologies – such choices are made in the relevant end-use sectoral trajectories.
The agriculture and land use trajectories are described in more detail in Section E. The remainder of this section describes in more detail the other four sets of bioenergy trajectories and levels highlighted above: waste, algae, bioenergy conversion processes, and imported biomass resources.
Drivers and enablers Agreements and targets at the national and international level provide important drivers for the development and production of bioenergy. The EU’s Renewable Energy Directive (RED) sets an EU target of 20% of energy from renewable sources by 2020, and also includes a target for transport fuels of 10% renewable sources by the same date.
This Directive has been transposed into UK law through a number of instruments. The Renewables Obligation scheme incentivises the generation of electricity from renewables. Under the banded Renewable Obligation Certificates (ROCs) approach, different biomass-to-electricity processes qualify for different incentives (see Table F1).

150
Pathways to 2050
Table F1: ROCs awarded per MWh under the Renewables Obligation in 2009 for biomass electricity generation technologies233
Technology ROCsawardedperMWh
Landfill gas 0.25
Sewage gas 0.5
Co-firing
Co-firing, dedicated energy crops
1Energy from waste with CHP
Co-firing with CHP
Standard gasification
Standard pyrolysis
Dedicated biomass plant 1.5
Co-firing, dedicated energy crops and CHP
Advanced gasification
2Advanced pyrolysis
Anaerobic digestion
Dedicated biomass plant with energy crops
Dedicated biomass plant with CHP
Dedicated biomass plant with energy crops and CHP
The Renewable Transport Fuels Obligation (RTFO) is the mechanism for increasing the blending of biofuels in road transport fuel. Its 2008-09 level was 2.5% by volume, and the target for 2009-10 is 3.25% by volume. In line with the EU RED, the obligation is intended to rise to ensure that renewable transport fuels account for 10% by energy of total transport demand by 2020. However, by the end of 2014 the European Commission will undertake a review to establish, among other things, whether this target can be met sustainably and cost effectively.
Constraints on the development of bioenergy supply may arise due to uncertainty and lack of confidence in supply chains and markets. Such uncertainties can arise from concerns about the sustainability of bioenergy chains, and the effectiveness of the greenhouse gas emission reductions relative to fossil fuels, over their whole life cycle. Uncertainties may also be felt by potential producers and suppliers of bioenergy resources, who may be unwilling to risk scaling up their own production in the absence of confidence in a clear demand for the products.
233Perry,MandRosillo-Calle,F(2009)IEA Task 40 – Country Report for United Kingdom.

151
Section F: Bioenergy and waste
1. Bioenergy from wasteThe waste sector is both a source of greenhouse gas emissions and a producer and consumer of energy. This work has developed three trajectories to identify how the management of waste could develop over time and the impact that this could have on the emissions generated and the energy potentially available from the waste sector.
In 2007, direct greenhouse gas emissions from waste were 22.9 MtCO2e overall, accounting for around 4% of total UK emissions.234 Around 90% of these emissions come from landfills where biodegradable wastes235 decompose, often over many decades, to release landfill gas which is roughly 60% methane and 40% CO2. A proportion of this gas is captured for energy recovery or flaring,236 but a significant amount escapes into the atmosphere. The rest of the emissions from the waste sector come from the incineration of wastes, or dealing with waste water at sewage treatment works.
In 2007, the waste sector in the UK generated an estimated:237
●● 11 TWh of energy (of which 6 TWh was the biodegradable fraction) from waste used at energy-from-waste facilities (including anaerobic digestion);
●● 18 TWh of energy in landfill gas from landfill sites; and
●● 2.5 TWh of energy in sewage gas from sewage treatment works.
Drivers and enablersThe Government’s overall objective is to work towards a zero waste economy where resources are fully valued – financially and environmentally – throughout the economy where we move towards zero waste to landfill. By prioritising waste management activities according to the ‘waste hierarchy’ (Figure F2) the Government aims to break the link between economic growth and the environmental impact of waste. Management activities towards the top of the hierarchy are more sustainable ways of managing waste than those lower down – for example, preventing waste from being created in the first place is more resource and carbon efficient than recycling it or disposing of it in another way. Disposal to landfill should be the very last option for dealing with waste.
234UKGreenhouseGasInventory(2009)Annual Report for Submission under the Framework Convention on Climate Change.
235Biogenicmaterials,suchasfood,wood,paper,andgreenwaste,whichdecaythroughtheactionofbacteria.
236Methaneflaring:thedirectconversionofmethanetoCO2throughburning,butwithoutenergyrecovery.237PerryandRosillo-Calle(2009)IEA Bioenergy Task 40 – Country Report for United Kingdom.

152
Pathways to 2050
Figure F2: The waste hierarchy238
Waste prevention/Re-use
Preparing for re-use
Recycling/Composting
Recovery/Energyrecovery
Disposal
Recent studies239 have indicated that the waste hierarchy remains a good guide to the relative environmental benefits of different waste management options, but that there will be exceptions to the hierarchy for particular materials and particular circumstances. Under the revised EU Waste Framework Directive, departures from the hierarchy will be allowed where this is justified by life-cycle analysis on the overall impacts of the generation and management of such waste.240
Direct greenhouse gas emissions from the waste sector have fallen by 57% compared to 1990 levels and are expected to fall further to 21.1 MtCO2e (60% of 1990 levels) by 2020.241
The Government is looking for an increase in energy from waste through anaerobic digestion. This will form part of the Government’s wider Review of Waste Policies. This will look at all waste policy and waste management delivery in England. The aim of the Review will be to ensure policies are aligned with the objective of moving towards a zero waste economy, while maximising the contribution waste prevention and management can make to the economy.
238Directive2008/98/EConwaste(WasteFrameworkDirective)239(1)Defra’sEnvironmentalReportpublishedalongsidetheConsultationDocumentinFebruary2006,
availableathttp://www.defra.gov.uk/environment/waste;(2)ERM(withGolderAssociates(March2007)Carbon Balances and Energy Impacts of the Management of UK Wastes,FinalReportreportforDefra,availableathttp://www.defra.gov.uk/science/project_data/DocumentLibrary/WR0602/WR0602_4750_FRP.pdf;(3)WRAP(May2006)Environmental Benefits of Recycling: An international review of life cycle comparisons for key materials in the UK recycling sector,www.wrap.org.uk/applications/publications.
240TherevisedWasteFrameworkDirectiverequiresinlawtheapplicationofthewastehierarchyinpriorityorder.
241UKGreenhouseGasInventory(2009)Annual Report for Submission under the Framework Convention on Climate Change.

153
Section F: Bioenergy and waste
The trajectories for wasteThe waste trajectories presented here reflect three possible outcomes that could happen in the waste sector. The trajectories differ according to how effective an implementation of the waste hierarchy they represent. Underlying the trajectories is the assumption that the primary aim of waste policy is the reduction of waste, not the production of bioenergy. However, although they accommodate the major waste and landfill targets, these trajectories are high level and not intended as simulations of specific waste policies.
As a starting point for long-range waste trajectories, waste arisings and waste management activities were established for the base year of 2007. The trajectories consider municipal solid waste (MSW), commercial and industrial (C&I) waste and wood waste arisings from construction and demolition (C&D) waste. Sewage sludge is also considered.
The waste trajectories necessarily reflect the waste policies that were in place earlier in the year. The Government will be looking separately at future waste scenarios as it works out its new approach through the Government’s Review of Waste Policies, and which will reflect the Government’s ambitions to work towards a zero waste economy and an increase in the use of anaerobic digestion.
Waste arising
The 2007 levels of waste arising in the UK are shown in Table F2.
Table F2: Waste arising in selected waste streams in 2007 by waste type
WASTEARISING(milliontonnes)
WASTE STREAM Biogenic dry
Biogenic wet
Non biogenic combustible
Non combustible
TOTAL
Municipal solid waste242
9.7 11.5 4.9 8.7 34.8
Commercial and industrial243
10.0 7.6 29.1 29.9 76.6
Construction and demolition244
2.3 – – – 2.3
TOTAL 47.0 13.2 2 47.4 107.4
242TotalMSWfromEurostat(Availableathttp://epp.eurostat.ec.europa.eu).ProportionalcompositionofMSWderivedfromResourceFutures(2009)MunicipalWasteComposition:Areviewofmunicipalwastecomponentanalyses.ReporttoDefra,code:WR0119.
243TotalC&IWfromWasteStatisticsRegulationreturnfor2006,projectedto2007–originalsourceisEAsurveyofC&I2002/03.ProportionalcompositionofC&IWfromDefraC&IWasteTypeandManagementData.
244C&Dbiogenicdryfromtotalwastewoodfromconstructionanddemolitionsources,asreportedinWRAP(2009)WoodwastemarketintheUK.OthercategoriesofwoodwastediscountedtoavoiddoublecountingwithC&IandMSW,andtoaccountforcompeting(non-energy)usesofwood.

154
Pathways to 2050
Waste managementTable F3 below sets out what assumptions were made in the trajectories about how the waste arising in 2007 was managed.
Table F3: Assumed waste management in 2007 by waste stream
WASTEMANAGEMENT(% of total waste arising)
WASTE STREAM Re-use/recycle Energy recovery Landfill
Municipal solid waste 32 8 60
Commercial and industrial 40 10 50
Construction and demolition 0 0 100
The assumed waste management figures in Table F3 were derived from the following data:
●● percentage sent to landfill – in 2007, 20.06 Mt of MSW and 38.91 Mt of C&I waste went to landfill;245
●● percentage energy recovery (MSW) – the UK’s 15 energy-from-waste plants handle around 3 Mt of municipal waste;
●● percentage energy recovery (C&I) – according to Environment Agency figures, 6% of C&I waste was recovered for energy in 02/03.246 10% was assumed for 2007 to allow for growth in EfW; and
●● percentage re-used/recycled – the waste arising that was not landfilled or recovered was assumed to be re-used/recycled.
The capture rate of landfill gas was assumed to be 75% in 2007. Half of this was assumed to be flared, and half used for energy, in order to match the levels of landfill gas recovered for energy as reported by DUKES.247
Developing the three waste trajectoriesStarting from this base year data, three waste trajectories were developed, describing levels of waste arising, landfilled, recovered for energy or landfilled out to 2050. The trajectories are defined by the following key variables:
●● total levels of waste arising – driven up by rising population and GDP, but mitigated through waste reduction policies;
●● level of recycling – including anaerobic digestion of wet waste, which also produces energy in the form of biogas;
●● level of energy recovery;
●● level of waste to landfill – the remainder of total waste arising from the above two variables; and
●● level of capture of landfill gas and use for energy or flaring.
245AEA(2009)UKGreenhouseGasEmissionsInventory.246EA(2004)Environmental Agency Survey of Commercial and Industrial Waste 2002/03.247DECC(2009)Digest of UK Energy Statistics.

155
Section F: Bioenergy and waste
The assumptions under each of these variables form the basis of the three waste trajectories and are summarised in Table F4.
Table F4: Waste management assumptions for the three waste trajectories248
Trajectory A B C
Year 2020 2050 2020 2050 2020 2050
Waste growth (%) 1.5 1 0.75 0.5 0 0
Recycling (%) 50 50 50 65 60 80
Energy recovery (%) 20 20 30 30 20 20
Landfill (%) 30 30 20 5 20 0
Methane capture (%) 75 75 75 80 75 85
The assumptions in Table F4 give rise to three trajectories with the emissions over time to 2050 shown in Figure F3.
Figure F3: GHG emissions from waste under three waste trajectories
� Trajectory A
� Trajectory B
� Trajectory C0
5
10
15
20
25
30
2007
2040
2045
2035
2030
2025
2020
2015
2010
2050
Was
te e
mis
sion
s (M
tCO
2e)
And Figure F4 shows the amount of energy produced from biodegradable waste under the three trajectories. This includes energy from anaerobic digestion, landfill gas and sewage treatment works.
248Wastegrowth:thepercentagesfor2020referstotheperiodfromnowuntil2020,thefigurefor2050refersto2020-2050.

156
Pathways to 2050
Figure F4: Energy production from biodegradable waste only under three trajectories
� Trajectory A
� Trajectory B
� Trajectory C0
20
40
60
80
100
120
2007
2040
2045
2035
2030
2025
2020
2015
2010
2050
Ener
gy p
rodu
ced
from
bi
odeg
rada
ble
was
te (T
Wh)
Waste trajectories A-C are described in more detail below.
Trajectory ATrajectory A (Figure F5) reaches current 2020 recycling and recovery targets, although there is no increase in recycling and recovery beyond this. At the same time, overall waste arisings continue to grow at close to historic rates. Consequently this trajectory sees only moderate progress in reducing amounts of waste to landfill by 2020. Beyond 2020 recycling and recovery rates do not improve further, with the result that levels of waste to landfill begin to rise again. Emissions from landfill decline slightly in the initial period, but increase again beyond 2020, and by 2050 are higher than 2007 levels. Energy from biodegradable waste, landfill and sewage gas amounts to just under 100 TWh in 2050 (Figure F4).
Figure F5: Waste management under trajectory A
0
50
100
150
200
2007
2025
2020
2015
Was
te m
anag
emen
t (m
illio
n od
t)
� Landfilled
� Energy recovery
� Recycled
2010
2030
2050
2045
2040
2035

157
Section F: Bioenergy and waste
Trajectory BTrajectory B sees significant reductions in the amount of waste going to landfill compared to trajectory A (see Figure F6). This is initially driven by a strong focus on energy recovery (reaching almost 30% by 2020) and then subsequently by an increase in recycling (reaching over 60% by 2050). There are also greater efforts to decouple total waste arising from population and economic growth. Emissions from waste decline strongly in the first decade, ensuring that the 2020 emissions reduction target is met, after which emissions continue to decline at a similar rate (Figure F3). Energy from biodegradable waste, landfill and sewage gas amounts to just over 100 TWh in 2050 (Figure F4).
Figure F6: Waste management under trajectory B
0
50
100
150
200
2007
2025
2020
2015
Was
te m
anag
emen
t (m
illio
n od
t)
� Landfilled
� Energy recovery
� Recycled
2010
2030
2050
2045
2040
2035
Trajectory CTrajectory C (Figure F7) represents a possible path to ‘zero’ waste to landfill by 2050,249 achieved through zero waste growth between 2007 and 2050 (therefore implying a significant decoupling from economic and population growth) and ambitious recycling levels which reach 60% by 2020 and almost 80% by 2050. In 2050, emissions in Trajectory C are around 60% of those in trajectory B (Figure F3). Energy from biodegradable waste, landfill and sewage gas amounts to just under 80 TWh in 2050 (Figure F4).
249Itisexpectedthatsomewastewillcontinuetobesenttolandfill(suchasresiduesfromenergy-from-wastefacilities,construction/demolition/miningwastesetc)buttheseareignoredforthepurposesofthesewastetrajectoriesastheyareinert.

158
Pathways to 2050
Figure F7: Waste management under trajectory C
0
50
100
150
200
2007
2025
2020
2015
Was
te m
anag
emen
t (m
illio
n od
t)
� Landfilled
� Energy recovery
� Recycled
2010
2030
2050
2045
2040
2035
2. Bioenergy from algaeAlgae are divided into two broad classes: macro-algae (such as seaweed) and micro-algae (microscopic plants which are generally free floating and found in both freshwater and saline habitats).
Macro-algae can be farmed, attached to lines or other floating structures, in ocean environments. Macro-algae could also be used in anaerobic digestion plants to produce biogas for combustion or production of biomethane for injection into the gas grid. As with other plant material, it is possible to ferment algae to produce bioethanol.
Micro-algae can be grown in open ponds and enclosures or in concentrated photobioreactors (PBRs). Cultivation of micro-algae is currently practised on a small scale to provide feedstocks for health supplements and other high-value products. Several types of micro-algae can yield an oil which can be used as biodiesel or other transport fuels. The potential for micro-algae production of biofuels on a large scale is believed by many to have long term potential globally. However, the lower levels of sunlight in the UK prevent the large scale commercial production of micro-algae in open ponds. PBRs are extremely expensive and currently seem unlikely to offer a realistic source of energy, though some small scale PBRs are in existence for production of high value products. Micro-algae yields can be improved through the addition of CO2 or nutrients, for example from power stations, factories or waste water treatment plants.
Due to the generally perceived lack of suitability of conditions in the UK for producing micro-algae on a scale required to make a significant contribution to energy supply, this section focuses on the production of macro-algae. Micro-algae is considered one of the processes which could contribute to the higher levels of global supply of biofuels considered in trajectory 4 of the bioenergy imports section below.

159
Section F: Bioenergy and waste
Drivers and enablers The drivers of macro-algae production are the area of algae grown and harvested, yields and energy content. Areas around the north-west coast of Scotland are considered highly suitable areas for macro-algal production, as evidenced by the extent of natural standing stocks. The heavily indented fjordic coastline and relatively pristine water mean that Scotland is home to over 95% of UK aquaculture by value and volume, and hence the skill base for large aquaculture initiatives is here. The levels described in this project therefore focus on this area as an indicative basis for assessing the potential of scaling up macro-algae cultivation. The total area of the natural standing stock of macro-algae in Scottish waters is 1,125 km2 (112,509 hectares),250 and this figure is used as a comparative reference point. However, in each case it is assumed that the natural reserve itself will not be harvested. The figures refer to additional farming of areas further offshore.
The levels for algaeIn all levels the yield of macro-algae begins at 15 dry tonnes per hectare per year and rises to 20 dry tonnes per hectare per year by 2025.251 Energy content of macro-algae is held at 3.9 TWh per million dry tonnes.252
The four levels differ from each other in the following respects:
●● Level 1 entails no development of macro-algae cultivation in the UK.
●● Level 2 considers the cultivation of macro-algae rising to a farmed area equivalent to half that currently occupied by Scotland’s natural standing reserves of macro-algae – 562.6 km2 – by 2050.
●● Level 3 considers the cultivation of macro-algae rising to a farmed area equivalent to 100% of the Scottish natural standing reserve – 1125 km2 – by 2050.
●● Level 4 considers the cultivation of macro-algae rising to a farmed area equivalent to 100% of the Scottish natural standing reserve, plus an additional area of offshore development equivalent to the area proposed for the Hornsea Round Three offshore wind development area – 4735 km2 – by 2050.
If focussed on the west coast of Scotland, the deployment described in Level 4 would represent a considerable expansion into offshore areas around the outer Hebrides. A lesser impact on coastal activities in any one area could be achieved if this total area was distributed around other sites suitable for macro-algae cultivation in the UK. The comparison with the size of the Hornsea Round Three offshore wind development area primarily offers a general scale-comparison to other offshore renewable energy engineering activities. However, this comparison also acknowledges the suggestion which has been made that large scale offshore macro-algae cultivation could use offshore wind farms to provide structures on which to anchor their lines in offshore environments.253 This is, however, an as yet a speculative proposition. Key obstacles for major offshore macro-algae cultivation would include:
250Kelly,MandDworjanyn,S(2008)The potential of marine biomass for anaerobic biogas production.ReporttoTheCrownEstate.
251Reith,H,Huijgen,W,VanHal,JandLenstra,J(2009)Seaweed potential in the Netherlands.PresentationtoMacroalgae–BioenergyResearchForum,Plymouth,UK,2ndJune2009.
252Ibid.253Ibid.

160
Pathways to 2050
●● interference with shipping routes – or if linked to offshore wind turbines, interference with access of turbine maintenance vessels; and
●● rougher conditions in offshore areas, which could disrupt or destroy algae lines.
Figure F8 shows the total energy output in TWh from macro-algae levels1, 2, 3 and 4.
Figure F8: Energy output from macro-algae under four levels
� Level 1
� Level 2
� Level 3
� Level 40
10
20
30
40
50
2007
2040
2045
2035
2030
2025
2020
2015
2010
2050
Ener
gy p
rodu
ced
(TW
h)
3. Bioenergy conversion routesAs shown in Figure F1, the raw wet and dry biomass which arises from UK waste, algae, land use and agriculture activities must undergo conversion processes to be rendered into one of three forms of useable fuel: solid hydrocarbons; liquid hydrocarbons and gaseous hydrocarbons.
For any given amount of bioenergy resource, there are different conversion route options as shown in Table F5. The Table demonstrates that biomass resources are flexible and inter-convertible – raw dry and wet biomass can be converted to fuels in solid, liquid, or gaseous form (although it is not assumed here that wet biomass would be converted into dry solid fuel).

161
Section F: Bioenergy and waste
Table F5: Conversion options and efficiencies for transforming raw biomass resources into generic useable fuels
RAWBIOMASSRESOURCE ENDSTATEOFUSEABLEBIOMASSFUEL
Solid Gas Liquid
Dry biomass
Overall efficiency
90% 58.5% 64%
Summary of process
Accounts for various solid fuel process losses:
Chipping
Pelletting
Lower efficiency of solid waste incineration
Gasification/ methanation
Gasification followed by Fischer Tropsch (FT) synthesis
Wet biomass
Overall efficiency
– 80% 44%
Summary of process
–
Anaerobic digestion/clean-up to methane
Anaerobic digestion/ autothermal reforming/FT synthesis
A more detailed description of the energy conversion processes which make up the routes summarised in Table F5 is given in Table F6, along with references for the efficiencies assumed at each stage (the overall efficiencies in Table F5 represent in some cases combined efficiencies of two or more of the stages listed in Table F6).

162
Pathways to 2050
Table F6: Efficiencies of bioenergy conversion processes254
Process Description Efficiency Reference/comments
Various mixed dry biomass to homogenous dry solid fuel conversions
Homogenisation of solid dry biomass to facilitate combustion. Includes pelletisation, chipping. Also accounts for the around 10% lower average efficiency of burning waste compared to clean, homogenous biomass
90% Thornley, P, Tomei, J, Upham, P (2008) ‘Supergen Biomass and Bioenergy Consortium Theme 6 Resource Assessment Feedstock Properties’ – 10% energy loss in pelletisation
IEA (2006) Energy Technology Perspectives – gives 22% electrical efficiency for MSW incineration
Gasification Thermal conversion of solid dry biomass to syngas
90% IEA (2008) Energy Technology Perspectives
Methanation Conversion of syngas to methane
65% Mambre, V (2009) ‘Biomass Gasification for Production of “Green Energy”’ – World Gas Conference 2009 – energy efficiency of biomass to SNG, 55-65%
Anaerobic digestion
Controlled decomposition of biogenic material to produce biogas
80% Twidell, J and Weir, A (2006) Renewable Energy Resources, Second Edition
‘1st Generation’ biofuels production
Biodiesel production from oil seed rape
1100 litres diesel equivalent per hectare per year
IEA (2008) Energy Technology Perspectives
Clean up Upgrading of biogas to pure methane
100% Assumed energy losses too minor to quantify
Auto-thermal reforming
Thermal conversion of methane to a syngas suitable for FT synthesis
78% Halabi, M, De Croon, M, Van Der Schaaf, J., Cobden, P, Schouten, J (2008) Modelling analysis of autothermal reforming of methane to hydrogen in a fixed bed reformer, I, 137 (3) 568-578; IEA (2006) Energy Technology Perspectives – gives efficiency for auto-thermal reforming plus FT synthesis as 55%
Fischer Tropsch synthesis
Thermal conversion of syngas to diesel fuel
71% Boerrigter, H (2006) Economy of biomass to liquid plants – an engineering assessment, ECN, Netherlands
254Efficiency=(energycontentofoutputfuelorvector/energycontentoforiginalfeedstock).Syngas=gasofapproximatecontent:40%CO,24%H2,23%H2O,10%CO2,1.5%CH4andtracegases.Biogas=gasofapproximatecontent:60%CH4,40%CO2

163
Section F: Bioenergy and waste
The conversion processes specified above are not intended to be an exhaustive list of all possible conversion options for bioenergy resources. Rather, the processes outlined above should be considered as representative of a broad range of conversion processes which could be applied for the conversion of the raw biomass resource to the three broad fuel categories. The routes specified are simply those for which highest conversion efficiencies were found reported in available literature. This is not a definitive judgement that these particular processes will in every situation be the optimal choice.
In this work four simplified trajectories were considered, representing different combinations of options for converting raw biomass resources into different proportions of useable fuel types.
●● Trajectory A is a ‘mixed’ trajectory, with energy crops used to make liquid biofuels, all remaining dry biomass used as solid fuel, and all wet biomass used to make gas.
●● Trajectory B uses energy crops as well as dry biomass as solid fuel, with all wet biomass making gas.
●● Trajectory C uses all available resources to make liquid fuel.
●● Trajectory D uses all resources to make gas.
The trajectories represent, at a high level, choices which can be made regarding the use of biomass resources. In reality, the preferred conversion routes will be the result of a number of choices made by various actors – suppliers, fuel processes, power companies and other users – as well as influenced by policy signals.
4. Bioenergy importsAt a global scale, bioenergy is by some margin the largest source of renewable energy at present. Energy from biomass accounts for approximately 12,500 TWh per year – around 10% of current global primary energy demand. Two thirds of this is currently accounted for by traditional biomass use, such as burning of wood, dung or straw in open fires and stoves, which is the primary energy source for the world’s poor.255
In larger scale uses, consumption of biomass and waste for heat and industry was estimated in 2005 at around 1,250 TWh. Biomass was thought to supply around 1% of transport fuels and over 1% of fuel for electricity generation.256
Estimates of the future potential availability of biomass resources for energy vary over a wide range. A recent review by the International Energy Association (IEA) suggested a mean global potential of 55,000 – 111,000 TWh. The same review produced a full range of 11,000 – 305,500 TWh, depending on the assumptions made as to the extent of land made available for energy farming and the yields of energy crops – which in turn depend both on technological developments and the quality of land devoted to energy crops.257
255IEA(2008)Energy Technology Perspectives–globalbiomassconsumptionquotedas45(+/-10)exajoules(EJ).
256Ibid.257IEABioenergy(2007)PotentialContribution of Bioenergy to the World’s Future Energy Demand–mean
globalpotentialgivenas200–400EJ,fullrangegivenas40–1100EJ.

164
Pathways to 2050
Drivers and enablersFactors which could increase the potential future global availability of biomass for energy include: increasing amounts of land devoted to production of energy crops; improved yields; increased collection of wastes and residues; and improved efficiencies of thermo-chemical and bio-chemical conversion processes and technologies – all of which could be given greater or lesser impetus by the development of markets and supply chains.
Factors which could limit the increase in the potential future global availability of biomass for energy include: land constraints; concerns about the life cycle greenhouse gas emissions associated with global bioenergy supply chains; and concerns about wider impacts upon food production, biodiversity, communities and livelihoods. The availability of biomass will also depend on competing demands for food products, including growth or decline in levels of meat consumption.258
The extent of growth of global markets in bioenergy is therefore uncertain. However, the growth of a UK bioenergy industry has to be placed in the context of a global market and hence competition for resources. Bearing in mind such competing demands on open markets, this project has adopted a simple approach for estimating levels of biomass which could potentially be accessible to the UK.
In the IEA’s ‘Blue Map’ Scenario presented in the 2008 Energy Technology Perspectives Report, up to 41,700 TWh per year of primary biomass ‘is projected to be potentially available for energy purposes in 2050’. In this scenario, 19% of this is projected to be used as transport fuel and 20% for power. The remainder is accounted for by the building sector, industrial uses, and conversion losses.259
For present purposes we have assumed that it is the fuels which go to the power and transport sectors within the IEA breakdown that will be available to be traded on global markets. These are assumed to be in the form of liquid fuels for transport (approximately 8,300 TWh per year), and solid combustible fuels for power (approximately 8,300 TWh per year). An estimate of the likely market share accessible to the UK was made on the basis of its relative population size, using 2050 population estimates of 9 billion globally, and 75 million for the UK. This calculation produces an estimated UK market share of these projected resources of 70 TWh of liquid transport fuels, and the same amount of solid biomass fuels for combustion.
Levels for bioenergy importsThe IEA global resource availability of bioenergy for power and transport is used as a marker for establishing four possible levels of bioenergy imports to the UK. These differing levels of bioenergy imports are described below:
●● Level 1 assumes that biomass products imported to the UK for energy decline to zero by 2050. This level represents the possibility of very minimal development of global bioenergy trade, for example in a world where such trade is stalled by serious sustainability concerns which lead to very high restrictions on internationally traded bioenergy.
258IEA(2008)Energy Technology Perspectives;Hoogwijk,M,Faaij,A,Eickhout,B,deVries,B,Turkenburg,W(2005)‘Potentialofbiomassenergyoutto2100,forfourIPCCSRESland-usescenarios’Biomass and Bioenergy,35(4)225–257.
259IEA(2008)Energy Technology Perspectives–potentiallyavailableprimarybiomassreportedas150EJ.

165
Section F: Bioenergy and waste
●● Level 2 assumes that imported liquid biofuels and solid combustible biomass fuels rise to the equivalent of half of the UK’s projected market share by 2050, based on IEA figures. This may be seen as a cautious development of an international bioenergy trade, which perhaps may be held back to relatively lower levels due to limitations placed on the large scale development of energy crops, due to concerns relating to competition with food or other impacts.
●● Level 3 assumes that imported liquid biofuels and solid combustible biomass fuels rise to the equivalent of 100% of the UK’s projected market share by 2050, based on IEA figures. This may be seen as the result of concerted and coordinated international efforts to overcome food competition and sustainability issues, and to address trade barriers, as well as continued improvement in the efficiencies of solid to liquid biomass conversion processes, such as sugar fermentation, lignocellulosic fermentation, and Fischer-Tropsch synthesis.
●● Level 4 assumes that imported liquid biofuels and solid combustible biomass fuels rise to the equivalent of 200% of the UK’s projected market share by 2050, based on IEA figures. This may be seen as representing not only the successful resolution of trade barriers and sustainability concerns, but also a step-change in the yields-per-hectare of bioenergy production processes. This could include developments in second generation processes, or the development and commercialisation of the production of biofuels from algae.
These assumptions produce figures for available bioenergy imports, beginning from 2007 quantities, and extending on a ‘straight line’ basis to the 2050 quantities described in the levels above. Figure F9 shows the four levels of solid combustible biomass fuel imports.
Figure F9: Imports of solid biomass fuels under four levels
� Level 1
� Level 2
� Level 3
� Level 40
25
50
75
100
125
150
2007
2040
2045
2035
2030
2025
2020
2015
2010
2050
Impo
rts
of s
olid
bio
mas
s fu
els
(TW
h)
Figure F10 shows the four levels of liquid biomass fuel imports.

166
Pathways to 2050
Figure F10: Imports of liquid biomass fuels under four levels
� Level 1
� Level 2
� Level 3
� Level 4-30
0
30
60
90
120
150
2007
2040
2045
2035
2030
2025
2020
2015
2010
2050
Impo
rts
of li
quid
bio
mas
s fu
els
(TW
h)
These levels describe imports only – they are additional to the domestic biomass resources which are produced or arise in other levels or trajectories, as shown in Figure F1, and described in this section and Section E.
There are clearly some simplifications inherent in the approach used here. We have not built a global model for this project, neither is our approach driven by cost optimisation and price-based supply curves. Hence these import resource levels are not intended as an attempt to represent or simulate the potential dynamics of global supply chains and markets in their full complexity – they are simply presented as possible future levels of imports, as a means to inferring different implications for the UK energy system.
A further simplification is that for this project, all imported biofuels are treated as zero-carbon. In fact, analysis suggests that depending on the process and distance of transport, the carbon savings achieved by different forms of bioenergy can vary widely – some bioenergy chains would actually result in increased carbon emissions compared to fossil based energy equivalents.260 In this respect, the GHG emissions savings used in the Calculator are likely to be overestimates.
It is outside the current scope of this project to address these issues in detail. This is by no means to imply, however, that such issues are insignificant. If the UK did import significant quantities of biomass in the future, there would clearly be a pressing need to ensure the development of sustainable, low carbon and secure bioenergy supply chains. Therefore, the UK is continuing to work within the EU and international context towards establishing sustainability criteria for international trading of bioenergy.
260RenewableFuelsAgency(2009)Annual Report and Accounts;EnvironmentAgency(2009)Minimising greenhouse gas emissions from biomass energy generation.

167
Section G: Nuclear
ContextThe last nuclear power station to be built in the UK was Sizewell B which began generation in 1995. At the beginning of 2010 there were 17 nuclear reactors operational with a combined installed capacity of over 10 GW. All of these are due to close by 2025, except Sizewell B which has an installed capacity of just over 1 GW.
Although new build has not taken place in the UK since the late 1980s, plausible installation rates for nuclear power can be estimated from a comparison with what has been achieved historically in other countries. A good example is what happened in France following their decision in 1974 to expand the use of nuclear power in their energy mix after the first oil shock. The higher end of these build rates was in the ten years between the beginning of 1979 and the end of 1988 where on average 4.5 GW of new nuclear capacity was commissioned each year.261
Government policies aim to remove unnecessary barriers to new nuclear in the UK without providing public subsidy. Government does this by taking action on planning, Regulatory Justification, Generic Design Assessment and waste and decommissioning finance, as well as by developing a strong and competitive supply chain in the UK. This should enable energy companies to:
●● make applications for development consent in line with the framework set out by the Planning Act 2008 and the National Policy Statement for Nuclear Power;
●● begin construction of the first new nuclear power station between 2013 and 2014; and
●● start operating the first new nuclear power station from 2018.
In the UK, industry has already started to demonstrate its commitment to new nuclear. In 2009 EDF Energy acquired British Energy and announced plans to build around 6 GW of new nuclear capacity at Hinkley Point and Sizewell. Horizon Nuclear Power (a joint venture between RWE and E.ON) bought land at Oldbury and Wylfa from the Nuclear Decommissioning Authority and announced plans to build at least 6 GW of new nuclear. A third developer (a joint venture between Iberdrola, GDF Suez and Scottish and Southern Energy) also entered the UK market by securing an option to purchase land for the development of a new nuclear power station at Sellafield and announcing plans to build up to 3.6 GW of new nuclear capacity in the UK.
DriversThe plausible build rates for nuclear power are most affected by industry confidence that they will get a sufficient return on any investment made and the availability of suitable sites, rather than specific technical limitations. The levels of nuclear installed capacity described at the end of this section were developed following a review of a
261WorldNuclearAssociationReactorDatabase:http://www.world-nuclear.org/rd/
168
Pathways to 2050
wide range of published studies and discussions with industry experts and, as far as possible, they reflect their views about alternative assumptions to 2050.
Confidence that new build will proceedIt is fundamental that companies have confidence that, in common with all low carbon technologies, they will be able to make a return on their investments and this is underpinned by confidence that new build will be able to proceed in a timely fashion.
However, this confidence is affected by factors including:
●● Government support for new nuclear as demonstrated through public statements and actions, including progress on removing unnecessary barriers to new nuclear in the UK;
●● the level of public acceptability;
●● regulatory certainty about the acceptability of reactor design and clarity over lead times prior to operation; and
●● market certainty, whether in terms of a carbon price or clear targets. This is necessary in time to invigorate the supply chain and skills base, and enable operators to order with long lead times in order to meet construction deadlines.
The last point was raised by industry experts during a workshop to explore the potential deployment rates for new nuclear power in the UK. They felt that in order to develop and maintain build rates at the higher levels of ambition described at the end of this section there needed to be a continuous flow of projects, in order that the supply chain and skills base did not erode once established.
Availability of sitesThe draft National Policy Statement (NPS) for Nuclear Power, the consultation period for which closed in February 2010, identified 10 sites which were considered to be potentially suitable for the deployment of new nuclear power stations by 2025.262 The draft Nuclear NPS states that although it is not possible to predict whether or not there will be more than one reactor at each of the 10 sites, a single reactor at each of the sites would result in 12-17 GW of nuclear capacity, depending on the reactor chosen.263 Responses to this consultation are currently being considered prior to a revised Nuclear NPS being designated.
EnablersGovernment policyThe Government believes that it is in the public interest that nuclear power should continue to play a role in the UK’s energy mix.264 The Government’s view is that it is for private sector energy companies to construct, operate and decommission new nuclear plants. However, the Government will take active steps to remove unnecessary barriers
262DepartmentofEnergyandClimateChange(2009)Draft National Policy Statement for Nuclear Power Generation.
263Ibid.264DepartmentforBusinessEnterpriseandRegulatoryReform(2008)Meeting the Energy Challenge: A
White Paper on Nuclear Power.

169
Section G: Nuclear
to this investment. These steps include reforming the planning system so that those aspects of siting which are strategic in nature are considered at the national level, with only site specific criteria considered at the local level, and the introduction of a form of pre-licensing called the Generic Design Assessment. The Government will not subsidise new nuclear development.
Clarity over planning and licensing timescalesIn the past the planning system has been inefficient, costly and lengthy (for example it took Sizewell B six years to secure planning consent, costing £30 million) and as such may have dissuaded investors in coming forward with planning applications for new nuclear power stations.265
The reforms to the planning system introduced by the Planning Act 2008 (including publication of the Nuclear NPS as part of a suite of energy NPSs) will mean that there is greater clarity over which issues are to be considered when, and the overall timetable for achieving consent.
This will give promoters a clearer framework with a higher degree of predictability in which they can make investment decisions with confidence. It is intended that in most circumstances applications will be decided within a year of the validation of the application.
Clarity over arrangements for the management and disposal of wasteThe Government has stated that before development consents for new nuclear power stations are granted, it will need to be satisfied that effective arrangements exist or will exist to manage and dispose of the waste they will produce.266
Geological disposal was recommended as the best option for the long term management of existing higher activity waste by the independent Committee on Radioactive Waste Management in 2006.267 Geological disposal is internationally recognised as the preferred approach. It is being adopted in many countries, including Canada, Finland, France and Sweden, and is supported by a number of UK learned societies.268 Separate disposability assessments undertaken by the Nuclear Decommissioning Authority in 2009 support the Government’s view that it would be technically possible and desirable to dispose of both new and legacy waste in the same geological disposal facilities.
Following extensive consultation with experts, stakeholders and the public, the Government has a clear policy of geological disposal coupled with safe and secure interim storage and ongoing research and development. A framework to implement that policy was set out in 2008 with the first step being an Expression of Interest from communities which may be interested in talking to the Government about the siting process for a geological disposal facility.269 To date three local authorities have expressed interest. The Government continues to promote the invitation and will leave
265Ibid.266Ibid.267CommitteeonRadioactiveWasteManagement(2006)Managing our Radioactive Waste Safely.268IntheUK,geologicaldisposalissupportedbytheRoyalSociety,theRoyalSocietyofChemistry,andthe
GeologicalSociety.269DepartmentofEnergyandClimateChange(2008)Managing Radioactive Waste Safely.

170
Pathways to 2050
open the option for communities to come forward and talk to the Government for the foreseeable future.
Identification of suitable sites As discussed above, the draft Nuclear NPS has identified 10 sites potentially suitable for the deployment of new nuclear power stations by 2025. The draft NPS is currently under review, but will be finalised and designated as soon as possible. The Nuclear NPS would need to be reviewed and a further strategic siting assessment (SSA) considered if further sites are required. The Nuclear NPS does, however, provide that applications for development consent for sites not listed in the NPS can come forward for consideration against the SSA criteria.
Capability of the supply chain and availability of appropriate skills base The development of the UK supply chain and skills base to support new nuclear was seen by industry experts as something that would flow from increased clarity around the longer term prospects for nuclear power in the UK and globally, but as something that could not develop overnight. For the development of higher levels of nuclear capacity some of these experts thought that at least 10 years of clear Government signalling was required.
As part of invigorating the supply chain the Government has publicised the potential opportunities presented by new nuclear and supported strategic investments where appropriate. These have included capital investment to establish a Nuclear Advanced Manufacturing Research Centre that combines the knowledge, practices and expertise of manufacturing companies with the capability of universities; and strengthening the Manufacturing Advisory Service to support British based suppliers to the nuclear industry.
In the development of skills the Government has been working closely with the Nuclear Decommissioning Authority, Cogent,270 the National Skills Academy for Nuclear, and the nuclear industry itself to ensure that there is a clear, shared understanding of the key skills priorities for the nuclear sector and how skills demands can be met. Cogent, in partnership with the Government and others, has produced a skills report which provides information on the likely skills requirements to deliver a programme of new build together with strategic recommendations on how we can act now to close potential skills gaps.271
270TheSectorSkillsCouncilforthechemicals,pharmaceuticals,nuclear,oilandgas,petroleumandpolymerindustries.
271Cogent(2010)Next Generation: Skills for New Build Nuclear.

171
Section G: Nuclear
The levelsFigure G1 below illustrates four trajectories for nuclear power under four levels of deployment, which are described below.
Figure G1: Trajectories for electricity generation from nuclear power
0
200
400
600
800
1000
1200
� Level 1
� Level 2
� Level 3
� Level 4
2007
2040
2045
2035
2030
2025
2020
2015
2010
2050
TWh
per
year
Level 1This level of deployment shows a baseline. It assumes that implementation of the four facilitative actions on planning, Regulatory Justification, Generic Design Assessment, and waste and decommissioning finance falter. It assumes that the Government no longer wishes to take new nuclear forward and that a lack of clarity over planning and licensing timescales would lead to no planning applications coming forward and potentially the suspension of activities at sites where planning applications had been submitted. However, it is by no means certain that this would apply over the longer term if, as with other low carbon technologies, considerations of security of supply and the potential for rising fossil fuel costs are taken into account. In addition, the momentum already built towards new nuclear, including the investments already made by utilities, led some stakeholders to think this level highly improbable.
Level 2This level of deployment assumes that there would be continued Government and public support for new nuclear and that the facilitative actions would progress in accordance with the indicative timeline.272 The build rate of just over 1 GW/year is technically achievable in comparison with other historical build rates and is similar to what France achieved in the early part of its nuclear programme in the 1970s. A report by consultants Parson Brinckerhoff also suggests that at the current time and in the
272DepartmentforBusinessEnterpriseandRegulatoryReform(2008)Meeting the Energy Challenge: A White Paper on Nuclear Power.
172
Pathways to 2050
current environment the indicative maximum build rate for nuclear power in the UK is 1.5 GW/year.273
Some industry experts thought it plausible that the sites identified in the draft Nuclear NPS could eventually provide the total capacity of 39 GW under this level although there may be the need to consider the identification of additional sites. Experts also thought that there would need to be carbon price certainty at a level that made nuclear power attractive in comparison to fossil fuel generation for this level of build to progress. The total capacity of 39 GW at 2050 is calculated to deliver 275 TWh of electricity per year.
Level 3Given the long lead time for the development and construction of new nuclear power stations even an increased level of Government intervention is unlikely to affect what is achievable by 2020. However, quick and effective implementation of the facilitative actions and clear signals over a carbon price and future requirements for nuclear power by 2015 (in the context of wider market reform) could mean that a build rate of 3 GW/year is achievable from 2025 onwards as it gives developers, the supply chain and skills base the opportunity to respond.
This is technically achievable as it is still less than the 4.5 GW/year that France achieved on average in the ten years between the beginning of 1979 and the end of 1988, albeit in a nationalised market. However, during an industry workshop the view was expressed that given the challenge for a developer to work on multiple sites simultaneously there would need to be at least three separate developers active in the UK market, each building 1 GW/year, to achieve this build rate. The total capacity under this level assumes that the first wave of plants coming forward will be successful in the planning process and that new sites can be identified and obtain development consent at a rate that would support a continuous flow of projects.
The 16 GW predicted by 2025 under this level reflects industry announcements of plans to build 16 GW of new nuclear by 2025. The total capacity of 90 GW at 2050 is calculated to deliver 633 TWh of electricity per year.
Level 4Government interventions would be needed to deliver this level of deployment. It seems technically possible to bring forward initial build so that 6 GW is operational by 2020 and then maintain a build rate of 3 GW/year until 2025 before increasing to a maximum of 5 GW/year thereafter. However, some in the sector pointed out that this early increase in build rate would require ordering long lead items and equipment on the assumption of securing consent, and so as well as the ongoing incentives described under level 3 the Government might also need to be prepared to underwrite the sunk costs of developers.
Although these build rates are technically achievable (France managed to commission over 5 GW/year four times in the 1980s) maintaining such a build rate would be challenging and the likelihood of international competition for resource at this level of ambition means that a UK supply chain able to build new nuclear plants independently of the global supply chain could be necessary to achieve these rates. Supply chain
273ParsonsBrinkerhoff(2009)Powering the Future, Mapping our low carbon path to 2050.
173
Section G: Nuclear
development and skills programmes would need to be set up by 2015 on a scale that reflects the estimated build rates.
As with the previous level of deployment, the total capacity under this level assumes that the first wave of plants coming forward will be successful in the planning process and that new sites can be identified and obtain development consent at a rate that would support a continuous flow of projects. Given that an increased number of nuclear power stations would also lead to an increased level of waste, there would also need to be greater capacity for geological disposal which might require plans for a second facility to be developed. The total capacity of 146 GW at 2050 is calculated to deliver 1025 TWh of electricity per year.
Possible technology developmentsMost of those questioned during the industry workshop did not think that the availability of fuel would be a limiting factor during the timescale considered and this is supported by analysis carried out by OECD and the Euratom Supply Agency.274,275
Even if existing resources were exhausted it was pointed out that the relatively small contribution of fuel costs to the overall cost of nuclear generation made it likely that other, potentially more expensive, sources of uranium could be considered.
If there were a decline in fuel supply, utilities could also begin to consider reprocessing and other reactor technologies. Given that the transition to other reactor technologies was something that those at the workshop thought was unlikely over this time period it was felt that any such developments would be so far in the future that their introduction could be phased so that it did not affect the overall build rate, although this would be more difficult to achieve at the higher levels of ambition.
274OrganisationforEconomicCo-operationandDevelopmentNuclearEnergyAgency(2008)Nuclear Energy Outlook 2008.
275EuratomSupplyAgency(2008)Annual Report 2008.

174
Section H: Fossil fuel Carbon Capture and Storage
ContextCarbon Capture and Storage (CCS) consists of separate processes for capturing, transporting and storing carbon dioxide, each of which are currently deployed separately in a range of industrial processes. The International Energy Agency (IEA) has estimated that storage of carbon dioxide through CCS will be needed to deliver about 20% of the abatement required if global carbon dioxide emissions are to be reduced to 50% of the 2005 level by 2050.276,277 This will require an annual global capture rate exceeding 2Gt/year in 2030, increasing to about 10Gt/year by 2050, and would involve over 3000 projects by 2050, with CCS being applied to coal and gas power generation and to large industrial emission sources such as iron and steel, cement and oil refineries. Currently there are no projects anywhere in the world undertaking the full CCS chain at the scale necessary for commercial electricity production.
The technical challenges to attaining widespread commercial deployment of CCS are a combination of scaling-up and achieving reliable integrated operation of the three components of capturing, transporting and storing carbon dioxide in a way that does not compromise the underlying production process. This is one reason why the G8 and IEA have called for 20 full-scale demonstrations to be announced by 2010, and why the European Union has introduced measures to provide financial support for up to 12 such demonstrations.278 Other key objectives of the demonstrations are to reduce costs and increase investor confidence. Other developed economies have announced similar support programmes.
The Government has committed to a programme of support for the demonstration of CCS technology on four power stations, this includes the current competition for what is intended to be one of the world’s first full-scale demonstrations of CCS on a coal-fired power station. The purpose of these projects is to prove CCS both technically and economically by 2020, and thereby accelerate the availability of fossil fuel power stations incorporating CCS for further deployment in the UK and worldwide. The four demonstration projects alone will mean the UK will have close to 2 GW of CCS power generation by 2020 capturing about 9 MtCO2/year. The full installation of CCS to these units would more than double this capacity by 2025.
All new coal fired power stations in England and Wales are required to demonstrate CCS on at least 300 MW (net) of total capacity as a condition of consent, with an expectation that coal fired power stations consented under these arrangements will fully install CCS by 2025.279 In 2010 the Government committed to the introduction of an
276InternationalEnergyAgency(2008)Energy Technology Perspective 2008 – Scenarios and Strategies to 2050.
277A50%reductionisconsistentwithlimitingglobaltemperatureriseto2-3degreesCelsius;IntergovernmentalPanelonClimateChange(2007)Climate Change 2007: Synthesis Report.
278InternationalEnergyAgency/CarbonSequestrationLeadershipForum(2010)Report to the Muskoka G8 Summit – Carbon Capture and Storage – Progress and Next Steps.
279DepartmentofEnergyandClimateChange(2009)A framework for clean coal.
175
Section H: Fossil fuel Carbon Capture and Storage
Emissions Performance Standard that will prevent coal fired power stations being built unless they are equipped with sufficient CCS to meet that standard. Furthermore, the Government will produce a CCS roadmap and there will be a rolling review, which is planned to report by 2018, to consider the regulatory and financial framework needed to further the deployment of CCS.
The UK has also taken the lead in developing the licensing and regulatory frameworks necessary for controlling the transport and storage of carbon dioxide. Health and Safety and Environmental legislation has been reviewed, and the Energy Act 2008 provides one of the world’s first regulatory regimes for permitting the permanent storage of carbon dioxide. In 2009 the EU introduced the Directive on the geological storage of carbon dioxide which aims to take CCS forward by requiring all combustion plants with a capacity of 300 MW or more to be built so that CCS can be retrofitted at a later date; the so-called Carbon Capture Ready (CCR) requirement.280 A CCR requirement has been part of the permitting arrangements for new combustion power stations in the UK since 2009 for all new combustion power stations over 300 MW. The Government has consulted on the arrangements for transposing the Directive’s requirements for licensing exploration and operation of carbon dioxide storage in the UK Continental Shelf, and a response is in preparation. The EU Directive also set out minimum requirements for encouraging a European transport and storage infrastructure, including provision for third party access and the Government has outlined its plans to achieve this.281 As no commercial scale fossil CCS power generation projects have been built anywhere in the world the plausible levels of deployment can only be estimated via an assessment of the key drivers and enablers.
The next step in the development of CCS is a series of commercial scale demonstration projects aimed at proving the system both technically and economically. Accordingly the Government has committed to a UK demonstration programme of four such projects.
The Government recognises that the demonstration programme alone will not be enough to take us to the point of commercial deployment. The Office of Carbon Capture and Storage has been established to guide the UK’s efforts on CCS both domestically and internationally. An important step in this process will be the production of a roadmap setting out the steps necessary for CCS to be a commercially deployable technology.
DriversCommercial viabilityBeyond the demonstration projects, the Government’s policy is for further deployment of CCS to be determined by the carbon price, with CCS competing against other low carbon options. The Government’s ambition is to accelerate the commercialisation of CCS in order to have the technology ready for wider deployment from 2020, although the Government recognises that this will be very challenging.
CCS is not a mature technology and there are opportunities for substantial innovation-driven reductions in both the capital and operating costs which should increase its commercial competitiveness. Roughly two thirds of the costs of CCS lie in the capture
280Directive2009/31/ECoftheEuropeanParliamentandoftheCouncilof23April2009onthegeologicalstorageofcarbondioxide.
281DepartmentofEnergyandClimateChange(2009)Clean coal – an industrial strategy for the development of carbon capture and storage across the UK.

176
Pathways to 2050
process, and it is here that the greatest opportunities for savings lie.282 Therefore, in parallel with the commercial demonstration programme, the Government is supporting research and development and prototype trials to develop improved and lower cost processes and equipment.
Market position of CCSThe longer term deployment of CCS will depend on its cost competitiveness compared to other low carbon power generation technologies including renewable energy and nuclear power. CCS is capital intensive and therefore will be most cost effective if deployed as base-load generation. However, it could be displaced from this role by nuclear power and by intermittent renewable sources such as wind energy, which with much lower marginal cost should always be used when available. This means CCS could be required to operate at intermediate load, providing a low carbon back-up to a large intermittent renewable energy capacity. In these circumstances the commercial success of CCS will depend on the technology having the operational flexibility to undertake this role (see below), and the electricity market being able to provide investors with a sufficient return to make it worthwhile investing in CCS.
Providing a flexible back-up to intermittent renewable energy sourcesIt is expected that early commercial deployment of CCS in the UK will be on coal fired generation because this is expected to be the lowest cost option. However, CCS on gas may be important for three reasons:
1. CCS on gas could be cost competitive with CCS on coal if new sources of gas, such as shale gas, increase supplies and reduce gas prices.
2. CCS on coal may still release about 10% of the carbon dioxide into the atmosphere, and this may not be acceptable as carbon abatement targets are tightened.283 The efficiency of carbon dioxide capture technology may increase above 90% in future, or the carbon dioxide released could be accounted for by co-firing with biomass (see further detail on Bio-Energy with CCS (BECCS) in Section Q). However, it is likely that in future a significant amount of gas fired generation will be available for CCS retrofit, and since gas with CCS will only have about half the residual carbon dioxide emissions of coal, this could be an attractive option.
3. CCS on gas fired generation is less capital intensive than CCS on coal, therefore CCS on gas could be the more economic option when fossil power generation is required to provide a low carbon back-up to intermittent renewable energy sources.
282DepartmentofEnergyandClimateChange(2009)Impact Assessment of Coal and Carbon Capture and Storage requirements in‘Aframeworkforthedevelopmentofcleancoal’consultationdocument.
283IntergovernmentalPanelonClimateChange(2005)Carbon Dioxide Capture and Storage: Special Report.
177
Section H: Fossil fuel Carbon Capture and Storage
Finally, the retention of gas generation will increase the UK’s diversity of electricity supplies. Therefore it is possible, particularly under the most ambitious levels 3 and 4 (described below), that gas fired generation could take a significant share of CCS capacity.
Enablers Assuming the demonstration projects are successful in proving CCS, there are five key factors that will influence future commercial deployment of CCS:
1. consenting conditions for new fossil fuel electricity generation;
2. availability of transport networks and storage capacity;
3. availability of sites for CCS power stations;
4. operational flexibility; and
5. establishment of a competitive equipment supply chain.
Consenting conditions for new fossil fuel electricity generationThe Government recognises that investors require a clear policy framework in which to plan for the future. This is why it has committed to introducing a floor price for carbon, an Emissions Performance Standard to help drive CCS deployment and a CCS roadmap. The Government is also working with the regulatory agencies including the Health and Safety Executive and the Environment Agency to establish a clear regulatory framework to control the licensing and operation of CCS.
Availability of transport networks and storage capacityThe UK is well placed to be an early mover on CCS because the North Sea, and to a lesser extent the Irish Sea, offers significant capacity for carbon dioxide storage in depleted oil and gas reservoirs, and there may also be a substantially greater capacity in saline aquifers (geological formations consisting of water permeable rocks saturated with salt water).
Estimates of the total offshore storage capacity available on the UK Continental Shelf are wide ranging, largely because of uncertainties in the current geological understanding of aquifers. In a study for the Department of Energy and Climate Change, the British Geological Survey estimated capacity of about 7.5 Gt in depleted oil and gas fields and, on a theoretical basis, almost 15 Gt in aquifers, but this assessment did not consider aquifers in the central and northern North Sea.284 More recently an assessment by the Scottish Centre for Carbon Storage has estimated that the aquifers in the central and northern North Sea could take between 4.6 and 46 Gt.285 Overall current knowledge suggests that the UK Continental Shelf should be able to store at least 10 Gt of carbon dioxide and probably substantially more. 10 Gt is about 80 years’ worth of emissions from current UK coal fired power stations.
Two technical factors that could have an impact on the pace of CCS deployment are:
284BritishGeologicalSurvey(2006)Industrial carbon dioxide emissions and carbon dioxide storage potential in the UK.
285ScottishCentreforCarbonStorage(2009)Opportunities for CO2 storage around Scotland; an integrated strategic research study.

178
Pathways to 2050
1. the injectivity of the carbon dioxide stores (that is, how quickly carbon dioxide can be pumped into geological formations); and
2. the provision of pipeline capacity.
The Government is currently examining how the first of these can be addressed either through the CCS demonstration programme’s choice of storage sites or through a linked geological survey.
On the second point, transporting several hundred million tonnes of carbon dioxide per year appears to be a formidable undertaking. However, a standard 36 inch diameter pipeline can carry about 25 Mt/year, therefore it would only require about thirteen such ‘trunk’ pipelines to carry the output from 50 GW of coal fired generation fitted with CCS. Since the transportation distances are relatively small, of the order of 300-600km, this represents a total pipeline length of about 6,000-10,000km. This would be a network of a similar size to the existing network of offshore oil and gas pipelines, which is clearly feasible over the next 40 years – though still a very large industrial undertaking.
Availability of sites for CCS power stationsIn principle the availability of sites for CCS power stations should not be an issue. At the beginning of the 1990s the UK had over 50 GW of coal and oil fired generation, and although this fell to 28 GW by 2007 many of the sites remain available for redevelopment. Furthermore over 23 GW of gas fired generation has been added to overall UK electricity generating capacity suggesting that sufficient sites should be available.
The location of CCS power stations will be determined by factors relating to the power station itself (for example, proximity to demand, grid connection, availability of cooling water and transportation of fuel supplies), and also the availability of transport infrastructure to take the carbon dioxide to a storage site. Because most of the UK’s storage capacity is located off the East Coast this is likely to favour the location of power stations near to this coastline since there may be limited options for routing onshore pipelines around centres of population. For example a study by Pöyry for the Committee on Climate Change concluded that it may be desirable to consider clustering CCS units at coastal sites or at existing sites within 100km of a coastal gas terminal, if it is problematic to obtain consent for onshore carbon dioxide transport pipelines.286 Pöyry found that 15 GW of existing coal fired generating stations and a further 19 GW of other generating stations already met this criterion.
UK deployment of fossil fuelled power stations, and particularly coal, has tended to cluster in a limited number of locations (for example, the Thames estuary, Humberside, Tyne-Tees, Forth estuary, Merseyside, South Wales). This could encourage the development of regional infrastructure for the collection and transport of carbon dioxide. The Government is considering how the CCS demonstration programme could help establish such networks.
286Pöyry(2009)Carbon Capture and Storage: Milestones to deliver large scale deployment by 2030 in the UK.

179
Section H: Fossil fuel Carbon Capture and Storage
Power station operational flexibilityAn important attribute of fossil fuelled power stations is their flexibility in altering supply to meet demand, which makes them ideal for providing back-up generation, thereby ensuring short term security of supply. A key objective of the UK’s demonstration programme is to establish whether fossil fuelled power stations will retain this flexibility when fitted with CCS. If this proves to be the case then potential deployment of CCS could be substantially higher than if a power station was confined to base-load operation once fitted with CCS, as it would give a low carbon option for providing back up to intermittent renewable sources.
Establish a competitive equipment supply chainIt is important to diffuse the experience and know-how stemming from CCS demonstration projects to establish both technical and price competition between equipment suppliers. This is particularly so for carbon dioxide capture equipment, which, unlike pipelines and injection facilities, does not have an established market.
The levels Figure H1 below illustrates trajectories for new fossil fuel CCS power under four levels of deployment, which are described below.
Figure H1: Trajectories for electricity generation from fossil fuel Carbon Capture and Storage
0
100
200
300
400
500
600
� Level 1
� Level 2
� Level 3
� Level 4
2007
2040
2045
2035
2030
2025
2020
2015
2010
2050
TWh
per
year
This work considers CCS being applied to both gas and coal. However in the 2050 Pathways Calculator itself, in order to simplify the modelling, coal is mainly used. This can give the impression that gas is not expected to be used, but this is not a conclusion of the analysis. The figures provided for CCS on power plant are electricity generation net of own use and parasitic load.
180
Pathways to 2050
Level 1This level of deployment assumes all four demonstration projects are implemented before 2018, with the first in operation by 2015. If the demonstration plants don’t support the case for commercial deployment then it is assumed that no more CCS plants are built.
Level 2This deployment level is based on the assumption that demonstration projects are deployed, possibly in two tranches, with the first plant in operation by 2015 and that work is completed to confirm the availability of storage capacity. Assuming successful demonstration projects and a lead time for the first commercial plant of six years from the results of demonstration plants in 2018, then additional CCS capacity could become operational from 2024. The completion rate to 2030 is based on the lower deployment rate in the Pöyry report for the Committee on Climate Change.287 A completion rate of 1.5GW/year from around 2030 would be comparable to a Parsons Brinckerhoff estimate of the potential build rate of 1 GW/year reflecting the combination of power and process plants.288 The total capacity of 40 GW at 2050 is calculated to deliver 239 TWh of electricity per year.
Level 3Making the same initial assumptions as level 2, this level follows a completion rate of 2 GW/year from 2025 based on the ‘realistic high deployment’ scenario described in the Pöyry report for the Committee on Climate Change.289 The total capacity of 57 GW at 2050 is calculated to deliver 337 TWh of electricity per year.
Level 4This level assumes successful demonstration projects and successful confirmation of the storage capacity, with allowance for storage of emissions from other CCS processes. If the lead time is assumed to be six years but early consenting work provides an opportunity for construction on commercial plant from 2018 then additional CCS capacity plant could become operational from 2021. A completion rate of 3 GW/year from around 2030 would be similar to the peak delivery of Combined Cycle Gas Turbine plants in the UK during the 1990s. There may be a preference for locating multiple CCS units at existing or new sites in order to maximise the efficiency of carbon dioxide transportation. The total capacity of 86 GW at 2050 is calculated to deliver 511 TWh of electricity per year.
Possible technology developmentsCCS and in particular the capture aspect of the CCS chain are considered to have significant potential for cost reduction through technical development. In the near term CCS demonstration and deployment is likely to use one of three capture options that have been adapted from other processes involving carbon dioxide separation. These are: post combustion capture involving the separation of carbon dioxide from flue
287Pöyry(2009)Carbon Capture and Storage: Milestones to deliver large scale deployment by 2030 in the UK.288FromDepartmentofEnergyandClimateChangediscussionswithParsonsBrinckerhoff.289Ibid.

181
Section H: Fossil fuel Carbon Capture and Storage
gases; pre-combustion in which fossil fuels are converted to carbon dioxide and hydrogen prior to combustion; and oxy-firing in which combustion takes place in an oxygen/carbon dioxide mixture to yield a flue gas consisting mainly of carbon dioxide. The main opportunities for reducing the cost of these methods are:
●● Increasing the power station efficiency so that it uses less fuel per unit of electricity generated. This reduces the amount of carbon dioxide to be captured, which reduces the size of the capture plant (capital cost saving) and the amount of energy needed to operate capture (operating cost saving).
●● With present designs the amount of electricity supplied from a coal power station is reduced by about 20% because of the energy needed to run the capture plant and carbon dioxide compressors. Reducing this energy penalty by developing more efficient separation processes and carbon dioxide compressors will yield substantial savings.
Looking further ahead, more novel separation processes which may offer substantial savings in both capital and operating costs are the subject of research and development. These include the use of membranes for both carbon dioxide and oxygen separation, mineralisation, and also chemical looping methods for regenerative carbon dioxide capture.
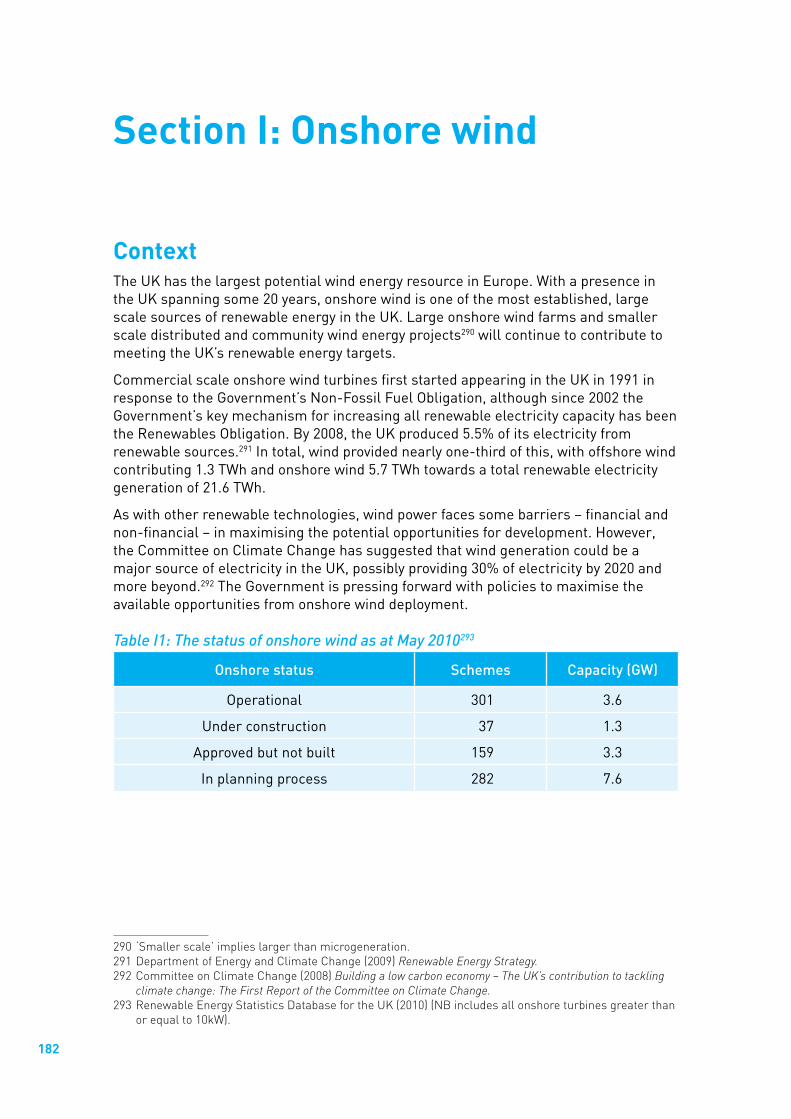
182
Section I: Onshore wind
ContextThe UK has the largest potential wind energy resource in Europe. With a presence in the UK spanning some 20 years, onshore wind is one of the most established, large scale sources of renewable energy in the UK. Large onshore wind farms and smaller scale distributed and community wind energy projects290 will continue to contribute to meeting the UK’s renewable energy targets.
Commercial scale onshore wind turbines first started appearing in the UK in 1991 in response to the Government’s Non-Fossil Fuel Obligation, although since 2002 the Government’s key mechanism for increasing all renewable electricity capacity has been the Renewables Obligation. By 2008, the UK produced 5.5% of its electricity from renewable sources.291 In total, wind provided nearly one-third of this, with offshore wind contributing 1.3 TWh and onshore wind 5.7 TWh towards a total renewable electricity generation of 21.6 TWh.
As with other renewable technologies, wind power faces some barriers – financial and non-financial – in maximising the potential opportunities for development. However, the Committee on Climate Change has suggested that wind generation could be a major source of electricity in the UK, possibly providing 30% of electricity by 2020 and more beyond.292 The Government is pressing forward with policies to maximise the available opportunities from onshore wind deployment.
Table I1: The status of onshore wind as at May 2010293
Onshorestatus Schemes Capacity(GW)
Operational 301 3.6
Under construction 37 1.3
Approved but not built 159 3.3
In planning process 282 7.6
290‘Smallerscale’implieslargerthanmicrogeneration.291DepartmentofEnergyandClimateChange(2009)Renewable Energy Strategy.292CommitteeonClimateChange(2008)Building a low carbon economy – The UK’s contribution to tackling
climate change: The First Report of the Committee on Climate Change.293RenewableEnergyStatisticsDatabasefortheUK(2010)(NBincludesallonshoreturbinesgreaterthan
orequalto10kW).

183
Section I: Onshore wind
Drivers Onshore wind farms have been under development in the UK for over twenty years. One way to assess the plausible levels of deployment of this technology looking ahead to 2050 is via the rate at which new sites have been submitted for planning permission and the success rate in taking them forward for approval (a ’bottom up‘ approach). Another method would be to estimate the potential practical resource in order to predict potential total capacity (a ’top down‘ approach).
The planning process varies by location and scale of development, but broadly speaking, applications for onshore wind farms of less than 50 MW are processed by local planning authorities, whereas applications for larger wind farms are handled at national level. In both cases (under the existing system), planning decision makers have to assess applications against a range of social and environmental criteria, taking into account both local impacts and the national need for renewable energy.
Planning applications
Figure I1: UK planning applications and decisions for onshore wind capacity294
0.0
1.0
2.0
3.0
4.0
0.0
0.5
1.0
1.5
2.0
2.5
3.0
3.5
4.0
� Submitted
� Approved
� Refused
� Determined
2008
2009
2007
2006
2005
2004
Capa
city
rep
rese
nted
in a
pplic
atio
ns,
appr
oval
s, r
efus
als
and
dete
rmin
atio
nsea
ch y
ear
(GW
)
The rate of UK planning applications being submitted had been gradually declining over recent years, until a surge of new submissions in 2009. When decisions on planning applications for new onshore wind capacity were made during the period 2004–9 there was a consistent rate of between 60% and 80% of capacity being approved (including projects approved after appeal), with an average approval rate of 69% for all sizes of projects across the UK. This rate did vary across different parts of the country and for local as opposed to national consenting bodies. For example, the approval rate for decisions made at a local level in England over the same period is 50%, although in terms of absolute numbers of submissions (rather than capacity) it is 62%.295
294CalculationsbyDepartmentofEnergyandClimateChange,basedondatafromtheRenewableEnergyStatisticsDatabasefortheUK.
295Ibid.
184
Pathways to 2050
Practical resourceIf we consider the UK’s land area as a whole and exclude land where wind farms would not be built for land use or ecological sensitivity reasons, then one estimate of the remaining accessible resource could lead to the construction 110 GW capacity of wind turbines.296 However, this was reduced to a maximum practical resource of 28 GW based on assumptions of clustering and proximity constraints.297 Using a different methodology extrapolating from regional planning assessments, the estimate of the resource is 31 GW for 2020 or later.298
If the density of onshore wind farms in the UK (MW/per 1000km2) was similar to the current density in Denmark then it is estimated that the total capacity would be around 16 GW.299 This is only a theoretical comparison of capacity and does not take account of factors that could affect the actual deployment, for example, differences in land use, ecological sensitivity, wind resource or planning policy.
Enablers
Planning decisionsThe Government has committed to retaining a fast-track process for onshore energy developments over 50 MW, but with decisions being made by Ministers rather than by the Infrastructure Planning Commission. For installations below 50 MW, decisions are taken by local planning authorities; the Government has stated that a new national planning framework for England will be introduced in due course.
While planning is largely a devolved issue, the Devolved Administrations of Northern Ireland, Scotland and Wales also pursue a positive approach to the development of onshore wind. Scottish planning policy supports and encourages the continued growth of all renewable technologies and the Scottish Executive has a target of 40% renewable electricity by 2020 with the majority coming from onshore wind and hydropower. The Welsh Assembly also has an aspiration that by 2025 it will generate more electricity from renewable energy than it consumes, and is aiming to deliver 800 MW of onshore wind by the end of 2010.
Renewables Obligation and loan financingThe Renewables Obligation is the Government’s key mechanism for increasing new renewable electricity generating capacity, including onshore wind, allowing renewable technologies to compete in the market against more established fuels in order to deliver against long term carbon and security of supply goals.
Access to finance in tighter credit conditions has been problematic for some wind farms. The European Investment Bank (EIB), in collaboration with BNP Paribas Fortis, Lloyds Banking Group and Royal Bank of Scotland has set up and is running a scheme to enable the small and medium sized segment of the renewable energy market, initially focussing on onshore wind, to secure access to finance for their projects. UK
296EnergyTechnologySupportUnit(ETSU)R-99asreportedbyEnvirosConsultingLimited(2005)The Costs of Supplying Renewable Energy.
297Ibid.298Ibid.299AsestimatedbytheDepartmentofEnergyandClimateChange.

185
Section I: Onshore wind
renewable and energy projects are benefitting from up to £4 billion of new capital from the EIB. The specific lending scheme for onshore wind will help finance project costs of up to £1.4 billion in order to bring consented small and medium sized UK projects to deployment. The 48 MW Hill of Towie wind farm in Scotland, which will become operational in summer 2011, was the first project to secure financing under the lending scheme in March 2010.
Wind turbines and aviationWind turbines can have significant effects on aviation radar which, unresolved, could potentially have an impact on national security or aviation safety, and limit the deployment of onshore and offshore wind. The Department of Energy and Climate Change and other Government departments are working with aviation and industry stakeholders to resolve this significant and challenging issue. An Aviation Plan was published in September 2008, alongside a Memorandum of Understanding between all relevant stakeholders which commits to working together to identify solutions based on both ways of working and new technological systems.
The levels Figure I2 below illustrates trajectories for onshore wind power (including existing schemes) under four levels of deployment, which are described below.
Figure I2: Trajectories for electricity generation from onshore wind
0
30
60
90
120
150
� Level 1
� Level 2
� Level 3
� Level 4
2007
2040
2045
2035
2030
2025
2020
2015
2010
2050
TWh
per
year
In this assessment it has been assumed that wind turbines are decommissioned after 20 years of operation. This means that even though new turbines are installed at the same time as decommissioning, the cumulative installed capacity levels off over time. It has also been assumed that the load factor is a constant 30%.300
300DepartmentofEnergyandClimateChange(2009)Digest of United Kingdom Energy Statistics.

186
Pathways to 2050
Level 1The capacity achieved at this level of deployment has been based on continuation of the average build rate over the past four years, which was approximately 0.55 GW/year. It is assumed that there will be a continuous pipeline of projects for construction. The total maximum capacity of around 11 GW in 2025 would require around a 50% approval rate of the sites currently submitted for planning permission, assuming all the approved projects are built.
It has been reported that currently the onshore wind supply chain is capable of a build-rate of around 0.85 GW/year in the UK.301 It is assumed that continuation of the build rate and availability of the supply chain is not affected by significant expansion of either onshore wind or offshore wind in other countries.
For this level it is assumed that sites are not replanted when the turbines are decommissioned.
Level 2This level of deployment assumes that applications for a further 2 GW are submitted in 2010 but then submissions decline at the rate of 0.2 GW/year, for example, as the availability of sites decreases over time. If the approval rate of planning submissions is 70% and all the projects are built then the total capacity, including projects already submitted, approved or operating, would be around 20 GW by 2030 and maintained at that level. This capacity of 20 GW is calculated to deliver 53 TWh of electricity per year.
As there are already projects that have gained consent and are awaiting construction, it is assumed there is no lead time and that a continuous pipeline of projects is available to support a build rate of 1 GW/year. A build rate of around 1 GW/year is similar to the build rates in the Pöyry ‘alternative scenario’ or the Sinclair Knight Merz (SKM) report’s ‘medium build’ scenario but requiring earlier delivery.302,303
This build rate would deliver around 14 GW of installed capacity by 2020, which is considered achievable by the industry, but nonetheless would still be challenging. The British Wind Energy Association highlighted in May 2009 that:
“The build rate required to meet this objective (of 14 GW by 2020), under 1 GW per year, is less than has been achieved in both Germany and Spain for nearly a decade, so on the face of it there is no reason why the supply chain cannot deliver this capacity.”304
301Pöyry(2009)Timeline for Wind Generation to 2020 and a set of progress indicators.302Ibid.303SinclairKnightMetz(2008)Quantification of Constraints on the Growth of UK Renewable Generating
Capacity.304MemorandumsubmittedbytheBritishWindEnergyAssociation,HouseofCommonsEnergyand
ClimateChangeSelectCommittee(2008-9)Low Carbon Technologies in a Green Economy.

187
Section I: Onshore wind
Level 3If it is assumed that planning submissions are submitted at the rate of 2.5 GW/year until 2020 and the success rate is 70%, then the total capacity at 2050 for this level of deployment would be approximately 32 GW, assuming all approved projects are built. This total capacity is calculated to deliver 84 TWh of electricity per year.
As there are already projects that have gained consent and that are awaiting construction, it is assumed that there is no lead time and a continuous pipeline of projects is available to support a build rate of 1.6 GW/year. The build rate is similar to the build rates in the Pöyry ‘high feasible scenario’ or the SKM ‘high build’ scenario but requiring earlier delivery.305,306
Level 4The installed capacity for this level of deployment reaches 50 GW, which is below the accessible resource indicated in the Energy Technology Support Unit report but is still likely to require some form of intervention either to reduce constraints or improve public acceptability.307
Assuming a planning approval rate of 70% the submission rate would need to be sustained at around 3.5 GW/year to 2025 in order to provide around 2.5 GW/year of projects for construction. In total, around 70 GW would need to be submitted for planning permissions compared to the 18 GW that has been submitted to the end of 2009. The total capacity of 50 GW at 2050 is calculated to deliver 132 TWh of electricity per year.
In Germany in recent years the build rate has averaged around 2.1 GW/year and Spain 1.6 GW/year, with peak capacity exceeding 3 GW/year.308 Both Germany and Spain have indigenous wind turbine manufacture whereas the UK may be more dependent upon the global supply chain.
305Pöyry(2009)Timeline for Wind Generation to 2020 and a set of progress indicators.306SinclairKnightMetz(2008)Quantification of Constraints on the Growth of UK Renewable Generating
Capacity.307EnergyTechnologySupportUnit(ETSU)R-99asreportedbyEnvirosConsultingLimited(2005)
The Costs of Supplying Renewable Energy.308BritishWindEnergyAssociation(2009)State of the Industry Report.

188
Section J: Offshore wind
ContextThe UK is demonstrating considerable international leadership in the development of offshore wind. The last decade has seen UK offshore wind progress from an immature technology into a proven technology that is expected be a significant contributor to achieving EU renewables targets.
In 2001, the first leasing round of the UK offshore wind programme resulted in 12 sites being allocated with the potential for around 1 GW of capacity. Following an offshore wind Strategic Environmental Assessment, a second leasing round competition was held in 2003, granting potential capacity of over 7 GW. Opportunities are now being explored to extend some of these planned offshore wind farms by up to 1.6 GW, as well as developing approximately 6 GW capacity within Scottish Territorial Waters.
In 2009, a second Strategic Environmental Assessment concluded that an additional 25 GW of offshore wind capacity by 2020 would be acceptable as long as appropriate mitigation measures were put in place, in addition to existing plans for 8 GW. Following a third leasing round competition in January 2010, The Crown Estate awarded Zone Development Agreements (exclusivity awards) for up to 32 GW of capacity. Following the award of an agreement for lease or a Zone Development Agreement by The Crown Estate, all offshore wind farm developments are subject to the usual planning processes, including the need to seek development consents from the appropriate planning authority prior to construction and generation.
Based on the outcome of Round 3 plus existing plans, the total available offshore wind potential is 47 GW by 2020, if all the ambitions were realised. It is clear that this level of development would require a massive step-change in the rate of deployment. The Government is committed to pressing forward with policies to maximise the available opportunities from this offshore wind deployment.
Table J1: The status of offshore wind as at May 2010309
Offshorestatus Schemes Capacity(GW)
Operational 14 1.0
Under construction 4 1.5
Approved but not built 6 2.6
In planning process (includes applications anticipated but not yet submitted)
32 43.7
309RenewableEnergyStatisticsDatabasefortheUK(2010).

189
Section J: Offshore wind
Drivers The plausible build rate for offshore wind can be estimated using an understanding of wind turbine size and speed of installation. The build rate will depend on the efficiency of the supply chain, which in turn will be assisted by a clear understanding of the total capacity to be installed, the need to replace turbines (‘repowering’) and opportunities to re-deploy resources.
Turbine size As offshore wind technology develops and progresses, the size of turbines has increased from 2 MW on early Round 1 sites in 2003 to 3.6 MW on the most recent installations. The Beatrice demonstration project in the UK has installed two 5 MW turbines. Offshore wind farms in other countries have also installed 5 MW turbines at demonstration sites. By the middle of this decade, it is expected that 5-7 MW turbines will start to be deployed at scale. Clipper Windpower is currently developing and will manufacture a 10 MW offshore turbine in the North East.
Installation rateAs UK offshore wind farms become larger in size and as some sites are locating further from shore or in deeper water, there are a variety of factors to consider that can affect future installation rates. Some of these will be project and location specific, such as seabed conditions and foundation type, turbine size, the type of installation techniques used and the length of construction and operating period. This combination of factors makes it very difficult to estimate the optimal future build rate across the technology as a whole.
Offshore wind turbine construction is dependent upon the availability of jack-up barges. A study in 2008 indicated a potential installation rate per barge of 0.18 GW/year, assuming installation of uniform 3.6 MW wind turbines and full-time usage of a jack-up barge.310 This equates to an installation rate of around 50 turbines each year per barge. In a later study of future offshore deployment for the Committee on Climate Change the same rate per barge of 0.18 GW/year was proposed, on the basis that as future sites will be located further offshore, the rougher seas will reduce the amount of time during which construction can safely proceed, which negates any additional improvements in technology or installation methods.311
Total capacity The current overall industry ambition could be around 50 GW by 2020 but as an island nation we are in a great position to harness our abundant offshore wind, wave and tidal resources further in the future. The recent Offshore Valuation report used various scenarios to suggest that we could even have the potential to become a net electricity exporter.312
310SinclairKnightMetz(2008)Quantification of Constraints on the Growth of UK Renewable Generating Capacity.
311Pöyry(2009)Timeline for Wind Generation to 2020 and a set of progress indicators.312TheOffshoreValuationGroup(2010)The Offshore Valuation: a valuation of the UK’s offshore renewable
energy resource.

190
Pathways to 2050
However, it is important to note that as more wind farms are built there will be an increase in the cumulative impacts on all users of the sea. As part of normal planning considerations, the need for low carbon energy infrastructure will need to be balanced with the security, social and environmental interests in the marine sector, including other energy infrastructure and shipping, fishing, ports and defence activities. Depending on the scale of intervention that is possible, if significant offshore wind capacity is required beyond the current industry ambitions, then wind farms in zones with water depth greater than 60m may need to be developed using a range of technology types including floating turbines. Some industry stakeholders believe that the total capacity could be up to 200-250 GW.
Lifetime and replanting Offshore wind developers currently anticipate their infrastructure will last about 20 years, therefore probably requiring upgrades and re-planting during the standard 50 year site lease period.
Enablers Innovation and cost reductionDeployment of offshore wind provides the opportunity to explore different installation techniques, reduce weight and improve turbine reliability.313 To ensure that investing in renewables makes financial sense and helps bring down costs in the future, the Renewables Obligation (RO) was introduced in 2002 and awards a pre-determined number of Renewables Obligation Certificates (ROCs) per MWh of electricity generated for each renewables technology, including offshore wind. The Government has committed to extending the RO to at least 2037 in order to provide greater long term certainty to investors and the Coalition Programme explained that the Government would maintain banded ROCs.314 Any move to a Feed In Tariff would be done with the aim of ensuring the UK is best placed to meet 2020 targets, protecting both investors and consumers.
In addition to the RO mechanisms, the long term cost of offshore wind is likely to reduce to more competitive levels once new technology and improvements in design, installation and maintenance are developed, along with greater competition in the marketplace. Offshore test sites are needed in order to enable the necessary research and demonstration to take place in a cost effective environment.
The Low Carbon Energy Demonstration capital grants scheme was launched in 2009, specifically aimed at bringing forward the demonstration of new components or technology to support the earlier deployment (within 2020 timescales) of large scale multi-MW wind turbines. It also aims to provide a learning experience which can improve confidence and help reduce future costs, and underpin development of the industry by stimulating the UK supply chain. So far around £23 million has been awarded to consortia in order to develop a range of technologies, supporting innovative offshore wind companies in the UK.
313CarbonTrust(2008)Offshore wind power: big challenge, big opportunity.314HMGovernment(2010)The Coalition: Our programme for Government.

191
Section J: Offshore wind
Water depth and distance offshoreTo date, ‘monopole’ turbine structures have been the preferred design for wind turbine foundations in offshore wind farms with water depths below 30-40m in the UK, apart from the Beatrice demonstration project where a jacket structure (several tubular steel legs piled into the seabed) was used at a depth of around 45m. As sites are increasingly established in water depths of between 30m and 60m, a range of other foundation designs may be used, with the potential in the future to consider using floating platforms for water depths greater than 60m.315 A floating platform demonstration project with a 2.3 MW wind turbine has been installed off the coast of Norway.316
Some of the zones in Round 3 – where exploration work began in early 2010 – will require turbines to be installed significantly further from shore than is currently the case. The Government and developers are working hard to consider how this may impact on the reliability of the technology used, installation strategies, the speed of installation processes and the operation and maintenance of the wind farm once constructed.
Competition and opportunity Some parts of the supply chain are common to both onshore and offshore wind, so a significant increase in demand for onshore wind to meet European renewable energy targets could impact the delivery of the UK offshore market, and vice versa.
To provide the step change required to match the ambitions of the UK offshore wind market, we need a supply chain to deliver the necessary skills, technology, installation capacity, operations, maintenance and related infrastructure. Supply chain pressures in the UK are exacerbated by a global increase in demand from key onshore wind markets, such as the rest of Europe, the US and China, as well as other offshore wind markets from around the world. However it should be noted that whilst a significant response is required from the supply chain industry, the build rate anticipated to fulfil the industry’s stated ambition to 2020 and beyond is broadly similar to that achieved for coal powered generation in the 1970s and gas powered generation in the 1990s.
Drawing on experiences with the North Sea oil and gas industry, a new Offshore Wind Developers Forum has been created to bring together the Government and industry to take practical actions to ensure the viability and deliverability of offshore wind in the UK and to identify economic opportunities. The Crown Estate and the Government have also held a series of supply chain events across the UK to raise awareness about the opportunities for businesses in the offshore wind industry.
315Ibid.316StatoilHydropressreleases:www.statoil.com

192
Pathways to 2050
The levelsFigure J1 below illustrates trajectories for offshore wind power (including existing schemes) under four levels of deployment, which are described below.
Figure J1: Trajectories for electricity generation from offshore wind
� Level 1
� Level 2
� Level 3
� Level 40
50
100
150
200
250
300
350
400
450
2007
2040
2045
2035
2030
2025
2020
2015
2010
2050
TWh
per
year
In this assessment it has been assumed that wind turbines are decommissioned after 20 years of operation. This means that even though new turbines are installed at the same time as decommissioning the cumulative installed capacity levels off over time. It has also been assumed that the load factor is a constant 35%.317
Level 1This level of deployment assumes that there will be a continuous pipeline of projects for construction. The total capacity of 8 GW assumes a high level of success from Round 1 and 2 sites.
A build rate of 0.5 GW/year has been assumed, which is greater than the historic rate, but this was mainly at the smaller Round 1 sites, and should be achievable if the current supply chain is capable of delivering 0.65 GW/year as estimated in the Pöyry Report for the Committee on Climate Change (CCC).318 It is assumed that continuation of the supply chain is not affected by significant expansion of onshore wind or offshore wind in other countries.
It is also assumed that sites are not replanted when the turbines are decommissioned.319
317DepartmentofEnergyandClimateChange(2009)Digest of United Kingdom Energy Statistics.318Pöyry(2009)Timeline for Wind Generation to 2020 and a set of progress indicators.319‘Replanting’involvesthereplacementofthewholeoffshorestructure,abiggerjobthanrepowering
(whereonlytheturbineisreplaced)andonethatwouldrequirenewplanningpermission.

193
Section J: Offshore wind
Level 2This level of deployment assumes that there is a continuous pipeline of projects from Rounds 1, 2, 3, extensions and projects within Scottish territorial waters that successfully gain planning permission and are constructed within around 4 years of submitting planning applications.320 A significant proportion of the total capacity of 60 GW could be achieved from the current sites that have been leased by The Crown Estate. This capacity of 60 GW at 2050 is calculated to deliver 184 TWh of electricity per year.
It is assumed that the supply chain grows to 2020 broadly in line with the ‘high feasible’ scenario of the Pöyry report for the CCC, increasing to a build rate of 3 GW/year in 2021.321
The potential build rate needs to be assessed in the context of the overall credible ambition across a wider geographical area if using a common supply chain. The British Wind Energy Association highlighted this point recently:
‘If the delivery of offshore wind in the UK is ramped up to perhaps 3 GW per year in 2020, out of a wider European market of 6-7 GW per year, then it is possible to have 20 GW of operating capacity in that year. Note that this size of industry will require longer term visibility of the market than just to 2020. European Governments will need to articulate their vision for offshore wind to 2030 if the sustained investment required to bring costs down is to be brought forward. However, we believe that the 20 GW figure is a realistic and achievable objective, and that the Government should seek at least this amount in the mix by 2020.’322
Level 3To achieve a total installed capacity of 100 GW at this level of deployment, intervention is likely to be required to ensure additional areas for offshore wind are made available, or sites may need to be developed in deeper water. It is assumed that if additional sites are needed then they will become available in time to support a continuous pipeline of projects for construction, assuming development and approval within four years.
It is assumed that the supply chain grows significantly to 2017, with a build rate from 2017 above the supply chain growth in the ‘high feasible’ scenario of the Pöyry report for the CCC.323 This build rate then continues to increase up to 5 GW/year by 2025.
The challenge of delivering the capacity in this level was highlighted by the Carbon Trust:
“Delivering this level of offshore wind power [29 GW] in just over a decade is an immense challenge. It is equivalent in scale to the 90s ‘dash for gas’ and could require up to £75 billion in investment from industry, on a similar scale to that invested in North Sea oil and gas in the peak decade of its development.”324
Under this level, around 25 GW of installed capacity would be achieved by 2020, which was above industry expectations prior to The Crown Estate’s announcement.
320Pöyry(2009)Timeline for Wind Generation to 2020 and a set of progress indicators.321Ibid.322MemorandumsubmittedbytheBritishWindEnergyAssociation,HouseofCommonsEnergyand
ClimateChangeSelectCommittee(2008-9)Low Carbon Technologies in a Green Economy.323Pöyry(2009)Timeline for Wind Generation to 2020 and a set of progress indicators.324MemorandumsubmittedbytheCarbonTrustHouseofCommonsEnergyandClimateChangeSelect
Committee(2008-9)Low Carbon Technologies in a Green Economy.

194
Pathways to 2050
For example the Renewables Advisory Board had previously forecast that 18 GW would be achievable by 2020.325 The total capacity of 100 GW at 2050 is calculated to deliver 307 TWh of electricity per year.
Level 4To achieve a total installed capacity of 140 GW at this level of deployment, intervention is likely to be required to make additional areas available for offshore wind development, or sites may need to be developed in deeper water. It is assumed that if additional sites are needed then they become available in time to support a continuous pipeline of projects for construction, assuming development and approval within four years. The total capacity of 140 GW at 2050 is calculated to deliver 430 TWh of electricity per year.
As with level 3, the build rate to 2020 reflects rapid implementation and a high success rate for the developments proposed under Crown Estate development rounds and is significantly above the ‘high feasible’ scenario of the Pöyry report for the CCC, expanding further to 7 GW/year after 2025.326 The peak build rate is comparable to the estimate of 6.8 GW/year by 2020 in a report prepared for The Crown Estate.327
Possible technology developmentsAlthough a number of turbine manufacturers are field testing turbines purpose-built for the offshore environment, most offshore wind turbines today resemble ’marinised‘ onshore wind turbines. Both the European Commission and International Energy Agency have published roadmaps on wind suggesting that further innovation is required to drive down the cost of energy and reliability,328,329 including:
●● deep-water foundations, located at depths greater than 35 metres;
●● installation techniques;
●● direct drive generators, with machines with no gearbox or drive train potentially leading to reduced noise impact, and improved cost and efficiency of the technology;
●● direct current (DC) generation;
●● larger offshore turbines and floating turbines (by 2020); and
●● condition monitoring, involving testing and performance monitoring of various components of turbines in order to lower the cost of condition monitoring systems and produce more accurate information for operations and maintenance planning.
It has been suggested that in future hydrogen or other clean fuels could be used as conduits for the storage and transport of energy from offshore wind sites.330 This could require expansion of the offshore wind supply chain to include the production, collection, transfer and distribution of the hydrogen.
325Douglas-WestwoodLtdfortheDepartmentofBusiness,EnterpriseandRegulatoryreform(2008)Supply Chain Constraints on the Deployment of Renewable Energy Technologies.
326Pöyry(2009)Timeline for Wind Generation to 2020 and a set of progress indicators.327BVGAssociates(2009)Towards Round 3: Building the Offshore Wind Supply Chain.328EuropeanCommission(2009)Investing in the Development of Low Carbon Technologies (SET-Plan) A
Technology Road Map.329OrganisationforEconomicCo-operationandDevelopment/InternationalEnergyAgency(2009)
Technology Roadmap Wind Energy.330BritishWindEnergyAssociation(2007)UK Offshore Wind: Moving up a gear.

195
Section K: Tidal range
ContextTidal range technology uses the height difference in water levels caused by the tide to generate electricity. Tidal range therefore captures potential energy, rather than the kinetic energy of a tidal current, as in tidal stream technology. There are very few tidal range schemes in operation around the world. The only one of a significant size currently operating is the La Rance barrage in Brittany. This has a generating capacity of 240 MW and has been operating continuously since 1966. There is a similar size barrage at Sihwa in South Korea that is due to start operating by the end of 2010 and the Korean Government has recently announced plans for a larger barrage on the Incheon peninsula. There are a number of small scale schemes in Canada, Russia and China.
In the UK there have been studies carried out for various estuaries and bays over the past few decades, but interest has increased over the past couple of years. Currently, a tidal range project that is under 1 GW in size would receive support under the Renewables Obligation to the value of two Renewable Obligation Certificates (ROCs) per MWh of electricity produced. A Government-commissioned report is currently looking at the cost of and financial support for wave and tidal generation in the UK, and this is likely to feed into any future review of ROCs. 331
In 2007, the Sustainable Development Commission (SDC) published a report investigating tidal power opportunities across the UK which concluded, with conditions, that there is a strong case for a sustainable Severn Barrage from Cardiff to Weston, and also potential for barrages in other locations such as the Mersey, Wyre and Thames. 332
Building on the SDC’s recommendation, the Government carried out a two-year (2008-10) feasibility study of tidal power in the Severn Estuary. The feasibility study explored the costs, benefits, impacts and risks of a tidal power scheme, and includes a Strategic Environmental Assessment of the environmental and social impacts of five potential tidal power schemes. The Severn Tidal Power feasibility study has also looked at potential support measures for schemes over 1 GW, which are currently outside the scope of the Renewables Obligation. The Severn Estuary is a unique environment and is designated under several pieces of international and national environmental legislation for the species and habitats within it. In addition, work was carried out on the regional economic impacts, supply chain, financing and development of new tidal range/stream technologies.
The feasibility study is due to report in 2010 on whether the Government should support a scheme in the Severn and if so on what terms. Following the conclusions of that report, the Government will announce whether it can support a project in the Severn Estuary and, if so, the terms of that support. The figures presented here do not pre-judge the conclusions of the feasibility study but instead use indicative volumes of
331DepartmentofEnergyandClimateChangeandScottishGovernment(2010,notyetpublished) Cost of financial support for wave, tidal stream and tidal range generation in the UK.
332SustainableDevelopmentCommission(2007)Turning the Tide, Tidal Power in the UK.

196
Pathways to 2050
the UK’s total tidal range resource, which may or may not include a scheme in the Severn Estuary at some point before 2050. In 2010 feasibility studies were also underway for the Mersey, the Solway Firth, and the Duddon, and additional studies are also planned for the Wyre and at several sites along the North Wales Coast.
Figure K1: Potential tidal range sites around the UK333
Solway Firth
Duddon, MorecambeBay & Wyre
Mersey & Liverpool Bay
Conwy
Severn
Wash
Thames
Dee
DriversResource The UK has one of the best natural tidal range resources in the world, with estimates that tidal range could meet 13% of our total electricity demand if fully exploited.334 The schemes that are currently being considered under feasibility studies only represent a fraction of this potential. Table K1 is based on the view of the SDC and other experts of the tidal range resource available. Most of the exploitable resource is located down the west coast, though there are also some possible sites on the east coast. The largest single site is the Severn Estuary, one of the top locations in the world for tidal range, which could, if harnessed, generate 5% of UK electricity demand. The five schemes studied in detail by the Government’s feasibility study are set out in Table K2.
333DepartmentofEnergyandClimateChange,adaptedfromSustainableDevelopmentCommission(October2007)Tidal Power in the UK – Research Report 1 – UK Tidal Resource Assessment; originalfigurebyMetoc.
334WorldEnergyCouncil(2004)Survey of Energy Resources.

197
Section K: Tidal range
Table K1: Potential tidal range resource outside the Severn Estuary335
Location Meantidalrange(m)
Estimatedinstalledcapacity(MW)
Predictedannualenergyoutput(TWh)
Solway Firth 5.5 7,200 10.25
Morecambe Bay 6.3 3,000 4.63
Wash 4.45 2,400 3.75
Humber 4.1 1,080 1.65
Thames 4.2 1.120 1.37
Mersey 6.45 620 1.32
Dee 5.95 840 1.16
Table K2: Tidal range schemes being considered in the Government’s Severn Tidal Power Feasibility Study336
Scheme Meantidalrange(m)
Estimatedinstalledcapacity(MW)
Predictedannualenergyoutput(TWh)
Cardiff-Weston Barrage
8.3 8,640 16.80
Shoots Barrage 9.15 1,050 2.77
Beachley Barrage 9.3 625 1.67
Welsh Grounds Lagoon
8.7 1,360 2.31
Bridgewater Bay Lagoon
8.05 1,360 2.64
Established technologyThe technology for tidal range is very similar to hydroelectric projects and is well understood. The most efficient form of operation is one-way generation (ebb only). The incoming tide is allowed to pass through sluices and this body of water is then held back by the barrage/lagoon as the tide ebbs. When the water level on the seaward side is low enough, the water behind the embankment is released back to the seaward side through the turbines, generating electricity. Alternatively, the impoundment can be operated in two-way mode, making use of both the flood and the ebb tide, but this requires more expensive turbines and large caissons.337
335BinnieandPartnersReport(1989)The UK Potential for Tidal Energy from Small Estuaries.336DepartmentofEnergyandClimateChange(2009)Severn Tidal Power, Phase One Consultation.337A‘cassion’isalargeboxorchamber,usuallyofsteelbutsometimesofwoodorreinforcedconcrete,
usedinbarrageconstruction.

198
Pathways to 2050
Extended lifetime Tidal range schemes have an estimated lifetime of over 120 years. The scheme at La Rance has been operating for over 40 years, and on a recent routine inspection the 24 turbines showed hardly any signs of wear despite continuous use. In general, once the capital costs of such tidal range schemes have been recouped, the electricity is cheap to produce as the operation and maintenance costs are low and there are no ongoing fuel costs.
Intermittent but predictable power generationElectricity generated from tidal range is intermittent but the generation is predictable as it follows the tides. This allows the system operator to balance the timing of the generation within the electricity transmission system, although the timing does not necessarily match peaks in demand, when electricity has the highest value. However in the future it should be possible to manage demand towards when the electricity is generated. As the electricity generated could come from a variety of sites around the UK coasts, it would be possible to have phased generation, which would help overcome issues with intermittency.
Other driversTidal range schemes that cross estuaries can include road or rail transport links. Proponents believe that such creative use of the infrastructure could support economic growth and job creation in the area where a barrage is constructed. A scheme could also become a tourist attraction, and if it is built high enough the barrage could provide flood protection.
EnablersSupply chain There is no established installation rate for tidal range projects, given the limited number of projects in existence. There will be a need in future, especially for a large scheme, for significant quantities of materials (sand and gravel, concrete, rocks); manufacturing facilities (turbines, gates); construction yards (caissons, locks); vessels (jack-up barges, cranes, dredgers); skilled labour (marine engineers); and project managers. These requirements could cause significant constraints in the supply chain, having an impact on the costs and roll-out of any tidal range construction programme. Early planning and placing of orders will be essential.
Studies by the Severn Tidal Power Group in the 1980s and a supply chain study for the Government’s Severn Tidal Power feasibility study state that an improvement in the existing international hydro turbine manufacturing facilities, including expansion of existing facilities or even a possible construction of a dedicated facility in the UK, would be required to support the delivery rate for turbines for a larger Severn Estuary scheme.338,339 Turbines could be transported to the UK, but given capacity constraints at existing facilities and the size of the turbines (up to 9 metres in diameter), manufacturers may choose to open new facilities in the UK.
338DepartmentofEnergy(1989)Severn Barrage Project (STPG) – Detailed Reports (Volumes I-V).339DepartmentofEnergyandClimateChange(2010–notyetpublished)Severn Tidal Power Supply Chain
Report.

199
Section K: Tidal range
Technology developmentThe Severn Tidal Power feasibility study gave rise to some innovative concepts being proposed, such as embryonic ‘tidal fence’ and ‘tidal reef’ designs, together with some novel designs for constructing embankments and walls. Some of these technologies, such as hybrids between tidal range and tidal stream technologies and very low head turbines, have been studied under the Severn Embryonic Technologies Scheme (SETS). New wall or embankment designs have also been looked at as part of the assessment of options in the feasibility study.
The design of turbines could be improved to make for more efficient two-way electricity generation and water pumping, and also to make them more friendly to migratory and estuarine fish. There is also a need to develop better modelling tools and methodologies to assess environmental impacts, such as sedimentation and erosion, and to improve energy yields via different operating modes.
The levelsFigure K2 below illustrates trajectories for tidal range schemes under four levels of deployment, which are described below.
Figure K2: Trajectories for electricity generation from tidal range schemes
� Level 1
� Level 2
� Level 3
� Level 40
5
10
15
20
25
30
35
40
45
2007
2040
2045
2035
2030
2025
2020
2015
2010
2050
TWh
per
year
Please note that these levels of deployment have been calculated prior to the conclusion of the Government’s Severn Tidal Power feasibility study. The levels presented here are hypothetical and without prejudice to the conclusions of any of the studies underway in 2010 or of any planning and consenting decisions.
The assumptions common to all levels of deployment below are that tidal range has a load factor of 24% and an availability of 95%.340
340DepartmentofEnergyandClimateChange(2010–notyetpublished)Severn Tidal Power: Options Definition Report.
200
Pathways to 2050
Level 1This level of deployment assumes that the current situation continues, with no tidal range schemes being built in the UK.
Level 2This level of deployment assumes that one of the three feasibility studies currently underway (Mersey, Solway, Severn) comes to fruition by 2020 with a further scheme built by 2030 and a third to follow by 2050. For example, one scenario with this level of ambition could see the construction of a scheme, on the Solway ranging between 250-300 MW; a scheme on the Mersey of around 400 MW; and one of the smaller schemes under consideration for the Severn Estuary, of between 600-1000 MW. The total capacity of 1.7 GW at 2050 is calculated to deliver 3.4 TWh of electricity per year.
Level 3This level of deployment is high, with 13 GW of tidal range power being installed. By 2020, 800 MW is installed in line with the tidal range deployment scenario produced by Black and Veatch.341 The total capacity of 13 GW at 2050 is calculated to deliver 26 TWh of electricity per year.
Such a high level of ambition could be met by schemes in the Solway and Mersey built by 2020; a medium Severn Estuary scheme (3.6 GW) built by 2030; and a large Severn Estuary scheme (8.6 GW) built by 2040. This would require expansion of the supply chain including caisson construction yards in the UK and expansion of worldwide turbine manufacturing and perhaps a turbine assembly plant in the UK.
Level 4This very high level of deployment assumes that all of the UK’s tidal range resource identified as being suitable is used to generate power. A potential timeline for this deployment could be schemes in the Solway, Mersey and medium and large Severn schemes built by 2025 and all practical tidal range resource (approximately 20 GW in total) developed by 2050. This would require significant expansion of the supply chain, large imports of materials and the construction of one or more turbine plants in the UK. The total capacity of 20 GW at 2050 is calculated to deliver 40 TWh of electricity per year.
341DepartmentofEnergyandClimateChangeandScottishGovernment(2010–notyetpublished)Cost of and financial support for wave, tidal stream and tidal range generation in the UK.

201
Section L: Wave energy and tidal stream
ContextWave and tidal stream technologies are currently emerging electricity generation technologies but they have significant potential to reach commercial deployment. As a result, the contribution that wave and tidal stream technologies can make to achieving the UK target of an 80% reduction in greenhouse gas emissions by 2050 could be significant.
Wave energy is created as winds pass over open bodies of water and transfer some of their energy to form waves, which can then be captured by wave conversion technologies to provide power. Tidal stream technologies harness the energy from the tides through the sheer velocity of the currents turning the blades of an underwater turbine (the majority of turbine designs are not dissimilar to a submerged wind turbine).
In early 2010 the Government announced a vision for the marine energy sector in the future, and set out the key steps both industry and the Government will need to take to achieve mainstream deployment of wave and tidal stream energy around the UK’s coasts by 2020/2030.342 Policies in this area will continue to be developed in collaboration with industry and other interested parties.
UK wave and tidal resourceThe UK is considered to be the global leader in the development of both wave and tidal stream technologies and has a uniquely rich wave and tidal resource. Work carried out by RenewableUK and the Carbon Trust has suggested it may have the potential to meet 15-20% of the UK’s current electricity demand once established.343
However, there are uncertainties about the wave and tidal resource because of the developing state of the industry, not least in terms of the methodologies and assumptions used to calculate the possible outputs out to 2050. This analysis seeks to improve the methodologies used in calculating tidal stream resource and indeed the assumptions used in the wave power calculations. However, the opportunities presented by this resource have led to the UK becoming a focus globally for the development and deployment of wave and tidal stream technologies.
Technology developmentThe UK is at the forefront of the wave and tidal stream renewable energy industry through its research and development programmes, test facilities and marine and offshore experience gained from the oil and gas industries. The UK has two dedicated operational test facilities, the National Renewable Energy Centre (NaREC) and the
342DepartmentofEnergyandClimateChange(2010)Marine Energy Action Plan.343BritishWindEnergyAssociation(nowRenewableUK)(2006)Path to Power.
202
Pathways to 2050
European Marine Energy Centre (EMEC), in addition to ‘WaveHub’, a new demonstration facility in the South West that will be commissioned during 2010.344
There is a high volume of different device types currently in development, reflecting the large engineering challenges in harnessing wave and tidal power. The high financial cost of development makes it complex to determine and support the most effective emerging devices.
In recent years there has been significant progress in the marine industry with the testing of full-scale prototype devices at sea and the installation of the first grid-connected deep water wave energy device and tidal stream devices. The Crown Estate has announced the first commercial leases of the seabed and anticipates the deployment of commercial wave and tidal stream technologies to begin in the period up to 2015. At the end of April 2009 the UK had one 0.5 MW wave energy machine installed, and 1.45 MW of tidal stream capacity installed in two devices.345 Since this time, at least one further wave device has been deployed for testing increasing the wave energy installed capacity to approximately 0.8 MW. In addition to this, several other wave and tidal stream devices are either about to begin testing or are currently being tested.
DriversThe plausible build rate for wave and tidal energy deployment can be estimated from a number of factors, including an understanding of the maximum levels of resource, the level of industry expertise and the rate at which the establishment of commercial-scale technology takes place. The build rate is also affected by the availability of the electricity grid connection and the ability of the supply chain to provide raw materials, components and manufacturing, deployment and other services. In addition to this, the opportunities for repowering and redeployment would also need to be considered within the build rate.
344CarbonTrust(2009)Focus on Success.345BritishWindEnergyAssociation(2009)State of the Marine Industry in the UK.
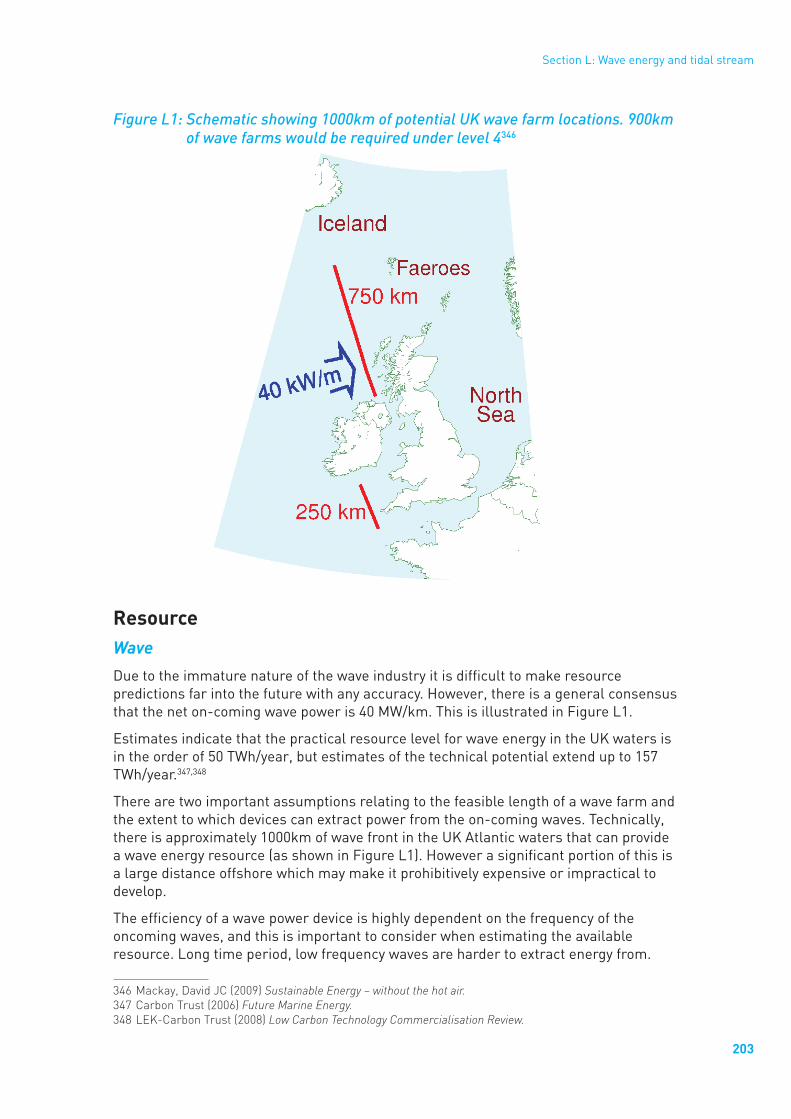
203
Section L: Wave energy and tidal stream
Figure L1: Schematic showing 1000km of potential UK wave farm locations. 900km of wave farms would be required under level 4346
ResourceWave
Due to the immature nature of the wave industry it is difficult to make resource predictions far into the future with any accuracy. However, there is a general consensus that the net on-coming wave power is 40 MW/km. This is illustrated in Figure L1.
Estimates indicate that the practical resource level for wave energy in the UK waters is in the order of 50 TWh/year, but estimates of the technical potential extend up to 157 TWh/year.347,348
There are two important assumptions relating to the feasible length of a wave farm and the extent to which devices can extract power from the on-coming waves. Technically, there is approximately 1000km of wave front in the UK Atlantic waters that can provide a wave energy resource (as shown in Figure L1). However a significant portion of this is a large distance offshore which may make it prohibitively expensive or impractical to develop.
The efficiency of a wave power device is highly dependent on the frequency of the oncoming waves, and this is important to consider when estimating the available resource. Long time period, low frequency waves are harder to extract energy from.
346Mackay,DavidJC(2009)Sustainable Energy – without the hot air.347CarbonTrust(2006)Future Marine Energy.348LEK-CarbonTrust(2008)Low Carbon Technology Commercialisation Review.
204
Pathways to 2050
In this report, the fraction of on-coming wave power which is captured is estimated to be between 20% and 25%, which is considered optimistic.349
Geographically, the largest wave resource is located off the west coast of Scotland and south west England/Wales, where the fetch (the distance travelled by waves without an obstruction) is across the Atlantic.
Tidal stream
The development of devices to capture the energy from tidal streams is still a very immature industry and again estimates of resource remain highly uncertain. It has been widely quoted that the total UK tidal stream potential is of the order of 17 TWh/year.350 This is derived from a method that provides the most conservative estimate.351 The tidal stream resource is largest off the north eastern coast of Scotland (the Pentland Firth), Strangford Lough in Northern Ireland, The Skerries off the coast of Anglesey, Wales, and the Channel Islands, where constrictions of tidal channels funnel water creating increases in flow velocity.
However, academic research has highlighted uncertainties surrounding the calculation of practical resource and other methods of estimating the tidal stream resource have resulted in higher technical potentials of up to 197 TWh/year.352,353 A number of different methods have so far been used to determine the theoretical resource, as outlined below. The kinetic flux method has historically been the preferred method, although recent papers have questioned its applicability in all but very specific situations.
●● The kinetic energy flux method, as used by the widely-referenced Black and Veatch study, calculates the kinetic energy in the water moving through a perpendicular plane within a channel.354
●● The bottom friction model considers the amount of tidal energy being dissipated by friction on the sea bed since some of this energy could also potentially be captured by the devices. This technique was originally used by Taylor and subsequently by Salter.355,356 The method suggests that the available resource could be an order of magnitude larger than that of the kinetic energy flux method.357
●● MacKay conducts an analysis of the energy contained in the tide modelled as a wave assuming there is no bottom friction.358 This method also suggests that the tidal resource is larger than that of the kinetic energy flux method by an order of magnitude.
In addition to this, Houlsby et al performed analysis suggesting that the theory that there is a maximum limit to the possible energy obtainable from devices has been
349Mollison(1986)Wave climate and the wave power resource.350SinclairKnightMerz(2008)Quantification of Constraints on the Growth of UK Renewable Generating
Capacity.351Blunden,LSandBahaj,AS(2006)Tidal energy resource assessment for tidal stream generators.352Houlsby,GT,Oldfield,MLGandDraper,S(2008)The Betz Limit and Tidal Turbines.353MacKay,DavidJC(2009)Sustainable Energy – Without the hot air.354BlackandVeatchConsulting,CarbonTrust(2004)UK, Europe and global tidal stream energy resource
assessment.355Taylor,GI(1918)Tidal Friction in the Irish Sea.356Salter,SHandTaylor,JRMT(2007)Vertical-Axis Tidal-Current Generators and the Pentland Firth.357Taylor,GI(1918)Tidal Friction in the Irish Sea.358MacKay,DavidJC(2009)Sustainable Energy – Without the hot air.
205
Section L: Wave energy and tidal stream
inappropriately applied to turbines in tidal flows.359 Their calculations show that the actual resource could be 1.5–4 times greater when tidal turbines block a large fraction of the tidal channel.
Industry and academics across a range of disciplines, including oceanography, turbulence, marine energy and physics, need to collaborate to come to a consensus on the appropriate methods for estimating resource and the subsequent predictions that result.
A second area of uncertainty relates to the impact of energy extraction on the remaining resource, for example the extent to which resource is available within a formation of devices or a tidal stream farm. There is limited practical experience from which to draw any clear conclusion and until further arrays and tidal stream farms are constructed there will remain considerable uncertainty regarding the degree to which the deployment of an array of tidal stream devices alters the available resource. Furthermore these considerations are likely to be highly site specific.
As indicated there are a number of uncertainties but the potential resource they suggest is sufficiently large to justify further research. The tidal stream industry currently has a slight advantage over the wave industry in that devices are not only beginning to be deployed but they are also seeing some consensus in their design. Data and experience from all the installations will help to improve future resource estimations.
Finally, the full extent of both wave and tidal stream resource which can be exploited for generation is also dependent on many other assumptions including device capacity, interactions between devices, their spacing and formation in wave and tidal stream farms, cumulative impact and the other constraints on deployment such as shipping, defence and environmental considerations. Overall, the more wave and tidal stream devices that get deployed, the greater our level of understanding and exploitation of the available resource will be.
ExpertiseThe UK has a unique opportunity to capture the benefits of this new sector through the entire supply chain, from research and development through to engineering, manufacturing, installation and maintenance. Many of the leading device developers are located in the UK and they enjoy a comparative advantage due to their extensive domestic knowledge and experience. The UK has engineering and manufacturing expertise in the complex systems required for power conversion, which are high value and can be exported globally. The UK also has the historical advantage of manufacturing success in industries relevant to the wave industry, including oil, gas and shipping. In discussions with the marine industry, it has been commented that the UK’s offshore experience in the North Sea has developed strong UK skills and expertise which could prove valuable for the emerging wave and tidal stream sectors.
Supporting the most effective devicesCurrently a large number of devices for wave and tidal stream are in development, and determining and supporting the most effective devices has been found to be difficult. In the wave industry there are varying designs due to different deployment locations
359Houlsby,GT,Oldfield,MLGandDraper,S(2008)The Betz Limit and Tidal Turbines.
206
Pathways to 2050
(onshore, nearshore and offshore) and fundamentally different approaches to extracting energy from waves, while tidal stream devices are showing more convergence towards a submerged horizontal axis turbine. The wish to establish a ‘lead’ technology approach from the plethora of devices forms a strong driver for those inside the wave and tidal stream industry and those looking to invest in this ‘lead’ technology.
Grid availabilityAs with other renewable energy technologies, the timely construction of grid connections is seen as essential by the sector (this is referred to in greater detail in Section P: Electricity balancing).
Lifetime and planningDue to the harsh conditions in which the wave and tidal stream technologies operate, the overall plant life is assumed in this assessment to be 20 years.360 The supply chain required to decommission and replace the plant is likely to develop further, however at this stage of assessment the impact of the replacement activities is unclear. The design of future wave and tidal stream technologies may extend plant life or components of the technology and reduce the rate at which they need to be replaced.
EnablersIn order for wave and tidal stream technologies to become commercially viable and to contribute to achieving the 2050 target the sector will require improvements to enable the technology to move forward. These are outlined below.
Innovation and cost reductionThe development of wave and tidal stream devices to commercial viability requires cost reduction and further step changes in technology development to reduce the cost of energy thereafter. Cost reductions may be found through:
●● fundamental change in the engineering design of devices;
●● more efficient use of materials;
●● new and innovative ways of conducting installation, operation and maintenance; and
●● increased efficiency of components.
Financing The development of wave and tidal stream devices is currently expensive. Many developers are small to medium sized companies formed with the sole purpose of developing a specific device. Not only are these developers faced with trying to secure funding for the development of the device but also the funds to support the day-to-day operations of the company. This sector requires a mixture of both public and private funding to enable commercial viability of the technologies, and funding will need to be applied in different forms, including grant funding, equity investment and market
360Redpoint/Trilemma(2009)Implementation of the EU 2020 renewables target in the UK electricity sector: RO Reform.

207
Section L: Wave energy and tidal stream
incentives. The opening up of private finance into wave and tidal stream development is necessary for the continued development of the sector.
Regulatory framework To ensure continued progression in this sector, the regulatory frameworks for leasing, planning and consenting need to be aligned to allow for commercial deployment of wave and tidal stream devices.
A Strategic Environmental Assessment (SEA) report for the development of wave and tidal stream energy around the Scottish Coastline was completed in 2007.361 As a result The Crown Estate carried out a competitive application process for commercial seabed lease options for marine energy devices in the Pentland Firth, off north eastern Scotland. In March 2010 the Government also commissioned a full SEA for wave and tidal technologies in English and Welsh waters. The Crown Estate will look at opportunities for commercial leasing opportunities in England and Wales. The Crown Estate is initiating a programme of activities relating to commercial offshore renewable energy leasing in Northern Ireland and Scotland following the completion of relevant SEAs in these countries.
The Marine and Coastal Access Bill received Royal Assent in November 2009 and saw the creation of a strategic marine planning system.362 This has led to changes in the marine licensing system which should result in more consistent licensing decisions and, through the Marine Management Organisation which will make decisions on offshore energy installations of less than 100 MW generating capacity, will enable the sector to kick start deployment.
However, to enable the longer term development of the sector, projects of more than 100 MW generating capacity will fall to the regime for nationally significant infrastructure projects established by the 2008 Planning Act. Although the Government intends to return decision making under this regime to Ministers, it will retain the streamlined consenting process for these projects. This would enable the sector to work towards achieving the scalability potential of the technologies when they are ready in the future.
Supply chainThe development of wave and tidal stream technologies will lead not only to a substantial generation industry in the UK, but more importantly to a substantial supply chain, a large part of which will be based in the UK provided the UK’s technological lead is maintained and there is an attractive environment for domestic or inward investment in manufacturing facilities. In the longer term the potential for jobs arising from the wave industry is expected to continue to increase, peaking at 16,000 in the 2040s of whom about 25% will support UK exports.363 Similar numbers are also expected to arise from the tidal stream industry.
361ScottishExecutive(2007)Scottish Marine Renewables Strategic Environmental Assessment Report.362UKParliament(2009)Marine and Coastal Access Bill.363CarbonTrust(2009)Focus on Success.
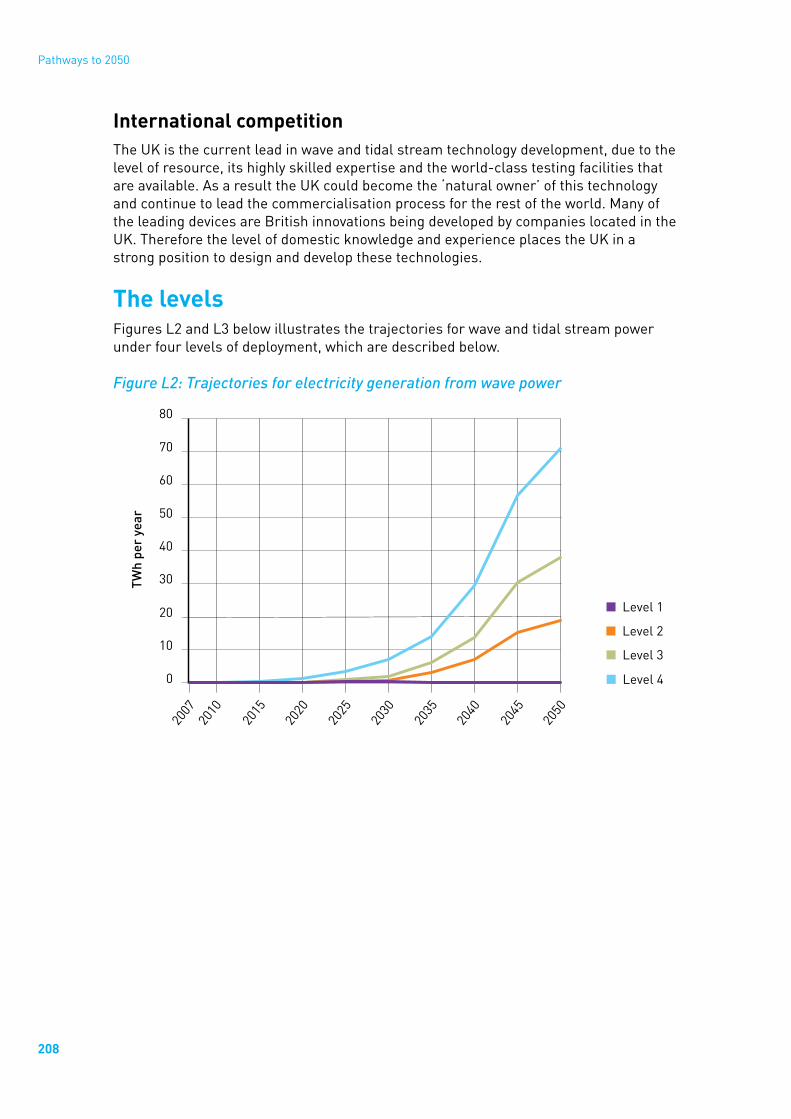
208
Pathways to 2050
International competitionThe UK is the current lead in wave and tidal stream technology development, due to the level of resource, its highly skilled expertise and the world-class testing facilities that are available. As a result the UK could become the ‘natural owner’ of this technology and continue to lead the commercialisation process for the rest of the world. Many of the leading devices are British innovations being developed by companies located in the UK. Therefore the level of domestic knowledge and experience places the UK in a strong position to design and develop these technologies.
The levels Figures L2 and L3 below illustrates the trajectories for wave and tidal stream power under four levels of deployment, which are described below.
Figure L2: Trajectories for electricity generation from wave power
� Level 1
� Level 2
� Level 3
� Level 40
10
20
30
40
50
60
70
80
2007
2040
2045
2035
2030
2025
2020
2015
2010
2050
TWh
per
year

209
Section L: Wave energy and tidal stream
Figure L3: Trajectories for electricity generation from tidal stream power
� Level 1
� Level 2
� Level 3
� Level 40
10
20
30
40
50
60
70
80
2007
2040
2045
2035
2030
2025
2020
2015
2010
2050
TWh
per
year
The common assumptions for wave deployment include that, when calculating the installed wave capacity from annual energy yield, we always assume a load factor of 25% and allow for a device availability of 90%.
Tidal stream estimates have been based on the three deployment scenarios in a report recently published by the Offshore Valuation Group but also allowing for a device availability of 90%.364 These estimates fall in between the highest and lowest published resource estimations.365 The load factor in this calculator is always assumed to be 40%, which is consistent with the report.
Level 1This level of deployment assumes that for both wave and tidal stream technologies there will be a very gradual increase in the number of projects being deployed out to 2040 based on current levels of financial support, and no further developments or increases in the level of financial support available to the sector. Deployment after 2040 is affected by the termination of the current Renewables Obligation policy in 2037, and without this level of support it assumes a fall-out of deployment to 2050 for both technologies.366 Overall, the potential of the sector is not achieved.
Level 2Level 2 assumes that for both wave and tidal stream technologies there will also be slow growth initially. However, an increase in learning rates during the early 2020s speeds up growth of the sector, particularly for wave energy. This level benefits from sufficient increases in the level of financial support for both wave and tidal stream, which leads to investor confidence in the sector. The supply chain at this level is more active in its cost reductions through the standardisation of components and volume of
364TheOffshoreValuationGroup(2010)Valuing the UK Offshore Renewable Energy Resource.365Ibid.366UKParliament(2010)The Renewables Obligation (Amendment) Order 2010.

210
Pathways to 2050
production. Grid connections have also been enabled and development of an enhanced distribution network has occurred.
The wave deployment assumptions are 300km of wave farms in the Atlantic delivering 8 MW per km (20% of raw power) with a device availability of 90%. The tidal stream deployment assumptions are 2 GW of installed capacity (1000 2 MW machines) with a load factor of 40% operating with 90% availability. The total capacity of 11.5 GW at 2050 is calculated to deliver 25 TWh of electricity per year.
Level 3This highly ambitious level of deployment for both wave and tidal stream shows significant acceleration in proving and commercialising the technologies between 2015 and 2020. It has been assumed that there are much greater increases in the level of financial support for the sector from both Government and private investment, leading to the accelerated development of technologies and more rapid deployment. The supply chain is assumed to be very active, promoting cost reductions and drawing on expertise that has already been gained during the expansion of offshore wind, including in manufacturing, ports and deployment vessels. It is also assumed that for both wave and tidal stream, grid connections will be developed and that significant upgrades to the distribution network are carried out in more remote sites where the resource is high.
The wave deployment assumptions are 600km of wave farms in the Atlantic delivering 8 MW per km (20% of raw power) with a device availability of 90%. The tidal stream deployment assumptions are 9.4 GW of installed capacity (4700 2 MW machines) with a load factor of 40% operating with 90% availability. The total capacity of 29 GW at 2050 is calculated to deliver 68 TWh of electricity per year.
Level 4This extremely ambitious level of deployment for wave and tidal stream shows an exceptional speed of development and deployment of technology. Although there is very little demonstrable capacity in 2010, by 2020 there is 0.8 GW and 0.5 GW capacity for wave and tidal stream technologies respectively, which equates to many hundreds of devices. This is a challenging timeline but it assumes much greater increases in the level of financial support for the sector to drive innovation in order for significant step changes to occur as soon as possible. This funding is assumed to be both through significantly increased government support mechanisms and through larger private investment in technology development and project finance. In this level, the supply chain is engaged and proactive in continually realising potential cost reductions, succeeding in driving down cost through step changes.
For both technologies, it is likely that there will be some element of repowering (the reinstallation and replacement of devices at utilised sites) that will increase the output per km of wave front intercepted and the output per area of sea occupied by tidal turbines. In this level, no grid constraints will be present and all development of the onshore grid distribution network would have occurred to enable the resource of wave and tidal stream to be harnessed.

211
Section L: Wave energy and tidal stream
The wave deployment assumptions are 900km of wave farms in the Atlantic delivering 10 MW per km (25% of raw power) with a device availability of 90%. An alternative level 4 would be to assume 750km of wave farm extracting 30% of the raw power (a greater technology improvement) with a device availability of 90%. The tidal stream deployment assumptions are 21.3 GW of installed capacity (10,600 2 MW machines) with a load factor of 40% operating with 90% availability. The total capacity of 58 GW at 2050 is calculated to deliver 139 TWh of electricity per year.

212
Section M: Microgeneration of electricity
ContextMicrogeneration of electricity is currently a costly mitigation measure relative to others, although relative cost-effectiveness could significantly change between now and 2050. And small scale wind in particular can only make a very small contribution towards overall national targets for renewable energy. However, small scale generation can empower individuals by enabling them to contribute towards a common goal, or even to benefit personally or within a community. It is also an important tool in engaging the public and can often be used as a lever for behavioural change. Anecdotal examples of consumers reducing their overall energy use in response to generating their own energy are often quoted. Microgeneration is also considered by many to be crucial in order to garner public acceptance and support for the level of change needed to deliver the overall targets.
In April 2010 a system of feed-in-tariffs to incentivise small scale, low carbon electricity generation was introducted using powers in the Energy Act 2008. The ‘clean energy cashback‘ will allow many people to invest in small scale, low carbon electricity, in return for a guaranteed payment for the electricity they generate. Small scale wind and solar PV generation up to 5 MW are eligible for the feed-in-tariff.
This section considers the potential supply from (1) small scale wind and (2) solar photovoltaic (PV).
Small scale windSo far, there has been minimal deployment of small scale wind in the UK. However the UK has a growing domestic small scale wind industry. In a recent report by the Carbon Trust, the total resource for small scale wind energy was estimated to be 41.3 TWh/year of electricity. However, for many reasons it was considered practical to achieve only a small proportion of these figures.367 In the recent Encraft Warwick Wind Trials Project Report, the industry and technology was described as still at the development stage and that it was likely to make a tangible contribution to energy and carbon saving but only on the most exposed sites and tallest buildings.368
Drivers and enablersThe energy generated by small scale wind farms will depend upon the number of suitable sites; the take-up and installation rates; and the size, efficiency and load factor of the wind turbines.
367CarbonTrust(2008)Small-scale wind energy – Policy insights and practical guidance.368Encraft(2009)Warwick Wind Trials Project, Final Report.

213
Section M: Microgeneration of electricity
Number of installation sites
A practical approach to assessing the resource for small scale wind was conducted by the Energy Saving Trust, which found that there is potential to generate 3.5 TWh/year of electricity from domestic small scale wind turbines in the UK.369 The greatest potential for successful small scale domestic wind installations was in Scotland, and the best performing free standing sites in the field trials were always remote rural locations, usually individual dwellings near the coast or on exposed land such as moors. The Energy Saving Trust assumed in its analysis that installations should only be installed at locations where the average wind speed is greater than 5m/s.
Take up and installation rates
The Energy Saving Trust’s scenario assumed a 50% uptake for agricultural farms; 30% uptake for pole mounted sites for buildings with significant land; and 10% for building mounted sites. The trajectories outlined below also look at higher and lower uptake rates. These would depend on a range of factors including the costs of the wind turbines in comparison to other energy sources, supply chain constraints, public attitudes and government policy.
Size, efficiency and load factor
The Energy Saving Trust reported average load factors for pole mounted installations to be 19%, with some sites in Scotland achieving in excess of 30%. The analysis also assumed that one 6kW wind turbine was installed at each suitable site and achieved an average load factor of 24%. However, higher generation rates could be achieved by installing more than one turbine at each site, or using larger 15kW turbines.
In the case of farms, the most likely limitation on higher uptake levels is the size of the grid connection. Upgrades to the grid infrastructure are likely to be expensive. Maximum installation sizes without grid upgrades are likely to be between 25-150kW depending upon the size of the farm and the size of the grid connection to the farm.
The trajectoriesFigure M1 below illustrates four trajectories for small scale wind schemes, which are described below.
369EnergySavingTrust(2009)Location, location, location. Domestic small-scale wind field trial report.

214
Pathways to 2050
Figure M1: Trajectories for electricity generation from small scale wind
0
2
4
6
8
10
Level 1Level 2Level 3Level 4
2007
2050
2045
2040
2035
2030
2025
2020
2015
2010
Elec
tric
ity p
rodu
ced
per
year
(TW
h/ye
ar)
Level 1This level of ambition is based upon the pessimistic assumption that significant numbers of micro-wind turbines are not installed in the UK.
Level 2This level of ambition is based upon the estimate for the realistic uptake of domestic small scale wind turbines in the report by the Energy Saving Trust.370 This was based upon field trial results and assessed the potential number of domestic small scale wind turbine (400W to 6kW) installations at domestic sites with a suitable wind speed of at least 5m/s. The analysis indicated that there are likely to be approximately 450,000 domestic properties in the UK that would have a suitable wind resource, adequate land area and/or building profiles. The analysis assumes that a 50% uptake for agricultural farms, 30% uptake for pole mounted sites and 10% for building mounted sites would deliver 1.34 TWh/year. In order to construct a suitable build rate, a maximum annual growth rate of 25% per annum is assumed, with a one-off jump in installations to 25 MW a year. For example, 25 MW of installed capacity would be almost 4,500 6kW installations. By 2015 the rate of installations would have reached over 12,000 and by 2020 the roll-out of small scale wind turbines would peak at about 40,000 a year, reaching saturation shortly after that. Maintenance and replacement would mean an ongoing role for the small scale wind industry for this level and higher ones.
Level 3The ambition for this level is based upon the Energy Saving Trust’s estimate of the number of suitable domestic properties371 but assumes a 100% uptake. Gross annual generation from these turbines (maximum size 6kW) would be approximately 3.5 TWh/year. In order to construct a suitable build rate on an ambitious scale, a maximum annual growth rate of 50% per annum is assumed, with a one-off jump in installations
370Ibid.371Ibid.
215
Section M: Microgeneration of electricity
to 50 MW a year.372 For example, 50 MW of installed capacity would be almost 9,000 6kW installations. By 2015 the rate of installations would have reached over 60,000, reaching a peak shortly after and by 2020 the roll-out of small scale wind turbines would effectively be complete.
Level 4This level is based upon the maximum feasible resource and would require significant investment in infrastructure and the roll-out of small scale wind turbines on non-domestic sites as well, rather than limiting installations to domestic sites as in the previous levels. This level of ambition is based on the Element Energy / Poyry estimates for the total UK potential for sub-5 MW wind turbines.373. The report estimates that the total resource for sub-5 MW turbines is over 17 TWh/year, although 8.4 TWh/year of this was for turbines larger than 500kW which would be accounted for elsewhere within the onshore wind section. Therefore the maximum resource for small scale wind in level 4 is assumed to be 8.6 TWh/year. This is also commensurate with the Energy Saving Trust report which was based upon the assumption that a single turbine of maximum 6kW would be installed at each site. A significant number of sites from the Energy Saving Trust report are farms or dwellings with large land areas where it would be feasible to install more than one turbine, and so installing larger 15kW turbines or increasing the number of turbines per site would achieve a similar upper estimate.
In order to construct a suitable build rate, the ambitious maximum annual growth rate of 50% per annum is assumed with a one-off jump in installations to 50 MW a year. Growth would therefore be identical to level 3, but installation rates would continue to grow and peak around 2020 with installation rates of around 200,000, when the roll-out of small scale wind turbines would effectively be complete.
Solar PVSo far, there has been little deployment of solar PV (photovoltaic) in the UK (see Table M1). However, the installation rates presented here have been demonstrated in a number of other countries around the world (see Table M2).
372ElementEnergy,PÖYRY(2009)DesignofFeed-inTariffsforSub-5MWElectricityinGreatBritain.FinalReport.
373Ibid.

216
Pathways to 2050
Table M1: The status of solar PV in the UK374
Year Installedcapacity(Megawattpeak
[MWp])
Annualgrowthrate Installationrate(MWp)
2004 8.2 – –
2005 10.9 33% 2.7
2006 14.3 31% 3.4
2007 18.1 26% 3.8
2008 22.5 24% 4.4
Table M2: The status of solar PV in the world375
Year Installedcapacity(MWp)
Annualgrowthrate Installationrate(MWp)
2004 3,847 38% 1,052
2005 5,167 34% 1,320
2006 6,770 31% 1,603
2007 9,162 35% 2,392
2008 14,730 61% 5,568
The solar PV industry’s plans to develop photovoltaic energy in the UK over the next decade are ambitious. The UK photovoltaic manufacturers association (UK-PV) consider that solar PV could contribute more than 21 TWh/year of electricity by 2020, which would represent about 26 GWp (Gigawatt Peak) of installed capacity.376 For comparison this would be equal to roughly 8.7 million domestic 3kWp (roughly 15-20 m2) installations by 2020. Build rates would have to be very ambitious in order to achieve this, and average growth in installed capacity would have to exceed 75% per year between 2010 and 2020.
To put this in context with wider industry expectations, the European Photovoltaic Industry Association has similarly ambitious targets and believes that solar PV could generate 12% of electricity in Europe by 2020.377 This is based upon upper estimates of industry growth rates and would require approximately 340 GWp of installed capacity in Europe. The UK, with 26 GW, would represent a 7.6% market share.
Delivering this amount of solar PV in just under a decade would be an immense challenge and represents the upper estimate of the PV industries’ projections for growth. It would require relatively large solar PV installations to be installed on roughly 25% of the country’s domestic building stock. This would be an unprecedented challenge and require major effort at all levels of society.
374DUKES2009375EuropeanPhotovoltaicIndustryAssociation(2009)Solar Photovoltaic Electricity: A mainstream power
source in Europe by 2020.376UKPhotovoltaicManufacturersAssociation(2009)Feed-in-Tariff Consulation Response.377EuropeanPhotovoltaicIndustryAssociation(2009)Solar Photovoltaic Electricity: A mainstream power
source in Europe by 2020.

217
Section M: Microgeneration of electricity
Drivers and enablersThe energy generated by solar PV will depend upon the number of suitable sites; the take-up and installation rates; and the size, efficiency and load factor of the solar panels.
Number of installation sites
In theory it would be possible to generate all of the UK’s electricity from solar PV. If 5% of the UK’s surface area (5,800km2) was covered in solar PV with an average load factor of 9.7%, almost 1,150 TWh/year of electricity could be generated.
However, this would require over 1,350 GWp to be installed by 2050, equivalent to about 100m2 per person. Additional problems would also be encountered around the time of day and year that the electricity would be generated, with obvious supply problems at night time and during winter months. The amount of energy storage capacity required to smooth supply in order to meet demand would also be considerable.
Practical estimates exist such as those produced by UK-PV who have calculated that there is a total of 4,000km2 of available roof space and facades on UK buildings and that the resource potential for south facing roofs and facades is about 140 TWh/year.378
Take up and installation rates
The plausible installation rate for solar PV can be estimated by comparing the UK with worldwide build rates, in particular in countries such as Japan, Germany, the US and Spain, which account for much of the installation. In 2007, the UK had a market share of 0.16%. Clearly it could multiply its installation rates dramatically for a number of years without imposing a noticeable burden upon the supply chain. Spain did this in 2007, starting from a low base and increasing its capacity by 480% in one year.379
The UK Energy Research Centre (UKERC) in 2007 estimated that the UK could realistically achieve 16 GWp of installed capacity by 2030, assuming that 75% of installations in 2030 would be domestic (implying four million domestic installations) with the balance installed on public and commercial buildings.380
The energy used in manufacture is normally paid back within 1-4 years, warranties are normally given for 25 years, and life expectancy is normally assumed to be 30 years or more.381
Size, efficiency and load factor
The UKERC report assumed that future domestic solar PV systems will average around 3kWp in capacity and roughly 15-20m2 in size, which will fit on most roofs.382
378UK-PV(2009)2020 A vision for UK PV.379Stafford,AnneandIrvine,Stuart(2009)UK Photovoltaic Solar Energy Road Map.OpTICTechnium/
GlyndwrUniversity,380Infield,David(2007)A Road Map for Photovoltaics Research in the UK.UKEnergyResearchCentre.381USNationalRenewableEnergyLaboratory(January2004)PVFAQs:WhatistheenergypaybackforPV?382Infield,David(2007)A Road Map for Photovoltaics Research in the UK.UKEnergyResearchCentre.

218
Pathways to 2050
An average load factor of 9.7% (850kWh/kWp per year) is typically assumed for well orientated (ie, south facing and free of obstructions) UK solar PV installations.383 The average load factor is a function of solar panel efficiency and the average incident solar radiation of the UK which is also a function of UK weather conditions.
The trajectoriesFigure M2 illustrates four trajectories for small scale solar PV, which are described below.
Figure M2: Trajectories for electricity generation from small scale solar PV
0
20
40
60
80
100
120
140
160
Level 1Level 2Level 3Level 4
2050
2045
2040
2035
2030
2025
2020
2015
2010
Elec
tric
ity p
rodu
ced
per
year
(TW
h/ye
ar)
Level 1This level of ambition is based upon the pessimistic assumption that significant installations of solar PV in the UK do not occur and existing installations are not maintained.
Level 2This level assumes that by 2050 there would be the equivalent of 4m2 of photovoltaic panels per person in the UK. In the report by POYRY and Element Energy on the design of feed-in tariffs, the technical potential for solar PV was estimated to be 60 TWh/year,384 which would require roughly 70 GWp of installed capacity by 2050.
This is a level of ambition greater than existing trends would predict: an increase in average growth in installed capacity (to match that seen worldwide in the last five years) to 34% per year is projected out to 2020. This would result in an installed capacity of almost 0.9 GWp by 2020. Beyond 2020, increases in average growth in installed capacity are assumed to be about 20% between 2020 and 2030 and about 13% beyond 2030, delivering 70 GWp of installed capacity by 2050.
383ElementEnergy,PÖYRY(2009)Design of Feed-in Tariffs for Sub-5MW Electricity in Great Britain.FinalReport.
384Ibid.
219
Section M: Microgeneration of electricity
Level 3This level assumes that by 2050 there would be the equivalent of 5.4m2 of solar PV per person, generating roughly 80 TWh/year of electricity. This level of ambition is based upon a report written by the UK Energy Research Centre (UKERC) in 2007, which estimates that the UK could realistically achieve 16 GWp of installed capacity by 2030.385 The report also assumes that future domestic solar PV systems will average around 3 kWp in capacity and roughly 15-20m2 in size, which will fit on most roofs. It assumes that 75% of installations in 2030 will be domestic, implying four million domestic installations, and the balance will be installed on public and commercial buildings. A total of 16 GWp of installed capacity would generate roughly 13.6 TWh/year of electricity by 2030. In order to achieve a realistic projection of growth commensurate with a significant effort, a ‘catch-up’ average growth in installed capacity of 45% is assumed for ten years up to 2020 delivering 2.5 GWp of installed capacity, followed by an average growth in installed capacity of 20% between 2020 and 2030.
By 2050 UKERC estimates that there could be 20 million domestic installations delivering 60 GWp of installed capacity. If it is assumed that non-domestic buildings have a similar coverage in terms of surface area, then they could contribute an additional 35 GWp of installed capacity. A total of 95 GWp of installed capacity would generate about 80 TWh/year of electricity and be equivalent to roughly 5.4m2 per person.
Level 4The amount of installed solar PV capacity in level 4 needs to be even more ambitious than level 3, yet still physically possible. Typical approaches for such calculations normally assume that south facing roofs present the most logical sites for installations, and use this assumption to calculate the potential for solar PV in the UK. This is not strictly true, as ground based installations are likely to be suitable in many locations. UK-PV has estimated that there is a total of 4,000km2 of available roof space and facades on UK buildings.386 It calculates that the resource potential for this total area is 460 TWh/year or 140 TWh/year for south facing roofs and facades. This latter figure is roughly in line with estimates by Mackay of 111 TWh/year,387 and the IEA of 105 TWh/year, both based upon south facing roofs only.388
The ambition of level 4 is based upon 140 TWh/year in 2050, which would come from a mixture of optimally sited roofs and facades and ground-based installations and would be equivalent to roughly 9.5m2 per person.
A build rate of 75% per year is used for this level to achieve the UK-PV target of 26 GWp by 2020. Beyond 2020 a reduction in the average annual growth in installed capacity of roughly 26% each year is assumed. This would represent a peak installation rate of 17.6 GWp in 2023, with saturation of all optimum sites between 2030 and 2040. This peak installation rate is highly challenging but plausible considering the European Photovoltaic Industry Association projection that the PV supply chain is expected to
385Infield,David(2007)A Road Map for Photovoltaics Research in the UK.UKEnergyResearchCentre.386UK-PV(2009)2020 A vision for UK PV.387MacKay,DavidJC(2009)Sustainable Energy – Without the hot air,UIT,Cambridge.388IEA(2002)PVPS Annual Report.

220
Pathways to 2050
deliver and sustain production to support a market between 80 GW and 160 GW worldwide.389
The replacement rate necessary for normal wear and tear has been assumed to be relatively low compared to overall installation rates.390 Adequate levels of maintenance are implicitly assumed as it is necessary to keep panels clean and free of debris in order to maximize efficiency.
389EuropeanPhotovoltaicIndustryAssociation(2009)Solar Photovoltaic Electricity: A mainstream power source in Europe by 2020.
390Stafford,AnneandIrvine,Stuart(2009)UK Photovoltaic Solar Energy Road Map.OpTICTechnium/GlyndwrUniversity.
221
Section N: Geothermal electricity generation
ContextRocks buried deep underground can hold a considerable amount of heat. The deeper they are, the more heat they tend to store. Moreover, specific geological features such as granite generate considerable amounts of heat due to natural radioactive decay. Through the use of geothermal technologies, this heat deep in the earth can be mined and used to generate electricity. The emissions from this form of electricity generation will be close to zero.
In the UK, Cornwall is considered to be the region with the most potential for developing geothermal power plants. There is a wealth of information available about the geology of Cornwall, and geothermal resources specifically, as a result of mining operations going back to Roman times; and the work done at the UK Engineered Geothermal Systems project at Rosemanowes in the 1980s. Cornwall has an underlying basement of granite, and estimates from the project at the time were that this resource could potentially supply the UK with 3% of today’s electricity consumption, for the next 50 to 200 years.
There are other granite basements in the north of England and in North East Scotland, which could also supply geothermal energy for electricity generation. It is estimated that in the UK as a whole, there is the geothermal resource to produce the equivalent of up to 35 TWh of electricity per year for around 50 years down to a depth of 6km391 (approximately 5 GW with an average load factor of 80%).
Via the Deep Geothermal Challenge Fund, DECC has awarded grants to help explore the potential for deep geothermal power in the UK, assisting companies to carry out exploratory work necessary to identify viable sites.
Drivers and enablersTechnological advancesTo date, the UK has not fully harnessed its geothermal potential, largely due to the depth of drilling required to reach a suitable temperature. However, in recent years interest in geothermal electricity generation in the UK has been triggered by the development of technologies which can harness heat from dry rocks buried at depths of around 3–5km (often called ‘Enhanced Geothermal Systems’ or EGS). High-pressure water is pumped through a specially drilled well into these rocks, causing them to fracture. The water permeates through these artificial fractures, extracting heat from the surrounding rock, which acts as a natural reservoir. This ‘reservoir’ is later penetrated by a second well, which is used to extract the heated water.
391MacDonaldP,SteadmanAandSymonsG(1992)TheUKGeothermalHotDryRockR&DProgramme,EnergyTechnologySupportUnit,Harwell.ReportedinPROCEEDINGS,SeventeenthWorkshoponGeothermalReservoirEngineering(January29-31,1992)StanfordUniversity,Stanford,California,SGP-TR-141.

222
Pathways to 2050
Much of the technology that has been developed has its roots in the Rosemanowes project. This trial in the 1980s was a success but the technology to drill the necessary depths was not commercially viable at the time. However, subsequent developments in drilling technology and the introduction of carbon pricing policy instruments have renewed interest in the results of the Rosemanowes projects and in geothermal electricity generation in the UK as a whole.
Demonstration projectsThere are currently two demonstration projects being planned in the UK, partly supported by the Department of Energy and Climate Change under the ‘Challenge Fund for Deep Geothermal Energy’.
EGS Energy in partnership with the Eden project is developing a 3 MWe plant which is expected to come on stream in late 2012. The waste heat will also be used by the Eden Project to heat greenhouses in a combined heat and power operation. It is anticipated that the demonstration plant could be scaled up so that it eventually generates between 25–50 MWe.
Geothermal Engineering Ltd is developing a 10 MWe and 55 MWt power plant at Redruth in Cornwall. It hopes that the plant will be operational by 2013.
The trajectoriesFigure N1 illustrates trajectories for geothermal electricity generation in the UK under four levels of ambition, which are described below.
Figure N1: Trajectories for geothermal electricity generation under four levels of deployment
0
10
20
30
40
Level 1Level 2Level 3Level 4
2050
2045
2040
2035
2030
2025
2020
2015
2010
Elec
tric
ity p
rodu
ced
per
year
(TW
h/ye
ar)
An average load factor of 80% is used in all of the trajectories. And it is assumed that 5.5 times the amount of thermal energy compared to electrical energy will be available for other uses if suitable demands are available, based upon the ratio of heat to electricity for the Redruth demonstration plant.

223
Section N: Geothermal electricity generation
Level 1This level of ambition is based upon no additional interest or investment in geothermal electricity generation.
Level 2This level of ambition is based upon successful demonstrations of geothermal electricity generation in the UK with currently planned schemes in operation by 2015. Investment and interest in geothermal electricity generation is then focused on the optimum resources and sites, mostly in Cornwall, and installed capacity grows at roughly 32% per year. Total installed capacity levels reach about 1 GW by 2035 mostly representing the practical resource in Cornwall.
Level 3This level of ambition is also based upon successful demonstrations of geothermal electricity generation in the UK with currently planned schemes in operation by 2015. Investment and interest in geothermal electricity generation is expanded to include areas other than Cornwall where granite is predominant and of the right age such as in the Midlands near Chesterfield, and in Cumbria. Installed capacity grows at roughly 52% per year to reflect the larger number of sites being developed, and reaches a total installed capacity of 3 GW by 2030.
Level 4This level of ambition is based upon exploiting the maximum technically feasible resource. Most industry reports estimate that the UK could generate up to 35 TWh/year from geothermal electricity generation. This would equate to an installed capacity of roughly 5 GW. It has been estimated that the total available resource in the UK is around 1880 TWh, so this rate of extraction would last for approximately 50 years. Higher rates of extraction are considered unfeasible and even this level is only possible in an aggressive scenario 4.392 Installed capacity grows at roughly 64% per year and reaches a total installed capacity of 5 GW by 2030.
392Ibid.

224
Section O: Hydropower
ContextCurrent installed hydropower capacity in the UK is 1.6 GW, which generates about 5 TWh/year, approximately 1.4% of the UK’s electricity demand.393 The majority (90%) of this comes from large-scale hydro, which was installed during the first renewable energy revolution in the 1940s and 50s, with the remaining 10% from hundreds of micro and small scale schemes. As well as generating electricity, some large hydropower plants combined with pumped storage facilities have the additional function of being able to store energy. This becomes increasingly important as the level of intermittent sources of electricity grows.
Using the powers in the Energy Act 2008 the Government has introduced a system of feed-in-tariffs to incentivise small scale, low carbon electricity generation. Feed-in tariffs will offer financial support for a) the generation and b) the export of renewable electricity from hydropower over a number of years which should encourage businesses, local authorities, householders and communities to invest in small scale low carbon electricity generation, in return for a guaranteed payment for the electricity they produce. Hydropower generation of up to 5 MW is eligible for feed-in-tariffs. The support will work alongside the Renewables Obligation for installations larger than 5MW. Feed-in-tariffs are expected to stimulate a rate of installations up to 2020 commensurate with level 3.
Drivers and enablersIt is considered unlikely that many more large scale schemes will be developed, since most of the economically attractive sites have already been exploited and there are considerable environmental concerns with developing new ones. However, there is still significant potential for developing the small hydro resource on existing weirs and disused mills, as well as for developing more pumped storage facilities.394
The average load factor for hydro schemes is estimated at 35-40% across the year, with 38% being the figure used in this analysis. The load factor at any given point in time can vary from 80% in winter down to 10-20% in summer, depending on the amount of rainfall.
The trajectoriesFigure O1 illustrates trajectories for hydroelectricity generation in the UK under four levels of ambition, which are described below.
393DepartmentofEnergyandClimateChange,Digest of UK Energy Statistics (2009).394MacKay,DavidJC(2009)Sustainable Energy – Without the hot air,UIT,Cambridge.

225
Section O: Hydropower
Figure O1: Trajectories for hydroelectricity generation under four levels of deployment
0
2
4
6
8
10
12
14
Level 1Level 2Level 3Level 4
2050
2045
2040
2035
2030
2025
2020
2015
2010
Elec
tric
ity p
rodu
ced
per
year
(TW
h/ye
ar)
Level 1The normal lifetime for hydro turbines is 40 to 50 years, although they can last longer if well maintained. Many of the schemes installed in the mid 20th century now need major refurbishment, so there is a challenge to maintain the current level of generating capacity at around 1.6 GW. There are, however, possibilities for small increments to the total from small and micro hydro schemes. This level of ambition assumes that current installed capacity is maintained but no new capacity is installed.
Level 2This level of ambition assumes that the refurbishment of existing capacity is coupled with a programme of upgrades of existing installations, for example replacing turbines with more efficient ones, and optimising maximum operating height. Coupled with this, the roll out of a number of micro-hydro sites progressively increases the total installed capacity from 1.6 GW to 2.1 GW by 2050.
Level 3In the last few years, studies of the remaining hydro resource have been carried out for Scotland, England and Wales. The Scottish Hydropower Resource Study,395 published in August 2008, estimates the remaining practical resource at 657 MW (base case). The Department of Energy and Climate Change and Welsh Assembly Government funded the ‘England and Wales Hydropower Resource Assessment’396 which estimates the current viable hydropower resource at between 156 and 248 MW. Taking the most optimistic figures would give a total remaining viable resource of 900 MW which, when added to the existing 1.6 GW would give 2.5 GW of generating capacity in 2050.
395NickForrestAssociatesLtd,SISTech,Black&VeatchLtd(August2008)Scottish Hydropower Resource Study – Final Report.
396DepartmentofEnergyandClimateChange/WelshAssemblyGovernment(2010–yettobepublished)EnglandandWalesHydropowerResourceAssessment.
226
Pathways to 2050
This level of ambition assumes that the additional 900 MW of capacity is installed progressively at a rate of 45 MW per year until 2030 and maintained beyond this.
Level 4A more recent study on the employment potential of Scotland’s hydro resource397 includes an up-rating of the remaining resource from 657 MW to 1.2 GW, which would generate up to 4 TWh/year. The Environment Agency’s recent report on hydropower opportunities in England and Wales398 looks at the maximum theoretical potential from a strategic point of view, while taking account of fish protection legislation. It came up with a Maximum potential capacity for England and Wales of 1.2 GW. Thus the total remaining UK maximum potential would equate to around 2.4 GW, which would make 4 GW in total in 2050. However, realising this potential is dependent on overcoming a number of environmental, technical and financial constraints.
This level of ambition assumes that an additional 2.4 GW of capacity is installed starting at a rate of 45 MW per year from 2010, with the installation rate growing by approximately 8% until installed capacity reaches 4 GW in 2035 and is maintained beyond this.
397Forrest,N&Wallace,J(September2009)The Employment Potential of Scotland’s Hydro Resource.398EnvironmentAgency(February2010)Opportunity and environmental sensitivity mapping for hydropower in
England and Wales- Non-technical project report.

227
Section P: Electricity balancing
ContextThe electricity system must be continually balanced to match supply and demand. This section sets out the range of options to ensure the electricity system can operate securely to supply peak demands and manage second-by-second variations. There is a range of existing and future technology options available to meet changing requirements. The transition to new forms of balancing on a low carbon electricity grid will need to be well managed in order to ensure that sufficient power is delivered, and delivered reliably.
Balancing supply and demandTo achieve the required balance in the electricity system from the timeframe of a few seconds through to daily, weekly and seasonal variations we need to ensure there is adequate means to flex generation and demand.
Balancing has historically been achieved by varying the output of generation (including existing pumped storage and interconnection) to meet indicated demands for electricity. To date, sufficient flexibility for second-by-second through to weekly balancing has been available from coal- and gas-fired generating stations. The existing UK nuclear fleet is less flexible over shorter timescales, but all sources of supply take some account of seasonal changes in demand when scheduling station output. Where possible, for example, nuclear plants will carry out maintenance and fuelling shutdowns during the lower demand periods of the summer. In addition, demand is already seen to respond to price signals in the market, moving demand to lower priced periods and avoiding high priced periods of the day (for example overnight storage heating).
Looking ahead, it is likely that daily and seasonal electricity demand trends will change with the potential changes driven by the growth in electric vehicles and water and space heating supplied by electric heat pumps.
At the same time, the transition to low carbon electricity generation sources (nuclear, CCS and renewables) introduces two additional challenges. First, some renewable sources, such as wind, have a more variable output; second, the low carbon sources of nuclear and fossil fuel with CCS due to come on stream between now and 2050 are perceived to be less flexible than existing coal and gas stations.
The analysis undertaken to date identifies that balancing can be managed on a technical level to deliver security of supply, but that there are a number of questions as to how this can be best optimised to ensure efficiency.399 This optimisation covers both the development of technology and physical measures, such as flexible generation
399See,amongstothers,Ofgem(2009)Project Discovery;Poyry(2008)Impact of Intermittency;NationalGrid(2008)Operating the Electricity Markets in 2020

228
Pathways to 2050
sources and smart demand, and the development of commercial arrangements for the electricity market and for new innovations such as smart demand and smart grids.
Analytical approachThis analysis considers the options that will provide flexibility in the electricity system to balance against a varying level of (in particular) wind output. This flexibility must be adequate to cover both the routine variability of wind output across hours and days; and periods of low wind winter cold spells associated with anticyclone weather systems, sometimes also called blocking events, that can last for a number of days.
For this analysis, the Government has sought to identify the range of capabilities for each technology group that could help to balance the electricity system. It has then assessed this capability against the requirement for balancing flexibility in each pathway. The analysis has not included an assessment of the impact on plant load factor.
DriversThe requirement for flexibility can be broken down into a number of time bands as follows:
●● Instantaneous: Instantaneous flexibility refers to continual management of frequency and is needed to smooth the continual second-by-second fluctuations in supply demand balance. In addition this flexibility must also secure the system from a sudden loss of a generator or large demand block. Typically this requirement is set by the largest generation loss and/or the requirement for short term spinning reserve.
●● Hourly: Variations across timeframes of an hour to several hours are currently driven by changes in demand, such as the increase in demand in the early morning, and as lights are turned on in the evening. In the future this requirement will also be driven by varying levels of wind generation.
●● Daily variations: Currently the UK has a lower electricity demand level at night, with higher demand during the day. This repeating daily pattern of demand is met by altering generation output.
●● Weekly variations: The weekly demand cycle sees higher demands during the typical working week (Monday to Friday) and lower demands at weekends.
●● Seasonal variations in demand: Typically, average UK electricity demand is higher in the winter than the summer due, for example, to increased lighting and heating load. Currently only around 10% of heating load is provided by electricity, typically powering storage heaters in areas that are not connected to the gas network. In the future the electrification of additional heat load may increase winter electricity demands.
In the current electricity market more than 98% of supply/demand matching is completed by the functioning of the electricity market ahead of time. A residual of less than 2% is completed by the system operator, National Grid, as it balances the system in real time. Whilst there will be new challenges in achieving supply/demand balance, this analysis assumes that a similar split will exist in the future, with the system

229
Section P: Electricity balancing
operator taking a perhaps larger but still very small minority of actions to balance the system.
Sector segmentation usedElectricity balancing can be segmented into different sectors, as considered in several analytical assessments of 2050 as well as the IEA 2009 working paper on electricity storage.400 Broadly, these fall into four categories.
1. Flexibility designed into generating stationsA number of analyses assume that future nuclear and CCS generating sources will not be flexible. It is not clear that this will be the case and it can be expected that some flexibility will be provided by these stations.
The current UK nuclear fleet is inflexible in its output, perhaps for historical reasons, due to the alternative flexibility available from coal and gas units. However, the current French nuclear fleet does provide some fast flexibility to manage fluctuations. It also provides some flexibility to match weekly and seasonal demand variations through careful management of refuelling and maintenance work across the fleet as a whole.
It is expected that a future UK nuclear fleet would be able to provide similar levels of flexibility to the existing French fleet and will therefore be a significant contribution to the flexibility required for short term, near instantaneous regulation as well as weekly and seasonal variability.
The technical potential for CCS plant flexibility is less clear as these stations are in earlier development. Whilst there are concerns as to the flexibility that can be provided from post-combustion CCS stations, there are design options that may allow these stations to provide fast flexibility at least equivalent to that of future nuclear stations and greater flexibility to regulate output over weekends and overnight. However, this work is still at an early stage. Improvements in flexibility would mirror the development of existing coal and gas stations, both of which became more flexible as the technology developed. Pre-combustion CCS stations are generally expected to be at least as flexible as existing gas-fired power stations.
A key point noted in some analyses is that the higher capital cost and lower operating cost, in particular of nuclear plant but also CCS, may mean that the financial model for investment in these stations is less suited to flexibility. This is because flexing the units will tend to reduce the high load factors needed to fund the capital cost.
In summary therefore, it is reasonable to expect, for all levels, a minimum level of flexibility from future nuclear and CCS plant similar to current French nuclear levels, providing some short term, weekly and seasonal balancing. For low load factor operation, alternative solutions are likely to prove more economic than nuclear or CCS. It is assumed that thermal stations can enhance availability during winter cold spells by taking short-term measures to move planned shutdowns or improve short term reliability. As a result, thermal power stations are assumed to be able to provide on average 5% more energy in the winter than their average annual output.
400IEA(2009)Prospects for Large-Scale Energy Storage in Decarbonised Power Grids,www.iea.org

230
Pathways to 2050
2. Storage: conventional pumped storage and new technology solutionsAt present there are several pumped storage stations in the UK, the largest being Dinorwig in North Wales with a storage capacity of approximately 10 GWh and a peak output of 2 GW. These stations have long lifetimes and can be expected to be still operational in 2050. The development of new stations is also possible within the UK.
Future flexibility and storage requirements may lead to different specifications that have a higher storage capability relative to peak output. If pumped storage were to provide longer term, multi-day or weekly storage then it is likely that storage capacities would need to be significantly larger than current designs. Such projects would be a major capital undertaking and the impact on the local environment can be expected to be a key concern. Dinorwig, for example, was approved via an Act of Parliament rather than through the local planning system. Pumped storage lagoons, built in the sea or estuary areas, have also been proposed as an alternative to large scale land-based pumped storage.
There are a number of alternative forms of storage which, by 2050, may provide large scale storage, including batteries and heat stores. Multi-MW scale battery systems have been installed at a number of sites worldwide. These technologies have not yet been proven on a scale required for national balancing but would provide an alternative to large scale storage at level 3 or 4.
3. InterconnectionInterconnection already forms part of the existing market mix. It allows power sharing between interconnected systems, in particular the large European power markets via the existing 2 GW connection to the French system. There is also an existing 0.5 GW link between Scotland and Northern Ireland.
A new 1 GW connection with the Netherlands is under construction and there are plans to build interconnectors with a number of other countries including Ireland, Belgium, Norway and France. Both existing and planned projects mean that capacity could grow by 200–500% over the next 15 years.
Interconnection can adjust flows very quickly (within seconds to minutes) and can also provide longer term support across hours or days. For example, power could be exported during high wind periods and imported during low wind periods. Imported power could be used immediately, offsetting local supplies or stored, through pumping or offsetting generation in the large scale hydro power resources of the Alps or Norway. Key to any assumptions about the flexibility interconnection might provide is the level of diversity we can expect to see across Europe in terms of demand variation, generation use and in particular wind output. This diversity and the benefits of integrating offshore wind with interconnectors are being studied further as part of existing work on interconnection. In this analysis we assume that interconnector transfers would be somewhat linked to variable power sources, for example periods with high wind output would lead to increased exports and low wind output would lead to increased imports of electricity across interconnection. For very low wind conditions in the UK, it is assumed that flows to the UK would be up to 75% of available interconnection capacity, driven, for example, by diversity of generation and wind output across continental Europe and the larger hydroelectric storage capability of Norway and the Alps.

231
Section P: Electricity balancing
4. Flexible demandFlexible demand, which may form part of a smart grid system, could play a major role in matching supply and demand. The development of this sector may be facilitated by the roll-out of smart metering, which may provide metering of shorter time periods, for example use in each half hour. This would allow demand to target low priced periods, for example when the wind is blowing. Smart grids may also play a key role in more complex optimisation solutions for flexible demand.
The amount of flexible demand assumed in different 2050 analyses varies but the assumption used is generally between 20% and 30%. With the right incentives there may be many opportunities to develop flexible demand across the domestic, industrial and commercial sectors. The level of actual accessible flexible demand and the period over which demand can be flexed will depend heavily on the path taken by technology development in each sector. This analysis focussed on the potential flexibility from electrified transport and domestic and commercial electric heat demand. Both are discussed below.
Car charging
There are a wide range of possible scenarios but the key drivers are battery size and pattern of future use:
●● If electric vehicles (EV) or plug-in hybrid electric vehicles (PHEV) car batteries remain of similar capacity to daily usage requirements, we expect to see regular charging patterns, particularly overnight, which could be flexed to provide short term variations in demand during the charging period.
●● At the high end, a growth in car battery capacity, perhaps to 40 kWh, may see less regular charging by many users and the ability to provide significant weekly flexibility through selective charging. Fuel switching of PHEVs to run solely on their liquid fuel source could also be used to reduce electricity demand. This assessment does not include the further option to re-export power from the battery to the grid.
Electric heat
Flexing heat demand is likely to be able to provide large quantities of short term flexibility if it can be incorporated into heat pump operation without major reductions in efficiency.
Space heating may be able to provide demand flexibility from a few minutes to a number of hours whilst preserving required heating levels, but this would be dependent on the level of insulation and the thermal mass of the heated source. For example, a well-insulated house with under-floor heating installed in a concrete floor with high thermal mass may be able to flex heating demand for many hours, or even days. An air-to-air heat pump in a poorly insulated home may provide flexibility over a few tens of minutes only. If incentives were present, it is possible that longer term heat stores could become widespread. Based on existing technology these would allow greater flexibility of heat demand, perhaps over several days.
It should also be noted that the volume of electric heat flexibility will vary with the season. In the winter large volumes of space heating could potentially be flexed. During the summer the only demand available from heating will be lower levels of water heating demand unless there is significant growth in air cooling, which could provide

232
Pathways to 2050
similar flexibility to heat. Increased penetration of solar thermal heating would reduce electric water heating demand flex capability in the summer.
For this analysis it is assumed that there is flexibility of up to 12 hours for space heating in a well insulated home, to avoid peak demand periods, or up to 12-24 hours for water heating.
The levelsLevels chosen in 2050 Pathways Calculator are presented as a combination of ranges between storage, interconnection and flexible demand.
Level 1●● Storage: remains at today’s level.
●● Interconnection: according to current plans, interconnection increases to 4 GW, but then remains stable from 2015 onwards.
●● Flexible demand: no shiftable demand provided by any form of car charging.
Level 2●● Storage: up to two or three projects to develop storage capacity at existing stations
or small new stations may be developed. Storage capacity peak output gradually increases from today’s 3.5 GW to 4 GW.
●● Interconnection: increases significantly over the coming two decades and stabilises at 10 GW.
●● Flexible demand: around a quarter of all EVs and PHEVs have a shiftable electricity demand capacity.
Level 3●● Storage: significant step change with the development of at least two large pumped
storage stations or lagoons, each with six times the storage capacity of Dinorwig. Storage capacity peak output increases to 7 GW in 2050.
●● Interconnection: increases to 15 GW in 2050.
●● Flexible demand: around a half of all EVs and PHEVs have a shiftable electricity demand capacity.
Level 4●● Storage: development of two very large pumped storage sites and two pumped
lagoons, giving a total storage capacity of 400 GWh or 0.4 TWh, approximately forty times that of Dinorwig. Storage capacity peak output reaches 20 GW. Alternatively, a significant proportion of this capacity could be provided by a new storage source, such as battery or heat storage.
●● Interconnection: very high levels of up to 30 GW could be achieved, which may include some integration of interconnection with large offshore wind farms. This figure is in line with other analyses of the potential for a highly interconnected European grid.

233
Section P: Electricity balancing
●● Flexible demand: 75% of all EVs’ and 90% of all PHEVs’ storage capacity are being utilised for shifting demand.
Table P1: Development of storage capacity peak output, GW
Storage:PeakPower GW
Level 2007 2010 2015 2020 2025 2030 2035 2040 2045 2050
1 3.5 3.5 3.5 3.5 3.5 3.5 3.5 3.5 3.5 3.5
2 3.5 3.5 3.5 3.8 3.8 3.8 3.8 3.8 3.8 4.0
3 3.5 3.5 3.5 3.8 7.0 7.0 7.0 7.0 7.0 7.0
4 3.5 3.5 3.5 3.8 7.0 10.0 15.0 15.0 20.0 20.0
Table P2: Development of storage capacity, TWh
Storage:energystorage GW
Level 2007 2010 2015 2020 2025 2030 2035 2040 2045 2050
1 0.03 0.03 0.03 0.03 0.03 0.03 0.03 0.03 0.03 0.03
2 0.03 0.03 0.03 0.03 0.03 0.03 0.03 0.03 0.03 0.03
3 0.03 0.03 0.03 0.03 0.04 0.08 0.10 0.10 0.10 0.10
4 0.03 0.03 0.03 0.03 0.04 0.15 0.30 0.35 0.40 0.40
Table P3: Development of interconnection capacity, GW
Innerconection:PeakPower GW
Level 2007 2010 2015 2020 2025 2030 2035 2040 2045 2050
1 2.5 2.5 4 4 4 4 4 4 4 4
2 2.5 2.5 4 6 8 10 10 10 10 10
3 2.5 2.5 4 6 10 15 15 15 15 15
4 2.5 2.5 4 9 15 25 30 30 30 30
Table P4: Electric cars – shiftable demand
Electriccars:shiftabledemand%ofaverage
Level EV PHEV
1 – –
2 25% 30%
3 50% 59%
4 75% 90%

234
Pathways to 2050
Back-up supplyIn addition to the four options above, a number of studies highlight scope for back-up generation or fuel switching to a non-electric back-up supply to allow supply and demand to match.
Back-up generation could be bio- or fossil-fuel fired generators, similar to back-up generation used today, or other measures such as CCS plants shutting down the CCS plant load during periods of peak demand to increase station output. This analysis assumes construction of back-up generation if insufficient flexibility is available elsewhere. Because of the high level of shorter term flexibility available under most scenarios, significant back-up plant is only likely to be required under pathways with the majority of electrical power coming from wind.
There are a number of options for fuel switching during periods of high demand or low wind. These include:
●● PHEVs running on their liquid fuel rather than plugging in to charge the battery;
●● bio or fossil fuel gas top-up for heating to reduce electrical heating demand; and
●● other economic responses to peak power demands.
DiscussionThere are a wide range of sources of flexibility that are proven or could be developed. At a high level the use of flexible demand, together with flexible generation and interconnection, would appear the most immediately available route for balancing demand and generation. In terms of storage options, pumped storage or pumped lagoons could also provide significant additional capacity but are identified in many studies as potentially more expensive options. Other storage technologies such as batteries, heat stores or greater demand flexibility have the potential to be in large scale use before 2050.
There remain a number of technical uncertainties – the flexibility of new plant; new storage technologies including seasonal heat stores; the roll-out of smart metering; and development of smart demands – but against these uncertainties, there is significant diversity of potential solutions. As such, it is clear that balancing is achievable, but that the cost will vary and will be dependent on the development of new infrastructure, storage technologies and smart demand.
However, it is likely that the requirement for flexibility will rise in the shorter term, ahead of 2050 and ahead of the development of smart demand volumes. As such, the role of flexible units such as non-CCS coal and gas, and back-up reserve plant will continue to play an important role, at least in the near term.
AnalysisThe 2050 Pathways Calculator tests the ability of the system to meet demands for electricity during a five day anticyclone blocking event, with five days of low wind output and a peak in heating demand associated with the cold weather.
This is a constraint identified by many commentators and other reviews of future balancing issues. If sufficient flexibility is available to meet the winter low wind period

235
Section P: Electricity balancing
then it is expected there will be sufficient capability from the same and other sources to manage more routine, shorter term fluctuations from day to day and hour to hour.
To ensure the test fully reflects the supply demand conditions, it additionally assumes that a portion of the increase in electricity demand resulting from colder than average weather during the five days would have to be met by flexible sources. In all levels it assumes that this increase during an occasional cold spell is equal to 20% of annual average daily domestic and commercial heating demand, or approximately 10% of peak daily heating demand.
GridsDiscussions with stakeholders indicate that networks will be able to facilitate the potential growth in electricity demand, even if national annual demand was to more than double to over 800 TWh. Clearly there are important issues that need further consideration such as how to coordinate and plan for this growth given the uncertainty of some demand technologies, the timing of growth and the balance of small and larger scale generation, all of which will place different requirements on networks.
There is evidence of close working between network companies and, for example, developers of electric vehicles, to look at how these can be integrated into the current demand mix. Further working across industries will be important to ensure robust integration of potential new demands such as vehicles and heat pumps. This and the associated development of networks could perhaps be further facilitated under the auspices of groups such as the Electricity Networks Strategy Group (ENSG), which is already looking at future grid development.

236
Section Q: Negative emissions
Context Negative emissions could assist the UK in achieving its 2050 emissions reduction target. Negative emissions remove CO2 directly from the atmosphere. Over the coming decades, many experts believe that negative emissions technologies could play a role in a global mitigation strategy, particularly for emissions that are hard to tackle at source. 401
This section focuses on new and emerging technologies and processes for negative emissions, most of which are currently at the research and demonstration phase. Each negative emissions technology has its own dynamics and each needs to be analysed as to its capacity to store CO2 securely in the long term; its potential to be scaled up; its material and energy requirements; and its impacts on the environment.402
Drivers and enablersThe majority of negative emissions technologies require the ability to store CO2 securely underground; without this, most negative emissions technologies become unfeasible. Energy demand is high for most engineered air capture technologies. However, many are flexible as to their location, since CO2 can be captured anywhere on the globe. For those processes that require heat, this means that technologies could be deployed in regions where there is unused excess heat or significant solar heat. Any cost estimates depend heavily on the energy these processes tap into.
Sector segmentation usedThe 2050 Pathways Calculator segments the generation of negative emissions into two sectors: bio-energy plus carbon capture and storage (BECCS); and geo-sequestration. BECCS takes advantage of nature’s capacity to capture CO2 directly from the atmosphere and is dependent on the development of a CCS infrastructure in the UK, as well as on the amount of biomass being utilised in the UK’s CCS plants. Geo-sequestration focuses on engineered air capture technologies.
The levels chosen in this analysis reflect a segmentation of negative emissions technologies by their technological difficulty, energy demand and potential environmental impacts. The analysis of these technologies is still at an early stage, and needs to reflect not only their potential to deliver real sequestration, but also the impacts in terms of wider sustainability and policy practicality (including the potential for funding), and the systems which might be needed to deploy them.
401Forinstance,IPCCFourthAssessmentReport2007;RoyalSociety(2009)Geo-engineering the climate. Science, governance and uncertainty;InstituteofMechanicalEngineers(2009)Geo-engineering – giving us the time to act;DECC/MetOfficeAVOIDprogramme(www.avoid.uk.net)The potential for the deployment of negative emissions technologies in the UK.
402CarbonsequestrationintheformofforestryiscoveredinSectionE.

237
Section Q: Negative emissions
Bio-energy plus carbon capture and storagePlants sequester CO2 from the atmosphere and store it in the form of biomass. BECCS assumes that the UK can take advantage of nature’s capacity to capture CO2 from the atmosphere by harvesting the biomass and burning it in electricity generation plants which are fitted with CCS infrastructure. This would ensure that the CO2 sequestered from the atmosphere by plants would be stored underground in designated CCS facilities. The CCS power plants could either be only biomass or co-fired coal and biomass plants to generate electricity.
To generate negative emissions from BECCS the 2050 Pathways Calculator necessitates several inputs.
●● First, CCS needs to be presumed to be in operation within the UK. BECCS obviously is dependent on CCS infrastructure to operate. Levels 2 to 4 in the section ‘Combustion plus CCS’ need to be chosen for BECCS to operate.
●● Second, bioenergy could be used in several forms – solid, liquid or as a biogas. The section ‘bioenergy production from agriculture and waste’ presents these options. BECCS is maximised in trajectory B (solid).
●● Third, once the BECCS infrastructure is existent and the usage of solid biomass is being prioritised, the 2050 Pathways Calculator user needs to decide on the amount of biomass being utilised within the UK. The country can either produce biomass domestically or import it. The domestic option depends on how much land is being dedicated to biomass production under the ‘agriculture’ section. With a CCS capture rate of around 90%, the 2050 pathways calculator assumes a carbon capture rate of 18tCO2 per year for each hectare of biomass production. The biomass levels for 2050 range between 350,000 hectares and 4.2 million hectares of domestic production. UK biomass imports are determined in the section ‘Bioenergy imports’.
These inputs into the 2050 Pathways Calculator determine the overall level of negative emissions generated by BECCS within the UK. If for all inputs the maximum possible is assumed, the UK could generate up to 165 MtCO2 per year from BECCS in 2050.
Geo-sequestration levelsBesides BECCS, geo-sequestration could become an additional driver of negative emissions for the UK. Also referred to as carbon dioxide removal techniques, geo-sequestration aims to reduce the amount of greenhouse gases in the atmosphere via, for instance, engineered air capture technologies or enhanced weathering processes.
The geo-sequestration levels presented in the 2050 Pathways Calculator describe a gradual build-up of mostly engineered air capture technologies. Levels 2 and 3 assess the negative emissions potential of these techniques within the boundaries of the UK. The most ambitious geo-sequestration activity is described in level 4. This entails the UK participating in an international initiative to deploy air capture technologies anywhere in the world wherever they are most effective. All negative emissions technologies can take advantage of the fact that CO2 travels freely in the atmosphere. The technologies can be installed wherever it is the most practical to do so. Level 4 maximises this strategic advantage.

238
Pathways to 2050
Level 1As a baseline, level 1 assumes that no action on geo-sequestration is taken over the coming decades. Any geo-sequestration options that do emerge prove to be technologically unfeasible, financially unattractive, unacceptable to the public and/or insignificant in terms of their contribution to mitigation.
Level 2Level 2 on geo-sequestration assumes the UK generates 1MtCO2 per year of negative emissions. These would be generated by business opportunities either in the form of biochar being linked to financial incentive structures or some business opportunities linked to negative emissions, such as the production of chalk or bio cement.
Level 3Level 3 assumes the construction of engineered air capture technologies within the UK geographical boundaries. A ten year demonstration phase would lead to a gradual build-up of engineered air capture technologies starting in 2025. Some engineered negative emissions technologies currently in R&D stage could possibly be deployed in the UK. Options include ‘forced draft contactors’403 and ‘induced air flow towers’.404 As an example, each induced air flow tower, approximately 20 meters tall, is expected to capture 4tCO2 per day. Thus, induced air flow towers capturing 30 MtCO2 per year in 2050 would necessitate the operation of roughly 20,000 towers.
All the engineered air capture methods are presumed to necessitate CCS infrastructure and locations close to power stations as well as significant energy supplies. Level 3 assumes an engineered air capture technology contribution of 30 MtCO2 per year in 2050 with an energy demand of 100 TWh per year. The possibility of utilising excess heat from power stations as well as probable efficiency gains could reduce this energy demand.
Level 4Level 4 assumes as in level 3 that the UK constructs its own air capture infrastructure in the 2020s, but also participates in an international negative emissions initiative. With international partners the UK would push for a global negative emissions effort to assist a worldwide mitigation strategy. Negative emission technologies would be deployed anywhere in the world wherever they are most cost effective. The UK holds a certain percentage share of negative emissions and counts them towards national mitigation targets. This level assumes that such an operation is in demonstration phase in 2020 with roll-out starting in 2030. It estimates that by 2050 the contribution of this negative emissions approach will deliver around 80 MtCO2 per year to the UK’s mitigation effort. It is also assumed that the energy cost of concentrating and compressing CO2 from the air is in line with statements of some experts in the field. These energy demand projections are significantly lower than the ones used in level 3. For 80 MtCO2 captured per year the technologies listed below estimate an energy cost of between 40 TWh to 130 TWh per year.
403‘CalgaryCarbonCaptureMachine’developedbyProfDavidKeith(CanadaResearchChairforEnergyandEnvironmentatUniversityofCalgary).
404‘FastTrees’ProcessviainducedairflowtowersbeingdevelopedandcommercializedbyCarbonCycleintheUK.
239
Section Q: Negative emissions
All engineered negative emissions proposals would need to be investigated as to their suitability for deployment in specific regions of the world, their efficiency at capturing and storing CO2 and their impact on the environment. It is impossible to state which technology will ultimately be chosen following a decade-long demonstration phase. Some contenders could include:
●● Artificial ‘carbon trees’ that capture CO2 via an ion exchange resin. The resin absorbs CO2, which is released when exposed to water vapour. 405 The technology must be deployed in regions with a lot of dry air, with access to water and with a CCS capability. Possible locations are Canada, Africa or the Middle East. The container sized carbon trees are predicted to capture around 1 tCO2 per day. 80 MtCO2 per year would necessitate approximately 250,000 ‘carbon trees’.
●● ‘Solar scrubber’406 technology pumps air into a tube full of calcium oxide pellets. The tubes are heated via parabolic mirrors. At 400 degrees the CO2 reacts with the pellets to form calcium carbonate. Heated to 1000 degrees, pure CO2 is driven out of the pellets. Solar scrubbers would only operate in conjunction with solar energy and would be most effective in desert regions with CCS infrastructure.
●● Adding alkalinity to seawater is another possible means of capturing CO2. This involves decomposing heated limestone into lime and CO2.
407 The CO2 is sequestered and the lime is added to seawater, where it acts to enhance the capacity of the oceans as a carbon sink by drawing CO2 out of the atmosphere and storing it as bicarbonate ions in the ocean. The process requires large amounts of limestone, energy, CCS infrastructure and access to the ocean. Possible locations include Australia, Namibia and Oman. 80 MtCO2 per year would require approximately 120 Mt of limestone.
The two engineered air capture technologies of level 3 could also be deployed on a global scale under level 4.
In summary, this level 4 of geo-sequestration estimates a negative emissions potential of 111 MtCO2 per year in 2050 (80 MtCO2 per year from international geo-sequestration processes plus 30 MtCO2 per year from UK engineered air capture techniques and 1 MtCO2 per year from other UK sources). As the energy cost of the international engineered negative emissions have such a significant range and will not need to be covered by UK production, the 2050 Pathways Calculator does not account for them. A significant UK financial contribution to any such international negative emissions programme is to be expected.
405GlobalResearchTechnologiesandColumbiaUniversity–www.grestech.com/.Technologyalsoreferredtoas‘CarbonCarousel’.AlsoseeScientific American(June2010)‘WashingCarbonoutoftheair’.
406ETHZurichUniversity–http://solar.web.psi.ch/407Cquestrate(UniversityofOxfordincollaborationwithShell,AEAtechnologyandPlymouthMarine
Laboratories)–www.cquestrate.com

240
Pathways to 2050
Figure Q1: Trajectories for negative emissions from geo-sequestration under four levels of deployment, in MtCO2
0
20
40
60
80
100
120
Level 1Level 2Level 3Level 4
2007
2050
2045
2040
2035
2030
2025
2020
2015
2010

241
Section R: Electricity imports
ContextLow carbon and/or renewable electricity could not only be produced domestically in the UK but also be imported from abroad. This will necessitate other countries to significantly oversupply their electricity and be willing to export. It will also require a much strengthened continental grid infrastructure to deliver electricity from the generation point to the areas of consumption.
Low carbon electricity could come from various sources to the UK. Geothermal energy from Iceland, wind capacity from Norway’s North Sea or solar energy from southern Europe including northern Africa are just some examples. The levels proposed in this analysis focus on the potential of electricity imports from solar, especially concentrated solar power, from the south. Concentrated solar power uses mirrors or lenses to focus sunlight. It has an electricity generation capacity of around 15 W/m2 and is considered as a ‘proven’ technology. It is around five times more efficient per square meter than wind and over twice as efficient as tidal stream. Concentrated solar power also has the advantage of being comparably simple to construct and to maintain, compared to, for example, offshore wind. Moreover, large scale projects are feasible for concentrated solar power as the technology is best deployed in areas with very low population density. Deserts in northern Africa as well as southern Europe could be utilised to construct large concentrated solar electricity generation capacities which would have a significant impact on the whole of the African as well as European system.408 Such a project would need substantial international cooperation.
For the UK to benefit from large scale concentrated solar power it needs to be connected to the generation plant. This will necessitate a cross European grid system connecting the south – possibly also across the Mediterranean – with the UK. The most likely interconnector would be high-voltage direct-current (HVDC). HVDC is preferred over AC lines because it requires less material and power losses are smaller. Such a grid infrastructure would need to be developed in close cooperation with other European countries. The 2050 electricity import levels used in this analysis assume that the UK participates with other European and Mediterranean countries in a common project for large scale concentrated solar power stations. Depending on the level of engagement of the UK in this international project, a ‘fair share’ of the generated electricity would become UK imports.
408Seeoneexampleofaplanforalargescaleconcentratedsolarpowergenerationproject:www.desertec.org.Also,seeGermanAerospaceCenter(DLR),InstituteofTechnicalThermodynamics,SectionSystemsAnalysisandTechnologyAssessment(2006)‘Trans-Mediterranean Interconnection for Concentrating Solar Power’orFranzTrieb(2009)Global Potential of Concentrating Solar Power..

242
Pathways to 2050
Levels for electricity importsLevel 1This level assumes that the UK does not import electricity, other than for balancing.
Level 2This level assumes that the UK imports 30 TWh, gradually beginning in 2020. Electricity originates mostly from concentrated solar power projects in southern Europe. The interconnector between the UK and the European mainland is strengthened with an additional 4 GW designated for electricity imports.
Level 3The UK imports 70 TWh. An international project constructs concentrated solar power in northern Africa, close to equivalent to the ambition of desertec. The whole project would require an area of around 5000 km2 of concentrated solar power infrastructure – roughly a quarter the size of Wales. Starting in 2020, this level of action would require the international project to achieve a build rate of roughly 0.5 km2 per day of concentrated solar power equipment for 30 years until 2050.
This level 3 assumes the UK’s project share to be 10%. Therefore, to import 70 TWh per year, the UK’s share of the international project would need to occupy an area of around 500 km2 – that is roughly equivalent to one third of the area of Greater London. A significant grid infrastructure in Europe would need to be constructed with a UK interconnector of an additional 8 GW designated for electricity imports.
Level 4The UK imports 140 TWh. The same project as in level 3 constructs concentrated solar power in northern Africa. The whole project area would require an area of over 5,000 km2 of concentrated solar power infrastructure – roughly a quarter the size of Wales. Starting in 2020, this level of action would require the international project to achieve a build rate of roughly 0.5 km2 per day of concentrated solar power equipment for 30 years until 2050.
This level 4 assumes the UK’s project share to be 20%. Therefore, to import 140 TWh per year, the UK’s share of the international project would need to occupy an area of around 1,000 km2 – that is roughly equivalent to two thirds of the area of Greater London. A significant grid infrastructure in Europe would need to be constructed with a UK interconnector of an additional 20 GW designated for electricity imports.

243
Section R: Electricity imports
Table P5: Electricity import levels409
Trajectoryassumptions
Imports, Desertec TWh
Trajectory Description 2007 2010 2015 2020 2025 2030 2035 2040 2045 2050
1 Concentrated solar power
– – – – – – – – – –
2 Concentrated solar power
– – – 2 6 10 15 20 25 30
3 Concentrated solar power
– – – 6 15 23 35 47 59 70
4 Concentrated solar power
– – – 12 30 46 70 94 118 140
409TheDesertecFoundation,Clean Power From Deserts, Whitebook, 4th edition.AssumesUKshareis10%

244
Annex A: Costs assumptions
Fuel cost assumptions (2009 prices)
2010 2020 2030 2040Low oil (£/bbl) 51 61 61 61
Central oil (£/bbl) 71 81 91 91
High oil (£/bbl) 85 122 122 122
High-High oil (£bbl) 104 152 152 152
Low coal (£/tonne) 81 51 51 51
Central coal (£/tonne) 111 81 81 81
High coal(£/tonne) 122 101 101 101
High-High coal (£/tonne) 132 132 132 132
Low gas (p/therm) 33 34 35 35
Central gas (p/therm) 59 68 75 75
High gas (p/therm) 71 98 98 98
High-High gas (p/therm) 85 121 121 121
Source: DECC fossil fuel price assumptions

245
Annex A: Costs assumptions
Capital cost assumptions (2009 prices)
Capitalcost,£/kW 2020 2030 2040
Low Central High Low Central High Low Central High
CCS (coal, ASC410, FGD411)
1,530 2,035 2,500 1,440 1,943 2,500 1,387 1,914 2,500
Nuclear (PWR412)
2,114 2,686 3,125 1,983 2,584 3,125 1,924 2,549 3,125
CCGT 470 588 688 454 580 688 440 572 688
Tidal range 2,000 2,600 3,100 2,000 2,600 3,100 2,000 2,600 3,100
Tidal stream 1,698 2,043 2,462 1,024 1,239 1,466 637 768 921
Wave 1,979 2,380 2,771 904 1,097 1,284 532 644 754
Onshore wind 997 1,258 1,500 966 1,241 1,500 934 1,223 1,500
Offshore wind 1,900 3,000 3,250 1,627 2,369 3,250 1,559 2,328 3,250
Oil 853 1,075 1,266 741 1,002 1,266 715 987 1,266
Hydro 1,438 1,594 1,688 1,438 1,594 1,688 1,438 1,594 1,688
Sources: CCS, nuclear, CCGT, onshore wind and offshore wind costs from UK Electricity Generation Costs Update: A report by Mott MacDonald (June 2010)
Oil, Hydro, wave, tidal stream and tidal range costs are DECC estimates
410Advancedsupercritical.411Fluegasdesulphurization.412Pressurisedwaterreactor.


Department of Energy and Climate Change. www.decc.gov.uk
First published July 2010 © Crown Copyright. URN 10D/764