20161116 Dissertation Yang
132
DEFORMATION PROCESSES OF METALLIC OPEN-CELL FOAM SUPPORTED SHEET METALS A Dissertation by CHENG-KANG YANG Submitted to the Office of Graduate and Professional Studies of Texas A&M University in partial fulfillment of the requirements for the degree of DOCTOR OF PHILOSOPHY Chair of Committee, Jyhwen Wang Committee Members, Anatasia Muliana Ibrahim Karaman Ramesh Talreja Head of Department, Andreas A. Polycarpou December 2016 Major Subject: Mechanical Engineering Copyright 2016 Cheng-Kang Yang
Transcript of 20161116 Dissertation Yang

DEFORMATION PROCESSES OF METALLIC OPEN-CELL FOAM SUPPORTED
SHEET METALS
A Dissertation
by
CHENG-KANG YANG
Submitted to the Office of Graduate and Professional Studies of Texas A&M University
in partial fulfillment of the requirements for the degree of
DOCTOR OF PHILOSOPHY
Chair of Committee, Jyhwen Wang Committee Members, Anatasia Muliana Ibrahim Karaman Ramesh Talreja Head of Department, Andreas A. Polycarpou
December 2016
Major Subject: Mechanical Engineering
Copyright 2016 Cheng-Kang Yang

ii
ABSTRACT
Sandwich panel has been widely applied to enhance the stiffness to weight
performance of components in many industries. The manufacturing procedure of curved
metal sandwich panels typically consists of forming the sheet and core material into
prescribed shapes and applying the adhesive to bond the material in shaped molds. An
alternative manufacturing method is to apply the conventional sheet metal forming
technique to deform the flat sandwich panel into a curved panel. However, the face sheet
will significantly limit the formability of the sandwich panel. To solve the problem, one
face sheet was removed in the sandwich panel to increase the formability, then the metal
sheet and the metallic open-cell foam were selected as the face sheet and the core
material to form the metallic open-cell foam supported sheet metals.
The main objective of this study is to develop a proper forming method to
deform the metallic open-cell foam supported sheet metal without failure occurring. Two
forming processes, press brake bending and hydroforming, which can reduce the contact
stress to avoid the structure damage were investigated. Experiments were designed to
understand the possible failure modes and the failure mechanism. Through the
parametric study in the experimental results, the effects of material dimensions, material
properties, and test parameters were analyzed to establish a failure criterion. In addition,
a finite element analysis with a proper foam model was implemented to further inspect
the failure mechanism and develop a guideline for the selection of materials and test
parameters.

iii
For the press brake bending process, the experiment results have shown that the
supported sheet metal can be successfully bent into a curved panel within small
thickness reduction. The prediction in both geometric hoop strain failure criterion and
shear strain failure in the finite element analysis were matched and agreed with the
experimental result. For the hydroforming process, the experimental result indicated that
the major failure mode is the adhesive failure. The early adhesive failure at the perimeter
of the attached foam disc caused the open-cell foam to separate from the sheet metal.
The required adhesive strength to the attainable dome height relationship was given by
finite element analysis.

iv
ACKNOWLEDGEMENTS
I would like to thank my committee chair, Dr. Wang, and my committee
members, Dr. Muliana, Dr. Karaman, and Dr. Talreja, for their guidance and insightful
comments on my research and dissertation.
Thanks also go to my friends, Yin-Ping Chen, Ya-Jen Yu, and Chia-Lan Liu, my
colleagues and the department staff for their help and advice.
Finally, thanks to my mother, Chun-Man Hsu, my father, Wu-Hsiung Yang, and
my wife, Hsing-Yi Tsai, for their patience, love, and endless support.

v
CONTRIBUTORS AND FUNDING SOURCES
Contributors
This work was supervised by a dissertation committee consisting of Professor
Jyhwen Wang [advisor], Professor Anatasia Muliana and Professor Ibrahim Karaman of
the Department of Mechanical Engineering and Professor Ramesh Talreja of the
Department of Aerospace Engineering.
The experiment in the Michigan State University apparatus for Chapter V was
conducted by Professor Farhang Pourboghrat at Michigan State University. The sample
used in the Michigan State University apparatus for Chapter V was provided by Mahesh
Nair and Bright Wadja.
All other work conducted for the dissertation was completed by the student
independently.
Funding Sources
The work was supported by National Science Foundation under Grant Number
CMMI-0825986.

vi
TABLE OF CONTENTS
Page
ABSTRACT ..................................................................................................................... ii
ACKNOWLEDGEMENTS ............................................................................................. iv
CONTRIBUTORS AND FUNDING SOURCES ............................................................. v
TABLE OF CONTENTS ................................................................................................. vi
LIST OF FIGURES ........................................................................................................ viii
LIST OF TABLES ......................................................................................................... xiii
CHAPTER I INTRODUCTION ........................................................................................ 1
CHAPTER II LITERATURE REVIEW ............................................................................ 7
2.1 Material behavior of metallic open-cell foam ...................................................... 7 2.2 Bending theory ................................................................................................... 27 2.3 Sheet hydroforming ............................................................................................ 31 2.4 Research method ................................................................................................ 32
CHAPTER III PRESS BRAKE BENDING EXPERIMENT .......................................... 33
3.1 Characterization of Duocel Al 6101-T6 open-cell foam .................................... 33 3.2 Experiment setup ................................................................................................ 36 3.3 Experimental result ............................................................................................. 40 3.4 Discussion of experimental results ..................................................................... 53 3.5 Hoop strain failure criterion ............................................................................... 58 3.6 Summary and conclusions .................................................................................. 64
CHAPTER IV NUMERICAL ANALYSIS OF PRESS BRAKE BENDING PROCESS ......................................................................................................................... 65
4.1 Anisotropic Kelvin cell foam model .................................................................. 65 4.2 Modeling of open-cell foam supported sheet metal ........................................... 68 4.3 Finite element simulation and results ................................................................. 75 4.4 Summary and conclusions .................................................................................. 89
CHAPTER V HYDROFORMING PROCESS ............................................................... 90
5.1 Hydroforming experiment .................................................................................. 90

vii
5.2 Hydroforming finite element analysis ................................................................ 97 5.3 Finite elements results and discussion .............................................................. 102 5.4 Conclusion ........................................................................................................ 108
CHAPTER VI CONCLUSIONS AND SUGGESTIONS FOR FUTURE WORK ...... 110
REFERENCES ............................................................................................................... 113

viii
LIST OF FIGURES
Page
Figure 1 Schematic of continuous lamination using a double-belt press [1]. ................ 2
Figure 2 Sandwich panels failure under different forming processes: (a) Deep drawing [3], (b) Incremental forming [4], (c) Three points bending. ............. 4
Figure 3 (a) The upper face sheet is clamped to sealed the chamber, (b) With continuous increase of the hydraulic pressure, the panel can be deformed. ........................................................................................................ 5
Figure 4 Metallic open-cell foam fabrication methods, (a) Gas injection method, (b) Investment casting (down casting) [5]. ..................................................... 9
Figure 5 Rise direction and transverse direction of the cavity in Duocel 40 PPI 4-6% Al 6101-T6 open-cell foam. ..................................................................... 9
Figure 6 Pore and cell definition in open-cell foam structure [6]. .............................. 12
Figure 7 6-8% Duocel aluminum open-cell foam in various pore size, (a) 10 PPI, (b) 20 PPI, (c) 40 PPI. ................................................................................... 12
Figure 8 Duocel 40 PPI Al 6101-T6 open-cell foam in (a) 4.76%, (b) 7.69%, (c) 11.14 %. ........................................................................................................ 13
Figure 9 Ligament cross-section profile of Duocell open-cell foam at various relative density [6]......................................................................................... 13
Figure 10 Typical compressive response of cellular metal foam [7]. ........................... 15
Figure 11 Effective material properties of open-cell foam via different relative density (a) Relative modulus (b) Relative compressive strength [7]. ........... 15
Figure 12 The shear response of Alporas aluminum foam at 11% relative density in the double lap shear test via various foam thickness [9]........................... 16
Figure 13 The shear response of Alporas aluminum foam at 11% relative density in the double lap shear test via various foam thickness [9]........................... 16
Figure 14 Size effects on the measured mechanical properties via various sample size: (a) Relative elastic modulus, (b) Relative collapse strength, (c) Relative shear strength [11, 12]. ................................................................... 17

ix
Figure 15 Idealized microstructure of open-cell foam, (a) Ashby and Gibson cubic cell model [24], (b) Kelvin cell model [8], (c) Voronoi cell model [25]. ..... 19
Figure 16 Cell edge bending during the elastic deformation [7]. .................................. 23
Figure 17 The plastic hinge formation in open-cell foam [7]........................................ 23
Figure 18 Failure mode map for a sandwich panel with aluminum sheet and aluminum foam core in three points bending test [73]. ................................ 30
Figure 19 Cell length measurement of 11.14% foam block in the microscope image. ............................................................................................................ 35
Figure 20 Three points bending experiment setup. ....................................................... 36
Figure 21 Schematic draw for the calculation of the test punch deflection (D) at specified punch radius (R), specimen thickness (H) and span length (L). .... 37
Figure 22 The averaged punch force to sheet metal deflection curve in the test set with 9 mm thickness of 7.69 % foam and 10 mm punch radius. .................. 40
Figure 23 Foam microstructure deformation before and after the bending process, (a) side view, (b) top view............................................................................. 43
Figure 24 Foam indentation at 4.85%, thickness 12.8mm foam, radius 5 mm test. ...... 43
Figure 25 Foam indentation at 4.85%, thickness 12.8 mm foam, radius 10 mm test.... 44
Figure 26 The thickness ratio to punch deflection curve in the test set with 9 mm foam thickness, 7.69% foam and 10 mm punch radius................................. 44
Figure 27 Sheet indentation at 7.69%, 15 mm foam thickness, radius 30 mm test. ...... 44
Figure 28 Deformation modes with three relative density foam at different test parameters. .................................................................................................... 46
Figure 29 Initial bending stiffness of 4.85 % relative density foam at the given specimen thickness and span length. ............................................................. 49
Figure 30 Initial bending stiffness of 7.69 % relative density foam at the given specimen thickness and span length. ............................................................. 49
Figure 31 Initial bending stiffness of 11.14 % relative density foam at the given specimen thickness and span length. ............................................................. 50

x
Figure 32 Effective moment of inertia of 4.85 % relative density foam at the given specimen thickness and span length. ............................................................. 50
Figure 33 Effective moment of inertia of 7.69 % relative density foam at the given specimen thickness and span length. ............................................................. 51
Figure 34 Effective moment of inertia of 11.14 % relative density foam at the given specimen thickness and span length. ................................................... 51
Figure 35 Effective moment of inertia in 80 mm and 90 mm span length via different relative density and sample thickness. ........................................... 52
Figure 36 Force to sheet metal deflection curve in 7.69 % density and 5 mm punch radius experiment. ......................................................................................... 55
Figure 37 Thickness ratio in 7.69 % density and 5 mm punch radius experiment. ....... 56
Figure 38 Punch force to deflection curve for each relative density foam in the experiment of 6 mm foam thickness and 10 mm punch radius. ................... 56
Figure 39 Foam thickness ratio to punch deflection curve for 5%, 8%, and 11% relative density in the experiment of 6 mm foam thickness and 10 mm radius. ............................................................................................................ 57
Figure 40 Configuration of the perfect bending condition. ........................................... 61
Figure 41 Geometric failure criterion hypothesis of metallic open-cell foam supported sheet panel in the press brake bending process. ........................... 61
Figure 42 Failure criterion in 7.69 % Duocel Al 6101-T6 open-cell foam. .................. 62
Figure 43 Failure criterion in 4.85 % Duocel Al 6101-T6 open-cell foam. .................. 62
Figure 44 Failure criterion for 11.14 % Duocel Al 6101-T6 open-cell foam. .............. 63
Figure 45 Cluster of Kelvin cells and the repeated ligament frame [38]. ..................... 66
Figure 46 Triangular shape of the ligament cross-section profile. ................................ 67
Figure 47 Hybrid model with Kelvin cell beam model, (a) Front view, (b) Side view. .............................................................................................................. 69
Figure 48 Model setup for the press brake bending analysis. ....................................... 69
Figure 49 Configuration of the nonlinear spring in Kelvin cell model Adapted from reference [38] with permission.. ........................................................... 73

xi
Figure 50 Force response of nonlinear spring element.................................................. 74
Figure 51 Specified nodes for the strain calculation in Kelvin cell............................... 74
Figure 52 Normalized punch force to sheet deflection response via anisotropy ratio .. 78
Figure 53 Prediction in punch force to sheet deflection curve of 7.69 % aluminum open-cell foam, (a) Uniform thickness case, (b) Indentation case. ............... 79
Figure 54 Deformation response of Kelvin cell beam model. ....................................... 82
Figure 55 The location of the nodes and the monitored cells for 9 mm thickness 7.69% foam simulation. ................................................................................ 83
Figure 56 Deformation plot of a uniform thickness bending for 9 mm thickness 7.69% open-cell foam at 20 mm punch radius and 80 mm span length. ...... 84
Figure 57 Hoop strain history plot of a uniform thickness bending for 9 mm thickness 7.69% open-cell foam at 20 mm punch radius and 80 mm span length. ............................................................................................................ 84
Figure 58 Shear strain history plot of a uniform thickness bending for 9 mm thickness 7.69% open-cell foam at 20 mm punch radius and 80 mm span length. ............................................................................................................ 85
Figure 59 Deformation plot of an indentation failure bending simulation for 9 mm thickness 7.69% open-cell foam at 10 mm punch radius and 60 mm span length. ............................................................................................................ 85
Figure 60 Hoop strain history plot of an indentation failure bending simulation for 9 mm thickness 7.69% open-cell foam at 10 mm punch radius and 60 mm span length. ............................................................................................ 86
Figure 61 Shear strain history plot of an indentation failure bending simulation for 9 mm thickness 7.69% open-cell foam at 10 mm punch radius and 60 mm span length. ............................................................................................ 86
Figure 62 Failure prediction by 0.12 shear strain in the hybrid finite element model via different relative density............................................................... 88
Figure 63 Axial-symmetric schematic diagram of hydroforming experiment process. .......................................................................................................... 91
Figure 64 Schematic diagram of hydroforming bulge machine. ................................... 93
Figure 65 Fracture occurred at the top face sheet. ......................................................... 95

xii
Figure 66 Delamination between the top face sheet and the foam blank. ..................... 95
Figure 67 The delamination in the sandwich panel. ...................................................... 96
Figure 68 The mixed failure mode in the two-layered panel. ....................................... 96
Figure 69 Finite element model of sandwich panels. .................................................... 98
Figure 70 The normal stress to displacement plot for the adhesive bond between the face sheet and the foam. ........................................................................ 101
Figure 71 Face sheet stress concentration near the edge of the foam in the sandwich panel. ........................................................................................... 104
Figure 72 Bottom adhesive delamination with a lower strength in the bottom adhesive. ...................................................................................................... 104
Figure 73 Delamination in two-layered panels............................................................ 104
Figure 74 Face sheet stress concentration in two-layered panels. ............................... 105
Figure 75 Maximum attainable dome height vs. adhesive strength for foam with 8 mm thickness and different diameters (D) for bi-layered panels: (a) D = 101.6mm (b) D = 127mm, (c) D = 152.4mm. ............................................. 106
Figure 76 The maximum attainable dome height vs. adhesive strength for blanks different foam diameter for bi-layered panels. ............................................ 107

xiii
LIST OF TABLES
Page Table 1 Chemical composition of Duocel Al 6101-T6 foam and bulk alloy of the
foam raw material [83]. ................................................................................. 34
Table 2 Material properties of Duocel 8% Al 6101-T6 open-cell foam. ................... 35
Table 3 Average cell lengths in 4.85 %, 7.69%, and 11.14 % Duocel Al 6101 foam. ............................................................................................................. 35
Table 4 Correspondent punch radius to specimen length. ......................................... 39
Table 5 Punch deflection (D) for specified test parameters. ...................................... 39
Table 6 Thickness ratio at the final punch deflection. ............................................... 45
Table 7 The average value of the effective moment of inertia in 80 mm and 90 mm span length via different relative density and sample thickness. ........... 52
Table 8 Edge length of the triangular shape via various anisotropy ratios for different foam density. .................................................................................. 67
Table 9 Geometry parameters of the hybrid model.................................................... 69
Table 10 Material properties of Al 5052-H32 and Al 6061-T6. .................................. 72
Table 11 Calibrated nonlinear spring coefficients. ...................................................... 79

1
CHAPTER I
INTRODUCTION
Light-weight sandwich panels are commonly used in various industries to
improve the stiffness or reduce the weight of structure components. In aviation and
aerospace industry, sandwich panels are widely adopted in body and airfoil design to
obtain a better stiffness to weight ratio. In automotive industrial, sandwich panels are
designed as shock-absorbing and impact-resistant materials in the racing car. In the past
decades, researchers have developed new materials and also improved the manufacturing
processed to create the high-performance sandwich panels. Sandwich panel is a structure
made of two layers of face sheets and one layer of light-weight core material. The light-
weight core material is bonded by the two face sheets to provide high structure stiffness.
The commonly used face sheet material includes sheet metal and fiber-reinforced
polymers. The commonly used core material includes honeycomb structures, polymer
foam, and balsa wood.
Traditionally, the wet lay-up and prepreg layup methods are used to fabricate
sandwich panels. These methods require only simple workshop techniques, inexpensive
tools, and equipment to bond the face sheet and core materials together. With the
evolution of manufacturing automation, flat sandwich panels could be continuously
laminated by the double belt press, as shown in Figure 1. In contrast, manufacturing
sandwich panels with a curvature requires a more complicated manufacturing procedure
before the adhesive being applied, especially for those hard-to-form face sheet and core

2
materials. For instance, the stiff metal sheet needs to be stamping into curved shape
before the bonding process, and the core materials, such as metallic foam, require a CNC
or EDM machine to cut them into the curved shape. Besides the additional procedures,
one or multiple molds that fit the final shape are also essential to keep the panels in
shape during the adhesive curing process. Due to these additional procedures, the
processes of producing curved sandwich panels become costly and timing consuming.
Figure 1 Schematic of continuous lamination using a double-belt press [1].
An alternative to replace the traditional approach for manufacturing curved
sandwich panels is to utilize the sheet metal forming processes, such as bending, forging,
deep drawing, and incremental forming, to deform the flat sandwich panels into curved
shapes. These processes, however, generally resulted in the collapse of the core materials
and damaged the sandwich structure as observed from the previous research results.
Elzey et al. analyzed the open die forging of structural sandwich with the porous core
material [2]. The result showed that the forging process could lead to non-uniform core
density and thickness distribution, indicating an uneven collapse of the core material, in

3
the panels. Mohr conducted deep drawing experiments using thin sandwich blanks with
metal face sheets and perforated sheet metal core [3]. The experiment results showed
that bending could lead to a core shear failure, which is also the dominant failure
mechanism. Moreover, the numerical analysis result also indicated that the required core
shear strength to successfully form sandwich panels by deep drawing is proportional to
the face sheet strength. Jackson conducted experiments in incremental sheet forming of
sandwich panels [4]. With the loading from the forming tool/pin, the soft core was non-
uniformly deformed. Figure 2 illustrates the deformed sandwich panels under these
forming processes.
From the previous results, it is found that the high contact stress between the
tool/die and the sandwich blank can cause the crushing or fracture of the lower strength
core material. Once the structure is damaged, the panel no longer has the original
stiffness. The structure of sandwich panel could not sustain a large deformation. The
high bending stiffness causes a large contact stress to forming, and the process could
result in indenting the face sheets or crushing the core material. Meanwhile, the two
bonded face sheets guide the core material to a large shear deformation, causing
adhesive failure (debonding) or shear failure in the low strength core materials.
Some sheet metal forming techniques could be applicable in forming of two
layered panels, which consists of a face sheet supported by a core material. Although the
two-layered panels have a reduced bending stiffness compared to the typical sandwich
structures, it could prevent the panels from debonding and core shear during the forming
process. With controlled contact stress during forming, the two-layered panels could be

4
kept at a thickness close to that of the original. Besides, an additional face sheet could be
attached to the formed two layered panels to produce sandwich panels with increased
stiffness.
Figure 2 Sandwich panels failure under different forming processes: (a) Deep drawing [3], (b) Incremental forming [4], (c) Three points bending.

5
This research takes the structural advantages of the two-layered panels, and
proposed two different manufacturing methods, press brake bending and hydroforming,
to deform the panels into a curved shape. These two processes are designed to distribute
the forming force evenly over the panel, and prevent the large contact stress causing the
collapse of the core materials. The first method, press brake bending process, is
developed based on the mechanics of three points bending. The support pins and center
pin are changed to a larger semicircular punch. Ideally, the forming force is dispersed
over the panels with the increased contact area. The second method, hydroforming
process, utilizes the hydraulic fluid as working media to distribute the forming pressure
uniformly over the panel, as shown in Figure 3.
Figure 3 (a) The upper face sheet is clamped to sealed the chamber, (b) With continuous increase of the hydraulic pressure, the panel can be deformed.
The two-layered panel is expected to be under a larger plastic deformation in the
forming processes; therefore, a good formability of the panel is essential. The aluminum
sheet metal and the aluminum metallic open-cell foam are selected to construct the two-
layered panels. The face sheet and the core are joined by a thin layer of commercial

6
acrylic adhesive. The good ductility in the sheet metal and the acrylic adhesive makes
the panel formable for the tensile deformation, and the porosity of the open-cell foam
gives the space for the compression deformation. The pores of the open-cell foam are
also beneficial to the hydroforming process. The fluid could enter the pores and directly
exert the forming pressure on the sheet metal; hence the foam crushing failure could be
prevented.
To summarize the work in this dissertation, previous works on sandwich bending
theory, sheet hydroforming process, and the material properties characterization of
metallic open-cell foams are reviewed in Chapter II. The experiment result of the press
brake bending process is concluded and analyzed in Chapter III. In addition, a geometric
failure criterion is proposed to predict the indentation failure based on the experimental
observations. In Chapter IV, Kelvin cell model is introduced to simulate the bending
behavior of open-cell foam in the finite element analysis of the press brake bending
process. Chapter V presents the experimental results and the finite element analysis of
hydroforming process. The conclusions and future works are discussed in Chapter VI.

7
CHAPTER II
LITERATURE REVIEW
In this research, the main objective is to deal with the plastic deformation of the
metallic open-cell foam supported sheet metal. To provide a basic background of this
research, the review of previous works is divided into three areas: beam bending theory,
material characterization of metallic open-cell foam, and sheet hydroforming
deformation process. To describe and model the deformation behavior of metallic open-
cell foams appropriately, the material response, effective material property model,
yielding criterion, and modeling technique of metallic open-cell foam are reviewed in
the first section To benefit from the past works on the bending of the layered material,
elastic-plastic beam bending theory, sandwich beam bending theory, and failure mode
map of bending sandwich panels are reviewed in the bending theory section. The last
section is to inspect the research methodology of sheet hydroforming process. Based on
the literature review, the research method of this dissertation is described in the last
section.
2.1 Material behavior of metallic open-cell foam
Metallic open-cell foam is used intensively in light-weight sandwich panels as core
materials. Various manufacturing methods can lead to dissimilar foam structures and
material behaviors in open-cell metallic foams. In general, the structure of metallic open-
cell foam consists of numerous random ligaments and cavities. The metallic open-cell
foam can be produced by creating gas bubbles in the metal liquid or by casting in the

8
investment which is used a polymer foam as a filler material to create the casting space.
Figure 4 illustrates the fabrication methods of metallic open-cell foam. These fabrication
methods usually lead to a non-uniform foam structure. In the gas injection process, the
buoyancy of the bubbles rises to the liquid surface, and the viscosity of the liquid causes
the gas bubble shape to become an ellipsoid. In the investment cast process, the filled
polymer foam is subjected to the weight of the slurry, and in the compressed foam, the
length of the cavity in the gravity direction is shorter than that in the directions
perpendicular to the gravity direction. In both processes, the cavity of the open-cell foam
structure can be considered as stretched in one direction. To identify the microstructure
of the open-cell foam, the direction in stretch direction is called the rise direction, and
the perpendicular direction is called the transverse direction. Figure 5 shows the rise and
transverse direction in the open-cell foam structure. The stretched cavity leads the
ligaments length in the rise direction is slightly longer than the ligament in the transverse
direction and generates the anisotropy in the material properties of open-cell foam.

9
Figure 4 Metallic open-cell foam fabrication methods, (a) Gas injection method, (b) Investment casting (down casting) [5].
Figure 5 Rise direction and transverse direction of the cavity in Duocel 40 PPI 4-6% Al 6101-T6 open-cell foam.

10
2.1.1 Structure characterization
To characterize a metallic open-cell foam structure, pore size and relative density
are the most important parameters that describe the shape and the composition of the
open-cell foam. The pore size defines the cell size of the microstructure and the relative
density gives the ligament size of the cell. Combined these parameters with the base
material, the mechanical response of the open-cell foam can be described. The following
paragraphs discuss the pore size, relative density, and base material individually and
explain their effects on the mechanical properties.
Pore size
During the fabrication process, each bubble in the open-cell foam will build a cell
generally consists of 14 windows, and pore is the open window in the cell. Figure 6 plots
the definition of pore and cell. The size and shape of each pore are different from one to
another. To statistically specify the open-cell foam, the value of pores number per inch
(PPI) is used to evaluate the pore size. The average value of PPI in metallic open-cell
foam is 5 to 40 [6]. Figure 7 shows the cell size difference of Duocel 6-8% Al 6101
aluminum in 10, 20 and 40 PPI. The pore size has a direct effect on the size of the
geometric parameters in open-cell foam, such as nominal cell size, ligament length,
cross-section area and pore diameter.
Relative density
Relative density is the ratio of the actual foam density to the fully solid material
density. The relative density value counts the percentage of the occupied volume by the

11
material in the foam structure. Metallic foam is defined as a high porosity material, and
the relative density range is 3% to 25%. Typically, the relative density for metallic open-
cell foam is 3% to 15%, and the relative density for metallic close-cell foam is above
15% to 25%. A large value of relative density means the open-cell foam has thicker
ligaments, and the pores may be filled with the material. The cross-section profile of
metallic open-cell foam also varies with the relative density. The ligament profile has a
direct effect on the mechanic response of the open-cell foam. Figure 8 demonstrates
Duocel aluminum open-cell foam in 4.85%, 7.69%, and 11.14% at 40 PPI. Figure 9
shows the cross-section profile of Duocel foam in different relative density. Hence,
relative density controls the size and the shape of the cross-section profile in the
ligament.
Base material
Open-cell foam can be manufactured with many materials such as carbon,
aluminum, steel, and various polymers. This base material determines the physical
properties of open-cell foam, such as thermal expansion, melt temperature, and specific
heat. The mechanical properties of the open-cell foam, such as modules, yielding
strength, and thermal conductivity are related to the base material properties and the
relative density. In general, the relative density has a dominant influence on the open-
cell foam mechanical properties.

12
Figure 6 Pore and cell definition in open-cell foam structure [6].
Figure 7 6-8% Duocel aluminum open-cell foam in various pore size, (a) 10 PPI, (b) 20 PPI, (c) 40 PPI.

13
Figure 8 Duocel 40 PPI Al 6101-T6 open-cell foam in (a) 4.76%, (b) 7.69%, (c) 11.14 %.
Figure 9 Ligament cross-section profile of Duocell open-cell foam at various relative density [6].

14
2.1.2 Deformation of metallic open-cell foam
From the experimental observation in the compress test, metallic open-cell foam
has an elastic-plastic stress-strain response. Figure 10 shows the schematic compressive
stress-strain curve of an elastic-plastic foam. The curve shows a linear stress response at
low strain, then followed by a long collapse plateau and ended in a steep stress
hardening behavior due to densification. Through the detail observation in the
microstructure of metallic open-cell foam, the linearity of elasticity is controlled by the
ligament bending. The plateau is associated with the plastic hinge in the ligament. When
the foam was around 70% compress strain, the further compression led to ligaments
contact and caused the rapidly increased stress. From the material property aspect, a
larger relative density of open-cell foam will build up the elastic modulus, raise the
plastic plateau stress, and reduce the strain at the initial densification [7].
The stress-strain response of the metallic foam in the double lap shear test is
demonstrated in Figure 12. The shear stress is linear at the low shear strain and turns into
a decreasing curve after it passes the peak value. The shear strength is defined as the
peak point in the curve. Figure 13 shows the shear strength of metal foam with various
relative densities.
Past research and experiments result indicated the measured shear response of the
open-cell foam is affected by the sample size in the experiment. Gibson et al. have
indicated the size effects on the elastic modulus, yielding strength and shear strength of
Alpha and Duocel foams [8]. Figure 14 illustrates the measured material properties in
different sample size ratios. When the normalized size of the test sample is close to the

15
unit cell length, the elasticity module is less than half of the value of that measured from
the sufficient size. In contrast, the value of shear strength becomes larger when the
sample dimension is close to the length of a unit cell. Fleck and Chen indicated the
sample is constrained at the boundary when the test dimension is not enough [9]. The
suggested test sample size is 7 cells in the length direction for uniaxial compress test and
3 cells in the thickness direction for the double lap shear test [10].
Figure 10 Typical compressive response of cellular metal foam [7].
Figure 11 Effective material properties of open-cell foam via different relative density (a) Relative modulus (b) Relative compressive strength [7].

16
Figure 12 The shear response of Alporas aluminum foam at 11% relative density in the double lap shear test via various foam thickness [9].
Figure 13 The shear response of Alporas aluminum foam at 11% relative density in the double lap shear test via various foam thickness [9].

17
Figure 14 Size effects on the measured mechanical properties via various sample size: (a) Relative elastic modulus, (b) Relative collapse strength, (c) Relative shear strength [11, 12].
2.1.3 Mechanical properties of metallic open-cell foam
Useful surveys on the mechanics of cellular solids are contributed by Gibson and
Ashby [7], and Kraynik and Warren [13], and Betts [14]. From the observation in the
experimental result of the uniaxial compression test and shear test, the relative
mechanical properties for low density foams are linear to the power of the relative
density. A review of the material behavior investigation in metallic open-cell foam
shows the major modeling methods fall into two major categories, (1) Analytical

18
analysis with idealized cell structures; (2) Numerical analysis in repeated unit cells or
random cells [14, 15]. Analytical modeling methods provide an excellent prediction of
the mechanical properties in the linear small strain, and the prediction is off from the
experimental observation when the strain is large. As a result, scientists applied
numerical methods to simulate the nonlinear behavior of open-cell foam under large
strain deformation.
Analytical modeling methods utilize the dependent foam properties to analyze the
mechanical response of open-cell foam and predict the effective mechanical properties.
In analytical method, an idealized geometry is selected to depict the microstructure of
open-call foam and the dependent foam parameters, such as relative density and pore
number, are used to describe the ligament size and the scale of the unit cell. The
equivalent material properties are obtained through the investigation of the mechanical
response in isolated strut [11, 16-19], isolated joints [13, 20-22], or isolated cell [23].
Among the idealized cell geometries, Ashby and Gibson cubic model and Kelvin cell
model are the most significant microstructure for open-cell foams. The numerical
methods typically consider a similar ligament arrangement to real open-cell foam in the
simulation of the linear and nonlinear response. The perturbed Kelvin cell model and
random Voronoi cell model are widely used to model the ligament arrangement in the
numerical simulation. Figure 15 shows Ashby and Gibson's cubic cell model, Kelvin cell
model and Voronoi cell model. Ashby and Gibson cubic cell model is discussed
separately from Kelvin cell model and Voronoi cell model.

19
Figure 15 Idealized microstructure of open-cell foam, (a) Ashby and Gibson cubic cell model [24], (b) Kelvin cell model [8], (c) Voronoi cell model [25].

20
Ashby and Gibson cubic cell model
Ashby and Gibson have contributed significant efforts in the material behavior
characterization of open-cell foams through experimental and analytical methods. The
relative density was selected as the key parameters to predict open-cell foams’ effective
material properties. Ashby and Gibson constructed an idealized cubic open-cell model to
analysis the elastic modulus and the collapsing stresses of open-cell foam [7]. The
proposed open-cell foam material model shows the elastic modulus and yielding are
proportional to the relative density of open-cell foam. The linear mechanical properties
derivation of Ashby and Gibson's cubic model is presented in the following paragraph.
A typical cubic model is demonstrated in Figure 15.(a). The relative density of the
cell, ∗⁄ (the foam density, ∗ , divided by the solid material density of the cell
ligament, , and the second moment of area of a strut, I , are related to the dimensions
t and l by:
ρ∗
ρ∝
tl
(2.1)
and
I ∝ t (2.2)
Young's modulus for the open-cell foam is obtained from the calculation of the
elastic deflection of the beam, which is loaded in the midpoint. The edge bending
schematic is shown in Figure 16. From the beam bending theory, the deflection, δ, is
proportional to ⁄ , where is the Young's modulus for the raw material. The
load, F, is related to the effective stress, σ, by ∝ and the effective strain, , is

21
related to the deflection, δ, by ∝ ⁄ . The effective Young's modulus of open-cell
foam, ∗, is given by
∗ (2.3)
by substitute the relative density in the equation
∗ ∗
(2.4)
where is the geometric constant. The experiment results suggest 1 for open-cell
foam.
Shear modulus of open-cell foam is calculated with the similar method. The
shear stress, τ, induces the shear strain, γ, through the bending of the ligament. The
deflection is proportional to ⁄ , the shear stress and shear strain are proportional to
⁄ and ⁄ , respectively. The effective shear modulus, G∗, is given by
∗ (2.5)
from which
∗ ∗
(2.6)
for cubic cell. The experimental data suggest 3/8 for open-cell foam.
∗ ∗
(2.7)
The linear elastic and isotropic material indicates

22
∗
∗
2 1(2.8)
Substituting the effective Young's modulus and shear modulus in the equation, the
effective Poisson's ratio is given by
21 (2.9)
where 1 3⁄ .
The plastic collapse of the cubic cell happens when the moments exceed the
maximum limit, and all the joints are under the plastic hinge. The formation of the
plastic hinge in the cubic model is demonstrated in Figure 17. The plastic bending
moment, M , at the joint is
M
14σ t (2.10)
where σ is the yielding strength of the raw material. The plastic bending moment,
M ,is proportional to Fl. The stress of the foam is proportional to ⁄ . The effective
plastic strength of open-cell foam, ∗ , can be expressed as
∗ ∝ (2.11)
Combined with the relative density, the relative plastic collapse strength is given by
∗ ∗ ⁄
(2.12)

23
where contains the geometric constants. The experiment results suggest 0.3 for
open-cell foam.
Figure 16 Cell edge bending during the elastic deformation [7].
Figure 17 The plastic hinge formation in open-cell foam [7].

24
Kelvin cell model or Voronoi cell model
Kelvin cell model is a tetrakaidecahedron unit cell which contains six planar
square faces and eight hexagonal faces and can be stacked up to show a regularly
repeated foam structures [7]. Open-cell foam was first modeled with the
tetrakaidecahedron unit cell by Dement'ev and Tarakanov [26]. Warren and Kraynik et al.
presented a micromechanical analysis to obtain the linear elastic behavior of low density
open-cell foam [13, 20-22]. Zhu and Mills et al. extended the analysis of
tetrakaidecahedron unit cell into the high compression strain for PU foam [27, 28]. Gong
and Jang developed several models for predicting the complete response of PU foam and
aluminum open-cell foam [29]. From the result of the above research, Kelvin cell model
also precisely predicts the elastic mechanical properties of open-cell foam.
For the nonlinear behavior of open-cell foam, such as the crushing response, the
numerical analysis is introduced to analyze the behavior under the randomized structure
and large strain deformation. It has been found the small perturbation reduce the
sensitivity of the initial postbuckling response to the domain size [30]. The randomized
structure was typically generated by a perturbed Kelvin cell model or Voronoi cell. A
perturbed Kelvin cell model uses a small random scale to adjust the node position.
Voronoi cell utilized randomly distributed cells with different size and shape to fill a
space [14]. Both models produced a close ligament arrangement to the real open-cell
foam structures.
For analyzing the size effect, Zhu et al. applied the finite element method to depict
the size effects on the mechanical properties of the irregular open-cell foam [15, 31]. For

25
low relative density open-cell foam, the research has shown that the main mechanical
response at low strain is the bending and twisting of the ligaments and the major
response at high compressive strain is the struts buckling. Tekog˜lu and Onck et al. used
2D Voronoi cells to show the size effects of open-cell foam under different loads of
compression, bending, shear and indentation [32]. The results show size effects is
associated with the cell morphology and can be realized from the basic deformation
modes. Li et al. further applied 3D Voronoi cells to investigate size effect in the dynamic
response of close-cell foam and indicated the dynamic response is sensitive to the cell
size when the material is rate dependent [33].
Kyriakides et al. have conducted a series of studies on the mechanical behavior of
open-cell foam with Kelvin cells and random Voronoi cells under compressive loads.
Gong et al. applied regular Kelvin cell model to predict the initial elastic modulus of
foams and nonlinear aspects of the compressive response [29, 34, 35]. The study
demonstrated that the onset of ligament buckling was associated with the first turning
point in the measured response and it also showed the anisotropy of open-cell foam
result in different crushing responses. Jang et al. continued the investigation into the
crushing response of aluminum open-cell foams with Voronoi cells and Kelvin cells [30,
36-38]. Micro-computer X-ray tomography was utilized to develop the 3D image of
open-cell foams and established the cell size and ligament length distribution. With the
statistical data, Kelvin cell model is improved to have the same dependent foam
properties with the actual open-cell foam and gives a better crush response prediction.
Gaitanaros et al. utilized the Surface Evolver software to construct a 3D Voronoi cell

26
model and extended the numerical analysis of aluminum open-cell foam behavior in the
dynamic crushing response at various impact speeds [39-41]. The simulation results
show the impact speed can change the initial crushing location. Okumura et al. rendered
some defects in the ligament and wall structure and observed the buckling behavior in
the numerical analysis [42, 43].
With the advanced 3D print technology, the material in special lattice geometry
can be produced and applied as the core material in the sandwich panel. A numerical
method is widely used to predict the stress-strain distribution and indicates the failure
modes [44-52]. Due to the precise geometry description in the ligament arrangement, the
numerical analysis results are in excellent agreement with the experimental data.
2.1.4 Summary
From the review, it can be concluded that the analytical methods and numerical
methods can have good predictions in mechanical properties of open-cell foam under
compressive loads. However, the early fracture under bending deformation in the
previous studies, a detailed analysis or experiment test of metallic open-cell foams under
a large plastic bending behavior is missing. In addition, the size effect on the shear
modulus and shear strength could be significant in the deformation process when the
number of cells through the thickness of the foam is insufficient. Hence, numerical
method and Kelvin cell model are implemented in this research to analyze the plastic
bending behavior of metallic open-cell foam and to understand the size effect on plastic
bending.

27
2.2 Bending theory
2.2.1 Elastic and plastic bending theory
Euler-Bernoulli beam theory and Timoshenko beam theory are the most well
known elastic beam bending theories. The major discovery of Euler-Bernoulli beam
theory was by Jacob Bernoulli. Leonhard Euler and Daniel Bernoulli put the theory
together to become the classical beam bending theory in 1750. The model assumes the
beam’s cross-section is always perpendicular to the bending line. As a result, the
curvature of a beam is proportional to the bending moment at any point. Euler-Bernoulli
beam theory does not include the transverse shear deformation and is only able to
describe the beam behavior with a small deflection. Timoshenko beam theory was
developed by Stephen Timoshenko in 1921 - 1922 [53, 54]. The shear deformation is
considered in Timoshenko beam model, and the rotational effect of the beam makes the
model suitable for describing the behavior of short beam, composite sandwich panel, and
beam under high frequency excitation.
The first plastic bending theory for non work hardening material was developed
by Ludwick based on the assumption similar to the elastic bending theory [55]. Hill
followed Ludwick's assumption and developed the plastic bending theory in plan-strain
condition [56]. However, Ludwick neglected the transverse shear stress, and the model
prediction is less accurate when the bending radius to the sheet thickness ratio is
decreased. In the later advanced theories, the transverse shear effect was considered in
bending of ideal plastic materials [57, 58]. Hill's work was extended to a hypothetical
linear strain-hardening material in pure bending condition by Proksa [59].

28
In the industrial application of sheet metal forming, elastic and plastic bending
theories are used to obtain the relationship between applied force and deformation. Yu
and Johnson derived an analytical solution to show the influence of axial force on the
elastic-plastic bending and springback of a beam [60]. DeVries and Lauderbaugh
established a model for bending bimetallic strip and predicted the punch load and the
strip shape. Stelson et al. used an elastic-plastic model to build an adaptive force control
model for the press brake bending [61-64].
2.2.2 Sandwich bending theory
The analytical models of sandwich bending were developed after 1940. Plantema
[65], Allen [66], and Zenkert [67] have made contributions to different problems in
bending and buckling of sandwich plates and struts under in-plane loading condition.
These classical bending theories used the following basic assumptions to derive
deflection equations: 1. The antiplane condition: There is no transverse flexibility in core
materials, and thus the deflections of the upper and lower face sheets are equal to each
other. 2. The displacement distribution in the longitudinal direction is linear. With these
assumptions, the total displacement could be separated into two parts. The primary
deformation is the beam deformation without shear deformation and the secondary
deformation is the face sheets bending on its own neutral axis, and the core is subjected
to shear deformation [68].
To consider the sandwich panel with a transversely flexible core, the assumptions
in the classical bending theory are no longer valid. As a result, the high order sandwich
theories were introduced to account for the nonlinear effects on the distortion of the

29
section plane. Forstig [69-71] investigated the general behavior of sandwich beams with
flexible core under concentrated loads and distributed loads, and developed the high
order sandwich theory. The proposed sandwich theories could determine the transverse
stress at the interface between the face sheets, which is helpful in analyzing the
delamination problem of sandwich panels. The high order sandwich theories could also
predict the stress under singular conditions.
From the review of sandwich theories, it is found that most of the sandwich panel
bending theories assumes small deflections. Under a large plastic deformation, the
deformation of sandwich panels is nonlinear, and the deformation behavior should be
described by nonlinear differential equations. The existing sandwich theories would not
be appropriate for a large deformation, and numerical methods could be applied to solve
the complex nonlinear problem.
2.2.3 Failure mode map
The concept of failure mode map for sandwich beams in bending problem was
developed by Triantafillou and Gibson in 1987. In the research, equations were
developed to describe the load at each possible failure modes for sandwich beams when
face sheets and core materials yield plastically [72]. Then, the failure map with the ratio
of face sheet thickness to span length versus the core relative density was developed.
The plot showed the major failure mode at given load configuration with a various
combination of face sheet and foam core. The failure mode map is then used to optimize
the design of sandwich beams.

30
McCormack et al. [73], Chen et al. [74] and Bart-Smith et al. [75] investigated
plastic collapse modes for the sandwich panel in three points and four points bending
using both experiments and analytical methods. The failure mode maps with the axes of
beam dimensional parameters and test parameters were built by using limit load
solutions, as shown in Figure 18. The analytical result shows the peak loads and the
major failure modes agree well with the experimental observations over failure maps.
The published failure maps were developed for sandwich panels, and sandwich
panels are not treated as a bendable material subjected to large plastic deformation. For
two layered panels of interest in this research, no failure map has been developed and
constructed.
Figure 18 Failure mode map for a sandwich panel with aluminum sheet and aluminum foam core in three points bending test [73].

31
2.3 Sheet hydroforming
A comprehensive review of sheet hydroforming process was collected by
Vollertsen Sheet hydroforming has been widely studied since 1950's [76]. Hill
developed an analytical model to describe the deformation of the metal sheet in a bulge
test [56]. Chakrabarty et al. improved Hill's work by including hardening coefficient in
the model [77]. The effects of work hardening on the thickness and the dome height
were investigated. Shang et al. developed a model to predict the influence of the die
radius on sheet hydroforming [78-80]. They found that allowing draw-in of the flange
can improve the formability of the sheet metal. Hein et al. presented the forming
mechanisms at different areas in free hydroforming of a blank [81]. Controlling the
blank holder force can improve the formability of the sheet was reported by Shulkin et al.
[82]. However, thicker materials, such as sandwich panels and two-layered panels, were
not considered as a deformable material in the hydroforming process. The failure
mechanism of two layered panels in hydroforming process is not well understood. Hence,
this research utilized experiment and finite element analysis to investigate and to
describe the failure mechanism of metallic open-cell foam supported sheet panel in
hydroforming process.

32
2.4 Research method
In this research, the major objective is to investigate the formability of the metallic
open-cell foam supported sheet metals in both press brake bending process and
hydroforming process. To accomplish the objectives, several tasks will be performed.
1. Establish the testing procedure and conduct tests to observe the deformation
in the test specimens for both forming processes. Conclude the failure modes
and indicate the failure cause.
2. Analyze the experimental results at different foam density, specimen
dimensions, and test parameters to understand the effects of material
properties and test parameters.
3. Conduct the numerical analysis with proper finite element models to capture
the detail failure mechanism and to carry the parametric study in the
specimen dimensions, material properties, and test parameters.
4. Construct the failure criterion and the design guideline based on the
experimental and numerical results
According to the overall literature review, using sandwich beam theories to obtain
the analytical load limit criterion can be challenging due to the large deformation and
complex structure of the metallic open-cell foam. Therefore, a proper open-cell foam
models based on the observation in the experimental result will be implemented in the
finite element analysis and expected to capture the detail failure mechanism.

33
CHAPTER III
PRESS BRAKE BENDING EXPERIMENT
Press brake bending is a process that a machine punch is used to bend the sheet
metal into a predesigned angle above a supporting die. The process is similar to the three
points bending test. In this research, the machine punch was modified to have a larger
radius to reduce the contact stress for a successful bending of two-layered panels with
open-cell foam. The supporting die is replaced by two supporting columns with a fixed
radius at the contact area. In this chapter, the experiment setup and results are described,
and the discussion of the effects for different test parameters is also presented in the
following section.
3.1 Characterization of Duocel Al 6101-T6 open-cell foam
In this study, three different relative densities of ERG Duocel 40 PPI Al 6101-T6
open-cell foam blocks were selected to produce the attached foam in the experiment.
The relative density ranges of the foam blocks are 4-6 %, 6-8 % and 10-12 %. To
evaluate the relative density precisely, each foam blocks was sliced into 1 inch wide
rectangular cuboids by electrical discharge machine, then each small piece was
measured and the average value of the blocks was taken as the relative density of the
foam block. The obtained average relative densities of the foam blocks are 4.85 %, 7.69
%, and 11.14%. The chemical composition of Duocel Al 6101-T6 open cell foam is
listed in Table 1. Table 2 shows the material properties of Duocel 6-8 % Al 6101-T6
open-cell foam given by the supplier ERG.

34
The previous experimental result already indicated the orientation of the cell has a
great influence on the mechanical response of the metallic open-cell foam. In order to
examine the cell geometry in the open-cell structure, each relative density block was
characterized by 12 mm x 15 mm microscopic images in the rise-transverse plane at 20
different locations. The cell lengths in both rise and transverse direction were measured
at least 5 cells in each image, and the value was used to calculate the aspect ratio. Figure
19 showed the measured plot in the microscope image. The average cell lengths in the
rise direction are 3.01 mm, 2.82 mm, 3.06 mm, and the aspect ratios are 1.18, 1.24, and
1.25 for 4.85 %, 7.69 %, and 11.14 % Duocel Al 6101-T6 foams, respectively. Table 3
lists the mean values of cell length in the rise and transverse direction and the calculated
aspect ratio.
Table 1 Chemical composition of Duocel Al 6101-T6 foam and bulk alloy of the foam raw material [83].

35
Table 2 Material properties of Duocel 8% Al 6101-T6 open-cell foam.
Table 3 Average cell lengths in 4.85 %, 7.69%, and 11.14 % Duocel Al 6101 foam.
Relative Density
Average cell length in rise direction
Average cell length in transverse direction
Aspect ratio
4.85 % 3.011 mm 2.422 mm 1.24
7.69 % 2.822 mm 2.276 mm 1.24
11.14 % 3.061 mm 2.601 mm 1.18
Figure 19 Cell length measurement of 11.14% foam block in the microscope image.
Compresssion Strength 367 psi
Tensile Strength 180 psi
Shear Strength 190 Psi
Modulus of Elasticity
(Compression)15000 psi
Modulus of Elasticity
(Tensile)14600 psi
Shear Modulus 29000 psi
Material property of 8% Duocel Al 6101-T6 Foam

36
3.2 Experiment setup
3.2.1 Experiment setup
Figure 20 illustrates the experiment setup for the press brake bending process. The
specimen was supported by two columns and was pushed down by the center
semicircular punch in the rate of 6.35 mm per minute. During the test, the extensometer
recorded the deflection in the middle of the bottom sheet, and the punch moved down
until the deflection of the bottom sheet reached the desired depth. The desired depth was
calculated by bending the panel into 90-degree angle without considering thickness
reduction at the given span length (L), as shown in Figure 21.
Figure 20 Three points bending experiment setup.

37
Figure 21 Schematic draw for the calculation of the test punch deflection (D) at specified punch radius (R), specimen thickness (H) and span length (L).
3.2.2 Specimen preparation
The two-layered panel was constructed by one layer of sheet metal and one layer
of metallic foam. In this experiment, the face sheet used was aluminum 5052-H32 sheet
metal in 0.8 mm thickness, and the metal foam is ERG Duocel aluminum 6101 T6, 40
PPI open-cell metallic foam. The electrical charged machine was applied to cut the foam
block and sheet metal into designed dimensions. The width is 25.4 mm and the length is
calculated based on the punch radius for both face sheet and foam. During the assembly
process, the face sheet was cleaned with acetone first, then was applied a 0.2 mm
thickness of Loctite H3151 acrylic adhesive to create the bond between the face sheet
and the foam. The two-layered panel was fixed by the clamps for one day to allow the
adhesive to cure completely.

38
3.2.3 Test parameters
The three point bending process was tested with three major test parameters to
evaluate the bendability for the metallic open-cell foam supported sheet panel. These
three major test parameters are punch radius, foam relative density and foam thickness.
For punch radius, there were four different punch radii (R), 5 mm, 10 mm, 20 mm, and
30 mm, tested in the experiment. Each punch radius was tested in a fixed span length (L)
between support columns. The length of the span are 50 mm, 60 mm, 80mm, and 90 mm
corresponding to the punch radius, 5 mm, 10 mm, 20 mm, and 30 mm respectively. For
foam relative density, 4.85%, 7.69%, and 11.14% relative densities of Duocel open-cell
metallic foams were tested in the bending process. The relative density of foam was
obtained from the averaged relative density of foam blocks after cutting by electrical
discharge machine. For the foam thickness, three thicknesses, 6mm, 9mm, and 12mm,
were selected for each relative density. For the 7.69% average relative density, an
additional set of 15.8 mm thickness specimens was added to observe the thickness effect
on the deformation of two-layered panels. Table 4 shows the correspondent punch radius
to specimen length and Table 5 demonstrates the calculated punch deflection for the
specified test parameters in the experiment.

39
Table 4 Correspondent punch radius to specimen length.
Punch Radius (mm) 5 10 20 30
Specimen Length (mm) 60 80 98 118
Table 5 Punch deflection (D) for specified test parameters.
Punch Radius (R) 5 10 20 30
Specimen Thickness (H)
L D L D L D L D
6.8
50
15.970
60
18.899
80
24.757
90
25.615
9.8 14.727 17.656 23.514 24.372
12.8 13.485 16.414 22.272 23.130
15.8 12.242 15.717 21.029 21.87
Unit: mm

40
3.3 Experimental result
3.3.1 Punch force to sheet metal deflection curve
Figure 22 presents the punch force to the sheet metal deflection curve in the test
set with 9 mm thickness of 7.69 % foam and 10 mm punch radius. As shown in the
curve, the punch force has a linear rise in the beginning of the test, and then turns
gradually into a less steep rise. If the punch force has an apparently decrease, it means
the foam is separated from the sheet metal due to weak adhesive bonding, such as the
sample 5 in Figure 22. In the observation, even though the relative density of foams in
the same test set has a small difference from one to another, the force-deflection curves
are quite close and the variation is in an acceptable range. Hence the repeatability of the
experiment is assured. For convenience, the averaged punch force to sheet metal
deflection curve is used in the following discussion.
Figure 22 The averaged punch force to sheet metal deflection curve in the test set with 9 mm thickness of 7.69 % foam and 10 mm punch radius.
0
100
200
300
400
500
0 5 10 15 20
Punch Force (N)
Sheet Defelection (mm)
7.69 % R10mm H9.8mm
Sample 1
Sample 2
Sample 3
Sample 4
Sample 5
Sample 6
Averaged curve

41
3.3.2 Deformation modes of two-layered panels
The deformation modes of press brake bending experiments can be discussed in
three major categories. These three major deformation modes are curved panel with
uniform thickness, foam indentation, and face sheet indentation. Each deformation
condition is described as follows:
Curved panel with uniform thickness
Figure 23 shows the foam microstructure in the middle of the specimen before and
after the bending process at the side view and the top view. The panel is bent into an
arch panel successfully, and there is little change in the panel thickness. The face sheet
only changes in its curvature, but the thickness and length do not vary in the bending
process. The only significant deformation happened around the top layer of the open-cell
foam. The cell structure is compressed in the transverse direction. The deformation is
obvious with the increased foam thickness. As expected, the bond from face sheet limit
the movement of the open-cell foams at the interface and leads the foam subjected to
compressive bending deformation.
Foam indentation
Figure 24 and Figure 25 demonstrate the foam indentation mode in the middle of
specimens during the bending process. The punch left a clear punch mark at the contact
area with metallic foam and caused the reduction of foam thickness. From the
observation, the deformation of struts collapse could be separated into two different
behaviors. In the middle line of specimens, the cells were compressed along the

42
thickness direction, but the length along the longitudinal direction is unchanged. The
cells near the punch had larger radial compression deformation than the cells near the
face sheet. Besides collapse in the middle line, there are two shear zones appeared at the
both edges of the punch contact area. From the observation in experiments, the shear
zone happened near the edge of the punch contact area at first. With the increased punch
deflection, the shear zone extended and the struts piled up near the punch contact area.
Meanwhile, the struts at the top middle span started to collapse and led to a thickness
reduction in the specimen.
Therefore, the parameter "thickness ratio" is introduced to characterize the
thickness change in the process. The thickness ratio is calculated by using the deformed
thickness divided by the original specimen thickness. The thickness ratio to punch
deflection curve can depict the thickness status of the specimen during the experiment,
as shown in Figure 26. Based on the observation of the curves, the foam indentation
always happens in the early stage of the bending process. Here, a 3 % thickness ratio
reduction is set to distinguish the foam indentation in the experiment. If the reduction of
thickness ratio is greater than 3%, then the specimen is considered to have foam
indentation. Table 6 lists the averaged thickness ratio in the final status for all test sets.
Face sheet indentation
The face sheet indentation happened when the foam thickness is over 12 mm in
the experiment. The excessive contact force at the support columns left a mark at the
sheet and led a non-straight edge in the face sheet, as shown in Figure 27. The face sheet

43
indentation is inspected after the experiment is completed. The face sheet and foam
indentation deformation can happen in a specimen simultaneously.
Figure 23 Foam microstructure deformation before and after the bending process, (a) side view, (b) top view.
Figure 24 Foam indentation at 4.85%, thickness 12.8mm foam, radius 5 mm test.

44
Figure 25 Foam indentation at 4.85%, thickness 12.8 mm foam, radius 10 mm test.
Figure 26 The thickness ratio to punch deflection curve in the test set with 9 mm foam thickness, 7.69% foam and 10 mm punch radius.
Figure 27 Sheet indentation at 7.69%, 15 mm foam thickness, radius 30 mm test.

45
Table 6 Thickness ratio at the final punch deflection.
Specimen average thickness ratio (H'/H)
Punch Radius (mm)
Foam thickness
(mm)
Foam relative density
4.85% 7.69% 11.14%
5
6 0.892 0.954* 0.972
9 0.835 0.909 0.933
12 0.741 0.79 0.871*
15 0.695
10
6 0.978 0.986 0.995
9 0.961 0.962 0.975
12 0.93 0.919* 0.954*
15 0.873*
20
6 0.998 1.022 1.009
9 0.998 0.99 0.994
12 0.987 0.978 0.992
15 0.964
30
6 0.982 0.999 1.012
9 0.996 0.9963 1.003
12 0.989 0.987 0.999
15 0.981
* Denote the set has less than three effective samples

46
3.3.3 Deformation modes at given test parameters
As a summary, the deformation modes in 4.85%, 7.69%, and 11.14% relative
density foams at given test parameters are collected and summarized in Figure 28. The
x-axis is the radius of punch in mm, and the y-axis is the foam thickness, also in mm.
From the chart, it can be concluded that the higher relative density foam may have less
foam indentation in the thinner foam thickness.
Figure 28 Deformation modes with three relative density foam at different test parameters.

47
3.3.4 Initial bending stiffness and effective moment of inertia
Since the foam indentation happens in the early stage, the initial bending stiffness
of the foam supported panels is an essential property for identifying the occurrence of
the foam indentation. To analyze the initial bending stiffness, the punch force to sheet
metal deflection curve with sheet metal deflection between 0 to 0.5 mm sheet metal
deflection is further examined. Then the linear fit method is applied to the linear portion
of the curve to approximate the bending stiffness. Figure 29 to Figure 31 demonstrate the
initial bending stiffness at the thickness of the foam and the span length of the
supporting die for each relative density foam.
From the observation of the force to sheet metal deflection curve, the very initial
bending stiffness of the test is linear and the response of the sheet metal should be elastic.
The linear bending stiffness can be expressed mathematically as a function of test
parameters from the flexure formula of in three points bending. The initial bending
stiffness, , is the reaction force of the punch, , divided by the deflection of the sheet
metal, , which is
48 ′
(3.1)
Here, is the span length and ( ′ is the effective constant of the elastic modulus
multiple the moment of inertia of the panel cross-section. In the test, the metallic foam
and the sheet panel are both aluminum, and the values of the elastic modulus for both
foam and sheet metal are the same. Hence, the elastic module of effective constant of

48
( ′ can be extracted as ∙ ′. ′ can be treated as the effective moments of inertia
of the panel cross-section and the value can be written as
148
(3.2)
Here 69 is applied in equation (3.2) to obtain the effective moments of
inertia from the bending stiffness. Figure 29 to Figure 31 plot the effective moments of
inertia of the foam supported sheet metal at different test parameters. As shown in the
Figure 32, the effective moments of inertia in the sample without indentation is very
consistent even in the different span length and the variation of the effective moments of
inertia in 80 mm and 90 mm for each set is within 5% to 10%. In the sample with
indentation failure, however, the value of effective moments of inertia is 19% to 32%
lower than the value of the identical sample tested in the longer span with no indentation.
According to the observation, we can conclude the indentation will reduce the bending
resistance of the panel in the very beginning of the test when the indentation failure
occurs. As a result, the difference of initial bending stiffness is significant between the
samples with and without indentation failure and it may be treated as a failure criterion
for the press brake bending process. Figure 34 plots the average value of the effective
moment of inertia in 80 mm and 90 mm span length for each test, and the average value
is a list in Table 7. The data are used to discuss the effects of different test parameters in
the next section.

49
Figure 29 Initial bending stiffness of 4.85 % relative density foam at the given specimen thickness and span length.
Figure 30 Initial bending stiffness of 7.69 % relative density foam at the given specimen thickness and span length.

50
Figure 31 Initial bending stiffness of 11.14 % relative density foam at the given specimen thickness and span length.
Figure 32 Effective moment of inertia of 4.85 % relative density foam at the given specimen thickness and span length.

51
Figure 33 Effective moment of inertia of 7.69 % relative density foam at the given specimen thickness and span length.
Figure 34 Effective moment of inertia of 11.14 % relative density foam at the given specimen thickness and span length.

52
Figure 35 Effective moment of inertia in 80 mm and 90 mm span length via different relative density and sample thickness.
Table 7 The average value of the effective moment of inertia in 80 mm and 90 mm span length via different relative density and sample thickness.
Effective Moment of Inertia mm )
Relative density
Sample thickness (mm)
6.8 9.8 12.8 15.8
4.85 % 3.40 10.99 27.99 ‐
7.69 % 11.05 29.43 59.72 101.88
11.14 % 17.86 40.29 73.09 ‐

53
3.4 Discussion of experimental results
In this section, the effects of the foam thickness, the relative density of foam and
the span length are discussed and summarized.
3.4.1 Effect of foam thickness
The increased thickness will make the panel has a better rigidity and cause a
higher initial bending stiffness. Therefore, the punch force to bend the panel for the same
sheet metal deflection is raised with the increase of foam thickness at the fixed span
length. A larger punch force will lead a great contact stress and may cause the ligaments
inside open-cell foam collapse in the middle of the span. Figure 36 and 37 illustrate the
punch force to sheet metal deflection curve and the thickness ratio to sheet metal
deflection curve in the different thickness experiments with 10 mm punch radius and
7.69% relative density foam As shown in Figure 36, the reduction of thickness ratio
apparently increased in a thicker foam, and the foam in 12 and 15 mm thickness have
significant changes in thickness ratio. The other test results in the 4.85% and 11.14%
relative density also had the same trends in the both of the force to deflection curve and
the thickness ratio to the deflection curve.
Compare to the effective moment of inertia in Figure 32, the thicker foam has a
larger effective moment of inertia. For instance, the average value of the moment of
inertia in 7.69 % relative density foam is 11.05 mm , 29.43 mm and 59.72 mm
respectively to 6.8 mm, 9.8 mm and 12.8 mm sample thickness.

54
3.4.2 Effect of relative density
The relative density of foam affects the foam material properties. According to
Ashby and Gibson's effective open-cell foam material model, the elastic modulus of
foam is proportional to the square of the relative density and the yielding strength is
proportional to one and a half power of the relative density. For the same pore size (PPI)
open-cell foam, the greater relative density increases the cross-section area in the
ligaments, and it also raises the elastic modulus and yielding strength at the same time.
As a result, the higher relative density open-cell foam is more difficult to be bending. To
compare with Figure 35 to Figure 38, the higher relative density will lead to a larger
initial bending stiffness, and it agrees with the physical observation from the foam
microstructure. From the view of the effective moments of inertia in Figure 32, the high
relative density foam also led a large value of the effective moments of inertia in the
panel.
Figure 38 shows the punch force to sheet metal deflection curve and Figure 38
shows the foam thickness ratio to punch deflection curve for 4.85 %, 7.69 %, and 11.14
% relative density in the experiment of 6 mm foam thickness and 10 mm radius. From
the plots, the 11.14 % relative density foam had the largest punch force and the smallest
reduction of thickness ratio among the three relative density foams under the same sheet
metal deflection.

55
3.4.3 Effect of span length
The observation of the indentation failure in Figure 28 shows the indentation
failure tests are on the left-hand side and the tests without the foam indentation are on
the right-hand side. Although the test radius at each span length is different, but the
initial contact area of the punch is relatively small and it leads the bending stiffness is
not strongly affected by the punch radius. In the classic beam bending theory, the
bending stiffness is proportional to the cubic of the inverse span length. The bending test
results also give the same trend that the value of the initial bending stiffness has a rapid
reduction with the increased span length. In the initial bending stiffness plot, a design
guideline exists and it will separate the area with the foam indentation area and the area
without foam indentation.
Figure 36 Force to sheet metal deflection curve in 7.69 % density and 5 mm punch radius experiment.

56
Figure 37 Thickness ratio in 7.69 % density and 5 mm punch radius experiment.
Figure 38 Punch force to deflection curve for each relative density foam in the experiment of 6 mm foam thickness and 10 mm punch radius.

57
Figure 39 Foam thickness ratio to punch deflection curve for 5%, 8%, and 11% relative density in the experiment of 6 mm foam thickness and 10 mm radius.

58
3.5 Hoop strain failure criterion
From the observation in the experiment, two shear zones were appeared next to the
mid-span in the indentation failure samples. The cell at the top edge of the shear zone
had the most severe shear deformation, and it was the initial shear buckling location. As
a result, the compressed stress and strain at the top cells would be the key parameters to
build the failure criterion for this process. However, to describe the localized stress and
strain for random foam ligaments is unrealistic. Therefore, a failure criterion is proposed
based on the geometry of a perfect bending condition. A perfect bending condition, as
shown in Figure 38, assumed the supported sheet metal would fully confirm the punch
curvature without variation in foam and sheet metal thickness. Hence, the deformation
behavior of the cross-section is linear in the perfect bending condition, and the bending
strain can be described by the location of neutral axis and the bending curvature. From
the observation in the experiment, the length change of sheet metal is minimal, and the
midplane of sheet metal is able the assumed as the location of the neutral axis. The hoop
strain along the cross-section can be written as:
εYR′
Y
R h t2
(3.3)
where, is the hoop strain; Y is the location from the neutral axis; R' is the bending
radius; R is the punch radius; h is the foam thickness; t is the sheet metal thickness. The
proposed failure criterion hypothesis analyzed the hoop strain of the top cell in the
perfect bending condition. The criterion assumed the shear zone failure will occur when

59
the compress hoop strain excess the compress strain limit, ∅. The location of the average
hoop strain of the top cell is half of the nominal cell length, , under the top edge.
The equation of hoop strain can be rewritten as:
212
2
∅ (3.4)
1
1 ∅∅
12 2
(3.5)
The equation (3.5) is the final form of the proposed failure criterion. Figure 40 shows the
criterion on the punch radius to foam thickness plot. The slope of the failure criterion is
∅∅
and the intersection value in the foam thickness axis. is ∅
. Here,
equation (3.5) was further normalized by the sheet thickness, t, and can be written as,
1
1 ∅∅
12
12
(3.6)
The failure criterion equation (3.6) splits the plane into two regions with indentation and
without indentation. For a larger compress strain limit, the slope becomes steeper and the
intersection point moves up.
To validate the geometric failure criterion, the geometric parameters of the test set
with the same radius were substituted in the equation and a range of the compress strain
limit was obtained from the failure transition zone. Here, the nominal cell length was
selected as 3 mm. The calculated compress strain limit range in the largest punch radius

60
which contained both indentation failure and uniform thickness samples are 0.3~0.4,
0.34~0.39, 0.41~0.48 for 4.85 %, 7.69 %, 11.14 % Duocel Al 6101-T6 open-cell foam
respectively. The mean value of the upper and lower limit of the range was selected as
the compress strain limit in the failure criterion. The average compress strain limit are
0.35, 0.365 and 0.445 for 4.85 %, 7.69%, 11.14 % Duocel foam respectively. Figure 42
expressed to the method to draw the failure criterion in the plot of 7.69 % Duocel foam.
Figure 43 and Figure 44 shows the failure criterion in 4.85 % and 11.14 % Duocel foam.
From the observation in the plots, the failure criterion successfully predicted the foam
indentation failure from the geometry parameters in various relative density Duocel Al
6101-T6 open-cell foam. It is demonstrated that the failure criterion is able to evaluate
the geometry parameters of the metallic open-cell foam supported sheet metal in the
press brake bending process.
The average compress strain limit also implied that there is shear deformation
resistant in the metallic open-cell foam. This observation agrees with the shear strength
of ligament in the foam structure. The ligament in the large relative density foam has a
larger profile, and the cell structure has a better rigidity to overcome the shear
deformation.

61
Figure 40 Configuration of the perfect bending condition.
Figure 41 Geometric failure criterion hypothesis of metallic open-cell foam supported sheet panel in the press brake bending process.

62
Figure 42 Failure criterion in 7.69 % Duocel Al 6101-T6 open-cell foam.
Figure 43 Failure criterion in 4.85 % Duocel Al 6101-T6 open-cell foam.

63
Figure 44 Failure criterion for 11.14 % Duocel Al 6101-T6 open-cell foam.

64
3.6 Summary and conclusions
The experiments of press brake bending process have successfully proved the idea
to deform the metallic open-cell foam supported sheet metal. The results show several
successful bending parameters and also indicate there might be a foam indentation
failure in the very beginning of the test when the specimen dimensions and test
parameters are inappropriately selected. A shear band in the foam microstructure is also
observed near the mid-span of the sample. Besides, the indentation failure will damage
the structure and lead a reduction in the initial bending stiffness of the panel.
Through observation in the experiment result, the indentation failure can be
prevented by choosing a larger punch to span length ratio. From the aspect of the
material property, the higher density foam can increase the ligament rigidity and can be
bent by a smaller punch radius without indentation failure.
A geometric failure criterion was proposed based on the assumption of the perfect
bending condition. By setting the maximum compressive hoop strain, the failure
criterion successfully identified the indentation failure in the given specimen dimensions
and the punch radius. The value of the maximum hoop strain for three density foams
also proved that the higher density foam has a larger capability to be compressed without
failure. This finding agrees with the experiments conclusion.

65
CHAPTER IV
NUMERICAL ANALYSIS OF PRESS BRAKE BENDING PROCESS
The experimental results had shown the feasibility of bending metallic foam
supported sheet metal with press brake bending process. A shear band of buckled
ligaments was observed in the indented samples before the thickness reduction ratio
reaches to 3 %. Due to the complex ligament arrangement in the open-cell foam, the
shear band was difficult to measure. Anisotropic Kelvin cell foam model was built using
shear deformable beam elements and implemented in the finite element analysis to
observe the open-cell foam deformation behavior. Grids were set up to calculate the
strain of the top layer cells near the punch during the bending process. Through the
observation of strain history at multiple test sets, a shear strain failure criterion was
established and compared with the geometric failure criterion introduced in Chapter III.
4.1 Anisotropic Kelvin cell foam model
The structure of Kelvin cell model is consists of 6 squares, and 8 hexagons. The
cluster of anisotropic Kelvin cell and the repeated ligament frame were shown in Figure
45. In the plot, l represents the ligament length in the horizontal plane, is the
height to width ratio in the cell, the 1 direction is along the rise direction; the 2 and 3
directions are along the transverse direction. The unit length in the transverse direction
plane, h2, is equal to 2√2 . For a convenience, anisotropy ratio (λ ) is introduced to
indicate the anisotropic geometry of Kelvin cell and . Hence, the unit length in
the vertical plane, h1, is equal to ∙ 2√2 . In this study, the sliced foam thickness

66
direction was selected in the rise direction and the thicknesses of blocks were selected as
6 mm, 9 mm, 12 mm and 15 mm. According to the statistical data, the range of the cell
length along the rise direction is 2.6~3.4 mm and the mean value are close to 3.0 mm in
each relative density foam. As a result, 3.0 mm was selected as the rise direction
dimension of the unit cell length. The 6 mm, 9 mm, 12 mm and 15 mm thickness foam
are equivalent to 2 cells, 3 cells, 4 cells and 5 cells in the thickness direction respectively.
Figure 45 Cluster of Kelvin cells and the repeated ligament frame [38].
The ligaments are assumed to be uniform and share the same cross-section profile.
To simplifying the ligament geometry for the three different density foams, a uniform
triangular shape, as shown in Figure 46, was given as the ligament cross-section profile
in Kelvin cell model. The relative density of model is equal to the volume ratio of the
characteristic cell to the unit cell, and can be expressed by the edge length of the profile,
a, and the ligament length, l, as:

67
ρ∗
ρ
V
V∑ A l
h h (4.1)
where A is the area of the cross-section area and the value is known as √3 4⁄ ∙ . The
edge length of the ligament profile was decided from the average value of the relative
density in each foam. The correspond profile edge length via various anisotropy ratio is
listed in Table 8.
Figure 46 Triangular shape of the ligament cross-section profile.
Table 8 Edge length of the triangular shape via various anisotropy ratios for different foam density.
Relative density λ=1.0 λ=1.1 λ=1.2 λ=1.3
4.85% 0.346 0.324 0.305 0.288
7.69% 0.434 0.407 0.383 0.362
11.14% 0.522 0.49 0.461 0.436
Edge length of the triangular shape ( mm )

68
4.2 Modeling of open-cell foam supported sheet metal
In the model of open-cell foam supported sheet panel, the sheet was constructed by
cubic elements and the open-cell foam was built by anisotropy Kelvin cell foam model
using beam elements. It is assumed that there is no separation between the open-cell
foam and the sheet metal, hence two type elements were bonded by a tie constraint at the
interface. From the observation of the experimental samples, the width change of
metallic foam supported sheet panel in the indentation sample was insignificant after the
bending. As a result, the bending of open-cell foam supported sheet metal was simplified
as a plane-strain problem in the numerical analysis. Hence, a single layer of Kelvin cell
foam model was implemented to simulate the foam behavior. The width of sheet metal
has followed the width of the Kelvin cell. To achieve plane-strain condition, a proper
periodical boundary constraint was applied at the correspondent nodes at the beam and
cubic elements. Due to the symmetrical bending geometry, the model was further
reduced into a half model with the symmetry boundary condition at the symmetry plane
to increase the computational efficiency. Here the ligament arrangement of the unit
Kelvin cell is modified to present the full Kelvin cell geometry at the side view. Figure
47 shows the finite element model, and Figure 48 shows the setup of the press brake
bending simulation. The detail geometry parameters of the model are listed in Table 9.

69
Figure 47 Hybrid model with Kelvin cell beam model, (a) Front view, (b) Side view.
Figure 48 Model setup for the press brake bending analysis.
Table 9 Geometry parameters of the hybrid model.
Geometry dimensions Value
Sheet metal thickness 0.8 mm
Foam thickness 6, 9, 12, 15 mm
Rise direction cell length 3mm
Rise driection cell numbers 2, 3, 4, 5
Anisotropy ratio 1 ‐ 1.3
Punch radius (R1) 5 ‐ 30 mm
Support Column radius (R2) 10 mm
Support column distance (L) 50 ‐ 90 mm

70
4.2.1 Discretization
Each ligament of Kelvin cell was discretized and modeled by 6 quadratic beam
elements, B32, in nonlinear finite element code ABAQUS. B32 is a shear deformable
element, which includes the strain energy due to to the transverse shear in the governing
equation. The mesh sensitivity of the beam element numbers was performed by 4, 6 and
8 elements in the test parameters which will induce the ligament shear in the experiment.
The behavior of the ligament can be efficiently and correctly performed by 6 beam
elements. The ligaments were assign specified orientations to show the nonhomogeneous
geometry in the Kelvin cell model. The specified orientation led the Kelvin cell model
has a close shape with the actual foam microstructure. The sheet was discretized by
C3D8R brick elements, and the sheet thickness direction was assigned 5 elements to
accurately model the sheet bending behavior.
4.2.2 Periodical boundary condition
In order to achieve the plane-strain assumption in the hybrid model, a periodic
boundary condition was applied on the opposite bounding face of characteristic Kelvin
cell and sheet metal. The periodic boundary condition prescribed a relationship in the
displacement and rotation degree of freedom at the corresponding nodes. The prescribed
degree of freedom relationship in each mating node set is described as following:
1, 2, 3 (4.2)
0 1, 2, 3 (4.3)

71
where i is the i-th degree of freedom; j is the node number in the mating node set;
and are the i-th displacement and rotation degree of freedom in the mating nodes
set; is the i-th displacement degree of freedom in the reference nodes set. Here, the
original locations of the mating nodes set were selected as the reference nodes set.
Because of the plane-strain condition, there is only a non-zero value in the width
direction for the relative distance of the mating nodes set. Combined with anisotropy
ratio, the value of the displacement periodic boundary condition is 2√2 in the width
direction, and the value in the thickness and length directions are both zero.
4.2.3 Material properties
In the simulation, materials properties of Al 5052-H32 and Al 6101-T6 were
assigned in the cubic element and beam element respectively. The behavior of Al 5052-
H32 and Al 6101-T6 were modeled as elastic-plastic materials. For Al 5052-H32
material, ten test samples were cut from the sheet metal used in the experiment and
material properties was obtained from the uniaxial tensile test. Here, the Ramberg-
Osgood equation was applied to express the nonlinear stress-strain relationship in the
test data. The equation of Ramberg-Osgood stress-strain ( - ) relationship is given by:
(4.4)
where are elastic modulus and yield stress; , are the fit parameters. For Al
6061-T6 material, the Ramberg-Osgood parameters of the Al 6101-T6 base material in

72
Jang's research of crushable aluminum open-cell foam [30]. Table 10 listed the material
property parameters of Al 5052-H32 and Al 6101-T6 in the numerical analysis.
Table 10 Material properties of Al 5052-H32 and Al 6061-T6.
Material Young's Modulus (E) Yielding Strength ( ) n
Al 6101-T6 69 GPa 195 MPa 48 0.707
Al 5052-H32 67.74 GPa 163 MPa 11 0.831
4.2.4 Ligament contact
The previous research and experiments conducted in the present work have shown
the initially localized buckling ligaments will lead the later collapse of cells in the
compress test. From the experiment observation, the local cell buckling behavior would
stop when the buckled ligaments contact one another. Then the collapse behavior is
transmitted to the adjacent cells. As a result, to correctly arrest the ligament contact
behavior is essential to perform a correct crush behavior in the Kelvin cell model. Gong
has introduced a nonlinear spring in the Kelvin cell structure to model the ligament
contact behavior at the corner nodes in the compressed direction [34]. Here, the same
approach to add a nonlinear spring in the corner nodes in the transverse direction is
adopted. The configuration of the spring is shown in Figure 49. The nonlinear spring is
modeled by the spring element, SPRINGA, in ABAQUS. The spring force depends on
the distance between the two connected nodes. Corresponding to the real force response

73
in the buckling element, the spring was activated only when the compress distant, ,
excess the threshold value. The nonlinear spring force is given by,
01 1 1 2 1 2 2
, 1 , 1 2, 2
(4.5)
where 1 is the threshold distance to activate the spring; 2 is the final contact distance;
1 and 2 are the spring constants. The spring force to compress distance curve in the
nonlinear spring is shown in Figure 50.
Figure 49 Configuration of the nonlinear spring in Kelvin cell model. Adapted from reference [38] with permission.

74
Figure 50 Force response of nonlinear spring element.
4.2.5 Strain calculation
In order to trace the strain of the Kelvin cell, the displacements at 4 nodes in the
Kelvin cell were used to calculate the hoop strain and the shear strain. The hoop strain is
obtained from the length change between the node 1 and node 2. The shear strain is
calculated by the angle change of the two connected lines. Figure 51 shows the select
nodes for calculating the hoop strain and shear strain.
Figure 51 Specified nodes for the strain calculation in Kelvin cell.

75
4.3 Finite element simulation and results
The simulation of the press brake bending was analyzed by the nonlinear FEA code
ABAQUS. Two sets of simulation were carried on for the specific purposes. The first
simulation was designed to investigate the effect of the anisotropy ratio of Kelvin unit
cell in the bending process. The simulation was conducted in ABAQUS Standard
analysis. The span length was set at 60 mm and 80 mm, and the punch displacement was
assigned 2.5 mm. The value of the aspect ratio of Kelvin cell was chosen as 1.0, 1.1, 1.2
and 1.3. During the simulation, the initial bending stiffness of the panel was calculated
and compared with the experimental result. The anisotropy ratio which led to the best
matched initial bending stiffness in the force-deflection curve for each relative density
foam is selected for the second simulation to further investigate the large deformation
response.
The second simulation was designed to investigate the strain history of Kelvin cell
during the bending process, and the punch moves down until the panel bent to 90-degree
in the simulation. During the bending process, the ligaments are expected to be under
large deformation and may have lots of contacts. Hence the second simulation was
conducted as the quasi-static problem in ABAQUS Explicit. Here, the time-scaling
technique is applied to reduce the simulation time period to 10 seconds. The coefficients
of the nonlinear spring were calibrated from the comparison of the simulation result and
the experimental data at the 20 mm and 10 mm punch radius for a 9 mm thickness foam.
After the calibration of the spring constants, the hybrid model was tested around the

76
geometric failure line for each foam thickness. The strain of the top layer cells was
monitored and examined.
4.3.1 Bending response for various anisotropy ratio
At the very beginning of the bending process for a successful bending case, the
ligament and sheet metal are still in the elastic behavior, and a linear force to the
deflection response is expected. In order to accommodate the different sheet width for
different anisotropy ratio in the hybrid model, the punch force response was divided by
the width of the unit cell to achieve a normalized comparison value in the future
discussion. The normalized punch force to the sheet deflection response for various
anisotropy ratio for each density is shown in Figure 52. The past research has shown the
increasing anisotropy ratio of Kelvin cell will reduce the elastic modulus in the
transverse direction, which is the major material property to evaluate the bending
stiffness. As a result, the increased value in the punch force and the initial bending
stiffness can be observed at the large anisotropy ratio. The simulated normalized punch
to sheet deflection curve at the initial bending for 4.85 %, 7.69 % and 11.14 % Duocel
open-cell foam are matched with the experiment curve in the anisotropy ratio of 1.3, 1.1,
and 1.3 respectively.
4.3.2 Spring constant calibration
The observation in the research of aluminum foam compress response has indicated
the force response will become increasingly stiffer when the average strain reaches
about 45 %, and the cells will collapse when the average strain reaches about 55 %[30].

77
In the uniaxial compress test, d is the most significant parameter which is the gap to
activate the stiffer spring coefficient, k2. Gong and Kyriakides have suggested the value
of 0.792 would provide the best match with the experimental data [34].
The coefficients of the nonlinear spring were calibrated in the full simulation at 20
mm punch radius, 9 mm thickness foam, and 80 mm span length for each relative
density. The normalized force to the deflection curve in the simulation was compared
with the experimental data. Due to the dynamic response in ABAQUS explicit, the
simulation curve fluctuated and the local regression method was implemented to smooth
the data. Here, the calibrated spring coefficients are transferred to related the unit length
d φ
h2
(4.6)
d φ
h2
(4.7)
where φ and φ are the compress ratio of the unit Kelvin cell. The calibrated
coefficients for each relative density foam are listed in Table 11. For the bending
problem, the initial contact ratio, d , has the major effect on the curve. A larger value of
d will lead a larger force prediction when the nonlinear spring is activated. As shown in
Figure 53, the hybrid model with the nonlinear spring can be calibrated to achieve a
good agreement with the experimental result.

78
Figure 52 Normalized punch force to sheet deflection response via anisotropy ratio.

79
Table 11 Calibrated nonlinear spring coefficients.
Relative Density h 2⁄ (mm)
φ φ K
(N/mm) K
(N/mm)
4.85% 1.154 0.2 0.55 15 50
7.69% 1.364 0.2 0.55 20 100
11.14% 1.154 0.2 0.55 40 200
Figure 53 Prediction in punch force to sheet deflection curve of 7.69 % aluminum open-cell foam, (a) Uniform thickness case, (b) Indentation case.
(a)
(b)

80
4.3.3 Deformation response of Kelvin cell beam model
The bending deformation of Kelvin cell was observed in multiple simulations, and
the deformation can be described into three stages: (1) Initial bending, (2) Spring
activate, (3) Ligament buckling. For the simulation of bending without indentation
failure, the deformation of Kelvin cell only experienced the first two stages. For the
simulation resulted in the indentation failure, the deformation of Kelvin cells went
through all three stages. The deformation plot for each stage is shown in Figure 54 and
the detail of each stage is described below:
Initial bending
At the initial bending stage, the major deformation of Kelvin cell is the hoop
compression of the diamond window in the vertical plane, as shown in Figure 54.(a).
The initial and also the most significant deformation happened at the second cell in the
top layer cells. In the linear region of the punch force to sheet deflection curve, the
deformation of the Kelvin is .not obvious. A significant change in the deformation was
observed after the punch force left the linear region.
Spring activate
After the first stage ended, the nonlinear spring is activated to model the resistant of
the ligament contact and entered the second stage, as shown in Figure 54.(b). In the
second stage, the activated spring will trigger a significant deformation on the nearby
cells. As a result, Kelvin cells are observed consequent hoop compression propagation
from the mid-span to the end of the panel when the punch displacement is increased.

81
Ligament buckling
During the second stage, the ligament buckling in the horizontal window at the top
layer cells may happen at the top layer cells, as shown in Figure 54.(c). Once the
horizontal window experiences the buckling deformation, the next Kelvin cell will
undergo a significantly shear deformation and cause the following cells collapse. The
location of the buckling window depends on the punch radius, the foam thickness, and
the support span length. For the indentation simulation in a smaller punch radius, the
location of the buckling ligament window is close to the mid-span.
To illustrate the deformation of Kelvin cell, two simulation results in successful
bending and indentation failure for 9 mm thickness 7.69 % open-cell foam are discussed
below. The strain of the five cells at the top layer cells are monitored and recorded. The
strain calculation nodes and the location of the cells are shown in Figure 55.
For the simulation result in successful bending, the punch radius is 20 mm, and the
span length is 80 mm. Figure 56 to Figure 58 illustrated the deformation plot, the hoop
strain history and the shear strain history plots for the monitored cells. As shown in the
deformation plot, the normal and shear strain is growing with the increased sheet
deflection, then keep a stable value during the bending process. Compared with the other
cells, the strain in cell 1 and cell 2 have a small value, which is supported by the
experiments observation that the deformation of cell 1 and cell 2 are not obvious. The
other cells were experienced in a consistent hoop strain and shear strain. The stabilized
hoop strain is 0.3, and the stabilized shear strain is 0.07. Due to the insignificant
deformation in cell 1 and cell 2, the other cells have to compensate the deformation and

82
result to a small shear strain value and the slight rotation in the vertical window. But the
small shear strain didn't change the cell geometry, and the edge of the cell is still pointed
to the radius center of the punch, as shown in Figure 56.
Figure 54 Deformation response of Kelvin cell beam model.
(a) Initial bending
(b) Spring activate
(c) Ligament buckling

83
For the simulation result in indentation failure, the punch radius is 10 mm, and the
span length is 60 mm. Figure 59 to Figure 61 illustrated the deformation plot, the hoop
strain history and the shear strain history for the monitored cells. The cells in the
indentation simulation go through a large deformation compared to the successful
bending simulation. In the deformation plot, as shown in Figure 59, it can be indicated
that the cell 5 experienced a severe distortion. From the strain plots, the cells stable hoop
strain is near 0.37, and the stable shear strain is above 0.12. The hoop strain and shear
strain of the distorted cell 5 keep growing up with the increased sheet deflection.
Figure 55 The location of the nodes and the monitored cells for 9 mm thickness 7.69% foam simulation.

84
Figure 56 Deformation plot of a uniform thickness bending for 9 mm thickness 7.69% open-cell foam at 20 mm punch radius and 80 mm span length.
Figure 57 Hoop strain history plot of a uniform thickness bending for 9 mm thickness 7.69% open-cell foam at 20 mm punch radius and 80 mm span length.

85
Figure 58 Shear strain history plot of a uniform thickness bending for 9 mm thickness 7.69% open-cell foam at 20 mm punch radius and 80 mm span length.
Figure 59 Deformation plot of an indentation failure bending simulation for 9 mm thickness 7.69% open-cell foam at 10 mm punch radius and 60 mm span length.
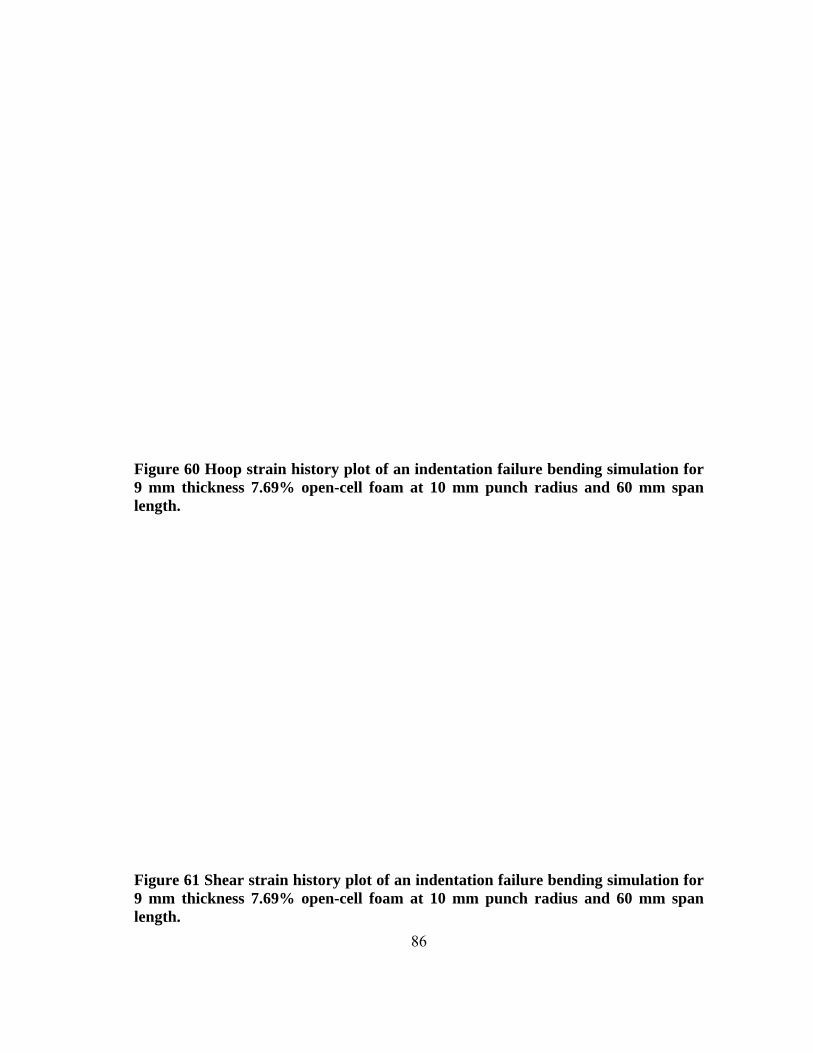
86
Figure 60 Hoop strain history plot of an indentation failure bending simulation for 9 mm thickness 7.69% open-cell foam at 10 mm punch radius and 60 mm span length.
Figure 61 Shear strain history plot of an indentation failure bending simulation for 9 mm thickness 7.69% open-cell foam at 10 mm punch radius and 60 mm span length.
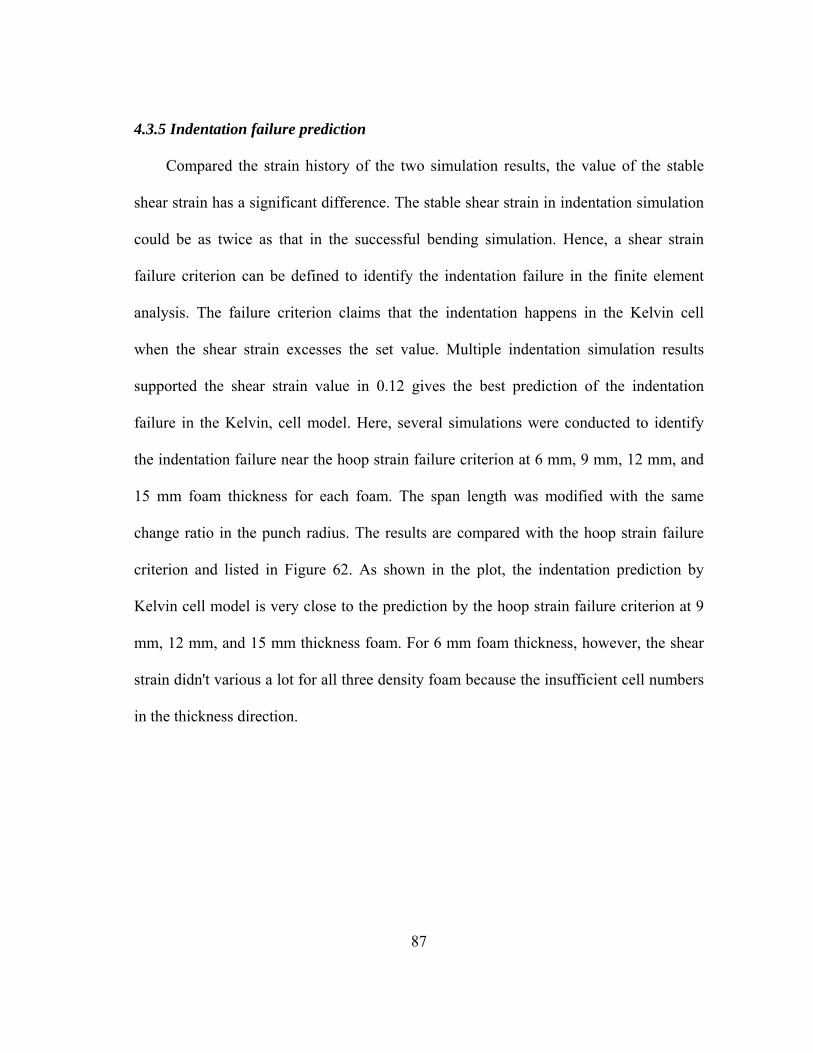
87
4.3.5 Indentation failure prediction
Compared the strain history of the two simulation results, the value of the stable
shear strain has a significant difference. The stable shear strain in indentation simulation
could be as twice as that in the successful bending simulation. Hence, a shear strain
failure criterion can be defined to identify the indentation failure in the finite element
analysis. The failure criterion claims that the indentation happens in the Kelvin cell
when the shear strain excesses the set value. Multiple indentation simulation results
supported the shear strain value in 0.12 gives the best prediction of the indentation
failure in the Kelvin, cell model. Here, several simulations were conducted to identify
the indentation failure near the hoop strain failure criterion at 6 mm, 9 mm, 12 mm, and
15 mm foam thickness for each foam. The span length was modified with the same
change ratio in the punch radius. The results are compared with the hoop strain failure
criterion and listed in Figure 62. As shown in the plot, the indentation prediction by
Kelvin cell model is very close to the prediction by the hoop strain failure criterion at 9
mm, 12 mm, and 15 mm thickness foam. For 6 mm foam thickness, however, the shear
strain didn't various a lot for all three density foam because the insufficient cell numbers
in the thickness direction.

88
Figure 62 Failure prediction by 0.12 shear strain in the hybrid finite element model via different relative density.

89
4.4 Summary and conclusions
In this chapter, a hybrid finite element model with anisotropy Kelvin cell was
constructed to analyze the response of open-cell foam supported sheet metal in the press
brake bending process. The most significant findings are concluding as below:
With the calibration in the anisotropy ratio of Kelvin cell and the nonlinear
spring coefficients, the model has a good prediction in the punch force to
sheet deflection curve within the acceptable engineering tolerance range. The
model deformation also shows the similar shear failure at the top layer cells
with the foam thickness and test parameters at the indentation failure
experiment.
The primary failure mechanism of Kelvin cell in the press brake bending is
the ligament buckling in the horizontal window at the top layer cells. The
buckling ligament will cause the next cell undergo a significant shear
deformation and lead the following cell collapse.
The history strain observation in both indentation and successful bending
simulation shows the normal and shear strain will reach a stabilized value
during the bending process. The indentation simulation will give a higher
stabilized shear strain value and show a sudden increase value when the cell
collapse. With setting a limit shear strain value at 0.12, the indentation
prediction in Kelvin cell model gives a good agreement with the hoop strain
failure criterion.

90
CHAPTER V
HYDROFORMING PROCESS1
In this chapter, the feasibility of using sheet hydroforming technique to deform
two-layered and sandwich panels is demonstrated by experiments and numerical
simulation. The process is similar to the bulge forming test [84] that is used to test the
biaxial formability of sheet metals. In the experiment, the porous open-cell metallic
foam was attached to the sheet metal to form a two-layered panel. As needed, an
additional bottom face sheet can be attached to the other side of the metallic foam to
make a sandwich panel. With different specimens and deformation conditions in the
experiment, various failure modes were observed. The experimental failure modes can
also be explained from the results of the finite element simulation, and a better
understanding of the failure mechanism of two-layered panels in the hydroforming
experiment is achieved.1
5.1 Hydroforming experiment
Figure 63 depicted the process of a sandwich panel hydroforming experiment in
the axial symmetric diagram. During the hydroforming process, the upper face sheet was
first clamped, and the hydraulic fluid can fill the sealed chamber and directly apply
pressure over the upper face sheet to deform. Then the upper face sheet was pushed into
a bulge deformation with continuously increased pressure, and the core material and the
1 Part of this chapter is reprinted with permission from "Failure Analysis of Hydroforming of
Sandwich Panels," by Wang, J., and Yang, C.-K. Journal of Manufacturing Processes 15, 256-262. Copyright © 2013 The Society of Manufacturing Engineers
11

91
bottom face sheet was also be bulged into the upper die cavity due to the adhesive
bonding of the upper face sheet.
Figure 63 Axial-symmetric schematic diagram of hydroforming experiment process.
5.1.1 Specimen preparation
To produce shaped panels, two-layered and sandwich blanks with metallic open-
cell foam core are used in this hydroforming experiment. Aluminum 5052-H32 sheet
metal was selected as face sheets and the Duocel aluminum 6101-T6 open-cell foam in
8% relative density was selected as the core materials. Both sheet metal and metallic
foam were cut into circular disks by the electrical discharge machining (EDM) processed.
The upper face sheet was cut into a larger diameter to fit the die shoulder in apparatus.
Metallic open-cell foam core and lower face sheet were cut into a smaller diameter to fit
the die cavity. After the face sheet and foam core were cut by the EDM, the face sheet,
and the foam disk was attached together by flushed by a thin layer of adhesive. Since
two-layered and sandwich panels are subjected to a stretch forming, the flexibility
adhesive was selected. Similarly to the procedure to produce the two-layered blanks, the

92
sandwich attached another face sheet on the other side of the foam disk. This additional
face sheet has the same diameter with the foam disk.
5.1.2 Experiment apparatus and setup
There were two apparatuses to test the hydroforming experiment. The first
apparatus is the hydraulic press in Michigan State University (MSU), and the other
apparatus is the hydroforming bulge machine in Texas A&M University, which was
built later. The apparatus in MSU is a close die press, which concealed the deflection of
the panel, and it was not able to provide the pressure history during the experiment. In
order to get an advanced test data in the future research, a hydroforming bulge machine
was designed and manufactured based on Dr. Koc's prototype of warm hydraulic bulge
system [86]. Figure 64 shows the schematic diagram of the hydraulic bulge machine.
The capacity of the hydraulic bulge machine allows the hydroforming experiment
reaches a maximum pressure at 35 MPa and a maximum dome height at 10 mm. During
the test, the hydraulic pressure, the dome height and the pneumatic pressure will be
recorded and saved from the data acquisition device.
The experiment setup in both two apparatuses uses the same steps to deform the
panel. The steps are described as following, (1) fill the lower chamber with hydraulic oil;
(2) place the specimen in the center of the die and close the die set, (3) pump the
hydraulic oil to deform the panel. During the experiment, the hydraulic pressure was
slowly increased, and the bulge forming process was stopped at a preset pressure or
when a sharp pressure drop was detected. The specimen was then inspected for any
failure.

93
Figure 64 Schematic diagram of hydroforming bulge machine.
5.1.3 Experimental results
From the experiments in MSU, the bulge deformation of sandwich panels is very
limited. The two-layered panels, on the other hand, can be deformed into a deeper dome
shape. Since the fluid can flow into the porous open-cell foam, no foam damage
(collapsing of foam core) was observed in foam disk. The major failures in forming the
two-layered and sandwich panels can be classified into three categories.
The first mode of failure is top face sheet fracture. It can be detected from a
sudden pressure drop. The fracture location can be at the radius of the clamping die or at
the area near the edge of the foam blank, as shown in Figure 65. As the top face sheet

94
was stretched over a hard corner (the die radius or the edge of the foam), the deformation
was localized and the fracture occurred.
The second failure mode was observed is the delamination between the face sheet
and foam blank in both two-layered and sandwich panels, and it occurred frequently in
sandwich panels. It was found that delamination can take place between the top face
sheet and the foam (Figure 66), or between the bottom face sheet and the foam. The
different failure modes could be due to the difference in bonding strength at the two
interfaces.
The third failure mode was the circumferential buckling of the bottom face sheet.
The failure can occur without complete delamination initially. As the sandwich panel
was further deformed, separation of the foam blank from one of the face sheets can be
observed. Figure 67 shows that along with the foam blank the buckled bottom face sheet
was separated from the top face sheet. It is believed that the buckling was due to the
induced hoop stress and the non-uniform adhesive strength at the interface between the
bottom face sheet and the foam blank.
In the experiment at Texas A&M University, a specimen with a mixed failure
mode was observed. As illustrated in Figure 68, this two-layered panel was tested until
the face sheet failure, hence, there is a vertical crack on the sheet metal. In particularly,
partial delamination and cracks along the foam were observed from the other side view
of the specimen. The delamination area happened at the center of the disk and certain
circumferential edge. Besides the biggest crack in the foam core, several cracks in the

95
radial direction near the disk edges were observed. The radial cracks proved that the
foam proved was subjected to a biaxial stretching deformation.
From the experiment results from both apparatuses, the adhesive debonding was
the most significant and earliest failure mode. To achieve a better hydroforming result,
the relationship between the adhesive strength and the deflection of the panel must be
analyzed. Therefore, a finite element simulation of hydroforming process was conducted
to obtain a better understanding of the failure mechanisms.
Figure 65 Fracture occurred at the top face sheet.
Figure 66 Delamination between the top face sheet and the foam blank.

96
Figure 67 The delamination in the sandwich panel.
Figure 68 The mixed failure mode in the two-layered panel.

97
5.2 Hydroforming finite element analysis
Hydroforming simulation of the two-layered panels was analyzed by using
ABAQUS to investigate the effects of material properties and adhesive bonding strength
on the failure modes. The simulation followed the same geometry and experiment setup
with the hydraulic press experiment.
5.2.1 Finite element analysis
Due to the geometry symmetry, an axisymmetric model was created to simulate
the hydroforming process of sandwich panels (as shown in Figure 69) and two-layered
panels. To save the computational cost, the open-cell foam was modeled by a solid
element with an equivalent material properties model. A bilinear hybrid element
CAX4H was utilized in the foam and face sheets, and a removable cohesive element,
COHAX4, based on the cohesive zone model, was applied in the adhesive layer. The
cohesive element can be removed to demonstrate the adhesive failure after the failure
criterion is satisfied. The pressure was distributed on the lower surface of the top face
sheet for both the two-layered and sandwich panels. To implement the stretching
forming on the top face sheet, a fixed boundary condition was added in the
circumferential edge of top face sheet to constraint the sheet deformation.

98
Figure 69 Finite element model of sandwich panels.
5.2.2 Material parameters
The material selection of face sheet and open-cell foam are aluminum 5052-H32
sheet metal and Duocel aluminum 6101-T6 open-cell foam respectively in this
simulation. The mechanical properties of aluminum 5052-H32 were considered isotropic
material and the elastic/perfect plastic material model was assumed to describe the
constitutive behavior in the plastic deformation. For aluminum 5052-H32, the Young’s
modulus, yielding strength, and the Poisson’s ratio are set at 70.3 GPa, 89.6 MPa, and
0.33 respectively.
The equivalent material models of open-cell foam material properties have been
widely studies [7, 8, 15, 24, 87, 88]. The density-dependent constitutive material model
developed by Gibson and Ashby [7] was adopted in this simulation. The density-
dependent Young’ modules ∗ and plastic collapse strength ∗ are given by

99
∗ ∗
(5.1)
∗ ∗
(5.2)
where , and are the Young’s modulus, density, and yield strength of the raw
material in foam, respectively, and ∗ is the density of the foam. and are geometry
related constants. From the experimental data [7], the values of the constants are
recommended that = 1 and = 0.3. The Poisson ratio of open-cell foam was
suggested as 0.3. The open-cell foam was also assumed to have an elastic-perfect plastic
behavior during the plastic deformation. In the finite element hydroforming simulations,
the aluminum 6101-T6 used as the raw material of metallic foam which has the
properties of = 68.9 GPa and = 193 MPa. In order to investigate the effect of
foam properties on the results of hydroforming process, the density of the open-cell
foam was set to value of 8 %, 16 %, 24 %.
5.2.3 Cohesive zone model
Cohesive zone models have been successfully used to analyze the interface
fracture of composite materials [89-91]. The technique of cohesive zone model was also
capable of describing the adhesive delamination behavior. As a result, the model was
applied in the adhesive layer in this hydroforming simulation. In the cohesive zone
model, the adhesion in the normal and shear direction was assumed independent. To
characterize the mixed mode adhesive fracture, an energy-based failure criterion is

100
introduced, and the cohesive element fracture will occur when the following failure
criterion is satisfied:
12
2
1
1 Cs
sCs
sCn
n
G
G
G
G
G
G(5.3)
where , and are the energy release rate in the normal, first shear and second
shear direction, and the , and were the energy toughness under each mode.
The energy release rate is given by
1
2
0
1 1 10
2 2 20
( )
( )
( )
n
s
s
n n n
s s s
s s s
G d
G d
G d
(5.4)
where and are displacement-related normal and shear stress, and , and are
the normal, first shear and second shear displacements [92].
The energy toughness is equal to the area under the stress–displacement curve in
the traction–separation law. As shown in Figure 70, the normal stress is proportional
to the displacement before the normal stress reached to a maximum value. Beyond the
maximum normal stress, the steep drop indicates the debonding of the adhesive. Hence,
the energy toughness can be approximated as:
tEG c
n ~2
1
2
1 2 (5.5)
where t is the thickness of the adhesive and is the modulus defined as ⁄ ⁄ . For
simplicity, the behavior of the adhesive in the first and the second shear directions was

101
assumed the same as that of the normal direction in the present study. To investigate
different potential failure modes, different adhesive strength values were assigned in the
model. In the finite element analysis, once the energy failure criterion, Equation (5.3), is
satisfied in a cohesive element, then the element is removed to depict the delamination.
Figure 70 The normal stress to displacement plot for the adhesive bond between the face sheet and the foam.
5.2.4 Simulation parameters
There were three major parameters, adhesive strength, foam relative density and
foam disk diameters, to be investigated in the hydroforming finite element simulation.
The adhesive strength varied from 0.5 MPa to 6 MPa by 0.5 MPa incremental amounts,
and the adhesive thickness and modulus were set at 0.3 mm and 150 MPa respectively.
By adjusting the relative density of the open-cell foam (8 %, 16 %, 24 %), three different
values of mechanical properties were simulated. Three different diameters of foam disks
(101.6 mm, 127 mm, 152.4 mm) were also selected to simulate the disk effect to the
delamination. The thickness of foam was selected at 8 mm. Besides these study

102
parameters, the remain geometry parameters of face sheets and open-cell foam were set
as constant values.
5.3 Finite elements results and discussion
The objective of the present finite element simulations is to investigate the causes
of various failure modes observed in the hydroforming experiments. It was found that
the simulation results are consistent with the experimental observations. The simulation
results can be used to guide the selection of the foam, and the adhesive for the
hydroforming processes.
5.3.1 Failure modes in sandwich panels
From finite element simulation, it was found that the deformation behavior of
sandwich panels was different from that of two-layered panels. The model in Figure 67
has 8% foam density and 1.5 MPa adhesive strength for both top and bottom interfaces.
The figure shows that the bottom face sheet provides high bending rigidity and thus the
deformation of the top face sheet took place mostly near the edge of the foam block. As
a result, the top face sheet fracture can easily occur. If the top face sheet has a high
strength to delay fracture, the delamination of the bottom face sheet can happen. To
compare with the model in Figure 71, a model with the increase top adhesive strength to
6 MPa was also simulated. In Figure 72, the delamination, due to insufficient adhesion
strength at the bottom interface, was initiated near the perimeter/edge of the foam and
sheet metal. The delamination can shift to the top interface only when the adhesion
strength at the bottom interface is much stronger than the adhesion strength at the top.

103
As shown earlier, the mechanical properties of the foam are determined by its
relative density. For low relative density (i.e. 8 %), the delamination was initiated at the
bottom interface. The upper interface can then delaminate at a later stage. A high relative
density leads to a high Young’s modulus, which in turn makes the foam difficult to bend.
As shown in the simulation, the bottom interface was not subject to significant stress,
and the delamination occurred at the top interface first.
5.3.2 Failure modes in two-layered panels
There were primarily three competing failure modes in hydroforming of two-
layered panels. Figure 73 shows that the delamination can be observed for panels with
low bonding strength at the sheet metal–foam interface. In this model, the panel has a
low adhesive strength (1.5 MPa) and foam relative density (8%). Figure 74 shows that,
with higher adhesive strength (6.0 MPa) and relative density (24%), the face sheet
fracture at the clamping die radius or at the edge of the foam block can occur before
delamination. With increasing strength or thickness of the face sheet, the fracture is
delayed, and the failure mode can shift to delamination failure.
The maximum attainable dome height of two-layered panel was typically greater
than that of the sandwich panels. This is because that the localized deformation of the
top face sheet is not as severe, and there is no debonding of the bottom face sheet to be
considered. Since no deformation limit is specified for the elastic-perfect plastic foam
model, no foam failure was predicted. The result is in agreement with the experiments
that, although the ligaments of the foam were plastically deformed, no significant
damage was noted.

104
Figure 71 Face sheet stress concentration near the edge of the foam in the sandwich panel.
Figure 72 Bottom adhesive delamination with a lower strength in the bottom adhesive.
Figure 73 Delamination in two-layered panels.

105
Figure 74 Face sheet stress concentration in two-layered panels.
5.3.3 Parametric study
The effect of the foam’s relative density on the attainable dome height in the bulge
test of two-layered panels was further investigated quantitatively. The maximum dome
height at the onset of delamination was plotted against the adhesive strength for the foam
blank with 8%, 16% and 24% relative density. Figure 75 shows the plots in three sizes of
foam diameters, 101.6 mm, 127.0 mm, and 152.4 mm. The filled mark presented the
final dome height without delamination at 2 MPa maximum hydraulic pressure.
It can be seen that the gain in the dome height due to the improved adhesion
strength was initially significant (large slope) for panels with low relative density foam.
Also, note that panels with high relative density foam required a stronger adhesive
strength to carry the foam during the hydroforming process to achieve a specified dome
height (e.g. a horizontal line at 10 mm). It can also be observed that for a given adhesive
strength (e.g. a vertical line at 3 MPa), a panel with a higher relative density foam (24
%) had a lower dome height compared to a panel with a lower relative density foam (8

106
%). To reach a certain dome height, the difference of the required adhesive strength
between each foam density was decreased with increased foam diameter as observed
from Figure 76 (a) through (c).
Figure 75 Maximum attainable dome height vs. adhesive strength for foam with 8 mm thickness and different diameters (D) for bi-layered panels: (a) D = 101.6mm (b) D = 127mm, (c) D = 152.4mm.
For low relative density foam (8 %), the effect of foam diameter is further
illustrated in Figure 71. Without curve fitting, the data show that the dome height can
reach a plateau despite an increase in adhesive strength. This could be due to continued

107
stress build up without bulge deformation prior to delamination. For the panel with
smaller foam blank, the plateau was reached at a lower dome height compared to the
panel with larger foam blank (16 mm for D = 101.6mm and 21mm for D = 152.4 mm).
Figure 76 The maximum attainable dome height vs. adhesive strength for blanks different foam diameter for bi-layered panels.

108
5.4 Conclusion
Forming sandwich panels with conventional stamping die has been proven
difficult as the foam core can be easily damaged during the deformation process. In this
chapter, experimental work, and numerical simulation are presented to demonstrate the
feasibility of using sheet hydroforming technique to form two-layered panels and
sandwich panels. With metallic open-cell foam core, the hydraulic fluid can flood the
pore without collapsing the foam. The approach, however, can lead to other failure
modes such as face sheet fracture and delamination. Through finite element simulation
of the conducted bulge test, the followings can be concluded:
The qualitative results of finite element simulation are in agreement with
experimental observation. The failure modes depend on the properties of the
face sheet, the foam, and the adhesive.
Compared to forming two-layered panels, forming sandwich panel is a more
difficult task as the delamination of the bottom face sheet can easily occur.
A low relative density of the foam can reduce the stiffness of the foam core
and improve the maximum dome height in the bulge test.
Finite element simulation of the hydroforming processes can facilitate the
identification of failure modes and can be used to determine the appropriate
constituents (face sheet, foam, and adhesive) of sandwich panels.
Additional FEA simulations can be conducted to investigate the failures of
sandwich panels. Other materials and tooling parameters such as the face

109
sheet thicknesses and properties and clamping die radius can be included in
the future study.

110
CHAPTER VI
CONCLUSIONS AND SUGGESTIONS FOR FUTURE WORK
In this research, the press brake bending and the hydroforming processes were
implemented to forming metallic open-cell foam supported sheet metals. Experiments
and finite element analysis were carried to find the failure mechanism and connected to
the material properties and test parameters in both processes.
For the press brake bending process, the experiment results have shown the
supported sheet metal can be successfully bent into a large deformation within small
thickness reduction. The most significant findings are listed below:
Before the indentation failure occurs, the cells at the top layer go through a
shear collapse deformation and form a shear band. The shear collapse is
considered as the result of the excessive hoop strain in the specimen.
A geometric hoop strain failure criterion was proposed to predict the
indentation failure by the foam thickness, sheet thickness and punch radius.
From the criterion, the higher density foam can go through a large hoop strain
without indentation.
A hybrid model with anisotropy Kelvin cells was conducted in the bending
simulation to monitor the history strain during deformation. The idealized
structure shows the buckling in the horizontal window at the top layer cell is
the initial failure mechanism of the shear collapse.

111
Hybrid model with 0.12 shear strain failure criterion shows a good agreement
with the hoop strain failure criterion in the prediction of indentation failure.
For the hydroforming process, the test sample experienced an adhesion issue, and
the open-cell foam was separated from the sheet metal at the early stage. Finite element
analysis was conducted to investigate the failure mechanism, and the main discovery is
listed as following:
The primary failure mechanism is the insufficient adhesive shear strength. At
the early stage, the adhesive near the perimeter of the foam disc undergo an
obvious shear deformation and is the first fail location. Increasing the
adhesive strength will delay the adhesive fail and attain a larger dome height.
The dome height is affected by the attached foam properties. Lower density
foam will reach a higher dome height. A higher density led a stress
concentration at the sheet metal in the location of the clamping edge and the
perimeter of the foam disc.
Based on the research result, there are several suggestions for the future work in
both deformation processes. For press brake bending process, a further mechanical test
on the deformed specimen is required. The current indentation criterion would be over
restricted, and the failure sample for 3% thickness reduction may have an acceptable
mechanical response. Through the understanding of the mechanical response, the
indentation failure criterion can be reevaluated. Besides, the bulking behavior of the
horizontal window in the Kelvin cell can be analyzed and establish a mechanism to
connect the failure with the foam properties. For the hydroforming process, a better

112
adhesion technique needs to apply to make the open-cell foam firmly bonded with the
sheet metal and continue to test the deformed behavior of the two-layered panel.

113
REFERENCES
[1] K.F. Karlsson, B. TomasÅström, Manufacturing and applications of structural sandwich components, Composites Part A: Applied Science and Manufacturing, 28 (1997) 97-111.
[2] D.M. Elzey, H.N.G. Wadley, Open-die forging of structurally porous sandwich panels, Metallurgical and Materials Transactions A, 30 (1999) 2689-2699.
[3] D. Mohr, On the role of shear strength in sandwich sheet forming, International Journal of Solids and Structures, 42 (2005) 1491-1512.
[4] K. Jackson, J. Allwood, The mechanics of incremental sheet forming, Journal of Materials Processing Technology, 209 (2009) 1158-1174.
[5] J. Banhart, Manufacture, characterisation and application of cellular metals and metal foams, Progress in Materials Science, 46 (2001) 559-632.
[6] E.A. Corp., The Basics of Duocel® Foam, (2011).
[7] L.J. Gibson, M.F. Ashby, Cellular solids : structure and properties, 2nd ed., Cambridge University Press, Cambridge ; New York, 1997.
[8] M.F. Ashby, Society of Automotive Engineers., Metal foams : a design guide, Butterworth-Heinemann, Woburn, MA, 2000.
[9] C. Chen, N.A. Fleck, Size effects in the constrained deformation of metallic foams, Journal of the Mechanics and Physics of Solids, 50 (2002) 955-977.
[10] N.A. Fleck, O.B. Olurin, C. Chen, M.F. Ashby, The effect of hole size upon the strength of metallic and polymeric foams, Journal of the Mechanics and Physics of Solids, 49 (2001) 2015-2030.
[11] P.R. Onck, E.W. Andrews, L.J. Gibson, Size effects in ductile cellular solids. Part I : modeling, International Journal of Mechanical Sciences, 43 (2001) 681-699.
[12] E.W. Andrews, G. Gioux, P. Onck, L.J. Gibson, Size effects in ductile cellular solids. Part II: experimental results, International Journal of Mechanical Sciences, 43 (2001) 701-713.
[13] A.M. Kraynik, W.E. Warren, The elastic behavior of low-density cellular plastics, in: Low density cellular plastics: Physical basis of behaviour, Springer Netherlands, (1994) 187-225.

114
[14] C. Betts, Benefits of metal foams and developments in modelling techniques to assess their materials behaviour: a review, Materials Science and Technology, 28 (2012) 129-143.
[15] H.X. Zhu, J.R. Hobdell, A.H. Windle, Effects of cell irregularity on the elastic properties of open-cell foams, Acta Materialia, 48 (2000) 4893-4900.
[16] A.N. Gent, A.G. Thomas, The deformation of foamed elastic materials, Journal of Applied Polymer Science, 1 (1959) 107-113.
[17] J.M. Lederman, The prediction of the tensile properties of flexible foams, Journal of Applied Polymer Science, 15 (1971) 693-703.
[18] P.S. Liu, Mechanical relations for porous metal foams under several typical loads of shearing, torsion and bending, Materials Science and Engineering: A, 527 (2010) 7961-7966.
[19] J. Zhou, W.O. Soboyejo, Mechanics Modeling of the Compressive Stiffness and Strength of Open-Celled Aluminum Foams, Materials and Manufacturing Processes, 19 (2004) 863-882.
[20] W.E. Warren, A.M. Kraynik, The Linear Elastic Properties of Open-Cell Foams, Journal of Applied Mechanics, 55 (1988) 341-346.
[21] W.E. Warren, A.M. Kraynik, The Nonlinear Elastic Behavior of Open-Cell Foams, Journal of Applied Mechanics, 58 (1991) 376.
[22] W.E. Warren, A.M. Kraynik, Linear Elastic Behavior of a Low-Density Kelvin Foam With Open Cells, Journal of Applied Mechanics, 64 (1997) 787-794.
[23] B. Budiansky, E. Kimmel, Elastic Moduli of Lungs, Journal of Applied Mechanics, 54 (1987) 351-358.
[24] L.J. Gibson, Mechanical Behavior of Metallic Foams, Annual Review of Materials Science, 30 (2000) 191-227.
[25] C.H. Rycroft, Voronoi volumes and local density - Introduction, Harvard University, (2014).
[26] A.G. Dement'ev, O.G. Tarakanov, Effect of cellular structure on the mechanical properties of plastic foams, Polymer Mechanics, 6 (1970) 519-525.
[27] H.X. Zhu, N.J. Mills, J.F. Knott, Analysis of the high strain compression of open-cell foams, Journal of the Mechanics and Physics of Solids, 45 (1997) 1875-1904.

115
[28] H.X. Zhu, J.F. Knott, N.J. Mills, Analysis of the elastic properties of open-cell foams with tetrakaidecahedral cells, Journal of the Mechanics and Physics of Solids, 45 (1997) 319-343.
[29] L. Gong, S. Kyriakides, W.Y. Jang, Compressive response of open-cell foams. Part I: Morphology and elastic properties, International Journal of Solids and Structures, 42 (2005) 1355-1379.
[30] W.-Y. Jang, S. Kyriakides, On the crushing of aluminum open-cell foams: Part II analysis, International Journal of Solids and Structures, 46 (2009) 635-650.
[31] H.X. Zhu, A.H. Windle, Effects of cell irregularity on the high strain compression of open-cell foams, Acta Materialia, 50 (2002) 1041-1052.
[32] C. Tekog˜lu, L.J. Gibson, T. Pardoen, P.R. Onck, Size effects in foams: Experiments and modeling, Progress in Materials Science, 56 (2011) 109-138.
[33] L. Li, P. Xue, Y. Chen, H.S.U. Butt, Insight into cell size effects on quasi-static and dynamic compressive properties of 3D foams, Materials Science and Engineering: A, 636 (2015) 60-69.
[34] L. Gong, S. Kyriakides, Compressive response of open cell foams Part II: Initiation and evolution of crushing, International Journal of Solids and Structures, 42 (2005) 1381-1399.
[35] L. Gong, S. Kyriakides, N. Triantafyllidis, On the stability of Kelvin cell foams under compressive loads, Journal of the Mechanics and Physics of Solids, 53 (2005) 771-794.
[36] W.-Y. Jang, A.M. Kraynik, S. Kyriakides, On the microstructure of open-cell foams and its effect on elastic properties, International Journal of Solids and Structures, 45 (2008) 1845-1875.
[37] W.-Y. Jang, S. Kyriakides, On the crushing of aluminum open-cell foams: Part I. Experiments, International Journal of Solids and Structures, 46 (2009) 617-634.
[38] W.-Y. Jang, S. Kyriakides, A.M. Kraynik, On the compressive strength of open-cell metal foams with Kelvin and random cell structures, International Journal of Solids and Structures, 47 (2010) 2872-2883.
[39] S. Gaitanaros, S. Kyriakides, A.M. Kraynik, On the crushing response of random open-cell foams, International Journal of Solids and Structures, 49 (2012) 2733-2743.

116
[40] A.T. Barnes, K. Ravi-Chandar, S. Kyriakides, S. Gaitanaros, Dynamic crushing of aluminum foams: Part I – Experiments, International Journal of Solids and Structures, 51 (2014) 1631-1645.
[41] S. Gaitanaros, S. Kyriakides, Dynamic crushing of aluminum foams: Part II – Analysis, International Journal of Solids and Structures, 51 (2014) 1646-1661.
[42] D. Okumura, Y. Takahashi, N. Ohno, Influence of closed faces on compressive strength of open cell metallic foams, Materials Research Innovations, 15 (2013) s61-s64.
[43] D. Okumura, T. Kuwayama, N. Ohno, Effect of geometrical imperfections on swelling-induced buckling patterns in gel films with a square lattice of holes, International Journal of Solids and Structures, 51 (2014) 154-163.
[44] L. Dong, V. Deshpande, H. Wadley, Mechanical response of Ti–6Al–4V octet-truss lattice structures, International Journal of Solids and Structures, 60-61 (2015) 107-124.
[45] L. Dong, H. Wadley, Mechanical properties of carbon fiber composite octet-truss lattice structures, Composites Science and Technology, 119 (2015) 26-33.
[46] T. Tancogne-Dejean, A.B. Spierings, D. Mohr, Additively-manufactured metallic micro-lattice materials for high specific energy absorption under static and dynamic loading, Acta Materialia, 116 (2016) 14-28.
[47] L.-J. Feng, L.-Z. Wu, G.-C. Yu, An Hourglass truss lattice structure and its mechanical performances, Materials & Design, 99 (2016) 581-591.
[48] O.E. Sotomayor, H.V. Tippur, Role of cell regularity and relative density on elastoplastic compression response of 3-D open-cell foam core sandwich structure generated using Voronoi diagrams, Acta Materialia, 78 (2014) 301-313.
[49] L. Yang, O. Harrysson, H. West, D. Cormier, A Comparison of Bending Properties for Cellular Core Sandwich Panels, Materials Sciences and Applications, 04 (2013) 471-477.
[50] X. Zhu, S. Ai, X. Lu, K. Cheng, X. Ling, L. Zhu, B. Liu, Collapse models of aluminum foam sandwiches under static three-point bending based on 3D geometrical reconstruction, Computational Materials Science, 85 (2014) 38-45.
[51] A. Xu, T. Vodenitcharova, K. Kabir, E.A. Flores-Johnson, M. Hoffman, Finite element analysis of indentation of aluminium foam and sandwich panels with aluminium foam core, Materials Science and Engineering: A, 599 (2014) 125-133.

117
[52] J. Zhang, Q. Qin, W. Ai, H. Li, T.J. Wang, The Failure Behavior of Geometrically Asymmetric Metal Foam Core Sandwich Beams Under Three-Point Bending, Journal of Applied Mechanics, 81 (2014) 071008.
[53] S.P. Timoshenko, On the correction for shear of the differential equation for transverse vibrations of prismatic bars, Philosophical Magazine, 41 (1921) 744-746.
[54] S.P. Timoshenko, On the transverse vibrations of bars of uniform cross-section, Philosophical Magazine, 43 (1922) 125-131.
[55] C. Wang, G. Kinzel, T. Altan, Mathematical modeling of plane-strain bending of sheet and plate, Journal of Materials Processing Technology, 39 (1993) 279-304.
[56] R. Hill, C. A theory of the plastic bulging of a metal diaphragm by lateral pressure, The London, Edinburgh, and Dublin Philosophical Magazine and Journal of Science, 41 (1950) 1133-1142.
[57] J. Lubahn and G. Sachs, Bending of an ideal plastic metal , Trans. ASME , 72 (1950) 201-208.
[58] R. Hill, On the problem of uniqueness in the theory of a rigid-plastic solid—IV, Journal of the Mechanics and Physics of Solids, 5 (1957) 302-307.
[59] F. Proksa, Zur Theorie des Plastischen Blechbiegens, Diss. T.H., (1958).
[60] T.X. Yu, W. Johnson, Influence of axial force on the elastic-plastic bending and springback of a beam, Journal of Mechanical Working Technology, 6 (1982) 5-21.
[61] K.A. Stelson, D.C. Gossard, An Adaptive Pressbrake Control Using an Elastic-Plastic Material Model, Journal of Manufacturing Science and Engineering, 104 (1982) 389-393.
[62] K.A. Stelson, An Adaptive Pressbrake Control for Strain-Hardening Materials, Journal of Engineering for Industry, 108 (1986) 127.
[63] F. Pourboghrat, K.A. Stelson, Pressbrake Bending in the Punch-Sheet Contact Region—Part 1: Modeling Nonuniformities, Journal of Manufacturing Science and Engineering, 110 (1988) 124-130.
[64] F. Pourboghrat, K.A. Stelson, Pressbrake Bending in the Punch-Sheet Contact Region—Part 2: Gap Formation and the Direction of Sheet Motion, Journal of Manufacturing Science and Engineering, 110 (1988) 131-136.
[65] F.J. Plantema, Sandwich Construction: The Bending and Buckling of Sandwich Beams, Plates and Shells, (1966).

118
[66] H.G. Allen, Analysis and design of structural sandwich panels, 1st ed., Pergamon Press, Oxford, New York, 1969.
[67] D. Zenkert, The Handbook of Sandwich Construction, (1997).
[68] I.J. V. Straalen, Comprehensive Overview of Theories for Sandwich Panels, Modeling of Sandwich Structures and Adhesive Bonded Joints, (2000) 48-70.
[69] Y. Frostig, M. Baruch, Bending of sandwich beams with transversely flexible core, AIAA Journal, 28 (1990) 523-531.
[70] Y. Frostig, Behavior of delaminated sandwich beam with transversely flexible core — high order theory, Composite Structures, 20 (1992) 1-16.
[71] Y. Frostig, On stress concentration in the bending of sandwich beams with transversely flexible core, Composite Structures, 24 (1993) 161-169.
[72] T.C. Triantafillou, L.J. Gibson, Failure mode maps for foam core sandwich beams, Materials Science and Engineering, 95 (1987) 37-53.
[73] T.M. McCormack, R. Miller, O. Kesler, L.J. Gibson, Failure of sandwich beams with metallic foam cores, International Journal of Solids and Structures, 38 (2001) 4901-4920.
[74] C. Chen, A.M. Harte, N.A. Fleck, The plastic collapse of sandwich beams with a metallic foam core, International Journal of Mechanical Sciences, 43 (2001) 1483-1506.
[75] H. Bart-Smith, J.W. Hutchinson, A.G. Evans, Measurement and analysis of the structural performance of cellular metal sandwich construction, International Journal of Mechanical Sciences, 43 (2001) 1945-1963.
[76] F. Vollertsen, State of the art and perspectives of hydroforming of tubes and sheets, J. Mater. Sci. Technol., 17 (2001) 321-324.
[77] J. Chakrabarty, J.M. Alexander, Hydrostatic bulging of circular diaphragms, The Journal of Strain Analysis for Engineering Design, 5 (1970) 155-161.
[78] H.M. Shang, T.C. Hsü, Deformation and Curvatures in Sheet-Metal in the Bulge Test, Journal of Engineering for Industry, 101 (1979) 341.
[79] H.M. Shang, V.P.W. Shim, A model study of the effect of the size of the die shoulder in hydroforming, Journal of Mechanical Working Technology, 10 (1984) 307-323.

119
[80] H.M. Shang, F.S. Chau, C.J. Tay, S.L. Toh, An approximate solution for the hydrostatic bulging of circular diaphragms with draw-in allowed, Journal of Mechanical Working Technology, 13 (1986) 279-289.
[81] P. Hein, F. Vollertsen, Hydroforming of sheet metal pairs, Journal of Materials Processing Technology, 87 (1999) 154-164.
[82] L.B. Shulkin, R.A. Posteraro, M.A. Ahmetoglu, G.L. Kinzel, T. Altan, Blank holder force (BHF) control in viscous pressure forming (VPF) of sheet metal, Journal of Materials Processing Technology, 98 (2000) 7-16.
[83] J. Zhou, Z. Gao, S. Allameh, E. Akpan, A.M. Cuitino, W.O. Soboyejo, Multiscale Deformation of Open Cell Aluminum Foams, Mechanics of Advanced Materials and Structures, 12 (2005) 201-216.
[84] ASTM Standard E2712-09e1, Test Methods for Forming Superplastic Metallic Sheet, ASTM International, (2009).
[85] J. Wang, C.-K. Yang, Failure analysis of hydroforming of sandwich panels, Journal of Manufacturing Processes, 15 (2013) 256-262.
[86] S. Mahabunphachai, M. Koç, Investigations on forming of aluminum 5052 and 6061 sheet alloys at warm temperatures, Materials & Design, 31 (2010) 2422-2434.
[87] E. Andrews, W. Sanders, L.J. Gibson, Compressive and tensile behaviour of aluminum foams, Materials Science and Engineering: A, 270 (1999) 113-124.
[88] L. Peroni, M. Avalle, M. Peroni, The mechanical behaviour of aluminium foam structures in different loading conditions, International Journal of Impact Engineering, 35 (2008) 644-658.
[89] S. Li, M. Thouless, A. Waas, J. Schroeder, P. Zavattieri, Use of a cohesive-zone model to analyze the fracture of a fiber-reinforced polymer?matrix composite, Composites Science and Technology, 65 (2005) 537-549.
[90] S. Li, M.D. Thouless, A.M. Waas, J.A. Schroeder, P.D. Zavattieri, Use of mode-I cohesive-zone models to describe the fracture of an adhesively-bonded polymer-matrix composite, Composites Science and Technology, 65 (2005) 281-293.
[91] S. Li, M.D. Thouless, A.M. Waas, J.A. Schroeder, P.D. Zavattieri, Mixed-mode cohesive-zone models for fracture of an adhesively bonded polymer–matrix composite, Engineering Fracture Mechanics, 73 (2006) 64-78.
[92] D. Systèmes, ABAQUS Analysis User's Manual, version 6.9-EF, (2009) 25.29.26.