2016 EU-wide Stress Test · Bank Name Svenska Handelsbanken - group LEI Code NHBDILHZTYCNBV5UYZ31...
29
Bank Name Svenska Handelsbanken - group LEI Code NHBDILHZTYCNBV5UYZ31 Country Code SE Sv 2016 EU-wide Stress Test
Transcript of 2016 EU-wide Stress Test · Bank Name Svenska Handelsbanken - group LEI Code NHBDILHZTYCNBV5UYZ31...

Bank Name Svenska Handelsbanken - group
LEI Code NHBDILHZTYCNBV5UYZ31
Country Code SESv
2016 EU-wide Stress Test

Actual
(starting year)Baseline Scenario Adverse Scenario
(mln EUR, %) 31/12/2015 31/12/2018 31/12/2018
Cumulative 3y: Net interest income 7,996.38 7,017.57
Cumulative 3y: Gains or (-) losses on financial assets and liabilities held for trading or designated at fair value through profit
and loss, net517.44 246.67
Cumulative 3y: (Impairment or (-) reversal of impairment on financial assets not measured at fair value through profit or loss) -725.74 -1,397.11
Cumulative 3y: Profit or (-) loss for the year 3,440.52 1,544.95
Coverage ratio - Default stock 42.74% 36.44% 36.18%
Common Equity Tier 1 capital 11,005.52 11,978.46 10,989.58
Total Risk exposure amount 51,794.63 51,883.55 59,251.76
Common Equity Tier 1 ratio, % 21.2% 23.1% 18.5%
Fully loaded Common Equity Tier 1 ratio, % 21.2% 23.1% 18.5%
Tier 1 capital 12,311.79 13,284.73 12,295.85
Total leverage ratio exposures 279,100.93 279,100.93 279,100.93
Leverage ratio, % 4.4% 4.8% 4.4%
Fully loaded leverage ratio, % 4.3% 4.7% 4.3%
Total amount of instruments with mandatory conversion into ordinary shares upon a fixed date in the 2016 -2018 period
(cumulative conversions)1 0
Total Additional Tier 1 and Tier 2 instruments eligible as regulatory capital under the CRR provisions that convert into Common
Equity Tier 1 or are written down upon a trigger event2 0
Of which: eligible instruments whose trigger is above CET1 capital ratio in the adverse scenario2 0
1 Conversions not considered for CET1 computation
2 Excluding instruments with mandatory conversion into ordinary shares upon a fixed date in the 2016 -2018 period
2016 EU-wide Stress Test: SummarySvenska Handelsbanken - group
Memorandum items
2016 EU-wide Stress Test:
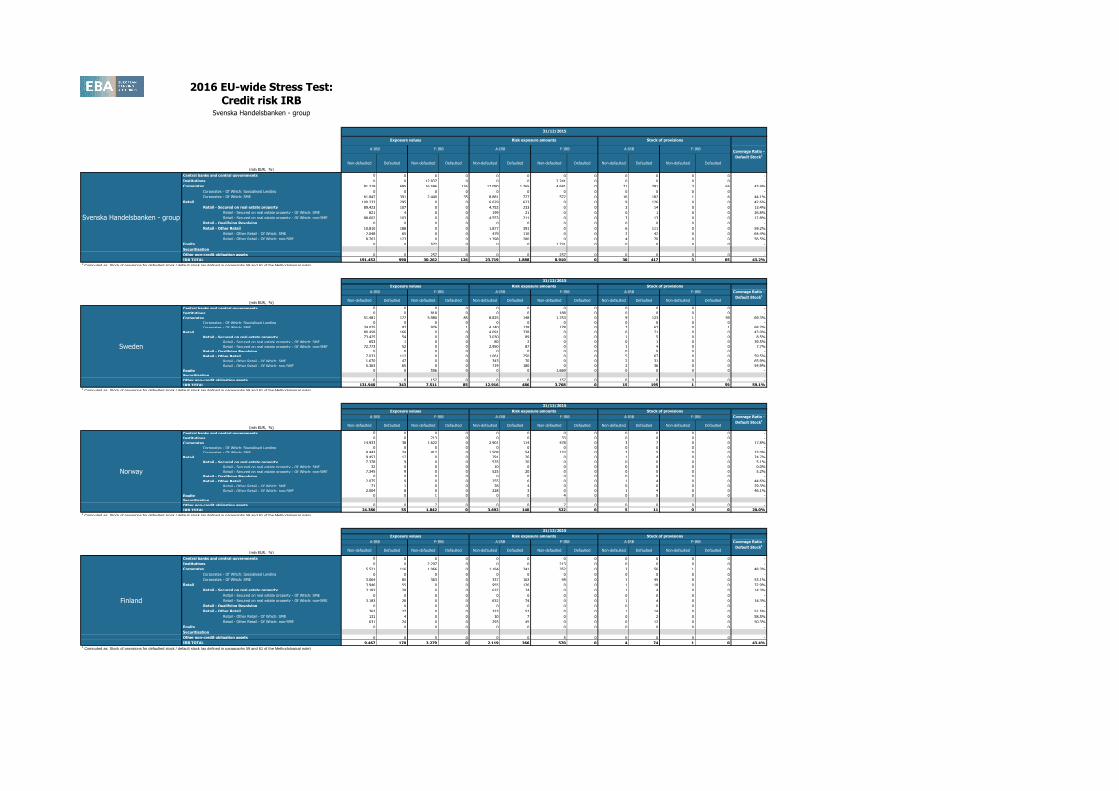
Credit risk IRBSvenska Handelsbanken - group
(mln EUR, %)
Non-defaulted Defaulted Non-defaulted Defaulted Non-defaulted Defaulted Non-defaulted Defaulted Non-defaulted Defaulted Non-defaulted Defaulted
Central banks and central governments 0 0 0 0 0 0 0 0 0 0 0 0 -
Institutions 0 0 12,837 0 0 0 2,241 0 0 0 0 0 -
Corporates 91,219 695 16,596 126 17,090 1,265 4,681 0 21 291 3 65 43.4%
Corporates - Of Which: Specialised Lending 0 0 0 0 0 0 0 0 0 0 0 0 -
Corporates - Of Which: SME 61,847 391 2,440 35 8,881 727 572 0 16 182 1 6 44.1%
Retail 100,233 295 0 0 6,629 623 0 0 9 126 0 0 42.6%
Retail - Secured on real estate property 89,423 107 0 0 4,752 233 0 0 3 14 0 0 13.4%
Retail - Secured on real estate property - Of Which: SME 821 4 0 0 199 21 0 0 0 1 0 0 26.8%
Retail - Secured on real estate property - Of Which: non-SME 88,602 103 0 0 4,553 211 0 0 3 13 0 0 12.8%
Retail - Qualifying Revolving 0 0 0 0 0 0 0 0 0 0 0 0 -
Retail - Other Retail 10,810 188 0 0 1,877 391 0 0 6 111 0 0 59.2%
Retail - Other Retail - Of Which: SME 2,048 65 0 0 479 110 0 0 2 42 0 0 64.4%
Retail - Other Retail - Of Which: non-SME 8,763 123 0 0 1,398 280 0 0 4 70 0 0 56.5%
Equity 0 0 572 0 0 0 1,731 0 0 0 0 0 -
Securitisation
Other non-credit obligation assets 0 0 257 0 0 0 257 0 0 0 0 0 -
IRB TOTAL 191,452 990 30,262 126 23,719 1,888 8,910 0 30 417 3 65 43.2%1 Computed as: Stock of provisions for defaulted stock / default stock (as defined in paragraphs 59 and 61 of the Methodological note)
(mln EUR, %)Non-defaulted Defaulted Non-defaulted Defaulted Non-defaulted Defaulted Non-defaulted Defaulted Non-defaulted Defaulted Non-defaulted Defaulted
Central banks and central governments 0 0 0 0 0 0 0 0 0 0 0 0 -
Institutions 0 0 818 0 0 0 188 0 0 0 0 0 -
Corporates 51,481 177 5,980 85 8,825 148 1,753 0 9 123 1 59 69.3%
Corporates - Of Which: Specialised Lending 0 0 0 0 0 0 0 0 0 0 0 0 -
Corporates - Of Which: SME 34,025 97 976 1 4,140 128 178 0 7 67 0 1 68.7%
Retail 80,458 166 0 0 4,091 338 0 0 6 71 0 0 43.0%
Retail - Secured on real estate property 73,425 54 0 0 3,030 89 0 0 1 5 0 0 8.5%
Retail - Secured on real estate property - Of Which: SME 653 1 0 0 80 2 0 0 0 1 0 0 39.5%
Retail - Secured on real estate property - Of Which: non-SME 72,773 52 0 0 2,950 87 0 0 1 4 0 0 7.7%
Retail - Qualifying Revolving 0 0 0 0 0 0 0 0 0 0 0 0 -
Retail - Other Retail 7,033 112 0 0 1,061 250 0 0 5 67 0 0 59.5%
Retail - Other Retail - Of Which: SME 1,670 47 0 0 343 70 0 0 2 31 0 0 65.9%
Retail - Other Retail - Of Which: non-SME 5,363 65 0 0 719 180 0 0 2 36 0 0 54.9%
Equity 0 0 556 0 0 0 1,669 0 0 0 0 0 -
Securitisation
Other non-credit obligation assets 0 0 157 0 0 0 157 0 0 0 0 0 -
IRB TOTAL 131,940 343 7,511 85 12,916 486 3,768 0 15 195 1 59 59.1%1 Computed as: Stock of provisions for defaulted stock / default stock (as defined in paragraphs 59 and 61 of the Methodological note)
(mln EUR, %)Non-defaulted Defaulted Non-defaulted Defaulted Non-defaulted Defaulted Non-defaulted Defaulted Non-defaulted Defaulted Non-defaulted Defaulted
Central banks and central governments 0 0 0 0 0 0 0 0 0 0 0 0 -
Institutions 0 0 213 0 0 0 33 0 0 0 0 0 -
Corporates 14,933 38 1,622 0 2,901 114 478 0 3 7 0 0 17.8%
Corporates - Of Which: Specialised Lending 0 0 0 0 0 0 0 0 0 0 0 0 -
Corporates - Of Which: SME 9,443 24 412 0 1,508 54 133 0 3 5 0 0 23.0%
Retail 9,453 17 0 0 791 26 0 0 1 4 0 0 24.7%
Retail - Secured on real estate property 7,378 9 0 0 535 20 0 0 0 0 0 0 5.1%
Retail - Secured on real estate property - Of Which: SME 32 0 0 0 10 0 0 0 0 0 0 0 0.0%
Retail - Secured on real estate property - Of Which: non-SME 7,345 9 0 0 525 20 0 0 0 0 0 0 5.2%
Retail - Qualifying Revolving 0 0 0 0 0 0 0 0 0 0 0 0 -
Retail - Other Retail 2,075 9 0 0 255 6 0 0 1 4 0 0 44.6%
Retail - Other Retail - Of Which: SME 71 1 0 0 28 4 0 0 0 0 0 0 29.3%
Retail - Other Retail - Of Which: non-SME 2,004 8 0 0 228 3 0 0 1 4 0 0 46.1%
Equity 0 0 1 0 0 0 4 0 0 0 0 0 -
Securitisation
Other non-credit obligation assets 0 0 7 0 0 0 7 0 0 0 0 0 -
IRB TOTAL 24,386 55 1,842 0 3,692 140 522 0 5 11 0 0 20.0%1 Computed as: Stock of provisions for defaulted stock / default stock (as defined in paragraphs 59 and 61 of the Methodological note)
(mln EUR, %)Non-defaulted Defaulted Non-defaulted Defaulted Non-defaulted Defaulted Non-defaulted Defaulted Non-defaulted Defaulted Non-defaulted Defaulted
Central banks and central governments 0 0 0 0 0 0 0 0 0 0 0 0 -
Institutions 0 0 2,207 0 0 0 213 0 0 0 0 0 -
Corporates 5,521 116 1,066 0 1,164 241 352 0 3 56 1 0 48.3%
Corporates - Of Which: Specialised Lending 0 0 0 0 0 0 0 0 0 0 0 0 -
Corporates - Of Which: SME 3,064 85 363 0 337 162 49 0 1 45 0 0 53.1%
Retail 3,946 55 0 0 955 126 0 0 1 18 0 0 32.9%
Retail - Secured on real estate property 3,183 28 0 0 632 74 0 0 1 4 0 0 14.3%
Retail - Secured on real estate property - Of Which: SME 0 0 0 0 0 0 0 0 0 0 0 0 -
Retail - Secured on real estate property - Of Which: non-SME 3,183 28 0 0 632 74 0 0 1 4 0 0 14.3%
Retail - Qualifying Revolving 0 0 0 0 0 0 0 0 0 0 0 0 -
Retail - Other Retail 762 27 0 0 323 52 0 0 1 14 0 0 51.5%
Retail - Other Retail - Of Which: SME 131 4 0 0 30 7 0 0 0 2 0 0 58.5%
Retail - Other Retail - Of Which: non-SME 631 24 0 0 293 45 0 0 0 12 0 0 50.3%
Equity 0 0 0 0 0 0 0 0 0 0 0 0 -
Securitisation
Other non-credit obligation assets 0 0 5 0 0 0 5 0 0 0 0 0 -
IRB TOTAL 9,467 170 3,279 0 2,119 366 570 0 4 74 1 0 43.4%1 Computed as: Stock of provisions for defaulted stock / default stock (as defined in paragraphs 59 and 61 of the Methodological note)
Finland
A-IRB F-IRB A-IRB F-IRB
Norway
31/12/2015
Exposure values Risk exposure amounts Stock of provisions
Coverage Ratio -
Default Stock1
A-IRB F-IRB
Coverage Ratio -
Default Stock1
A-IRB F-IRB A-IRB F-IRB A-IRB F-IRB
Sweden
31/12/2015
Exposure values Risk exposure amounts Stock of provisions
F-IRB A-IRB F-IRB
31/12/2015
Exposure values Risk exposure amounts Stock of provisions
Coverage Ratio -
Default Stock1
A-IRB F-IRB A-IRB
Svenska Handelsbanken - group
F-IRB A-IRB F-IRB A-IRB F-IRB
31/12/2015
Exposure values Risk exposure amounts Stock of provisions
Coverage Ratio -
Default Stock1
A-IRB

2016 EU-wide Stress Test:
Credit risk IRBSvenska Handelsbanken - group
(mln EUR, %)Non-defaulted Defaulted Non-defaulted Defaulted Non-defaulted Defaulted Non-defaulted Defaulted Non-defaulted Defaulted Non-defaulted Defaulted
Central banks and central governments 0 0 0 0 0 0 0 0 0 0 0 0 -
Institutions 0 0 1,651 0 0 0 467 0 0 0 0 0 -
Corporates 15,050 87 847 25 2,761 230 248 0 4 19 0 3 20.1%
Corporates - Of Which: Specialised Lending 0 0 0 0 0 0 0 0 0 0 0 0 -
Corporates - Of Which: SME 12,723 79 564 21 2,013 179 149 0 3 18 0 3 21.4%
Retail 87 0 0 0 7 0 0 0 0 0 0 0 100.1%
Retail - Secured on real estate property 75 0 0 0 5 0 0 0 0 0 0 0 -
Retail - Secured on real estate property - Of Which: SME 0 0 0 0 0 0 0 0 0 0 0 0 -
Retail - Secured on real estate property - Of Which: non-SME 75 0 0 0 5 0 0 0 0 0 0 0 -
Retail - Qualifying Revolving 0 0 0 0 0 0 0 0 0 0 0 0 -
Retail - Other Retail 12 0 0 0 2 0 0 0 0 0 0 0 100.1%
Retail - Other Retail - Of Which: SME 0 0 0 0 0 0 0 0 0 0 0 0 100.0%
Retail - Other Retail - Of Which: non-SME 12 0 0 0 2 0 0 0 0 0 0 0 100.1%
Equity 0 0 3 0 0 0 11 0 0 0 0 0 -
Securitisation
Other non-credit obligation assets 0 0 34 0 0 0 34 0 0 0 0 0 -
IRB TOTAL 15,137 88 2,535 25 2,768 230 759 0 4 19 0 3 20.2%1 Computed as: Stock of provisions for defaulted stock / default stock (as defined in paragraphs 59 and 61 of the Methodological note)
(mln EUR, %)Non-defaulted Defaulted Non-defaulted Defaulted Non-defaulted Defaulted Non-defaulted Defaulted Non-defaulted Defaulted Non-defaulted Defaulted
Central banks and central governments 0 0 0 0 0 0 0 0 0 0 0 0 -
Institutions 0 0 2,280 0 0 0 542 0 0 0 0 0 -
Corporates 3,089 213 1,462 0 1,025 462 307 0 1 57 0 0 26.5%
Corporates - Of Which: Specialised Lending 0 0 0 0 0 0 0 0 0 0 0 0 -
Corporates - Of Which: SME 2,079 62 80 0 715 135 38 0 1 26 0 0 42.0%
Retail 5,830 54 0 0 750 128 0 0 1 30 0 0 56.4%
Retail - Secured on real estate property 4,963 16 0 0 522 48 0 0 1 5 0 0 33.4%
Retail - Secured on real estate property - Of Which: SME 135 3 0 0 109 19 0 0 0 1 0 0 21.2%
Retail - Secured on real estate property - Of Which: non-SME 4,828 13 0 0 413 28 0 0 1 5 0 0 36.1%
Retail - Qualifying Revolving 0 0 0 0 0 0 0 0 0 0 0 0 -
Retail - Other Retail 866 38 0 0 228 81 0 0 0 25 0 0 66.0%
Retail - Other Retail - Of Which: SME 175 13 0 0 79 30 0 0 0 8 0 0 62.8%
Retail - Other Retail - Of Which: non-SME 692 25 0 0 149 51 0 0 0 17 0 0 67.7%
Equity 0 0 9 0 0 0 33 0 0 0 0 0 -
Securitisation
Other non-credit obligation assets 0 0 49 0 0 0 49 0 0 0 0 0 -
IRB TOTAL 8,919 267 3,801 0 1,775 591 932 0 2 87 0 0 32.5%1 Computed as: Stock of provisions for defaulted stock / default stock (as defined in paragraphs 59 and 61 of the Methodological note)
(mln EUR, %)Non-defaulted Defaulted Non-defaulted Defaulted Non-defaulted Defaulted Non-defaulted Defaulted Non-defaulted Defaulted Non-defaulted Defaulted
Central banks and central governments 0 0 0 0 0 0 0 0 0 0 0 0 -
Institutions 0 0 150 0 0 0 33 0 0 0 0 0 -
Corporates 26 0 406 0 16 0 176 0 0 0 0 0 -
Corporates - Of Which: Specialised Lending 0 0 0 0 0 0 0 0 0 0 0 0 -
Corporates - Of Which: SME 0 0 2 0 0 0 1 0 0 0 0 0 -
Retail 17 0 0 0 2 0 0 0 0 0 0 0 0.0%
Retail - Secured on real estate property 14 0 0 0 1 0 0 0 0 0 0 0 -
Retail - Secured on real estate property - Of Which: SME 0 0 0 0 0 0 0 0 0 0 0 0 -
Retail - Secured on real estate property - Of Which: non-SME 14 0 0 0 1 0 0 0 0 0 0 0 -
Retail - Qualifying Revolving 0 0 0 0 0 0 0 0 0 0 0 0 -
Retail - Other Retail 2 0 0 0 0 0 0 0 0 0 0 0 0.0%
Retail - Other Retail - Of Which: SME 0 0 0 0 0 0 0 0 0 0 0 0 -
Retail - Other Retail - Of Which: non-SME 2 0 0 0 0 0 0 0 0 0 0 0 0.0%
Equity 0 0 0 0 0 0 0 0 0 0 0 0 -
Securitisation
Other non-credit obligation assets 0 0 1 0 0 0 1 0 0 0 0 0 -
IRB TOTAL 43 0 558 0 17 0 210 0 0 0 0 0 0.0%1 Computed as: Stock of provisions for defaulted stock / default stock (as defined in paragraphs 59 and 61 of the Methodological note)
(mln EUR, %)Non-defaulted Defaulted Non-defaulted Defaulted Non-defaulted Defaulted Non-defaulted Defaulted Non-defaulted Defaulted Non-defaulted Defaulted
Central banks and central governments 0 0 0 0 0 0 0 0 0 0 0 0 -
Institutions 0 0 3,202 0 0 0 172 0 0 0 0 0 -
Corporates 45 2 1,853 0 19 0 509 0 0 1 0 0 65.9%
Corporates - Of Which: Specialised Lending 0 0 0 0 0 0 0 0 0 0 0 0 -
Corporates - Of Which: SME 0 0 2 0 0 0 0 0 0 0 0 0 -
Retail 81 0 0 0 6 0 0 0 0 0 0 0 53.5%
Retail - Secured on real estate property 70 0 0 0 4 0 0 0 0 0 0 0 -
Retail - Secured on real estate property - Of Which: SME 0 0 0 0 0 0 0 0 0 0 0 0 -
Retail - Secured on real estate property - Of Which: non-SME 70 0 0 0 4 0 0 0 0 0 0 0 -
Retail - Qualifying Revolving 0 0 0 0 0 0 0 0 0 0 0 0 -
Retail - Other Retail 11 0 0 0 2 0 0 0 0 0 0 0 53.5%
Retail - Other Retail - Of Which: SME 0 0 0 0 0 0 0 0 0 0 0 0 -
Retail - Other Retail - Of Which: non-SME 11 0 0 0 2 0 0 0 0 0 0 0 53.5%
Equity 0 0 0 0 0 0 0 0 0 0 0 0 -
Securitisation
Other non-credit obligation assets 0 0 1 0 0 0 1 0 0 0 0 0 -
IRB TOTAL 127 2 5,056 0 25 0 682 0 0 1 0 0 65.4%1 Computed as: Stock of provisions for defaulted stock / default stock (as defined in paragraphs 59 and 61 of the Methodological note)
United States
A-IRB F-IRB A-IRB F-IRB
Netherlands
31/12/2015
Exposure values Risk exposure amounts Stock of provisions
Coverage Ratio -
Default Stock1
A-IRB F-IRB
Stock of provisions
Coverage Ratio -
Default Stock1
A-IRB F-IRB A-IRB F-IRB A-IRB F-IRB
Denmark
31/12/2015
Exposure values Risk exposure amounts
A-IRB F-IRB A-IRB F-IRB
United Kingdom
31/12/2015
Exposure values Risk exposure amounts Stock of provisions
Coverage Ratio -
Default Stock1
A-IRB F-IRB
Stock of provisions
Coverage Ratio -
Default Stock1
A-IRB F-IRB A-IRB F-IRB A-IRB F-IRB
31/12/2015
Exposure values Risk exposure amounts
2016 EU-wide Stress Test:
Credit risk IRBSvenska Handelsbanken - group
(mln EUR, %)Non-defaulted Defaulted Non-defaulted Defaulted Non-defaulted Defaulted Non-defaulted Defaulted Non-defaulted Defaulted Non-defaulted Defaulted
Central banks and central governments 0 0 0 0 0 0 0 0 0 0 0 0 -
Institutions 0 0 0 0 0 0 0 0 0 0 0 0 -
Corporates 0 0 0 0 0 0 0 0 0 0 0 0 -
Corporates - Of Which: Specialised Lending 0 0 0 0 0 0 0 0 0 0 0 0 -
Corporates - Of Which: SME 0 0 0 0 0 0 0 0 0 0 0 0 -
Retail 0 0 0 0 0 0 0 0 0 0 0 0 -
Retail - Secured on real estate property 0 0 0 0 0 0 0 0 0 0 0 0 -
Retail - Secured on real estate property - Of Which: SME 0 0 0 0 0 0 0 0 0 0 0 0 -
Retail - Secured on real estate property - Of Which: non-SME 0 0 0 0 0 0 0 0 0 0 0 0 -
Retail - Qualifying Revolving 0 0 0 0 0 0 0 0 0 0 0 0 -
Retail - Other Retail 0 0 0 0 0 0 0 0 0 0 0 0 -
Retail - Other Retail - Of Which: SME 0 0 0 0 0 0 0 0 0 0 0 0 -
Retail - Other Retail - Of Which: non-SME 0 0 0 0 0 0 0 0 0 0 0 0 -
Equity 0 0 0 0 0 0 0 0 0 0 0 0 -
Securitisation
Other non-credit obligation assets 0 0 0 0 0 0 0 0 0 0 0 0 -
IRB TOTAL 0 0 0 0 0 0 0 0 0 0 0 0 -1 Computed as: Stock of provisions for defaulted stock / default stock (as defined in paragraphs 59 and 61 of the Methodological note)
0
Stock of provisions
Coverage Ratio -
Default Stock1
A-IRB F-IRB A-IRB F-IRB A-IRB F-IRB
0
31/12/2015
Exposure values Risk exposure amounts
A-IRB F-IRB A-IRB F-IRB
0
31/12/2015
Exposure values Risk exposure amounts Stock of provisions
Coverage Ratio -
Default Stock1
A-IRB F-IRB
Stock of provisions
Coverage Ratio -
Default Stock1
A-IRB F-IRB A-IRB F-IRB A-IRB F-IRB
31/12/2015
Exposure values Risk exposure amounts

2016 EU-wide Stress Test:
Credit risk IRBSvenska Handelsbanken - group
(mln EUR, %)
Central banks and central governments
Institutions
Corporates
Corporates - Of Which: Specialised Lending
Corporates - Of Which: SME
Retail
Retail - Secured on real estate property
Retail - Secured on real estate property - Of Which: SME
Retail - Secured on real estate property - Of Which: non-SME
Retail - Qualifying Revolving
Retail - Other Retail
Retail - Other Retail - Of Which: SME
Retail - Other Retail - Of Which: non-SME
Equity
Securitisation
Other non-credit obligation assets
IRB TOTAL1 Computed as: Stock of provisions for defaulted stock / default stock (as defined in paragraphs 59 and 61 of the Methodological note)
Finland
Norway
Sweden
Svenska Handelsbanken - group
Impairment
rate
Stock of
Provisions
Coverage Ratio -
Default Stock1
Impairment
rate
Stock of
Provisions
Coverage Ratio -
Default Stock1
Impairment
rate
Stock of
Provisions
Coverage Ratio -
Default Stock1
Impairment
rate
Stock of
Provisions
Coverage Ratio -
Default Stock1
Impairment
rate
Stock of
Provisions
Coverage Ratio -
Default Stock1
Impairment
rate
Stock of
Provisions
Coverage Ratio -
Default Stock1
- 0 - - 0 - - 0 - - 0 - - 0 - - 0 -
0.1% 7 44.2% 0.1% 14 45.1% 0.1% 21 45.4% 0.1% 7 44.2% 0.1% 15 45.0% 0.1% 22 45.3%
0.1% 521 41.4% 0.1% 648 39.1% 0.1% 782 37.7% 0.2% 580 40.4% 0.3% 937 38.8% 0.4% 1,324 37.6%
- 0 - - 0 - - 0 - - 0 - - 0 - - 0 -
0.1% 278 41.8% 0.1% 342 38.8% 0.1% 407 36.9% 0.1% 314 42.1% 0.3% 510 40.4% 0.3% 727 38.8%
0.1% 216 35.7% 0.1% 307 34.7% 0.1% 396 33.9% 0.1% 227 36.0% 0.1% 356 34.4% 0.1% 509 32.4%
0.0% 62 19.6% 0.0% 105 20.8% 0.0% 148 21.1% 0.0% 73 21.5% 0.1% 153 23.9% 0.1% 256 24.0%
0.4% 6 44.1% 0.4% 10 49.3% 0.4% 14 51.5% 0.4% 6 44.1% 0.4% 10 48.3% 0.4% 13 44.1%
0.0% 56 18.5% 0.0% 95 19.5% 0.0% 133 19.9% 0.0% 67 20.7% 0.1% 143 23.1% 0.1% 243 23.4%
- 0 - - 0 - - 0 - - 0 - - 0 - - 0 -
0.3% 154 53.2% 0.3% 202 53.4% 0.3% 249 53.2% 0.3% 154 52.8% 0.4% 203 51.8% 0.4% 253 50.5%
0.6% 55 56.3% 0.6% 67 52.4% 0.6% 79 50.0% 0.6% 56 56.3% 0.6% 68 52.2% 0.7% 81 49.6%
0.3% 99 51.6% 0.3% 135 53.8% 0.3% 170 54.8% 0.3% 99 51.0% 0.3% 135 51.6% 0.3% 172 51.0%
0.0% 0 - 0.0% 0 - 0.0% 0 - 0.0% 0 - 0.0% 0 - 0.0% 0 -
0.0% 0 - 0.0% 0 - 0.0% 0 - 0.0% 0 - 0.0% 0 - 0.0% 0 -
0.1% 744 39.6% 0.1% 970 37.7% 0.1% 1,199 36.5% 0.1% 814 39.1% 0.2% 1,307 37.5% 0.2% 1,855 36.1%
Impairment
rate
Stock of
Provisions
Coverage Ratio -
Default Stock1
Impairment
rate
Stock of
Provisions
Coverage Ratio -
Default Stock1
Impairment
rate
Stock of
Provisions
Coverage Ratio -
Default Stock1
Impairment
rate
Stock of
Provisions
Coverage Ratio -
Default Stock1
Impairment
rate
Stock of
Provisions
Coverage Ratio -
Default Stock1
Impairment
rate
Stock of
Provisions
Coverage Ratio -
Default Stock1
- 0 - - 0 - - 0 - - 0 - - 0 - - 0 -
0.0% 0 35.4% 0.0% 1 36.0% 0.0% 1 36.2% 0.0% 0 35.4% 0.0% 1 36.3% 0.0% 1 36.9%
0.1% 249 53.9% 0.1% 306 47.3% 0.1% 366 43.4% 0.1% 275 49.9% 0.3% 429 42.1% 0.3% 602 38.7%
- 0 - - 0 - - 0 - - 0 - - 0 - - 0 -
0.1% 97 51.2% 0.1% 120 43.9% 0.1% 144 39.8% 0.1% 108 48.8% 0.2% 171 41.5% 0.2% 246 38.3%
0.0% 118 31.9% 0.0% 161 29.0% 0.0% 204 27.5% 0.1% 129 32.9% 0.1% 210 31.1% 0.1% 315 29.6%
0.0% 27 13.8% 0.0% 45 13.7% 0.0% 62 13.6% 0.0% 38 17.7% 0.1% 93 21.3% 0.1% 169 22.3%
0.1% 1 24.5% 0.1% 2 22.6% 0.1% 3 21.8% 0.1% 1 24.5% 0.1% 2 22.5% 0.2% 4 21.6%
0.0% 25 13.4% 0.0% 42 13.4% 0.0% 59 13.4% 0.0% 36 17.5% 0.1% 91 21.3% 0.1% 166 22.3%
- 0 - - 0 - - 0 - - 0 - - 0 - - 0 -
0.3% 91 52.4% 0.3% 116 51.4% 0.3% 141 50.7% 0.3% 91 51.9% 0.3% 117 50.0% 0.3% 145 48.7%
0.5% 41 55.2% 0.5% 50 50.1% 0.5% 58 47.1% 0.5% 41 55.1% 0.5% 50 49.9% 0.6% 60 46.7%
0.2% 50 50.3% 0.2% 67 52.5% 0.2% 84 53.6% 0.2% 50 49.5% 0.2% 67 50.1% 0.2% 86 50.1%
0.0% 0 - 0.0% 0 - 0.0% 0 - 0.0% 0 - 0.0% 0 - 0.0% 0 -
0.0% 0 - 0.0% 0 - 0.0% 0 - 0.0% 0 - 0.0% 0 - 0.0% 0 -
0.1% 367 44.2% 0.1% 467 38.9% 0.1% 570 36.0% 0.1% 404 42.8% 0.2% 640 37.7% 0.2% 917 35.0%
Impairment
rate
Stock of
Provisions
Coverage Ratio -
Default Stock1
Impairment
rate
Stock of
Provisions
Coverage Ratio -
Default Stock1
Impairment
rate
Stock of
Provisions
Coverage Ratio -
Default Stock1
Impairment
rate
Stock of
Provisions
Coverage Ratio -
Default Stock1
Impairment
rate
Stock of
Provisions
Coverage Ratio -
Default Stock1
Impairment
rate
Stock of
Provisions
Coverage Ratio -
Default Stock1
- 0 - - 0 - - 0 - - 0 - - 0 - - 0 -
0.0% 0 44.2% 0.0% 0 45.6% 0.0% 0 46.2% 0.0% 0 44.0% 0.0% 0 44.6% 0.0% 0 44.9%
0.1% 38 38.0% 0.1% 61 37.6% 0.2% 87 37.1% 0.2% 45 39.0% 0.3% 102 41.5% 0.4% 163 42.0%
- 0 - - 0 - - 0 - - 0 - - 0 - - 0 -
0.1% 25 38.3% 0.1% 40 37.7% 0.2% 55 37.1% 0.2% 30 39.6% 0.4% 77 42.8% 0.5% 125 42.9%
0.1% 13 26.7% 0.1% 20 25.3% 0.1% 26 24.6% 0.1% 14 26.5% 0.1% 23 24.6% 0.1% 35 23.6%
0.0% 6 20.5% 0.1% 10 20.8% 0.1% 13 20.8% 0.1% 6 20.5% 0.1% 12 20.7% 0.1% 20 20.6%
0.5% 0 30.0% 0.5% 0 30.0% 0.5% 1 30.0% 0.5% 0 30.0% 0.7% 0 30.0% 0.7% 1 30.0%
0.0% 6 20.3% 0.0% 9 20.5% 0.0% 13 20.6% 0.1% 6 20.3% 0.1% 12 20.4% 0.1% 19 20.4%
- 0 - - 0 - - 0 - - 0 - - 0 - - 0 -
0.1% 7 35.8% 0.1% 10 32.5% 0.1% 13 30.9% 0.1% 8 35.6% 0.1% 11 31.8% 0.2% 15 29.7%
0.9% 1 56.5% 0.9% 2 57.4% 0.9% 2 57.9% 0.9% 1 56.5% 0.9% 2 57.6% 1.1% 3 58.6%
0.1% 6 33.4% 0.1% 8 29.5% 0.1% 10 27.6% 0.1% 6 33.2% 0.1% 9 29.0% 0.2% 12 26.8%
0.0% 0 - 0.0% 0 - 0.0% 0 - 0.0% 0 - 0.0% 0 - 0.0% 0 -
0.0% 0 - 0.0% 0 - 0.0% 0 - 0.0% 0 - 0.0% 0 - 0.0% 0 -
0.1% 51 34.2% 0.1% 81 33.6% 0.1% 114 33.2% 0.1% 59 35.1% 0.2% 125 36.9% 0.3% 198 37.0%
Impairment
rate
Stock of
Provisions
Coverage Ratio -
Default Stock1
Impairment
rate
Stock of
Provisions
Coverage Ratio -
Default Stock1
Impairment
rate
Stock of
Provisions
Coverage Ratio -
Default Stock1
Impairment
rate
Stock of
Provisions
Coverage Ratio -
Default Stock1
Impairment
rate
Stock of
Provisions
Coverage Ratio -
Default Stock1
Impairment
rate
Stock of
Provisions
Coverage Ratio -
Default Stock1
- 0 - - 0 - - 0 - - 0 - - 0 - - 0 -
0.0% 1 45.0% 0.0% 1 45.9% 0.0% 2 46.2% 0.0% 0 45.0% 0.0% 1 45.9% 0.0% 2 46.2%
0.1% 69 44.9% 0.1% 77 42.2% 0.1% 88 42.6% 0.2% 72 41.1% 0.3% 98 39.6% 0.5% 131 38.9%
- 0 - - 0 - - 0 - - 0 - - 0 - - 0 -
0.1% 49 51.0% 0.1% 52 49.0% 0.1% 55 47.5% 0.1% 51 50.5% 0.3% 60 47.1% 0.4% 75 46.6%
0.5% 43 40.3% 0.5% 63 41.0% 0.5% 82 41.0% 0.5% 43 40.2% 0.5% 65 40.5% 0.5% 86 40.2%
0.2% 16 28.2% 0.2% 24 28.7% 0.2% 31 28.7% 0.2% 16 28.2% 0.3% 25 28.7% 0.3% 35 28.7%
0.5% 0 20.0% 0.5% 0 20.0% 0.5% 0 20.0% 0.5% 0 20.0% 0.5% 0 20.0% 0.5% 0 20.0%
0.2% 16 28.2% 0.2% 24 28.7% 0.2% 31 28.7% 0.2% 16 28.2% 0.3% 25 28.7% 0.3% 35 28.7%
- 0 - - 0 - - 0 - - 0 - - 0 - - 0 -
1.4% 27 53.9% 1.4% 39 55.3% 1.4% 51 55.8% 1.4% 27 53.9% 1.4% 39 55.2% 1.4% 51 55.7%
0.5% 3 55.3% 0.5% 4 53.8% 0.5% 4 52.8% 0.5% 3 55.3% 0.6% 4 53.8% 0.6% 5 52.7%
1.6% 24 53.7% 1.6% 35 55.4% 1.6% 46 56.1% 1.6% 24 53.7% 1.6% 35 55.4% 1.6% 46 56.0%
- 0 - - 0 - - 0 - - 0 - - 0 - - 0 -
0.0% 0 - 0.0% 0 - 0.0% 0 - 0.0% 0 - 0.0% 0 - 0.0% 0 -
0.2% 112 43.0% 0.2% 141 41.7% 0.2% 171 41.9% 0.2% 115 40.8% 0.3% 163 40.0% 0.4% 219 39.5%
31/12/2016 31/12/2017
Baseline Scenario Adverse Scenario
31/12/2018 31/12/2016 31/12/2017 31/12/2018
31/12/2016 31/12/2017 31/12/2018 31/12/2016 31/12/2017 31/12/2018
Baseline Scenario Adverse Scenario
31/12/2016 31/12/2017 31/12/2018
Baseline Scenario Adverse Scenario
31/12/2016 31/12/2017 31/12/2018
31/12/2017 31/12/2018 31/12/2016 31/12/2017 31/12/201831/12/2016
Baseline Scenario Adverse Scenario
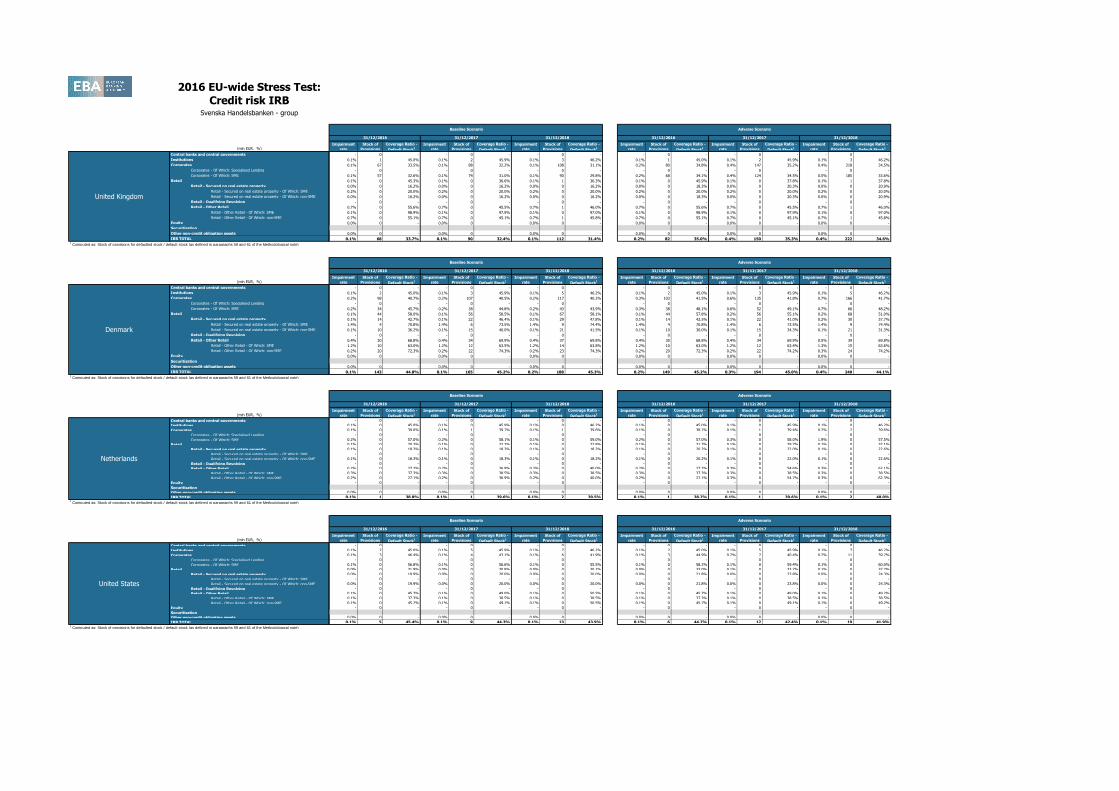
2016 EU-wide Stress Test:
Credit risk IRBSvenska Handelsbanken - group
(mln EUR, %)
Central banks and central governments
Institutions
Corporates
Corporates - Of Which: Specialised Lending
Corporates - Of Which: SME
Retail
Retail - Secured on real estate property
Retail - Secured on real estate property - Of Which: SME
Retail - Secured on real estate property - Of Which: non-SME
Retail - Qualifying Revolving
Retail - Other Retail
Retail - Other Retail - Of Which: SME
Retail - Other Retail - Of Which: non-SME
Equity
Securitisation
Other non-credit obligation assets
IRB TOTAL1 Computed as: Stock of provisions for defaulted stock / default stock (as defined in paragraphs 59 and 61 of the Methodological note)
(mln EUR, %)
Central banks and central governments
Institutions
Corporates
Corporates - Of Which: Specialised Lending
Corporates - Of Which: SME
Retail
Retail - Secured on real estate property
Retail - Secured on real estate property - Of Which: SME
Retail - Secured on real estate property - Of Which: non-SME
Retail - Qualifying Revolving
Retail - Other Retail
Retail - Other Retail - Of Which: SME
Retail - Other Retail - Of Which: non-SME
Equity
Securitisation
Other non-credit obligation assets
IRB TOTAL1 Computed as: Stock of provisions for defaulted stock / default stock (as defined in paragraphs 59 and 61 of the Methodological note)
(mln EUR, %)
Central banks and central governments
Institutions
Corporates
Corporates - Of Which: Specialised Lending
Corporates - Of Which: SME
Retail
Retail - Secured on real estate property
Retail - Secured on real estate property - Of Which: SME
Retail - Secured on real estate property - Of Which: non-SME
Retail - Qualifying Revolving
Retail - Other Retail
Retail - Other Retail - Of Which: SME
Retail - Other Retail - Of Which: non-SME
Equity
Securitisation
Other non-credit obligation assets
IRB TOTAL1 Computed as: Stock of provisions for defaulted stock / default stock (as defined in paragraphs 59 and 61 of the Methodological note)
(mln EUR, %)
Central banks and central governments
Institutions
Corporates
Corporates - Of Which: Specialised Lending
Corporates - Of Which: SME
Retail
Retail - Secured on real estate property
Retail - Secured on real estate property - Of Which: SME
Retail - Secured on real estate property - Of Which: non-SME
Retail - Qualifying Revolving
Retail - Other Retail
Retail - Other Retail - Of Which: SME
Retail - Other Retail - Of Which: non-SME
Equity
Securitisation
Other non-credit obligation assets
IRB TOTAL1 Computed as: Stock of provisions for defaulted stock / default stock (as defined in paragraphs 59 and 61 of the Methodological note)
United States
Netherlands
Denmark
United Kingdom
Impairment
rate
Stock of
Provisions
Coverage Ratio -
Default Stock1
Impairment
rate
Stock of
Provisions
Coverage Ratio -
Default Stock1
Impairment
rate
Stock of
Provisions
Coverage Ratio -
Default Stock1
Impairment
rate
Stock of
Provisions
Coverage Ratio -
Default Stock1
Impairment
rate
Stock of
Provisions
Coverage Ratio -
Default Stock1
Impairment
rate
Stock of
Provisions
Coverage Ratio -
Default Stock1
- 0 - - 0 - - 0 - - 0 - - 0 - - 0 -
0.1% 1 45.0% 0.1% 2 45.9% 0.1% 3 46.2% 0.1% 1 45.0% 0.1% 2 45.9% 0.1% 3 46.2%
0.1% 67 33.5% 0.1% 88 32.2% 0.1% 108 31.1% 0.2% 80 34.8% 0.4% 147 35.2% 0.4% 218 34.5%
- 0 - - 0 - - 0 - - 0 - - 0 - - 0 -
0.1% 57 32.6% 0.1% 74 31.0% 0.1% 90 29.8% 0.2% 68 34.1% 0.4% 124 34.5% 0.5% 185 33.6%
0.1% 0 45.3% 0.1% 0 36.6% 0.1% 1 36.3% 0.1% 0 45.9% 0.1% 0 37.8% 0.1% 1 37.8%
0.0% 0 16.2% 0.0% 0 16.2% 0.0% 0 16.2% 0.0% 0 18.3% 0.0% 0 20.3% 0.0% 0 20.9%
0.2% 0 20.0% 0.2% 0 20.0% 0.2% 0 20.0% 0.2% 0 20.0% 0.2% 0 20.0% 0.2% 0 20.0%
0.0% 0 16.2% 0.0% 0 16.2% 0.0% 0 16.2% 0.0% 0 18.3% 0.0% 0 20.3% 0.0% 0 20.9%
- 0 - - 0 - - 0 - - 0 - - 0 - - 0 -
0.7% 0 55.6% 0.7% 0 45.5% 0.7% 1 46.0% 0.7% 0 55.6% 0.7% 0 45.5% 0.7% 1 46.0%
0.1% 0 98.9% 0.1% 0 97.9% 0.1% 0 97.0% 0.1% 0 98.9% 0.1% 0 97.9% 0.1% 0 97.0%
0.7% 0 55.1% 0.7% 0 45.1% 0.7% 1 45.8% 0.7% 0 55.1% 0.7% 0 45.1% 0.7% 1 45.8%
0.0% 0 - 0.0% 0 - 0.0% 0 - 0.0% 0 - 0.0% 0 - 0.0% 0 -
0.0% 0 - 0.0% 0 - 0.0% 0 - 0.0% 0 - 0.0% 0 - 0.0% 0 -
0.1% 68 33.7% 0.1% 90 32.4% 0.1% 112 31.4% 0.2% 82 35.0% 0.4% 150 35.3% 0.4% 222 34.6%
Impairment
rate
Stock of
Provisions
Coverage Ratio -
Default Stock1
Impairment
rate
Stock of
Provisions
Coverage Ratio -
Default Stock1
Impairment
rate
Stock of
Provisions
Coverage Ratio -
Default Stock1
Impairment
rate
Stock of
Provisions
Coverage Ratio -
Default Stock1
Impairment
rate
Stock of
Provisions
Coverage Ratio -
Default Stock1
Impairment
rate
Stock of
Provisions
Coverage Ratio -
Default Stock1
- 0 - - 0 - - 0 - - 0 - - 0 - - 0 -
0.1% 2 45.0% 0.1% 3 45.9% 0.1% 5 46.2% 0.1% 2 45.0% 0.1% 3 45.9% 0.1% 5 46.2%
0.2% 98 40.7% 0.2% 107 40.5% 0.2% 117 40.2% 0.3% 103 41.5% 0.6% 135 41.8% 0.7% 166 41.7%
- 0 - - 0 - - 0 - - 0 - - 0 - - 0 -
0.2% 34 45.7% 0.2% 38 44.8% 0.2% 43 43.9% 0.3% 38 48.1% 0.6% 52 49.1% 0.7% 66 48.2%
0.1% 44 58.0% 0.1% 56 58.5% 0.1% 67 58.1% 0.1% 44 57.8% 0.2% 56 55.1% 0.2% 68 51.0%
0.1% 14 42.7% 0.1% 22 46.4% 0.1% 29 47.8% 0.1% 14 42.5% 0.1% 22 41.0% 0.2% 30 37.7%
1.4% 4 70.8% 1.4% 6 73.5% 1.4% 9 74.4% 1.4% 4 70.8% 1.4% 6 73.5% 1.4% 9 74.4%
0.1% 10 36.2% 0.1% 15 40.0% 0.1% 21 41.5% 0.1% 10 36.0% 0.1% 15 34.3% 0.1% 21 31.3%
- 0 - - 0 - - 0 - - 0 - - 0 - - 0 -
0.4% 30 68.8% 0.4% 34 69.9% 0.4% 37 69.8% 0.4% 30 68.8% 0.4% 34 69.9% 0.5% 39 69.8%
1.2% 10 63.0% 1.2% 12 63.5% 1.2% 14 63.8% 1.2% 10 63.0% 1.2% 12 63.4% 1.3% 15 63.6%
0.2% 20 72.3% 0.2% 22 74.3% 0.2% 23 74.3% 0.2% 20 72.3% 0.2% 22 74.2% 0.3% 24 74.2%
0.0% 0 - 0.0% 0 - 0.0% 0 - 0.0% 0 - 0.0% 0 - 0.0% 0 -
0.0% 0 - 0.0% 0 - 0.0% 0 - 0.0% 0 - 0.0% 0 - 0.0% 0 -
0.1% 143 44.8% 0.1% 165 45.2% 0.2% 188 45.3% 0.2% 149 45.2% 0.3% 194 45.0% 0.4% 240 44.1%
Impairment
rate
Stock of
Provisions
Coverage Ratio -
Default Stock1
Impairment
rate
Stock of
Provisions
Coverage Ratio -
Default Stock1
Impairment
rate
Stock of
Provisions
Coverage Ratio -
Default Stock1
Impairment
rate
Stock of
Provisions
Coverage Ratio -
Default Stock1
Impairment
rate
Stock of
Provisions
Coverage Ratio -
Default Stock1
Impairment
rate
Stock of
Provisions
Coverage Ratio -
Default Stock1
- 0 - - 0 - - 0 - - 0 - - 0 - - 0 -
0.1% 0 45.0% 0.1% 0 45.9% 0.1% 0 46.2% 0.1% 0 45.0% 0.1% 0 45.9% 0.1% 0 46.2%
0.1% 0 39.0% 0.1% 1 39.7% 0.1% 1 39.6% 0.1% 0 38.7% 0.1% 1 39.4% 0.2% 2 39.6%
- 0 - - 0 - - 0 - - 0 - - 0 - - 0 -
0.2% 0 57.0% 0.2% 0 58.1% 0.1% 0 59.0% 0.2% 0 57.0% 0.3% 0 58.0% 1.9% 0 57.5%
0.1% 0 20.2% 0.1% 0 22.2% 0.1% 0 22.8% 0.1% 0 21.7% 0.1% 0 29.7% 0.1% 0 32.1%
0.1% 0 18.3% 0.1% 0 18.3% 0.1% 0 18.2% 0.1% 0 20.2% 0.1% 0 22.0% 0.1% 0 22.6%
- 0 - - 0 - - 0 - - 0 - - 0 - - 0 -
0.1% 0 18.3% 0.1% 0 18.3% 0.1% 0 18.2% 0.1% 0 20.2% 0.1% 0 22.0% 0.1% 0 22.6%
- 0 - - 0 - - 0 - - 0 - - 0 - - 0 -
0.2% 0 27.2% 0.2% 0 36.9% 0.2% 0 40.0% 0.2% 0 27.2% 0.3% 0 54.6% 0.3% 0 62.1%
0.3% 0 37.3% 0.3% 0 38.5% 0.3% 0 38.5% 0.3% 0 37.3% 0.3% 0 38.5% 0.3% 0 38.5%
0.2% 0 27.1% 0.2% 0 36.9% 0.2% 0 40.0% 0.2% 0 27.1% 0.3% 0 54.7% 0.3% 0 62.3%
- 0 - - 0 - - 0 - - 0 - - 0 - - 0 -
0.0% 0 - 0.0% 0 - 0.0% 0 - 0.0% 0 - 0.0% 0 - 0.0% 0 -
0.1% 1 38.8% 0.1% 1 39.6% 0.1% 2 39.5% 0.1% 1 38.7% 0.1% 1 39.6% 0.1% 2 40.0%
Impairment
rate
Stock of
Provisions
Coverage Ratio -
Default Stock1
Impairment
rate
Stock of
Provisions
Coverage Ratio -
Default Stock1
Impairment
rate
Stock of
Provisions
Coverage Ratio -
Default Stock1
Impairment
rate
Stock of
Provisions
Coverage Ratio -
Default Stock1
Impairment
rate
Stock of
Provisions
Coverage Ratio -
Default Stock1
Impairment
rate
Stock of
Provisions
Coverage Ratio -
Default Stock1
- 0 - - 0 - - 0 - - 0 - - 0 - - 0 -
0.1% 2 45.0% 0.1% 5 45.9% 0.1% 7 46.2% 0.1% 2 45.0% 0.1% 5 45.9% 0.1% 7 46.2%
0.1% 3 46.4% 0.1% 4 43.1% 0.1% 6 41.9% 0.1% 3 44.9% 0.2% 7 40.4% 0.2% 11 39.7%
- 0 - - 0 - - 0 - - 0 - - 0 - - 0 -
0.1% 0 56.8% 0.1% 0 56.6% 0.1% 0 55.5% 0.1% 0 58.2% 0.1% 0 59.4% 0.1% 0 60.0%
0.0% 0 31.9% 0.0% 0 30.8% 0.0% 0 30.1% 0.0% 0 33.0% 0.1% 0 33.2% 0.1% 0 32.7%
0.0% 0 19.9% 0.0% 0 20.0% 0.0% 0 20.0% 0.0% 0 21.8% 0.0% 0 23.8% 0.0% 0 24.3%
- 0 - - 0 - - 0 - - 0 - - 0 - - 0 -
0.0% 0 19.9% 0.0% 0 20.0% 0.0% 0 20.0% 0.0% 0 21.8% 0.0% 0 23.8% 0.0% 0 24.3%
- 0 - - 0 - - 0 - - 0 - - 0 - - 0 -
0.1% 0 45.7% 0.1% 0 49.0% 0.1% 0 50.5% 0.1% 0 45.7% 0.1% 0 49.0% 0.1% 0 49.2%
0.1% 0 37.3% 0.1% 0 38.5% 0.1% 0 38.5% 0.1% 0 37.3% 0.1% 0 38.5% 0.1% 0 38.5%
0.1% 0 45.7% 0.1% 0 49.1% 0.1% 0 50.5% 0.1% 0 45.7% 0.1% 0 49.1% 0.1% 0 49.2%
- 0 - - 0 - - 0 - - 0 - - 0 - - 0 -
0.0% 0 - 0.0% 0 - 0.0% 0 - 0.0% 0 - 0.0% 0 - 0.0% 0 -
0.1% 5 45.4% 0.1% 9 44.3% 0.1% 13 43.9% 0.1% 6 44.7% 0.1% 12 42.4% 0.1% 19 41.9%
31/12/2016 31/12/2017
Baseline Scenario Adverse Scenario
31/12/2018 31/12/2016 31/12/2017 31/12/2018
31/12/2016 31/12/2017 31/12/2018 31/12/2016 31/12/2017 31/12/2018
Baseline Scenario Adverse Scenario
31/12/2016 31/12/2017
Baseline Scenario Adverse Scenario
31/12/2018 31/12/2016 31/12/2017 31/12/2018
31/12/2016 31/12/2017 31/12/2018 31/12/2016 31/12/2017 31/12/2018
Baseline Scenario Adverse Scenario

2016 EU-wide Stress Test:
Credit risk IRBSvenska Handelsbanken - group
(mln EUR, %)
Central banks and central governments
Institutions
Corporates
Corporates - Of Which: Specialised Lending
Corporates - Of Which: SME
Retail
Retail - Secured on real estate property
Retail - Secured on real estate property - Of Which: SME
Retail - Secured on real estate property - Of Which: non-SME
Retail - Qualifying Revolving
Retail - Other Retail
Retail - Other Retail - Of Which: SME
Retail - Other Retail - Of Which: non-SME
Equity
Securitisation
Other non-credit obligation assets
IRB TOTAL1 Computed as: Stock of provisions for defaulted stock / default stock (as defined in paragraphs 59 and 61 of the Methodological note)
(mln EUR, %)
Central banks and central governments
Institutions
Corporates
Corporates - Of Which: Specialised Lending
Corporates - Of Which: SME
Retail
Retail - Secured on real estate property
Retail - Secured on real estate property - Of Which: SME
Retail - Secured on real estate property - Of Which: non-SME
Retail - Qualifying Revolving
Retail - Other Retail
Retail - Other Retail - Of Which: SME
Retail - Other Retail - Of Which: non-SME
Equity
Securitisation
Other non-credit obligation assets
IRB TOTAL1 Computed as: Stock of provisions for defaulted stock / default stock (as defined in paragraphs 59 and 61 of the Methodological note)
(mln EUR, %)
Central banks and central governments
Institutions
Corporates
Corporates - Of Which: Specialised Lending
Corporates - Of Which: SME
Retail
Retail - Secured on real estate property
Retail - Secured on real estate property - Of Which: SME
Retail - Secured on real estate property - Of Which: non-SME
Retail - Qualifying Revolving
Retail - Other Retail
Retail - Other Retail - Of Which: SME
Retail - Other Retail - Of Which: non-SME
Equity
Securitisation
Other non-credit obligation assets
IRB TOTAL1 Computed as: Stock of provisions for defaulted stock / default stock (as defined in paragraphs 59 and 61 of the Methodological note)
0
0
0
Impairment
rate
Stock of
Provisions
Coverage Ratio -
Default Stock1
Impairment
rate
Stock of
Provisions
Coverage Ratio -
Default Stock1
Impairment
rate
Stock of
Provisions
Coverage Ratio -
Default Stock1
Impairment
rate
Stock of
Provisions
Coverage Ratio -
Default Stock1
Impairment
rate
Stock of
Provisions
Coverage Ratio -
Default Stock1
Impairment
rate
Stock of
Provisions
Coverage Ratio -
Default Stock1
- 0 - - 0 - - 0 - - 0 - - 0 - - 0 -
- 0 - - 0 - - 0 - - 0 - - 0 - - 0 -
- 0 - - 0 - - 0 - - 0 - - 0 - - 0 -
- 0 - - 0 - - 0 - - 0 - - 0 - - 0 -
- 0 - - 0 - - 0 - - 0 - - 0 - - 0 -
- 0 - - 0 - - 0 - - 0 - - 0 - - 0 -
- 0 - - 0 - - 0 - - 0 - - 0 - - 0 -
- 0 - - 0 - - 0 - - 0 - - 0 - - 0 -
- 0 - - 0 - - 0 - - 0 - - 0 - - 0 -
- 0 - - 0 - - 0 - - 0 - - 0 - - 0 -
- 0 - - 0 - - 0 - - 0 - - 0 - - 0 -
- 0 - - 0 - - 0 - - 0 - - 0 - - 0 -
- 0 - - 0 - - 0 - - 0 - - 0 - - 0 -
- 0 - - 0 - - 0 - - 0 - - 0 - - 0 -
- 0 - - 0 - - 0 - - 0 - - 0 - - 0 -
- 0 - - 0 - - 0 - - 0 - - 0 - - 0 -
Impairment
rate
Stock of
Provisions
Coverage Ratio -
Default Stock1
Impairment
rate
Stock of
Provisions
Coverage Ratio -
Default Stock1
Impairment
rate
Stock of
Provisions
Coverage Ratio -
Default Stock1
Impairment
rate
Stock of
Provisions
Coverage Ratio -
Default Stock1
Impairment
rate
Stock of
Provisions
Coverage Ratio -
Default Stock1
Impairment
rate
Stock of
Provisions
Coverage Ratio -
Default Stock1
- 0 - - 0 - - 0 - - 0 - - 0 - - 0 -
- 0 - - 0 - - 0 - - 0 - - 0 - - 0 -
- 0 - - 0 - - 0 - - 0 - - 0 - - 0 -
- 0 - - 0 - - 0 - - 0 - - 0 - - 0 -
- 0 - - 0 - - 0 - - 0 - - 0 - - 0 -
- 0 - - 0 - - 0 - - 0 - - 0 - - 0 -
- 0 - - 0 - - 0 - - 0 - - 0 - - 0 -
- 0 - - 0 - - 0 - - 0 - - 0 - - 0 -
- 0 - - 0 - - 0 - - 0 - - 0 - - 0 -
- 0 - - 0 - - 0 - - 0 - - 0 - - 0 -
- 0 - - 0 - - 0 - - 0 - - 0 - - 0 -
- 0 - - 0 - - 0 - - 0 - - 0 - - 0 -
- 0 - - 0 - - 0 - - 0 - - 0 - - 0 -
- 0 - - 0 - - 0 - - 0 - - 0 - - 0 -
- 0 - - 0 - - 0 - - 0 - - 0 - - 0 -
- 0 - - 0 - - 0 - - 0 - - 0 - - 0 -
Impairment
rate
Stock of
Provisions
Coverage Ratio -
Default Stock1
Impairment
rate
Stock of
Provisions
Coverage Ratio -
Default Stock1
Impairment
rate
Stock of
Provisions
Coverage Ratio -
Default Stock1
Impairment
rate
Stock of
Provisions
Coverage Ratio -
Default Stock1
Impairment
rate
Stock of
Provisions
Coverage Ratio -
Default Stock1
Impairment
rate
Stock of
Provisions
Coverage Ratio -
Default Stock1
- 0 - - 0 - - 0 - - 0 - - 0 - - 0 -
- 0 - - 0 - - 0 - - 0 - - 0 - - 0 -
- 0 - - 0 - - 0 - - 0 - - 0 - - 0 -
- 0 - - 0 - - 0 - - 0 - - 0 - - 0 -
- 0 - - 0 - - 0 - - 0 - - 0 - - 0 -
- 0 - - 0 - - 0 - - 0 - - 0 - - 0 -
- 0 - - 0 - - 0 - - 0 - - 0 - - 0 -
- 0 - - 0 - - 0 - - 0 - - 0 - - 0 -
- 0 - - 0 - - 0 - - 0 - - 0 - - 0 -
- 0 - - 0 - - 0 - - 0 - - 0 - - 0 -
- 0 - - 0 - - 0 - - 0 - - 0 - - 0 -
- 0 - - 0 - - 0 - - 0 - - 0 - - 0 -
- 0 - - 0 - - 0 - - 0 - - 0 - - 0 -
- 0 - - 0 - - 0 - - 0 - - 0 - - 0 -
- 0 - - 0 - - 0 - - 0 - - 0 - - 0 -
- 0 - - 0 - - 0 - - 0 - - 0 - - 0 -
31/12/2016 31/12/2017 31/12/2018 31/12/2016 31/12/2017 31/12/2018
Baseline Scenario Adverse Scenario
31/12/2016 31/12/2017
Baseline Scenario Adverse Scenario
31/12/2018 31/12/2016 31/12/2017 31/12/2018
31/12/2016 31/12/2017 31/12/2018 31/12/2016 31/12/2017 31/12/2018
Baseline Scenario Adverse Scenario

2016 EU-wide Stress Test:
Credit risk STASvenska Handelsbanken - group
Non-defaulted Defaulted Non-defaulted Defaulted Non-defaulted Defaulted
Central governments or central banks 30,335 0 8 0 0 0 0.0%
Regional governments or local authorities 6,374 0 2 0 0 0 0.0%
Public sector entities 0 0 0 0 0 0 0.0%
Multilateral Development Banks 71 0 0 0 0 0 0.0%
International Organisations 0 0 0 0 0 0 0.0%
Institutions 535 0 66 0 0 0 0.0%
Corporates 1,347 12 1,267 13 0 3 23.2%
of which: SME 0 0 0 0 0 0 0.0%
Retail 2,524 17 1,836 14 0 7 38.7%
of which: SME 0 0 0 0 0 0 0.0%
Secured by mortgages on immovable property 7,764 6 2,777 7 0 0 7.3%
of which: SME 1,618 1 617 1 0 0 10.6%
Items associated with particularly high risk 0 0 0 0 0 0 0.0%
Covered bonds 0 0 0 0 0 0 0.0%
Claims on institutions and corporates with a ST credit assessment 0 0 0 0 0 0 0.0%
Collective investments undertakings (CIU) 0 0 0 0 0 0 0.0%
Equity 873 0 1,895 0 0 0 0.0%
Securitisation
Other exposures 989 0 917 0 0 0 0.0%
Standardised Total 50,813 35 8,767 35 1 10 28.4%1 Computed as: Stock of provisions for defaulted stock / default stock (as defined in paragraphs 59 and 61 of the Methodological note)
Non-defaulted Defaulted Non-defaulted Defaulted Non-defaulted Defaulted
Central governments or central banks 3,939 0 0 0 0 0 0.0%
Regional governments or local authorities 4,243 0 0 0 0 0 0.0%
Public sector entities 0 0 0 0 0 0 0.0%
Multilateral Development Banks 0 0 0 0 0 0 0.0%
International Organisations 0 0 0 0 0 0 0.0%
Institutions 14 0 4 0 0 0 0.0%
Corporates 289 0 229 0 0 0 0.0%
of which: SME 0 0 0 0 0 0 0.0%
Retail 215 0 159 0 0 0 53.5%
of which: SME 0 0 0 0 0 0 0.0%
Secured by mortgages on immovable property 175 0 59 0 0 0 0.0%
of which: SME 19 0 5 0 0 0 0.0%
Items associated with particularly high risk 0 0 0 0 0 0 0.0%
Covered bonds 0 0 0 0 0 0 0.0%
Claims on institutions and corporates with a ST credit assessment 0 0 0 0 0 0 0.0%
Collective investments undertakings (CIU) 0 0 0 0 0 0 0.0%
Equity 837 0 1,858 0 0 0 0.0%
Securitisation
Other exposures 735 0 687 0 0 0 0.0%
Standardised Total 10,447 0 2,996 0 0 0 14.4%1 Computed as: Stock of provisions for defaulted stock / default stock (as defined in paragraphs 59 and 61 of the Methodological note)
Non-defaulted Defaulted Non-defaulted Defaulted Non-defaulted Defaulted
Central governments or central banks 944 0 0 0 0 0 0.0%
Regional governments or local authorities 9 0 2 0 0 0 0.0%
Public sector entities 0 0 0 0 0 0 0.0%
Multilateral Development Banks 0 0 0 0 0 0 0.0%
International Organisations 0 0 0 0 0 0 0.0%
Institutions 1 0 1 0 0 0 0.0%
Corporates 93 0 91 0 0 0 0.0%
of which: SME 0 0 0 0 0 0 0.0%
Retail 78 0 58 0 0 0 85.5%
of which: SME 0 0 0 0 0 0 0.0%
Secured by mortgages on immovable property 47 0 16 0 0 0 0.0%
of which: SME 4 0 1 0 0 0 0.0%
Items associated with particularly high risk 0 0 0 0 0 0 0.0%
Covered bonds 0 0 0 0 0 0 0.0%
Claims on institutions and corporates with a ST credit assessment 0 0 0 0 0 0 0.0%
Collective investments undertakings (CIU) 0 0 0 0 0 0 0.0%
Equity 32 0 32 0 0 0 0.0%
Securitisation
Other exposures 29 0 23 0 0 0 0.0%
Standardised Total 1,233 0 223 0 0 0 85.5%1 Computed as: Stock of provisions for defaulted stock / default stock (as defined in paragraphs 59 and 61 of the Methodological note)
Norway
Exposure values Risk exposure amounts Stock of provisionsCoverage Ratio -
Default Stock1
Sweden
31/12/2015
31/12/2015
Exposure values Risk exposure amounts Stock of provisionsCoverage Ratio -
Default Stock1
Svenska Handelsbanken -
group
31/12/2015
Exposure values Risk exposure amounts Stock of provisions
Coverage Ratio -
Default Stock1

2016 EU-wide Stress Test:
Credit risk STASvenska Handelsbanken - group
Non-defaulted Defaulted Non-defaulted Defaulted Non-defaulted Defaulted
Central governments or central banks 6,446 0 0 0 0 0 0.0%
Regional governments or local authorities 2,065 0 0 0 0 0 0.0%
Public sector entities 0 0 0 0 0 0 0.0%
Multilateral Development Banks 6 0 0 0 0 0 0.0%
International Organisations 0 0 0 0 0 0 0.0%
Institutions 0 0 0 0 0 0 0.0%
Corporates 17 0 14 0 0 0 0.0%
of which: SME 0 0 0 0 0 0 0.0%
Retail 44 0 33 0 0 0 41.3%
of which: SME 0 0 0 0 0 0 0.0%
Secured by mortgages on immovable property 3 0 1 0 0 0 0.0%
of which: SME 0 0 0 0 0 0 0.0%
Items associated with particularly high risk 0 0 0 0 0 0 0.0%
Covered bonds 0 0 0 0 0 0 0.0%
Claims on institutions and corporates with a ST credit assessment 0 0 0 0 0 0 0.0%
Collective investments undertakings (CIU) 0 0 0 0 0 0 0.0%
Equity 4 0 4 0 0 0 0.0%
Securitisation
Other exposures 52 0 47 0 0 0 0.0%
Standardised Total 8,637 0 100 0 0 0 41.3%1 Computed as: Stock of provisions for defaulted stock / default stock (as defined in paragraphs 59 and 61 of the Methodological note)
Non-defaulted Defaulted Non-defaulted Defaulted Non-defaulted Defaulted
Central governments or central banks 6,122 0 0 0 0 0 0.0%
Regional governments or local authorities 0 0 0 0 0 0 0.0%
Public sector entities 0 0 0 0 0 0 0.0%
Multilateral Development Banks 0 0 0 0 0 0 0.0%
International Organisations 0 0 0 0 0 0 0.0%
Institutions 384 0 8 0 0 0 0.0%
Corporates 156 0 155 0 0 0 0.0%
of which: SME 0 0 0 0 0 0 0.0%
Retail 1,921 9 1,440 10 0 3 17.8%
of which: SME 0 0 0 0 0 0 0.0%
Secured by mortgages on immovable property 5,077 0 1,783 0 0 0 0.0%
of which: SME 8 0 3 0 0 0 0.0%
Items associated with particularly high risk 0 0 0 0 0 0 0.0%
Covered bonds 0 0 0 0 0 0 0.0%
Claims on institutions and corporates with a ST credit assessment 0 0 0 0 0 0 0.0%
Collective investments undertakings (CIU) 0 0 0 0 0 0 0.0%
Equity 0 0 0 0 0 0 0.0%
Securitisation
Other exposures 35 0 35 0 0 0 0.0%
Standardised Total 13,694 9 3,421 10 0 3 17.8%1 Computed as: Stock of provisions for defaulted stock / default stock (as defined in paragraphs 59 and 61 of the Methodological note)
Non-defaulted Defaulted Non-defaulted Defaulted Non-defaulted Defaulted
Central governments or central banks 1,773 0 0 0 0 0 0.0%
Regional governments or local authorities 0 0 0 0 0 0 0.0%
Public sector entities 0 0 0 0 0 0 0.0%
Multilateral Development Banks 0 0 0 0 0 0 0.0%
International Organisations 0 0 0 0 0 0 0.0%
Institutions 3 0 1 0 0 0 0.0%
Corporates 40 0 40 0 0 0 49.9%
of which: SME 0 0 0 0 0 0 0.0%
Retail 87 2 63 2 0 1 25.3%
of which: SME 0 0 0 0 0 0 0.0%
Secured by mortgages on immovable property 6 0 2 0 0 0 0.0%
of which: SME 1 0 0 0 0 0 0.0%
Items associated with particularly high risk 0 0 0 0 0 0 0.0%
Covered bonds 0 0 0 0 0 0 0.0%
Claims on institutions and corporates with a ST credit assessment 0 0 0 0 0 0 0.0%
Collective investments undertakings (CIU) 0 0 0 0 0 0 0.0%
Equity 0 0 0 0 0 0 0.0%
Securitisation
Other exposures 37 0 24 0 0 0 0.0%
Standardised Total 1,945 2 130 2 0 1 25.5%1 Computed as: Stock of provisions for defaulted stock / default stock (as defined in paragraphs 59 and 61 of the Methodological note)
Denmark
Exposure values Risk exposure amounts Stock of provisionsCoverage Ratio -
Default Stock1
United Kingdom
31/12/2015
Exposure values Risk exposure amounts Stock of provisionsCoverage Ratio -
Default Stock1
Finland
31/12/2015
Exposure values Risk exposure amounts Stock of provisionsCoverage Ratio -
Default Stock1
31/12/2015

2016 EU-wide Stress Test:
Credit risk STASvenska Handelsbanken - group
Non-defaulted Defaulted Non-defaulted Defaulted Non-defaulted Defaulted
Central governments or central banks 41 0 0 0 0 0 0.0%
Regional governments or local authorities 0 0 0 0 0 0 0.0%
Public sector entities 0 0 0 0 0 0 0.0%
Multilateral Development Banks 0 0 0 0 0 0 0.0%
International Organisations 0 0 0 0 0 0 0.0%
Institutions 0 0 0 0 0 0 0.0%
Corporates 12 0 9 0 0 0 0.0%
of which: SME 0 0 0 0 0 0 0.0%
Retail 41 0 27 0 0 0 44.4%
of which: SME 0 0 0 0 0 0 0.0%
Secured by mortgages on immovable property 2,147 0 810 0 0 0 33.6%
of which: SME 1,543 0 596 0 0 0 0.0%
Items associated with particularly high risk 0 0 0 0 0 0 0.0%
Covered bonds 0 0 0 0 0 0 0.0%
Claims on institutions and corporates with a ST credit assessment 0 0 0 0 0 0 0.0%
Collective investments undertakings (CIU) 0 0 0 0 0 0 0.0%
Equity 0 0 0 0 0 0 0.0%
Securitisation
Other exposures 1 0 1 0 0 0 0.0%
Standardised Total 2,241 0 847 0 0 0 36.8%1 Computed as: Stock of provisions for defaulted stock / default stock (as defined in paragraphs 59 and 61 of the Methodological note)
Non-defaulted Defaulted Non-defaulted Defaulted Non-defaulted Defaulted
Central governments or central banks 10,473 0 0 0 0 0 0.0%
Regional governments or local authorities 0 0 0 0 0 0 0.0%
Public sector entities 0 0 0 0 0 0 0.0%
Multilateral Development Banks 0 0 0 0 0 0 0.0%
International Organisations 0 0 0 0 0 0 0.0%
Institutions 55 0 11 0 0 0 0.0%
Corporates 77 0 76 0 0 0 0.0%
of which: SME 0 0 0 0 0 0 0.0%
Retail 4 0 3 0 0 0 0.0%
of which: SME 0 0 0 0 0 0 0.0%
Secured by mortgages on immovable property 4 0 1 0 0 0 0.0%
of which: SME 1 0 0 0 0 0 0.0%
Items associated with particularly high risk 0 0 0 0 0 0 0.0%
Covered bonds 0 0 0 0 0 0 0.0%
Claims on institutions and corporates with a ST credit assessment 0 0 0 0 0 0 0.0%
Collective investments undertakings (CIU) 0 0 0 0 0 0 0.0%
Equity 0 0 0 0 0 0 0.0%
Securitisation
Other exposures 48 0 48 0 0 0 0.0%
Standardised Total 10,660 0 140 0 0 0 0.0%1 Computed as: Stock of provisions for defaulted stock / default stock (as defined in paragraphs 59 and 61 of the Methodological note)
Non-defaulted Defaulted Non-defaulted Defaulted Non-defaulted Defaulted
Central governments or central banks 0 0 0 0 0 0 0.0%
Regional governments or local authorities 0 0 0 0 0 0 0.0%
Public sector entities 0 0 0 0 0 0 0.0%
Multilateral Development Banks 0 0 0 0 0 0 0.0%
International Organisations 0 0 0 0 0 0 0.0%
Institutions 0 0 0 0 0 0 0.0%
Corporates 0 0 0 0 0 0 0.0%
of which: SME 0 0 0 0 0 0 0.0%
Retail 0 0 0 0 0 0 0.0%
of which: SME 0 0 0 0 0 0 0.0%
Secured by mortgages on immovable property 0 0 0 0 0 0 0.0%
of which: SME 0 0 0 0 0 0 0.0%
Items associated with particularly high risk 0 0 0 0 0 0 0.0%
Covered bonds 0 0 0 0 0 0 0.0%
Claims on institutions and corporates with a ST credit assessment 0 0 0 0 0 0 0.0%
Collective investments undertakings (CIU) 0 0 0 0 0 0 0.0%
Equity 0 0 0 0 0 0 0.0%
Securitisation
Other exposures 0 0 0 0 0 0 0.0%
Standardised Total 0 0 0 0 0 0 0.0%1 Computed as: Stock of provisions for defaulted stock / default stock (as defined in paragraphs 59 and 61 of the Methodological note)
0
Exposure values Risk exposure amounts Stock of provisionsCoverage Ratio -
Default Stock1
United States
31/12/2015
Exposure values Risk exposure amounts Stock of provisionsCoverage Ratio -
Default Stock1
Netherlands
31/12/2015
Exposure values Risk exposure amounts Stock of provisionsCoverage Ratio -
Default Stock1
31/12/2015

2016 EU-wide Stress Test:
Credit risk STASvenska Handelsbanken - group
Non-defaulted Defaulted Non-defaulted Defaulted Non-defaulted Defaulted
Central governments or central banks 0 0 0 0 0 0 0.0%
Regional governments or local authorities 0 0 0 0 0 0 0.0%
Public sector entities 0 0 0 0 0 0 0.0%
Multilateral Development Banks 0 0 0 0 0 0 0.0%
International Organisations 0 0 0 0 0 0 0.0%
Institutions 0 0 0 0 0 0 0.0%
Corporates 0 0 0 0 0 0 0.0%
of which: SME 0 0 0 0 0 0 0.0%
Retail 0 0 0 0 0 0 0.0%
of which: SME 0 0 0 0 0 0 0.0%
Secured by mortgages on immovable property 0 0 0 0 0 0 0.0%
of which: SME 0 0 0 0 0 0 0.0%
Items associated with particularly high risk 0 0 0 0 0 0 0.0%
Covered bonds 0 0 0 0 0 0 0.0%
Claims on institutions and corporates with a ST credit assessment 0 0 0 0 0 0 0.0%
Collective investments undertakings (CIU) 0 0 0 0 0 0 0.0%
Equity 0 0 0 0 0 0 0.0%
Securitisation
Other exposures 0 0 0 0 0 0 0.0%
Standardised Total 0 0 0 0 0 0 0.0%1 Computed as: Stock of provisions for defaulted stock / default stock (as defined in paragraphs 59 and 61 of the Methodological note)
0
Exposure values Risk exposure amounts Stock of provisionsCoverage Ratio -
Default Stock1
0
31/12/2015
Exposure values Risk exposure amounts Stock of provisionsCoverage Ratio -
Default Stock1
31/12/2015
2016 EU-wide Stress Test:
Credit risk STASvenska Handelsbanken - group
Central governments or central banks
Regional governments or local authorities
Public sector entities
Multilateral Development Banks
International Organisations
Institutions
Corporates
of which: SME
Retail
of which: SME
Secured by mortgages on immovable property
of which: SME
Items associated with particularly high risk
Covered bonds
Claims on institutions and corporates with a ST credit assessment
Collective investments undertakings (CIU)
Equity
Securitisation
Other exposures
Standardised Total1 Computed as: Stock of provisions for defaulted stock / default stock (as defined in paragraphs 59 and 61 of the Methodological note)
Norway
Sweden
Svenska Handelsbanken -
group
Impairment
rate
Stock of
Provisions
Coverage Ratio -
Default Stock1
Impairment
rate
Stock of
Provisions
Coverage Ratio -
Default Stock1
Impairment
rate
Stock of
Provisions
Coverage Ratio -
Default Stock1
Impairment
rate
Stock of
Provisions
Coverage Ratio -
Default Stock1
Impairment
rate
Stock of
Provisions
Coverage Ratio -
Default Stock1
Impairment
rate
Stock of
Provisions
Coverage Ratio -
Default Stock1
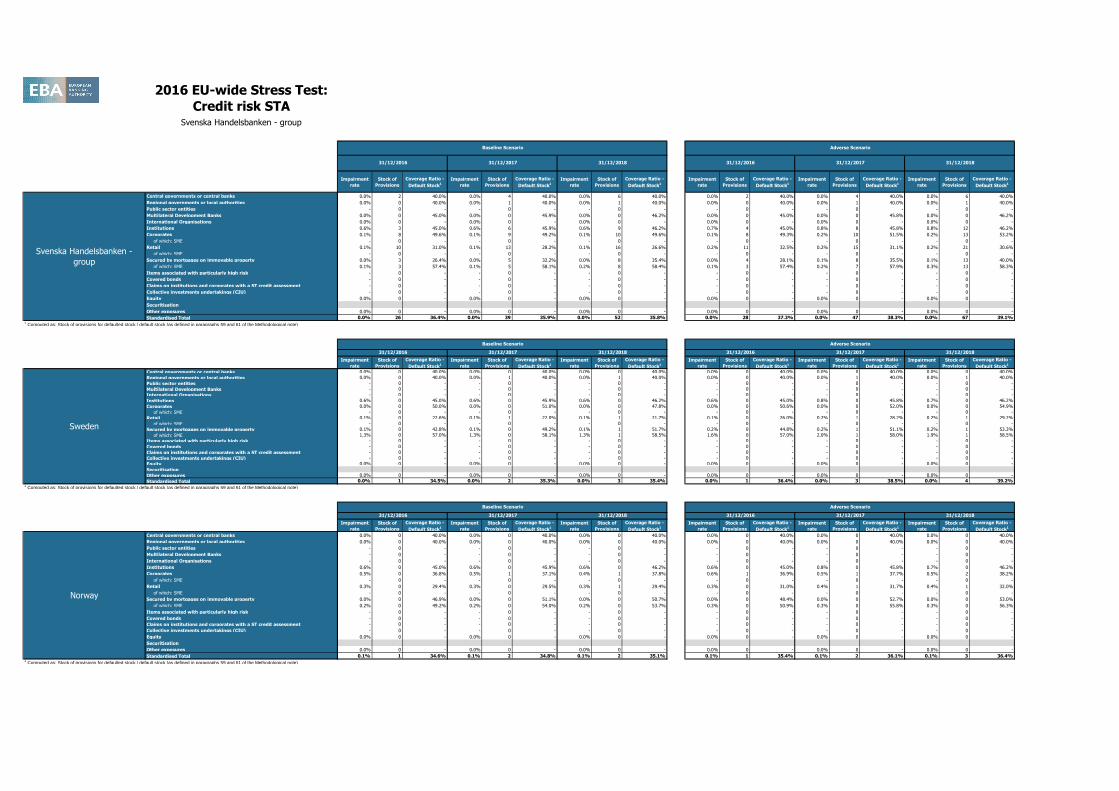
0.0% 2 40.0% 0.0% 4 40.0% 0.0% 6 40.0% 0.0% 2 40.0% 0.0% 4 40.0% 0.0% 6 40.0%
0.0% 0 40.0% 0.0% 1 40.0% 0.0% 1 40.0% 0.0% 0 40.0% 0.0% 1 40.0% 0.0% 1 40.0%
- 0 - - 0 - - 0 - - 0 - - 0 - - 0 -
0.0% 0 45.0% 0.0% 0 45.9% 0.0% 0 46.2% 0.0% 0 45.0% 0.0% 0 45.8% 0.0% 0 46.2%
0.0% 0 - 0.0% 0 - 0.0% 0 - 0.0% 0 - 0.0% 0 - 0.0% 0 -
0.6% 3 45.0% 0.6% 6 45.9% 0.6% 9 46.2% 0.7% 4 45.0% 0.8% 8 45.8% 0.8% 12 46.2%
0.1% 8 49.6% 0.1% 9 49.2% 0.1% 10 49.6% 0.1% 8 49.3% 0.2% 10 51.5% 0.2% 13 53.2%
- 0 - - 0 - - 0 - - 0 - - 0 - - 0 -
0.1% 10 31.0% 0.1% 13 28.2% 0.1% 16 26.6% 0.2% 11 32.5% 0.2% 15 31.1% 0.2% 21 30.6%
- 0 - - 0 - - 0 - - 0 - - 0 - - 0 -
0.0% 3 26.4% 0.0% 5 32.2% 0.0% 8 35.4% 0.0% 4 28.1% 0.1% 8 35.5% 0.1% 13 40.0%
0.1% 3 57.4% 0.1% 5 58.1% 0.2% 8 58.4% 0.1% 3 57.4% 0.2% 7 57.9% 0.3% 13 58.3%
- 0 - - 0 - - 0 - - 0 - - 0 - - 0 -
- 0 - - 0 - - 0 - - 0 - - 0 - - 0 -
- 0 - - 0 - - 0 - - 0 - - 0 - - 0 -
- 0 - - 0 - - 0 - - 0 - - 0 - - 0 -
0.0% 0 - 0.0% 0 - 0.0% 0 - 0.0% 0 - 0.0% 0 - 0.0% 0 -
0.0% 0 - 0.0% 0 - 0.0% 0 - 0.0% 0 - 0.0% 0 - 0.0% 0 -
0.0% 26 36.4% 0.0% 39 35.9% 0.0% 52 35.8% 0.0% 28 37.3% 0.0% 47 38.3% 0.0% 67 39.1%
Impairment
rate
Stock of
Provisions
Coverage Ratio -
Default Stock1
Impairment
rate
Stock of
Provisions
Coverage Ratio -
Default Stock1
Impairment
rate
Stock of
Provisions
Coverage Ratio -
Default Stock1
Impairment
rate
Stock of
Provisions
Coverage Ratio -
Default Stock1
Impairment
rate
Stock of
Provisions
Coverage Ratio -
Default Stock1
Impairment
rate
Stock of
Provisions
Coverage Ratio -
Default Stock1
0.0% 0 40.0% 0.0% 0 40.0% 0.0% 0 40.0% 0.0% 0 40.0% 0.0% 0 40.0% 0.0% 0 40.0%
0.0% 0 40.0% 0.0% 1 40.0% 0.0% 1 40.0% 0.0% 0 40.0% 0.0% 1 40.0% 0.0% 1 40.0%
- 0 - - 0 - - 0 - - 0 - - 0 - - 0 -
- 0 - - 0 - - 0 - - 0 - - 0 - - 0 -
- 0 - - 0 - - 0 - - 0 - - 0 - - 0 -
0.6% 0 45.0% 0.6% 0 45.9% 0.6% 0 46.2% 0.6% 0 45.0% 0.8% 0 45.8% 0.7% 0 46.2%
0.0% 0 50.0% 0.0% 0 51.0% 0.0% 0 47.8% 0.0% 0 50.6% 0.0% 0 52.0% 0.0% 0 54.9%
- 0 - - 0 - - 0 - - 0 - - 0 - - 0 -
0.1% 0 22.6% 0.1% 1 22.0% 0.1% 1 21.7% 0.1% 0 26.0% 0.2% 1 28.2% 0.2% 1 29.2%
- 0 - - 0 - - 0 - - 0 - - 0 - - 0 -
0.1% 0 42.8% 0.1% 0 49.2% 0.1% 1 51.7% 0.2% 0 44.8% 0.2% 1 51.1% 0.2% 1 53.3%
1.3% 0 57.0% 1.3% 0 58.1% 1.3% 1 58.5% 1.6% 0 57.0% 2.0% 1 58.0% 1.9% 1 58.5%
- 0 - - 0 - - 0 - - 0 - - 0 - - 0 -
- 0 - - 0 - - 0 - - 0 - - 0 - - 0 -
- 0 - - 0 - - 0 - - 0 - - 0 - - 0 -
- 0 - - 0 - - 0 - - 0 - - 0 - - 0 -
0.0% 0 - 0.0% 0 - 0.0% 0 - 0.0% 0 - 0.0% 0 - 0.0% 0 -
0.0% 0 - 0.0% 0 - 0.0% 0 - 0.0% 0 - 0.0% 0 - 0.0% 0 -0.0% 1 34.5% 0.0% 2 35.3% 0.0% 3 35.4% 0.0% 1 36.4% 0.0% 3 38.5% 0.0% 4 39.2%
Impairment
rate
Stock of
Provisions
Coverage Ratio -
Default Stock1
Impairment
rate
Stock of
Provisions
Coverage Ratio -
Default Stock1
Impairment
rate
Stock of
Provisions
Coverage Ratio -
Default Stock1
Impairment
rate
Stock of
Provisions
Coverage Ratio -
Default Stock1
Impairment
rate
Stock of
Provisions
Coverage Ratio -
Default Stock1
Impairment
rate
Stock of
Provisions
Coverage Ratio -
Default Stock1
0.0% 0 40.0% 0.0% 0 40.0% 0.0% 0 40.0% 0.0% 0 40.0% 0.0% 0 40.0% 0.0% 0 40.0%
0.0% 0 40.0% 0.0% 0 40.0% 0.0% 0 40.0% 0.0% 0 40.0% 0.0% 0 40.0% 0.0% 0 40.0%
- 0 - - 0 - - 0 - - 0 - - 0 - - 0 -
- 0 - - 0 - - 0 - - 0 - - 0 - - 0 -
- 0 - - 0 - - 0 - - 0 - - 0 - - 0 -
0.6% 0 45.0% 0.6% 0 45.9% 0.6% 0 46.2% 0.6% 0 45.0% 0.8% 0 45.8% 0.7% 0 46.2%
0.5% 0 36.8% 0.5% 1 37.1% 0.4% 1 37.8% 0.6% 1 36.9% 0.5% 1 37.7% 0.5% 2 38.2%
- 0 - - 0 - - 0 - - 0 - - 0 - - 0 -
0.3% 0 29.4% 0.3% 0 29.5% 0.3% 1 29.4% 0.3% 0 31.0% 0.4% 1 31.7% 0.4% 1 32.0%
- 0 - - 0 - - 0 - - 0 - - 0 - - 0 -
0.0% 0 46.9% 0.0% 0 51.1% 0.0% 0 50.7% 0.0% 0 48.4% 0.0% 0 52.7% 0.0% 0 53.0%
0.2% 0 49.2% 0.2% 0 54.0% 0.2% 0 53.7% 0.3% 0 50.9% 0.3% 0 55.8% 0.3% 0 56.3%
- 0 - - 0 - - 0 - - 0 - - 0 - - 0 -
- 0 - - 0 - - 0 - - 0 - - 0 - - 0 -
- 0 - - 0 - - 0 - - 0 - - 0 - - 0 -
- 0 - - 0 - - 0 - - 0 - - 0 - - 0 -
0.0% 0 - 0.0% 0 - 0.0% 0 - 0.0% 0 - 0.0% 0 - 0.0% 0 -
0.0% 0 - 0.0% 0 - 0.0% 0 - 0.0% 0 - 0.0% 0 - 0.0% 0 -
0.1% 1 34.6% 0.1% 2 34.8% 0.1% 2 35.1% 0.1% 1 35.4% 0.1% 2 36.1% 0.1% 3 36.4%
31/12/2018 31/12/2016 31/12/2017 31/12/201831/12/2016 31/12/2017
Baseline Scenario Adverse Scenario
Baseline Scenario Adverse Scenario
31/12/2016 31/12/2017 31/12/2018
31/12/2018
31/12/2016 31/12/2017 31/12/2018
Baseline Scenario Adverse Scenario
31/12/2016 31/12/2017 31/12/2018 31/12/2016 31/12/2017

2016 EU-wide Stress Test:
Credit risk STASvenska Handelsbanken - group
Central governments or central banks
Regional governments or local authorities
Public sector entities
Multilateral Development Banks
International Organisations
Institutions
Corporates
of which: SME
Retail
of which: SME
Secured by mortgages on immovable property
of which: SME
Items associated with particularly high risk
Covered bonds
Claims on institutions and corporates with a ST credit assessment
Collective investments undertakings (CIU)
Equity
Securitisation
Other exposures
Standardised Total1 Computed as: Stock of provisions for defaulted stock / default stock (as defined in paragraphs 59 and 61 of the Methodological note)
Central governments or central banks
Regional governments or local authorities
Public sector entities
Multilateral Development Banks
International Organisations
Institutions
Corporates
of which: SME
Retail
of which: SME
Secured by mortgages on immovable property
of which: SME
Items associated with particularly high risk
Covered bonds
Claims on institutions and corporates with a ST credit assessment
Collective investments undertakings (CIU)
Equity
Securitisation
Other exposures
Standardised Total1 Computed as: Stock of provisions for defaulted stock / default stock (as defined in paragraphs 59 and 61 of the Methodological note)
Central governments or central banks
Regional governments or local authorities
Public sector entities
Multilateral Development Banks
International Organisations
Institutions
Corporates
of which: SME
Retail
of which: SME
Secured by mortgages on immovable property
of which: SME
Items associated with particularly high risk
Covered bonds
Claims on institutions and corporates with a ST credit assessment
Collective investments undertakings (CIU)
Equity
Securitisation
Other exposures
Standardised Total1 Computed as: Stock of provisions for defaulted stock / default stock (as defined in paragraphs 59 and 61 of the Methodological note)
Denmark
United Kingdom
Finland
Impairment
rate
Stock of
Provisions
Coverage Ratio -
Default Stock1
Impairment
rate
Stock of
Provisions
Coverage Ratio -
Default Stock1
Impairment
rate
Stock of
Provisions
Coverage Ratio -
Default Stock1
Impairment
rate
Stock of
Provisions
Coverage Ratio -
Default Stock1
Impairment
rate
Stock of
Provisions
Coverage Ratio -
Default Stock1
Impairment
rate
Stock of
Provisions
Coverage Ratio -
Default Stock1
0.0% 0 40.0% 0.0% 1 40.0% 0.0% 1 40.0% 0.0% 1 40.0% 0.0% 1 40.0% 0.0% 2 40.0%
0.0% 0 40.0% 0.0% 0 40.0% 0.0% 0 40.0% 0.0% 0 40.0% 0.0% 1 40.0% 0.0% 1 40.0%
- 0 - - 0 - - 0 - - 0 - - 0 - - 0 -
0.0% 0 - 0.0% 0 - 0.0% 0 - 0.0% 0 - 0.0% 0 - 0.0% 0 -
- 0 - - 0 - - 0 - - 0 - - 0 - - 0 -
0.6% 0 45.0% 0.6% 0 45.9% 0.6% 0 46.2% 0.6% 0 45.0% 0.8% 0 45.8% 0.7% 0 46.2%
0.2% 0 55.0% 0.2% 0 56.1% 0.2% 0 56.4% 0.2% 0 55.2% 0.2% 0 56.2% 0.2% 0 56.6%
- 0 - - 0 - - 0 - - 0 - - 0 - - 0 -
0.1% 0 28.1% 0.1% 0 25.4% 0.1% 0 24.2% 0.1% 0 30.3% 0.2% 0 29.4% 0.2% 0 29.3%
- 0 - - 0 - - 0 - - 0 - - 0 - - 0 -
0.0% 0 0.0% 0.0% 0 0.0% 0.0% 0 0.0% 0.0% 0 0.0% 0.0% 0 0.0% 0.0% 0 0.0%
- 0 - - 0 - - 0 - - 0 - - 0 - - 0 -
- 0 - - 0 - - 0 - - 0 - - 0 - - 0 -
- 0 - - 0 - - 0 - - 0 - - 0 - - 0 -
- 0 - - 0 - - 0 - - 0 - - 0 - - 0 -
- 0 - - 0 - - 0 - - 0 - - 0 - - 0 -
0.0% 0 - 0.0% 0 - 0.0% 0 - 0.0% 0 - 0.0% 0 - 0.0% 0 -
0.0% 0 - 0.0% 0 - 0.0% 0 - 0.0% 0 - 0.0% 0 - 0.0% 0 -
0.0% 1 38.2% 0.0% 2 38.2% 0.0% 2 38.1% 0.0% 1 39.1% 0.0% 2 39.2% 0.0% 3 39.2%
Impairment
rate
Stock of
Provisions
Coverage Ratio -
Default Stock1
Impairment
rate
Stock of
Provisions
Coverage Ratio -
Default Stock1
Impairment
rate
Stock of
Provisions
Coverage Ratio -
Default Stock1
Impairment
rate
Stock of
Provisions
Coverage Ratio -
Default Stock1
Impairment
rate
Stock of
Provisions
Coverage Ratio -
Default Stock1
Impairment
rate
Stock of
Provisions
Coverage Ratio -
Default Stock1
0.0% 0 40.0% 0.0% 1 40.0% 0.0% 1 40.0% 0.0% 0 40.0% 0.0% 1 40.0% 0.0% 1 40.0%
- 0 - - 0 - - 0 - - 0 - - 0 - - 0 -
- 0 - - 0 - - 0 - - 0 - - 0 - - 0 -
- 0 - - 0 - - 0 - - 0 - - 0 - - 0 -
- 0 - - 0 - - 0 - - 0 - - 0 - - 0 -
0.6% 2 45.0% 0.6% 5 45.9% 0.6% 7 46.2% 0.8% 3 45.0% 0.9% 7 45.8% 0.9% 10 46.2%
0.0% 0 13.9% 0.0% 0 14.1% 0.0% 0 14.2% 0.0% 0 13.9% 0.0% 0 14.1% 0.0% 0 14.2%
- 0 - - 0 - - 0 - - 0 - - 0 - - 0 -
0.1% 4 21.4% 0.1% 7 21.4% 0.1% 9 21.3% 0.1% 5 24.9% 0.2% 9 28.2% 0.2% 14 29.2%
- 0 - - 0 - - 0 - - 0 - - 0 - - 0 -
0.0% 0 0.0% 0.0% 0 0.0% 0.0% 0 0.0% 0.0% 0 0.0% 0.0% 0 0.0% 0.0% 0 0.0%
0.0% 0 - 0.0% 0 - 0.0% 0 - 0.0% 0 - 0.0% 0 - 0.0% 0 -
- 0 - - 0 - - 0 - - 0 - - 0 - - 0 -
- 0 - - 0 - - 0 - - 0 - - 0 - - 0 -
- 0 - - 0 - - 0 - - 0 - - 0 - - 0 -
- 0 - - 0 - - 0 - - 0 - - 0 - - 0 -
- 0 - - 0 - - 0 - - 0 - - 0 - - 0 -
0.0% 0 - 0.0% 0 - 0.0% 0 - 0.0% 0 - 0.0% 0 - 0.0% 0 -
0.0% 7 25.7% 0.0% 13 26.7% 0.0% 18 27.0% 0.0% 9 28.5% 0.1% 17 31.5% 0.1% 25 32.3%
Impairment
rate
Stock of
Provisions
Coverage Ratio -
Default Stock1
Impairment
rate
Stock of
Provisions
Coverage Ratio -
Default Stock1
Impairment
rate
Stock of
Provisions
Coverage Ratio -
Default Stock1
Impairment
rate
Stock of
Provisions
Coverage Ratio -
Default Stock1
Impairment
rate
Stock of
Provisions
Coverage Ratio -
Default Stock1
Impairment
rate
Stock of
Provisions
Coverage Ratio -
Default Stock1
0.0% 0 40.0% 0.0% 0 40.0% 0.0% 0 40.0% 0.0% 0 40.0% 0.0% 0 40.0% 0.0% 0 40.0%
0.0% 0 40.0% 0.0% 0 40.0% 0.0% 0 40.0% 0.0% 0 40.0% 0.0% 0 40.0% 0.0% 0 40.0%
- 0 - - 0 - - 0 - - 0 - - 0 - - 0 -
- 0 - - 0 - - 0 - - 0 - - 0 - - 0 -
- 0 - - 0 - - 0 - - 0 - - 0 - - 0 -
0.0% 0 - 0.0% 0 - 0.0% 0 - 0.0% 0 - 0.0% 0 - 0.0% 0 -
0.0% 0 57.8% 0.0% 0 58.2% 0.0% 0 58.4% 0.0% 0 57.6% 0.0% 0 58.1% 0.1% 0 57.9%
- 0 - - 0 - - 0 - - 0 - - 0 - - 0 -
0.1% 1 24.4% 0.1% 1 23.9% 0.1% 1 23.5% 0.1% 1 25.2% 0.2% 1 28.2% 0.2% 1 29.2%
- 0 - - 0 - - 0 - - 0 - - 0 - - 0 -
0.0% 0 55.5% 0.0% 0 56.4% 0.0% 0 55.9% 0.0% 0 55.4% 0.0% 0 56.4% 0.0% 0 56.8%
0.1% 0 57.0% 0.0% 0 58.8% 0.0% 0 58.9% 0.1% 0 57.0% 0.1% 0 58.1% 0.1% 0 58.5%
- 0 - - 0 - - 0 - - 0 - - 0 - - 0 -
- 0 - - 0 - - 0 - - 0 - - 0 - - 0 -
- 0 - - 0 - - 0 - - 0 - - 0 - - 0 -
- 0 - - 0 - - 0 - - 0 - - 0 - - 0 -
0.0% 0 - 0.0% 0 - 0.0% 0 - 0.0% 0 - 0.0% 0 - 0.0% 0 -
0.0% 0 - 0.0% 0 - 0.0% 0 - 0.0% 0 - 0.0% 0 - 0.0% 0 -
0.0% 1 26.9% 0.0% 1 27.6% 0.0% 1 28.0% 0.0% 1 27.7% 0.0% 1 31.1% 0.0% 2 32.6%
31/12/2018 31/12/2016 31/12/2017 31/12/201831/12/2016 31/12/2017
31/12/2018 31/12/2016 31/12/2017 31/12/2018
Baseline Scenario Adverse Scenario
31/12/2016 31/12/2017
31/12/2018 31/12/2016 31/12/2017 31/12/2018
Baseline Scenario Adverse Scenario
31/12/2016 31/12/2017
Baseline Scenario Adverse Scenario

2016 EU-wide Stress Test:
Credit risk STASvenska Handelsbanken - group
Central governments or central banks
Regional governments or local authorities
Public sector entities
Multilateral Development Banks
International Organisations
Institutions
Corporates
of which: SME
Retail
of which: SME
Secured by mortgages on immovable property
of which: SME
Items associated with particularly high risk
Covered bonds
Claims on institutions and corporates with a ST credit assessment
Collective investments undertakings (CIU)
Equity
Securitisation
Other exposures
Standardised Total1 Computed as: Stock of provisions for defaulted stock / default stock (as defined in paragraphs 59 and 61 of the Methodological note)
Central governments or central banks
Regional governments or local authorities
Public sector entities
Multilateral Development Banks
International Organisations
Institutions
Corporates
of which: SME
Retail
of which: SME
Secured by mortgages on immovable property
of which: SME
Items associated with particularly high risk
Covered bonds
Claims on institutions and corporates with a ST credit assessment
Collective investments undertakings (CIU)
Equity
Securitisation
Other exposures
Standardised Total1 Computed as: Stock of provisions for defaulted stock / default stock (as defined in paragraphs 59 and 61 of the Methodological note)
Central governments or central banks
Regional governments or local authorities
Public sector entities
Multilateral Development Banks
International Organisations
Institutions
Corporates
of which: SME
Retail
of which: SME
Secured by mortgages on immovable property
of which: SME
Items associated with particularly high risk
Covered bonds
Claims on institutions and corporates with a ST credit assessment
Collective investments undertakings (CIU)
Equity
Securitisation
Other exposures
Standardised Total1 Computed as: Stock of provisions for defaulted stock / default stock (as defined in paragraphs 59 and 61 of the Methodological note)
0
United States
Netherlands
Impairment
rate
Stock of
Provisions
Coverage Ratio -
Default Stock1
Impairment
rate
Stock of
Provisions
Coverage Ratio -
Default Stock1
Impairment
rate
Stock of
Provisions
Coverage Ratio -
Default Stock1
Impairment
rate
Stock of
Provisions
Coverage Ratio -
Default Stock1
Impairment
rate
Stock of
Provisions
Coverage Ratio -
Default Stock1
Impairment
rate
Stock of
Provisions
Coverage Ratio -
Default Stock1
0.0% 0 40.0% 0.0% 0 40.0% 0.0% 0 40.0% 0.0% 0 40.0% 0.0% 0 40.0% 0.0% 0 40.0%
- 0 - - 0 - - 0 - - 0 - - 0 - - 0 -
- 0 - - 0 - - 0 - - 0 - - 0 - - 0 -
- 0 - - 0 - - 0 - - 0 - - 0 - - 0 -
- 0 - - 0 - - 0 - - 0 - - 0 - - 0 -
0.0% 0 - 0.0% 0 - 0.0% 0 - 0.0% 0 - 0.0% 0 - 0.0% 0 -
0.1% 0 57.0% 0.1% 0 58.1% 0.1% 0 58.5% 0.1% 0 57.0% 0.1% 0 58.1% 0.1% 0 58.5%
- 0 - - 0 - - 0 - - 0 - - 0 - - 0 -
0.1% 0 27.4% 0.1% 0 24.8% 0.1% 0 23.8% 0.1% 0 29.9% 0.2% 0 29.1% 0.2% 0 29.2%
- 0 - - 0 - - 0 - - 0 - - 0 - - 0 -
0.1% 2 55.5% 0.1% 4 57.2% 0.1% 6 57.9% 0.1% 2 55.7% 0.2% 6 57.3% 0.2% 11 57.9%
0.1% 2 57.0% 0.1% 4 58.0% 0.1% 6 58.4% 0.1% 2 57.0% 0.2% 6 57.8% 0.3% 10 58.2%
- 0 - - 0 - - 0 - - 0 - - 0 - - 0 -
- 0 - - 0 - - 0 - - 0 - - 0 - - 0 -
- 0 - - 0 - - 0 - - 0 - - 0 - - 0 -
- 0 - - 0 - - 0 - - 0 - - 0 - - 0 -
- 0 - - 0 - - 0 - - 0 - - 0 - - 0 -
0.0% 0 - 0.0% 0 - 0.0% 0 - 0.0% 0 - 0.0% 0 - 0.0% 0 -
0.1% 2 52.8% 0.1% 4 54.8% 0.1% 6 55.6% 0.1% 2 53.7% 0.2% 6 55.7% 0.2% 11 56.5%
Impairment
rate
Stock of
Provisions
Coverage Ratio -
Default Stock1
Impairment
rate
Stock of
Provisions
Coverage Ratio -
Default Stock1
Impairment
rate
Stock of
Provisions
Coverage Ratio -
Default Stock1
Impairment
rate
Stock of
Provisions
Coverage Ratio -
Default Stock1
Impairment
rate
Stock of
Provisions
Coverage Ratio -
Default Stock1
Impairment
rate
Stock of
Provisions
Coverage Ratio -
Default Stock1
0.0% 1 40.0% 0.0% 2 40.0% 0.0% 2 40.0% 0.0% 1 40.0% 0.0% 2 40.0% 0.0% 2 40.0%
- 0 - - 0 - - 0 - - 0 - - 0 - - 0 -
- 0 - - 0 - - 0 - - 0 - - 0 - - 0 -
0.0% 0 - 0.0% 0 - 0.0% 0 - 0.0% 0 - 0.0% 0 - 0.0% 0 -
- 0 - - 0 - - 0 - - 0 - - 0 - - 0 -
0.0% 0 - 0.0% 0 - 0.0% 0 - 0.0% 0 - 0.0% 0 - 0.0% 0 -
0.0% 0 57.0% 0.0% 0 58.1% 0.0% 0 58.6% 0.0% 0 57.0% 0.0% 0 58.1% 0.0% 0 58.5%
- 0 - - 0 - - 0 - - 0 - - 0 - - 0 -
0.1% 0 21.4% 0.1% 0 21.4% 0.1% 0 21.3% 0.1% 0 24.9% 0.2% 0 28.2% 0.2% 0 29.2%
- 0 - - 0 - - 0 - - 0 - - 0 - - 0 -
0.0% 0 43.9% 0.0% 0 44.8% 0.0% 0 45.1% 0.0% 0 43.3% 0.1% 0 43.7% 0.1% 0 43.9%
0.2% 0 57.0% 0.2% 0 58.1% 0.2% 0 58.5% 0.2% 0 57.0% 0.2% 0 58.1% 0.2% 0 58.5%
- 0 - - 0 - - 0 - - 0 - - 0 - - 0 -
- 0 - - 0 - - 0 - - 0 - - 0 - - 0 -
- 0 - - 0 - - 0 - - 0 - - 0 - - 0 -
- 0 - - 0 - - 0 - - 0 - - 0 - - 0 -
- 0 - - 0 - - 0 - - 0 - - 0 - - 0 -
0.0% 0 - 0.0% 0 - 0.0% 0 - 0.0% 0 - 0.0% 0 - 0.0% 0 -
0.0% 1 40.1% 0.0% 2 40.1% 0.0% 3 40.1% 0.0% 1 40.1% 0.0% 2 40.2% 0.0% 3 40.2%
Impairment
rate
Stock of
Provisions
Coverage Ratio -
Default Stock1
Impairment
rate
Stock of
Provisions
Coverage Ratio -
Default Stock1
Impairment
rate
Stock of
Provisions
Coverage Ratio -
Default Stock1
Impairment
rate
Stock of
Provisions
Coverage Ratio -
Default Stock1
Impairment
rate
Stock of
Provisions
Coverage Ratio -
Default Stock1
Impairment
rate
Stock of
Provisions
Coverage Ratio -
Default Stock1
- 0 - - 0 - - 0 - - 0 - - 0 - - 0 -
- 0 - - 0 - - 0 - - 0 - - 0 - - 0 -
- 0 - - 0 - - 0 - - 0 - - 0 - - 0 -
- 0 - - 0 - - 0 - - 0 - - 0 - - 0 -
- 0 - - 0 - - 0 - - 0 - - 0 - - 0 -
- 0 - - 0 - - 0 - - 0 - - 0 - - 0 -
- 0 - - 0 - - 0 - - 0 - - 0 - - 0 -
- 0 - - 0 - - 0 - - 0 - - 0 - - 0 -
- 0 - - 0 - - 0 - - 0 - - 0 - - 0 -
- 0 - - 0 - - 0 - - 0 - - 0 - - 0 -
- 0 - - 0 - - 0 - - 0 - - 0 - - 0 -
- 0 - - 0 - - 0 - - 0 - - 0 - - 0 -
- 0 - - 0 - - 0 - - 0 - - 0 - - 0 -
- 0 - - 0 - - 0 - - 0 - - 0 - - 0 -
- 0 - - 0 - - 0 - - 0 - - 0 - - 0 -
- 0 - - 0 - - 0 - - 0 - - 0 - - 0 -
- 0 - - 0 - - 0 - - 0 - - 0 - - 0 -
- 0 - - 0 - - 0 - - 0 - - 0 - - 0 -
- 0 - - 0 - - 0 - - 0 - - 0 - - 0 -
31/12/2018 31/12/2016 31/12/2017 31/12/201831/12/2016 31/12/2017
31/12/2018 31/12/2016 31/12/2017 31/12/2018
Baseline Scenario Adverse Scenario
31/12/2016 31/12/2017
31/12/2018 31/12/2016 31/12/2017 31/12/2018
Baseline Scenario Adverse Scenario
31/12/2016 31/12/2017
Baseline Scenario Adverse Scenario
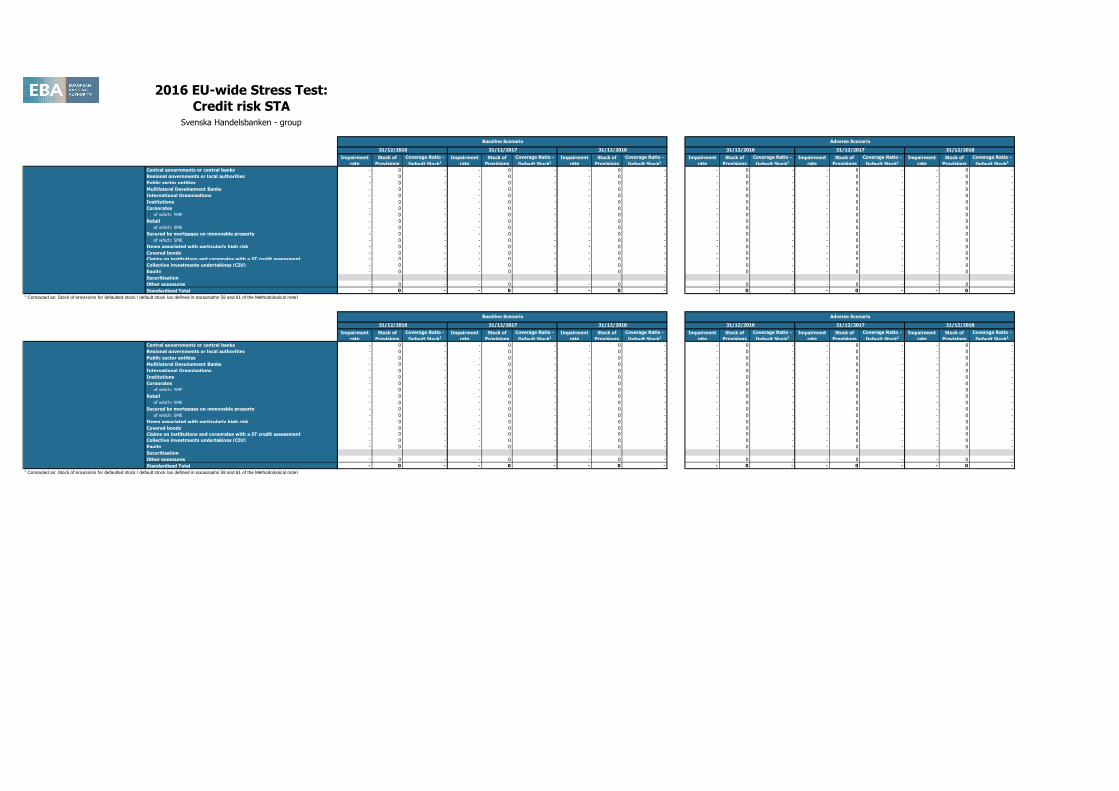
2016 EU-wide Stress Test:
Credit risk STASvenska Handelsbanken - group
Central governments or central banks
Regional governments or local authorities
Public sector entities
Multilateral Development Banks
International Organisations
Institutions
Corporates
of which: SME
Retail
of which: SME
Secured by mortgages on immovable property
of which: SME
Items associated with particularly high risk
Covered bonds
Claims on institutions and corporates with a ST credit assessment
Collective investments undertakings (CIU)
Equity
Securitisation
Other exposures
Standardised Total1 Computed as: Stock of provisions for defaulted stock / default stock (as defined in paragraphs 59 and 61 of the Methodological note)
Central governments or central banks
Regional governments or local authorities
Public sector entities
Multilateral Development Banks
International Organisations
Institutions
Corporates
of which: SME
Retail
of which: SME
Secured by mortgages on immovable property
of which: SME
Items associated with particularly high risk
Covered bonds
Claims on institutions and corporates with a ST credit assessment
Collective investments undertakings (CIU)
Equity
Securitisation
Other exposures
Standardised Total1 Computed as: Stock of provisions for defaulted stock / default stock (as defined in paragraphs 59 and 61 of the Methodological note)
0
0
Impairment
rate
Stock of
Provisions
Coverage Ratio -
Default Stock1
Impairment
rate
Stock of
Provisions
Coverage Ratio -
Default Stock1
Impairment
rate
Stock of
Provisions
Coverage Ratio -
Default Stock1
Impairment
rate
Stock of
Provisions
Coverage Ratio -
Default Stock1
Impairment
rate
Stock of
Provisions
Coverage Ratio -
Default Stock1
Impairment
rate
Stock of
Provisions
Coverage Ratio -
Default Stock1
- 0 - - 0 - - 0 - - 0 - - 0 - - 0 -
- 0 - - 0 - - 0 - - 0 - - 0 - - 0 -
- 0 - - 0 - - 0 - - 0 - - 0 - - 0 -
- 0 - - 0 - - 0 - - 0 - - 0 - - 0 -
- 0 - - 0 - - 0 - - 0 - - 0 - - 0 -
- 0 - - 0 - - 0 - - 0 - - 0 - - 0 -
- 0 - - 0 - - 0 - - 0 - - 0 - - 0 -
- 0 - - 0 - - 0 - - 0 - - 0 - - 0 -
- 0 - - 0 - - 0 - - 0 - - 0 - - 0 -
- 0 - - 0 - - 0 - - 0 - - 0 - - 0 -
- 0 - - 0 - - 0 - - 0 - - 0 - - 0 -
- 0 - - 0 - - 0 - - 0 - - 0 - - 0 -
- 0 - - 0 - - 0 - - 0 - - 0 - - 0 -
- 0 - - 0 - - 0 - - 0 - - 0 - - 0 -
- 0 - - 0 - - 0 - - 0 - - 0 - - 0 -
- 0 - - 0 - - 0 - - 0 - - 0 - - 0 -
- 0 - - 0 - - 0 - - 0 - - 0 - - 0 -
- 0 - - 0 - - 0 - - 0 - - 0 - - 0 -
- 0 - - 0 - - 0 - - 0 - - 0 - - 0 -
Impairment
rate
Stock of
Provisions
Coverage Ratio -
Default Stock1
Impairment
rate
Stock of
Provisions
Coverage Ratio -
Default Stock1
Impairment
rate
Stock of
Provisions
Coverage Ratio -
Default Stock1
Impairment
rate
Stock of
Provisions
Coverage Ratio -
Default Stock1
Impairment
rate
Stock of
Provisions
Coverage Ratio -
Default Stock1
Impairment
rate
Stock of
Provisions
Coverage Ratio -
Default Stock1
- 0 - - 0 - - 0 - - 0 - - 0 - - 0 -
- 0 - - 0 - - 0 - - 0 - - 0 - - 0 -
- 0 - - 0 - - 0 - - 0 - - 0 - - 0 -
- 0 - - 0 - - 0 - - 0 - - 0 - - 0 -
- 0 - - 0 - - 0 - - 0 - - 0 - - 0 -
- 0 - - 0 - - 0 - - 0 - - 0 - - 0 -
- 0 - - 0 - - 0 - - 0 - - 0 - - 0 -
- 0 - - 0 - - 0 - - 0 - - 0 - - 0 -
- 0 - - 0 - - 0 - - 0 - - 0 - - 0 -
- 0 - - 0 - - 0 - - 0 - - 0 - - 0 -
- 0 - - 0 - - 0 - - 0 - - 0 - - 0 -
- 0 - - 0 - - 0 - - 0 - - 0 - - 0 -
- 0 - - 0 - - 0 - - 0 - - 0 - - 0 -
- 0 - - 0 - - 0 - - 0 - - 0 - - 0 -
- 0 - - 0 - - 0 - - 0 - - 0 - - 0 -
- 0 - - 0 - - 0 - - 0 - - 0 - - 0 -
- 0 - - 0 - - 0 - - 0 - - 0 - - 0 -
- 0 - - 0 - - 0 - - 0 - - 0 - - 0 -
- 0 - - 0 - - 0 - - 0 - - 0 - - 0 -
31/12/2018 31/12/2016 31/12/2017 31/12/201831/12/2016 31/12/2017
31/12/2018 31/12/2016 31/12/2017 31/12/2018
Baseline Scenario Adverse Scenario
31/12/2016 31/12/2017
Baseline Scenario Adverse Scenario

(mln EUR) 31/12/2016 31/12/2017 31/12/2018 31/12/2016 31/12/2017 31/12/2018
STA 0IRB 3Total 3
STA 0 0 0 0 0 0 0IRB 0 0 0 0 0 0 0Total 0 0 0 0 0 0 0
Impairments Total banking book others than assessed at fair value 0 0 0 0 0 0 0
2016 EU-wide Stress Test: SecuritisationsSvenska Handelsbanken - group
Risk exposure amounts
31/12/2015Baseline Scenario Adverse Scenario
Exposure values
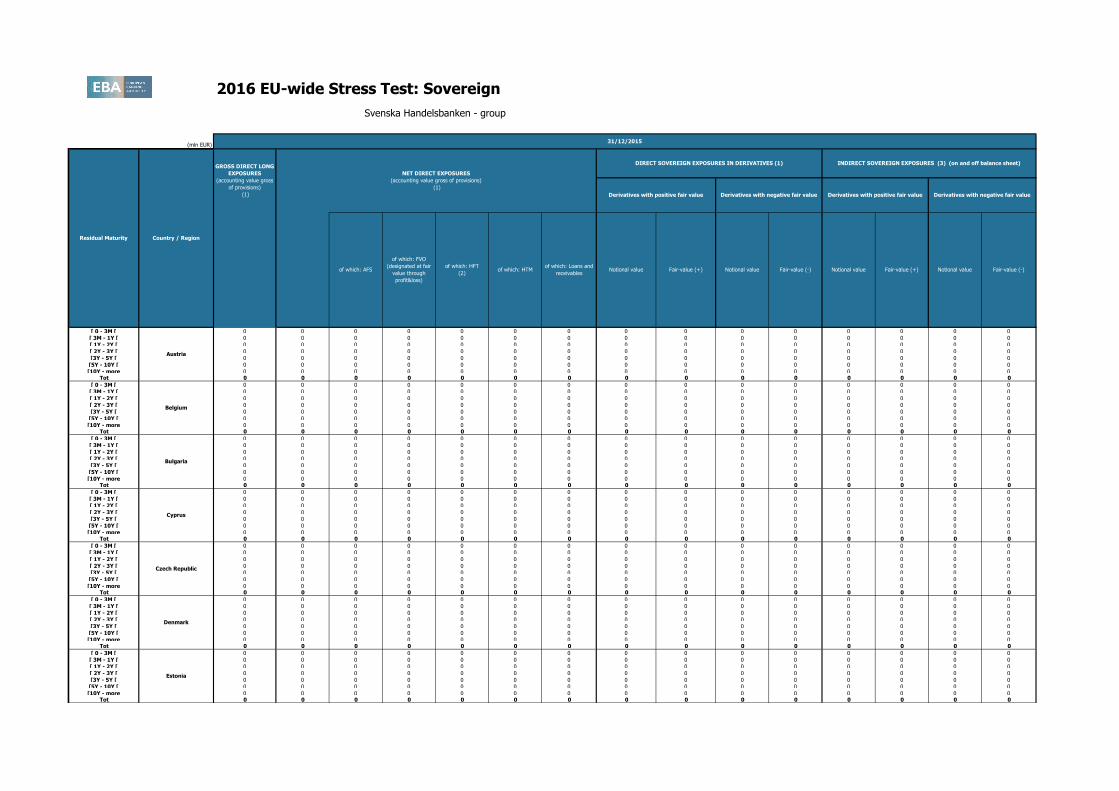
2016 EU-wide Stress Test: Sovereign
(mln EUR)
[ 0 - 3M [ 0 0 0 0 0 0 0 0 0 0 0 0 0 0 0
[ 3M - 1Y [ 0 0 0 0 0 0 0 0 0 0 0 0 0 0 0
[ 1Y - 2Y [ 0 0 0 0 0 0 0 0 0 0 0 0 0 0 0
[ 2Y - 3Y [ 0 0 0 0 0 0 0 0 0 0 0 0 0 0 0
[3Y - 5Y [ 0 0 0 0 0 0 0 0 0 0 0 0 0 0 0
[5Y - 10Y [ 0 0 0 0 0 0 0 0 0 0 0 0 0 0 0
[10Y - more 0 0 0 0 0 0 0 0 0 0 0 0 0 0 0Tot 0 0 0 0 0 0 0 0 0 0 0 0 0 0 0
Svenska Handelsbanken - group
31/12/2015
Residual Maturity Country / Region
GROSS DIRECT LONG
EXPOSURES
(accounting value gross
of provisions)
(1)
NET DIRECT EXPOSURES
(accounting value gross of provisions)
(1)
Notional value Fair-value (+) Fair-value (-) Notional value Fair-value (+)
DIRECT SOVEREIGN EXPOSURES IN DERIVATIVES (1) INDIRECT SOVEREIGN EXPOSURES (3) (on and off balance sheet)
Derivatives with positive fair value Derivatives with negative fair value Derivatives with positive fair value Derivatives with negative fair value
Notional value Fair-value (-)Notional value
Cyprus
Czech Republic
of which: Loans and
receivablesof which: AFS
of which: FVO
(designated at fair
value through
profit&loss)
of which: HFT
(2)of which: HTM
Austria
Belgium
Bulgaria
Denmark
Estonia

2016 EU-wide Stress Test: Sovereign
(mln EUR)
Svenska Handelsbanken - group
31/12/2015
Residual Maturity Country / Region
GROSS DIRECT LONG
EXPOSURES
(accounting value gross
of provisions)
(1)
NET DIRECT EXPOSURES
(accounting value gross of provisions)
(1)
Notional value Fair-value (+) Fair-value (-) Notional value Fair-value (+)
DIRECT SOVEREIGN EXPOSURES IN DERIVATIVES (1) INDIRECT SOVEREIGN EXPOSURES (3) (on and off balance sheet)
Derivatives with positive fair value Derivatives with negative fair value Derivatives with positive fair value Derivatives with negative fair value
Notional value Fair-value (-)Notional valueof which: Loans and
receivablesof which: AFS
of which: FVO
(designated at fair
value through
profit&loss)
of which: HFT
(2)of which: HTM
Austria
[ 0 - 3M [ 191 109 0 0 24 0 85 0 0 0 0 0 0 0 0
[ 3M - 1Y [ 2 2 0 0 0 0 2 0 0 0 0 0 0 0 0
[ 1Y - 2Y [ 17 17 0 0 0 0 17 0 0 0 0 0 0 0 0
[ 2Y - 3Y [ 18 18 0 0 0 0 18 0 0 0 0 0 0 0 0
[3Y - 5Y [ 91 91 0 0 0 0 91 0 0 0 0 0 0 0 0
[5Y - 10Y [ 960 960 0 0 1 0 960 0 0 0 0 0 0 0 0
[10Y - more 153 153 0 0 0 0 153 0 0 0 0 0 0 0 0Tot 1,431 1,350 0 0 24 0 1,325 0 0 0 0 0 0 0 0
[ 0 - 3M [ 2 2 0 0 0 0 2 0 0 0 0 0 0 0 0
[ 3M - 1Y [ 29 29 0 0 29 0 0 0 0 0 0 0 0 0 0
[ 1Y - 2Y [ 0 0 0 0 0 0 0 0 0 0 0 0 0 0 0
[ 2Y - 3Y [ 0 0 0 0 0 0 0 0 0 0 0 0 0 0 0
[3Y - 5Y [ 0 0 0 0 0 0 0 0 0 0 0 0 0 0 0
[5Y - 10Y [ 0 0 0 0 0 0 0 0 0 0 0 0 0 0 0
[10Y - more 0 0 0 0 0 0 0 0 0 0 0 0 0 0 0Tot 31 31 0 0 29 0 2 0 0 0 0 0 0 0 0
[ 0 - 3M [ 78 78 0 0 78 0 0 -514 1 0 0 0 0 0 0
[ 3M - 1Y [ 97 97 0 20 77 0 0 0 0 0 0 0 0 0 0
[ 1Y - 2Y [ 165 165 0 100 64 0 0 0 0 0 0 0 0 0 0
[ 2Y - 3Y [ 23 23 0 0 23 0 0 0 0 0 0 0 0 0 0
[3Y - 5Y [ 52 52 0 0 52 0 0 0 0 0 0 0 0 0 0
[5Y - 10Y [ 17 17 0 0 17 0 0 0 0 0 0 0 0 0 0
[10Y - more 0 0 0 0 0 0 0 0 0 0 0 0 0 0 0Tot 432 432 0 121 311 0 0 -514 1 0 0 0 0 0 0
[ 0 - 3M [ 0 0 0 0 0 0 0 0 0 0 0 0 0 0 0
[ 3M - 1Y [ 0 0 0 0 0 0 0 0 0 0 0 0 0 0 0
[ 1Y - 2Y [ 0 0 0 0 0 0 0 0 0 0 0 0 0 0 0
[ 2Y - 3Y [ 0 0 0 0 0 0 0 0 0 0 0 0 0 0 0
[3Y - 5Y [ 0 0 0 0 0 0 0 0 0 0 0 0 0 0 0
[5Y - 10Y [ 0 0 0 0 0 0 0 0 0 0 0 0 0 0 0
[10Y - more 0 0 0 0 0 0 0 0 0 0 0 0 0 0 0Tot 0 0 0 0 0 0 0 0 0 0 0 0 0 0 0
[ 0 - 3M [ 0 0 0 0 0 0 0 0 0 0 0 0 0 0 0
[ 3M - 1Y [ 0 0 0 0 0 0 0 0 0 0 0 0 0 0 0
[ 1Y - 2Y [ 0 0 0 0 0 0 0 0 0 0 0 0 0 0 0
[ 2Y - 3Y [ 0 0 0 0 0 0 0 0 0 0 0 0 0 0 0
[3Y - 5Y [ 26 26 0 0 26 0 0 0 0 0 0 0 0 0 0
[5Y - 10Y [ 0 0 0 0 0 0 0 0 0 0 0 0 0 0 0
[10Y - more 0 0 0 0 0 0 0 0 0 0 0 0 0 0 0Tot 26 26 0 0 26 0 0 0 0 0 0 0 0 0 0
Greece
Ireland
Finland
France
Germany
Croatia
Hungary

2016 EU-wide Stress Test: Sovereign
(mln EUR)
Svenska Handelsbanken - group
31/12/2015
Residual Maturity Country / Region
GROSS DIRECT LONG
EXPOSURES
(accounting value gross
of provisions)
(1)
NET DIRECT EXPOSURES
(accounting value gross of provisions)
(1)
Notional value Fair-value (+) Fair-value (-) Notional value Fair-value (+)
DIRECT SOVEREIGN EXPOSURES IN DERIVATIVES (1) INDIRECT SOVEREIGN EXPOSURES (3) (on and off balance sheet)
Derivatives with positive fair value Derivatives with negative fair value Derivatives with positive fair value Derivatives with negative fair value
Notional value Fair-value (-)Notional valueof which: Loans and
receivablesof which: AFS
of which: FVO
(designated at fair
value through
profit&loss)
of which: HFT
(2)of which: HTM
Austria
[ 0 - 3M [ 0 0 0 0 0 0 0 0 0 0 0 0 0 0 0
[ 3M - 1Y [ 0 0 0 0 0 0 0 0 0 0 0 0 0 0 0
[ 1Y - 2Y [ 0 0 0 0 0 0 0 0 0 0 0 0 0 0 0
[ 2Y - 3Y [ 0 0 0 0 0 0 0 0 0 0 0 0 0 0 0
[3Y - 5Y [ 0 0 0 0 0 0 0 0 0 0 0 0 0 0 0
[5Y - 10Y [ 2 2 0 0 2 0 0 0 0 0 0 0 0 0 0
[10Y - more 26 26 0 0 26 0 0 0 0 0 0 0 0 0 0Tot 27 27 0 0 27 0 0 0 0 0 0 0 0 0 0
[ 0 - 3M [ 0 0 0 0 0 0 0 0 0 0 0 0 0 0 0
[ 3M - 1Y [ 0 0 0 0 0 0 0 0 0 0 0 0 0 0 0
[ 1Y - 2Y [ 0 0 0 0 0 0 0 0 0 0 0 0 0 0 0
[ 2Y - 3Y [ 0 0 0 0 0 0 0 0 0 0 0 0 0 0 0
[3Y - 5Y [ 0 0 0 0 0 0 0 0 0 0 0 0 0 0 0
[5Y - 10Y [ 0 0 0 0 0 0 0 0 0 0 0 0 0 0 0
[10Y - more 0 0 0 0 0 0 0 0 0 0 0 0 0 0 0Tot 0 0 0 0 0 0 0 0 0 0 0 0 0 0 0
[ 0 - 3M [ 0 0 0 0 0 0 0 0 0 0 0 0 0 0 0
[ 3M - 1Y [ 0 0 0 0 0 0 0 0 0 0 0 0 0 0 0
[ 1Y - 2Y [ 0 0 0 0 0 0 0 0 0 0 0 0 0 0 0
[ 2Y - 3Y [ 0 0 0 0 0 0 0 0 0 0 0 0 0 0 0
[3Y - 5Y [ 0 0 0 0 0 0 0 0 0 0 0 0 0 0 0
[5Y - 10Y [ 0 0 0 0 0 0 0 0 0 0 0 0 0 0 0
[10Y - more 0 0 0 0 0 0 0 0 0 0 0 0 0 0 0Tot 0 0 0 0 0 0 0 0 0 0 0 0 0 0 0
[ 0 - 3M [ 0 29 0 0 29 0 0 0 0 0 0 0 0 0 0
[ 3M - 1Y [ 30 0 0 0 0 0 0 0 0 0 0 0 0 0 0
[ 1Y - 2Y [ 0 0 0 0 0 0 0 0 0 0 0 0 0 0 0
[ 2Y - 3Y [ 0 0 0 0 0 0 0 0 0 0 0 0 0 0 0
[3Y - 5Y [ 0 0 0 0 0 0 0 0 0 0 0 0 0 0 0
[5Y - 10Y [ 0 0 0 0 0 0 0 0 0 0 0 0 0 0 0
[10Y - more 1 1 0 0 1 0 0 0 0 0 0 0 0 0 0Tot 31 30 0 0 30 0 0 0 0 0 0 0 0 0 0
[ 0 - 3M [ 0 0 0 0 0 0 0 0 0 0 0 0 0 0 0
[ 3M - 1Y [ 0 0 0 0 0 0 0 0 0 0 0 0 0 0 0
[ 1Y - 2Y [ 0 0 0 0 0 0 0 0 0 0 0 0 0 0 0
[ 2Y - 3Y [ 0 0 0 0 0 0 0 0 0 0 0 0 0 0 0
[3Y - 5Y [ 0 0 0 0 0 0 0 0 0 0 0 0 0 0 0
[5Y - 10Y [ 0 0 0 0 0 0 0 0 0 0 0 0 0 0 0
[10Y - more 0 0 0 0 0 0 0 0 0 0 0 0 0 0 0Tot 0 0 0 0 0 0 0 0 0 0 0 0 0 0 0
Italy
Latvia
Lithuania
Malta
Netherlands
Poland
Luxembourg

2016 EU-wide Stress Test: Sovereign
(mln EUR)
Svenska Handelsbanken - group
31/12/2015
Residual Maturity Country / Region
GROSS DIRECT LONG
EXPOSURES
(accounting value gross
of provisions)
(1)
NET DIRECT EXPOSURES
(accounting value gross of provisions)
(1)
Notional value Fair-value (+) Fair-value (-) Notional value Fair-value (+)
DIRECT SOVEREIGN EXPOSURES IN DERIVATIVES (1) INDIRECT SOVEREIGN EXPOSURES (3) (on and off balance sheet)
Derivatives with positive fair value Derivatives with negative fair value Derivatives with positive fair value Derivatives with negative fair value
Notional value Fair-value (-)Notional valueof which: Loans and
receivablesof which: AFS
of which: FVO
(designated at fair
value through
profit&loss)
of which: HFT
(2)of which: HTM
Austria
[ 0 - 3M [ 0 0 0 0 0 0 0 0 0 0 0 0 0 0 0
[ 3M - 1Y [ 0 0 0 0 0 0 0 0 0 0 0 0 0 0 0
[ 1Y - 2Y [ 0 0 0 0 0 0 0 0 0 0 0 0 0 0 0
[ 2Y - 3Y [ 0 0 0 0 0 0 0 0 0 0 0 0 0 0 0
[3Y - 5Y [ 0 0 0 0 0 0 0 0 0 0 0 0 0 0 0
[5Y - 10Y [ 0 0 0 0 0 0 0 0 0 0 0 0 0 0 0
[10Y - more 0 0 0 0 0 0 0 0 0 0 0 0 0 0 0Tot 0 0 0 0 0 0 0 0 0 0 0 0 0 0 0
[ 0 - 3M [ 0 0 0 0 0 0 0 0 0 0 0 0 0 0 0
[ 3M - 1Y [ 0 0 0 0 0 0 0 0 0 0 0 0 0 0 0
[ 1Y - 2Y [ 1 1 0 0 1 0 0 0 0 0 0 0 0 0 0
[ 2Y - 3Y [ 0 0 0 0 0 0 0 0 0 0 0 0 0 0 0
[3Y - 5Y [ 0 0 0 0 0 0 0 0 0 0 0 0 0 0 0
[5Y - 10Y [ 0 0 0 0 0 0 0 0 0 0 0 0 0 0 0
[10Y - more 0 0 0 0 0 0 0 0 0 0 0 0 0 0 0Tot 1 1 0 0 1 0 0 0 0 0 0 0 0 0 0
[ 0 - 3M [ 516 382 0 -38 0 0 420 -649 14 0 0 0 0 0 0
[ 3M - 1Y [ 146 108 0 8 0 0 101 0 0 0 0 0 0 0 0
[ 1Y - 2Y [ 366 270 0 205 0 0 66 0 0 0 0 0 0 0 0
[ 2Y - 3Y [ 389 389 0 0 281 0 108 0 0 0 0 0 0 0 0
[3Y - 5Y [ 399 729 0 639 0 0 90 0 0 0 0 0 0 0 0
[5Y - 10Y [ 134 169 0 120 0 0 48 0 0 0 0 0 0 0 0
[10Y - more 0 0 0 0 0 0 0 0 0 0 0 0 0 0 0Tot 1,950 2,048 0 934 281 0 833 -649 14 0 0 0 0 0 0
[ 0 - 3M [ 0 0 0 0 0 0 0 0 0 0 0 0 0 0 0
[ 3M - 1Y [ 0 0 0 0 0 0 0 0 0 0 0 0 0 0 0
[ 1Y - 2Y [ 0 0 0 0 0 0 0 0 0 0 0 0 0 0 0
[ 2Y - 3Y [ 0 0 0 0 0 0 0 0 0 0 0 0 0 0 0
[3Y - 5Y [ 0 0 0 0 0 0 0 0 0 0 0 0 0 0 0
[5Y - 10Y [ 0 0 0 0 0 0 0 0 0 0 0 0 0 0 0
[10Y - more 0 0 0 0 0 0 0 0 0 0 0 0 0 0 0Tot 0 0 0 0 0 0 0 0 0 0 0 0 0 0 0
Portugal
Romania
Slovakia
Slovenia
Spain
Sweden
United Kingdom

2016 EU-wide Stress Test: Sovereign
(mln EUR)
Svenska Handelsbanken - group
31/12/2015
Residual Maturity Country / Region
GROSS DIRECT LONG
EXPOSURES
(accounting value gross
of provisions)
(1)
NET DIRECT EXPOSURES
(accounting value gross of provisions)
(1)
Notional value Fair-value (+) Fair-value (-) Notional value Fair-value (+)
DIRECT SOVEREIGN EXPOSURES IN DERIVATIVES (1) INDIRECT SOVEREIGN EXPOSURES (3) (on and off balance sheet)
Derivatives with positive fair value Derivatives with negative fair value Derivatives with positive fair value Derivatives with negative fair value
Notional value Fair-value (-)Notional valueof which: Loans and
receivablesof which: AFS
of which: FVO
(designated at fair
value through
profit&loss)
of which: HFT
(2)of which: HTM
Austria
[ 0 - 3M [ 0 0 0 0 0 0 0 0 0 0 0 0 0 0 0
[ 3M - 1Y [ 0 0 0 0 0 0 0 0 0 0 0 0 0 0 0
[ 1Y - 2Y [ 0 0 0 0 0 0 0 0 0 0 0 0 0 0 0
[ 2Y - 3Y [ 0 0 0 0 0 0 0 0 0 0 0 0 0 0 0
[3Y - 5Y [ 0 0 0 0 0 0 0 0 0 0 0 0 0 0 0
[5Y - 10Y [ 0 0 0 0 0 0 0 0 0 0 0 0 0 0 0
[10Y - more 0 0 0 0 0 0 0 0 0 0 0 0 0 0 0Tot 0 0 0 0 0 0 0 0 0 0 0 0 0 0 0
[ 0 - 3M [ 0 0 0 0 0 0 0 0 0 0 0 0 0 0 0
[ 3M - 1Y [ 0 0 0 0 0 0 0 0 0 0 0 0 0 0 0
[ 1Y - 2Y [ 0 0 0 0 0 0 0 0 0 0 0 0 0 0 0
[ 2Y - 3Y [ 0 0 0 0 0 0 0 0 0 0 0 0 0 0 0
[3Y - 5Y [ 0 0 0 0 0 0 0 0 0 0 0 0 0 0 0
[5Y - 10Y [ 0 0 0 0 0 0 0 0 0 0 0 0 0 0 0
[10Y - more 0 0 0 0 0 0 0 0 0 0 0 0 0 0 0Tot 0 0 0 0 0 0 0 0 0 0 0 0 0 0 0
[ 0 - 3M [ 180 180 0 0 179 0 1 0 0 0 0 0 0 0 0
[ 3M - 1Y [ 21 21 0 0 21 0 0 0 0 0 0 0 0 0 0
[ 1Y - 2Y [ 29 2 0 0 0 0 2 0 0 0 0 0 0 0 0
[ 2Y - 3Y [ 1 1 0 0 0 0 1 0 0 0 0 0 0 0 0
[3Y - 5Y [ 2 2 0 0 0 0 2 0 0 0 0 0 0 0 0
[5Y - 10Y [ 1 5 0 0 4 0 1 0 0 0 0 0 0 0 0
[10Y - more 15 15 0 0 0 0 15 0 0 0 0 0 0 0 0Tot 250 226 0 0 205 0 22 0 0 0 0 0 0 0 0
[ 0 - 3M [ 0 0 0 0 0 0 0 0 0 0 0 0 0 0 0
[ 3M - 1Y [ 0 0 0 0 0 0 0 0 0 0 0 0 0 0 0
[ 1Y - 2Y [ 0 0 0 0 0 0 0 0 0 0 0 0 0 0 0
[ 2Y - 3Y [ 0 0 0 0 0 0 0 0 0 0 0 0 0 0 0
[3Y - 5Y [ 0 0 0 0 0 0 0 0 0 0 0 0 0 0 0
[5Y - 10Y [ 0 0 0 0 0 0 0 0 0 0 0 0 0 0 0
[10Y - more 0 0 0 0 0 0 0 0 0 0 0 0 0 0 0Tot 0 0 0 0 0 0 0 0 0 0 0 0 0 0 0
[ 0 - 3M [ 0 0 0 0 0 0 0 0 0 0 0 0 0 0 0
[ 3M - 1Y [ 0 0 0 0 0 0 0 0 0 0 0 0 0 0 0
[ 1Y - 2Y [ 0 0 0 0 0 0 0 0 0 0 0 0 0 0 0
[ 2Y - 3Y [ 23 46 0 23 23 0 0 0 0 0 0 0 0 0 0
[3Y - 5Y [ 0 0 0 0 0 0 0 0 0 0 0 0 0 0 0
[5Y - 10Y [ 0 0 0 0 0 0 0 0 0 0 0 0 0 0 0
[10Y - more 0 0 0 0 0 0 0 0 0 0 0 0 0 0 0Tot 23 46 0 23 23 0 0 0 0 0 0 0 0 0 0
[ 0 - 3M [ 0 0 0 0 0 0 0 0 0 0 0 0 0 0 0
[ 3M - 1Y [ 0 0 0 0 0 0 0 0 0 0 0 0 0 0 0
[ 1Y - 2Y [ 0 0 0 0 0 0 0 0 0 0 0 0 0 0 0
[ 2Y - 3Y [ 0 0 0 0 0 0 0 0 0 0 0 0 0 0 0
[3Y - 5Y [ 0 0 0 0 0 0 0 0 0 0 0 0 0 0 0
[5Y - 10Y [ 0 0 0 0 0 0 0 0 0 0 0 0 0 0 0
[10Y - more 0 0 0 0 0 0 0 0 0 0 0 0 0 0 0Tot 0 0 0 0 0 0 0 0 0 0 0 0 0 0 0
[ 0 - 3M [ 0 0 0 0 0 0 0 0 0 0 0 0 0 0 0
[ 3M - 1Y [ 0 0 0 0 0 0 0 0 0 0 0 0 0 0 0
[ 1Y - 2Y [ 0 0 0 0 0 0 0 0 0 0 0 0 0 0 0
[ 2Y - 3Y [ 0 0 0 0 0 0 0 0 0 0 0 0 0 0 0
[3Y - 5Y [ 0 0 0 0 0 0 0 0 0 0 0 0 0 0 0
[5Y - 10Y [ 0 0 0 0 0 0 0 0 0 0 0 0 0 0 0
[10Y - more 0 0 0 0 0 0 0 0 0 0 0 0 0 0 0Tot 0 0 0 0 0 0 0 0 0 0 0 0 0 0 0
Liechtenstein
Iceland
Norway
Australia
Canada
Hong Kong
Japan
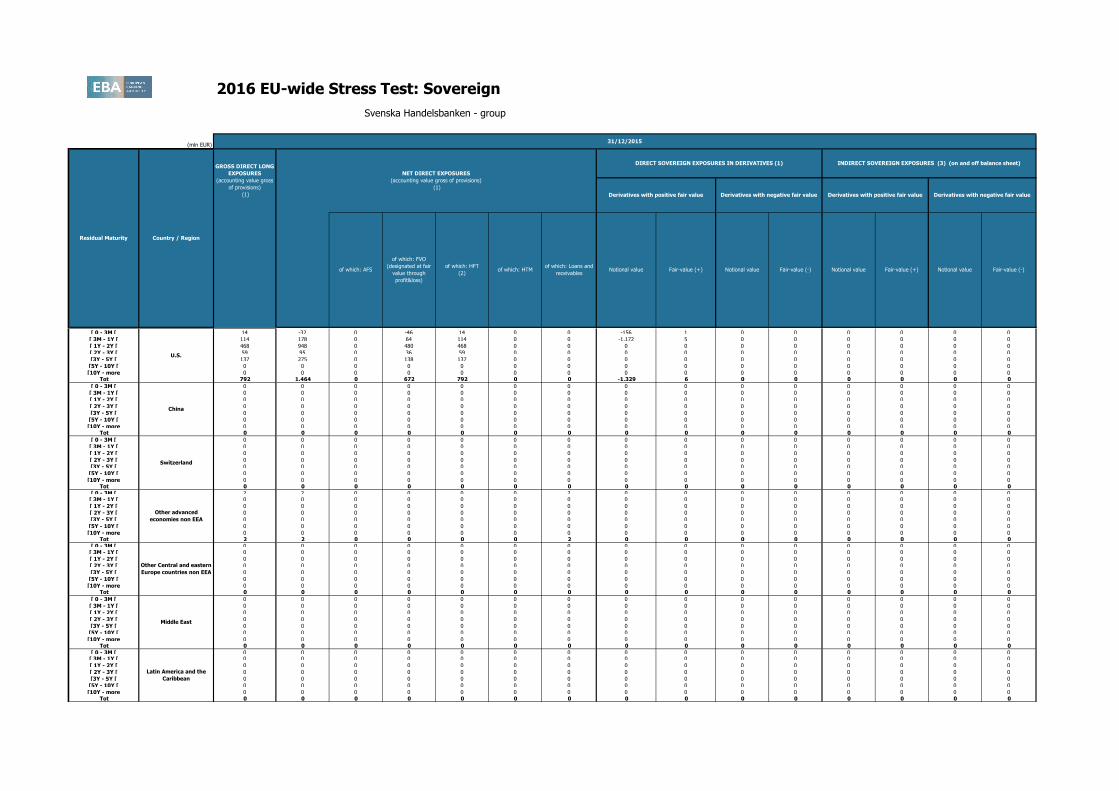
2016 EU-wide Stress Test: Sovereign
(mln EUR)
Svenska Handelsbanken - group
31/12/2015
Residual Maturity Country / Region
GROSS DIRECT LONG
EXPOSURES
(accounting value gross
of provisions)
(1)
NET DIRECT EXPOSURES
(accounting value gross of provisions)
(1)
Notional value Fair-value (+) Fair-value (-) Notional value Fair-value (+)
DIRECT SOVEREIGN EXPOSURES IN DERIVATIVES (1) INDIRECT SOVEREIGN EXPOSURES (3) (on and off balance sheet)
Derivatives with positive fair value Derivatives with negative fair value Derivatives with positive fair value Derivatives with negative fair value
Notional value Fair-value (-)Notional valueof which: Loans and
receivablesof which: AFS
of which: FVO
(designated at fair
value through
profit&loss)
of which: HFT
(2)of which: HTM
Austria
[ 0 - 3M [ 14 -32 0 -46 14 0 0 -156 1 0 0 0 0 0 0
[ 3M - 1Y [ 114 178 0 64 114 0 0 -1,172 5 0 0 0 0 0 0
[ 1Y - 2Y [ 468 948 0 480 468 0 0 0 0 0 0 0 0 0 0
[ 2Y - 3Y [ 59 95 0 36 59 0 0 0 0 0 0 0 0 0 0
[3Y - 5Y [ 137 275 0 138 137 0 0 0 0 0 0 0 0 0 0
[5Y - 10Y [ 0 0 0 0 0 0 0 0 0 0 0 0 0 0 0
[10Y - more 0 0 0 0 0 0 0 0 0 0 0 0 0 0 0Tot 792 1,464 0 672 792 0 0 -1,329 6 0 0 0 0 0 0
[ 0 - 3M [ 0 0 0 0 0 0 0 0 0 0 0 0 0 0 0
[ 3M - 1Y [ 0 0 0 0 0 0 0 0 0 0 0 0 0 0 0
[ 1Y - 2Y [ 0 0 0 0 0 0 0 0 0 0 0 0 0 0 0
[ 2Y - 3Y [ 0 0 0 0 0 0 0 0 0 0 0 0 0 0 0
[3Y - 5Y [ 0 0 0 0 0 0 0 0 0 0 0 0 0 0 0
[5Y - 10Y [ 0 0 0 0 0 0 0 0 0 0 0 0 0 0 0
[10Y - more 0 0 0 0 0 0 0 0 0 0 0 0 0 0 0Tot 0 0 0 0 0 0 0 0 0 0 0 0 0 0 0
[ 0 - 3M [ 2 2 0 0 0 0 2 0 0 0 0 0 0 0 0[ 3M - 1Y [ 0 0 0 0 0 0 0 0 0 0 0 0 0 0 0
[ 1Y - 2Y [ 0 0 0 0 0 0 0 0 0 0 0 0 0 0 0
[ 2Y - 3Y [ 0 0 0 0 0 0 0 0 0 0 0 0 0 0 0
[3Y - 5Y [ 0 0 0 0 0 0 0 0 0 0 0 0 0 0 0
[5Y - 10Y [ 0 0 0 0 0 0 0 0 0 0 0 0 0 0 0
[10Y - more 0 0 0 0 0 0 0 0 0 0 0 0 0 0 0Tot 2 2 0 0 0 0 2 0 0 0 0 0 0 0 0
[ 0 - 3M [ 0 0 0 0 0 0 0 0 0 0 0 0 0 0 0[ 3M - 1Y [ 0 0 0 0 0 0 0 0 0 0 0 0 0 0 0
[ 1Y - 2Y [ 0 0 0 0 0 0 0 0 0 0 0 0 0 0 0
[ 2Y - 3Y [ 0 0 0 0 0 0 0 0 0 0 0 0 0 0 0
[3Y - 5Y [ 0 0 0 0 0 0 0 0 0 0 0 0 0 0 0
[5Y - 10Y [ 0 0 0 0 0 0 0 0 0 0 0 0 0 0 0
[10Y - more 0 0 0 0 0 0 0 0 0 0 0 0 0 0 0Tot 0 0 0 0 0 0 0 0 0 0 0 0 0 0 0
[ 0 - 3M [ 0 0 0 0 0 0 0 0 0 0 0 0 0 0 0
[ 3M - 1Y [ 0 0 0 0 0 0 0 0 0 0 0 0 0 0 0
[ 1Y - 2Y [ 0 0 0 0 0 0 0 0 0 0 0 0 0 0 0
[ 2Y - 3Y [ 0 0 0 0 0 0 0 0 0 0 0 0 0 0 0
[3Y - 5Y [ 0 0 0 0 0 0 0 0 0 0 0 0 0 0 0
[5Y - 10Y [ 0 0 0 0 0 0 0 0 0 0 0 0 0 0 0
[10Y - more 0 0 0 0 0 0 0 0 0 0 0 0 0 0 0Tot 0 0 0 0 0 0 0 0 0 0 0 0 0 0 0
[ 0 - 3M [ 0 0 0 0 0 0 0 0 0 0 0 0 0 0 0[ 3M - 1Y [ 0 0 0 0 0 0 0 0 0 0 0 0 0 0 0
[ 1Y - 2Y [ 0 0 0 0 0 0 0 0 0 0 0 0 0 0 0
[ 2Y - 3Y [ 0 0 0 0 0 0 0 0 0 0 0 0 0 0 0
[3Y - 5Y [ 0 0 0 0 0 0 0 0 0 0 0 0 0 0 0
[5Y - 10Y [ 0 0 0 0 0 0 0 0 0 0 0 0 0 0 0
[10Y - more 0 0 0 0 0 0 0 0 0 0 0 0 0 0 0Tot 0 0 0 0 0 0 0 0 0 0 0 0 0 0 0
Latin America and the
Caribbean
Middle East
U.S.
China
Switzerland
Other advanced
economies non EEA
Other Central and eastern
Europe countries non EEA
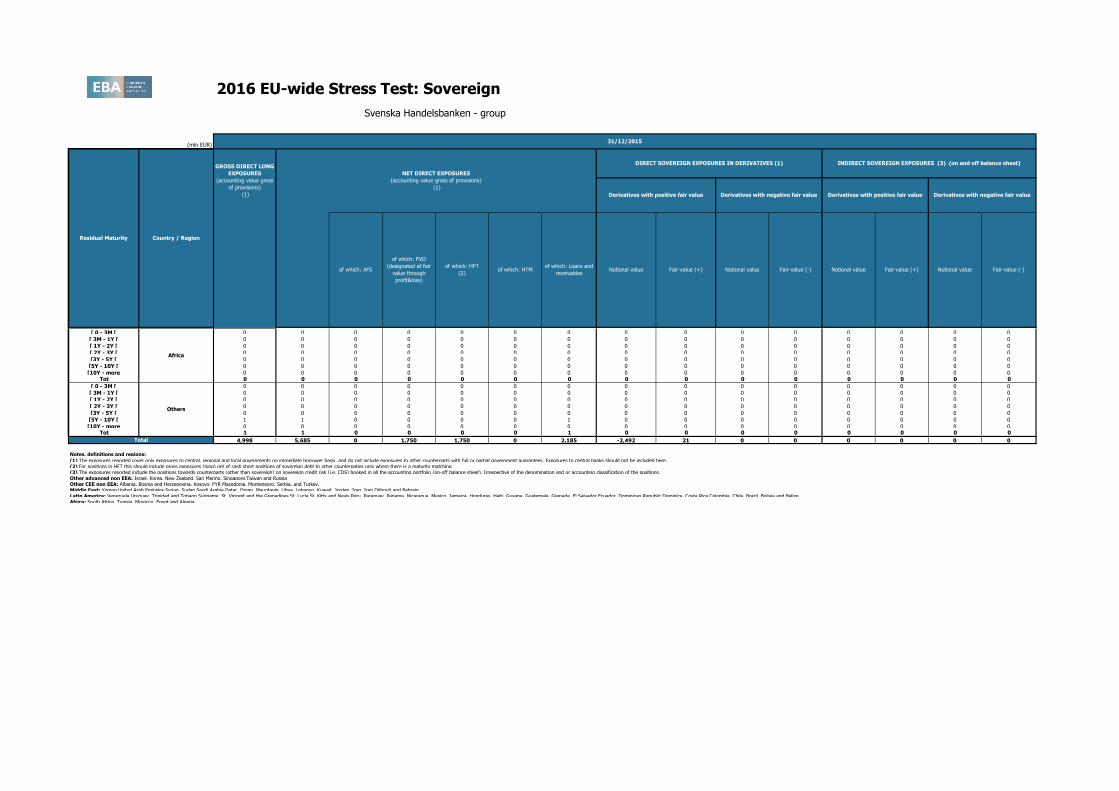
2016 EU-wide Stress Test: Sovereign
(mln EUR)
Svenska Handelsbanken - group
31/12/2015
Residual Maturity Country / Region
GROSS DIRECT LONG
EXPOSURES
(accounting value gross
of provisions)
(1)
NET DIRECT EXPOSURES
(accounting value gross of provisions)
(1)
Notional value Fair-value (+) Fair-value (-) Notional value Fair-value (+)
DIRECT SOVEREIGN EXPOSURES IN DERIVATIVES (1) INDIRECT SOVEREIGN EXPOSURES (3) (on and off balance sheet)
Derivatives with positive fair value Derivatives with negative fair value Derivatives with positive fair value Derivatives with negative fair value
Notional value Fair-value (-)Notional valueof which: Loans and
receivablesof which: AFS
of which: FVO
(designated at fair
value through
profit&loss)
of which: HFT
(2)of which: HTM
Austria
[ 0 - 3M [ 0 0 0 0 0 0 0 0 0 0 0 0 0 0 0
[ 3M - 1Y [ 0 0 0 0 0 0 0 0 0 0 0 0 0 0 0
[ 1Y - 2Y [ 0 0 0 0 0 0 0 0 0 0 0 0 0 0 0
[ 2Y - 3Y [ 0 0 0 0 0 0 0 0 0 0 0 0 0 0 0
[3Y - 5Y [ 0 0 0 0 0 0 0 0 0 0 0 0 0 0 0
[5Y - 10Y [ 0 0 0 0 0 0 0 0 0 0 0 0 0 0 0
[10Y - more 0 0 0 0 0 0 0 0 0 0 0 0 0 0 0Tot 0 0 0 0 0 0 0 0 0 0 0 0 0 0 0
[ 0 - 3M [ 0 0 0 0 0 0 0 0 0 0 0 0 0 0 0
[ 3M - 1Y [ 0 0 0 0 0 0 0 0 0 0 0 0 0 0 0
[ 1Y - 2Y [ 0 0 0 0 0 0 0 0 0 0 0 0 0 0 0
[ 2Y - 3Y [ 0 0 0 0 0 0 0 0 0 0 0 0 0 0 0
[3Y - 5Y [ 0 0 0 0 0 0 0 0 0 0 0 0 0 0 0
[5Y - 10Y [ 1 1 0 0 0 0 1 0 0 0 0 0 0 0 0
[10Y - more 0 0 0 0 0 0 0 0 0 0 0 0 0 0 0Tot 1 1 0 0 0 0 1 0 0 0 0 0 0 0 0
4,998 5,685 0 1,750 1,750 0 2,185 -2,492 21 0 0 0 0 0 0
Notes, definitions and regions:
(1) The exposures reported cover only exposures to central, regional and local governments on immediate borrower basis, and do not include exposures to other counterparts with full or partial government guarantees. Exposures to central banks should not be included here.(2) For positions in HFT this should include gross exposures (long) net of cash short positions of sovereign debt to other counterpaties only where there is a maturity matching(3) The exposures reported include the positions towards counterparts (other than sovereign) on sovereign credit risk (i.e. CDS) booked in all the accounting portfolio (on-off balance sheet). Irrespective of the denomination and or accounting classification of the positions.Other advanced non EEA: Israel, Korea, New Zealand, San Marino, Singapore,Taiwan and RussiaOther CEE non EEA: Albania, Bosnia and Herzegovina, Kosovo, FYR Macedonia, Montenegro, Serbia, and Turkey.Middle East: Yemen,United Arab Emirates,Syrian ,Sudan,Saudi Arabia,Qatar ,Oman ,Mauritania ,Libya ,Lebanon ,Kuwait ,Jordan ,Iraq ,Iran,Djibouti and Bahrain.Latin America: Venezuela,Uruguay ,Trinidad and Tobago,Suriname ,St. Vincent and the Grenadines,St. Lucia,St. Kitts and Nevis,Peru ,Paraguay ,Panama ,Nicaragua ,Mexico ,Jamaica ,Honduras ,Haiti ,Guyana ,Guatemala ,Grenada ,El Salvador,Ecuador ,Dominican Republic,Dominica ,Costa Rica,Colombia ,Chile ,Brazil ,Bolivia and Belize.Africa: South Africa, Tunisia ,Morocco ,Egypt and Algeria.
Africa
Others
Total

2016 EU-wide Stress Test - Risk exposure amounts
(mln EUR) 31/12/2015 31/12/2016 31/12/2017 31/12/2018 31/12/2016 31/12/2017 31/12/2018
Risk exposure amount for credit risk 43,320 43,354 43,381 43,409 45,358 48,677 50,777
Risk exposure amount for securitisations and re-securitisations 0 0 0 0 0 0 0
Risk exposure amount other credit risk 43,320 43,354 43,381 43,409 45,358 48,676 50,777
Risk exposure amount for market risk 2,105 2,105 2,105 2,105 2,105 2,105 2,105
Risk exposure amount for operational risk 6,370 6,370 6,370 6,370 6,370 6,370 6,370
Other risk exposure amounts 0 0 0 0 0 0 0
Total risk exposure amount 51,795 51,829 51,856 51,884 53,833 57,151 59,252
Baseline scenario Adverse scenario
Svenska Handelsbanken - group

2016 EU-wide Stress Test - P&L
31/12/2015 31/12/2016 31/12/2017 31/12/2018 31/12/2016 31/12/2017 31/12/2018
Net interest income (1) 3,0662,546 2,745 2,705 2,381 2,354 2,283
Interest income 5,982 5,029 5,595 5,823 5,464 5,994 5,888
(Interest expense) -2,916 -2,483 -2,850 -3,118 -3,084 -3,640 -3,604
Dividend income 77 77 77 77 63 63 63
Net fee and commission income 892 892 892 892 743 743 743
Gains or (-) losses on financial assets and liabilities held for trading, net 285 172 172 172 59 129 129
Gains or (-) losses on financial assets and liabilities designated at fair
value through profit and loss, net-87 -71
Other operating income not listed above, net 82 22 22 22 22 22 22
Total operating income, net 4,316 3,711 3,909 3,869 3,198 3,312 3,242
(Impairment or (-) reversal of impairment on financial assets not
measured at fair value through profit or loss)-173 -245 -239 -242 -317 -512 -569
Other income and expenses not listed above, net -1,945 -1,949 -1,949 -1,949 -2,232 -1,958 -1,958
Profit or (-) loss before tax from continuing operations 2,198 1,517 1,721 1,677 649 843 715
(Tax expenses or (-) income related to profit or loss from continuing operations) -465 -455 -516 -503 -195 -253 -215
Profit or (-) loss after tax from discontinued operations 0 0 0 0 0 0 0
Profit or (-) loss for the year 1,733 1,062 1,205 1,174 454 590 501
Attributable to owners of the parent 1,733 1,062 1,205 1,174 454 590 501
Amount of dividends paid 1,253 767 871 849 328 426 362
Attributable to owners of the parent net of estimated dividends 480 294 334 326 126 163 139
(mln EUR)
Baseline Scenario Adverse Scenario
Svenska Handelsbanken - group
(1) Projected NII may differ from the sum of interest income and interest expenses due to the application of the cap on NII (paragraphs 308 of the methodological note).

2016 EU-wide Stress Test: Capital
(mln EUR,%) 31/12/2015 31/12/2016 31/12/2017 31/12/2018 31/12/2016 31/12/2017 31/12/2018
A OWN FUNDS 14,066 14,383 14,716 15,039 13,834 13,930 14,050
A.1 COMMON EQUITY TIER 1 CAPITAL (net of deductions and after applying transitional adjustments) 11,006 11,323 11,656 11,978 10,774 10,870 10,990
A.1.1 Capital instruments eligible as CET1 Capital (including share premium and net own capital instruments) 497 497 497 497 497 497 497
A.1.1.1 Of which: CET1 instruments subscribed by Government 0 0 0 0 0 0 0
A.1.2 Retained earnings 11,150 11,445 11,779 12,104 11,276 11,440 11,578
A.1.3 Accumulated other comprehensive income 937 937 937 937 599 599 599
A.1.3.1 Of which: arising from unrealised gains/losses from Sovereign exposure in AFS portfolio 0 0 0 0 0 0 0
A.1.3.2 Of which: arising from unrealised gains/losses from the rest of AFS portfolio 222 222 222 222 3 3 3
A.1.4 Other Reserves 78 78 78 78 78 78 78
A.1.5 Funds for general banking risk 0 0 0 0 0 0 0
A.1.6 Minority interest given recognition in CET1 capital 0 0 0 0 0 0 0
A.1.7 Adjustments to CET1 due to prudential filters -601 -601 -601 -601 -601 -601 -601
A.1.8 (-) Intangible assets (including Goodwill) -903 -903 -903 -903 -903 -903 -903
A.1.9 (-) DTAs that rely on future profitability and do not arise from temporary differences net of associated DTLs 0 0 0 0 0 0 0
A.1.10 (-) IRB shortfall of credit risk adjustments to expected losses -153 -129 -130 -134 -172 -240 -259
A.1.11 (-) Defined benefit pension fund assets 0 0 0 0 0 0 0
A.1.12 (-) Reciprocal cross holdings in CET1 Capital 0 0 0 0 0 0 0
A.1.13 (-) Excess deduction from AT1 items over AT1 Capital 0 0 0 0 0 0 0
A.1.14 (-) Deductions related to assets which can alternatively be subject to a 1.250% risk weight 0 0 0 0 0 0 0
A.1.14.1 Of which: from securitisation positions (-) 0 0 0 0 0 0 0
A.1.15(-) Holdings of CET1 capital instruments of financial sector entities where the institiution does not have a significant
investment0 0 0 0 0 0 0
A.1.16 (-) Deductible DTAs that rely on future profitability and arise from temporary differences 0 0 0 0 0 0 0
A.1.17 (-) CET1 instruments of financial sector entities where the institiution has a significant investment 0 0 0 0 0 0 0
A.1.18 (-) Amount exceding the 17.65% threshold 0 0 0 0 0 0 0
A.1.19 (-) Additional deductions of CET1 Capital due to Article 3 CRR 0 0 0 0 0 0 0
A.1.20 CET1 capital elements or deductions - other 0 0 0 0 0 0 0
A.1.21 Transitional adjustments 0 0 0 0 0 0 0
A.1.21.1 Transitional adjustments due to grandfathered CET1 Capital instruments (+/-) 0 0 0 0 0 0 0
A.1.21.2 Transitional adjustments due to additional minority interests (+/-) 0 0 0 0 0 0 0
A.1.21.3Transitional adjustments to CET1 Capital from unrealised gains/losses from Sovereign exposure in AFS portfolio (+/-
)0 0 0 0 0 0 0
A.1.21.4 Transitional adjustments to CET1 Capital from unrealised gains/losses from the rest of AFS portfolio (+/-) 0 0 0 0 0 0 0
A.1.21.5 Other transitional adjustments to CET1 Capital 0 0 0 0 0 0 0
A.1.21.5.1 Of which: due to DTAs that rely on future profitability and do not arise from temporary differences 0 0 0 0 0 0 0
A.1.21.5.2Of which: due to DTAs that rely on future profitability and arise from temporary differences and CET1
instruments of financial sector entities where the institution has a significant investment0 0 0 0 0 0 0
A.2 ADDITIONAL TIER 1 CAPITAL (net of deductions and after transitional adjustments) 1,306 1,306 1,306 1,306 1,306 1,306 1,306
A.2.1 Additional Tier 1 Capital instruments 1,049 1,049 1,049 1,049 1,049 1,049 1,049
A.2.2 (-) Excess deduction from T2 items over T2 capital 0 0 0 0 0 0 0
A.2.3 Other Additional Tier 1 Capital components and deductions 0 0 0 0 0 0 0
A.2.4 Additional Tier 1 transitional adjustments 257 257 257 257 257 257 257
A.3 TIER 1 CAPITAL (net of deductions and after transitional adjustments) 12,312 12,630 12,962 13,285 12,080 12,176 12,296
A.4 TIER 2 CAPITAL (net of deductions and after transitional adjustments) 1,754 1,754 1,754 1,754 1,754 1,754 1,754
A.4.1 Tier 2 Capital instruments 1,877 1,877 1,877 1,877 1,877 1,877 1,877
A.4.2 Other Tier 2 Capital components and deductions -124 -124 -124 -124 -124 -124 -124
A.4.3 Tier 2 transitional adjustments 0 0 0 0 0 0 0
B TOTAL RISK EXPOSURE AMOUNT 51,795 51,829 51,856 51,884 53,833 57,151 59,252
B.1 Of which: Transitional adjustments included 0 0 0 0 0 0 0
C.1 Common Equity Tier 1 Capital ratio 21.25% 21.85% 22.48% 23.09% 20.01% 19.02% 18.55%
C.2 Tier 1 Capital ratio 23.77% 24.37% 25.00% 25.60% 22.44% 21.31% 20.75%
C.3 Total Capital ratio 27.16% 27.75% 28.38% 28.99% 25.70% 24.37% 23.71%
D.1 Common Equity Tier 1 Capital ratio (1) 21.25% 21.85% 22.48% 23.09% 20.01% 19.02% 18.55%
D.2 Tier 1 Capital ratio (2) 23.27% 23.87% 24.50% 25.11% 21.96% 20.85% 20.32%
D.3 Total Capital ratio (3) 26.66% 27.26% 27.88% 28.49% 25.22% 23.92% 23.28%
ETotal amount of instruments with mandatory conversion into ordinary shares upon a fixed date in the 2016 -2018 period
(cumulative conversions) (4)0 0 0 0 0 0 0
FTotal Additional Tier 1 and Tier 2 instruments eligible as regulatory capital under the CRR provisions that convert into
Common Equity Tier 1 or are written down upon a trigger event (5)0 0 0
F.1 Of which: eligible instruments whose trigger is above CET1 capital ratio in the adverse scenario (5) 0 0 0
G.1 Total leverage ratio exposures (transitional) 279,101 279,101 279,101 279,101 279,101 279,101 279,101
G.2 Total leverage ratio exposures (fully loaded) 279,101 279,101 279,101 279,101 279,101 279,101 279,101
G.3 Leverage ratio (transitional) 4.41% 4.53% 4.64% 4.76% 4.33% 4.36% 4.41%
G.4 Leverage ratio (fully loaded) 4.32% 4.43% 4.55% 4.67% 4.24% 4.27% 4.31%
(1) Fully loaded CET1 capital ratio estimation: [A.1-A.1.13-A.1.21+MIN(A.2+A.1.13-A.2.2-A.2.4+MIN(A.4+A.2.2-A.4.3,0),0)]/[B-B.1]
(2) Fully loaded T1 capital ratio estimation: [A.1-A.1.21+A.2-A.2.2-A.2.4+MIN(A.4+A.2.2-A.4.3,0)]/[B-B.1]
(3) Fully loaded Total capital ratio estimation: [A.1-A.1.21+A.2-A.2.4+A.4-A.4.3)/[B-B.1]. This ratio does not include grandfathered AT1 capital instruments meeting the conditions laid down in Article 63 of CRR and, hence, eligible as fully loaded T2 capital. Therefore, the ratio could be underestimated for banks with material instruments of such kind.
(4) Conversions not considered for CET1 computation
(5) Excluding instruments included in row E
Memorandum items
Baseline Scenario Adverse Scenario
CAPITAL RATIOS (%)
Transitional period
Svenska Handelsbanken - group
OWN FUNDS
CAPITAL RATIOS (%)
Fully loaded
TOTAL RISK EXPOSURE
AMOUNT

(mln EUR)
Of which:
defaulted
Debt securities (including at amortised cost and fair value) 7,873 0 0 0 0 0 0
Central banks 2,301
General governments 1,900
Credit institutions 3,672
Other financial corporations 0
Non-financial corporations 0
Loans and advances(including at amortised cost and fair value) 215,124 52 1,198 1,198 -41 -486 426
Central banks 3,736
General governments 2,599 0 0 0 0 0 0
Credit institutions 5,321 0 0 0 0 0 0
Other financial corporations 2,580 0 0 0 0 0 0
Non-financial corporations 95,019 13 857 857 -21 -355 294
Households 105,869 39 341 341 -20 -131 132
DEBT INSTRUMENTS other than HFT 222,997 52 1,198 1,198 -41 -486 426
OFF-BALANCE SHEET EXPOSURES 54,070 12 12 4 0 21 For the definition of non-performing exposures please refer to COMMISSION IMPLEMENTING REGULATION (EU) 2015/227 of 9 January 2015, ANNEX V, Part 2-Template related instructions, subtitle 29
2 Insitutions report here collective allowances for incurrred but not reported losses (instruments at amortised cost) and changes in fair value of performing exposures due to credit risk and provisions (instruments at fair value other than HFT)
3 Insitutions report here specific allowances for financial assets, individually and collectively estimated (instruments at amortised cost) and changes in fair value of NPE due to credit risk and provisions (instruments at fair value other than HFT)
On non-performing
exposures3
2016 EU-wide Stress Test Information on performing and non-performing exposures
1
31/12/2015
Gross carrying amount
Accumulated impairment,
accumulated changes in fair value due
to credit risk and provisions Collaterals and
financial
guarantees
received on non-
performing
exposures
Of which performing
but past due >30 days
and <=90 days
Of which non-performing
On performing
exposures2
Svenska Handelsbanken - group

(mln EUR)
Debt securities (including at amortised cost and fair value) 0 0 0 0 0
Central banks
General governments
Credit institutions
Other financial corporations
Non-financial corporations
Loans and advances (including at amortised cost and fair value) 1,455 862 346 338 694
Central banks 0 0 0 0 0
General governments 0 0 0 0 0
Credit institutions 0 0 0 0 0
Other financial corporations 0 0 0 0 0
Non-financial corporations 1,171 734 296 289 549
Households 284 127 50 49 145
DEBT INSTRUMENTS other than HFT 1,455 862 346 338 694
Loan commitments given 26 1 1 0 41 For the definition of forborne exposures please refer to COMMISSION IMPLEMENTING REGULATION (EU) 2015/227 of 9 January 2015, ANNEX V, Part 2-Template related instructions, subtitle 30
2016 EU-wide Stress Test Information on forborne exposures
1
31/12/2015
Of which non-
performing
exposures with
forbearance
measures
Of which on non-
performing
exposures with
forbearance
measures
Gross carrying amount of exposures
with forbearance measures
Accumulated impairment, accumulated
changes in fair value due to credit risk
and provisions for exposures with
forbearance measures Collateral and financial
guarantees received on
exposures with forbearance
measures
Svenska Handelsbanken - group