2016 EU-wide stress test - Presentation to analysts · 2016 EU‐wide stress test: Presentation to...
20
2016 EU‐wide stress test: Presentation to analysts 30/7/2016
Transcript of 2016 EU-wide stress test - Presentation to analysts · 2016 EU‐wide stress test: Presentation to...
2016 EU‐wide stress test: Presentation to analysts
30/7/2016
2016 EU‐wide stress test exercise ‐ Key features
2
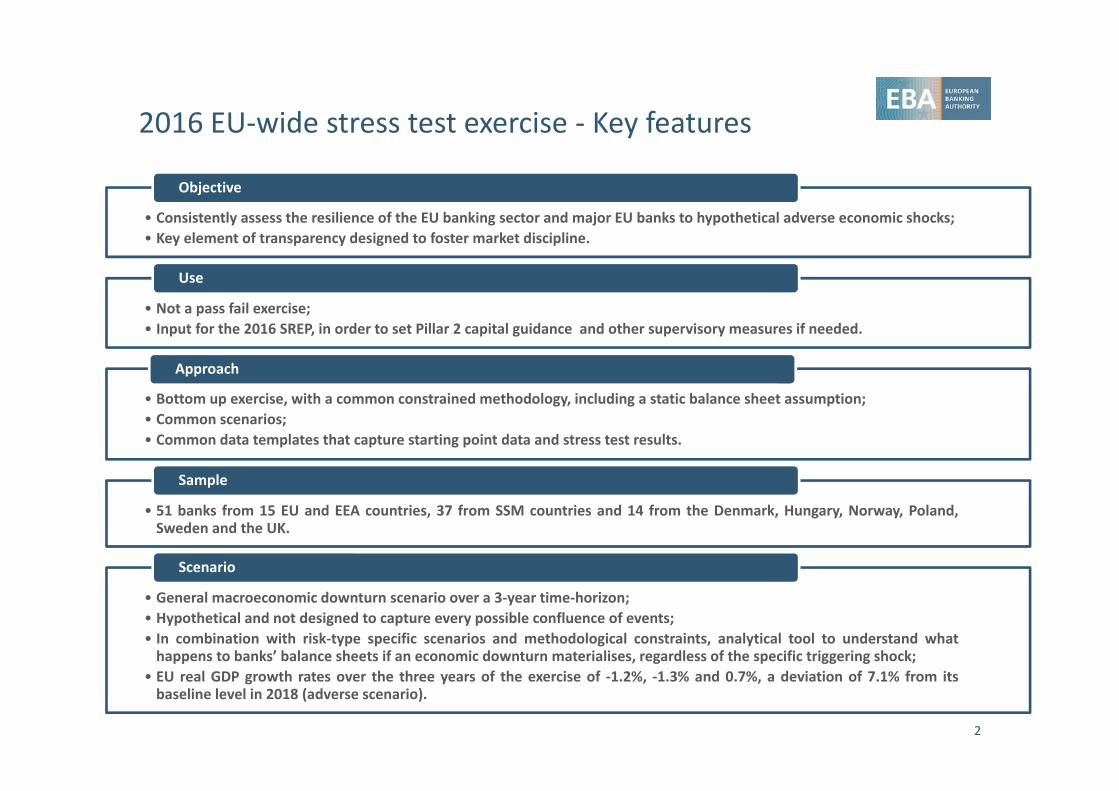
• Consistently assess the resilience of the EU banking sector and major EU banks to hypothetical adverse economic shocks;• Key element of transparency designed to foster market discipline.
Objective
• Not a pass fail exercise;• Input for the 2016 SREP, in order to set Pillar 2 capital guidance and other supervisory measures if needed.
Use
• Bottom up exercise, with a common constrained methodology, including a static balance sheet assumption;• Common scenarios;• Common data templates that capture starting point data and stress test results.
Approach
• 51 banks from 15 EU and EEA countries, 37 from SSM countries and 14 from the Denmark, Hungary, Norway, Poland,Sweden and the UK.
Sample
• General macroeconomic downturn scenario over a 3‐year time‐horizon;• Hypothetical and not designed to capture every possible confluence of events;• In combination with risk‐type specific scenarios and methodological constraints, analytical tool to understand whathappens to banks’ balance sheets if an economic downturn materialises, regardless of the specific triggering shock;
• EU real GDP growth rates over the three years of the exercise of ‐1.2%, ‐1.3% and 0.7%, a deviation of 7.1% from itsbaseline level in 2018 (adverse scenario).
Scenario
Macroeconomic adverse scenario
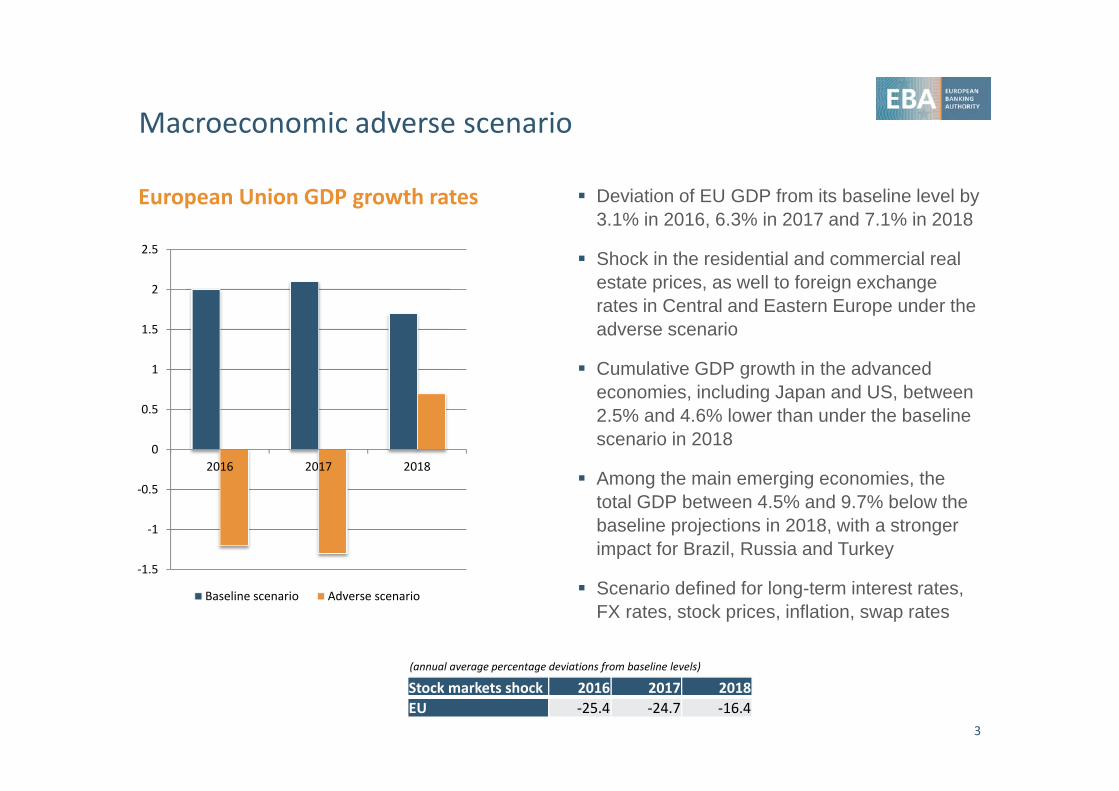
Deviation of EU GDP from its baseline level by 3.1% in 2016, 6.3% in 2017 and 7.1% in 2018
Shock in the residential and commercial real estate prices, as well to foreign exchange rates in Central and Eastern Europe under the adverse scenario
Cumulative GDP growth in the advanced economies, including Japan and US, between 2.5% and 4.6% lower than under the baseline scenario in 2018
Among the main emerging economies, the total GDP between 4.5% and 9.7% below the baseline projections in 2018, with a stronger impact for Brazil, Russia and Turkey
Scenario defined for long-term interest rates, FX rates, stock prices, inflation, swap rates
European Union GDP growth rates
‐1.5
‐1
‐0.5
0
0.5
1
1.5
2
2.5
2016 2017 2018
Baseline scenario Adverse scenario
3
Stock markets shock 2016 2017 2018EU ‐25.4 ‐24.7 ‐16.4
(annual average percentage deviations from baseline levels)
2016 EU‐wide stress test exercise – Key results
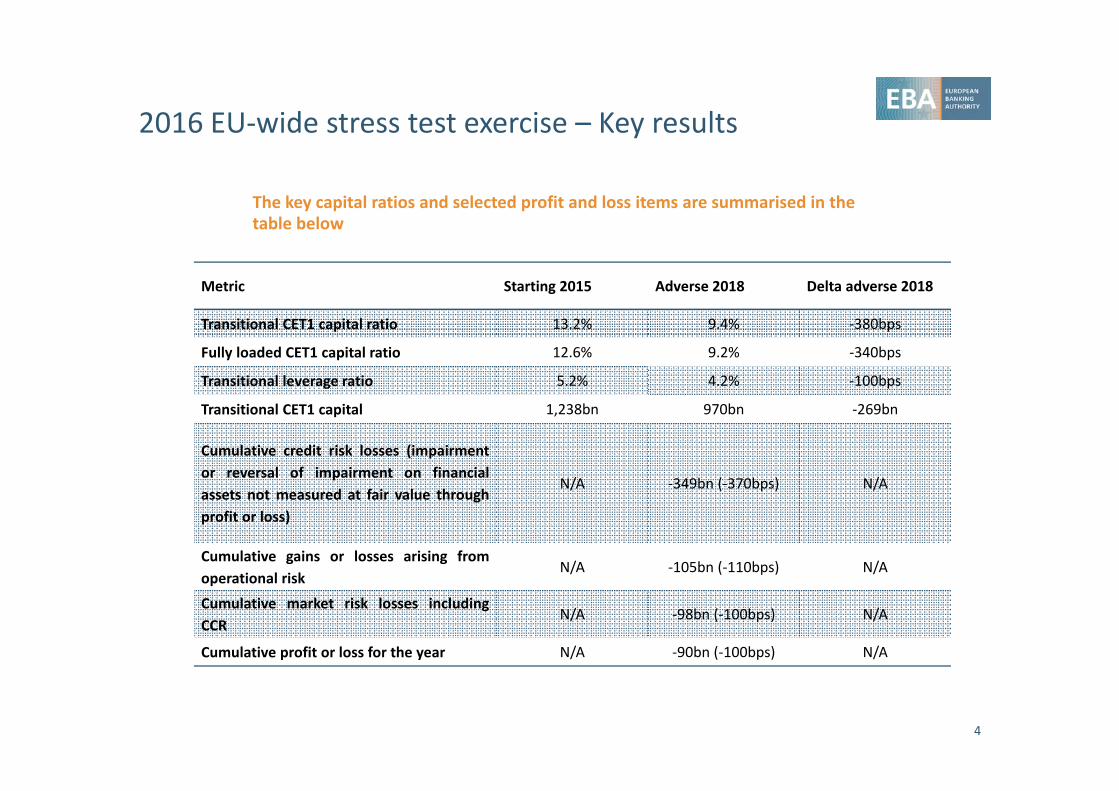
Metric Starting 2015 Adverse 2018 Delta adverse 2018
Transitional CET1 capital ratio 13.2% 9.4% ‐380bps
Fully loaded CET1 capital ratio 12.6% 9.2% ‐340bps
Transitional leverage ratio 5.2% 4.2% ‐100bps
Transitional CET1 capital 1,238bn 970bn ‐269bn
Cumulative credit risk losses (impairmentor reversal of impairment on financialassets not measured at fair value throughprofit or loss)
N/A ‐349bn (‐370bps) N/A
Cumulative gains or losses arising fromoperational risk
N/A ‐105bn (‐110bps) N/A
Cumulative market risk losses includingCCR
N/A ‐98bn (‐100bps) N/A
Cumulative profit or loss for the year N/A ‐90bn (‐100bps) N/A
4
The key capital ratios and selected profit and loss items are summarised in the table below
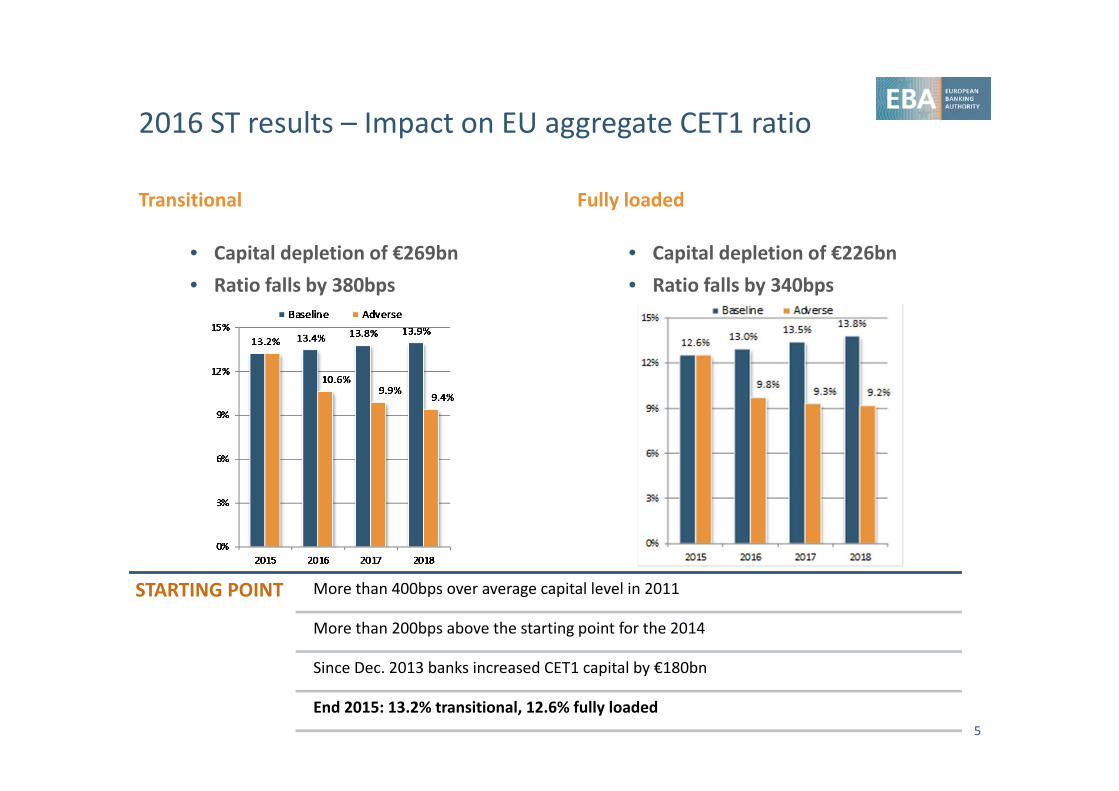
2016 ST results – Impact on EU aggregate CET1 ratio
Transitional
• Capital depletion of €269bn• Ratio falls by 380bps
Fully loaded
• Capital depletion of €226bn• Ratio falls by 340bps
5
STARTING POINT More than 400bps over average capital level in 2011
More than 200bps above the starting point for the 2014
Since Dec. 2013 banks increased CET1 capital by €180bn
End 2015: 13.2% transitional, 12.6% fully loaded
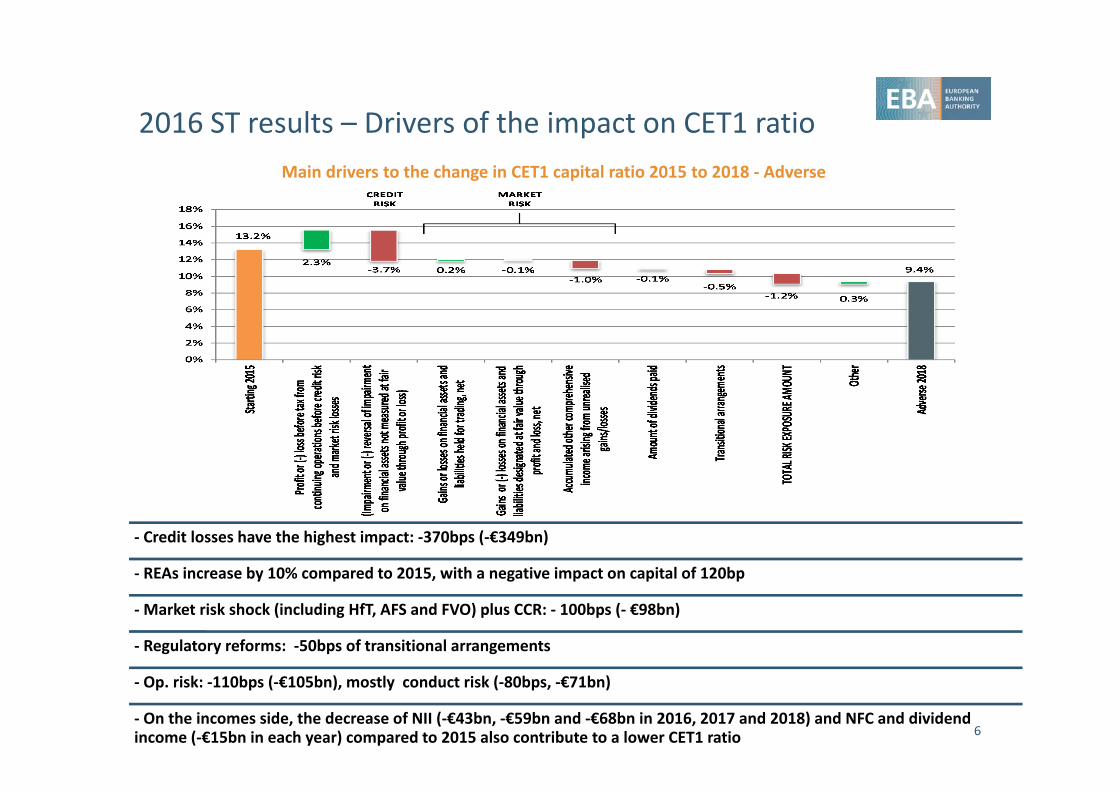
2016 ST results – Drivers of the impact on CET1 ratio
6
Main drivers to the change in CET1 capital ratio 2015 to 2018 ‐ Adverse
‐ Credit losses have the highest impact: ‐370bps (‐€349bn)
‐ REAs increase by 10% compared to 2015, with a negative impact on capital of 120bp
‐Market risk shock (including HfT, AFS and FVO) plus CCR: ‐ 100bps (‐ €98bn)
‐ Regulatory reforms: ‐50bps of transitional arrangements
‐ Op. risk: ‐110bps (‐€105bn), mostly conduct risk (‐80bps, ‐€71bn)
‐ On the incomes side, the decrease of NII (‐€43bn, ‐€59bn and ‐€68bn in 2016, 2017 and 2018) and NFC and dividend income (‐€15bn in each year) compared to 2015 also contribute to a lower CET1 ratio
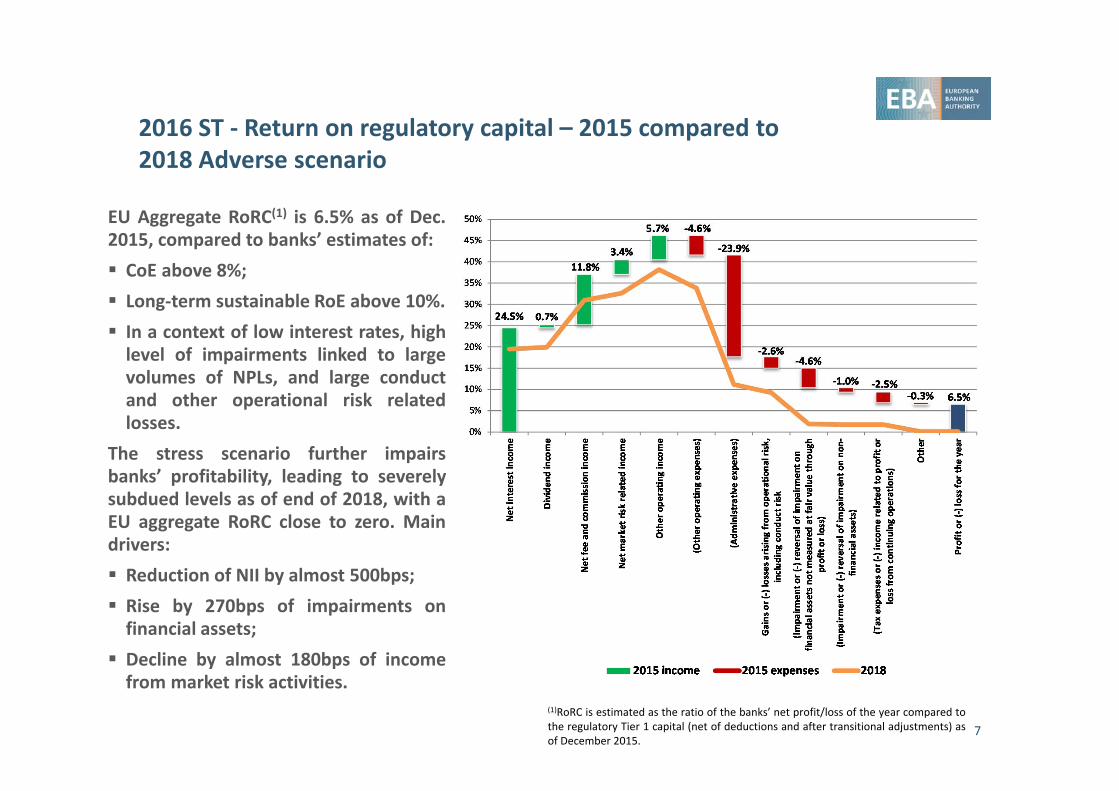
2016 ST ‐ Return on regulatory capital – 2015 compared to 2018 Adverse scenario
EU Aggregate RoRC(1) is 6.5% as of Dec.2015, compared to banks’ estimates of: CoE above 8%; Long‐term sustainable RoE above 10%. In a context of low interest rates, highlevel of impairments linked to largevolumes of NPLs, and large conductand other operational risk relatedlosses.
The stress scenario further impairsbanks’ profitability, leading to severelysubdued levels as of end of 2018, with aEU aggregate RoRC close to zero. Maindrivers: Reduction of NII by almost 500bps; Rise by 270bps of impairments onfinancial assets;
Decline by almost 180bps of incomefrom market risk activities.
7
(1)RoRC is estimated as the ratio of the banks’ net profit/loss of the year compared tothe regulatory Tier 1 capital (net of deductions and after transitional adjustments) asof December 2015.
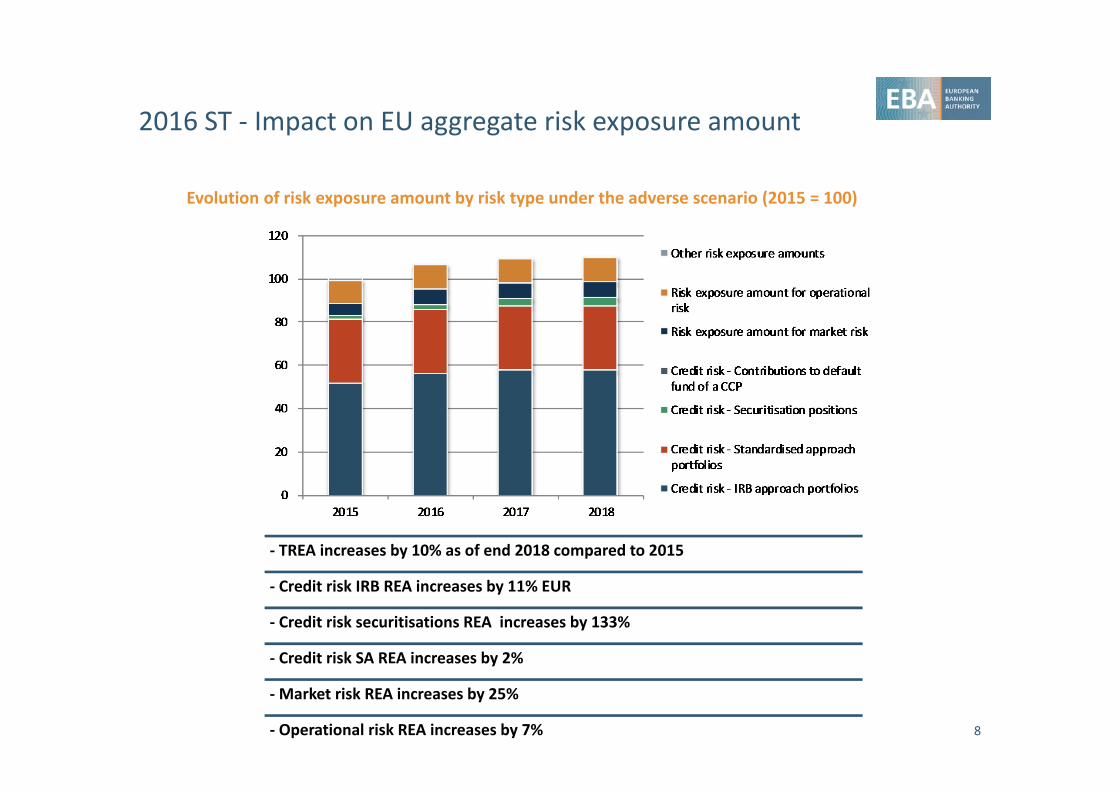
2016 ST ‐ Impact on EU aggregate risk exposure amount
Evolution of risk exposure amount by risk type under the adverse scenario (2015 = 100)
8
‐ TREA increases by 10% as of end 2018 compared to 2015
‐ Credit risk IRB REA increases by 11% EUR
‐ Credit risk securitisations REA increases by 133%
‐ Credit risk SA REA increases by 2%
‐Market risk REA increases by 25%
‐ Operational risk REA increases by 7%
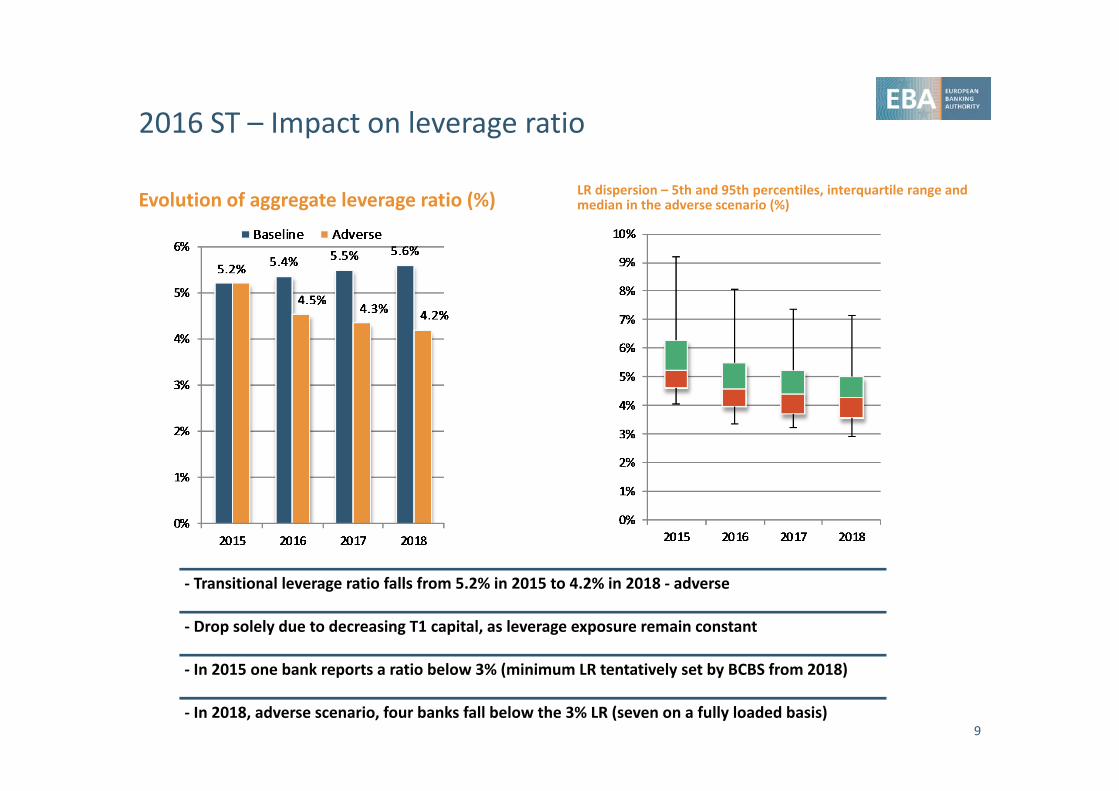
2016 ST – Impact on leverage ratio
Evolution of aggregate leverage ratio (%) LR dispersion – 5th and 95th percentiles, interquartile range and median in the adverse scenario (%)
9
‐ Transitional leverage ratio falls from 5.2% in 2015 to 4.2% in 2018 ‐ adverse
‐ Drop solely due to decreasing T1 capital, as leverage exposure remain constant
‐ In 2015 one bank reports a ratio below 3% (minimum LR tentatively set by BCBS from 2018)
‐ In 2018, adverse scenario, four banks fall below the 3% LR (seven on a fully loaded basis)
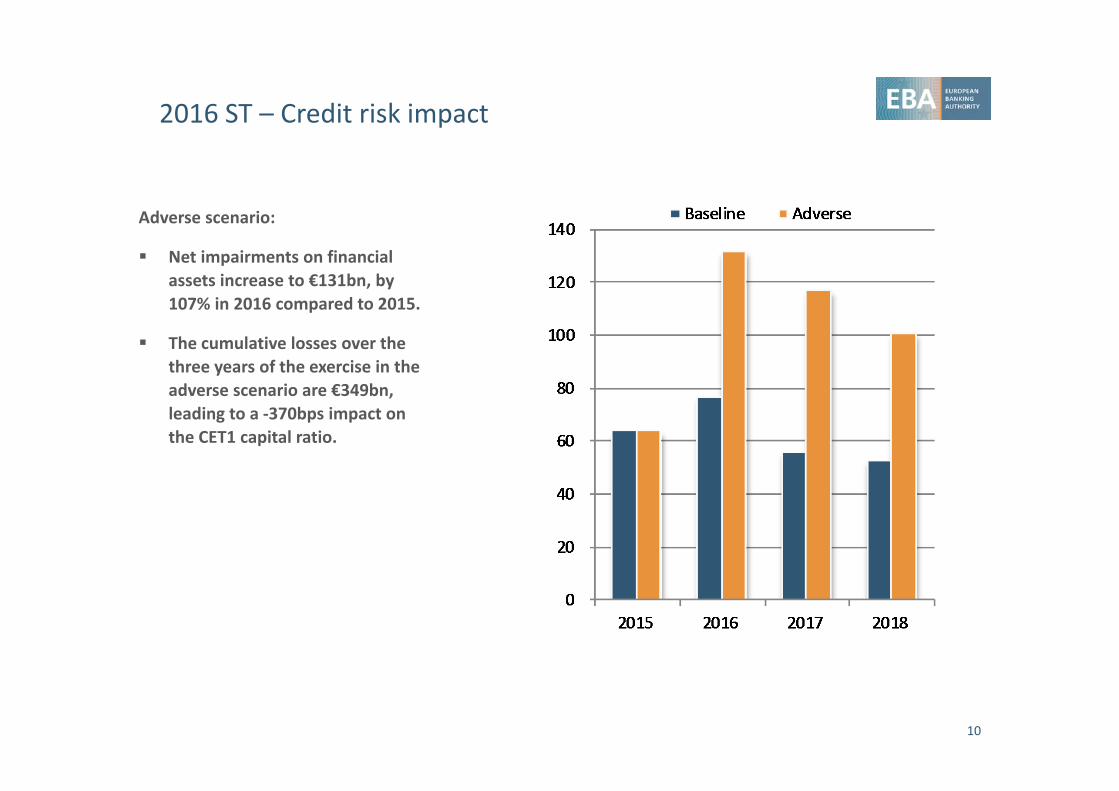
2016 ST – Credit risk impact
Adverse scenario:
Net impairments on financial assets increase to €131bn, by 107% in 2016 compared to 2015.
The cumulative losses over the three years of the exercise in the adverse scenario are €349bn, leading to a ‐370bps impact on the CET1 capital ratio.
10
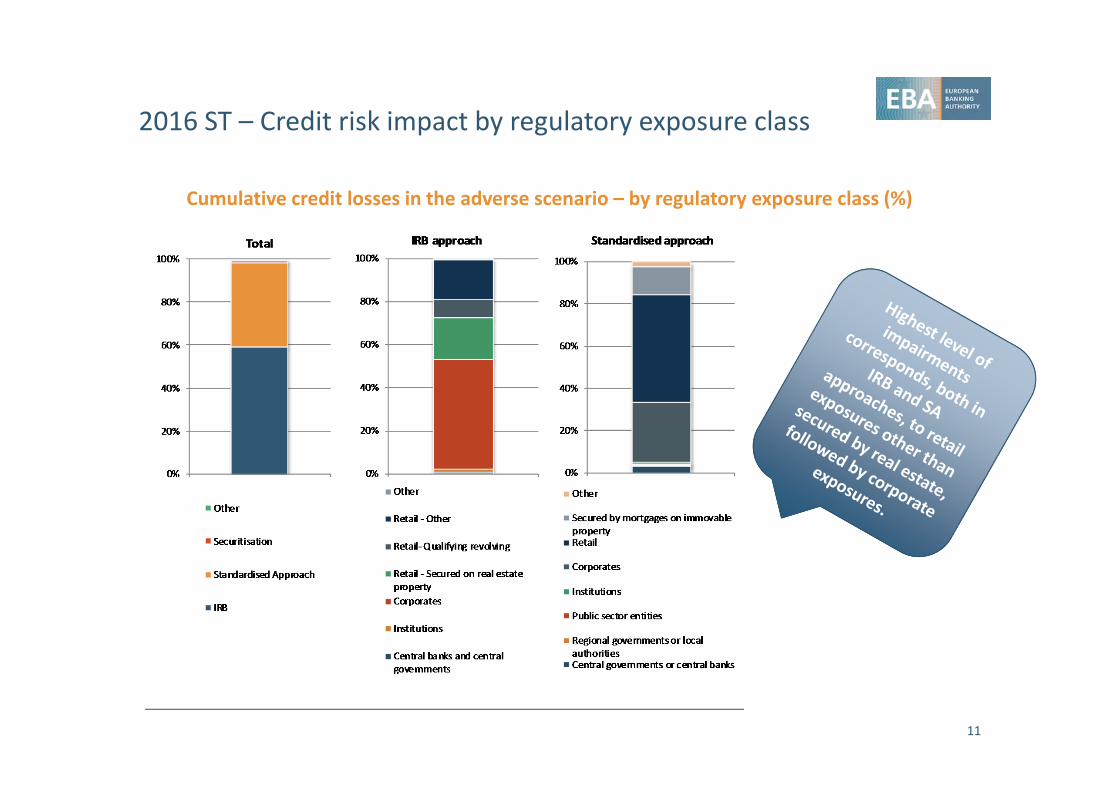
2016 ST – Credit risk impact by regulatory exposure class
11
Cumulative credit losses in the adverse scenario – by regulatory exposure class (%)
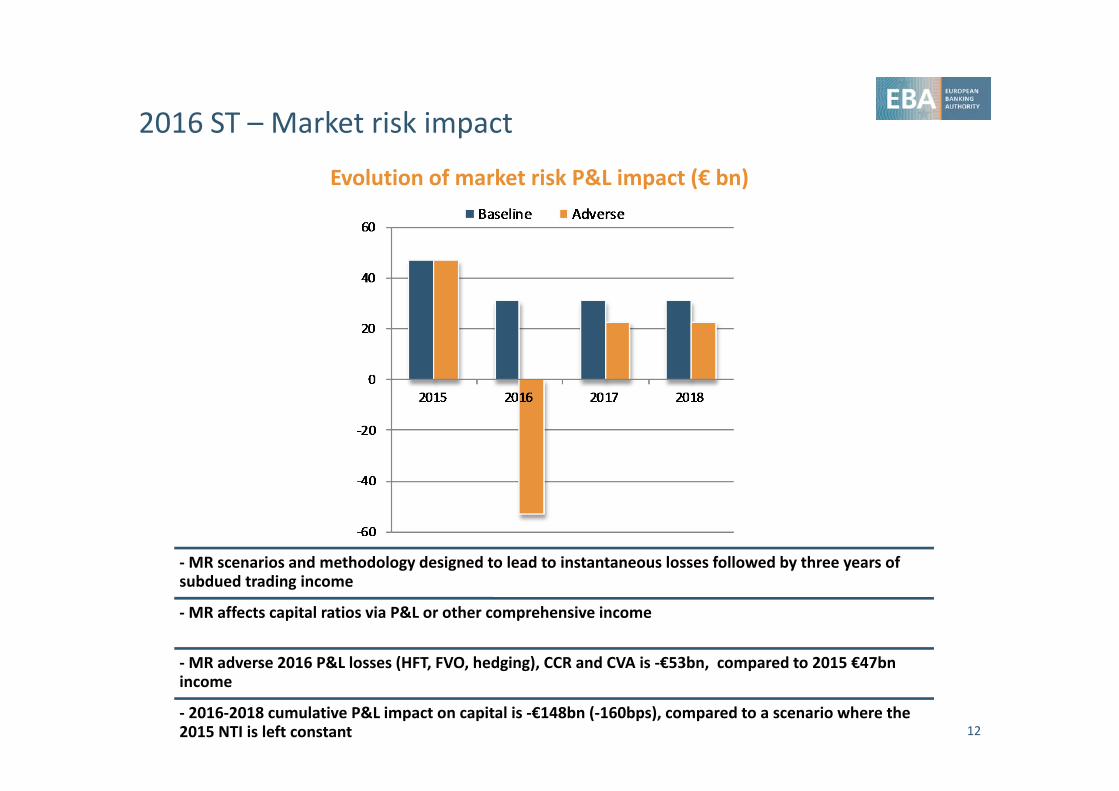
2016 ST – Market risk impact
12
Evolution of market risk P&L impact (€ bn)
‐MR scenarios and methodology designed to lead to instantaneous losses followed by three years of subdued trading income
‐MR affects capital ratios via P&L or other comprehensive income
‐MR adverse 2016 P&L losses (HFT, FVO, hedging), CCR and CVA is ‐€53bn, compared to 2015 €47bn income
‐ 2016‐2018 cumulative P&L impact on capital is ‐€148bn (‐160bps), compared to a scenario where the 2015 NTI is left constant
2016 ST – Impact on sovereign exposures (AFS and FVO)
13
‐ Net direct exposure of banks in the sample to sovereigns is €2,600bn across all accounting portfolios
‐ Largest exposures are towards Germany, France, Spain, Italy and the US
‐ AFS/FVO: 55% of exposures, stressed with hypothetical stressed market values
‐ Credit spread and interest rate risk losses after hedging: 3.4% of total exposures
‐ HTM and L&R faced a stress of credit risk losses; and HFT as part of the shock to NTI
2016 ST – Impact on NII
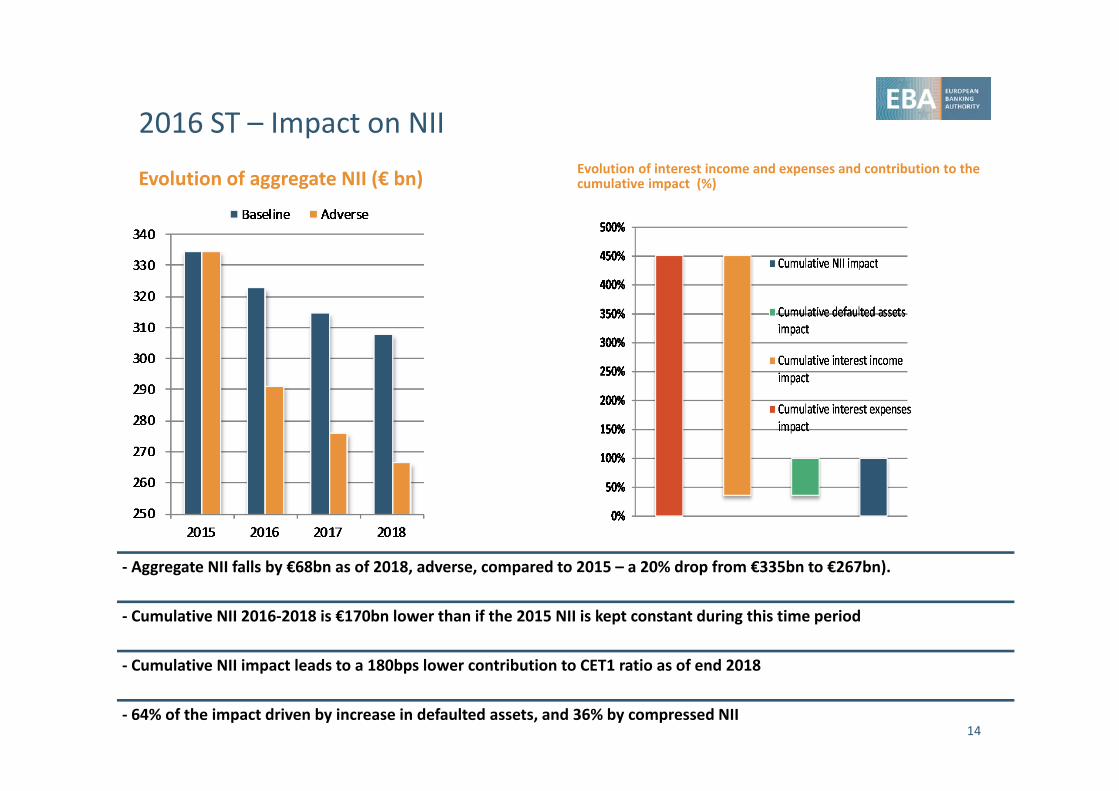
Evolution of aggregate NII (€ bn) Evolution of interest income and expenses and contribution to the cumulative impact (%)
14
‐ Aggregate NII falls by €68bn as of 2018, adverse, compared to 2015 – a 20% drop from €335bn to €267bn).
‐ Cumulative NII 2016‐2018 is €170bn lower than if the 2015 NII is kept constant during this time period
‐ Cumulative NII impact leads to a 180bps lower contribution to CET1 ratio as of end 2018
‐ 64% of the impact driven by increase in defaulted assets, and 36% by compressed NII
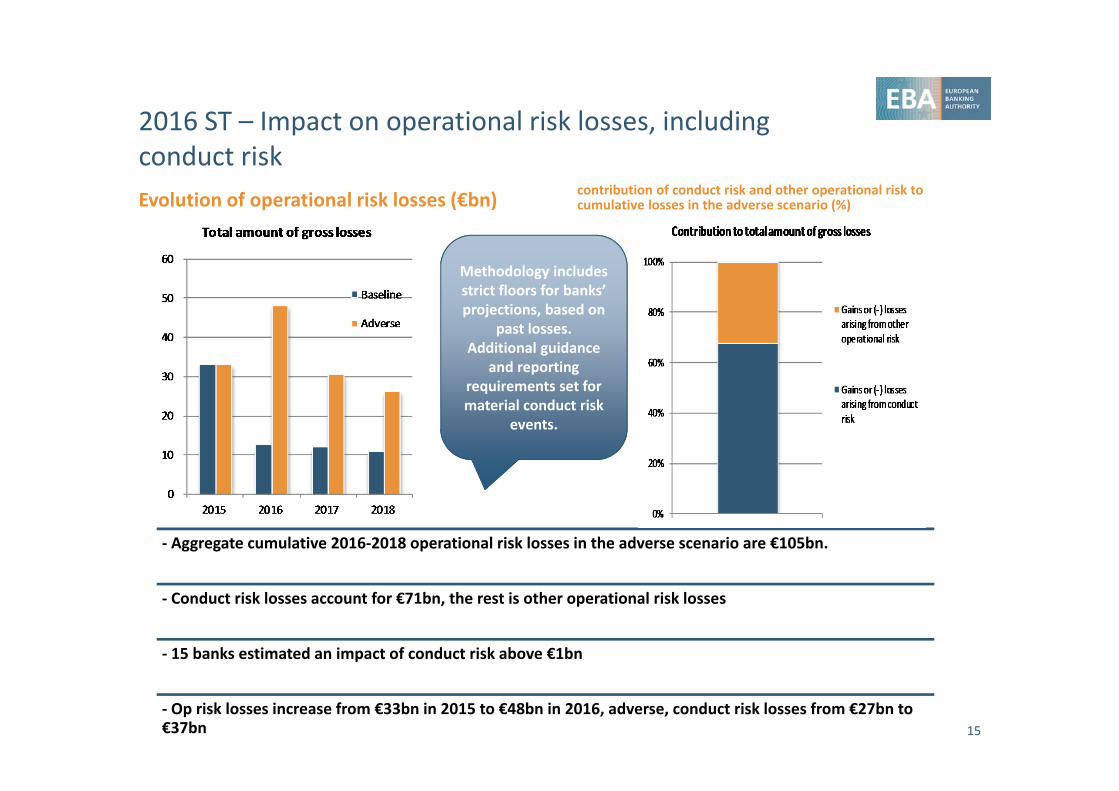
2016 ST – Impact on operational risk losses, including conduct riskEvolution of operational risk losses (€bn) contribution of conduct risk and other operational risk to
cumulative losses in the adverse scenario (%)
15
‐ Aggregate cumulative 2016‐2018 operational risk losses in the adverse scenario are €105bn.
‐ Conduct risk losses account for €71bn, the rest is other operational risk losses
‐ 15 banks estimated an impact of conduct risk above €1bn
‐ Op risk losses increase from €33bn in 2015 to €48bn in 2016, adverse, conduct risk losses from €27bn to €37bn
Methodology includes strict floors for banks’ projections, based on
past losses.Additional guidance
and reporting requirements set for material conduct risk
events.
2016 ST – Impact on non‐interest income, expenses and capital
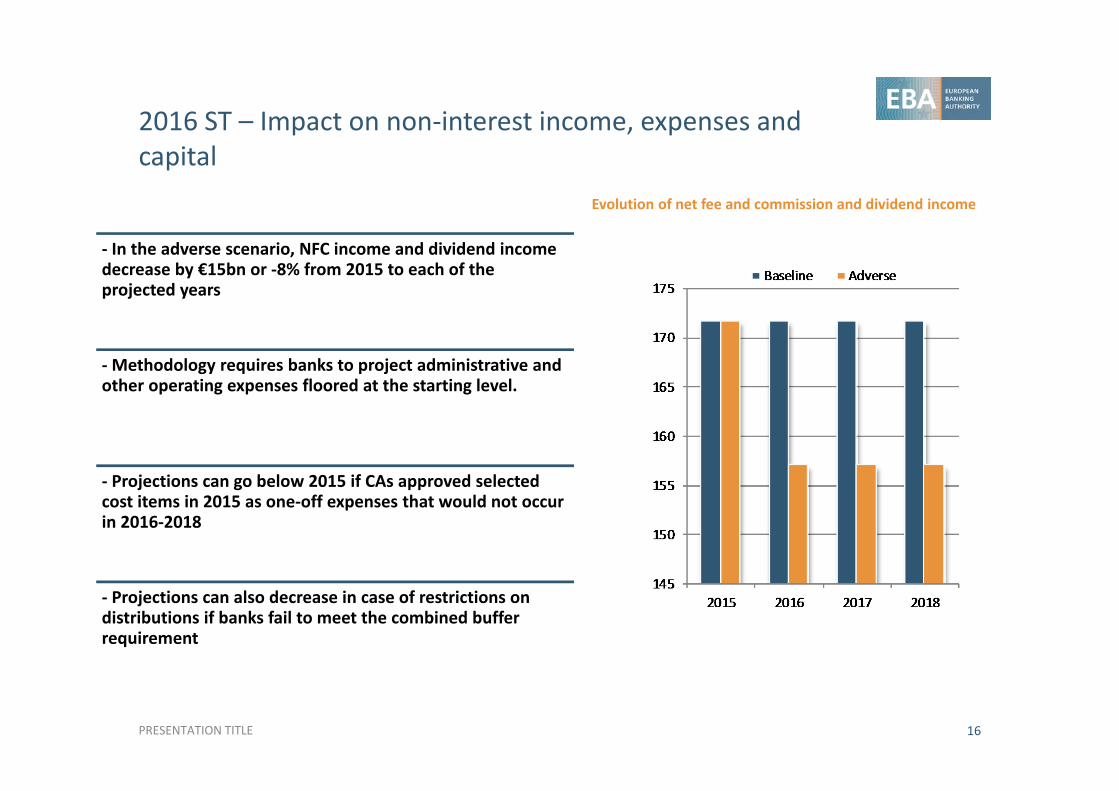
Evolution of net fee and commission and dividend income
PRESENTATION TITLE 16
‐ In the adverse scenario, NFC income and dividend income decrease by €15bn or ‐8% from 2015 to each of the projected years
‐Methodology requires banks to project administrative and other operating expenses floored at the starting level.
‐ Projections can go below 2015 if CAs approved selected cost items in 2015 as one‐off expenses that would not occur in 2016‐2018
‐ Projections can also decrease in case of restrictions on distributions if banks fail to meet the combined buffer requirement
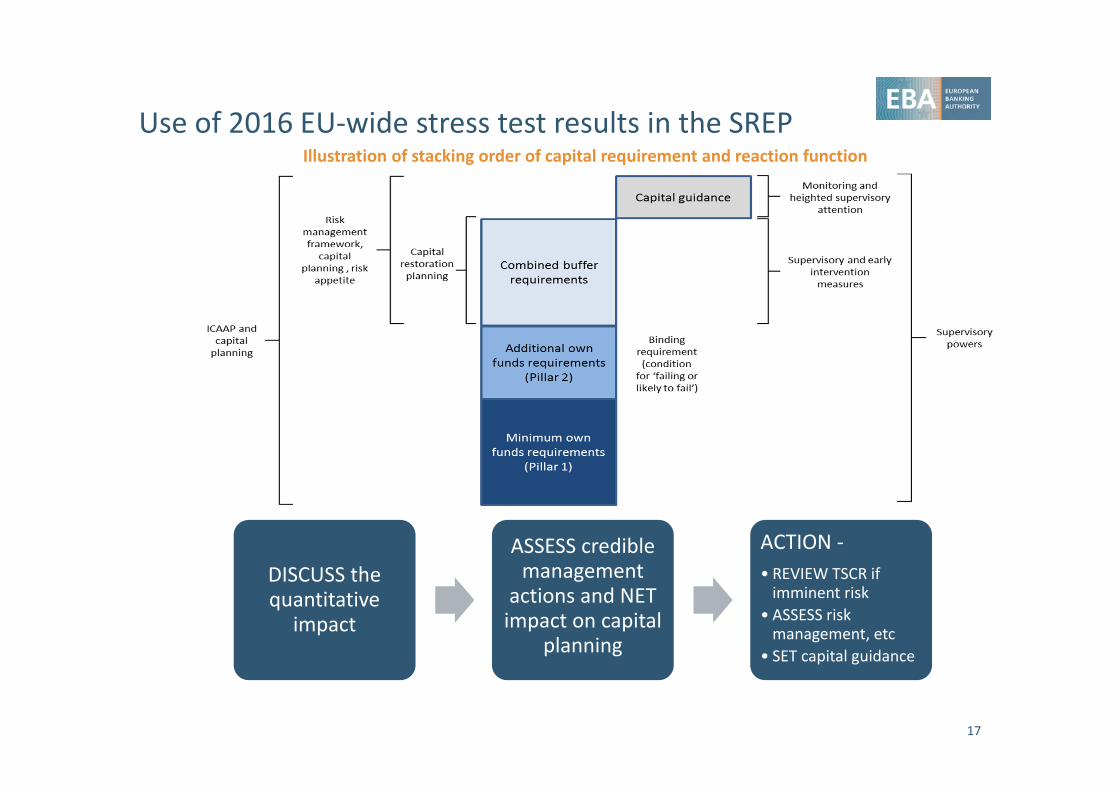
Use of 2016 EU‐wide stress test results in the SREP
17
Illustration of stacking order of capital requirement and reaction function
DISCUSS the quantitative
impact
ASSESS credible management
actions and NET impact on capital
planning
ACTION ‐• REVIEW TSCR if imminent risk
• ASSESS risk management, etc
• SET capital guidance
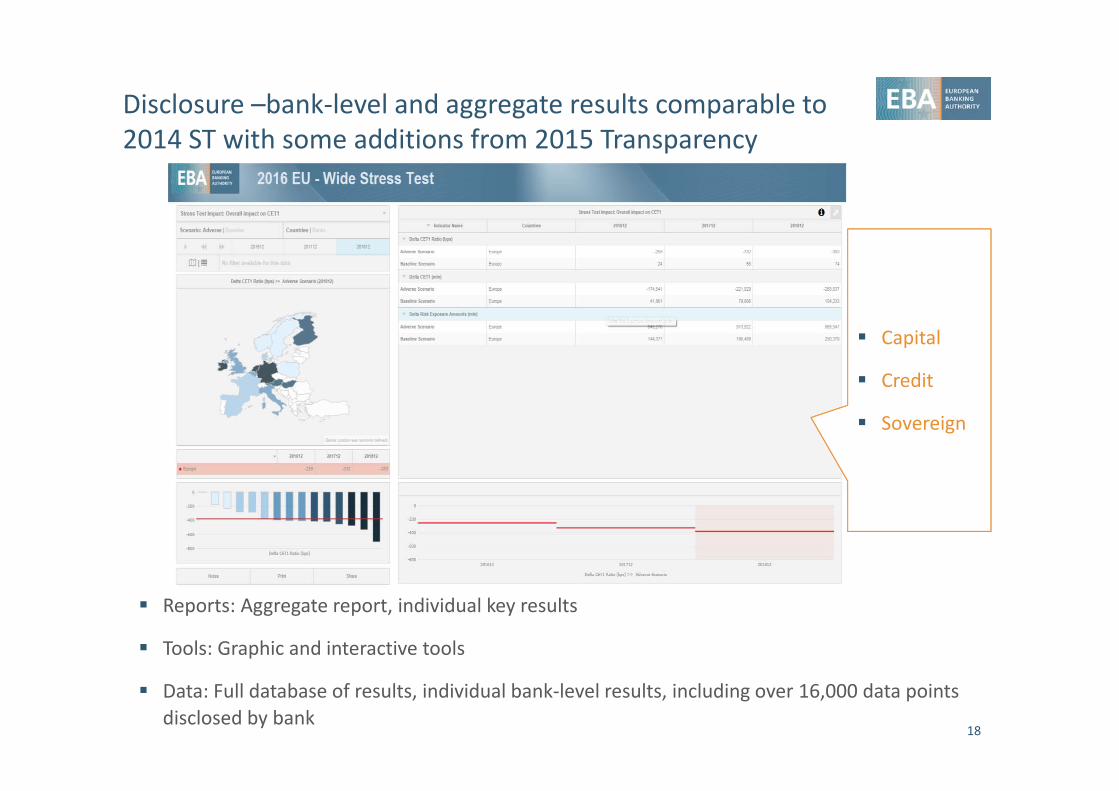
Disclosure –bank‐level and aggregate results comparable to 2014 ST with some additions from 2015 Transparency
18
Reports: Aggregate report, individual key results
Tools: Graphic and interactive tools
Data: Full database of results, individual bank‐level results, including over 16,000 data points disclosed by bank
Capital
Credit
Sovereign

Q&As
PRESENTATION TITLE 19
EUROPEAN BANKING AUTHORITY
Floor 46, One Canada Square, London E14 5AA
Tel: +44 207 382 1776Fax: +44 207 382 1771
E‐mail: [email protected]://www.eba.europa.eu