2014 EU-wide Stress Test - European Banking Authority. 2014 EU-wide Stress Test 2014 EU-wide Stress...
16
Bank Name ES - Banco Popular Español, S.A. LEI Code 80H66LPTVDLM0P28XF25 ES NUK_WL_NR_XX version 1809014 No restructuring 2014 EU-wide Stress Test
Transcript of 2014 EU-wide Stress Test - European Banking Authority. 2014 EU-wide Stress Test 2014 EU-wide Stress...

Bank Name ES - Banco Popular Español, S.A.
LEI Code 80H66LPTVDLM0P28XF25
ES
NUK_WL_NR_XX
version
1809014
No restructuring
2014 EU-wide Stress Test
Actual figures as of 31 December 2013 mln EUR, % Actual figures as of 31 December 2013 mln EUR, %
Operating profit before impairments 2,771 Operating profit before impairments 2,771
Impairment losses on financial and non-financial assets in the banking book 3,034 Impairment losses on financial and non-financial assets in the banking book 3,034
Common Equity Tier 1 capital (1) 8,481 Common Equity Tier 1 capital (1) 8,481
Total Risk Exposure (1) 84,293 Total Risk Exposure (1) 84,293
Common Equity Tier 1 ratio, % (1) 10.1% Common Equity Tier 1 ratio, % (1) 10.1%
Outcome of the adverse scenario as of 31 December 2016 mln EUR, % Outcome of the baseline scenario as of 31 December 2016 mln EUR, %
3 yr cumulative operating profit before impairments 2,867 3 yr cumulative operating profit before impairments 4,924
3 yr cumulative impairment losses on financial and non-financial assets in the banking book 5,194 3 yr cumulative impairment losses on financial and non-financial assets in the banking book 3,065
3 yr cumulative losses from the stress in the trading book 107 3 yr cumulative losses from the stress in the trading book 69
Valuation losses due to sovereign shock after tax and prudential filters 342 Common Equity Tier 1 capital (1) 9,258
Common Equity Tier 1 capital (1) 6,434 Total Risk Exposure (1) 84,664
Total Risk Exposure (1) 85,052 Common Equity Tier 1 ratio, % (1) 10.9%
Common Equity Tier 1 ratio, % (1) 7.6%
Memorandum items mln EUR
Memorandum items mln EUR Common EU wide CET1 Threshold (8.0%) 6,773
Common EU wide CET1 Threshold (5.5%) 4,678
Total amount of instruments with mandatory conversion into ordinary shares upon a fixed date in
the 2014 -2016 period (cumulative conversions) (2)773
Total Additional Tier 1 and Tier 2 instruments eligible as regulatory capital under the CRR provisions
that convert into Common Equity Tier 1 or are written down upon a trigger event (3)500
Of which: eligible instruments whose trigger is above CET1 capital ratio in the adverse
scenario (3)0
(2) Conversions not considered for CET1 computation
(3) Excluding instruments with mandatory conversion into ordinary shares upon a fixed date in the 2014 -2016 period
(1) According to CRR/CRD4 definition transitional arrangements as per reporting date. Figures as of 31/12/2013 computed as of first day of application:
01/01/2014.
2014 EU-wide Stress Test 2014 EU-wide Stress TestSummary Baseline Scenario
ES - Banco Popular Español, S.A.
(1) According to CRR/CRD4 definition transitional arrangements as per reporting date. Figures as of 31/12/2013 computed as of first day of application:
01/01/2014.
Summary Adverse Scenario
ES - Banco Popular Español, S.A.
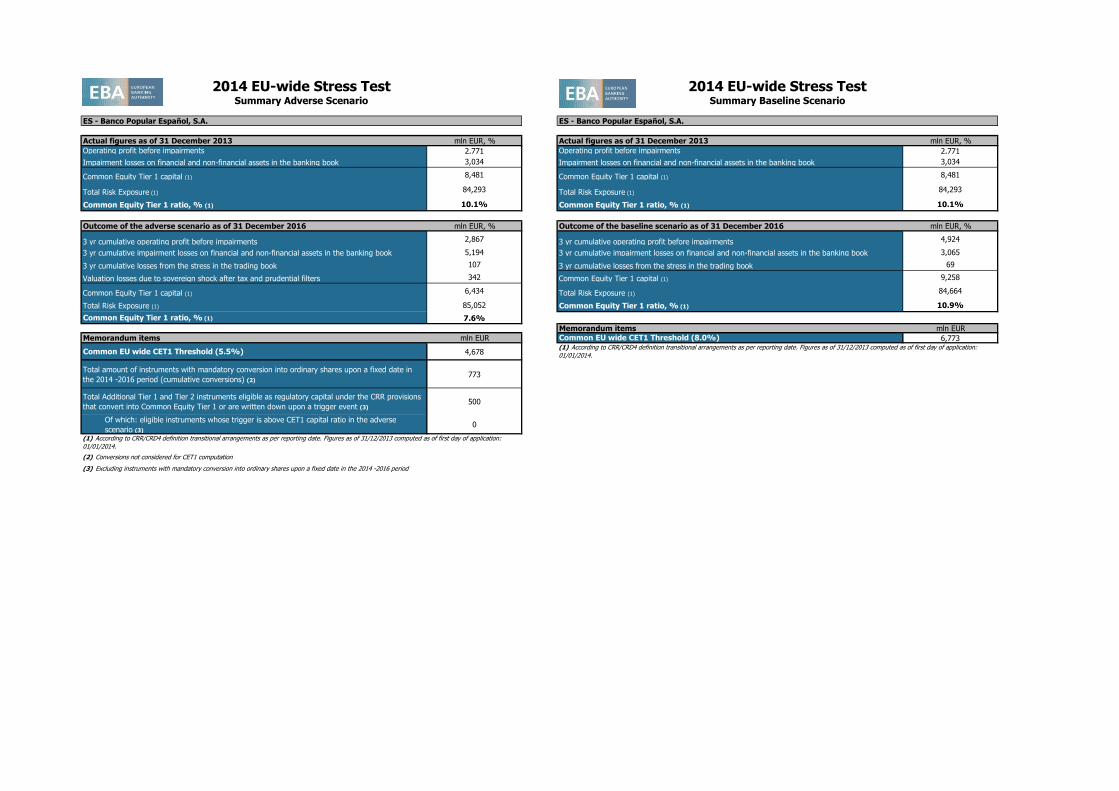
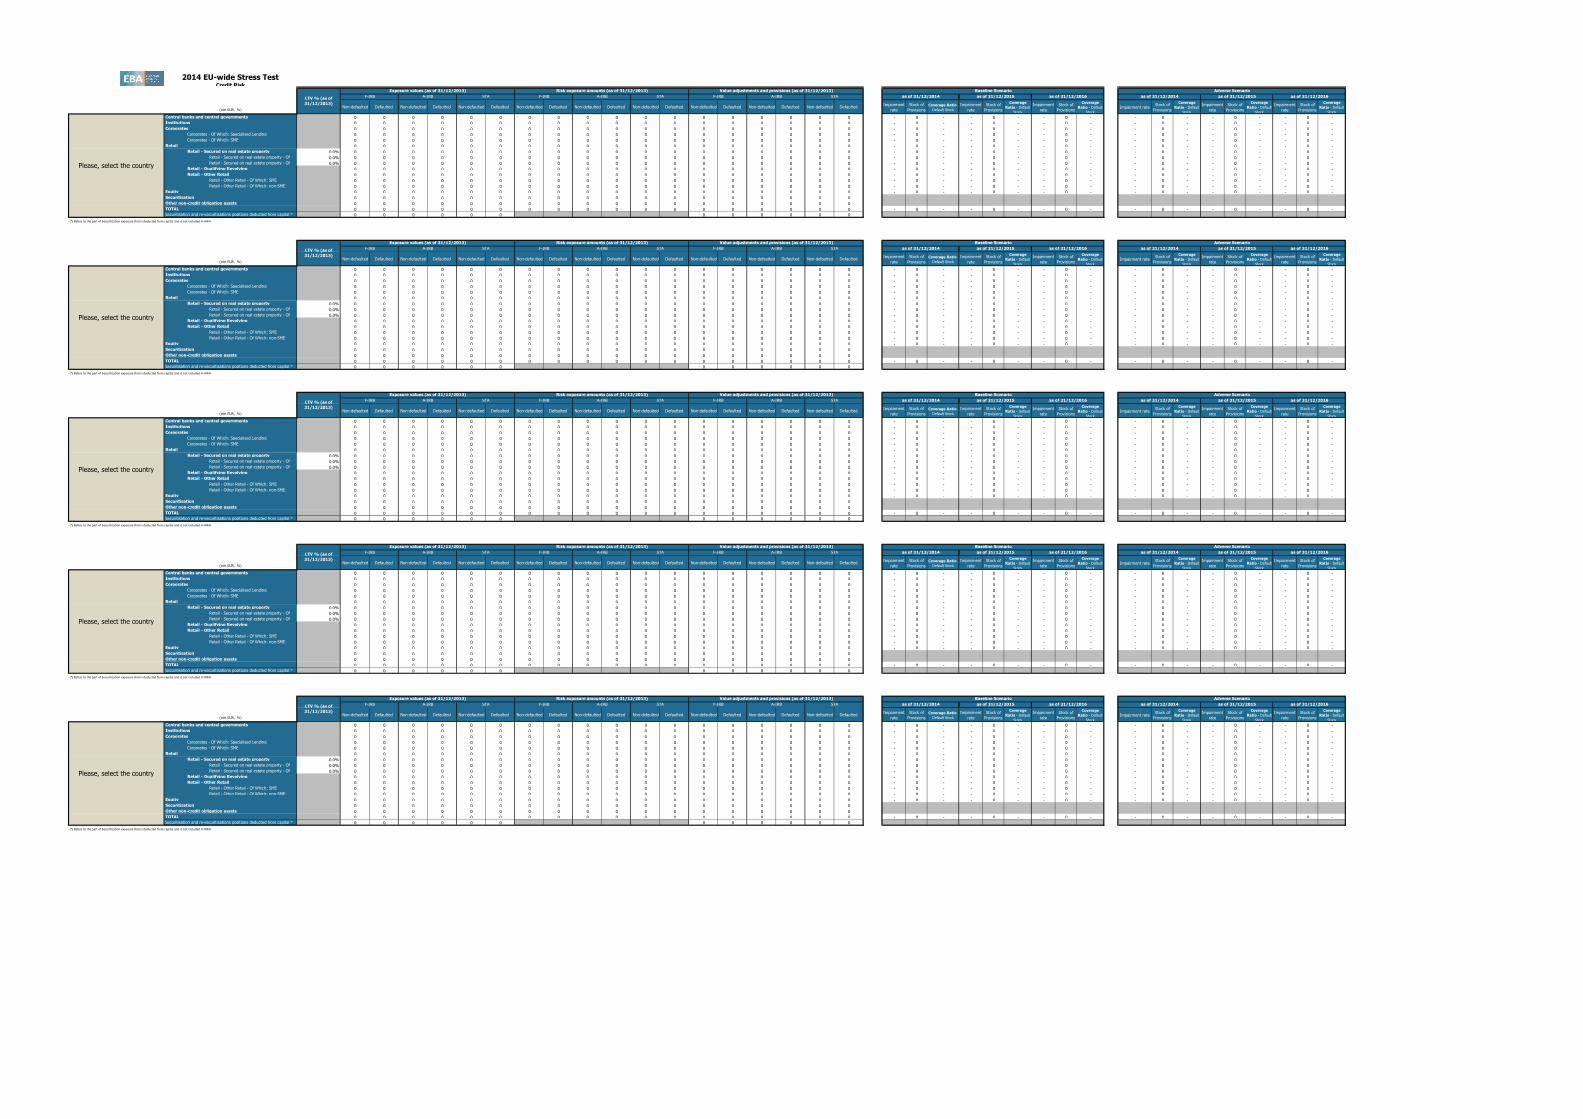
2014 EU-wide Stress TestCredit Risk
(mln EUR, %)
Non-defaulted Defaulted Non-defaulted Defaulted Non-defaulted Defaulted Non-defaulted Defaulted Non-defaulted Defaulted Non-defaulted Defaulted Non-defaulted Defaulted Non-defaulted Defaulted Non-defaulted Defaulted Impairment
rate
Stock of
Provisions
Coverage Ratio -
Default Stock
Impairment
rate
Stock of
Provisions
Coverage
Ratio - Default
Stock
Impairment
rate
Stock of
Provisions
Coverage
Ratio - Default
Stock
Impairment rateStock of
Provisions
Coverage
Ratio - Default
Stock
Impairment
rate
Stock of
Provisions
Coverage
Ratio - Default
Stock
Impairment
rate
Stock of
Provisions
Coverage
Ratio - Default
Stock
Central banks and central governments 0 0 0 0 16,120 22 0 0 0 0 281 8 0 0 0 0 1 0 0.07% 14 44.16% 0.07% 18 44.39% 0.07% 21 44.25% 0.41% 31 42.03% 0.40% 50 41.62% 0.39% 69 41.31%
Institutions 2,959 2 0 0 7,659 30 669 0 0 0 2,251 30 0 0 0 0 9 4 0.38% 45 30.70% 0.30% 67 31.94% 0.26% 85 32.43% 0.67% 66 33.72% 0.67% 114 34.72% 0.59% 155 34.99%
Corporates 10,725 588 17,571 7,511 10,946 4,830 7,989 147 12,686 1,263 9,949 5,437 120 210 337 2,828 392 3,226 1.65% 8,517 38.01% 1.08% 9,064 38.02% 0.84% 9,446 37.82% 2.02% 8,952 39.56% 1.87% 9,921 39.94% 1.49% 10,506 39.51%
Corporates - Of Which: Specialised Lending 0 0 0 0 1,949 103 0 0 0 0 1,914 103 0 0 0 0 3 37 - 0 - - 0 - - 0 - - 0 - - 0 - - 0 -
Corporates - Of Which: SME 1,341 230 13,428 6,811 4,972 3,293 1,101 0 9,495 1,191 4,532 3,811 25 86 297 2,499 289 2,367 - 0 - - 0 - - 0 - - 0 - - 0 - - 0 -
Retail 0 0 28,261 3,333 18,154 1,263 0 0 9,477 317 9,270 1,307 0 0 31 829 33 479 0.80% 2,079 26.52% 0.57% 2,379 26.07% 0.43% 2,596 25.61% 0.95% 2,191 27.49% 0.86% 2,639 27.20% 0.69% 2,969 26.60%
Retail - Secured on real estate property 63.7% 0 0 22,215 2,745 10,669 1,063 0 0 7,540 292 4,228 1,096 0 0 28 406 21 208 0.58% 1,080 16.49% 0.39% 1,234 16.51% 0.28% 1,337 16.31% 0.69% 1,147 17.38% 0.61% 1,384 17.68% 0.47% 1,550 17.46%
Retail - Secured on real estate property - Of
Which: SME56.7% 0 0 3,241 1,145 2,772 598 0 0 1,660 135 1,186 616 0 0 17 245 11 117 1.22% 665 21.36% 0.86% 741 21.95% 0.66% 791 22.06% 1.46% 697 22.28% 1.40% 813 23.31% 1.13% 890 23.48%
Retail - Secured on real estate property - Of
Which: non-SME65.4% 0 0 18,975 1,600 7,897 465 0 0 5,880 157 3,041 479 0 0 11 160 10 91 0.43% 414 12.87% 0.28% 493 12.75% 0.20% 546 12.50% 0.51% 449 13.73% 0.44% 571 13.82% 0.34% 659 13.58%
Retail - Qualifying Revolving 0 0 0 0 469 10 0 0 0 0 352 10 0 0 0 0 0 10 1.29% 21 68.38% 1.12% 26 65.24% 0.97% 30 62.66% 1.44% 22 69.94% 1.35% 28 67.73% 1.18% 34 65.64%
Retail - Other Retail 0 0 6,046 588 7,016 189 0 0 1,937 25 4,690 201 0 0 3 424 12 261 1.33% 978 62.25% 0.99% 1,119 58.73% 0.80% 1,228 56.30% 1.60% 1,023 62.98% 1.46% 1,226 58.82% 1.22% 1,386 55.72%
Retail - Other Retail - Of Which: SME 0 0 6,046 588 4,497 129 0 0 1,937 25 2,786 134 0 0 3 424 4 206 1.36% 846 61.76% 0.97% 960 58.02% 0.77% 1,045 55.50% 1.66% 886 62.38% 1.50% 1,056 57.84% 1.25% 1,186 54.54%
Retail - Other Retail - Of Which: non-SME 0 0 0 0 2,519 60 0 0 0 0 1,904 67 0 0 0 0 8 56 1.22% 132 66.08% 1.05% 159 63.89% 0.92% 183 61.85% 1.36% 137 67.77% 1.27% 170 66.37% 1.11% 199 64.71%
Equity 0 0 0 0 400 0 0 0 0 0 540 0 0 0 0 0 0 0 0.00% 0 - 0.00% 0 - 0.00% 0 - 0.00% 0 - 0.00% 0 - 0.00% 0 -
Securitisation 0 0 363 0 97 0 0 0 283 0 121 0 0 0 0 12 0 4
Other non-credit obligation assets 0 0 0 0 13,506 0 0 0 0 0 14,853 0 0 0 0 0 0 0
TOTAL 13,684 591 46,195 10,844 66,884 6,145 8,657 148 22,446 1,579 37,265 6,782 120 210 368 3,669 434 3,714 1.06% 10,654 35.07% 0.71% 11,528 34.73% 0.55% 12,148 34.32% 1.32% 11,240 36.46% 1.20% 12,724 36.39% 0.96% 13,700 35.73%
Securitisation and re-securitisations positions deducted from capital * 0 0 27 0 28 0 0 0 0 0 0 0
(mln EUR, %)Non-defaulted Defaulted Non-defaulted Defaulted Non-defaulted Defaulted Non-defaulted Defaulted Non-defaulted Defaulted Non-defaulted Defaulted Non-defaulted Defaulted Non-defaulted Defaulted Non-defaulted Defaulted
Impairment
rate
Stock of
Provisions
Coverage Ratio -
Default Stock
Impairment
rate
Stock of
Provisions
Coverage
Ratio - Default
Stock
Impairment
rate
Stock of
Provisions
Coverage
Ratio - Default
Stock
Impairment rateStock of
Provisions
Coverage
Ratio - Default
Stock
Impairment
rate
Stock of
Provisions
Coverage
Ratio - Default
Stock
Impairment
rate
Stock of
Provisions
Coverage
Ratio - Default
Stock
Central banks and central governments 0 0 0 0 14,570 22 0 0 0 0 281 8 0 0 0 0 1 0 0.07% 14 44.17% 0.07% 18 44.41% 0.07% 21 44.26% 0.41% 31 42.04% 0.40% 50 41.63% 0.39% 69 41.32%
Institutions 2,079 2 0 0 6,980 30 520 0 0 0 2,033 30 0 0 0 0 9 4 0.40% 43 30.26% 0.32% 64 31.52% 0.27% 81 32.01% 0.72% 64 33.42% 0.72% 109 34.46% 0.64% 148 34.73%
Corporates 10,032 483 17,069 7,404 7,957 4,794 7,386 147 12,212 1,257 7,536 5,398 120 161 328 2,778 383 3,140 1.63% 8,230 37.88% 1.07% 8,726 37.97% 0.83% 9,070 37.84% 2.00% 8,644 39.46% 1.86% 9,530 40.00% 1.48% 10,055 39.67%
Corporates - Of Which: Specialised Lending 0 0 0 0 1,613 96 0 0 0 0 1,574 96 0 0 0 0 3 35 - 0 - - 0 - - 0 - - 0 - - 0 - - 0 -
Corporates - Of Which: SME 945 125 13,004 6,715 4,481 3,284 724 0 9,083 1,185 4,147 3,785 25 37 288 2,454 279 2,358 - 0 - - 0 - - 0 - - 0 - - 0 - - 0 -
Retail 0 0 26,634 3,034 13,846 1,148 0 0 8,855 290 6,911 1,194 0 0 30 793 32 329 0.80% 1,829 25.92% 0.57% 2,091 25.60% 0.44% 2,282 25.22% 0.95% 1,925 26.87% 0.86% 2,318 26.76% 0.70% 2,609 26.27%
Retail - Secured on real estate property 63.2% 0 0 20,608 2,447 8,082 973 0 0 6,924 266 2,991 1,007 0 0 27 370 20 141 0.58% 944 15.85% 0.39% 1,080 16.01% 0.28% 1,172 15.89% 0.69% 1,002 16.74% 0.61% 1,212 17.22% 0.48% 1,359 17.11%
Retail - Secured on real estate property - Of
Which: SME56.2% 0 0 3,236 1,145 2,279 592 0 0 1,657 135 938 611 0 0 17 245 11 94 1.23% 635 20.64% 0.87% 706 21.34% 0.66% 753 21.53% 1.47% 665 21.56% 1.41% 774 22.75% 1.14% 847 23.03%
Retail - Secured on real estate property - Of
Which: non-SME65.2% 0 0 17,372 1,302 5,803 381 0 0 5,268 131 2,053 397 0 0 10 125 9 47 0.43% 309 11.61% 0.28% 374 11.68% 0.20% 419 11.53% 0.50% 337 12.47% 0.43% 438 12.79% 0.33% 512 12.69%
Retail - Qualifying Revolving 0 0 0 0 423 8 0 0 0 0 318 8 0 0 0 0 0 7 1.26% 17 70.32% 1.09% 22 66.37% 0.95% 26 63.38% 1.40% 18 71.87% 1.32% 24 68.82% 1.14% 29 66.29%
Retail - Other Retail 0 0 6,027 587 5,341 167 0 0 1,931 25 3,602 178 0 0 3 423 12 181 1.33% 867 61.53% 1.00% 989 58.20% 0.81% 1,085 55.92% 1.60% 905 62.19% 1.47% 1,082 58.28% 1.23% 1,222 55.37%
Retail - Other Retail - Of Which: SME 0 0 6,027 587 3,157 114 0 0 1,931 25 1,935 119 0 0 3 423 4 142 1.36% 758 61.10% 0.99% 857 57.61% 0.79% 933 55.26% 1.66% 792 61.67% 1.52% 941 57.45% 1.27% 1,056 54.35%
Retail - Other Retail - Of Which: non-SME 0 0 0 0 2,184 53 0 0 0 0 1,667 59 0 0 0 0 7 39 1.19% 110 65.16% 1.03% 132 62.87% 0.90% 152 60.86% 1.33% 113 66.78% 1.25% 141 65.33% 1.09% 166 63.76%
Equity 0 0 0 0 343 0 0 0 0 0 496 0 0 0 0 0 0 0 0.00% 0 - 0.00% 0 - 0.00% 0 - 0.00% 0 - 0.00% 0 - 0.00% 0 -
Securitisation 0 0 363 0 87 0 0 0 283 0 115 0 0 0 0 12 0 4
Other non-credit obligation assets 0 0 0 0 13,385 0 0 0 0 0 14,832 0 0 0 0 0 0 0
TOTAL 12,111 485 44,067 10,438 57,169 5,994 7,907 148 21,350 1,547 32,203 6,630 120 161 358 3,583 425 3,477 1.05% 10,116 35.02% 0.71% 10,899 34.78% 0.55% 11,454 34.43% 1.31% 10,664 36.43% 1.20% 12,007 36.53% 0.96% 12,881 35.96%
Securitisation and re-securitisations positions deducted from capital * 0 0 27 0 26 0 0 0 0 0 0 0
(mln EUR, %)Non-defaulted Defaulted Non-defaulted Defaulted Non-defaulted Defaulted Non-defaulted Defaulted Non-defaulted Defaulted Non-defaulted Defaulted Non-defaulted Defaulted Non-defaulted Defaulted Non-defaulted Defaulted
Impairment
rate
Stock of
Provisions
Coverage Ratio -
Default Stock
Impairment
rate
Stock of
Provisions
Coverage
Ratio - Default
Stock
Impairment
rate
Stock of
Provisions
Coverage
Ratio - Default
Stock
Impairment rateStock of
Provisions
Coverage
Ratio - Default
Stock
Impairment
rate
Stock of
Provisions
Coverage
Ratio - Default
Stock
Impairment
rate
Stock of
Provisions
Coverage
Ratio - Default
Stock
Central banks and central governments 0 0 0 0 1,282 0 0 0 0 0 0 0 0 0 0 0 0 0 0.17% 0 40.00% 0.17% 0 40.00% 0.17% 0 40.00% 1.06% 0 40.00% 1.06% 0 40.00% 1.06% 0 40.00%
Institutions 0 0 0 0 593 0 0 0 0 0 198 0 0 0 0 0 0 0 0.57% 1 40.15% 0.45% 2 40.09% 0.38% 2 40.07% 0.93% 2 40.10% 0.95% 3 40.05% 0.85% 4 40.04%
Corporates 370 0 87 7 1,851 25 316 0 76 0 1,552 25 0 0 4 7 0 80 1.71% 137 52.59% 1.07% 164 47.16% 0.83% 183 44.13% 2.13% 149 52.92% 1.78% 191 46.22% 1.43% 222 42.73%
Corporates - Of Which: Specialised Lending 0 0 0 0 160 7 0 0 0 0 160 7 0 0 0 0 0 2 - 0 - - 0 - - 0 - - 0 - - 0 - - 0 -
Corporates - Of Which: SME 244 0 77 4 1,500 0 223 0 70 0 1,257 0 0 0 4 4 0 3 - 0 - - 0 - - 0 - - 0 - - 0 - - 0 -
Retail 0 0 38 4 3,599 33 0 0 13 0 2,107 33 0 0 0 1 0 138 0.87% 181 57.55% 0.59% 208 50.09% 0.45% 226 45.82% 1.05% 191 58.24% 0.89% 230 49.48% 0.72% 256 44.38%
Retail - Secured on real estate property 70.1% 0 0 31 4 2,117 15 0 0 11 0 1,142 15 0 0 0 0 0 61 0.55% 79 46.87% 0.36% 89 38.76% 0.26% 95 34.54% 0.65% 82 47.15% 0.56% 97 37.85% 0.44% 107 33.02%
Retail - Secured on real estate property - Of
Which: SME67.8% 0 0 2 0 362 6 0 0 1 0 248 6 0 0 0 0 0 24 1.16% 30 53.06% 0.79% 34 45.41% 0.60% 36 41.30% 1.37% 31 52.72% 1.26% 37 43.97% 1.03% 40 39.37%
Retail - Secured on real estate property - Of
Which: non-SME70.6% 0 0 29 4 1,754 9 0 0 10 0 895 9 0 0 0 0 0 38 0.42% 49 43.74% 0.27% 55 35.58% 0.19% 59 31.40% 0.50% 51 44.29% 0.42% 60 34.89% 0.33% 67 30.08%
Retail - Qualifying Revolving 0 0 0 0 12 0 0 0 0 0 9 0 0 0 0 0 0 1 1.33% 1 75.07% 1.14% 1 72.96% 1.00% 1 70.42% 1.48% 1 77.13% 1.39% 1 75.54% 1.21% 1 72.94%
Retail - Other Retail 0 0 7 0 1,470 18 0 0 2 0 956 18 0 0 0 0 0 76 1.33% 102 69.70% 0.92% 118 63.98% 0.71% 130 60.05% 1.62% 108 70.83% 1.37% 131 63.80% 1.13% 148 58.78%
Retail - Other Retail - Of Which: SME 0 0 7 0 1,304 15 0 0 2 0 831 15 0 0 0 0 0 64 1.34% 87 67.90% 0.90% 101 61.82% 0.69% 111 57.80% 1.65% 92 68.96% 1.38% 113 61.51% 1.13% 128 56.41%
Retail - Other Retail - Of Which: non-SME 0 0 0 0 166 3 0 0 0 0 125 3 0 0 0 0 0 12 1.25% 15 82.31% 1.07% 17 80.39% 0.93% 19 77.69% 1.39% 16 84.47% 1.29% 18 82.95% 1.12% 20 79.96%
Equity 0 0 0 0 57 0 0 0 0 0 44 0 0 0 0 0 0 0 0.00% 0 - 0.00% 0 - 0.00% 0 - 0.00% 0 - 0.00% 0 - 0.00% 0 -
Securitisation 0 0 0 0 10 0 0 0 0 0 6 0 0 0 0 0 0 0
Other non-credit obligation assets 0 0 0 0 0 0 0 0 0 0 0 0 0 0 0 0 0 0
TOTAL 370 0 124 11 7,393 57 316 0 89 1 3,906 57 0 0 4 8 0 218 1.17% 319 55.27% 0.75% 373 48.72% 0.58% 411 45.03% 1.44% 342 55.72% 1.21% 424 47.89% 0.97% 483 43.57%
Securitisation and re-securitisations positions deducted from capital * 0 0 0 0 2 0 0 0 0 0 0 0
(mln EUR, %)Non-defaulted Defaulted Non-defaulted Defaulted Non-defaulted Defaulted Non-defaulted Defaulted Non-defaulted Defaulted Non-defaulted Defaulted Non-defaulted Defaulted Non-defaulted Defaulted Non-defaulted Defaulted
Impairment
rate
Stock of
Provisions
Coverage Ratio -
Default Stock
Impairment
rate
Stock of
Provisions
Coverage
Ratio - Default
Stock
Impairment
rate
Stock of
Provisions
Coverage
Ratio - Default
Stock
Impairment rateStock of
Provisions
Coverage
Ratio - Default
Stock
Impairment
rate
Stock of
Provisions
Coverage
Ratio - Default
Stock
Impairment
rate
Stock of
Provisions
Coverage
Ratio - Default
Stock
Central banks and central governments 0 0 0 0 0 0 0 0 0 0 0 0 0 0 0 0 0 0 - 0 - - 0 - - 0 - - 0 - - 0 - - 0 -
Institutions 0 0 0 0 0 0 0 0 0 0 0 0 0 0 0 0 0 0 - 0 - - 0 - - 0 - - 0 - - 0 - - 0 -
Corporates 0 0 0 0 0 0 0 0 0 0 0 0 0 0 0 0 0 0 - 0 - - 0 - - 0 - - 0 - - 0 - - 0 -
Corporates - Of Which: Specialised Lending 0 0 0 0 0 0 0 0 0 0 0 0 0 0 0 0 0 0 - 0 - - 0 - - 0 - - 0 - - 0 - - 0 -
Corporates - Of Which: SME 0 0 0 0 0 0 0 0 0 0 0 0 0 0 0 0 0 0 - 0 - - 0 - - 0 - - 0 - - 0 - - 0 -
Retail 0 0 0 0 0 0 0 0 0 0 0 0 0 0 0 0 0 0 - 0 - - 0 - - 0 - - 0 - - 0 - - 0 -
Retail - Secured on real estate property 0.0% 0 0 0 0 0 0 0 0 0 0 0 0 0 0 0 0 0 0 - 0 - - 0 - - 0 - - 0 - - 0 - - 0 -
Retail - Secured on real estate property - Of
Which: SME0.0% 0 0 0 0 0 0 0 0 0 0 0 0 0 0 0 0 0 0 - 0 - - 0 - - 0 - - 0 - - 0 - - 0 -
Retail - Secured on real estate property - Of
Which: non-SME0.0% 0 0 0 0 0 0 0 0 0 0 0 0 0 0 0 0 0 0 - 0 - - 0 - - 0 - - 0 - - 0 - - 0 -
Retail - Qualifying Revolving 0 0 0 0 0 0 0 0 0 0 0 0 0 0 0 0 0 0 - 0 - - 0 - - 0 - - 0 - - 0 - - 0 -
Retail - Other Retail 0 0 0 0 0 0 0 0 0 0 0 0 0 0 0 0 0 0 - 0 - - 0 - - 0 - - 0 - - 0 - - 0 -
Retail - Other Retail - Of Which: SME 0 0 0 0 0 0 0 0 0 0 0 0 0 0 0 0 0 0 - 0 - - 0 - - 0 - - 0 - - 0 - - 0 -
Retail - Other Retail - Of Which: non-SME 0 0 0 0 0 0 0 0 0 0 0 0 0 0 0 0 0 0 - 0 - - 0 - - 0 - - 0 - - 0 - - 0 -
Equity 0 0 0 0 0 0 0 0 0 0 0 0 0 0 0 0 0 0 - 0 - - 0 - - 0 - - 0 - - 0 - - 0 -
Securitisation 0 0 0 0 0 0 0 0 0 0 0 0 0 0 0 0 0 0
Other non-credit obligation assets 0 0 0 0 0 0 0 0 0 0 0 0 0 0 0 0 0 0
TOTAL 0 0 0 0 0 0 0 0 0 0 0 0 0 0 0 0 0 0 - 0 - - 0 - - 0 - - 0 - - 0 - - 0 -
Securitisation and re-securitisations positions deducted from capital * 0 0 0 0 0 0 0 0 0 0 0 0
as of 31/12/2016 as of 31/12/2014 as of 31/12/2015 as of 31/12/2016
Please, select the country
F-IRB A-IRB STA as of 31/12/2014 as of 31/12/2015LTV % (as of
31/12/2013)
Exposure values (as of 31/12/2013) Risk exposure amounts (as of 31/12/2013) Value adjustments and provisions (as of 31/12/2013) Baseline Scenario Adverse Scenario
F-IRB A-IRB STA F-IRB A-IRB STA
LTV % (as of
31/12/2013)
Exposure values (as of 31/12/2013) Risk exposure amounts (as of 31/12/2013) Value adjustments and provisions (as of 31/12/2013) Baseline Scenario Adverse Scenario
F-IRB A-IRB STA F-IRB A-IRB STA F-IRB as of 31/12/2014 as of 31/12/2015 as of 31/12/2016A-IRB STA as of 31/12/2014 as of 31/12/2015 as of 31/12/2016
LTV % (as of
31/12/2013)
Exposure values (as of 31/12/2013) Risk exposure amounts (as of 31/12/2013) Value adjustments and provisions (as of 31/12/2013) Baseline Scenario Adverse Scenario
F-IRB A-IRB STA F-IRB A-IRB STA F-IRB A-IRB as of 31/12/2015 as of 31/12/2016STA as of 31/12/2014 as of 31/12/2015 as of 31/12/2016 as of 31/12/2014
Risk exposure amounts (as of 31/12/2013)
Baseline Scenario Adverse Scenario
F-IRB A-IRB STA F-IRB A-IRB STA F-IRB A-IRB STA as of 31/12/2014 as of 31/12/2015 as of 31/12/2016 as of 31/12/2014 as of 31/12/2015 as of 31/12/2016
as of 31/12/2016
Spain
LTV % (as of
31/12/2013)
Exposure values (as of 31/12/2013) Risk exposure amounts (as of 31/12/2013) Value adjustments and provisions (as of 31/12/2013)
Adverse Scenario
F-IRB A-IRB STA F-IRB A-IRB STA F-IRB A-IRB STA as of 31/12/2014 as of 31/12/2015 as of 31/12/2016 as of 31/12/2014 as of 31/12/2015 as of 31/12/2016LTV % (as of
31/12/2013)
Exposure values (as of 31/12/2013)
ES - Banco Popular Español,
S.A.
(*) Refers to the part of Securitization exposure that is deducted from capital and is not included in RWA
Value adjustments and provisions (as of 31/12/2013) Baseline Scenario
LTV % (as of
31/12/2013)
Exposure values (as of 31/12/2013) Risk exposure amounts (as of 31/12/2013) Value adjustments and provisions (as of 31/12/2013) Adverse Scenario
F-IRB A-IRB STA F-IRB A-IRB STA F-IRB A-IRB STA
Baseline Scenario
as of 31/12/2014 as of 31/12/2015 as of 31/12/2016 as of 31/12/2014 as of 31/12/2015
(*) Refers to the part of Securitization exposure that is deducted from capital and is not included in RWA
(*) Refers to the part of Securitization exposure that is deducted from capital and is not included in RWA
(*) Refers to the part of Securitization exposure that is deducted from capital and is not included in RWA
(*) Refers to the part of Securitization exposure that is deducted from capital and is not included in RWA
(*) Refers to the part of Securitization exposure that is deducted from capital and is not included in RWA
Portugal
Please, select the country
Please, select the country
2014 EU-wide Stress TestCredit Risk
LTV % (as of
31/12/2013)
Exposure values (as of 31/12/2013) Risk exposure amounts (as of 31/12/2013) Value adjustments and provisions (as of 31/12/2013) Adverse ScenarioBaseline Scenario
(mln EUR, %)Non-defaulted Defaulted Non-defaulted Defaulted Non-defaulted Defaulted Non-defaulted Defaulted Non-defaulted Defaulted Non-defaulted Defaulted Non-defaulted Defaulted Non-defaulted Defaulted Non-defaulted Defaulted
Impairment
rate
Stock of
Provisions
Coverage Ratio -
Default Stock
Impairment
rate
Stock of
Provisions
Coverage
Ratio - Default
Stock
Impairment
rate
Stock of
Provisions
Coverage
Ratio - Default
Stock
Impairment rateStock of
Provisions
Coverage
Ratio - Default
Stock
Impairment
rate
Stock of
Provisions
Coverage
Ratio - Default
Stock
Impairment
rate
Stock of
Provisions
Coverage
Ratio - Default
Stock
Central banks and central governments 0 0 0 0 0 0 0 0 0 0 0 0 0 0 0 0 0 0 - 0 - - 0 - - 0 - - 0 - - 0 - - 0 -
Institutions 0 0 0 0 0 0 0 0 0 0 0 0 0 0 0 0 0 0 - 0 - - 0 - - 0 - - 0 - - 0 - - 0 -
Corporates 0 0 0 0 0 0 0 0 0 0 0 0 0 0 0 0 0 0 - 0 - - 0 - - 0 - - 0 - - 0 - - 0 -
Corporates - Of Which: Specialised Lending 0 0 0 0 0 0 0 0 0 0 0 0 0 0 0 0 0 0 - 0 - - 0 - - 0 - - 0 - - 0 - - 0 -
Corporates - Of Which: SME 0 0 0 0 0 0 0 0 0 0 0 0 0 0 0 0 0 0 - 0 - - 0 - - 0 - - 0 - - 0 - - 0 -
Retail 0 0 0 0 0 0 0 0 0 0 0 0 0 0 0 0 0 0 - 0 - - 0 - - 0 - - 0 - - 0 - - 0 -
Retail - Secured on real estate property 0.0% 0 0 0 0 0 0 0 0 0 0 0 0 0 0 0 0 0 0 - 0 - - 0 - - 0 - - 0 - - 0 - - 0 -
Retail - Secured on real estate property - Of
Which: SME0.0% 0 0 0 0 0 0 0 0 0 0 0 0 0 0 0 0 0 0 - 0 - - 0 - - 0 - - 0 - - 0 - - 0 -
Retail - Secured on real estate property - Of
Which: non-SME0.0% 0 0 0 0 0 0 0 0 0 0 0 0 0 0 0 0 0 0 - 0 - - 0 - - 0 - - 0 - - 0 - - 0 -
Retail - Qualifying Revolving 0 0 0 0 0 0 0 0 0 0 0 0 0 0 0 0 0 0 - 0 - - 0 - - 0 - - 0 - - 0 - - 0 -
Retail - Other Retail 0 0 0 0 0 0 0 0 0 0 0 0 0 0 0 0 0 0 - 0 - - 0 - - 0 - - 0 - - 0 - - 0 -
Retail - Other Retail - Of Which: SME 0 0 0 0 0 0 0 0 0 0 0 0 0 0 0 0 0 0 - 0 - - 0 - - 0 - - 0 - - 0 - - 0 -
Retail - Other Retail - Of Which: non-SME 0 0 0 0 0 0 0 0 0 0 0 0 0 0 0 0 0 0 - 0 - - 0 - - 0 - - 0 - - 0 - - 0 -
Equity 0 0 0 0 0 0 0 0 0 0 0 0 0 0 0 0 0 0 - 0 - - 0 - - 0 - - 0 - - 0 - - 0 -
Securitisation 0 0 0 0 0 0 0 0 0 0 0 0 0 0 0 0 0 0
Other non-credit obligation assets 0 0 0 0 0 0 0 0 0 0 0 0 0 0 0 0 0 0
TOTAL 0 0 0 0 0 0 0 0 0 0 0 0 0 0 0 0 0 0 - 0 - - 0 - - 0 - - 0 - - 0 - - 0 -
Securitisation and re-securitisations positions deducted from capital * 0 0 0 0 0 0 0 0 0 0 0 0
LTV % (as of
31/12/2013)
Exposure values (as of 31/12/2013) Risk exposure amounts (as of 31/12/2013) Value adjustments and provisions (as of 31/12/2013) Baseline Scenario Adverse Scenario
F-IRB A-IRB STA F-IRB A-IRB STA as of 31/12/2016 as of 31/12/2014 as of 31/12/2015 as of 31/12/2016F-IRB A-IRB STA as of 31/12/2014 as of 31/12/2015
LTV % (as of
31/12/2013)
Exposure values (as of 31/12/2013) Risk exposure amounts (as of 31/12/2013) Value adjustments and provisions (as of 31/12/2013) Baseline Scenario Adverse Scenario
F-IRB A-IRB STA F-IRB A-IRB STA F-IRB as of 31/12/2014 as of 31/12/2015 as of 31/12/2016A-IRB STA as of 31/12/2014 as of 31/12/2015 as of 31/12/2016
LTV % (as of
31/12/2013)
Exposure values (as of 31/12/2013) Risk exposure amounts (as of 31/12/2013) Value adjustments and provisions (as of 31/12/2013) Baseline Scenario Adverse Scenario
F-IRB A-IRB STA F-IRB A-IRB STA F-IRB A-IRB as of 31/12/2015 as of 31/12/2016STA as of 31/12/2014 as of 31/12/2015 as of 31/12/2016 as of 31/12/2014
Adverse Scenario
F-IRB A-IRB STA F-IRB A-IRB STA F-IRB A-IRB STA as of 31/12/2014 as of 31/12/2015 as of 31/12/2016 as of 31/12/2014 as of 31/12/2015 as of 31/12/2016LTV % (as of
31/12/2013)
Exposure values (as of 31/12/2013) Risk exposure amounts (as of 31/12/2013) Value adjustments and provisions (as of 31/12/2013)
Adverse Scenario
F-IRB A-IRB STA F-IRB A-IRB STA F-IRB A-IRB STA as of 31/12/2014 as of 31/12/2015 as of 31/12/2016 as of 31/12/2014 as of 31/12/2015 as of 31/12/2016LTV % (as of
31/12/2013)
Exposure values (as of 31/12/2013) Risk exposure amounts (as of 31/12/2013)
Baseline Scenario
Value adjustments and provisions (as of 31/12/2013) Baseline Scenario
(*) Refers to the part of Securitization exposure that is deducted from capital and is not included in RWA
(*) Refers to the part of Securitization exposure that is deducted from capital and is not included in RWA
(*) Refers to the part of Securitization exposure that is deducted from capital and is not included in RWA
(*) Refers to the part of Securitization exposure that is deducted from capital and is not included in RWA
(*) Refers to the part of Securitization exposure that is deducted from capital and is not included in RWA
Please, select the country
Please, select the country
Please, select the country
Please, select the country
Please, select the country
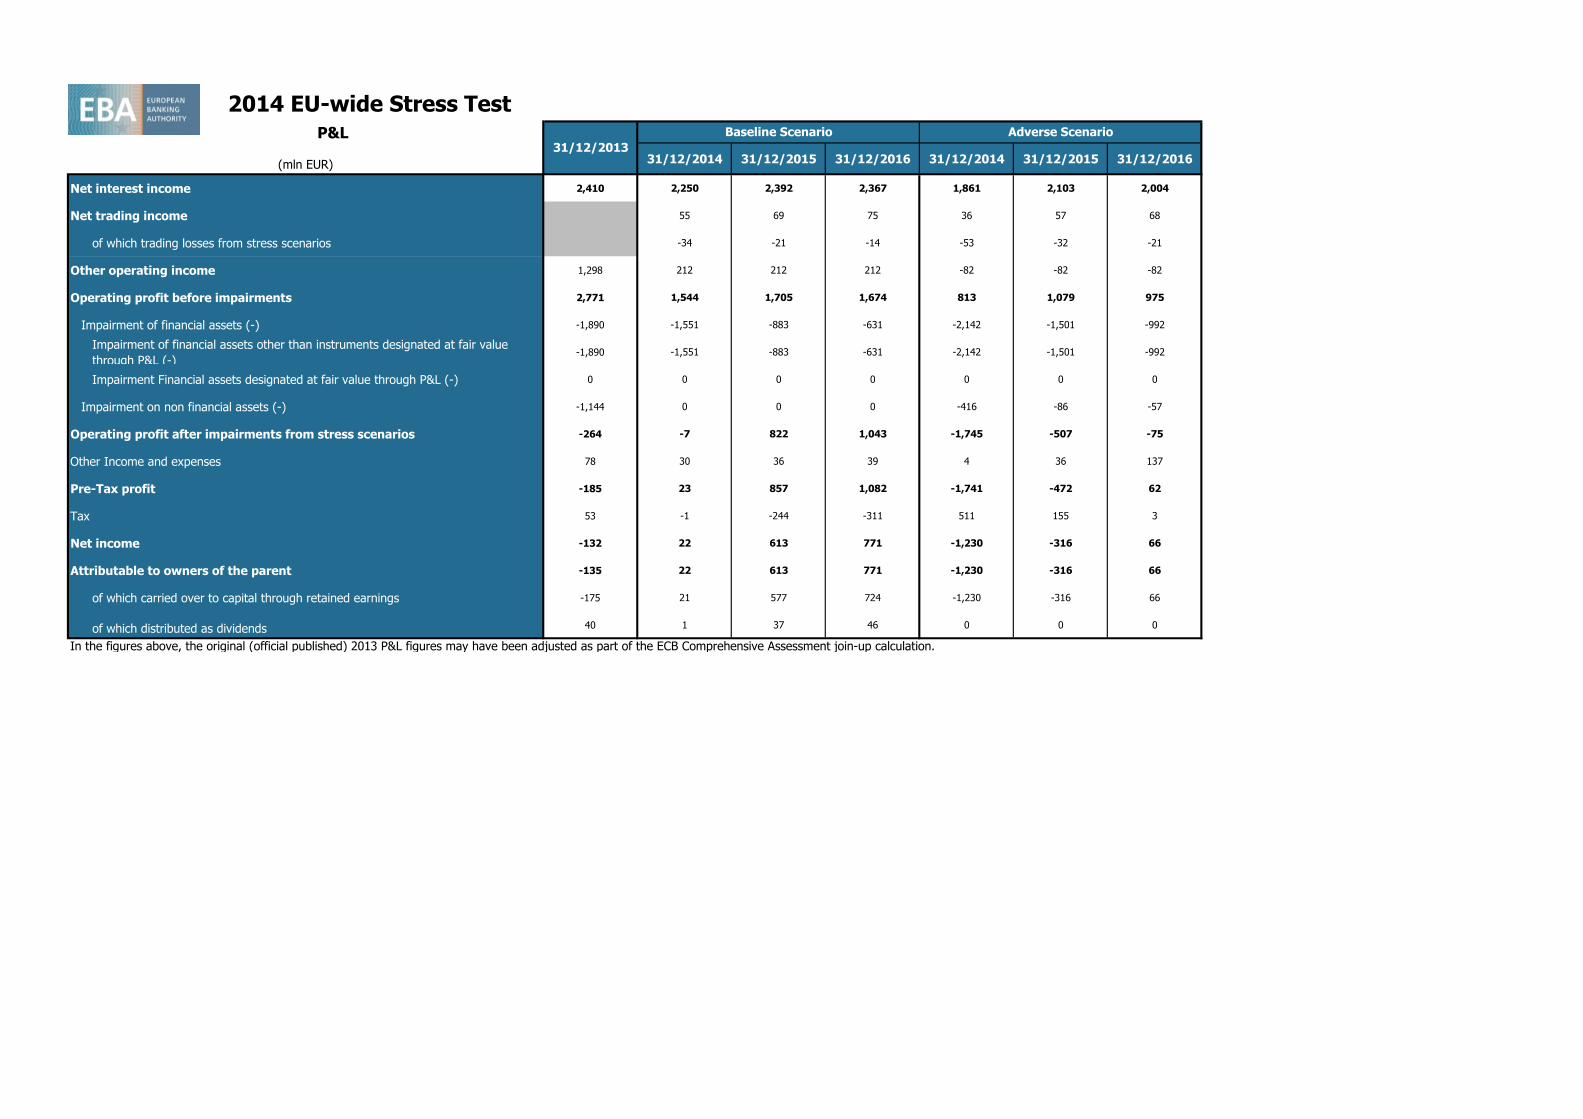
2014 EU-wide Stress Test P&L
(mln EUR) 31/12/2014 31/12/2015 31/12/2016 31/12/2014 31/12/2015 31/12/2016
Net interest income 2,410 2,250 2,392 2,367 1,861 2,103 2,004
Net trading income 55 69 75 36 57 68
of which trading losses from stress scenarios -34 -21 -14 -53 -32 -21
Other operating income 1,298 212 212 212 -82 -82 -82
Operating profit before impairments 2,771 1,544 1,705 1,674 813 1,079 975
Impairment of financial assets (-) -1,890 -1,551 -883 -631 -2,142 -1,501 -992
Impairment of financial assets other than instruments designated at fair value
through P&L (-)-1,890 -1,551 -883 -631 -2,142 -1,501 -992
Impairment Financial assets designated at fair value through P&L (-) 0 0 0 0 0 0 0
Impairment on non financial assets (-) -1,144 0 0 0 -416 -86 -57
Operating profit after impairments from stress scenarios -264 -7 822 1,043 -1,745 -507 -75
Other Income and expenses 78 30 36 39 4 36 137
Pre-Tax profit -185 23 857 1,082 -1,741 -472 62
Tax 53 -1 -244 -311 511 155 3
Net income -132 22 613 771 -1,230 -316 66
Attributable to owners of the parent -135 22 613 771 -1,230 -316 66
of which carried over to capital through retained earnings -175 21 577 724 -1,230 -316 66
of which distributed as dividends 40 1 37 46 0 0 0
In the figures above, the original (official published) 2013 P&L figures may have been adjusted as part of the ECB Comprehensive Assessment join-up calculation.
31/12/2013
Baseline Scenario Adverse Scenario
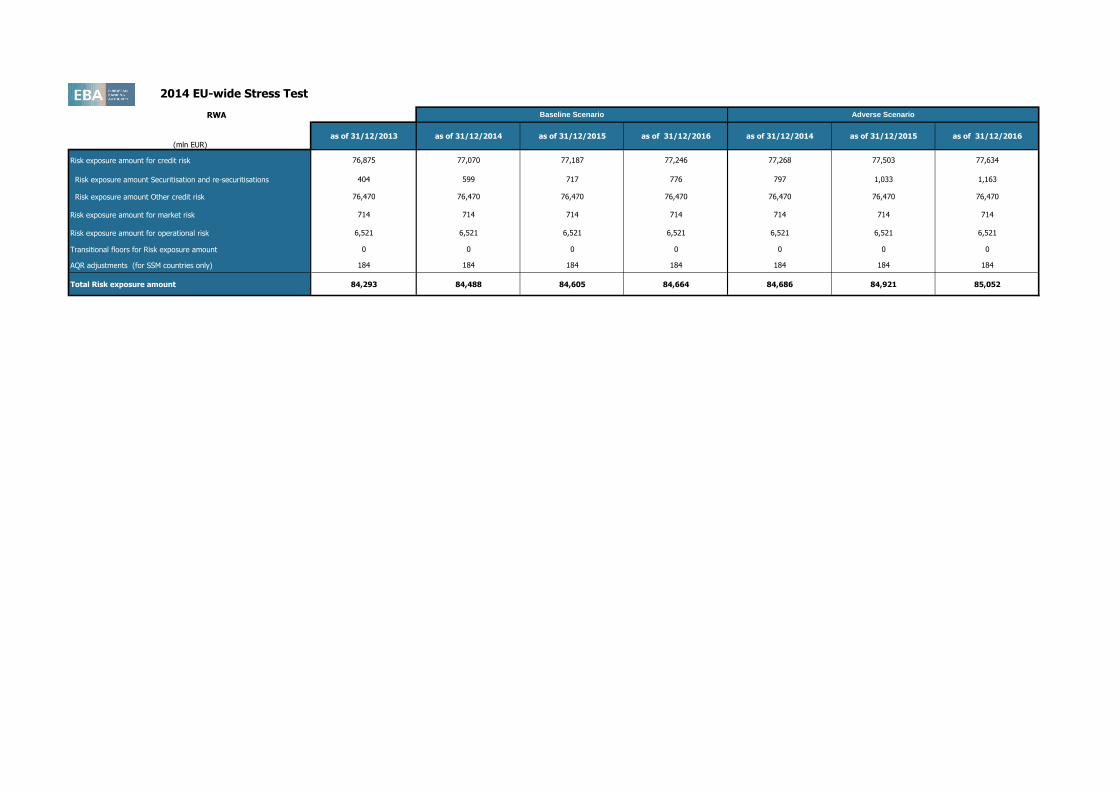
2014 EU-wide Stress Test
RWA
(mln EUR)as of 31/12/2013 as of 31/12/2014 as of 31/12/2015 as of 31/12/2016 as of 31/12/2014 as of 31/12/2015 as of 31/12/2016
Risk exposure amount for credit risk 76,875 77,070 77,187 77,246 77,268 77,503 77,634
Risk exposure amount Securitisation and re-securitisations 404 599 717 776 797 1,033 1,163
Risk exposure amount Other credit risk 76,470 76,470 76,470 76,470 76,470 76,470 76,470
Risk exposure amount for market risk 714 714 714 714 714 714 714
Risk exposure amount for operational risk 6,521 6,521 6,521 6,521 6,521 6,521 6,521
Transitional floors for Risk exposure amount 0 0 0 0 0 0 0
AQR adjustments (for SSM countries only) 184 184 184 184 184 184 184
Total Risk exposure amount 84,293 84,488 84,605 84,664 84,686 84,921 85,052
Baseline Scenario Adverse Scenario
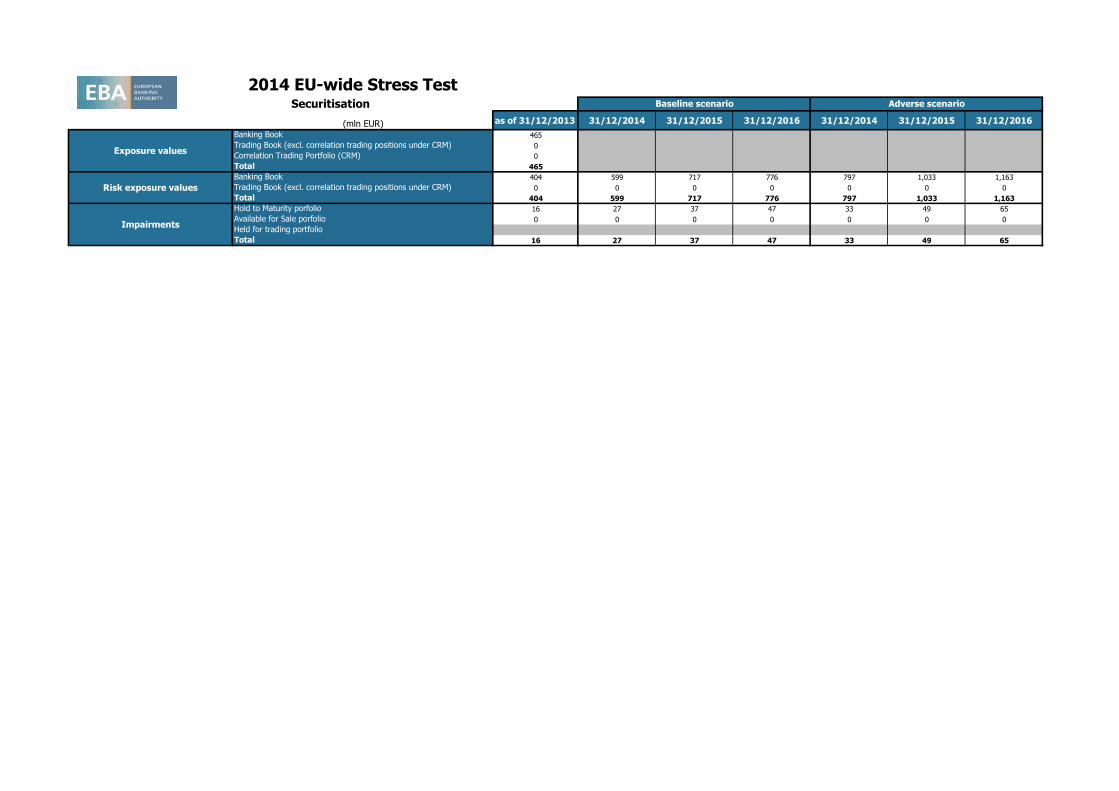
(mln EUR) as of 31/12/2013 31/12/2014 31/12/2015 31/12/2016 31/12/2014 31/12/2015 31/12/2016
Banking Book 465
Trading Book (excl. correlation trading positions under CRM) 0
Correlation Trading Portfolio (CRM) 0
Total 465
Banking Book 404 599 717 776 797 1,033 1,163
Trading Book (excl. correlation trading positions under CRM) 0 0 0 0 0 0 0
Total 404 599 717 776 797 1,033 1,163
Hold to Maturity porfolio 16 27 37 47 33 49 65
Available for Sale porfolio 0 0 0 0 0 0 0
Held for trading portfolio
Total 16 27 37 47 33 49 65
2014 EU-wide Stress Test
Impairments
Baseline scenario Adverse scenario
Exposure values
Risk exposure values
Securitisation

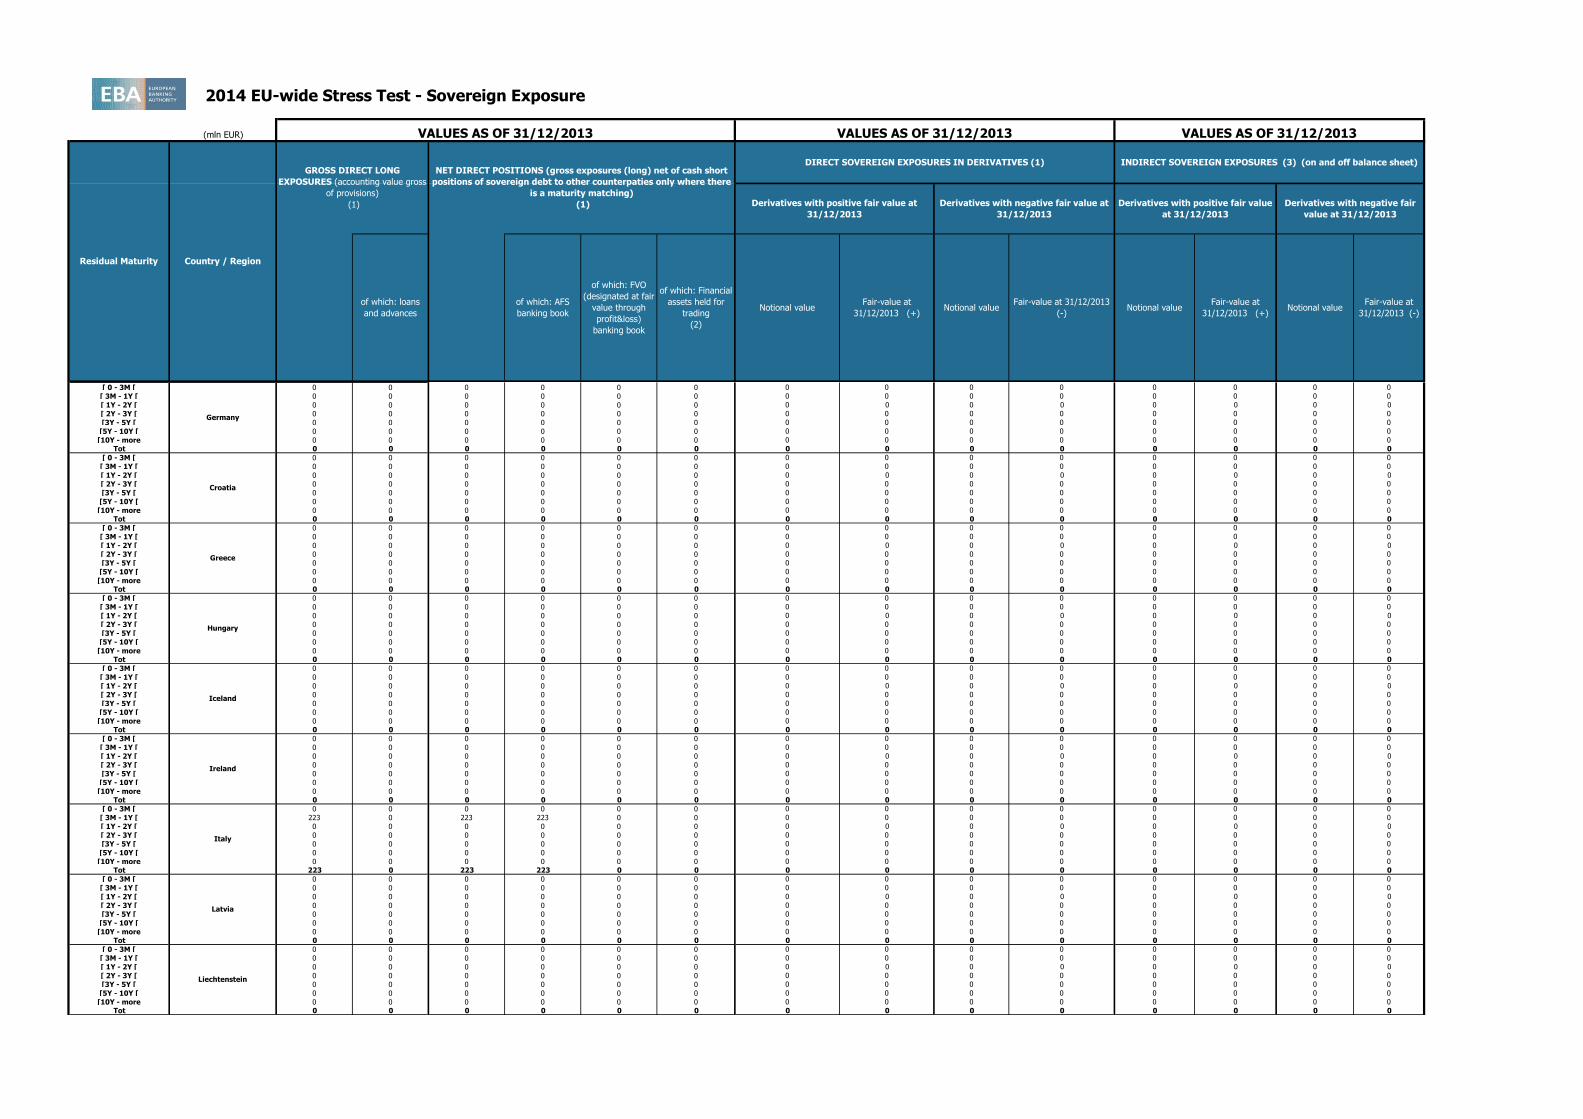
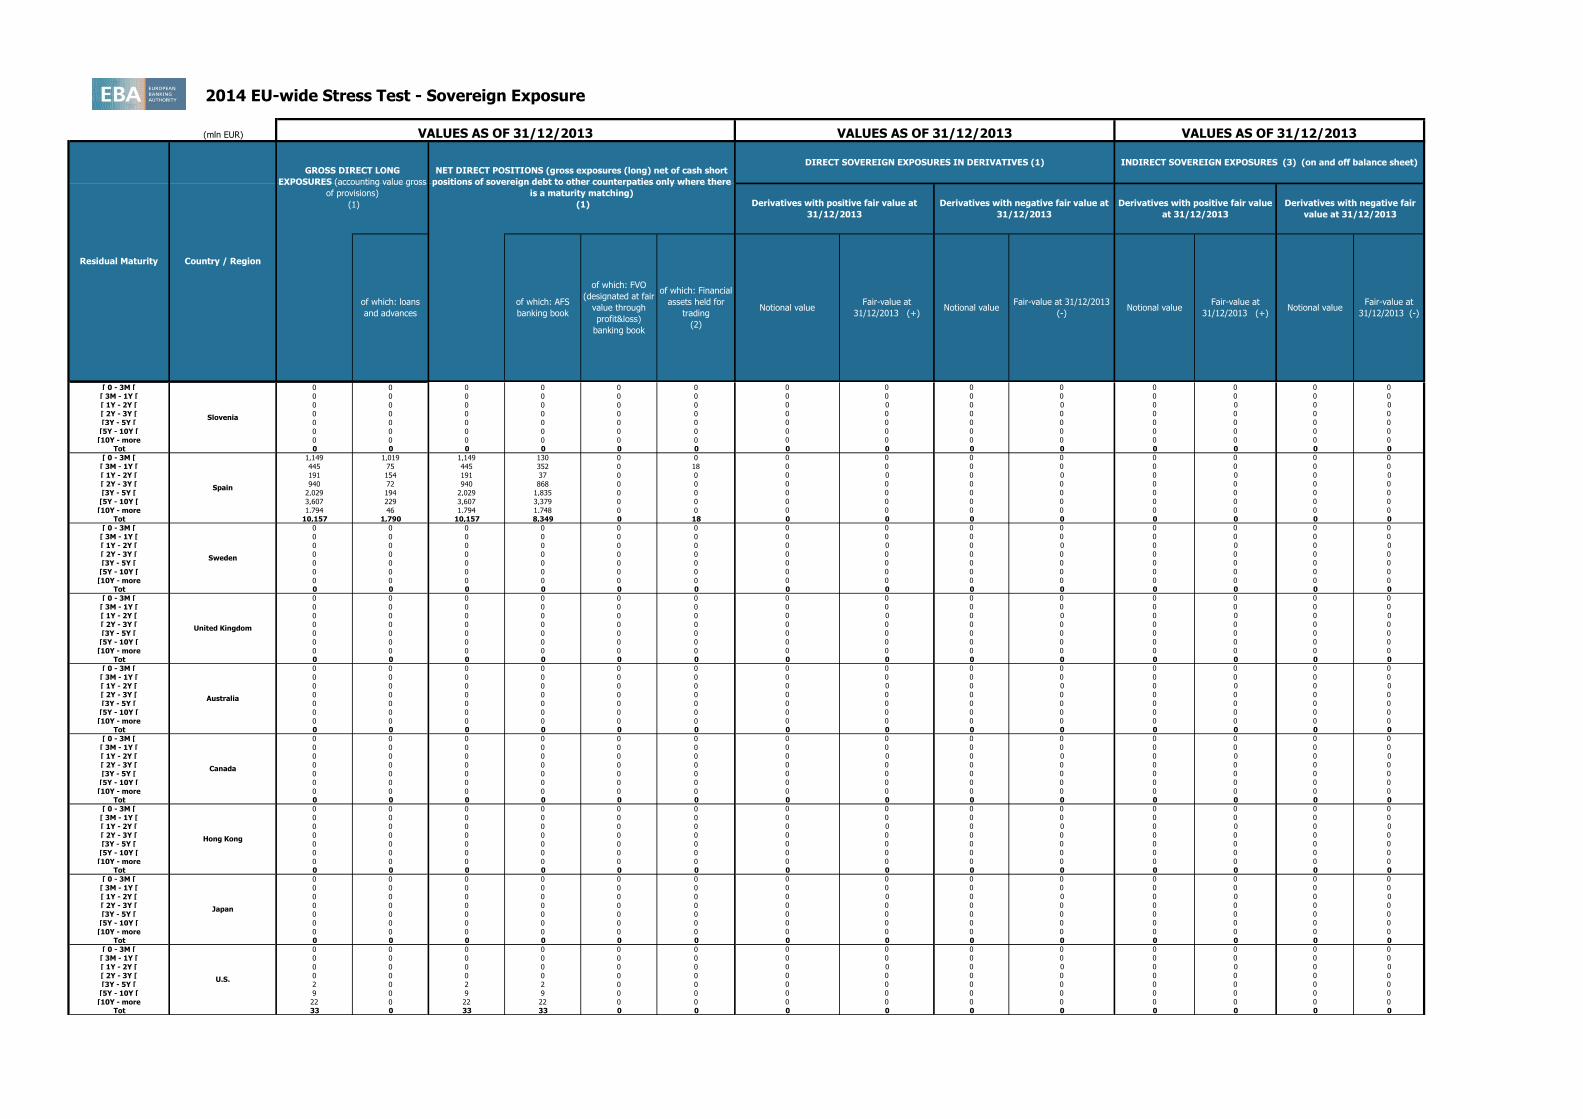
2014 EU-wide Stress Test - Sovereign Exposure
(mln EUR)
[ 0 - 3M [ 0 0 0 0 0 0 0 0 0 0 0 0 0 0
[ 3M - 1Y [ 0 0 0 0 0 0 0 0 0 0 0 0 0 0
[ 1Y - 2Y [ 0 0 0 0 0 0 0 0 0 0 0 0 0 0
[ 2Y - 3Y [ 0 0 0 0 0 0 0 0 0 0 0 0 0 0
[3Y - 5Y [ 0 0 0 0 0 0 0 0 0 0 0 0 0 0
[5Y - 10Y [ 0 0 0 0 0 0 0 0 0 0 0 0 0 0
[10Y - more 0 0 0 0 0 0 0 0 0 0 0 0 0 0
Tot 0 0 0 0 0 0 0 0 0 0 0 0 0 0
Residual Maturity Country / Region
GROSS DIRECT LONG
EXPOSURES (accounting value gross
of provisions)
(1)
NET DIRECT POSITIONS (gross exposures (long) net of cash short
positions of sovereign debt to other counterpaties only where there
is a maturity matching)
(1)
DIRECT SOVEREIGN EXPOSURES IN DERIVATIVES (1)
of which: loans
and advances
of which: AFS
banking book
of which: FVO
(designated at fair
value through
profit&loss)
banking book
of which: Financial
assets held for
trading
(2)
Derivatives with positive fair value at
31/12/2013
Derivatives with negative fair value at
31/12/2013
Derivatives with positive fair value
at 31/12/2013
Derivatives with negative fair
value at 31/12/2013
VALUES AS OF 31/12/2013 VALUES AS OF 31/12/2013 VALUES AS OF 31/12/2013
INDIRECT SOVEREIGN EXPOSURES (3) (on and off balance sheet)
Fair-value at
31/12/2013 (+)Notional value
Fair-value at
31/12/2013 (-)Notional value
Fair-value at
31/12/2013 (+)Notional value
Fair-value at 31/12/2013
(-)
Austria
Belgium
Bulgaria
Cyprus
Notional value
Czech Republic
Denmark
Estonia
Finland
France
2014 EU-wide Stress Test - Sovereign Exposure
(mln EUR)
Residual Maturity Country / Region
GROSS DIRECT LONG
EXPOSURES (accounting value gross
of provisions)
(1)
NET DIRECT POSITIONS (gross exposures (long) net of cash short
positions of sovereign debt to other counterpaties only where there
is a maturity matching)
(1)
DIRECT SOVEREIGN EXPOSURES IN DERIVATIVES (1)
of which: loans
and advances
of which: AFS
banking book
of which: FVO
(designated at fair
value through
profit&loss)
banking book
of which: Financial
assets held for
trading
(2)
Derivatives with positive fair value at
31/12/2013
Derivatives with negative fair value at
31/12/2013
Derivatives with positive fair value
at 31/12/2013
Derivatives with negative fair
value at 31/12/2013
VALUES AS OF 31/12/2013 VALUES AS OF 31/12/2013 VALUES AS OF 31/12/2013
INDIRECT SOVEREIGN EXPOSURES (3) (on and off balance sheet)
Fair-value at
31/12/2013 (+)Notional value
Fair-value at
31/12/2013 (-)Notional value
Fair-value at
31/12/2013 (+)Notional value
Fair-value at 31/12/2013
(-)
Austria
Notional value
[ 0 - 3M [ 0 0 0 0 0 0 0 0 0 0 0 0 0 0
[ 3M - 1Y [ 0 0 0 0 0 0 0 0 0 0 0 0 0 0
[ 1Y - 2Y [ 0 0 0 0 0 0 0 0 0 0 0 0 0 0
[ 2Y - 3Y [ 0 0 0 0 0 0 0 0 0 0 0 0 0 0
[3Y - 5Y [ 0 0 0 0 0 0 0 0 0 0 0 0 0 0
[5Y - 10Y [ 0 0 0 0 0 0 0 0 0 0 0 0 0 0
[10Y - more 0 0 0 0 0 0 0 0 0 0 0 0 0 0
Tot 0 0 0 0 0 0 0 0 0 0 0 0 0 0
[ 0 - 3M [ 0 0 0 0 0 0 0 0 0 0 0 0 0 0
[ 3M - 1Y [ 223 0 223 223 0 0 0 0 0 0 0 0 0 0
[ 1Y - 2Y [ 0 0 0 0 0 0 0 0 0 0 0 0 0 0
[ 2Y - 3Y [ 0 0 0 0 0 0 0 0 0 0 0 0 0 0
[3Y - 5Y [ 0 0 0 0 0 0 0 0 0 0 0 0 0 0
[5Y - 10Y [ 0 0 0 0 0 0 0 0 0 0 0 0 0 0
[10Y - more 0 0 0 0 0 0 0 0 0 0 0 0 0 0
Tot 223 0 223 223 0 0 0 0 0 0 0 0 0 0
[ 0 - 3M [ 0 0 0 0 0 0 0 0 0 0 0 0 0 0
[ 3M - 1Y [ 0 0 0 0 0 0 0 0 0 0 0 0 0 0
[ 1Y - 2Y [ 0 0 0 0 0 0 0 0 0 0 0 0 0 0
[ 2Y - 3Y [ 0 0 0 0 0 0 0 0 0 0 0 0 0 0
[3Y - 5Y [ 0 0 0 0 0 0 0 0 0 0 0 0 0 0
[5Y - 10Y [ 0 0 0 0 0 0 0 0 0 0 0 0 0 0
[10Y - more 0 0 0 0 0 0 0 0 0 0 0 0 0 0
Tot 0 0 0 0 0 0 0 0 0 0 0 0 0 0
[ 0 - 3M [ 0 0 0 0 0 0 0 0 0 0 0 0 0 0
[ 3M - 1Y [ 0 0 0 0 0 0 0 0 0 0 0 0 0 0
[ 1Y - 2Y [ 0 0 0 0 0 0 0 0 0 0 0 0 0 0
[ 2Y - 3Y [ 0 0 0 0 0 0 0 0 0 0 0 0 0 0
[3Y - 5Y [ 0 0 0 0 0 0 0 0 0 0 0 0 0 0
[5Y - 10Y [ 0 0 0 0 0 0 0 0 0 0 0 0 0 0
[10Y - more 0 0 0 0 0 0 0 0 0 0 0 0 0 0
Tot 0 0 0 0 0 0 0 0 0 0 0 0 0 0
Latvia
Germany
Greece
Hungary
Iceland
Ireland
Italy
Croatia
Liechtenstein

2014 EU-wide Stress Test - Sovereign Exposure
(mln EUR)
Residual Maturity Country / Region
GROSS DIRECT LONG
EXPOSURES (accounting value gross
of provisions)
(1)
NET DIRECT POSITIONS (gross exposures (long) net of cash short
positions of sovereign debt to other counterpaties only where there
is a maturity matching)
(1)
DIRECT SOVEREIGN EXPOSURES IN DERIVATIVES (1)
of which: loans
and advances
of which: AFS
banking book
of which: FVO
(designated at fair
value through
profit&loss)
banking book
of which: Financial
assets held for
trading
(2)
Derivatives with positive fair value at
31/12/2013
Derivatives with negative fair value at
31/12/2013
Derivatives with positive fair value
at 31/12/2013
Derivatives with negative fair
value at 31/12/2013
VALUES AS OF 31/12/2013 VALUES AS OF 31/12/2013 VALUES AS OF 31/12/2013
INDIRECT SOVEREIGN EXPOSURES (3) (on and off balance sheet)
Fair-value at
31/12/2013 (+)Notional value
Fair-value at
31/12/2013 (-)Notional value
Fair-value at
31/12/2013 (+)Notional value
Fair-value at 31/12/2013
(-)
Austria
Notional value
[ 0 - 3M [ 0 0 0 0 0 0 0 0 0 0 0 0 0 0
[ 3M - 1Y [ 0 0 0 0 0 0 0 0 0 0 0 0 0 0
[ 1Y - 2Y [ 0 0 0 0 0 0 0 0 0 0 0 0 0 0
[ 2Y - 3Y [ 0 0 0 0 0 0 0 0 0 0 0 0 0 0
[3Y - 5Y [ 0 0 0 0 0 0 0 0 0 0 0 0 0 0
[5Y - 10Y [ 0 0 0 0 0 0 0 0 0 0 0 0 0 0
[10Y - more 0 0 0 0 0 0 0 0 0 0 0 0 0 0
Tot 0 0 0 0 0 0 0 0 0 0 0 0 0 0
[ 0 - 3M [ 0 0 0 0 0 0 0 0 0 0 0 0 0 0
[ 3M - 1Y [ 0 0 0 0 0 0 0 0 0 0 0 0 0 0
[ 1Y - 2Y [ 0 0 0 0 0 0 0 0 0 0 0 0 0 0
[ 2Y - 3Y [ 0 0 0 0 0 0 0 0 0 0 0 0 0 0
[3Y - 5Y [ 0 0 0 0 0 0 0 0 0 0 0 0 0 0
[5Y - 10Y [ 0 0 0 0 0 0 0 0 0 0 0 0 0 0
[10Y - more 0 0 0 0 0 0 0 0 0 0 0 0 0 0
Tot 0 0 0 0 0 0 0 0 0 0 0 0 0 0
[ 0 - 3M [ 0 0 0 0 0 0 0 0 0 0 0 0 0 0
[ 3M - 1Y [ 0 0 0 0 0 0 0 0 0 0 0 0 0 0
[ 1Y - 2Y [ 0 0 0 0 0 0 0 0 0 0 0 0 0 0
[ 2Y - 3Y [ 0 0 0 0 0 0 0 0 0 0 0 0 0 0
[3Y - 5Y [ 0 0 0 0 0 0 0 0 0 0 0 0 0 0
[5Y - 10Y [ 0 0 0 0 0 0 0 0 0 0 0 0 0 0
[10Y - more 0 0 0 0 0 0 0 0 0 0 0 0 0 0
Tot 0 0 0 0 0 0 0 0 0 0 0 0 0 0
[ 0 - 3M [ 0 0 0 0 0 0 0 0 0 0 0 0 0 0
[ 3M - 1Y [ 0 0 0 0 0 0 0 0 0 0 0 0 0 0
[ 1Y - 2Y [ 0 0 0 0 0 0 0 0 0 0 0 0 0 0
[ 2Y - 3Y [ 0 0 0 0 0 0 0 0 0 0 0 0 0 0
[3Y - 5Y [ 0 0 0 0 0 0 0 0 0 0 0 0 0 0
[5Y - 10Y [ 0 0 0 0 0 0 0 0 0 0 0 0 0 0
[10Y - more 0 0 0 0 0 0 0 0 0 0 0 0 0 0
Tot 0 0 0 0 0 0 0 0 0 0 0 0 0 0
[ 0 - 3M [ 0 0 0 0 0 0 0 0 0 0 0 0 0 0
[ 3M - 1Y [ 0 0 0 0 0 0 0 0 0 0 0 0 0 0
[ 1Y - 2Y [ 0 0 0 0 0 0 0 0 0 0 0 0 0 0
[ 2Y - 3Y [ 0 0 0 0 0 0 0 0 0 0 0 0 0 0
[3Y - 5Y [ 0 0 0 0 0 0 0 0 0 0 0 0 0 0
[5Y - 10Y [ 0 0 0 0 0 0 0 0 0 0 0 0 0 0
[10Y - more 0 0 0 0 0 0 0 0 0 0 0 0 0 0
Tot 0 0 0 0 0 0 0 0 0 0 0 0 0 0
[ 0 - 3M [ 0 0 0 0 0 0 0 0 0 0 0 0 0 0
[ 3M - 1Y [ 0 0 0 0 0 0 0 0 0 0 0 0 0 0
[ 1Y - 2Y [ 0 0 0 0 0 0 0 0 0 0 0 0 0 0
[ 2Y - 3Y [ 0 0 0 0 0 0 0 0 0 0 0 0 0 0
[3Y - 5Y [ 0 0 0 0 0 0 0 0 0 0 0 0 0 0
[5Y - 10Y [ 0 0 0 0 0 0 0 0 0 0 0 0 0 0
[10Y - more 0 0 0 0 0 0 0 0 0 0 0 0 0 0
Tot 0 0 0 0 0 0 0 0 0 0 0 0 0 0
[ 0 - 3M [ 0 0 0 0 0 0 0 0 0 0 0 0 0 0
[ 3M - 1Y [ 0 0 0 0 0 0 0 0 0 0 0 0 0 0
[ 1Y - 2Y [ 0 0 0 0 0 0 0 0 0 0 0 0 0 0
[ 2Y - 3Y [ 0 0 0 0 0 0 0 0 0 0 0 0 0 0
[3Y - 5Y [ 0 0 0 0 0 0 0 0 0 0 0 0 0 0
[5Y - 10Y [ 38 0 38 38 0 0 0 0 0 0 0 0 0 0
[10Y - more 0 0 0 0 0 0 0 0 0 0 0 0 0 0
Tot 38 0 38 38 0 0 0 0 0 0 0 0 0 0
[ 0 - 3M [ 0 0 0 0 0 0 0 0 0 0 0 0 0 0
[ 3M - 1Y [ 0 0 0 0 0 0 0 0 0 0 0 0 0 0
[ 1Y - 2Y [ 0 0 0 0 0 0 0 0 0 0 0 0 0 0
[ 2Y - 3Y [ 0 0 0 0 0 0 0 0 0 0 0 0 0 0
[3Y - 5Y [ 0 0 0 0 0 0 0 0 0 0 0 0 0 0
[5Y - 10Y [ 0 0 0 0 0 0 0 0 0 0 0 0 0 0
[10Y - more 0 0 0 0 0 0 0 0 0 0 0 0 0 0
Tot 0 0 0 0 0 0 0 0 0 0 0 0 0 0
[ 0 - 3M [ 0 0 0 0 0 0 0 0 0 0 0 0 0 0
[ 3M - 1Y [ 0 0 0 0 0 0 0 0 0 0 0 0 0 0
[ 1Y - 2Y [ 0 0 0 0 0 0 0 0 0 0 0 0 0 0
[ 2Y - 3Y [ 0 0 0 0 0 0 0 0 0 0 0 0 0 0
[3Y - 5Y [ 0 0 0 0 0 0 0 0 0 0 0 0 0 0
[5Y - 10Y [ 0 0 0 0 0 0 0 0 0 0 0 0 0 0
[10Y - more 0 0 0 0 0 0 0 0 0 0 0 0 0 0
Tot 0 0 0 0 0 0 0 0 0 0 0 0 0 0
Lithuania
Luxembourg
Malta
Netherlands
Norway
Poland
Portugal
Romania
Slovakia
2014 EU-wide Stress Test - Sovereign Exposure
(mln EUR)
Residual Maturity Country / Region
GROSS DIRECT LONG
EXPOSURES (accounting value gross
of provisions)
(1)
NET DIRECT POSITIONS (gross exposures (long) net of cash short
positions of sovereign debt to other counterpaties only where there
is a maturity matching)
(1)
DIRECT SOVEREIGN EXPOSURES IN DERIVATIVES (1)
of which: loans
and advances
of which: AFS
banking book
of which: FVO
(designated at fair
value through
profit&loss)
banking book
of which: Financial
assets held for
trading
(2)
Derivatives with positive fair value at
31/12/2013
Derivatives with negative fair value at
31/12/2013
Derivatives with positive fair value
at 31/12/2013
Derivatives with negative fair
value at 31/12/2013
VALUES AS OF 31/12/2013 VALUES AS OF 31/12/2013 VALUES AS OF 31/12/2013
INDIRECT SOVEREIGN EXPOSURES (3) (on and off balance sheet)
Fair-value at
31/12/2013 (+)Notional value
Fair-value at
31/12/2013 (-)Notional value
Fair-value at
31/12/2013 (+)Notional value
Fair-value at 31/12/2013
(-)
Austria
Notional value
[ 0 - 3M [ 0 0 0 0 0 0 0 0 0 0 0 0 0 0
[ 3M - 1Y [ 0 0 0 0 0 0 0 0 0 0 0 0 0 0
[ 1Y - 2Y [ 0 0 0 0 0 0 0 0 0 0 0 0 0 0
[ 2Y - 3Y [ 0 0 0 0 0 0 0 0 0 0 0 0 0 0
[3Y - 5Y [ 0 0 0 0 0 0 0 0 0 0 0 0 0 0
[5Y - 10Y [ 0 0 0 0 0 0 0 0 0 0 0 0 0 0
[10Y - more 0 0 0 0 0 0 0 0 0 0 0 0 0 0
Tot 0 0 0 0 0 0 0 0 0 0 0 0 0 0
[ 0 - 3M [ 1,149 1,019 1,149 130 0 0 0 0 0 0 0 0 0 0
[ 3M - 1Y [ 445 75 445 352 0 18 0 0 0 0 0 0 0 0
[ 1Y - 2Y [ 191 154 191 37 0 0 0 0 0 0 0 0 0 0
[ 2Y - 3Y [ 940 72 940 868 0 0 0 0 0 0 0 0 0 0
[3Y - 5Y [ 2,029 194 2,029 1,835 0 0 0 0 0 0 0 0 0 0
[5Y - 10Y [ 3,607 229 3,607 3,379 0 0 0 0 0 0 0 0 0 0
[10Y - more 1,794 46 1,794 1,748 0 0 0 0 0 0 0 0 0 0
Tot 10,157 1,790 10,157 8,349 0 18 0 0 0 0 0 0 0 0
[ 0 - 3M [ 0 0 0 0 0 0 0 0 0 0 0 0 0 0
[ 3M - 1Y [ 0 0 0 0 0 0 0 0 0 0 0 0 0 0
[ 1Y - 2Y [ 0 0 0 0 0 0 0 0 0 0 0 0 0 0
[ 2Y - 3Y [ 0 0 0 0 0 0 0 0 0 0 0 0 0 0
[3Y - 5Y [ 0 0 0 0 0 0 0 0 0 0 0 0 0 0
[5Y - 10Y [ 0 0 0 0 0 0 0 0 0 0 0 0 0 0
[10Y - more 0 0 0 0 0 0 0 0 0 0 0 0 0 0
Tot 0 0 0 0 0 0 0 0 0 0 0 0 0 0
[ 0 - 3M [ 0 0 0 0 0 0 0 0 0 0 0 0 0 0
[ 3M - 1Y [ 0 0 0 0 0 0 0 0 0 0 0 0 0 0
[ 1Y - 2Y [ 0 0 0 0 0 0 0 0 0 0 0 0 0 0
[ 2Y - 3Y [ 0 0 0 0 0 0 0 0 0 0 0 0 0 0
[3Y - 5Y [ 2 0 2 2 0 0 0 0 0 0 0 0 0 0
[5Y - 10Y [ 9 0 9 9 0 0 0 0 0 0 0 0 0 0
[10Y - more 22 0 22 22 0 0 0 0 0 0 0 0 0 0
Tot 33 0 33 33 0 0 0 0 0 0 0 0 0 0
Spain
Slovenia
Sweden
United Kingdom
Australia
Canada
Hong Kong
Japan
U.S.
2014 EU-wide Stress Test - Sovereign Exposure
(mln EUR)
Residual Maturity Country / Region
GROSS DIRECT LONG
EXPOSURES (accounting value gross
of provisions)
(1)
NET DIRECT POSITIONS (gross exposures (long) net of cash short
positions of sovereign debt to other counterpaties only where there
is a maturity matching)
(1)
DIRECT SOVEREIGN EXPOSURES IN DERIVATIVES (1)
of which: loans
and advances
of which: AFS
banking book
of which: FVO
(designated at fair
value through
profit&loss)
banking book
of which: Financial
assets held for
trading
(2)
Derivatives with positive fair value at
31/12/2013
Derivatives with negative fair value at
31/12/2013
Derivatives with positive fair value
at 31/12/2013
Derivatives with negative fair
value at 31/12/2013
VALUES AS OF 31/12/2013 VALUES AS OF 31/12/2013 VALUES AS OF 31/12/2013
INDIRECT SOVEREIGN EXPOSURES (3) (on and off balance sheet)
Fair-value at
31/12/2013 (+)Notional value
Fair-value at
31/12/2013 (-)Notional value
Fair-value at
31/12/2013 (+)Notional value
Fair-value at 31/12/2013
(-)
Austria
Notional value
[ 0 - 3M [ 0 0 0 0 0 0 0 0 0 0 0 0 0 0
[ 3M - 1Y [ 0 0 0 0 0 0 0 0 0 0 0 0 0 0
[ 1Y - 2Y [ 0 0 0 0 0 0 0 0 0 0 0 0 0 0
[ 2Y - 3Y [ 0 0 0 0 0 0 0 0 0 0 0 0 0 0
[3Y - 5Y [ 0 0 0 0 0 0 0 0 0 0 0 0 0 0
[5Y - 10Y [ 0 0 0 0 0 0 0 0 0 0 0 0 0 0
[10Y - more 0 0 0 0 0 0 0 0 0 0 0 0 0 0
Tot 0 0 0 0 0 0 0 0 0 0 0 0 0 0
[ 0 - 3M [ 0 0 0 0 0 0 0 0 0 0 0 0 0 0
[ 3M - 1Y [ 0 0 0 0 0 0 0 0 0 0 0 0 0 0
[ 1Y - 2Y [ 0 0 0 0 0 0 0 0 0 0 0 0 0 0
[ 2Y - 3Y [ 0 0 0 0 0 0 0 0 0 0 0 0 0 0
[3Y - 5Y [ 0 0 0 0 0 0 0 0 0 0 0 0 0 0
[5Y - 10Y [ 0 0 0 0 0 0 0 0 0 0 0 0 0 0
[10Y - more 0 0 0 0 0 0 0 0 0 0 0 0 0 0Tot 0 0 0 0 0 0 0 0 0 0 0 0 0 0
Notes and definitions
(1) The exposures reported cover only exposures to central, regional and local governments on immediate borrower basis, and do not include exposures to other counterparts with full or partial government guarantees
(2) The banks disclose the exposures in the "Financial assets held for trading" portfolio after offsetting the cash short positions having the same maturities. (3) The exposures reported include the positions towards counterparts (other than sovereign) on sovereign credit risk (i.e. CDS, financial guarantees) booked in all the accounting portfolio (on-off balance sheet). 'Irrespective of the denomination and or accounting classification of the positions the economic substance over the form must be used as a criteria for the identification of the exposures to be included in this column. This item does not include exposures to counterparts (other than sovereign) with full or partial government guarantees by central, regional and local governments
Latin America and the
Caribbean
Africa
Others
Middle East
China
Switzerland
Other advanced economies
non EEA
Other Central and eastern
Europe countries non EEA
2014 EU-wide Stress TestCapital
(mln EUR) CRR / CRDIV DEFINITION OF CAPITAL As of 31/12/2013 As of 31/12/2014 As of 31/12/2015 As of 31/12/2016 As of 31/12/2014 As of 31/12/2015 As of 31/12/2016 COREP CODE REGULATION
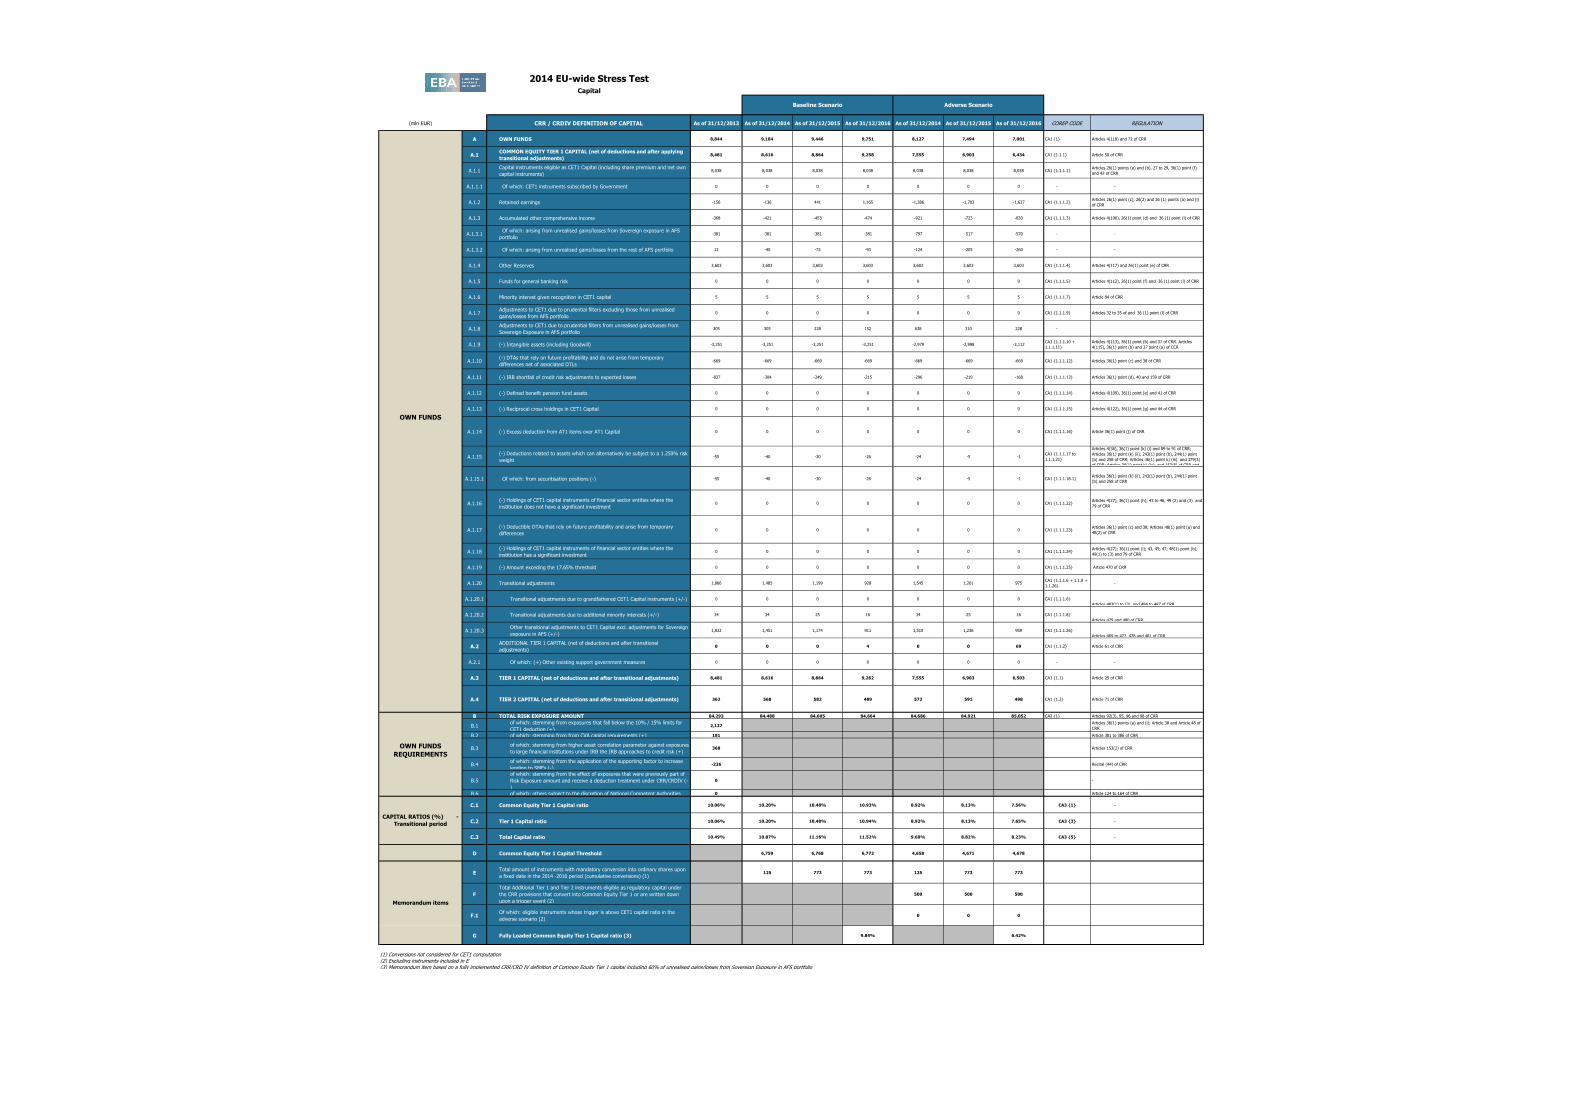
A OWN FUNDS 8,844 9,184 9,446 9,751 8,127 7,494 7,001 CA1 {1} Articles 4(118) and 72 of CRR
A.1COMMON EQUITY TIER 1 CAPITAL (net of deductions and after applying
transitional adjustments)8,481 8,616 8,864 9,258 7,555 6,903 6,434 CA1 {1.1.1} Article 50 of CRR
A.1.1Capital instruments eligible as CET1 Capital (including share premium and net own
capital instruments)8,038 8,038 8,038 8,038 8,038 8,038 8,038 CA1 {1.1.1.1}
Articles 26(1) points (a) and (b), 27 to 29, 36(1) point (f)
and 42 of CRR
A.1.1.1 Of which: CET1 instruments subscribed by Government 0 0 0 0 0 0 0 - -
A.1.2 Retained earnings -156 -136 441 1,165 -1,386 -1,703 -1,637 CA1 {1.1.1.2}Articles 26(1) point (c), 26(2) and 36 (1) points (a) and (l)
of CRR
A.1.3 Accumulated other comprehensive income -368 -421 -453 -474 -921 -723 -830 CA1 {1.1.1.3} Articles 4(100), 26(1) point (d) and 36 (1) point (l) of CRR
A.1.3.1 Of which: arising from unrealised gains/losses from Sovereign exposure in AFS
portfolio-381 -381 -381 -381 -797 -517 -570 - -
A.1.3.2 Of which: arising from unrealised gains/losses from the rest of AFS portfolio 12 -40 -72 -93 -124 -205 -260 - -
A.1.4 Other Reserves 3,603 3,603 3,603 3,603 3,603 3,603 3,603 CA1 {1.1.1.4} Articles 4(117) and 26(1) point (e) of CRR
A.1.5 Funds for general banking risk 0 0 0 0 0 0 0 CA1 {1.1.1.5} Articles 4(112), 26(1) point (f) and 36 (1) point (l) of CRR
A.1.6 Minority interest given recognition in CET1 capital 5 5 5 5 5 5 5 CA1 {1.1.1.7} Article 84 of CRR
A.1.7Adjustments to CET1 due to prudential filters excluding those from unrealised
gains/losses from AFS portfolio0 0 0 0 0 0 0 CA1 {1.1.1.9} Articles 32 to 35 of and 36 (1) point (l) of CRR
A.1.8Adjustments to CET1 due to prudential filters from unrealised gains/losses from
Sovereign Exposure in AFS portfolio305 305 228 152 638 310 228 -
A.1.9 (-) Intangible assets (including Goodwill) -3,251 -3,251 -3,251 -3,251 -2,979 -2,998 -3,112CA1 {1.1.1.10 +
1.1.1.11}
Articles 4(113), 36(1) point (b) and 37 of CRR. Articles
4(115), 36(1) point (b) and 37 point (a) of CCR
A.1.10(-) DTAs that rely on future profitability and do not arise from temporary
differences net of associated DTLs -669 -669 -669 -669 -669 -669 -669 CA1 {1.1.1.12} Articles 36(1) point (c) and 38 of CRR
A.1.11 (-) IRB shortfall of credit risk adjustments to expected losses -837 -304 -249 -215 -296 -219 -168 CA1 {1.1.1.13} Articles 36(1) point (d), 40 and 159 of CRR
A.1.12 (-) Defined benefit pension fund assets 0 0 0 0 0 0 0 CA1 {1.1.1.14} Articles 4(109), 36(1) point (e) and 41 of CRR
A.1.13 (-) Reciprocal cross holdings in CET1 Capital 0 0 0 0 0 0 0 CA1 {1.1.1.15} Articles 4(122), 36(1) point (g) and 44 of CRR
A.1.14 (-) Excess deduction from AT1 items over AT1 Capital 0 0 0 0 0 0 0 CA1 {1.1.1.16} Article 36(1) point (j) of CRR
A.1.15(-) Deductions related to assets which can alternatively be subject to a 1.250% risk
weight-55 -40 -30 -26 -24 -5 -1
CA1 {1.1.1.17 to
1.1.1.21}
Articles 4(36), 36(1) point (k) (i) and 89 to 91 of CRR;
Articles 36(1) point (k) (ii), 243(1) point (b), 244(1) point
(b) and 258 of CRR; Articles 36(1) point k) (iii) and 379(3)
of CRR; Articles 36(1) point k) (iv) and 153(8) of CRR and
A.1.15.1 Of which: from securitisation positions (-) -55 -40 -30 -26 -24 -5 -1 CA1 {1.1.1.18.1}Articles 36(1) point (k) (ii), 243(1) point (b), 244(1) point
(b) and 258 of CRR
A.1.16(-) Holdings of CET1 capital instruments of financial sector entities where the
institiution does not have a significant investment0 0 0 0 0 0 0 CA1 {1.1.1.22}
Articles 4(27), 36(1) point (h); 43 to 46, 49 (2) and (3) and
79 of CRR
A.1.17(-) Deductible DTAs that rely on future profitability and arise from temporary
differences0 0 0 0 0 0 0 CA1 {1.1.1.23}
Articles 36(1) point (c) and 38; Articles 48(1) point (a) and
48(2) of CRR
A.1.18(-) Holdings of CET1 capital instruments of financial sector entities where the
institiution has a significant investment0 0 0 0 0 0 0 CA1 {1.1.1.24}
Articles 4(27); 36(1) point (i); 43, 45; 47; 48(1) point (b);
49(1) to (3) and 79 of CRR
A.1.19 (-) Amount exceding the 17.65% threshold 0 0 0 0 0 0 0 CA1 {1.1.1.25} Article 470 of CRR
A.1.20 Transitional adjustments 1,866 1,485 1,199 928 1,545 1,261 975CA1 {1.1.1.6 + 1.1.8 +
1.1.26}-
A.1.20.1 Transitional adjustments due to grandfathered CET1 Capital instruments (+/-) 0 0 0 0 0 0 0 CA1 {1.1.1.6}
Articles 483(1) to (3), and 484 to 487 of CRR
A.1.20.2 Transitional adjustments due to additional minority interests (+/-) 34 34 25 16 34 25 16 CA1 {1.1.1.8}
Articles 479 and 480 of CRR
A.1.20.3Other transitional adjustments to CET1 Capital excl. adjustments for Sovereign
exposure in AFS (+/-)1,832 1,451 1,174 911 1,510 1,236 959 CA1 {1.1.1.26}
Articles 469 to 472, 478 and 481 of CRR
A.2ADDITIONAL TIER 1 CAPITAL (net of deductions and after transitional
adjustments)0 0 0 4 0 0 69 CA1 {1.1.2} Article 61 of CRR
A.2.1 Of which: (+) Other existing support government measures 0 0 0 0 0 0 0 - -
A.3 TIER 1 CAPITAL (net of deductions and after transitional adjustments) 8,481 8,616 8,864 9,262 7,555 6,903 6,503 CA1 {1.1} Article 25 of CRR
A.4 TIER 2 CAPITAL (net of deductions and after transitional adjustments) 362 568 582 489 572 591 498 CA1 {1.2} Article 71 of CRR
B TOTAL RISK EXPOSURE AMOUNT 84,293 84,488 84,605 84,664 84,686 84,921 85,052 CA2 {1} Articles 92(3), 95, 96 and 98 of CRR
B.1of which: stemming from exposures that fall below the 10% / 15% limits for
CET1 deduction (+)2,127 0 0 0 0 0 0
Articles 36(1) points (a) and (i); Article 38 and Article 48 of
CRR
B.2 of which: stemming from from CVA capital requirements (+) 181 0 0 0 0 0 0 Article 381 to 386 of CRR
B.3of which: stemming from higher asset correlation parameter against exposures
to large financial institutions under IRB the IRB approaches to credit risk (+)368 0 0 0 0 0 0 Articles 153(2) of CRR
B.4of which: stemming from the application of the supporting factor to increase
lending to SMEs (-)-226 0 0 0 0 0 0 Recital (44) of CRR
B.5
of which: stemming from the effect of exposures that were previously part of
Risk Exposure amount and receive a deduction treatment under CRR/CRDIV (-
)
0 0 0 0 0 0 0 -
B.6 of which: others subject to the discretion of National Competent Authorities 0 0 0 0 0 0 0 Article 124 to 164 of CRR
C.1 Common Equity Tier 1 Capital ratio 10.06% 10.20% 10.48% 10.93% 8.92% 8.13% 7.56% CA3 {1} -
C.2 Tier 1 Capital ratio 10.06% 10.20% 10.48% 10.94% 8.92% 8.13% 7.65% CA3 {3} -
C.3 Total Capital ratio 10.49% 10.87% 11.16% 11.52% 9.60% 8.82% 8.23% CA3 {5} -
D Common Equity Tier 1 Capital Threshold 6,759 6,768 6,773 4,658 4,671 4,678
ETotal amount of instruments with mandatory conversion into ordinary shares upon
a fixed date in the 2014 -2016 period (cumulative conversions) (1)125 773 773 125 773 773
F
Total Additional Tier 1 and Tier 2 instruments eligible as regulatory capital under
the CRR provisions that convert into Common Equity Tier 1 or are written down
upon a trigger event (2)
500 500 500
F.1Of which: eligible instruments whose trigger is above CET1 capital ratio in the
adverse scenario (2)0 0 0
G Fully Loaded Common Equity Tier 1 Capital ratio (3) 9.84% 6.42%
(1) Conversions not considered for CET1 computation(2) Excluding instruments included in E(3) Memorandum item based on a fully implemented CRR/CRD IV definition of Common Equity Tier 1 capital including 60% of unrealised gains/losses from Sovereign Exposure in AFS portfolio
Memorandum items
Baseline Scenario Adverse Scenario
OWN FUNDS
OWN FUNDS
REQUIREMENTS
CAPITAL RATIOS (%) -
Transitional period
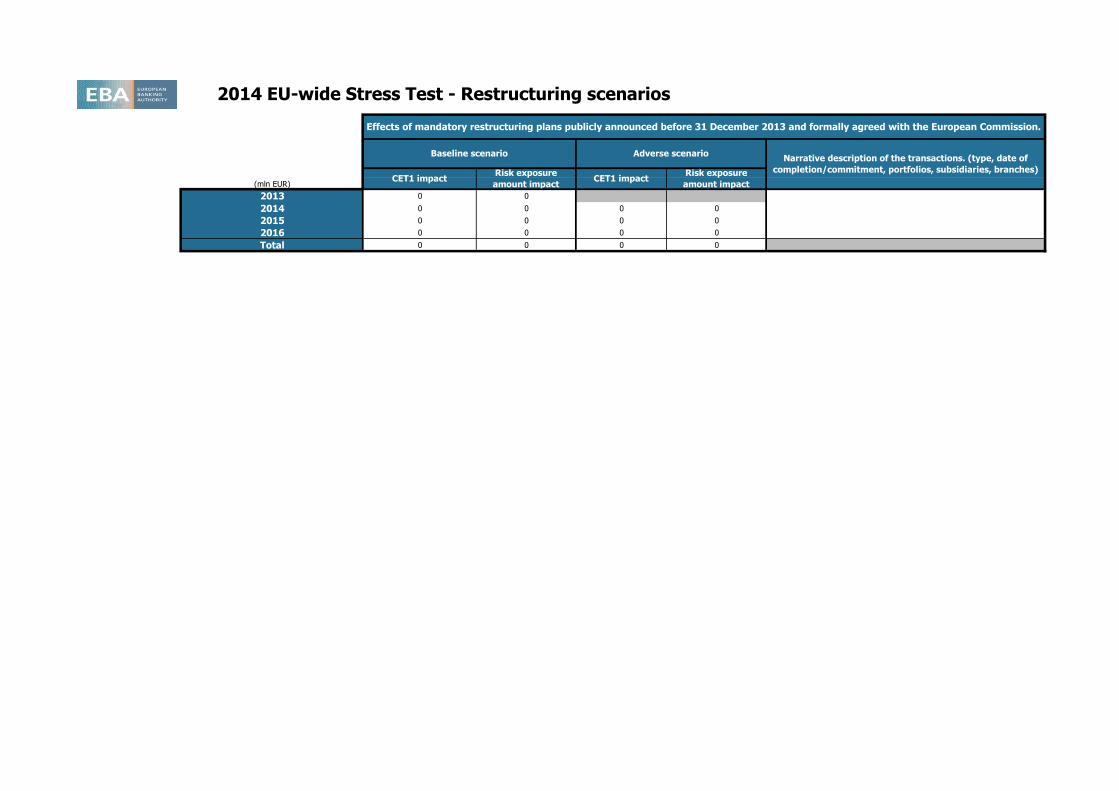
2014 EU-wide Stress Test - Restructuring scenarios
(mln EUR)
2013 0 0
2014 0 0 0 0
2015 0 0 0 0
2016 0 0 0 0
Total 0 0 0 0
Effects of mandatory restructuring plans publicly announced before 31 December 2013 and formally agreed with the European Commission.
Baseline scenario Adverse scenarioNarrative description of the transactions. (type, date of
completion/commitment, portfolios, subsidiaries, branches) CET1 impact
Risk exposure
amount impactCET1 impact
Risk exposure
amount impact
2014 EU-wide Stress Test
Outcome of the Stress Test based on the Restructuring plan for banks whose plan was formally agreed with the European Commission after 31 December 2013
(mln EUR)
As of
31/12/2013
As of
31/12/2014
As of
31/12/2015
As of
31/12/2016
As of
31/12/2014
As of
31/12/2015
As of
31/12/2016
COMMON EQUITY TIER 1 CAPITAL (net of deductions and after applying transitional adjustments)
TOTAL RISK EXPOSURE AMOUNT
COMMON EQUITY TIER 1 RATIO #DIV/0! #DIV/0! #DIV/0! #DIV/0! #DIV/0! #DIV/0! #DIV/0!
Baseline scenario Adverse scenario
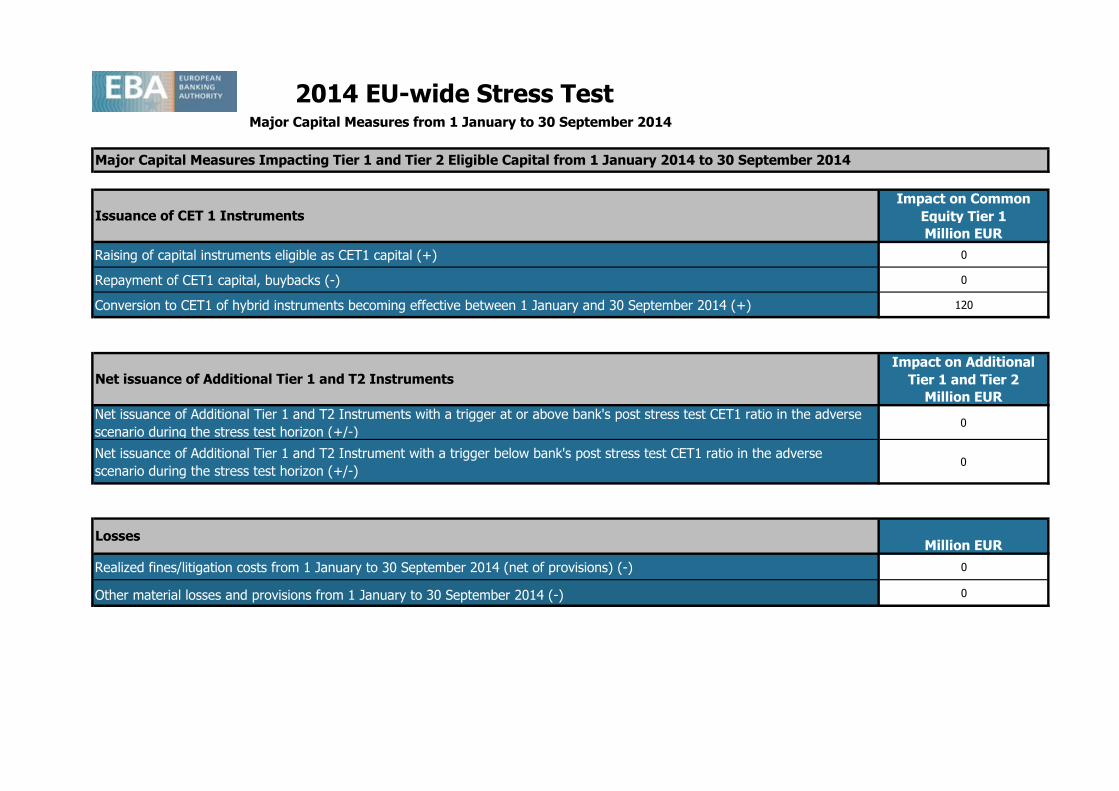
2014 EU-wide Stress Test
Impact on Common
Equity Tier 1
Million EUR
Raising of capital instruments eligible as CET1 capital (+) 0
Repayment of CET1 capital, buybacks (-) 0
Conversion to CET1 of hybrid instruments becoming effective between 1 January and 30 September 2014 (+) 120
Impact on Additional
Tier 1 and Tier 2
Million EUR
Net issuance of Additional Tier 1 and T2 Instruments with a trigger at or above bank's post stress test CET1 ratio in the adverse
scenario during the stress test horizon (+/-)0
Net issuance of Additional Tier 1 and T2 Instrument with a trigger below bank's post stress test CET1 ratio in the adverse
scenario during the stress test horizon (+/-)0
Million EUR
Realized fines/litigation costs from 1 January to 30 September 2014 (net of provisions) (-) 0
Other material losses and provisions from 1 January to 30 September 2014 (-) 0
Major Capital Measures from 1 January to 30 September 2014
Losses
Net issuance of Additional Tier 1 and T2 Instruments
Issuance of CET 1 Instruments
Major Capital Measures Impacting Tier 1 and Tier 2 Eligible Capital from 1 January 2014 to 30 September 2014