2016 EU-wide Stress Test · Bank Name Deutsche Bank AG LEI Code 7LTWFZYICNSX8D621K86 Country Code...
29
Bank Name Deutsche Bank AG LEI Code 7LTWFZYICNSX8D621K86 Country Code DE De 2016 EU-wide Stress Test
-
Upload
truonghanh -
Category
Documents
-
view
215 -
download
0
Transcript of 2016 EU-wide Stress Test · Bank Name Deutsche Bank AG LEI Code 7LTWFZYICNSX8D621K86 Country Code...
Bank Name Deutsche Bank AG
LEI Code 7LTWFZYICNSX8D621K86
Country Code DEDe
2016 EU-wide Stress Test
Actual
(starting year)Baseline Scenario Adverse Scenario
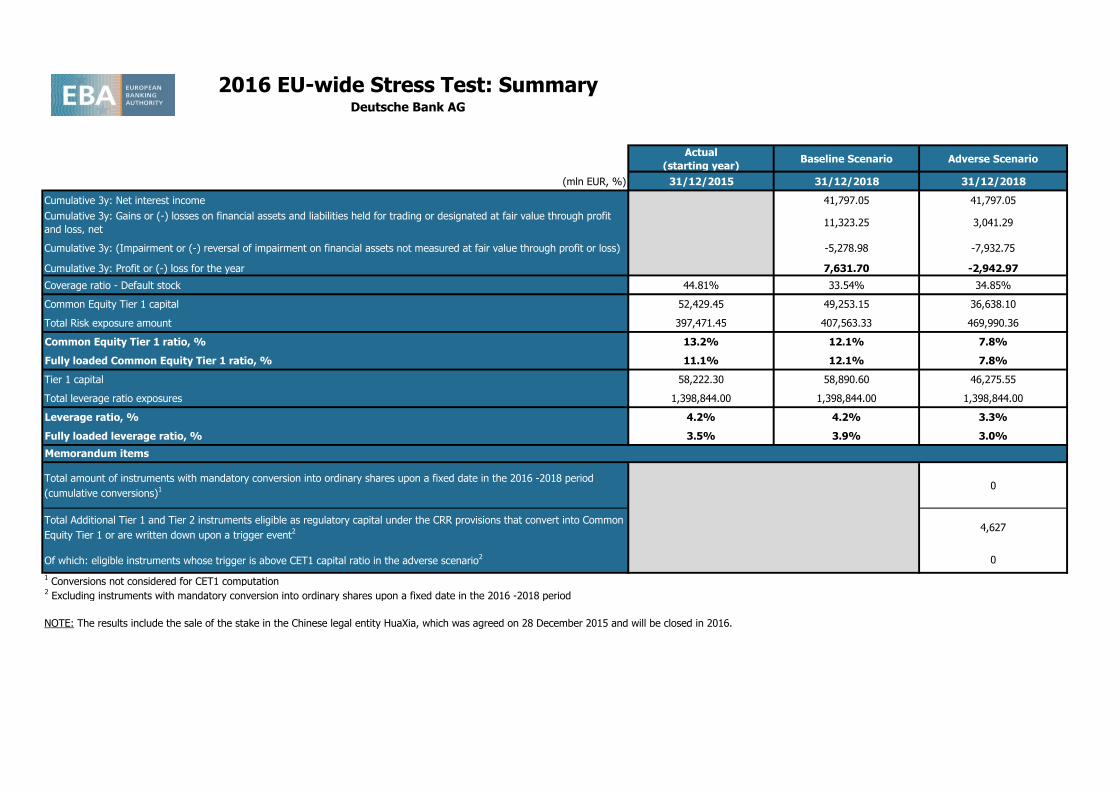
(mln EUR, %) 31/12/2015 31/12/2018 31/12/2018
Cumulative 3y: Net interest income 41,797.05 41,797.05
Cumulative 3y: Gains or (-) losses on financial assets and liabilities held for trading or designated at fair value through profit
and loss, net11,323.25 3,041.29
Cumulative 3y: (Impairment or (-) reversal of impairment on financial assets not measured at fair value through profit or loss) -5,278.98 -7,932.75
Cumulative 3y: Profit or (-) loss for the year 7,631.70 -2,942.97
Coverage ratio - Default stock 44.81% 33.54% 34.85%
Common Equity Tier 1 capital 52,429.45 49,253.15 36,638.10
Total Risk exposure amount 397,471.45 407,563.33 469,990.36
Common Equity Tier 1 ratio, % 13.2% 12.1% 7.8%
Fully loaded Common Equity Tier 1 ratio, % 11.1% 12.1% 7.8%
Tier 1 capital 58,222.30 58,890.60 46,275.55
Total leverage ratio exposures 1,398,844.00 1,398,844.00 1,398,844.00
Leverage ratio, % 4.2% 4.2% 3.3%
Fully loaded leverage ratio, % 3.5% 3.9% 3.0%
Total amount of instruments with mandatory conversion into ordinary shares upon a fixed date in the 2016 -2018 period
(cumulative conversions)1 0
Total Additional Tier 1 and Tier 2 instruments eligible as regulatory capital under the CRR provisions that convert into Common
Equity Tier 1 or are written down upon a trigger event2 4,627
Of which: eligible instruments whose trigger is above CET1 capital ratio in the adverse scenario2 0
1 Conversions not considered for CET1 computation
2 Excluding instruments with mandatory conversion into ordinary shares upon a fixed date in the 2016 -2018 period
2016 EU-wide Stress Test: SummaryDeutsche Bank AG
Memorandum items
NOTE: The results include the sale of the stake in the Chinese legal entity HuaXia, which was agreed on 28 December 2015 and will be closed in 2016.
2016 EU-wide Stress Test:
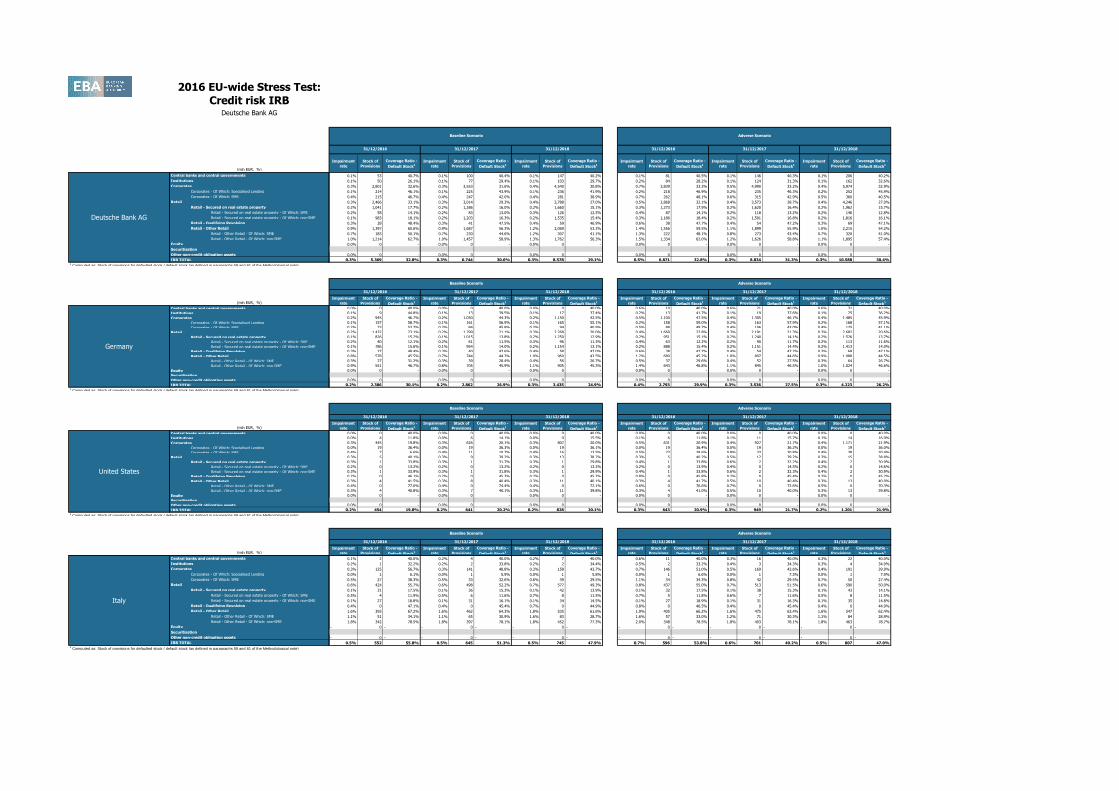
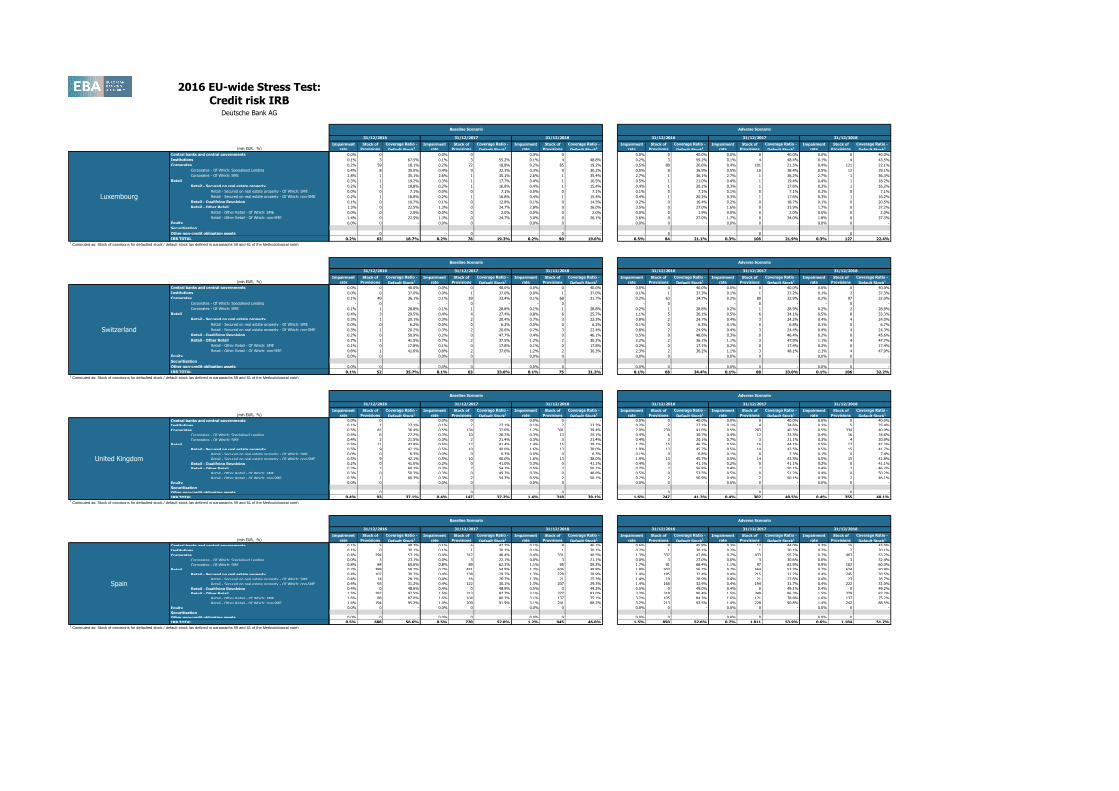
Credit risk IRBDeutsche Bank AG
(mln EUR, %)
Non-defaulted Defaulted Non-defaulted Defaulted Non-defaulted Defaulted Non-defaulted Defaulted Non-defaulted Defaulted Non-defaulted Defaulted
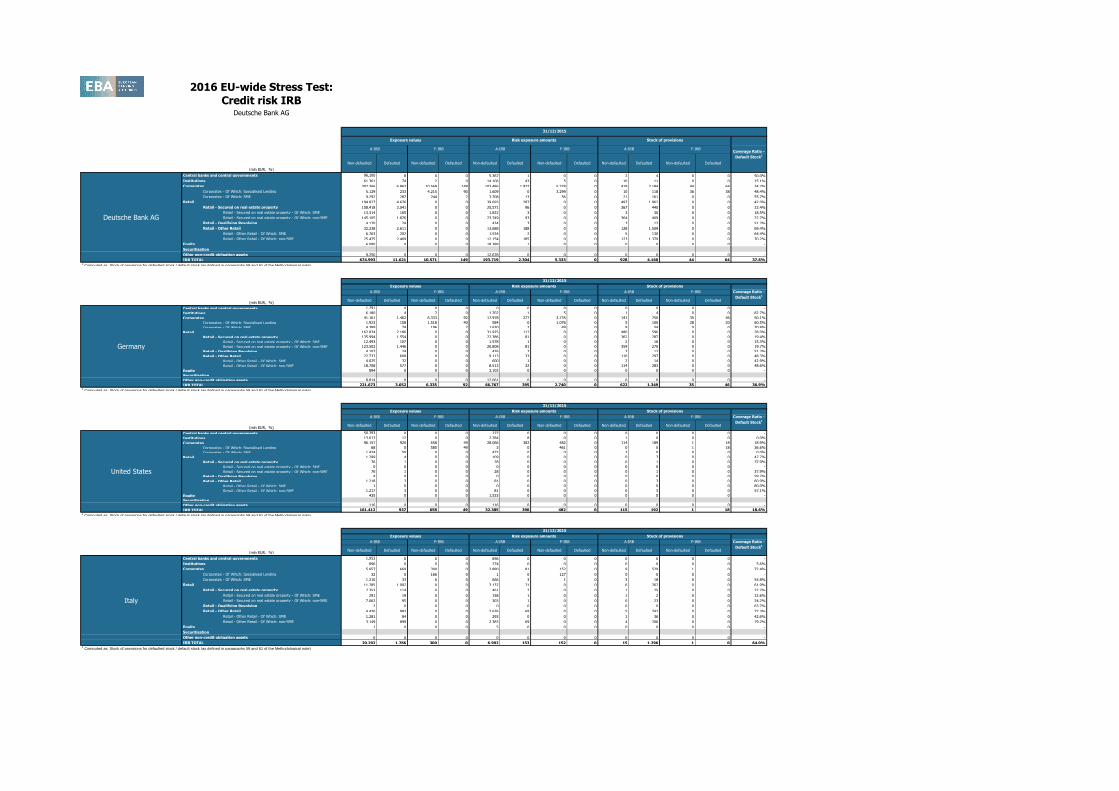
Central banks and central governments 96,100 8 0 0 5,367 1 0 0 2 4 0 0 50.0%
Institutions 61,361 74 2 0 14,106 43 5 0 10 11 0 0 15.1%
Corporates 307,366 6,863 10,569 149 103,486 1,972 5,328 0 419 2,184 44 64 34.7%
Corporates - Of Which: Specialised Lending 5,129 233 4,215 90 1,609 0 3,299 0 10 118 36 38 48.4%
Corporates - Of Which: SME 9,292 287 244 2 3,708 13 56 0 21 161 0 0 55.7%
Retail 194,827 4,676 0 0 39,693 287 0 0 497 1,962 0 0 42.0%
Retail - Secured on real estate property 158,418 2,041 0 0 25,571 96 0 0 367 440 0 0 22.4%
Retail - Secured on real estate property - Of Which: SME 13,314 165 0 0 1,822 3 0 0 3 30 0 0 18.5%
Retail - Secured on real estate property - Of Which: non-SME 145,105 1,876 0 0 23,749 93 0 0 364 409 0 0 22.7%
Retail - Qualifying Revolving 4,170 24 0 0 434 3 0 0 3 12 0 0 51.3%
Retail - Other Retail 32,238 2,611 0 0 13,688 188 0 0 128 1,509 0 0 69.4%
Retail - Other Retail - Of Which: SME 6,763 202 0 0 1,534 2 0 0 5 130 0 0 64.4%
Retail - Other Retail - Of Which: non-SME 25,475 2,409 0 0 12,154 185 0 0 123 1,379 0 0 70.2%
Equity 6,090 0 0 0 18,388 1 0 0 0 0 0 0 -
Securitisation
Other non-credit obligation assets 9,250 0 0 0 12,678 0 0 0 0 0 0 0 -
IRB TOTAL 674,993 11,621 10,571 149 193,719 2,304 5,333 0 928 4,160 44 64 37.6%1 Computed as: Stock of provisions for defaulted stock / default stock (as defined in paragraphs 59 and 61 of the Methodological note)
(mln EUR, %)Non-defaulted Defaulted Non-defaulted Defaulted Non-defaulted Defaulted Non-defaulted Defaulted Non-defaulted Defaulted Non-defaulted Defaulted
Central banks and central governments 1,791 0 0 0 0 0 0 0 0 0 0 0 -
Institutions 6,180 4 2 0 1,702 1 5 0 1 4 0 0 82.7%
Corporates 41,161 1,462 6,333 92 17,978 277 2,735 0 141 750 35 46 50.1%
Corporates - Of Which: Specialised Lending 1,923 158 1,518 40 584 0 1,076 0 5 100 28 20 60.5%
Corporates - Of Which: SME 4,389 74 196 2 1,630 2 49 0 9 54 0 0 70.8%
Retail 162,834 2,186 0 0 31,925 117 0 0 480 596 0 0 28.0%
Retail - Secured on real estate property 135,994 1,554 0 0 22,386 81 0 0 362 287 0 0 19.4%
Retail - Secured on real estate property - Of Which: SME 12,493 107 0 0 1,578 1 0 0 2 16 0 0 15.3%
Retail - Secured on real estate property - Of Which: non-SME 123,502 1,446 0 0 20,808 81 0 0 359 270 0 0 19.7%
Retail - Qualifying Revolving 4,107 24 0 0 426 3 0 0 3 12 0 0 51.3%
Retail - Other Retail 22,733 608 0 0 9,113 33 0 0 116 297 0 0 48.3%
Retail - Other Retail - Of Which: SME 4,025 32 0 0 600 1 0 0 2 14 0 0 42.9%
Retail - Other Retail - Of Which: non-SME 18,708 577 0 0 8,513 32 0 0 114 283 0 0 48.6%
Equity 894 0 0 0 3,102 0 0 0 0 0 0 0 -
Securitisation
Other non-credit obligation assets 8,814 0 0 0 12,061 0 0 0 0 0 0 0 -
IRB TOTAL 221,673 3,652 6,335 92 66,767 395 2,740 0 622 1,349 35 46 36.9%1 Computed as: Stock of provisions for defaulted stock / default stock (as defined in paragraphs 59 and 61 of the Methodological note)
(mln EUR, %)Non-defaulted Defaulted Non-defaulted Defaulted Non-defaulted Defaulted Non-defaulted Defaulted Non-defaulted Defaulted Non-defaulted Defaulted
Central banks and central governments 50,393 0 0 0 277 0 0 0 0 0 0 0 -
Institutions 13,013 12 0 0 2,284 8 0 0 1 0 0 0 0.0%
Corporates 96,157 920 658 49 28,066 382 482 0 114 189 1 18 18.9%
Corporates - Of Which: Specialised Lending 68 0 585 49 3 0 461 0 0 0 1 18 36.6%
Corporates - Of Which: SME 1,424 50 0 0 472 0 0 0 3 0 0 0 0.0%
Retail 1,299 4 0 0 109 0 0 0 0 3 0 0 47.7%
Retail - Secured on real estate property 76 1 0 0 28 0 0 0 0 1 0 0 37.9%
Retail - Secured on real estate property - Of Which: SME 0 0 0 0 0 0 0 0 0 0 0 0 -
Retail - Secured on real estate property - Of Which: non-SME 76 1 0 0 28 0 0 0 0 1 0 0 37.9%
Retail - Qualifying Revolving 4 0 0 0 0 0 0 0 0 0 0 0 59.2%
Retail - Other Retail 1,218 3 0 0 81 0 0 0 0 3 0 0 60.9%
Retail - Other Retail - Of Which: SME 1 0 0 0 0 0 0 0 0 0 0 0 80.0%
Retail - Other Retail - Of Which: non-SME 1,217 3 0 0 81 0 0 0 0 3 0 0 57.1%
Equity 435 0 0 0 1,533 0 0 0 0 0 0 0 -
Securitisation
Other non-credit obligation assets 116 0 0 0 116 0 0 0 0 0 0 0 -
IRB TOTAL 161,412 937 658 49 32,385 390 482 0 115 192 1 18 18.6%1 Computed as: Stock of provisions for defaulted stock / default stock (as defined in paragraphs 59 and 61 of the Methodological note)
(mln EUR, %)Non-defaulted Defaulted Non-defaulted Defaulted Non-defaulted Defaulted Non-defaulted Defaulted Non-defaulted Defaulted Non-defaulted Defaulted
Central banks and central governments 1,953 0 0 0 696 0 0 0 0 0 0 0 -
Institutions 896 0 0 0 274 0 0 0 0 0 0 0 5.6%
Corporates 5,657 669 300 0 2,880 81 152 0 9 529 1 0 72.4%
Corporates - Of Which: Specialised Lending 32 0 166 0 1 0 127 0 0 0 0 0 -
Corporates - Of Which: SME 1,210 33 6 0 666 3 1 0 3 18 0 0 54.8%
Retail 11,785 1,097 0 0 3,137 71 0 0 6 767 0 0 61.9%
Retail - Secured on real estate property 7,353 114 0 0 461 2 0 0 1 25 0 0 22.2%
Retail - Secured on real estate property - Of Which: SME 291 19 0 0 158 1 0 0 1 2 0 0 12.6%
Retail - Secured on real estate property - Of Which: non-SME 7,062 95 0 0 303 1 0 0 0 23 0 0 24.2%
Retail - Qualifying Revolving 2 0 0 0 0 0 0 0 0 0 0 0 63.7%
Retail - Other Retail 4,430 983 0 0 2,676 69 0 0 5 742 0 0 72.3%
Retail - Other Retail - Of Which: SME 1,281 84 0 0 293 0 0 0 1 36 0 0 42.6%
Retail - Other Retail - Of Which: non-SME 3,149 899 0 0 2,383 69 0 0 4 706 0 0 79.2%
Equity 1 0 0 0 5 0 0 0 0 0 0 0 -
Securitisation
Other non-credit obligation assets 0 0 0 0 0 0 0 0 0 0 0 0 -
IRB TOTAL 20,292 1,766 300 0 6,992 153 152 0 15 1,296 1 0 64.0%1 Computed as: Stock of provisions for defaulted stock / default stock (as defined in paragraphs 59 and 61 of the Methodological note)
Italy
A-IRB F-IRB A-IRB F-IRB
United States
31/12/2015
Exposure values Risk exposure amounts Stock of provisions
Coverage Ratio -
Default Stock1
A-IRB F-IRB
Coverage Ratio -
Default Stock1
A-IRB F-IRB A-IRB F-IRB A-IRB F-IRB
Germany
31/12/2015
Exposure values Risk exposure amounts Stock of provisions
F-IRB A-IRB F-IRB
31/12/2015
Exposure values Risk exposure amounts Stock of provisions
Coverage Ratio -
Default Stock1
A-IRB F-IRB A-IRB
Deutsche Bank AG
F-IRB A-IRB F-IRB A-IRB F-IRB
31/12/2015
Exposure values Risk exposure amounts Stock of provisions
Coverage Ratio -
Default Stock1
A-IRB
2016 EU-wide Stress Test:
Credit risk IRBDeutsche Bank AG
(mln EUR, %)Non-defaulted Defaulted Non-defaulted Defaulted Non-defaulted Defaulted Non-defaulted Defaulted Non-defaulted Defaulted Non-defaulted Defaulted
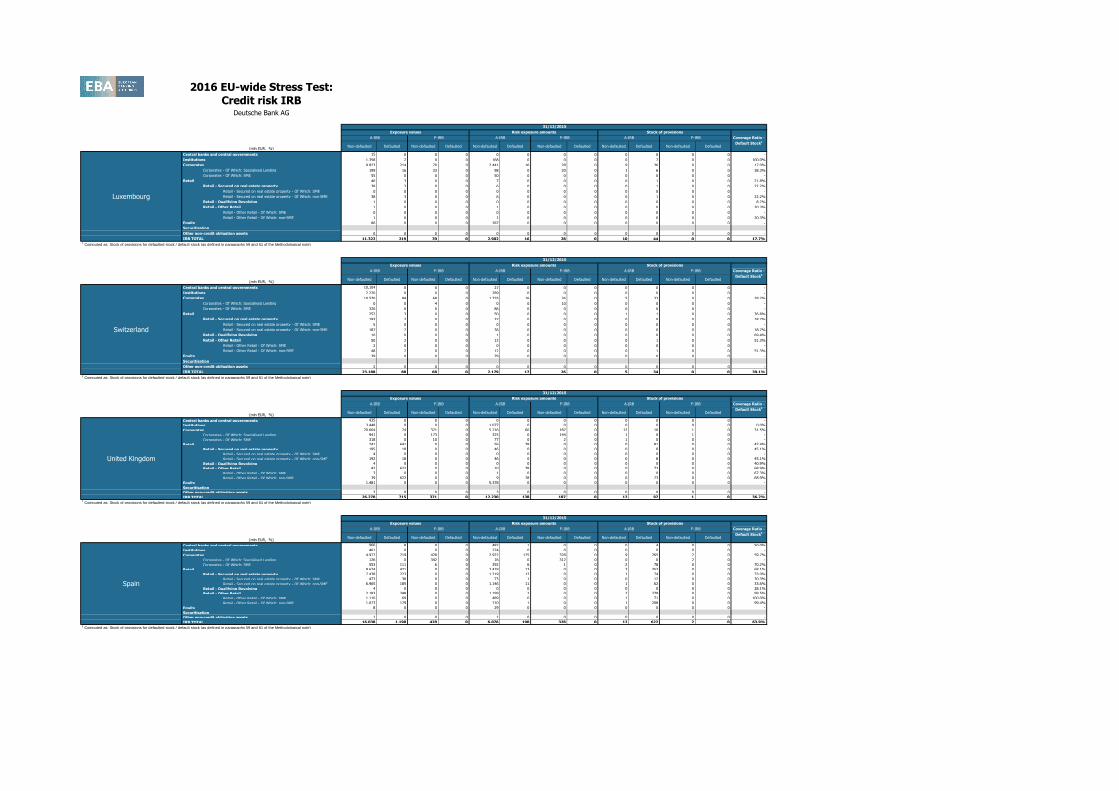
Central banks and central governments 15 0 0 0 0 0 0 0 0 0 0 0 -
Institutions 1,358 2 0 0 168 0 0 0 0 7 0 0 100.0%
Corporates 9,823 214 70 0 2,441 16 28 0 9 36 0 0 17.0%
Corporates - Of Which: Specialised Lending 199 16 33 0 98 0 20 0 1 6 0 0 38.3%
Corporates - Of Which: SME 55 0 0 0 50 0 0 0 0 0 0 0 -
Retail 40 3 0 0 7 0 0 0 0 1 0 0 21.8%
Retail - Secured on real estate property 38 3 0 0 6 0 0 0 0 1 0 0 22.2%
Retail - Secured on real estate property - Of Which: SME 0 0 0 0 0 0 0 0 0 0 0 0 -
Retail - Secured on real estate property - Of Which: non-SME 38 3 0 0 6 0 0 0 0 1 0 0 22.2%
Retail - Qualifying Revolving 1 0 0 0 0 0 0 0 0 0 0 0 8.2%
Retail - Other Retail 1 0 0 0 1 0 0 0 0 0 0 0 20.3%
Retail - Other Retail - Of Which: SME 0 0 0 0 0 0 0 0 0 0 0 0 -
Retail - Other Retail - Of Which: non-SME 1 0 0 0 1 0 0 0 0 0 0 0 20.3%
Equity 86 0 0 0 287 0 0 0 0 0 0 0 -
Securitisation
Other non-credit obligation assets 0 0 0 0 0 0 0 0 0 0 0 0 -
IRB TOTAL 11,322 219 70 0 2,902 16 28 0 10 44 0 0 17.7%1 Computed as: Stock of provisions for defaulted stock / default stock (as defined in paragraphs 59 and 61 of the Methodological note)
(mln EUR, %)Non-defaulted Defaulted Non-defaulted Defaulted Non-defaulted Defaulted Non-defaulted Defaulted Non-defaulted Defaulted Non-defaulted Defaulted
Central banks and central governments 10,104 0 0 0 27 0 0 0 0 0 0 0 -
Institutions 2,220 0 0 0 289 0 0 0 0 0 0 0 -
Corporates 10,570 84 68 0 1,735 16 26 0 5 33 0 0 39.2%
Corporates - Of Which: Specialised Lending 0 0 4 0 0 0 10 0 0 0 0 0 -
Corporates - Of Which: SME 320 0 0 0 86 0 0 0 0 0 0 0 -
Retail 252 3 0 0 50 0 0 0 1 1 0 0 36.8%
Retail - Secured on real estate property 193 2 0 0 37 0 0 0 0 0 0 0 18.7%
Retail - Secured on real estate property - Of Which: SME 5 0 0 0 0 0 0 0 0 0 0 0 -
Retail - Secured on real estate property - Of Which: non-SME 187 2 0 0 36 0 0 0 0 0 0 0 18.7%
Retail - Qualifying Revolving 10 0 0 0 1 0 0 0 0 0 0 0 69.4%
Retail - Other Retail 50 2 0 0 12 0 0 0 0 1 0 0 51.3%
Retail - Other Retail - Of Which: SME 2 0 0 0 0 0 0 0 0 0 0 0 -
Retail - Other Retail - Of Which: non-SME 48 2 0 0 12 0 0 0 0 1 0 0 51.3%
Equity 39 0 0 0 79 0 0 0 0 0 0 0 -
Securitisation
Other non-credit obligation assets 2 0 0 0 0 0 0 0 0 0 0 0 -
IRB TOTAL 23,188 88 68 0 2,179 17 26 0 5 34 0 0 39.1%1 Computed as: Stock of provisions for defaulted stock / default stock (as defined in paragraphs 59 and 61 of the Methodological note)
(mln EUR, %)Non-defaulted Defaulted Non-defaulted Defaulted Non-defaulted Defaulted Non-defaulted Defaulted Non-defaulted Defaulted Non-defaulted Defaulted
Central banks and central governments 435 0 0 0 0 0 0 0 0 0 0 0 -
Institutions 3,448 0 0 0 1,077 0 0 0 0 0 0 0 0.0%
Corporates 20,664 74 371 0 5,716 60 187 0 12 16 1 0 31.5%
Corporates - Of Which: Specialised Lending 941 0 173 0 325 0 144 0 1 0 1 0 -
Corporates - Of Which: SME 318 0 10 0 77 0 2 0 1 0 0 0 -
Retail 241 641 0 0 56 78 0 0 0 81 0 0 47.4%
Retail - Secured on real estate property 195 18 0 0 46 0 0 0 0 8 0 0 45.1%
Retail - Secured on real estate property - Of Which: SME 4 0 0 0 0 0 0 0 0 0 0 0 -
Retail - Secured on real estate property - Of Which: non-SME 192 18 0 0 46 0 0 0 0 8 0 0 45.1%
Retail - Qualifying Revolving 4 0 0 0 0 0 0 0 0 0 0 0 40.9%
Retail - Other Retail 42 622 0 0 10 78 0 0 0 73 0 0 68.9%
Retail - Other Retail - Of Which: SME 3 0 0 0 1 0 0 0 0 0 0 0 67.3%
Retail - Other Retail - Of Which: non-SME 39 622 0 0 9 78 0 0 0 73 0 0 68.9%
Equity 1,481 0 0 0 5,378 0 0 0 0 0 0 0 -
Securitisation
Other non-credit obligation assets 3 0 0 0 3 0 0 0 0 0 0 0 -
IRB TOTAL 26,270 715 371 0 12,230 138 187 0 12 97 1 0 36.2%1 Computed as: Stock of provisions for defaulted stock / default stock (as defined in paragraphs 59 and 61 of the Methodological note)
(mln EUR, %)Non-defaulted Defaulted Non-defaulted Defaulted Non-defaulted Defaulted Non-defaulted Defaulted Non-defaulted Defaulted Non-defaulted Defaulted
Central banks and central governments 966 8 0 0 482 1 0 0 0 4 0 0 50.0%
Institutions 461 0 0 0 224 0 0 0 0 0 0 0 -
Corporates 4,977 719 428 0 2,922 175 328 0 9 265 2 0 59.7%
Corporates - Of Which: Specialised Lending 126 0 342 0 16 0 312 0 0 0 2 0 -
Corporates - Of Which: SME 553 111 6 0 292 6 1 0 2 78 0 0 70.2%
Retail 9,624 471 0 0 2,418 13 0 0 3 353 0 0 68.1%
Retail - Secured on real estate property 7,438 223 0 0 1,219 12 0 0 1 74 0 0 33.0%
Retail - Secured on real estate property - Of Which: SME 473 38 0 0 73 1 0 0 0 12 0 0 30.3%
Retail - Secured on real estate property - Of Which: non-SME 6,965 185 0 0 1,146 11 0 0 1 62 0 0 33.6%
Retail - Qualifying Revolving 4 0 0 0 0 0 0 0 0 0 0 0 28.1%
Retail - Other Retail 2,183 248 0 0 1,199 2 0 0 2 279 0 0 99.5%
Retail - Other Retail - Of Which: SME 1,110 69 0 0 489 0 0 0 1 71 0 0 100.0%
Retail - Other Retail - Of Which: non-SME 1,073 179 0 0 710 1 0 0 1 208 0 0 99.4%
Equity 8 0 0 0 29 0 0 0 0 0 0 0 -
Securitisation
Other non-credit obligation assets 1 0 0 0 1 0 0 0 0 0 0 0 -
IRB TOTAL 16,038 1,198 428 0 6,076 190 328 0 12 622 2 0 63.9%1 Computed as: Stock of provisions for defaulted stock / default stock (as defined in paragraphs 59 and 61 of the Methodological note)
Spain
A-IRB F-IRB A-IRB F-IRB
United Kingdom
31/12/2015
Exposure values Risk exposure amounts Stock of provisions
Coverage Ratio -
Default Stock1
A-IRB F-IRB
Stock of provisions
Coverage Ratio -
Default Stock1
A-IRB F-IRB A-IRB F-IRB A-IRB F-IRB
Switzerland
31/12/2015
Exposure values Risk exposure amounts
A-IRB F-IRB A-IRB F-IRB
Luxembourg
31/12/2015
Exposure values Risk exposure amounts Stock of provisions
Coverage Ratio -
Default Stock1
A-IRB F-IRB
Stock of provisions
Coverage Ratio -
Default Stock1
A-IRB F-IRB A-IRB F-IRB A-IRB F-IRB
31/12/2015
Exposure values Risk exposure amounts

2016 EU-wide Stress Test:
Credit risk IRBDeutsche Bank AG
(mln EUR, %)Non-defaulted Defaulted Non-defaulted Defaulted Non-defaulted Defaulted Non-defaulted Defaulted Non-defaulted Defaulted Non-defaulted Defaulted
Central banks and central governments 170 0 0 0 6 0 0 0 0 0 0 0 -
Institutions 1,617 0 0 0 527 0 0 0 0 0 0 0 -
Corporates 10,996 501 195 0 3,892 86 103 0 12 4 0 0 0.9%
Corporates - Of Which: Specialised Lending 337 38 78 0 79 0 54 0 1 1 0 0 1.7%
Corporates - Of Which: SME 51 0 2 0 16 0 0 0 0 0 0 0 -
Retail 100 1 0 0 18 0 0 0 0 0 0 0 31.6%
Retail - Secured on real estate property 82 1 0 0 14 0 0 0 0 0 0 0 23.1%
Retail - Secured on real estate property - Of Which: SME 3 0 0 0 1 0 0 0 0 0 0 0 -
Retail - Secured on real estate property - Of Which: non-SME 78 1 0 0 14 0 0 0 0 0 0 0 23.1%
Retail - Qualifying Revolving 2 0 0 0 0 0 0 0 0 0 0 0 84.1%
Retail - Other Retail 16 0 0 0 4 0 0 0 0 0 0 0 44.5%
Retail - Other Retail - Of Which: SME 1 0 0 0 0 0 0 0 0 0 0 0 -
Retail - Other Retail - Of Which: non-SME 15 0 0 0 4 0 0 0 0 0 0 0 44.5%
Equity 1 0 0 0 2 0 0 0 0 0 0 0 -
Securitisation
Other non-credit obligation assets 15 0 0 0 15 0 0 0 0 0 0 0 -
IRB TOTAL 12,898 502 195 0 4,460 86 103 0 12 5 0 0 1.0%1 Computed as: Stock of provisions for defaulted stock / default stock (as defined in paragraphs 59 and 61 of the Methodological note)
(mln EUR, %)Non-defaulted Defaulted Non-defaulted Defaulted Non-defaulted Defaulted Non-defaulted Defaulted Non-defaulted Defaulted Non-defaulted Defaulted
Central banks and central governments 2,741 0 0 0 0 0 0 0 0 0 0 0 -
Institutions 5,112 0 0 0 1,158 0 0 0 1 0 0 0 -
Corporates 5,364 52 5 0 1,536 25 2 0 7 14 0 0 27.2%
Corporates - Of Which: Specialised Lending 0 0 0 0 0 0 0 0 0 0 0 0 -
Corporates - Of Which: SME 0 0 0 0 0 0 0 0 0 0 0 0 -
Retail 22 0 0 0 7 0 0 0 0 0 0 0 53.2%
Retail - Secured on real estate property 16 0 0 0 4 0 0 0 0 0 0 0 28.7%
Retail - Secured on real estate property - Of Which: SME 0 0 0 0 0 0 0 0 0 0 0 0 28.7%
Retail - Secured on real estate property - Of Which: non-SME 16 0 0 0 4 0 0 0 0 0 0 0 -
Retail - Qualifying Revolving 1 0 0 0 0 0 0 0 0 0 0 0 56.2%
Retail - Other Retail 5 0 0 0 3 0 0 0 0 0 0 0 86.5%
Retail - Other Retail - Of Which: SME 0 0 0 0 0 0 0 0 0 0 0 0 0.1%
Retail - Other Retail - Of Which: non-SME 4 0 0 0 2 0 0 0 0 0 0 0 86.5%
Equity 2,760 0 0 0 6,899 0 0 0 0 0 0 0 -
Securitisation
Other non-credit obligation assets 6 0 0 0 6 0 0 0 0 0 0 0 -
IRB TOTAL 16,004 53 5 0 9,606 25 2 0 8 14 0 0 27.4%1 Computed as: Stock of provisions for defaulted stock / default stock (as defined in paragraphs 59 and 61 of the Methodological note)
(mln EUR, %)Non-defaulted Defaulted Non-defaulted Defaulted Non-defaulted Defaulted Non-defaulted Defaulted Non-defaulted Defaulted Non-defaulted Defaulted
Central banks and central governments 1,406 0 0 0 795 0 0 0 0 0 0 0 -
Institutions 3,126 0 0 0 1,982 0 0 0 5 0 0 0 -
Corporates 6,077 111 9 1 2,750 149 4 0 12 15 0 0 12.9%
Corporates - Of Which: Specialised Lending 0 0 0 0 0 0 0 0 0 0 0 0 -
Corporates - Of Which: SME 44 0 0 0 18 0 0 0 0 0 0 0 -
Retail 12 0 0 0 5 0 0 0 0 0 0 0 68.4%
Retail - Secured on real estate property 3 0 0 0 0 0 0 0 0 0 0 0 22.4%
Retail - Secured on real estate property - Of Which: SME 0 0 0 0 0 0 0 0 0 0 0 0 -
Retail - Secured on real estate property - Of Which: non-SME 3 0 0 0 0 0 0 0 0 0 0 0 22.4%
Retail - Qualifying Revolving 1 0 0 0 0 0 0 0 0 0 0 0 65.6%
Retail - Other Retail 8 0 0 0 4 0 0 0 0 0 0 0 79.1%
Retail - Other Retail - Of Which: SME 0 0 0 0 0 0 0 0 0 0 0 0 -
Retail - Other Retail - Of Which: non-SME 8 0 0 0 4 0 0 0 0 0 0 0 79.1%
Equity 3 0 0 0 11 0 0 0 0 0 0 0 -
Securitisation
Other non-credit obligation assets 0 0 0 0 0 0 0 0 0 0 0 0 -
IRB TOTAL 10,624 111 9 1 5,543 149 4 0 17 15 0 0 13.1%1 Computed as: Stock of provisions for defaulted stock / default stock (as defined in paragraphs 59 and 61 of the Methodological note)
India
Stock of provisions
Coverage Ratio -
Default Stock1
A-IRB F-IRB A-IRB F-IRB A-IRB F-IRB
China
31/12/2015
Exposure values Risk exposure amounts
A-IRB F-IRB A-IRB F-IRB
Netherlands
31/12/2015
Exposure values Risk exposure amounts Stock of provisions
Coverage Ratio -
Default Stock1
A-IRB F-IRB
Stock of provisions
Coverage Ratio -
Default Stock1
A-IRB F-IRB A-IRB F-IRB A-IRB F-IRB
31/12/2015
Exposure values Risk exposure amounts
2016 EU-wide Stress Test:
Credit risk IRBDeutsche Bank AG
(mln EUR, %)
Central banks and central governments
Institutions
Corporates
Corporates - Of Which: Specialised Lending
Corporates - Of Which: SME
Retail
Retail - Secured on real estate property
Retail - Secured on real estate property - Of Which: SME
Retail - Secured on real estate property - Of Which: non-SME
Retail - Qualifying Revolving
Retail - Other Retail
Retail - Other Retail - Of Which: SME
Retail - Other Retail - Of Which: non-SME
Equity
Securitisation
Other non-credit obligation assets
IRB TOTAL1 Computed as: Stock of provisions for defaulted stock / default stock (as defined in paragraphs 59 and 61 of the Methodological note)
Italy
United States
Germany
Deutsche Bank AG
Impairment
rate
Stock of
Provisions
Coverage Ratio -
Default Stock1
Impairment
rate
Stock of
Provisions
Coverage Ratio -
Default Stock1
Impairment
rate
Stock of
Provisions
Coverage Ratio -
Default Stock1
Impairment
rate
Stock of
Provisions
Coverage Ratio -
Default Stock1
Impairment
rate
Stock of
Provisions
Coverage Ratio -
Default Stock1
Impairment
rate
Stock of
Provisions
Coverage Ratio -
Default Stock1
0.1% 53 40.7% 0.1% 100 40.4% 0.1% 147 40.2% 0.1% 81 40.5% 0.1% 146 40.3% 0.1% 206 40.2%
0.1% 50 26.1% 0.1% 77 29.4% 0.1% 103 29.7% 0.2% 84 28.2% 0.1% 124 31.3% 0.1% 162 32.6%
0.3% 2,801 32.6% 0.3% 3,553 31.6% 0.4% 4,540 30.8% 0.7% 3,839 33.3% 0.5% 4,990 33.2% 0.4% 5,974 32.9%
0.1% 214 46.1% 0.1% 225 43.9% 0.1% 236 41.9% 0.2% 218 46.9% 0.2% 235 46.3% 0.2% 252 45.9%
0.4% 215 46.7% 0.4% 247 42.0% 0.4% 281 38.9% 0.7% 262 48.1% 0.6% 315 42.9% 0.5% 360 40.5%
0.3% 2,466 33.1% 0.3% 3,014 29.3% 0.4% 3,788 27.0% 0.5% 2,868 32.1% 0.4% 3,573 28.7% 0.4% 4,246 27.0%
0.2% 1,041 17.7% 0.2% 1,286 16.0% 0.2% 1,660 15.1% 0.3% 1,273 17.9% 0.2% 1,620 16.4% 0.2% 1,962 15.7%
0.2% 58 14.1% 0.2% 83 13.0% 0.3% 126 12.5% 0.4% 87 14.1% 0.2% 118 13.2% 0.2% 146 12.8%
0.1% 983 18.1% 0.2% 1,203 16.3% 0.2% 1,535 15.4% 0.3% 1,186 18.4% 0.2% 1,501 16.8% 0.2% 1,816 16.1%
0.3% 28 48.4% 0.3% 41 47.5% 0.4% 59 46.9% 0.6% 38 47.7% 0.4% 54 47.2% 0.3% 69 47.1%
0.9% 1,397 60.6% 0.9% 1,687 56.3% 1.2% 2,069 53.3% 1.4% 1,556 59.5% 1.1% 1,899 55.9% 1.0% 2,215 54.2%
0.7% 183 50.1% 0.7% 230 44.6% 1.2% 307 41.1% 1.3% 222 48.1% 0.8% 273 43.4% 0.7% 320 41.0%
1.0% 1,214 62.7% 1.0% 1,457 58.9% 1.3% 1,762 56.3% 1.5% 1,334 62.0% 1.2% 1,626 58.8% 1.1% 1,895 57.4%
0.0% 0 - 0.0% 0 - 0.0% 0 - 0.0% 0 - 0.0% 0 - 0.0% 0 -
0.0% 0 - 0.0% 0 - 0.0% 0 - 0.0% 0 - 0.0% 0 - 0.0% 0 -
0.3% 5,369 32.8% 0.3% 6,744 30.6% 0.3% 8,578 29.1% 0.5% 6,871 32.8% 0.3% 8,834 31.3% 0.3% 10,588 30.4%
Impairment
rate
Stock of
Provisions
Coverage Ratio -
Default Stock1
Impairment
rate
Stock of
Provisions
Coverage Ratio -
Default Stock1
Impairment
rate
Stock of
Provisions
Coverage Ratio -
Default Stock1
Impairment
rate
Stock of
Provisions
Coverage Ratio -
Default Stock1
Impairment
rate
Stock of
Provisions
Coverage Ratio -
Default Stock1
Impairment
rate
Stock of
Provisions
Coverage Ratio -
Default Stock1
0.0% 0 40.0% 0.0% 0 40.0% 0.0% 0 40.0% 0.6% 10 40.0% 0.6% 21 40.0% 0.6% 31 40.0%
0.1% 9 44.8% 0.1% 13 39.5% 0.1% 17 37.4% 0.2% 13 41.7% 0.1% 19 37.6% 0.1% 25 36.2%
0.2% 945 46.7% 0.2% 1,050 44.3% 0.2% 1,150 42.5% 0.5% 1,100 47.5% 0.4% 1,305 46.7% 0.4% 1,485 45.9%
0.1% 157 58.7% 0.1% 161 56.9% 0.1% 165 55.1% 0.2% 158 59.0% 0.2% 163 57.9% 0.2% 168 57.1%
0.2% 73 53.7% 0.2% 84 45.8% 0.2% 94 40.9% 0.5% 88 49.7% 0.4% 106 43.0% 0.4% 125 41.1%
0.2% 1,432 23.1% 0.2% 1,799 21.1% 0.3% 2,268 20.0% 0.4% 1,669 22.8% 0.3% 2,191 21.3% 0.3% 2,682 20.6%
0.1% 826 15.2% 0.1% 1,015 13.8% 0.2% 1,250 12.9% 0.2% 951 15.1% 0.2% 1,240 14.1% 0.2% 1,526 13.7%
0.2% 40 12.1% 0.2% 61 11.5% 0.3% 96 11.3% 0.4% 63 12.2% 0.2% 90 11.7% 0.2% 113 11.6%
0.1% 786 15.6% 0.1% 954 14.0% 0.2% 1,154 13.1% 0.2% 888 15.4% 0.2% 1,151 14.4% 0.2% 1,413 14.0%
0.3% 27 48.4% 0.3% 40 47.6% 0.4% 58 47.0% 0.6% 38 47.7% 0.4% 54 47.2% 0.3% 68 47.1%
0.8% 578 45.5% 0.7% 744 44.3% 1.0% 960 43.5% 1.2% 680 45.2% 1.0% 897 44.6% 0.9% 1,088 44.5%
0.3% 27 31.2% 0.3% 39 28.4% 0.4% 56 26.7% 0.5% 37 29.6% 0.4% 52 27.5% 0.3% 64 26.7%
0.9% 551 46.7% 0.8% 705 45.9% 1.1% 905 45.3% 1.4% 643 46.8% 1.1% 845 46.5% 1.0% 1,024 46.6%
0.0% 0 - 0.0% 0 - 0.0% 0 - 0.0% 0 - 0.0% 0 - 0.0% 0 -
0.0% 0 - 0.0% 0 - 0.0% 0 - 0.0% 0 - 0.0% 0 - 0.0% 0 -
0.2% 2,386 30.1% 0.2% 2,862 26.9% 0.3% 3,435 24.9% 0.4% 2,793 29.9% 0.3% 3,536 27.5% 0.3% 4,223 26.2%
Impairment
rate
Stock of
Provisions
Coverage Ratio -
Default Stock1
Impairment
rate
Stock of
Provisions
Coverage Ratio -
Default Stock1
Impairment
rate
Stock of
Provisions
Coverage Ratio -
Default Stock1
Impairment
rate
Stock of
Provisions
Coverage Ratio -
Default Stock1
Impairment
rate
Stock of
Provisions
Coverage Ratio -
Default Stock1
Impairment
rate
Stock of
Provisions
Coverage Ratio -
Default Stock1
0.0% 0 40.0% 0.0% 0 40.0% 0.0% 0 40.0% 0.0% 0 40.0% 0.0% 0 40.0% 0.0% 0 40.0%
0.0% 4 11.8% 0.0% 6 14.1% 0.0% 9 15.5% 0.1% 6 11.8% 0.1% 11 15.7% 0.1% 14 16.9%
0.3% 445 19.8% 0.3% 626 20.1% 0.3% 807 20.0% 0.5% 631 20.9% 0.4% 927 21.7% 0.4% 1,171 21.9%
0.0% 19 36.4% 0.0% 19 36.3% 0.0% 19 36.1% 0.0% 19 36.4% 0.0% 19 36.2% 0.0% 19 36.0%
0.4% 7 6.6% 0.4% 11 10.7% 0.4% 16 13.5% 0.5% 23 28.6% 0.8% 33 30.8% 0.4% 38 30.4%
0.3% 5 40.1% 0.3% 9 39.2% 0.3% 13 38.7% 0.3% 5 40.2% 0.5% 12 39.2% 0.3% 15 38.8%
0.3% 1 33.8% 0.3% 1 31.7% 0.3% 1 29.8% 0.4% 1 33.8% 0.6% 2 32.2% 0.4% 2 30.9%
0.2% 0 13.2% 0.2% 0 13.2% 0.2% 0 13.2% 0.2% 0 13.9% 0.4% 0 14.5% 0.2% 0 14.6%
0.3% 1 33.9% 0.3% 1 31.8% 0.3% 1 29.9% 0.4% 1 33.8% 0.6% 2 32.3% 0.4% 2 30.9%
0.2% 0 46.1% 0.2% 0 45.3% 0.7% 0 45.2% 0.8% 0 45.8% 0.2% 0 45.4% 0.2% 0 45.2%
0.3% 4 41.5% 0.3% 8 40.4% 0.3% 11 40.1% 0.3% 4 41.7% 0.5% 10 40.4% 0.3% 13 40.0%
0.4% 0 77.0% 0.4% 0 74.4% 0.4% 0 72.1% 0.6% 0 76.6% 0.7% 0 72.6% 0.5% 0 70.3%
0.3% 4 40.8% 0.3% 7 40.1% 0.3% 11 39.8% 0.3% 4 41.0% 0.5% 10 40.0% 0.3% 13 39.8%
0.0% 0 - 0.0% 0 - 0.0% 0 - 0.0% 0 - 0.0% 0 - 0.0% 0 -
0.0% 0 - 0.0% 0 - 0.0% 0 - 0.0% 0 - 0.0% 0 - 0.0% 0 -
0.2% 454 19.8% 0.2% 641 20.2% 0.2% 828 20.1% 0.3% 643 20.9% 0.3% 949 21.7% 0.2% 1,201 21.9%
Impairment
rate
Stock of
Provisions
Coverage Ratio -
Default Stock1
Impairment
rate
Stock of
Provisions
Coverage Ratio -
Default Stock1
Impairment
rate
Stock of
Provisions
Coverage Ratio -
Default Stock1
Impairment
rate
Stock of
Provisions
Coverage Ratio -
Default Stock1
Impairment
rate
Stock of
Provisions
Coverage Ratio -
Default Stock1
Impairment
rate
Stock of
Provisions
Coverage Ratio -
Default Stock1
0.1% 2 40.0% 0.2% 4 40.0% 0.2% 7 40.0% 0.6% 11 40.0% 0.3% 16 40.0% 0.3% 22 40.0%
0.2% 1 32.2% 0.2% 2 33.8% 0.2% 2 34.4% 0.5% 2 33.2% 0.4% 3 34.3% 0.3% 4 34.9%
0.3% 125 56.7% 0.3% 141 48.8% 0.3% 158 43.7% 0.7% 146 51.0% 0.5% 169 43.6% 0.4% 191 39.9%
0.0% 1 6.1% 0.0% 1 5.9% 0.0% 1 5.8% 0.0% 1 6.6% 0.0% 1 7.3% 0.0% 1 7.9%
0.5% 27 38.3% 0.5% 33 32.6% 0.6% 39 29.5% 1.1% 34 34.3% 0.8% 42 29.5% 0.7% 50 27.4%
0.6% 424 55.7% 0.6% 498 52.2% 0.7% 577 49.3% 0.8% 437 55.0% 0.7% 513 51.5% 0.6% 590 50.0%
0.1% 31 17.5% 0.1% 36 15.3% 0.1% 42 13.9% 0.1% 32 17.5% 0.1% 38 15.3% 0.1% 43 14.1%
0.5% 4 11.9% 0.5% 6 11.6% 0.7% 8 11.5% 0.7% 5 11.8% 0.6% 7 11.6% 0.5% 8 11.5%
0.1% 27 18.8% 0.1% 31 16.1% 0.1% 34 14.5% 0.1% 27 18.9% 0.1% 31 16.3% 0.1% 35 14.8%
0.4% 0 47.1% 0.4% 0 45.4% 0.7% 0 44.9% 0.8% 0 46.5% 0.4% 0 45.4% 0.4% 0 44.9%
1.6% 393 67.2% 1.6% 462 64.3% 1.8% 535 61.6% 1.9% 405 66.2% 1.6% 475 63.4% 1.6% 547 62.4%
1.1% 51 34.1% 1.1% 65 30.9% 1.6% 83 28.7% 1.6% 57 33.0% 1.2% 71 30.3% 1.1% 84 28.9%
1.8% 342 78.5% 1.8% 397 78.1% 1.8% 452 77.3% 2.0% 348 78.5% 1.8% 403 78.1% 1.8% 463 78.7%
- 0 - - 0 - - 0 - - 0 - - 0 - - 0 -
- 0 - - 0 - - 0 - - 0 - - 0 - - 0 -
0.5% 552 55.8% 0.5% 645 51.3% 0.5% 745 47.9% 0.7% 596 53.8% 0.6% 701 49.2% 0.5% 807 47.0%
31/12/2016 31/12/2017
Baseline Scenario Adverse Scenario
31/12/2018 31/12/2016 31/12/2017 31/12/2018
31/12/2016 31/12/2017 31/12/2018 31/12/2016 31/12/2017 31/12/2018
Baseline Scenario Adverse Scenario
31/12/2016 31/12/2017 31/12/2018
Baseline Scenario Adverse Scenario
31/12/2016 31/12/2017 31/12/2018
31/12/2017 31/12/2018 31/12/2016 31/12/2017 31/12/201831/12/2016
Baseline Scenario Adverse Scenario
2016 EU-wide Stress Test:
Credit risk IRBDeutsche Bank AG
(mln EUR, %)
Central banks and central governments
Institutions
Corporates
Corporates - Of Which: Specialised Lending
Corporates - Of Which: SME
Retail
Retail - Secured on real estate property
Retail - Secured on real estate property - Of Which: SME
Retail - Secured on real estate property - Of Which: non-SME
Retail - Qualifying Revolving
Retail - Other Retail
Retail - Other Retail - Of Which: SME
Retail - Other Retail - Of Which: non-SME
Equity
Securitisation
Other non-credit obligation assets
IRB TOTAL1 Computed as: Stock of provisions for defaulted stock / default stock (as defined in paragraphs 59 and 61 of the Methodological note)
(mln EUR, %)
Central banks and central governments
Institutions
Corporates
Corporates - Of Which: Specialised Lending
Corporates - Of Which: SME
Retail
Retail - Secured on real estate property
Retail - Secured on real estate property - Of Which: SME
Retail - Secured on real estate property - Of Which: non-SME
Retail - Qualifying Revolving
Retail - Other Retail
Retail - Other Retail - Of Which: SME
Retail - Other Retail - Of Which: non-SME
Equity
Securitisation
Other non-credit obligation assets
IRB TOTAL1 Computed as: Stock of provisions for defaulted stock / default stock (as defined in paragraphs 59 and 61 of the Methodological note)
(mln EUR, %)
Central banks and central governments
Institutions
Corporates
Corporates - Of Which: Specialised Lending
Corporates - Of Which: SME
Retail
Retail - Secured on real estate property
Retail - Secured on real estate property - Of Which: SME
Retail - Secured on real estate property - Of Which: non-SME
Retail - Qualifying Revolving
Retail - Other Retail
Retail - Other Retail - Of Which: SME
Retail - Other Retail - Of Which: non-SME
Equity
Securitisation
Other non-credit obligation assets
IRB TOTAL1 Computed as: Stock of provisions for defaulted stock / default stock (as defined in paragraphs 59 and 61 of the Methodological note)
(mln EUR, %)
Central banks and central governments
Institutions
Corporates
Corporates - Of Which: Specialised Lending
Corporates - Of Which: SME
Retail
Retail - Secured on real estate property
Retail - Secured on real estate property - Of Which: SME
Retail - Secured on real estate property - Of Which: non-SME
Retail - Qualifying Revolving
Retail - Other Retail
Retail - Other Retail - Of Which: SME
Retail - Other Retail - Of Which: non-SME
Equity
Securitisation
Other non-credit obligation assets
IRB TOTAL1 Computed as: Stock of provisions for defaulted stock / default stock (as defined in paragraphs 59 and 61 of the Methodological note)
Spain
United Kingdom
Switzerland
Luxembourg
Impairment
rate
Stock of
Provisions
Coverage Ratio -
Default Stock1
Impairment
rate
Stock of
Provisions
Coverage Ratio -
Default Stock1
Impairment
rate
Stock of
Provisions
Coverage Ratio -
Default Stock1
Impairment
rate
Stock of
Provisions
Coverage Ratio -
Default Stock1
Impairment
rate
Stock of
Provisions
Coverage Ratio -
Default Stock1
Impairment
rate
Stock of
Provisions
Coverage Ratio -
Default Stock1
0.0% 0 - 0.0% 0 - 0.0% 0 - 0.0% 0 40.0% 0.0% 0 40.0% 0.0% 0 40.0%
0.1% 3 67.5% 0.1% 3 55.2% 0.1% 4 48.8% 0.2% 3 59.2% 0.1% 4 48.4% 0.1% 4 43.5%
0.2% 59 18.1% 0.2% 72 18.8% 0.2% 85 19.2% 0.5% 80 20.6% 0.4% 101 21.5% 0.4% 121 22.1%
0.4% 8 35.0% 0.4% 9 32.3% 0.3% 9 30.2% 0.5% 8 36.9% 0.5% 10 38.4% 0.5% 12 39.1%
2.8% 1 35.1% 2.6% 1 35.1% 2.6% 1 35.4% 2.7% 1 36.1% 2.7% 1 36.2% 2.7% 1 36.3%
0.3% 1 19.2% 0.3% 1 17.7% 0.4% 1 16.5% 0.5% 1 21.0% 0.4% 1 19.4% 0.4% 1 18.2%
0.2% 1 18.8% 0.2% 1 16.8% 0.4% 1 15.4% 0.4% 1 20.1% 0.3% 1 17.6% 0.3% 1 16.2%
0.0% 0 7.1% 0.0% 0 7.1% 0.0% 0 7.1% 0.1% 0 7.1% 0.1% 0 7.1% 0.1% 0 7.1%
0.2% 1 18.8% 0.2% 1 16.8% 0.4% 1 15.4% 0.4% 1 20.2% 0.3% 1 17.6% 0.3% 1 16.2%
0.1% 0 10.7% 0.1% 0 12.8% 0.1% 0 14.5% 0.2% 0 16.4% 0.2% 0 18.7% 0.1% 0 20.5%
1.3% 0 22.5% 1.3% 0 24.7% 2.8% 0 26.0% 3.5% 0 27.0% 1.6% 0 33.9% 1.7% 0 37.2%
0.0% 0 2.0% 0.0% 0 2.0% 0.0% 0 2.0% 0.0% 0 1.9% 0.0% 0 2.0% 0.0% 0 2.0%
1.4% 0 22.5% 1.3% 0 24.7% 3.0% 0 26.1% 3.6% 0 27.0% 1.7% 0 34.0% 1.8% 0 37.3%
0.0% 0 - 0.0% 0 - 0.0% 0 - 0.0% 0 - 0.0% 0 - 0.0% 0 -
- 0 - - 0 - - 0 - - 0 - - 0 - - 0 -
0.2% 63 18.7% 0.2% 76 19.3% 0.2% 90 19.6% 0.5% 84 21.1% 0.3% 106 21.9% 0.3% 127 22.4%
Impairment
rate
Stock of
Provisions
Coverage Ratio -
Default Stock1
Impairment
rate
Stock of
Provisions
Coverage Ratio -
Default Stock1
Impairment
rate
Stock of
Provisions
Coverage Ratio -
Default Stock1
Impairment
rate
Stock of
Provisions
Coverage Ratio -
Default Stock1
Impairment
rate
Stock of
Provisions
Coverage Ratio -
Default Stock1
Impairment
rate
Stock of
Provisions
Coverage Ratio -
Default Stock1
0.0% 0 40.0% 0.0% 0 40.0% 0.0% 0 40.0% 0.0% 0 40.0% 0.0% 0 40.0% 0.0% 0 40.0%
0.0% 0 37.0% 0.0% 1 37.0% 0.0% 1 37.0% 0.1% 1 37.3% 0.1% 1 37.2% 0.1% 2 37.3%
0.1% 49 36.1% 0.1% 59 33.4% 0.1% 68 31.7% 0.2% 63 34.7% 0.2% 80 32.9% 0.2% 97 32.0%
- 0 - - 0 - - 0 - - 0 - - 0 - - 0 -
0.1% 1 28.8% 0.1% 1 28.8% 0.1% 1 28.8% 0.2% 1 28.8% 0.2% 1 28.9% 0.2% 2 28.9%
0.4% 3 29.5% 0.4% 4 27.4% 0.8% 6 25.7% 1.1% 5 30.1% 0.5% 6 34.1% 0.5% 8 33.3%
0.3% 1 20.1% 0.3% 2 20.4% 0.7% 3 22.3% 0.8% 2 24.7% 0.4% 3 24.2% 0.4% 4 24.0%
0.0% 0 6.2% 0.0% 0 6.2% 0.0% 0 6.2% 0.1% 0 6.3% 0.1% 0 6.8% 0.1% 0 6.7%
0.3% 1 20.2% 0.3% 2 20.6% 0.7% 3 22.4% 0.8% 2 24.9% 0.4% 3 24.4% 0.4% 4 24.3%
0.2% 0 50.9% 0.2% 0 47.7% 0.4% 0 46.1% 0.5% 0 48.6% 0.3% 0 46.4% 0.2% 0 45.6%
0.7% 1 41.5% 0.7% 2 37.5% 1.2% 2 30.2% 2.2% 2 36.1% 1.1% 3 47.9% 1.1% 4 47.7%
0.1% 0 17.8% 0.1% 0 17.8% 0.1% 0 17.8% 0.2% 0 17.1% 0.2% 0 17.4% 0.2% 0 17.4%
0.8% 1 41.6% 0.8% 2 37.6% 1.2% 2 30.3% 2.3% 2 36.2% 1.1% 3 48.1% 1.1% 4 47.9%
0.0% 0 - 0.0% 0 - 0.0% 0 - 0.0% 0 - 0.0% 0 - 0.0% 0 -
0.0% 0 - 0.0% 0 - 0.0% 0 - 0.0% 0 - 0.0% 0 - 0.0% 0 -
0.1% 52 35.7% 0.1% 63 33.0% 0.1% 75 31.3% 0.1% 68 34.4% 0.1% 88 33.0% 0.1% 106 32.2%
Impairment
rate
Stock of
Provisions
Coverage Ratio -
Default Stock1
Impairment
rate
Stock of
Provisions
Coverage Ratio -
Default Stock1
Impairment
rate
Stock of
Provisions
Coverage Ratio -
Default Stock1
Impairment
rate
Stock of
Provisions
Coverage Ratio -
Default Stock1
Impairment
rate
Stock of
Provisions
Coverage Ratio -
Default Stock1
Impairment
rate
Stock of
Provisions
Coverage Ratio -
Default Stock1
0.0% 0 - 0.0% 0 - 0.0% 0 - 0.0% 0 40.0% 0.0% 0 40.0% 0.0% 0 40.0%
0.1% 1 27.1% 0.1% 2 27.1% 0.1% 2 23.3% 0.2% 2 27.1% 0.1% 4 34.6% 0.1% 5 35.4%
0.5% 81 36.4% 0.5% 134 37.0% 1.7% 301 39.4% 2.0% 230 41.0% 0.5% 283 40.3% 0.5% 334 40.0%
0.4% 6 27.2% 0.3% 10 26.2% 0.3% 13 25.1% 0.4% 6 30.7% 0.4% 12 33.5% 0.4% 16 34.6%
0.4% 2 21.5% 0.3% 2 21.4% 0.3% 3 21.4% 0.4% 2 20.1% 0.7% 3 21.1% 0.3% 4 20.9%
0.5% 11 43.9% 0.5% 12 41.4% 1.4% 15 39.1% 1.7% 15 46.7% 0.5% 16 44.1% 0.5% 17 42.2%
0.5% 9 42.1% 0.5% 10 40.0% 1.6% 13 38.0% 1.9% 13 45.7% 0.5% 14 43.5% 0.5% 15 41.7%
0.0% 0 6.3% 0.0% 0 6.3% 0.0% 0 6.3% 0.1% 0 6.8% 0.1% 0 7.3% 0.1% 0 7.4%
0.5% 9 42.1% 0.5% 10 40.0% 1.6% 13 38.0% 1.9% 13 45.7% 0.5% 14 43.5% 0.5% 15 41.8%
0.2% 0 41.0% 0.2% 0 41.0% 0.3% 0 41.1% 0.4% 0 41.1% 0.2% 0 41.1% 0.2% 0 41.1%
0.3% 2 60.2% 0.3% 2 54.3% 0.5% 2 50.1% 0.7% 2 56.8% 0.4% 2 50.1% 0.4% 2 46.2%
0.3% 0 50.3% 0.3% 0 49.2% 0.3% 0 48.8% 0.5% 0 53.5% 0.5% 0 51.2% 0.4% 0 50.2%
0.3% 1 60.3% 0.3% 2 54.3% 0.5% 2 50.1% 0.7% 2 56.9% 0.4% 2 50.1% 0.3% 2 46.1%
0.0% 0 - 0.0% 0 - 0.0% 0 - 0.0% 0 - 0.0% 0 - 0.0% 0 -
- 0 - - 0 - - 0 - - 0 - - 0 - - 0 -
0.4% 93 37.1% 0.4% 147 37.2% 1.4% 318 39.1% 1.6% 247 41.3% 0.4% 302 40.5% 0.4% 355 40.1%
Impairment
rate
Stock of
Provisions
Coverage Ratio -
Default Stock1
Impairment
rate
Stock of
Provisions
Coverage Ratio -
Default Stock1
Impairment
rate
Stock of
Provisions
Coverage Ratio -
Default Stock1
Impairment
rate
Stock of
Provisions
Coverage Ratio -
Default Stock1
Impairment
rate
Stock of
Provisions
Coverage Ratio -
Default Stock1
Impairment
rate
Stock of
Provisions
Coverage Ratio -
Default Stock1
0.1% 5 48.7% 0.1% 6 47.2% 0.1% 8 46.1% 0.6% 9 45.8% 0.3% 12 44.0% 0.3% 15 43.0%
0.1% 0 30.1% 0.1% 1 30.1% 0.1% 1 30.1% 0.2% 1 30.1% 0.2% 1 30.1% 0.2% 2 30.1%
0.4% 294 53.1% 0.4% 312 48.4% 0.4% 331 40.5% 1.3% 337 47.8% 0.7% 433 55.2% 0.7% 463 53.2%
0.0% 3 23.1% 0.0% 3 22.1% 0.0% 3 21.1% 0.0% 3 27.0% 0.0% 3 30.6% 0.0% 3 32.4%
0.8% 84 65.6% 0.8% 89 62.1% 1.1% 95 59.3% 1.7% 91 66.4% 1.1% 97 62.9% 0.9% 102 60.3%
0.7% 388 59.7% 0.7% 451 54.9% 1.7% 606 49.8% 1.8% 503 56.7% 0.7% 564 53.3% 0.7% 624 50.9%
0.4% 107 30.7% 0.4% 138 29.7% 1.3% 228 28.9% 1.4% 185 32.4% 0.4% 215 31.2% 0.4% 245 30.5%
0.4% 14 28.1% 0.4% 16 26.7% 1.3% 21 25.3% 1.4% 19 28.9% 0.4% 21 27.6% 0.4% 23 26.7%
0.4% 93 31.2% 0.4% 122 30.1% 1.3% 207 29.3% 1.4% 166 32.9% 0.4% 194 31.7% 0.4% 222 31.0%
0.4% 0 48.6% 0.4% 0 48.9% 0.5% 0 49.2% 0.5% 0 49.0% 0.4% 0 49.1% 0.4% 0 49.2%
1.5% 282 92.5% 1.5% 313 87.7% 3.1% 377 83.0% 3.2% 318 90.4% 1.5% 349 86.3% 1.5% 379 83.2%
1.6% 88 87.0% 1.6% 104 80.2% 3.1% 137 75.1% 3.2% 105 84.3% 1.6% 121 78.8% 1.6% 137 75.2%
1.4% 194 95.2% 1.4% 209 91.9% 3.1% 241 88.2% 3.2% 213 93.5% 1.4% 228 90.8% 1.4% 242 88.5%
0.0% 0 - 0.0% 0 - 0.0% 0 - 0.0% 0 - 0.0% 0 - 0.0% 0 -
0.0% 0 - 0.0% 0 - 0.0% 0 - 0.0% 0 - 0.0% 0 - 0.0% 0 -
0.5% 688 56.6% 0.5% 770 52.0% 1.2% 945 46.0% 1.5% 850 52.6% 0.7% 1,011 53.9% 0.6% 1,104 51.7%
31/12/2016 31/12/2017
Baseline Scenario Adverse Scenario
31/12/2018 31/12/2016 31/12/2017 31/12/2018
31/12/2016 31/12/2017 31/12/2018 31/12/2016 31/12/2017 31/12/2018
Baseline Scenario Adverse Scenario
31/12/2016 31/12/2017
Baseline Scenario Adverse Scenario
31/12/2018 31/12/2016 31/12/2017 31/12/2018
31/12/2016 31/12/2017 31/12/2018 31/12/2016 31/12/2017 31/12/2018
Baseline Scenario Adverse Scenario

2016 EU-wide Stress Test:
Credit risk IRBDeutsche Bank AG
(mln EUR, %)
Central banks and central governments
Institutions
Corporates
Corporates - Of Which: Specialised Lending
Corporates - Of Which: SME
Retail
Retail - Secured on real estate property
Retail - Secured on real estate property - Of Which: SME
Retail - Secured on real estate property - Of Which: non-SME
Retail - Qualifying Revolving
Retail - Other Retail
Retail - Other Retail - Of Which: SME
Retail - Other Retail - Of Which: non-SME
Equity
Securitisation
Other non-credit obligation assets
IRB TOTAL1 Computed as: Stock of provisions for defaulted stock / default stock (as defined in paragraphs 59 and 61 of the Methodological note)
(mln EUR, %)
Central banks and central governments
Institutions
Corporates
Corporates - Of Which: Specialised Lending
Corporates - Of Which: SME
Retail
Retail - Secured on real estate property
Retail - Secured on real estate property - Of Which: SME
Retail - Secured on real estate property - Of Which: non-SME
Retail - Qualifying Revolving
Retail - Other Retail
Retail - Other Retail - Of Which: SME
Retail - Other Retail - Of Which: non-SME
Equity
Securitisation
Other non-credit obligation assets
IRB TOTAL1 Computed as: Stock of provisions for defaulted stock / default stock (as defined in paragraphs 59 and 61 of the Methodological note)
(mln EUR, %)
Central banks and central governments
Institutions
Corporates
Corporates - Of Which: Specialised Lending
Corporates - Of Which: SME
Retail
Retail - Secured on real estate property
Retail - Secured on real estate property - Of Which: SME
Retail - Secured on real estate property - Of Which: non-SME
Retail - Qualifying Revolving
Retail - Other Retail
Retail - Other Retail - Of Which: SME
Retail - Other Retail - Of Which: non-SME
Equity
Securitisation
Other non-credit obligation assets
IRB TOTAL1 Computed as: Stock of provisions for defaulted stock / default stock (as defined in paragraphs 59 and 61 of the Methodological note)
India
China
Netherlands
Impairment
rate
Stock of
Provisions
Coverage Ratio -
Default Stock1
Impairment
rate
Stock of
Provisions
Coverage Ratio -
Default Stock1
Impairment
rate
Stock of
Provisions
Coverage Ratio -
Default Stock1
Impairment
rate
Stock of
Provisions
Coverage Ratio -
Default Stock1
Impairment
rate
Stock of
Provisions
Coverage Ratio -
Default Stock1
Impairment
rate
Stock of
Provisions
Coverage Ratio -
Default Stock1
0.0% 0 - 0.0% 0 - 0.0% 0 - 0.0% 0 40.0% 0.0% 0 40.0% 0.0% 0 40.0%
0.1% 0 43.2% 0.1% 1 43.2% 0.1% 1 43.2% 0.2% 1 43.2% 0.2% 1 43.4% 0.1% 1 43.3%
0.3% 55 7.9% 0.3% 75 10.4% 0.3% 93 12.1% 0.7% 76 8.9% 0.4% 107 12.3% 0.4% 133 14.5%
0.1% 2 3.7% 0.1% 3 4.5% 0.1% 3 5.2% 0.1% 3 6.0% 0.1% 5 10.3% 0.2% 6 12.7%
0.3% 0 6.1% 0.2% 0 6.0% 0.2% 0 6.0% 0.7% 0 7.7% 0.7% 0 9.9% 0.7% 0 11.0%
0.3% 1 23.7% 0.3% 1 21.9% 0.4% 1 20.0% 0.5% 1 21.6% 0.3% 1 21.6% 0.3% 2 21.8%
0.2% 0 18.4% 0.2% 1 17.6% 0.4% 1 16.4% 0.5% 1 17.3% 0.3% 1 17.9% 0.3% 1 18.3%
0.2% 0 15.2% 0.2% 0 15.2% 0.2% 0 15.2% 0.3% 0 15.2% 0.3% 0 15.5% 0.3% 0 15.8%
0.2% 0 18.5% 0.2% 1 17.6% 0.4% 1 16.5% 0.5% 1 17.4% 0.3% 1 17.9% 0.3% 1 18.4%
0.2% 0 57.8% 0.2% 0 50.7% 0.2% 0 47.8% 0.3% 0 56.2% 0.3% 0 49.9% 0.2% 0 47.5%
0.4% 0 42.3% 0.3% 0 41.3% 0.4% 0 40.8% 0.5% 0 42.5% 0.5% 0 41.0% 0.4% 0 40.5%
0.4% 0 52.5% 0.4% 0 52.5% 0.4% 0 52.5% 0.7% 0 53.3% 0.6% 0 53.1% 0.6% 0 53.2%
0.4% 0 42.2% 0.3% 0 41.0% 0.4% 0 40.4% 0.5% 0 42.3% 0.5% 0 40.7% 0.4% 0 40.0%
0.0% 0 - 0.0% 0 - 0.0% 0 - 0.0% 0 - 0.0% 0 - 0.0% 0 -
0.0% 0 - 0.0% 0 - 0.0% 0 - 0.0% 0 - 0.0% 0 - 0.0% 0 -
0.3% 56 8.0% 0.3% 76 10.5% 0.3% 95 12.2% 0.6% 78 9.0% 0.4% 109 12.4% 0.4% 136 14.7%
Impairment
rate
Stock of
Provisions
Coverage Ratio -
Default Stock1
Impairment
rate
Stock of
Provisions
Coverage Ratio -
Default Stock1
Impairment
rate
Stock of
Provisions
Coverage Ratio -
Default Stock1
Impairment
rate
Stock of
Provisions
Coverage Ratio -
Default Stock1
Impairment
rate
Stock of
Provisions
Coverage Ratio -
Default Stock1
Impairment
rate
Stock of
Provisions
Coverage Ratio -
Default Stock1
0.0% 0 40.0% 0.0% 0 40.0% 0.0% 0 40.0% 0.0% 0 40.0% 0.0% 0 40.0% 0.0% 0 40.0%
0.1% 5 45.3% 0.1% 8 45.3% 0.1% 12 45.3% 0.2% 9 45.3% 0.2% 14 45.3% 0.1% 20 45.3%
0.2% 29 31.5% 0.2% 38 33.9% 0.3% 51 36.1% 0.6% 50 41.9% 0.3% 61 42.0% 0.3% 73 42.1%
- 0 - - 0 - - 0 - - 0 - - 0 - - 0 -
0.0% 0 59.7% 0.0% 0 59.7% 0.0% 0 59.7% 0.0% 0 59.7% 0.0% 0 59.7% 0.0% 0 59.7%
0.5% 0 41.7% 0.5% 0 37.7% 0.5% 1 35.6% 0.5% 0 41.9% 0.6% 0 36.9% 0.5% 1 35.3%
0.3% 0 22.5% 0.3% 0 20.6% 0.3% 0 19.6% 0.3% 0 22.8% 0.4% 0 20.7% 0.3% 0 20.0%
- 0 28.7% - 0 28.7% - 0 28.7% - 0 28.7% - 0 28.7% - 0 28.7%
0.3% 0 17.5% 0.3% 0 17.3% 0.3% 0 17.1% 0.3% 0 18.1% 0.4% 0 17.7% 0.3% 0 17.7%
0.3% 0 40.7% 0.3% 0 39.7% 0.3% 0 39.4% 0.4% 0 41.2% 0.4% 0 39.8% 0.3% 0 39.5%
1.2% 0 83.0% 1.2% 0 81.2% 1.2% 0 80.2% 1.2% 0 82.9% 1.2% 0 80.9% 1.2% 0 79.8%
0.8% 0 51.4% 0.7% 0 51.6% 0.7% 0 51.7% 0.9% 0 51.5% 1.0% 0 51.6% 0.9% 0 51.7%
1.2% 0 83.4% 1.2% 0 81.8% 1.2% 0 80.8% 1.2% 0 83.3% 1.2% 0 81.5% 1.2% 0 80.5%
0.0% 0 - 0.0% 0 - 0.0% 0 - 0.0% 0 - 0.0% 0 - 0.0% 0 -
0.0% 0 - 0.0% 0 - 0.0% 0 - 0.0% 0 - 0.0% 0 - 0.0% 0 -
0.1% 35 32.9% 0.1% 47 35.6% 0.1% 64 37.6% 0.2% 59 42.3% 0.1% 76 42.5% 0.1% 93 42.7%
Impairment
rate
Stock of
Provisions
Coverage Ratio -
Default Stock1
Impairment
rate
Stock of
Provisions
Coverage Ratio -
Default Stock1
Impairment
rate
Stock of
Provisions
Coverage Ratio -
Default Stock1
Impairment
rate
Stock of
Provisions
Coverage Ratio -
Default Stock1
Impairment
rate
Stock of
Provisions
Coverage Ratio -
Default Stock1
Impairment
rate
Stock of
Provisions
Coverage Ratio -
Default Stock1
0.1% 2 40.0% 0.1% 3 40.0% 0.1% 5 40.0% 0.2% 2 40.0% 0.2% 4 40.0% 0.2% 7 40.0%
0.2% 11 46.3% 0.2% 18 46.3% 0.2% 24 46.3% 0.5% 20 46.5% 0.4% 30 46.5% 0.4% 41 46.5%
0.4% 52 20.8% 0.4% 75 23.7% 0.4% 99 25.4% 0.8% 87 30.4% 0.6% 121 31.2% 0.5% 159 34.6%
- 0 - - 0 - - 0 - - 0 - - 0 - - 0 -
0.3% 0 57.4% 0.3% 0 57.4% 0.3% 0 57.3% 0.7% 0 57.4% 0.5% 1 57.7% 0.5% 1 57.7%
0.6% 0 62.8% 0.6% 0 59.6% 0.6% 1 57.5% 0.7% 0 62.4% 0.8% 0 58.9% 0.6% 1 56.9%
0.1% 0 19.9% 0.1% 0 18.2% 0.1% 0 17.0% 0.1% 0 19.7% 0.1% 0 18.1% 0.1% 0 17.0%
- 0 - - 0 - - 0 - - 0 - - 0 - - 0 -
0.1% 0 19.9% 0.1% 0 18.2% 0.1% 0 17.0% 0.1% 0 19.7% 0.1% 0 18.1% 0.1% 0 17.0%
0.5% 0 51.3% 0.5% 0 48.1% 0.8% 0 46.6% 0.9% 0 50.2% 0.5% 0 47.6% 0.5% 0 46.5%
0.8% 0 72.3% 0.8% 0 68.5% 0.9% 0 66.0% 1.0% 0 72.1% 1.1% 0 67.7% 0.9% 1 65.4%
0.4% 0 42.8% 0.4% 0 42.8% 0.4% 0 42.9% 0.5% 0 44.1% 0.5% 0 44.6% 0.5% 0 44.8%
0.9% 0 72.5% 0.9% 0 68.7% 0.9% 0 66.2% 1.0% 0 72.3% 1.2% 0 67.9% 0.9% 0 65.6%
0.0% 0 - 0.0% 0 - 0.0% 0 - 0.0% 0 - 0.0% 0 - 0.0% 0 -
- 0 - - 0 - - 0 - - 0 - - 0 - - 0 -
0.3% 65 23.0% 0.3% 97 26.3% 0.3% 128 28.1% 0.6% 109 32.2% 0.5% 156 33.4% 0.4% 207 36.5%
31/12/2016 31/12/2017 31/12/2018 31/12/2016 31/12/2017 31/12/2018
Baseline Scenario Adverse Scenario
31/12/2016 31/12/2017
Baseline Scenario Adverse Scenario
31/12/2018 31/12/2016 31/12/2017 31/12/2018
31/12/2016 31/12/2017 31/12/2018 31/12/2016 31/12/2017 31/12/2018
Baseline Scenario Adverse Scenario
2016 EU-wide Stress Test:
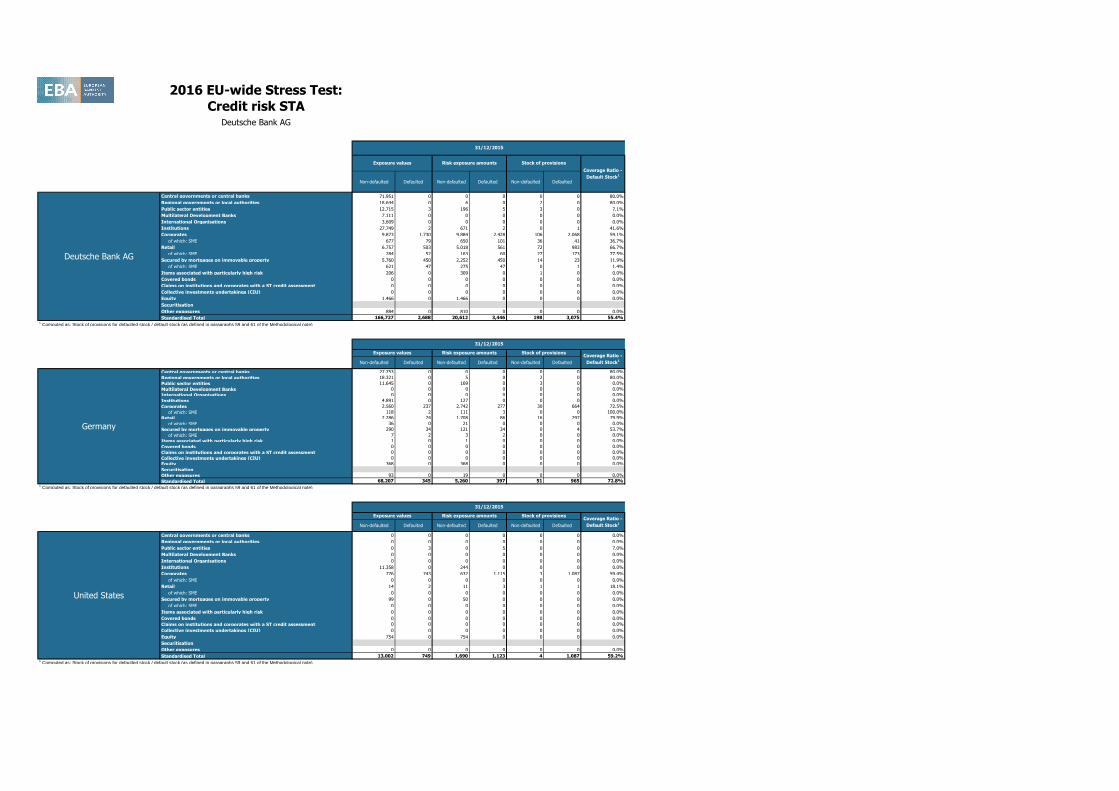
Credit risk STADeutsche Bank AG
Non-defaulted Defaulted Non-defaulted Defaulted Non-defaulted Defaulted
Central governments or central banks 71,951 0 0 0 0 0 80.0%
Regional governments or local authorities 18,644 0 6 0 2 0 80.0%
Public sector entities 12,715 3 196 5 3 0 7.1%
Multilateral Development Banks 7,111 0 0 0 0 0 0.0%
International Organisations 3,609 0 0 0 0 0 0.0%
Institutions 27,749 2 671 2 0 1 41.6%
Corporates 9,873 1,730 9,884 2,428 106 2,068 59.1%
of which: SME 677 79 650 101 36 41 36.7%
Retail 6,757 503 5,018 561 72 983 66.7%
of which: SME 284 52 163 60 27 173 77.5%
Secured by mortgages on immovable property 5,760 450 2,252 450 14 23 11.9%
of which: SME 621 47 275 47 0 1 1.4%
Items associated with particularly high risk 206 0 309 0 1 0 0.0%
Covered bonds 0 0 0 0 0 0 0.0%
Claims on institutions and corporates with a ST credit assessment 0 0 0 0 0 0 0.0%
Collective investments undertakings (CIU) 0 0 0 0 0 0 0.0%
Equity 1,466 0 1,466 0 0 0 0.0%
Securitisation
Other exposures 884 0 810 0 0 0 0.0%
Standardised Total 166,727 2,688 20,612 3,446 198 3,075 55.4%1 Computed as: Stock of provisions for defaulted stock / default stock (as defined in paragraphs 59 and 61 of the Methodological note)
Non-defaulted Defaulted Non-defaulted Defaulted Non-defaulted Defaulted
Central governments or central banks 27,753 0 0 0 0 0 80.0%
Regional governments or local authorities 18,321 0 5 0 2 0 80.0%
Public sector entities 11,645 0 169 0 3 0 0.0%
Multilateral Development Banks 0 0 0 0 0 0 0.0%
International Organisations 0 0 0 0 0 0 0.0%
Institutions 4,891 0 127 0 0 0 0.0%
Corporates 2,560 237 2,742 277 30 664 72.5%
of which: SME 118 2 111 3 0 0 100.0%
Retail 2,286 74 1,708 86 16 297 79.9%
of which: SME 36 0 21 0 0 0 0.0%
Secured by mortgages on immovable property 290 34 121 34 0 4 53.7%
of which: SME 7 2 3 2 0 0 0.0%
Items associated with particularly high risk 1 0 1 0 0 0 0.0%
Covered bonds 0 0 0 0 0 0 0.0%
Claims on institutions and corporates with a ST credit assessment 0 0 0 0 0 0 0.0%
Collective investments undertakings (CIU) 0 0 0 0 0 0 0.0%
Equity 368 0 368 0 0 0 0.0%
Securitisation
Other exposures 93 0 19 0 0 0 0.0%
Standardised Total 68,207 345 5,260 397 51 965 72.8%1 Computed as: Stock of provisions for defaulted stock / default stock (as defined in paragraphs 59 and 61 of the Methodological note)
Non-defaulted Defaulted Non-defaulted Defaulted Non-defaulted Defaulted
Central governments or central banks 0 0 0 0 0 0 0.0%
Regional governments or local authorities 0 0 0 0 0 0 0.0%
Public sector entities 0 3 0 5 0 0 7.0%
Multilateral Development Banks 0 0 0 0 0 0 0.0%
International Organisations 0 0 0 0 0 0 0.0%
Institutions 11,358 0 244 0 0 0 0.0%
Corporates 776 743 632 1,115 3 1,087 59.4%
of which: SME 0 0 0 0 0 0 0.0%
Retail 14 2 11 3 1 1 18.1%
of which: SME 0 0 0 0 0 0 0.0%
Secured by mortgages on immovable property 99 0 50 0 0 0 0.0%
of which: SME 0 0 0 0 0 0 0.0%
Items associated with particularly high risk 0 0 0 0 0 0 0.0%
Covered bonds 0 0 0 0 0 0 0.0%
Claims on institutions and corporates with a ST credit assessment 0 0 0 0 0 0 0.0%
Collective investments undertakings (CIU) 0 0 0 0 0 0 0.0%
Equity 754 0 754 0 0 0 0.0%
Securitisation
Other exposures 0 0 0 0 0 0 0.0%
Standardised Total 13,002 749 1,690 1,123 4 1,087 59.2%1 Computed as: Stock of provisions for defaulted stock / default stock (as defined in paragraphs 59 and 61 of the Methodological note)
United States
Exposure values Risk exposure amounts Stock of provisionsCoverage Ratio -
Default Stock1
Germany
31/12/2015
31/12/2015
Exposure values Risk exposure amounts Stock of provisionsCoverage Ratio -
Default Stock1
Deutsche Bank AG
31/12/2015
Exposure values Risk exposure amounts Stock of provisions
Coverage Ratio -
Default Stock1
2016 EU-wide Stress Test:
Credit risk STADeutsche Bank AG
Non-defaulted Defaulted Non-defaulted Defaulted Non-defaulted Defaulted
Central governments or central banks 3,463 0 0 0 0 0 0.0%
Regional governments or local authorities 0 0 0 0 0 0 0.0%
Public sector entities 329 0 0 0 0 0 0.0%
Multilateral Development Banks 0 0 0 0 0 0 0.0%
International Organisations 0 0 0 0 0 0 0.0%
Institutions 275 2 27 2 0 1 31.2%
Corporates 363 156 363 192 4 127 58.8%
of which: SME 14 3 13 4 0 1 25.6%
Retail 2,172 262 1,628 285 15 336 56.4%
of which: SME 5 0 3 0 0 1 64.7%
Secured by mortgages on immovable property 2,010 259 711 259 0 15 1.1%
of which: SME 1 1 0 1 0 0 0.0%
Items associated with particularly high risk 86 0 129 0 0 0 0.0%
Covered bonds 0 0 0 0 0 0 0.0%
Claims on institutions and corporates with a ST credit assessment 0 0 0 0 0 0 0.0%
Collective investments undertakings (CIU) 0 0 0 0 0 0 0.0%
Equity 21 0 21 0 0 0 0.0%
Securitisation
Other exposures 0 0 0 0 0 0 0.0%
Standardised Total 8,720 678 2,880 737 19 479 43.0%1 Computed as: Stock of provisions for defaulted stock / default stock (as defined in paragraphs 59 and 61 of the Methodological note)
Non-defaulted Defaulted Non-defaulted Defaulted Non-defaulted Defaulted
Central governments or central banks 11,269 0 0 0 0 0 0.0%
Regional governments or local authorities 0 0 0 0 0 0 0.0%
Public sector entities 0 0 0 0 0 0 0.0%
Multilateral Development Banks 0 0 0 0 0 0 0.0%
International Organisations 0 0 0 0 0 0 0.0%
Institutions 77 0 15 0 0 0 0.0%
Corporates 160 3 160 5 0 0 0.0%
of which: SME 0 0 0 0 0 0 0.0%
Retail 53 0 39 0 5 0 82.8%
of which: SME 1 0 0 0 0 0 0.0%
Secured by mortgages on immovable property 858 2 300 2 0 0 2.4%
of which: SME 0 0 0 0 0 0 0.0%
Items associated with particularly high risk 0 0 0 0 0 0 0.0%
Covered bonds 0 0 0 0 0 0 0.0%
Claims on institutions and corporates with a ST credit assessment 0 0 0 0 0 0 0.0%
Collective investments undertakings (CIU) 0 0 0 0 0 0 0.0%
Equity 1 0 1 0 0 0 0.0%
Securitisation
Other exposures 791 0 791 0 0 0 0.0%
Standardised Total 13,209 5 1,307 7 5 0 4.2%1 Computed as: Stock of provisions for defaulted stock / default stock (as defined in paragraphs 59 and 61 of the Methodological note)
Non-defaulted Defaulted Non-defaulted Defaulted Non-defaulted Defaulted
Central governments or central banks 0 0 0 0 0 0 0.0%
Regional governments or local authorities 0 0 0 0 0 0 0.0%
Public sector entities 0 0 0 0 0 0 0.0%
Multilateral Development Banks 0 0 0 0 0 0 0.0%
International Organisations 0 0 0 0 0 0 0.0%
Institutions 6 0 3 0 0 0 0.0%
Corporates 109 0 109 0 0 0 0.0%
of which: SME 2 0 2 0 0 0 0.0%
Retail 13 1 10 1 0 2 53.0%
of which: SME 0 0 0 0 0 1 0.0%
Secured by mortgages on immovable property 8 1 4 1 0 0 0.0%
of which: SME 0 0 0 0 0 0 0.0%
Items associated with particularly high risk 0 0 0 0 0 0 0.0%
Covered bonds 0 0 0 0 0 0 0.0%
Claims on institutions and corporates with a ST credit assessment 0 0 0 0 0 0 0.0%
Collective investments undertakings (CIU) 0 0 0 0 0 0 0.0%
Equity 53 0 53 0 0 0 0.0%
Securitisation
Other exposures 0 0 0 0 0 0 0.0%
Standardised Total 190 2 179 2 0 2 42.0%1 Computed as: Stock of provisions for defaulted stock / default stock (as defined in paragraphs 59 and 61 of the Methodological note)
Switzerland
Exposure values Risk exposure amounts Stock of provisionsCoverage Ratio -
Default Stock1
Luxembourg
31/12/2015
Exposure values Risk exposure amounts Stock of provisionsCoverage Ratio -
Default Stock1
Italy
31/12/2015
Exposure values Risk exposure amounts Stock of provisionsCoverage Ratio -
Default Stock1
31/12/2015
2016 EU-wide Stress Test:
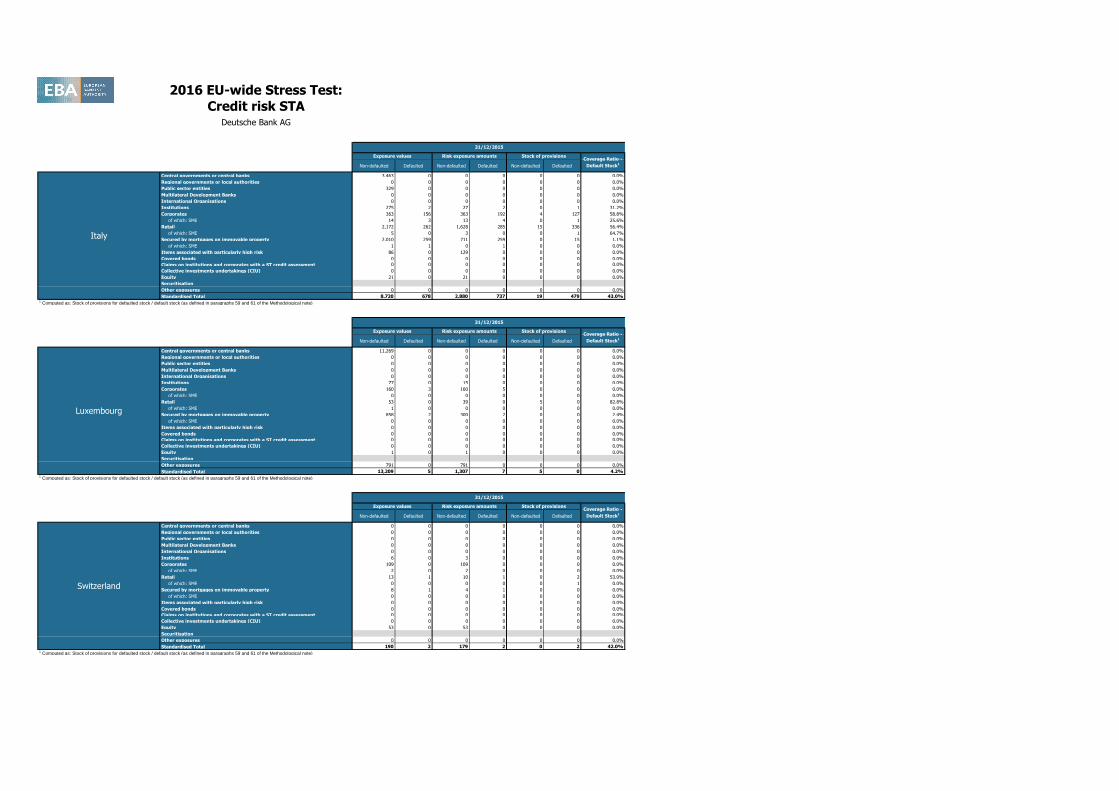
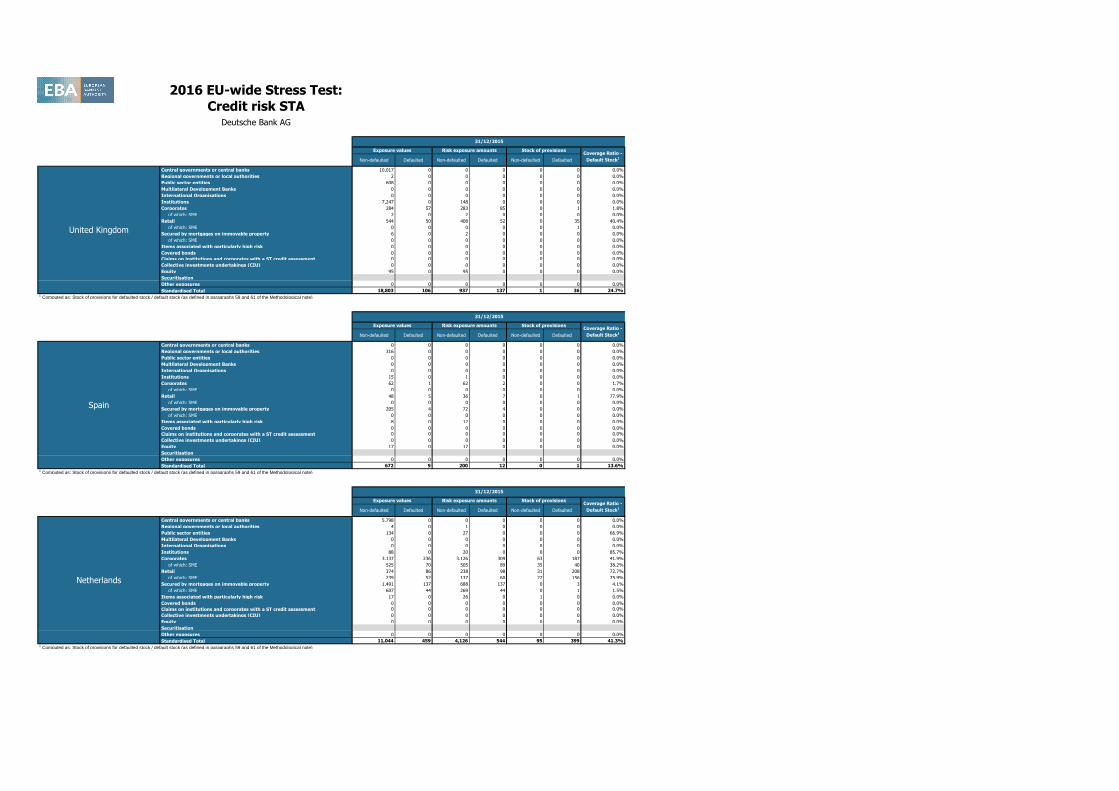
Credit risk STADeutsche Bank AG
Non-defaulted Defaulted Non-defaulted Defaulted Non-defaulted Defaulted
Central governments or central banks 10,017 0 0 0 0 0 0.0%
Regional governments or local authorities 2 0 0 0 0 0 0.0%
Public sector entities 608 0 0 0 0 0 0.0%
Multilateral Development Banks 0 0 0 0 0 0 0.0%
International Organisations 0 0 0 0 0 0 0.0%
Institutions 7,247 0 148 0 0 0 0.0%
Corporates 284 57 283 85 0 1 1.8%
of which: SME 2 0 2 0 0 0 0.0%
Retail 544 50 408 52 0 35 40.4%
of which: SME 0 0 0 0 0 1 0.0%
Secured by mortgages on immovable property 6 0 2 0 0 0 0.0%
of which: SME 0 0 0 0 0 0 0.0%
Items associated with particularly high risk 0 0 0 0 0 0 0.0%
Covered bonds 0 0 0 0 0 0 0.0%
Claims on institutions and corporates with a ST credit assessment 0 0 0 0 0 0 0.0%
Collective investments undertakings (CIU) 0 0 0 0 0 0 0.0%
Equity 95 0 95 0 0 0 0.0%
Securitisation
Other exposures 0 0 0 0 0 0 0.0%
Standardised Total 18,803 106 937 137 1 36 24.7%1 Computed as: Stock of provisions for defaulted stock / default stock (as defined in paragraphs 59 and 61 of the Methodological note)
Non-defaulted Defaulted Non-defaulted Defaulted Non-defaulted Defaulted
Central governments or central banks 0 0 0 0 0 0 0.0%
Regional governments or local authorities 316 0 0 0 0 0 0.0%
Public sector entities 0 0 0 0 0 0 0.0%
Multilateral Development Banks 0 0 0 0 0 0 0.0%
International Organisations 0 0 0 0 0 0 0.0%
Institutions 15 0 1 0 0 0 0.0%
Corporates 62 1 62 2 0 0 1.7%
of which: SME 0 0 0 0 0 0 0.0%
Retail 48 5 36 7 0 1 77.9%
of which: SME 0 0 0 0 0 0 0.0%
Secured by mortgages on immovable property 205 4 72 4 0 0 0.0%
of which: SME 0 0 0 0 0 0 0.0%
Items associated with particularly high risk 8 0 12 0 0 0 0.0%
Covered bonds 0 0 0 0 0 0 0.0%
Claims on institutions and corporates with a ST credit assessment 0 0 0 0 0 0 0.0%
Collective investments undertakings (CIU) 0 0 0 0 0 0 0.0%
Equity 17 0 17 0 0 0 0.0%
Securitisation
Other exposures 0 0 0 0 0 0 0.0%
Standardised Total 672 9 200 12 0 1 13.6%1 Computed as: Stock of provisions for defaulted stock / default stock (as defined in paragraphs 59 and 61 of the Methodological note)
Non-defaulted Defaulted Non-defaulted Defaulted Non-defaulted Defaulted
Central governments or central banks 5,798 0 0 0 0 0 0.0%
Regional governments or local authorities 4 0 1 0 0 0 0.0%
Public sector entities 134 0 27 0 0 0 66.9%
Multilateral Development Banks 0 0 0 0 0 0 0.0%
International Organisations 0 0 0 0 0 0 0.0%
Institutions 88 0 20 0 0 0 85.7%
Corporates 3,137 236 3,126 309 63 187 41.9%
of which: SME 525 70 505 89 35 40 38.2%
Retail 374 86 238 98 31 208 72.7%
of which: SME 239 52 137 60 27 156 75.9%
Secured by mortgages on immovable property 1,491 137 688 137 0 3 4.1%
of which: SME 607 44 269 44 0 1 1.5%
Items associated with particularly high risk 17 0 26 0 1 0 0.0%
Covered bonds 0 0 0 0 0 0 0.0%
Claims on institutions and corporates with a ST credit assessment 0 0 0 0 0 0 0.0%
Collective investments undertakings (CIU) 0 0 0 0 0 0 0.0%
Equity 0 0 0 0 0 0 0.0%
Securitisation
Other exposures 0 0 0 0 0 0 0.0%
Standardised Total 11,044 459 4,126 544 95 399 41.3%1 Computed as: Stock of provisions for defaulted stock / default stock (as defined in paragraphs 59 and 61 of the Methodological note)
Netherlands
Exposure values Risk exposure amounts Stock of provisionsCoverage Ratio -
Default Stock1
Spain
31/12/2015
Exposure values Risk exposure amounts Stock of provisionsCoverage Ratio -
Default Stock1
United Kingdom
31/12/2015
Exposure values Risk exposure amounts Stock of provisionsCoverage Ratio -
Default Stock1
31/12/2015
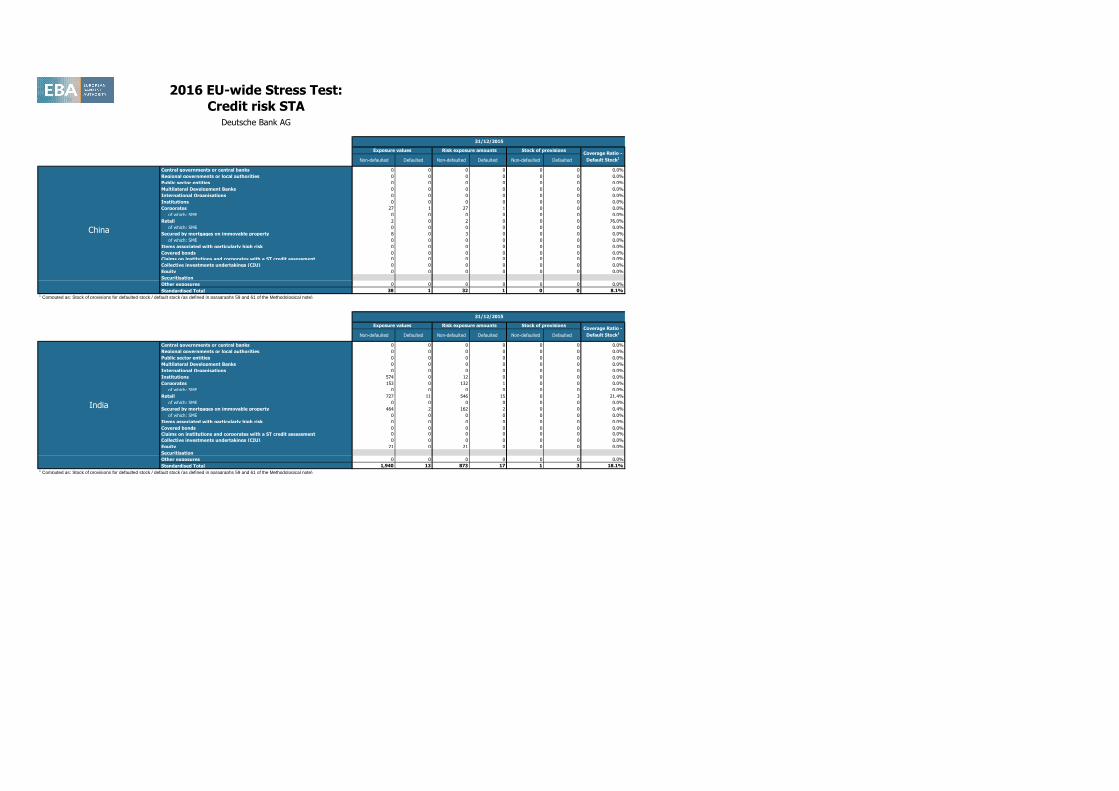
2016 EU-wide Stress Test:
Credit risk STADeutsche Bank AG
Non-defaulted Defaulted Non-defaulted Defaulted Non-defaulted Defaulted
Central governments or central banks 0 0 0 0 0 0 0.0%
Regional governments or local authorities 0 0 0 0 0 0 0.0%
Public sector entities 0 0 0 0 0 0 0.0%
Multilateral Development Banks 0 0 0 0 0 0 0.0%
International Organisations 0 0 0 0 0 0 0.0%
Institutions 0 0 0 0 0 0 0.0%
Corporates 27 1 27 1 0 0 0.0%
of which: SME 0 0 0 0 0 0 0.0%
Retail 2 0 2 0 0 0 76.0%
of which: SME 0 0 0 0 0 0 0.0%
Secured by mortgages on immovable property 8 0 3 0 0 0 0.0%
of which: SME 0 0 0 0 0 0 0.0%
Items associated with particularly high risk 0 0 0 0 0 0 0.0%
Covered bonds 0 0 0 0 0 0 0.0%
Claims on institutions and corporates with a ST credit assessment 0 0 0 0 0 0 0.0%
Collective investments undertakings (CIU) 0 0 0 0 0 0 0.0%
Equity 0 0 0 0 0 0 0.0%
Securitisation
Other exposures 0 0 0 0 0 0 0.0%
Standardised Total 38 1 32 1 0 0 8.1%1 Computed as: Stock of provisions for defaulted stock / default stock (as defined in paragraphs 59 and 61 of the Methodological note)
Non-defaulted Defaulted Non-defaulted Defaulted Non-defaulted Defaulted
Central governments or central banks 0 0 0 0 0 0 0.0%
Regional governments or local authorities 0 0 0 0 0 0 0.0%
Public sector entities 0 0 0 0 0 0 0.0%
Multilateral Development Banks 0 0 0 0 0 0 0.0%
International Organisations 0 0 0 0 0 0 0.0%
Institutions 574 0 12 0 0 0 0.0%
Corporates 153 0 132 1 0 0 0.0%
of which: SME 0 0 0 0 0 0 0.0%
Retail 727 11 546 15 0 3 21.4%
of which: SME 0 0 0 0 0 0 0.0%
Secured by mortgages on immovable property 464 2 162 2 0 0 0.4%
of which: SME 0 0 0 0 0 0 0.0%
Items associated with particularly high risk 0 0 0 0 0 0 0.0%
Covered bonds 0 0 0 0 0 0 0.0%
Claims on institutions and corporates with a ST credit assessment 0 0 0 0 0 0 0.0%
Collective investments undertakings (CIU) 0 0 0 0 0 0 0.0%
Equity 21 0 21 0 0 0 0.0%
Securitisation
Other exposures 0 0 0 0 0 0 0.0%
Standardised Total 1,940 13 873 17 1 3 18.1%1 Computed as: Stock of provisions for defaulted stock / default stock (as defined in paragraphs 59 and 61 of the Methodological note)
India
Exposure values Risk exposure amounts Stock of provisionsCoverage Ratio -
Default Stock1
China
31/12/2015
Exposure values Risk exposure amounts Stock of provisionsCoverage Ratio -
Default Stock1
31/12/2015
2016 EU-wide Stress Test:
Credit risk STADeutsche Bank AG
Central governments or central banks
Regional governments or local authorities
Public sector entities
Multilateral Development Banks
International Organisations
Institutions
Corporates
of which: SME
Retail
of which: SME
Secured by mortgages on immovable property
of which: SME
Items associated with particularly high risk
Covered bonds
Claims on institutions and corporates with a ST credit assessment
Collective investments undertakings (CIU)
Equity
Securitisation
Other exposures
Standardised Total1 Computed as: Stock of provisions for defaulted stock / default stock (as defined in paragraphs 59 and 61 of the Methodological note)
United States
Germany
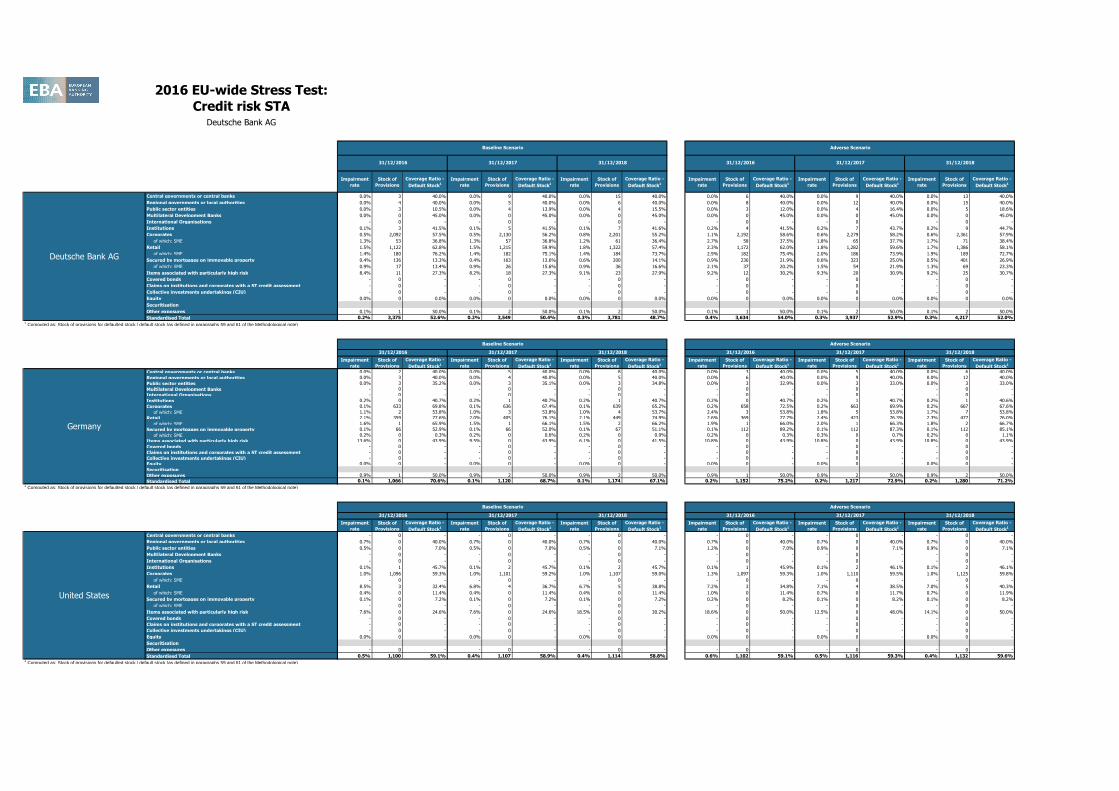
Deutsche Bank AG
Impairment
rate
Stock of
Provisions
Coverage Ratio -
Default Stock1
Impairment
rate
Stock of
Provisions
Coverage Ratio -
Default Stock1
Impairment
rate
Stock of
Provisions
Coverage Ratio -
Default Stock1
Impairment
rate
Stock of
Provisions
Coverage Ratio -
Default Stock1
Impairment
rate
Stock of
Provisions
Coverage Ratio -
Default Stock1
Impairment
rate
Stock of
Provisions
Coverage Ratio -
Default Stock1
0.0% 3 40.0% 0.0% 9 40.0% 0.0% 15 40.0% 0.0% 6 40.0% 0.0% 9 40.0% 0.0% 13 40.0%
0.0% 4 40.0% 0.0% 5 40.0% 0.0% 6 40.0% 0.0% 8 40.0% 0.0% 12 40.0% 0.0% 15 40.0%
0.0% 3 10.5% 0.0% 4 13.9% 0.0% 4 15.5% 0.0% 3 12.0% 0.0% 4 16.4% 0.0% 5 18.6%
0.0% 0 45.0% 0.0% 0 45.0% 0.0% 0 45.0% 0.0% 0 45.0% 0.0% 0 45.0% 0.0% 0 45.0%
- 0 - - 0 - - 0 - - 0 - - 0 - - 0 -
0.1% 3 41.5% 0.1% 5 41.5% 0.1% 7 41.6% 0.2% 4 41.5% 0.2% 7 43.7% 0.2% 9 44.7%
0.5% 2,092 57.5% 0.5% 2,130 56.2% 0.8% 2,201 55.2% 1.1% 2,192 58.6% 0.6% 2,279 58.2% 0.6% 2,361 57.9%
1.3% 53 36.8% 1.3% 57 36.8% 1.2% 61 36.4% 2.7% 58 37.5% 1.8% 65 37.7% 1.7% 71 38.4%
1.5% 1,122 62.8% 1.5% 1,215 59.9% 1.8% 1,322 57.4% 2.3% 1,172 62.0% 1.8% 1,282 59.6% 1.7% 1,386 58.1%
1.4% 180 76.2% 1.4% 182 75.1% 1.4% 184 73.7% 2.9% 182 75.4% 2.0% 186 73.9% 1.9% 189 72.7%
0.4% 136 13.3% 0.4% 163 13.6% 0.6% 200 14.1% 0.9% 236 21.9% 0.6% 323 25.0% 0.5% 401 26.9%
0.9% 17 13.4% 0.9% 26 15.6% 0.9% 36 16.6% 2.1% 37 20.2% 1.5% 54 21.9% 1.3% 69 23.3%
8.4% 11 27.3% 8.2% 18 27.3% 9.1% 23 27.9% 9.2% 12 30.2% 9.3% 20 30.9% 9.2% 25 30.7%
- 0 - - 0 - - 0 - - 0 - - 0 - - 0 -
- 0 - - 0 - - 0 - - 0 - - 0 - - 0 -
- 0 - - 0 - - 0 - - 0 - - 0 - - 0 -
0.0% 0 0.0% 0.0% 0 0.0% 0.0% 0 0.0% 0.0% 0 0.0% 0.0% 0 0.0% 0.0% 0 0.0%
0.1% 1 50.0% 0.1% 2 50.0% 0.1% 2 50.0% 0.1% 1 50.0% 0.1% 2 50.0% 0.1% 2 50.0%
0.2% 3,375 52.6% 0.2% 3,549 50.4% 0.3% 3,781 48.7% 0.4% 3,634 54.0% 0.3% 3,937 52.9% 0.3% 4,217 52.0%
Impairment
rate
Stock of
Provisions
Coverage Ratio -
Default Stock1
Impairment
rate
Stock of
Provisions
Coverage Ratio -
Default Stock1
Impairment
rate
Stock of
Provisions
Coverage Ratio -
Default Stock1
Impairment
rate
Stock of
Provisions
Coverage Ratio -
Default Stock1
Impairment
rate
Stock of
Provisions
Coverage Ratio -
Default Stock1
Impairment
rate
Stock of
Provisions
Coverage Ratio -
Default Stock1
0.0% 2 40.0% 0.0% 5 40.0% 0.0% 8 40.0% 0.0% 3 40.0% 0.0% 5 40.0% 0.0% 6 40.0%
0.0% 3 40.0% 0.0% 4 40.0% 0.0% 5 40.0% 0.0% 6 40.0% 0.0% 9 40.0% 0.0% 12 40.0%
0.0% 3 35.2% 0.0% 3 35.1% 0.0% 3 34.8% 0.0% 3 32.9% 0.0% 3 33.0% 0.0% 3 33.0%
- 0 - - 0 - - 0 - - 0 - - 0 - - 0 -
- 0 - - 0 - - 0 - - 0 - - 0 - - 0 -
0.2% 0 40.7% 0.2% 1 40.7% 0.2% 1 40.7% 0.2% 0 40.7% 0.2% 1 40.7% 0.2% 1 40.6%
0.1% 633 69.8% 0.1% 636 67.4% 0.1% 639 65.2% 0.2% 658 72.5% 0.2% 663 69.9% 0.2% 667 67.6%
1.1% 2 53.8% 1.0% 3 53.8% 1.0% 4 53.7% 2.4% 3 53.8% 1.8% 5 53.8% 1.7% 7 53.8%
2.1% 359 77.6% 2.0% 405 76.1% 2.1% 449 74.9% 2.6% 369 77.7% 2.4% 423 76.3% 2.3% 477 76.0%
1.6% 1 65.9% 1.5% 1 66.1% 1.5% 2 66.2% 1.9% 1 66.0% 2.0% 1 66.3% 1.8% 2 66.7%
0.1% 66 52.9% 0.1% 66 52.0% 0.1% 67 51.1% 0.1% 112 89.2% 0.1% 112 87.3% 0.1% 112 85.1%
0.2% 0 0.3% 0.2% 0 0.6% 0.2% 0 0.9% 0.2% 0 0.3% 0.3% 0 0.7% 0.2% 0 1.1%
13.6% 0 43.9% 9.5% 0 43.9% 6.1% 0 41.5% 10.8% 0 43.9% 10.8% 0 43.9% 10.8% 0 43.9%
- 0 - - 0 - - 0 - - 0 - - 0 - - 0 -
- 0 - - 0 - - 0 - - 0 - - 0 - - 0 -
- 0 - - 0 - - 0 - - 0 - - 0 - - 0 -
0.0% 0 - 0.0% 0 - 0.0% 0 - 0.0% 0 - 0.0% 0 - 0.0% 0 -
0.9% 1 50.0% 0.9% 2 50.0% 0.9% 2 50.0% 0.9% 1 50.0% 0.9% 2 50.0% 0.9% 2 50.0%0.1% 1,066 70.6% 0.1% 1,120 68.7% 0.1% 1,174 67.1% 0.2% 1,152 75.2% 0.2% 1,217 72.9% 0.2% 1,280 71.2%
Impairment
rate
Stock of
Provisions
Coverage Ratio -
Default Stock1
Impairment
rate
Stock of
Provisions
Coverage Ratio -
Default Stock1
Impairment
rate
Stock of
Provisions
Coverage Ratio -
Default Stock1
Impairment
rate
Stock of
Provisions
Coverage Ratio -
Default Stock1
Impairment
rate
Stock of
Provisions
Coverage Ratio -
Default Stock1
Impairment
rate
Stock of
Provisions
Coverage Ratio -
Default Stock1
- 0 - - 0 - - 0 - - 0 - - 0 - - 0 -
0.7% 0 40.0% 0.7% 0 40.0% 0.7% 0 40.0% 0.7% 0 40.0% 0.7% 0 40.0% 0.7% 0 40.0%
0.5% 0 7.0% 0.5% 0 7.0% 0.5% 0 7.1% 1.2% 0 7.0% 0.9% 0 7.1% 0.9% 0 7.1%
- 0 - - 0 - - 0 - - 0 - - 0 - - 0 -
- 0 - - 0 - - 0 - - 0 - - 0 - - 0 -
0.1% 1 45.7% 0.1% 2 45.7% 0.1% 2 45.7% 0.1% 1 45.9% 0.1% 2 46.1% 0.1% 2 46.1%
1.0% 1,096 59.3% 1.0% 1,101 59.2% 1.0% 1,107 59.0% 1.3% 1,097 59.3% 1.0% 1,110 59.5% 1.0% 1,125 59.8%
- 0 - - 0 - - 0 - - 0 - - 0 - - 0 -
8.5% 3 32.4% 6.8% 4 36.7% 6.7% 5 38.8% 7.2% 3 34.8% 7.1% 4 38.5% 7.0% 5 40.3%
0.4% 0 11.4% 0.4% 0 11.4% 0.4% 0 11.4% 1.0% 0 11.4% 0.7% 0 11.7% 0.7% 0 11.9%
0.1% 0 7.2% 0.1% 0 7.2% 0.1% 0 7.2% 0.2% 0 8.2% 0.1% 0 8.2% 0.1% 0 8.2%
- 0 - - 0 - - 0 - - 0 - - 0 - - 0 -
7.6% 0 24.6% 7.6% 0 24.6% 18.5% 0 30.2% 18.6% 0 50.0% 12.5% 0 48.0% 14.1% 0 50.0%
- 0 - - 0 - - 0 - - 0 - - 0 - - 0 -
- 0 - - 0 - - 0 - - 0 - - 0 - - 0 -
- 0 - - 0 - - 0 - - 0 - - 0 - - 0 -
0.0% 0 - 0.0% 0 - 0.0% 0 - 0.0% 0 - 0.0% 0 - 0.0% 0 -
- 0 - - 0 - - 0 - - 0 - - 0 - - 0 -
0.5% 1,100 59.1% 0.4% 1,107 58.9% 0.4% 1,114 58.8% 0.6% 1,102 59.1% 0.5% 1,116 59.3% 0.4% 1,132 59.6%
31/12/2018 31/12/2016 31/12/2017 31/12/201831/12/2016 31/12/2017
Baseline Scenario Adverse Scenario
Baseline Scenario Adverse Scenario
31/12/2016 31/12/2017 31/12/2018
31/12/2018
31/12/2016 31/12/2017 31/12/2018
Baseline Scenario Adverse Scenario
31/12/2016 31/12/2017 31/12/2018 31/12/2016 31/12/2017
2016 EU-wide Stress Test:
Credit risk STADeutsche Bank AG
Central governments or central banks
Regional governments or local authorities
Public sector entities
Multilateral Development Banks
International Organisations
Institutions
Corporates
of which: SME
Retail
of which: SME
Secured by mortgages on immovable property
of which: SME
Items associated with particularly high risk
Covered bonds
Claims on institutions and corporates with a ST credit assessment
Collective investments undertakings (CIU)
Equity
Securitisation
Other exposures
Standardised Total1 Computed as: Stock of provisions for defaulted stock / default stock (as defined in paragraphs 59 and 61 of the Methodological note)
Central governments or central banks
Regional governments or local authorities
Public sector entities
Multilateral Development Banks
International Organisations
Institutions
Corporates
of which: SME
Retail
of which: SME
Secured by mortgages on immovable property
of which: SME
Items associated with particularly high risk
Covered bonds
Claims on institutions and corporates with a ST credit assessment
Collective investments undertakings (CIU)
Equity
Securitisation
Other exposures
Standardised Total1 Computed as: Stock of provisions for defaulted stock / default stock (as defined in paragraphs 59 and 61 of the Methodological note)
Central governments or central banks
Regional governments or local authorities
Public sector entities
Multilateral Development Banks
International Organisations
Institutions
Corporates
of which: SME
Retail
of which: SME
Secured by mortgages on immovable property
of which: SME
Items associated with particularly high risk
Covered bonds
Claims on institutions and corporates with a ST credit assessment
Collective investments undertakings (CIU)
Equity
Securitisation
Other exposures
Standardised Total1 Computed as: Stock of provisions for defaulted stock / default stock (as defined in paragraphs 59 and 61 of the Methodological note)
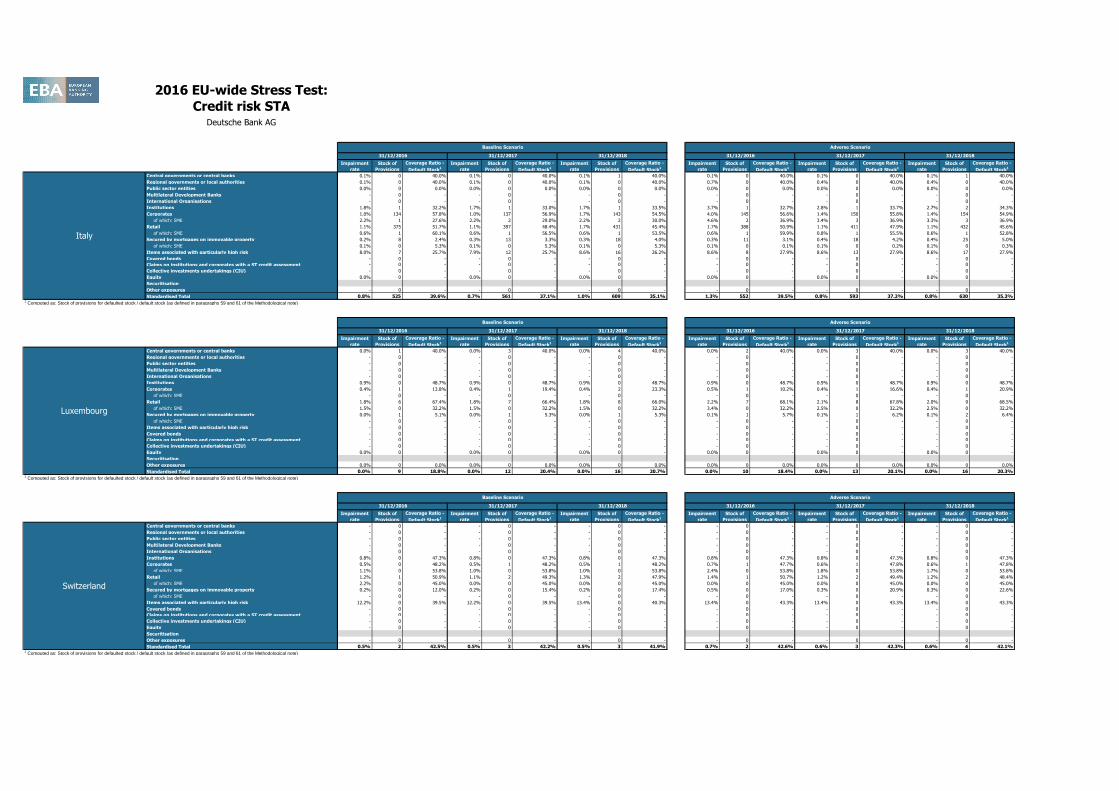
Switzerland
Luxembourg
Italy
Impairment
rate
Stock of
Provisions
Coverage Ratio -
Default Stock1
Impairment
rate
Stock of
Provisions
Coverage Ratio -
Default Stock1
Impairment
rate
Stock of
Provisions
Coverage Ratio -
Default Stock1
Impairment
rate
Stock of
Provisions
Coverage Ratio -
Default Stock1
Impairment
rate
Stock of
Provisions
Coverage Ratio -
Default Stock1
Impairment
rate
Stock of
Provisions
Coverage Ratio -
Default Stock1
0.1% 0 40.0% 0.1% 0 40.0% 0.1% 1 40.0% 0.1% 0 40.0% 0.1% 0 40.0% 0.1% 1 40.0%
0.1% 0 40.0% 0.1% 0 40.0% 0.1% 0 40.0% 0.7% 0 40.0% 0.4% 0 40.0% 0.4% 0 40.0%
0.0% 0 0.0% 0.0% 0 0.0% 0.0% 0 0.0% 0.0% 0 0.0% 0.0% 0 0.0% 0.0% 0 0.0%
- 0 - - 0 - - 0 - - 0 - - 0 - - 0 -
- 0 - - 0 - - 0 - - 0 - - 0 - - 0 -
1.8% 1 32.2% 1.7% 1 33.0% 1.7% 1 33.5% 3.7% 1 32.7% 2.8% 1 33.7% 2.7% 2 34.3%
1.0% 134 57.8% 1.0% 137 56.9% 1.7% 143 54.5% 4.0% 145 56.6% 1.4% 150 55.8% 1.4% 154 54.9%
2.2% 1 27.6% 2.2% 2 29.0% 2.2% 2 30.0% 4.6% 2 36.9% 3.4% 3 36.9% 3.3% 3 36.9%
1.1% 375 51.7% 1.1% 397 48.4% 1.7% 431 45.4% 1.7% 388 50.9% 1.1% 411 47.9% 1.1% 432 45.6%
0.6% 1 60.1% 0.6% 1 56.5% 0.6% 1 53.5% 0.6% 1 59.9% 0.8% 1 55.5% 0.6% 1 52.8%
0.2% 8 2.4% 0.3% 13 3.3% 0.3% 18 4.0% 0.3% 11 3.1% 0.4% 18 4.2% 0.4% 25 5.0%
0.1% 0 5.3% 0.1% 0 5.3% 0.1% 0 5.3% 0.1% 0 0.1% 0.1% 0 0.2% 0.1% 0 0.3%
8.0% 7 25.7% 7.9% 12 25.7% 8.6% 16 26.2% 8.6% 8 27.9% 8.6% 13 27.9% 8.6% 17 27.9%
- 0 - - 0 - - 0 - - 0 - - 0 - - 0 -
- 0 - - 0 - - 0 - - 0 - - 0 - - 0 -
- 0 - - 0 - - 0 - - 0 - - 0 - - 0 -
0.0% 0 - 0.0% 0 - 0.0% 0 - 0.0% 0 - 0.0% 0 - 0.0% 0 -
- 0 - - 0 - - 0 - - 0 - - 0 - - 0 -
0.8% 525 39.6% 0.7% 561 37.1% 1.0% 609 35.1% 1.3% 552 39.5% 0.8% 593 37.2% 0.8% 630 35.3%
Impairment
rate
Stock of
Provisions
Coverage Ratio -
Default Stock1
Impairment
rate
Stock of
Provisions
Coverage Ratio -
Default Stock1
Impairment
rate
Stock of
Provisions
Coverage Ratio -
Default Stock1
Impairment
rate
Stock of
Provisions
Coverage Ratio -
Default Stock1
Impairment
rate
Stock of
Provisions
Coverage Ratio -
Default Stock1
Impairment
rate
Stock of
Provisions
Coverage Ratio -
Default Stock1
0.0% 1 40.0% 0.0% 3 40.0% 0.0% 4 40.0% 0.0% 2 40.0% 0.0% 3 40.0% 0.0% 3 40.0%
- 0 - - 0 - - 0 - - 0 - - 0 - - 0 -
- 0 - - 0 - - 0 - - 0 - - 0 - - 0 -
- 0 - - 0 - - 0 - - 0 - - 0 - - 0 -
- 0 - - 0 - - 0 - - 0 - - 0 - - 0 -
0.9% 0 48.7% 0.9% 0 48.7% 0.9% 0 48.7% 0.9% 0 48.7% 0.9% 0 48.7% 0.9% 0 48.7%
0.4% 1 13.8% 0.4% 1 19.4% 0.4% 2 23.3% 0.5% 1 10.2% 0.4% 1 16.6% 0.4% 1 20.9%
- 0 - - 0 - - 0 - - 0 - - 0 - - 0 -
1.8% 6 67.4% 1.8% 7 66.4% 1.8% 8 66.0% 2.2% 7 68.1% 2.1% 8 67.8% 2.0% 9 68.5%
1.5% 0 32.2% 1.5% 0 32.2% 1.5% 0 32.2% 3.4% 0 32.2% 2.5% 0 32.2% 2.5% 0 32.2%
0.0% 1 5.1% 0.0% 1 5.3% 0.0% 1 5.3% 0.1% 1 5.7% 0.1% 1 6.2% 0.1% 2 6.4%
- 0 - - 0 - - 0 - - 0 - - 0 - - 0 -
- 0 - - 0 - - 0 - - 0 - - 0 - - 0 -
- 0 - - 0 - - 0 - - 0 - - 0 - - 0 -
- 0 - - 0 - - 0 - - 0 - - 0 - - 0 -
- 0 - - 0 - - 0 - - 0 - - 0 - - 0 -
0.0% 0 - 0.0% 0 - 0.0% 0 - 0.0% 0 - 0.0% 0 - 0.0% 0 -
0.0% 0 0.0% 0.0% 0 0.0% 0.0% 0 0.0% 0.0% 0 0.0% 0.0% 0 0.0% 0.0% 0 0.0%
0.0% 9 18.8% 0.0% 12 20.4% 0.0% 16 20.7% 0.0% 10 18.4% 0.0% 13 20.1% 0.0% 16 20.3%
Impairment
rate
Stock of
Provisions
Coverage Ratio -
Default Stock1
Impairment
rate
Stock of
Provisions
Coverage Ratio -
Default Stock1
Impairment
rate
Stock of
Provisions
Coverage Ratio -
Default Stock1
Impairment
rate
Stock of
Provisions
Coverage Ratio -
Default Stock1
Impairment
rate
Stock of
Provisions
Coverage Ratio -
Default Stock1
Impairment
rate
Stock of
Provisions
Coverage Ratio -
Default Stock1
- 0 - - 0 - - 0 - - 0 - - 0 - - 0 -
- 0 - - 0 - - 0 - - 0 - - 0 - - 0 -
- 0 - - 0 - - 0 - - 0 - - 0 - - 0 -
- 0 - - 0 - - 0 - - 0 - - 0 - - 0 -
- 0 - - 0 - - 0 - - 0 - - 0 - - 0 -
0.8% 0 47.3% 0.8% 0 47.3% 0.8% 0 47.3% 0.8% 0 47.3% 0.8% 0 47.3% 0.8% 0 47.3%
0.5% 0 48.2% 0.5% 1 48.2% 0.5% 1 48.2% 0.7% 1 47.7% 0.6% 1 47.8% 0.6% 1 47.8%
1.1% 0 53.8% 1.0% 0 53.8% 1.0% 0 53.8% 2.4% 0 53.8% 1.8% 0 53.8% 1.7% 0 53.8%
1.2% 1 50.9% 1.1% 2 49.3% 1.3% 2 47.9% 1.4% 1 50.7% 1.2% 2 49.4% 1.2% 2 48.4%
2.2% 0 45.0% 0.0% 0 45.0% 0.0% 0 45.0% 0.0% 0 45.0% 0.0% 0 45.0% 0.0% 0 45.0%
0.2% 0 12.0% 0.2% 0 15.4% 0.2% 0 17.4% 0.5% 0 17.0% 0.3% 0 20.9% 0.3% 0 22.6%
- 0 - - 0 - - 0 - - 0 - - 0 - - 0 -
12.2% 0 39.5% 12.2% 0 39.5% 13.4% 0 40.3% 13.4% 0 43.3% 13.4% 0 43.3% 13.4% 0 43.3%
- 0 - - 0 - - 0 - - 0 - - 0 - - 0 -
- 0 - - 0 - - 0 - - 0 - - 0 - - 0 -
- 0 - - 0 - - 0 - - 0 - - 0 - - 0 -
- 0 - - 0 - - 0 - - 0 - - 0 - - 0 -
- 0 - - 0 - - 0 - - 0 - - 0 - - 0 -
0.5% 2 42.5% 0.5% 3 42.2% 0.5% 3 41.9% 0.7% 2 42.6% 0.6% 3 42.3% 0.6% 4 42.1%
31/12/2018 31/12/2016 31/12/2017 31/12/201831/12/2016 31/12/2017
31/12/2018 31/12/2016 31/12/2017 31/12/2018
Baseline Scenario Adverse Scenario
31/12/2016 31/12/2017
31/12/2018 31/12/2016 31/12/2017 31/12/2018
Baseline Scenario Adverse Scenario
31/12/2016 31/12/2017
Baseline Scenario Adverse Scenario
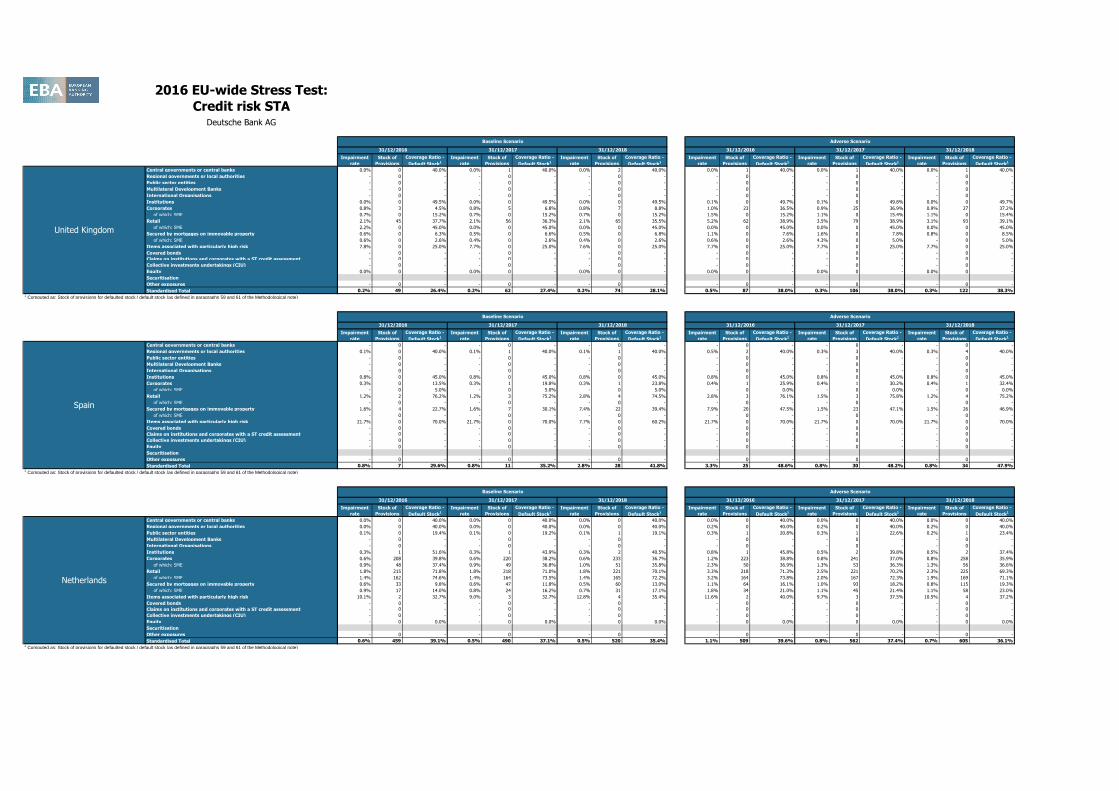
2016 EU-wide Stress Test:
Credit risk STADeutsche Bank AG
Central governments or central banks
Regional governments or local authorities
Public sector entities
Multilateral Development Banks
International Organisations
Institutions
Corporates
of which: SME
Retail
of which: SME
Secured by mortgages on immovable property
of which: SME
Items associated with particularly high risk
Covered bonds
Claims on institutions and corporates with a ST credit assessment
Collective investments undertakings (CIU)
Equity
Securitisation
Other exposures
Standardised Total1 Computed as: Stock of provisions for defaulted stock / default stock (as defined in paragraphs 59 and 61 of the Methodological note)
Central governments or central banks
Regional governments or local authorities
Public sector entities
Multilateral Development Banks
International Organisations
Institutions
Corporates
of which: SME
Retail
of which: SME
Secured by mortgages on immovable property
of which: SME
Items associated with particularly high risk
Covered bonds
Claims on institutions and corporates with a ST credit assessment
Collective investments undertakings (CIU)
Equity
Securitisation
Other exposures
Standardised Total1 Computed as: Stock of provisions for defaulted stock / default stock (as defined in paragraphs 59 and 61 of the Methodological note)
Central governments or central banks
Regional governments or local authorities
Public sector entities
Multilateral Development Banks
International Organisations
Institutions
Corporates
of which: SME
Retail
of which: SME
Secured by mortgages on immovable property
of which: SME
Items associated with particularly high risk
Covered bonds
Claims on institutions and corporates with a ST credit assessment
Collective investments undertakings (CIU)
Equity
Securitisation
Other exposures
Standardised Total1 Computed as: Stock of provisions for defaulted stock / default stock (as defined in paragraphs 59 and 61 of the Methodological note)
Netherlands
Spain
United Kingdom
Impairment
rate
Stock of
Provisions
Coverage Ratio -
Default Stock1
Impairment
rate
Stock of
Provisions
Coverage Ratio -
Default Stock1
Impairment
rate
Stock of
Provisions
Coverage Ratio -
Default Stock1
Impairment
rate
Stock of
Provisions
Coverage Ratio -
Default Stock1
Impairment
rate
Stock of
Provisions
Coverage Ratio -
Default Stock1
Impairment
rate
Stock of
Provisions
Coverage Ratio -
Default Stock1
0.0% 0 40.0% 0.0% 1 40.0% 0.0% 2 40.0% 0.0% 1 40.0% 0.0% 1 40.0% 0.0% 1 40.0%
- 0 - - 0 - - 0 - - 0 - - 0 - - 0 -
- 0 - - 0 - - 0 - - 0 - - 0 - - 0 -
- 0 - - 0 - - 0 - - 0 - - 0 - - 0 -
- 0 - - 0 - - 0 - - 0 - - 0 - - 0 -
0.0% 0 49.5% 0.0% 0 49.5% 0.0% 0 49.5% 0.1% 0 49.7% 0.1% 0 49.8% 0.0% 0 49.7%
0.8% 3 4.5% 0.8% 5 6.8% 0.8% 7 8.8% 1.0% 23 36.5% 0.9% 25 36.9% 0.9% 27 37.2%
0.7% 0 15.2% 0.7% 0 15.2% 0.7% 0 15.2% 1.5% 0 15.2% 1.1% 0 15.4% 1.1% 0 15.4%
2.1% 45 37.7% 2.1% 56 36.3% 2.1% 65 35.5% 5.2% 62 38.9% 3.5% 79 38.9% 3.1% 93 39.1%
2.2% 0 45.0% 0.0% 0 45.0% 0.0% 0 45.0% 0.0% 0 45.0% 0.0% 0 45.0% 0.0% 0 45.0%
0.6% 0 6.3% 0.5% 0 6.6% 0.5% 0 6.8% 1.1% 0 7.6% 1.6% 0 7.8% 0.8% 0 8.5%
0.6% 0 2.6% 0.4% 0 2.6% 0.4% 0 2.6% 0.6% 0 2.6% 4.3% 0 5.0% - 0 5.0%
7.8% 0 25.0% 7.7% 0 25.0% 7.6% 0 25.0% 7.7% 0 25.0% 7.7% 0 25.0% 7.7% 0 25.0%
- 0 - - 0 - - 0 - - 0 - - 0 - - 0 -
- 0 - - 0 - - 0 - - 0 - - 0 - - 0 -
- 0 - - 0 - - 0 - - 0 - - 0 - - 0 -
0.0% 0 - 0.0% 0 - 0.0% 0 - 0.0% 0 - 0.0% 0 - 0.0% 0 -
- 0 - - 0 - - 0 - - 0 - - 0 - - 0 -
0.2% 49 26.4% 0.2% 62 27.4% 0.2% 74 28.1% 0.5% 87 38.0% 0.3% 106 38.0% 0.3% 122 38.3%
Impairment
rate
Stock of
Provisions
Coverage Ratio -
Default Stock1
Impairment
rate
Stock of
Provisions
Coverage Ratio -
Default Stock1
Impairment
rate
Stock of
Provisions
Coverage Ratio -
Default Stock1
Impairment
rate
Stock of
Provisions
Coverage Ratio -
Default Stock1
Impairment
rate
Stock of
Provisions
Coverage Ratio -
Default Stock1
Impairment
rate
Stock of
Provisions
Coverage Ratio -
Default Stock1
- 0 - - 0 - - 0 - - 0 - - 0 - - 0 -
0.1% 0 40.0% 0.1% 1 40.0% 0.1% 1 40.0% 0.5% 2 40.0% 0.3% 3 40.0% 0.3% 4 40.0%
- 0 - - 0 - - 0 - - 0 - - 0 - - 0 -
- 0 - - 0 - - 0 - - 0 - - 0 - - 0 -
- 0 - - 0 - - 0 - - 0 - - 0 - - 0 -
0.8% 0 45.0% 0.8% 0 45.0% 0.8% 0 45.0% 0.8% 0 45.0% 0.8% 0 45.0% 0.8% 0 45.0%
0.3% 0 13.5% 0.3% 1 19.8% 0.3% 1 23.8% 0.4% 1 25.9% 0.4% 1 30.2% 0.4% 1 32.4%
- 0 5.0% - 0 5.0% - 0 5.0% - 0 0.0% - 0 0.0% - 0 0.0%
1.2% 2 76.2% 1.2% 3 75.2% 2.8% 4 74.5% 2.8% 3 76.1% 1.5% 3 75.8% 1.2% 4 75.2%
- 0 - - 0 - - 0 - - 0 - - 0 - - 0 -
1.6% 4 22.7% 1.6% 7 30.1% 7.4% 22 39.4% 7.9% 20 47.5% 1.5% 23 47.1% 1.5% 26 46.9%
- 0 - - 0 - - 0 - - 0 - - 0 - - 0 -
21.7% 0 70.0% 21.7% 0 70.0% 7.7% 0 60.2% 21.7% 0 70.0% 21.7% 0 70.0% 21.7% 0 70.0%
- 0 - - 0 - - 0 - - 0 - - 0 - - 0 -
- 0 - - 0 - - 0 - - 0 - - 0 - - 0 -
- 0 - - 0 - - 0 - - 0 - - 0 - - 0 -
- 0 - - 0 - - 0 - - 0 - - 0 - - 0 -
- 0 - - 0 - - 0 - - 0 - - 0 - - 0 -
0.8% 7 29.6% 0.8% 11 35.2% 2.8% 28 41.8% 3.3% 25 48.6% 0.8% 30 48.2% 0.8% 34 47.9%
Impairment
rate
Stock of
Provisions
Coverage Ratio -
Default Stock1
Impairment
rate
Stock of
Provisions
Coverage Ratio -
Default Stock1
Impairment
rate
Stock of
Provisions
Coverage Ratio -
Default Stock1
Impairment
rate
Stock of
Provisions
Coverage Ratio -
Default Stock1
Impairment
rate
Stock of
Provisions
Coverage Ratio -
Default Stock1
Impairment
rate
Stock of
Provisions
Coverage Ratio -
Default Stock1
0.0% 0 40.0% 0.0% 0 40.0% 0.0% 0 40.0% 0.0% 0 40.0% 0.0% 0 40.0% 0.0% 0 40.0%
0.0% 0 40.0% 0.0% 0 40.0% 0.0% 0 40.0% 0.2% 0 40.0% 0.2% 0 40.0% 0.2% 0 40.0%
0.1% 0 19.4% 0.1% 0 19.2% 0.1% 1 19.1% 0.3% 1 20.8% 0.3% 1 22.6% 0.2% 1 23.4%
- 0 - - 0 - - 0 - - 0 - - 0 - - 0 -
- 0 - - 0 - - 0 - - 0 - - 0 - - 0 -
0.3% 1 51.6% 0.3% 1 43.9% 0.3% 2 40.5% 0.8% 1 45.8% 0.5% 2 39.8% 0.5% 2 37.4%
0.6% 208 39.8% 0.6% 220 38.2% 0.6% 233 36.7% 1.2% 223 38.8% 0.8% 241 37.0% 0.8% 258 35.9%
0.9% 48 37.4% 0.9% 49 36.8% 1.0% 51 35.8% 2.3% 50 36.9% 1.3% 53 36.3% 1.3% 56 36.6%
1.8% 215 71.8% 1.8% 218 71.0% 1.8% 221 70.1% 3.3% 218 71.3% 2.5% 221 70.2% 2.3% 225 69.3%
1.4% 162 74.6% 1.4% 164 73.5% 1.4% 165 72.2% 3.2% 164 73.8% 2.0% 167 72.3% 1.9% 169 71.1%
0.6% 33 9.8% 0.6% 47 11.8% 0.5% 60 13.0% 1.1% 64 16.1% 1.0% 93 18.2% 0.8% 115 19.3%
0.9% 17 14.0% 0.8% 24 16.2% 0.7% 31 17.1% 1.8% 34 21.0% 1.1% 45 21.4% 1.1% 58 23.0%
10.1% 2 32.7% 9.0% 3 32.7% 12.8% 4 35.4% 11.6% 2 40.0% 9.7% 3 37.5% 10.5% 4 37.2%
- 0 - - 0 - - 0 - - 0 - - 0 - - 0 -
- 0 - - 0 - - 0 - - 0 - - 0 - - 0 -
- 0 - - 0 - - 0 - - 0 - - 0 - - 0 -
- 0 0.0% - 0 0.0% - 0 0.0% - 0 0.0% - 0 0.0% - 0 0.0%
- 0 - - 0 - - 0 - - 0 - - 0 - - 0 -
0.6% 459 39.1% 0.5% 490 37.1% 0.5% 520 35.4% 1.1% 509 39.6% 0.8% 562 37.4% 0.7% 605 36.1%
31/12/2018 31/12/2016 31/12/2017 31/12/201831/12/2016 31/12/2017
31/12/2018 31/12/2016 31/12/2017 31/12/2018
Baseline Scenario Adverse Scenario
31/12/2016 31/12/2017
31/12/2018 31/12/2016 31/12/2017 31/12/2018
Baseline Scenario Adverse Scenario
31/12/2016 31/12/2017
Baseline Scenario Adverse Scenario
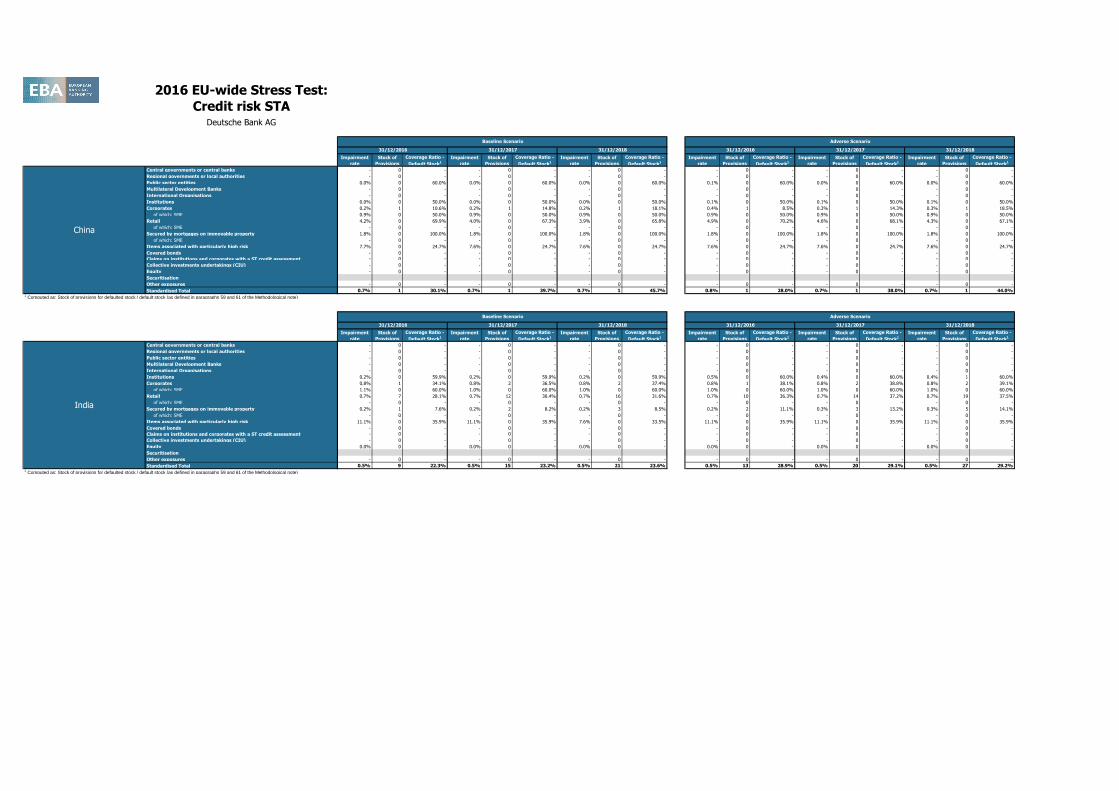
2016 EU-wide Stress Test:
Credit risk STADeutsche Bank AG
Central governments or central banks
Regional governments or local authorities
Public sector entities
Multilateral Development Banks
International Organisations
Institutions
Corporates
of which: SME
Retail
of which: SME
Secured by mortgages on immovable property
of which: SME
Items associated with particularly high risk
Covered bonds
Claims on institutions and corporates with a ST credit assessment
Collective investments undertakings (CIU)
Equity
Securitisation
Other exposures
Standardised Total1 Computed as: Stock of provisions for defaulted stock / default stock (as defined in paragraphs 59 and 61 of the Methodological note)
Central governments or central banks
Regional governments or local authorities
Public sector entities
Multilateral Development Banks
International Organisations
Institutions
Corporates
of which: SME
Retail
of which: SME
Secured by mortgages on immovable property
of which: SME
Items associated with particularly high risk
Covered bonds
Claims on institutions and corporates with a ST credit assessment
Collective investments undertakings (CIU)
Equity
Securitisation
Other exposures
Standardised Total1 Computed as: Stock of provisions for defaulted stock / default stock (as defined in paragraphs 59 and 61 of the Methodological note)
India
China
Impairment
rate
Stock of
Provisions
Coverage Ratio -
Default Stock1
Impairment
rate
Stock of
Provisions
Coverage Ratio -
Default Stock1
Impairment
rate
Stock of
Provisions
Coverage Ratio -
Default Stock1
Impairment
rate
Stock of
Provisions
Coverage Ratio -
Default Stock1
Impairment
rate
Stock of
Provisions
Coverage Ratio -
Default Stock1
Impairment
rate
Stock of
Provisions
Coverage Ratio -
Default Stock1
- 0 - - 0 - - 0 - - 0 - - 0 - - 0 -
- 0 - - 0 - - 0 - - 0 - - 0 - - 0 -
0.0% 0 60.0% 0.0% 0 60.0% 0.0% 0 60.0% 0.1% 0 60.0% 0.0% 0 60.0% 0.0% 0 60.0%
- 0 - - 0 - - 0 - - 0 - - 0 - - 0 -
- 0 - - 0 - - 0 - - 0 - - 0 - - 0 -
0.0% 0 50.0% 0.0% 0 50.0% 0.0% 0 50.0% 0.1% 0 50.0% 0.1% 0 50.0% 0.1% 0 50.0%
0.2% 1 10.6% 0.2% 1 14.8% 0.2% 1 18.1% 0.4% 1 8.5% 0.3% 1 14.3% 0.3% 1 18.5%
0.9% 0 50.0% 0.9% 0 50.0% 0.9% 0 50.0% 0.9% 0 50.0% 0.9% 0 50.0% 0.9% 0 50.0%
4.2% 0 69.9% 4.0% 0 67.3% 3.9% 0 65.8% 4.9% 0 70.2% 4.6% 0 68.1% 4.3% 0 67.1%
- 0 - - 0 - - 0 - - 0 - - 0 - - 0 -
1.8% 0 100.0% 1.8% 0 100.0% 1.8% 0 100.0% 1.8% 0 100.0% 1.8% 0 100.0% 1.8% 0 100.0%
- 0 - - 0 - - 0 - - 0 - - 0 - - 0 -
7.7% 0 24.7% 7.6% 0 24.7% 7.6% 0 24.7% 7.6% 0 24.7% 7.6% 0 24.7% 7.6% 0 24.7%
- 0 - - 0 - - 0 - - 0 - - 0 - - 0 -
- 0 - - 0 - - 0 - - 0 - - 0 - - 0 -
- 0 - - 0 - - 0 - - 0 - - 0 - - 0 -
- 0 - - 0 - - 0 - - 0 - - 0 - - 0 -
- 0 - - 0 - - 0 - - 0 - - 0 - - 0 -
0.7% 1 30.1% 0.7% 1 39.7% 0.7% 1 45.7% 0.8% 1 28.0% 0.7% 1 38.0% 0.7% 1 44.0%
Impairment
rate
Stock of
Provisions
Coverage Ratio -
Default Stock1
Impairment
rate
Stock of
Provisions
Coverage Ratio -
Default Stock1
Impairment
rate
Stock of
Provisions
Coverage Ratio -
Default Stock1
Impairment
rate
Stock of
Provisions
Coverage Ratio -
Default Stock1
Impairment
rate
Stock of
Provisions
Coverage Ratio -
Default Stock1
Impairment
rate
Stock of
Provisions
Coverage Ratio -
Default Stock1
- 0 - - 0 - - 0 - - 0 - - 0 - - 0 -
- 0 - - 0 - - 0 - - 0 - - 0 - - 0 -
- 0 - - 0 - - 0 - - 0 - - 0 - - 0 -
- 0 - - 0 - - 0 - - 0 - - 0 - - 0 -
- 0 - - 0 - - 0 - - 0 - - 0 - - 0 -
0.2% 0 59.9% 0.2% 0 59.9% 0.2% 0 59.9% 0.5% 0 60.0% 0.4% 0 60.0% 0.4% 1 60.0%
0.8% 1 34.1% 0.8% 2 36.5% 0.8% 2 37.4% 0.8% 1 38.1% 0.8% 2 38.8% 0.8% 2 39.1%
1.1% 0 60.0% 1.0% 0 60.0% 1.0% 0 60.0% 1.0% 0 60.0% 1.0% 0 60.0% 1.0% 0 60.0%
0.7% 7 28.1% 0.7% 12 30.4% 0.7% 16 31.6% 0.7% 10 36.3% 0.7% 14 37.2% 0.7% 19 37.5%
- 0 - - 0 - - 0 - - 0 - - 0 - - 0 -
0.2% 1 7.6% 0.2% 2 8.2% 0.2% 3 8.5% 0.2% 2 11.1% 0.3% 3 13.2% 0.3% 5 14.1%
- 0 - - 0 - - 0 - - 0 - - 0 - - 0 -
11.1% 0 35.9% 11.1% 0 35.9% 7.6% 0 33.5% 11.1% 0 35.9% 11.1% 0 35.9% 11.1% 0 35.9%
- 0 - - 0 - - 0 - - 0 - - 0 - - 0 -
- 0 - - 0 - - 0 - - 0 - - 0 - - 0 -
- 0 - - 0 - - 0 - - 0 - - 0 - - 0 -
0.0% 0 - 0.0% 0 - 0.0% 0 - 0.0% 0 - 0.0% 0 - 0.0% 0 -
- 0 - - 0 - - 0 - - 0 - - 0 - - 0 -
0.5% 9 22.3% 0.5% 15 23.2% 0.5% 21 23.6% 0.5% 13 28.9% 0.5% 20 29.1% 0.5% 27 29.2%
31/12/2018 31/12/2016 31/12/2017 31/12/201831/12/2016 31/12/2017
31/12/2018 31/12/2016 31/12/2017 31/12/2018
Baseline Scenario Adverse Scenario
31/12/2016 31/12/2017
Baseline Scenario Adverse Scenario
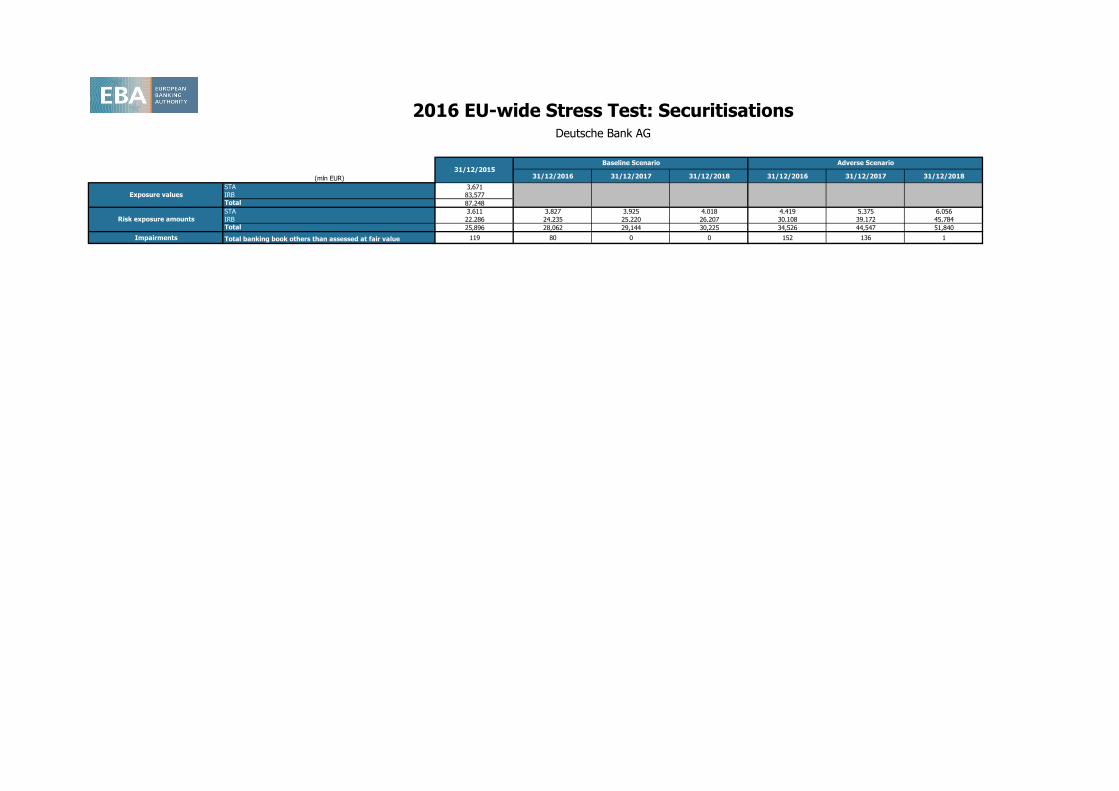
(mln EUR) 31/12/2016 31/12/2017 31/12/2018 31/12/2016 31/12/2017 31/12/2018
STA 3,671IRB 83,577Total 87,248
STA 3,611 3,827 3,925 4,018 4,419 5,375 6,056IRB 22,286 24,235 25,220 26,207 30,108 39,172 45,784Total 25,896 28,062 29,144 30,225 34,526 44,547 51,840
Impairments Total banking book others than assessed at fair value 119 80 0 0 152 136 1
2016 EU-wide Stress Test: SecuritisationsDeutsche Bank AG
Risk exposure amounts
31/12/2015Baseline Scenario Adverse Scenario
Exposure values
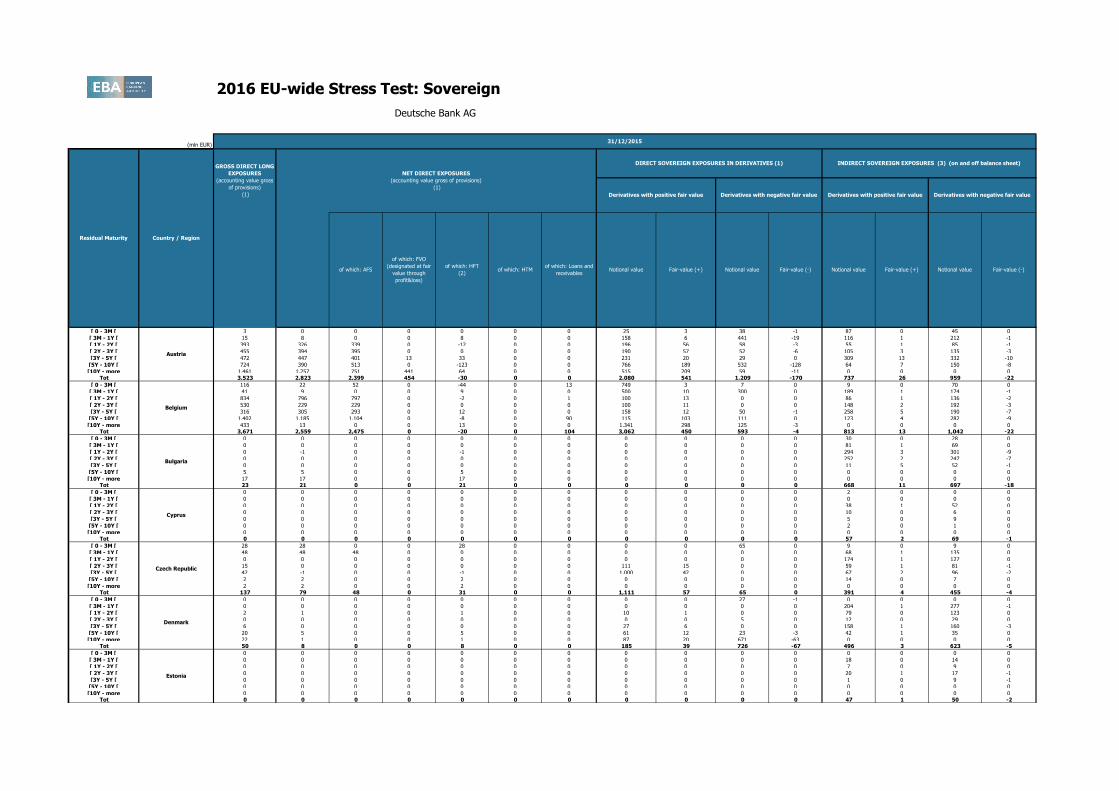
2016 EU-wide Stress Test: Sovereign
(mln EUR)
[ 0 - 3M [ 3 0 0 0 0 0 0 25 3 38 -1 87 0 45 0
[ 3M - 1Y [ 15 8 0 0 8 0 0 158 6 441 -19 116 1 212 -1
[ 1Y - 2Y [ 393 326 339 0 -12 0 0 196 56 58 -3 55 1 85 -1
[ 2Y - 3Y [ 455 394 395 0 0 0 0 190 57 52 -6 105 3 135 -3
[3Y - 5Y [ 472 447 401 13 33 0 0 231 20 29 0 309 13 332 -10
[5Y - 10Y [ 724 390 513 0 -123 0 0 766 189 532 -128 64 7 150 -8
[10Y - more 1,461 1,257 751 441 64 0 0 515 209 59 -11 0 0 0 0Tot 3,523 2,823 2,399 454 -30 0 0 2,080 541 1,209 -170 737 26 959 -22
[ 0 - 3M [ 116 22 52 0 -44 0 13 749 3 7 0 9 0 70 0
[ 3M - 1Y [ 41 9 0 0 9 0 0 500 10 300 0 189 1 174 -1
[ 1Y - 2Y [ 834 796 797 0 -2 0 1 100 13 0 0 86 1 136 -2
[ 2Y - 3Y [ 530 229 229 0 0 0 0 100 11 0 0 148 2 192 -3
[3Y - 5Y [ 316 305 293 0 12 0 0 158 12 50 -1 258 5 190 -7
[5Y - 10Y [ 1,402 1,185 1,104 0 -8 0 90 115 103 111 0 123 4 282 -9
[10Y - more 433 13 0 0 13 0 0 1,341 298 125 -3 0 0 0 0Tot 3,671 2,559 2,475 0 -20 0 104 3,062 450 593 -4 813 13 1,042 -22
[ 0 - 3M [ 0 0 0 0 0 0 0 0 0 0 0 30 0 28 0
[ 3M - 1Y [ 0 0 0 0 0 0 0 0 0 0 0 81 1 69 0
[ 1Y - 2Y [ 0 -1 0 0 -1 0 0 0 0 0 0 294 3 301 -9
[ 2Y - 3Y [ 0 0 0 0 0 0 0 0 0 0 0 252 2 247 -7
[3Y - 5Y [ 0 0 0 0 0 0 0 0 0 0 0 11 5 52 -1
[5Y - 10Y [ 5 5 0 0 5 0 0 0 0 0 0 0 0 0 0
[10Y - more 17 17 0 0 17 0 0 0 0 0 0 0 0 0 0Tot 23 21 0 0 21 0 0 0 0 0 0 668 11 697 -18
[ 0 - 3M [ 0 0 0 0 0 0 0 0 0 0 0 2 0 0 0
[ 3M - 1Y [ 0 0 0 0 0 0 0 0 0 0 0 0 0 0 0
[ 1Y - 2Y [ 0 0 0 0 0 0 0 0 0 0 0 38 1 52 0
[ 2Y - 3Y [ 0 0 0 0 0 0 0 0 0 0 0 10 0 6 0
[3Y - 5Y [ 0 0 0 0 0 0 0 0 0 0 0 5 0 9 0
[5Y - 10Y [ 0 0 0 0 0 0 0 0 0 0 0 2 0 1 0
[10Y - more 0 0 0 0 0 0 0 0 0 0 0 0 0 0 0Tot 0 0 0 0 0 0 0 0 0 0 0 57 2 69 -1
[ 0 - 3M [ 28 28 0 0 28 0 0 0 0 65 0 9 0 9 0
[ 3M - 1Y [ 48 48 48 0 0 0 0 0 0 0 0 68 1 135 0
[ 1Y - 2Y [ 0 0 0 0 0 0 0 0 0 0 0 174 1 127 0
[ 2Y - 3Y [ 15 0 0 0 0 0 0 111 15 0 0 59 1 81 -1
[3Y - 5Y [ 42 -1 0 0 -1 0 0 1,000 42 0 0 67 2 96 -2
[5Y - 10Y [ 2 2 0 0 2 0 0 0 0 0 0 14 0 7 0
[10Y - more 2 2 0 0 2 0 0 0 0 0 0 0 0 0 0Tot 137 79 48 0 31 0 0 1,111 57 65 0 391 4 455 -4
[ 0 - 3M [ 0 0 0 0 0 0 0 0 0 27 -1 0 0 0 0
[ 3M - 1Y [ 0 0 0 0 0 0 0 0 0 0 0 204 1 277 -1
[ 1Y - 2Y [ 2 1 0 0 1 0 0 10 1 0 0 79 0 123 0
[ 2Y - 3Y [ 0 0 0 0 0 0 0 0 0 5 0 12 0 29 0
[3Y - 5Y [ 6 0 0 0 0 0 0 27 6 0 0 158 1 160 -3
[5Y - 10Y [ 20 5 0 0 5 0 0 61 12 23 -3 42 1 35 0
[10Y - more 22 1 0 0 1 0 0 87 20 671 -63 0 0 0 0Tot 50 8 0 0 8 0 0 185 39 726 -67 496 3 623 -5
[ 0 - 3M [ 0 0 0 0 0 0 0 0 0 0 0 0 0 0 0
[ 3M - 1Y [ 0 0 0 0 0 0 0 0 0 0 0 18 0 14 0
[ 1Y - 2Y [ 0 0 0 0 0 0 0 0 0 0 0 7 0 9 0
[ 2Y - 3Y [ 0 0 0 0 0 0 0 0 0 0 0 20 1 17 -1
[3Y - 5Y [ 0 0 0 0 0 0 0 0 0 0 0 1 0 9 -1
[5Y - 10Y [ 0 0 0 0 0 0 0 0 0 0 0 0 0 0 0
[10Y - more 0 0 0 0 0 0 0 0 0 0 0 0 0 0 0Tot 0 0 0 0 0 0 0 0 0 0 0 47 1 50 -2
Deutsche Bank AG
31/12/2015
Residual Maturity Country / Region
GROSS DIRECT LONG
EXPOSURES
(accounting value gross
of provisions)
(1)
NET DIRECT EXPOSURES
(accounting value gross of provisions)
(1)
Notional value Fair-value (+) Fair-value (-) Notional value Fair-value (+)
DIRECT SOVEREIGN EXPOSURES IN DERIVATIVES (1) INDIRECT SOVEREIGN EXPOSURES (3) (on and off balance sheet)
Derivatives with positive fair value Derivatives with negative fair value Derivatives with positive fair value Derivatives with negative fair value
Notional value Fair-value (-)Notional value
Cyprus
Czech Republic
of which: Loans and
receivablesof which: AFS
of which: FVO
(designated at fair
value through
profit&loss)
of which: HFT
(2)of which: HTM
Austria
Belgium
Bulgaria
Denmark
Estonia
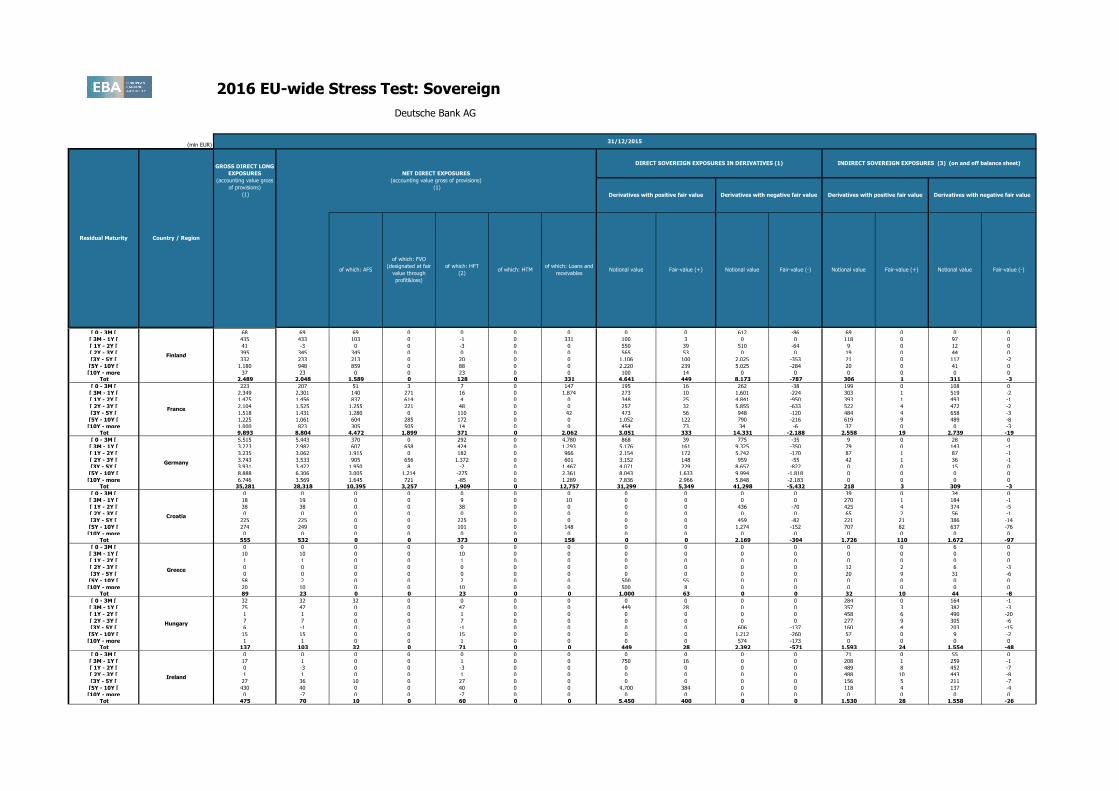
2016 EU-wide Stress Test: Sovereign
(mln EUR)
Deutsche Bank AG
31/12/2015
Residual Maturity Country / Region
GROSS DIRECT LONG
EXPOSURES
(accounting value gross
of provisions)
(1)
NET DIRECT EXPOSURES
(accounting value gross of provisions)
(1)
Notional value Fair-value (+) Fair-value (-) Notional value Fair-value (+)
DIRECT SOVEREIGN EXPOSURES IN DERIVATIVES (1) INDIRECT SOVEREIGN EXPOSURES (3) (on and off balance sheet)
Derivatives with positive fair value Derivatives with negative fair value Derivatives with positive fair value Derivatives with negative fair value
Notional value Fair-value (-)Notional valueof which: Loans and
receivablesof which: AFS
of which: FVO
(designated at fair
value through
profit&loss)
of which: HFT
(2)of which: HTM
Austria
[ 0 - 3M [ 68 69 69 0 0 0 0 0 0 612 -86 69 0 0 0
[ 3M - 1Y [ 435 433 103 0 -1 0 331 100 3 0 0 118 0 97 0
[ 1Y - 2Y [ 41 -3 0 0 -3 0 0 550 39 510 -64 9 0 12 0
[ 2Y - 3Y [ 395 345 345 0 0 0 0 565 53 0 0 19 0 44 0
[3Y - 5Y [ 332 233 213 0 20 0 0 1,106 100 2,025 -353 71 0 117 -2
[5Y - 10Y [ 1,180 948 859 0 88 0 0 2,220 239 5,025 -284 20 0 41 0
[10Y - more 37 23 0 0 23 0 0 100 14 0 0 0 0 0 0Tot 2,489 2,048 1,589 0 128 0 331 4,641 449 8,173 -787 306 1 311 -3
[ 0 - 3M [ 223 207 51 3 7 0 147 195 16 262 -38 199 0 108 0
[ 3M - 1Y [ 2,349 2,301 140 271 16 0 1,874 273 10 1,601 -224 303 1 519 -2
[ 1Y - 2Y [ 1,475 1,456 837 614 4 0 0 348 25 4,841 -950 393 1 493 -1
[ 2Y - 3Y [ 2,104 1,525 1,255 221 48 0 0 257 32 5,855 -633 522 4 472 -2
[3Y - 5Y [ 1,518 1,431 1,280 0 110 0 42 473 56 948 -120 484 4 658 -3
[5Y - 10Y [ 1,225 1,061 604 285 172 0 0 1,052 122 790 -216 619 9 489 -8
[10Y - more 1,000 823 305 505 14 0 0 454 73 34 -6 37 0 0 -3Tot 9,893 8,804 4,472 1,899 371 0 2,062 3,051 333 14,331 -2,188 2,558 19 2,739 -19
[ 0 - 3M [ 5,515 5,443 370 0 292 0 4,780 868 39 775 -35 9 0 28 0
[ 3M - 1Y [ 3,223 2,982 607 658 424 0 1,293 5,176 161 9,325 -350 79 0 143 -1
[ 1Y - 2Y [ 3,235 3,062 1,915 0 182 0 966 2,154 172 5,742 -170 87 1 87 -1
[ 2Y - 3Y [ 3,743 3,533 905 656 1,372 0 601 3,152 148 959 -55 42 1 36 -1
[3Y - 5Y [ 3,931 3,422 1,950 8 -2 0 1,467 4,071 229 8,657 -822 0 0 15 0
[5Y - 10Y [ 8,888 6,306 3,005 1,214 -275 0 2,361 8,043 1,633 9,994 -1,818 0 0 0 0
[10Y - more 6,746 3,569 1,645 721 -85 0 1,289 7,836 2,966 5,848 -2,183 0 0 0 0Tot 35,281 28,318 10,395 3,257 1,909 0 12,757 31,299 5,349 41,298 -5,432 218 3 309 -3
[ 0 - 3M [ 0 0 0 0 0 0 0 0 0 0 0 39 0 34 0
[ 3M - 1Y [ 18 19 0 0 9 0 10 0 0 0 0 270 1 184 -1
[ 1Y - 2Y [ 38 38 0 0 38 0 0 0 0 436 -70 425 4 374 -5
[ 2Y - 3Y [ 0 0 0 0 0 0 0 0 0 0 0 65 2 56 -1
[3Y - 5Y [ 225 225 0 0 225 0 0 0 0 459 -82 221 21 386 -14
[5Y - 10Y [ 274 249 0 0 101 0 148 0 0 1,274 -152 707 82 637 -76
[10Y - more 0 0 0 0 0 0 0 0 0 0 0 0 0 0 0Tot 555 532 0 0 373 0 158 0 0 2,169 -304 1,726 110 1,672 -97
[ 0 - 3M [ 0 0 0 0 0 0 0 0 0 0 0 0 0 6 0
[ 3M - 1Y [ 10 10 0 0 10 0 0 0 0 0 0 0 0 0 0
[ 1Y - 2Y [ 1 1 0 0 1 0 0 0 0 0 0 0 0 0 0
[ 2Y - 3Y [ 0 0 0 0 0 0 0 0 0 0 0 12 2 6 -3
[3Y - 5Y [ 0 0 0 0 0 0 0 0 0 0 0 20 9 31 -6
[5Y - 10Y [ 58 2 0 0 2 0 0 500 55 0 0 0 0 0 0
[10Y - more 20 10 0 0 10 0 0 500 8 0 0 0 0 0 0Tot 89 23 0 0 23 0 0 1,000 63 0 0 32 10 44 -8
[ 0 - 3M [ 32 32 32 0 0 0 0 0 0 0 0 284 0 164 -1
[ 3M - 1Y [ 75 47 0 0 47 0 0 449 28 0 0 357 3 382 -3
[ 1Y - 2Y [ 1 1 0 0 1 0 0 0 0 0 0 458 6 490 -20
[ 2Y - 3Y [ 7 7 0 0 7 0 0 0 0 0 0 277 9 305 -6
[3Y - 5Y [ 6 -1 0 0 -1 0 0 0 0 606 -137 160 4 203 -15
[5Y - 10Y [ 15 15 0 0 15 0 0 0 0 1,212 -260 57 0 9 -2
[10Y - more 1 1 0 0 1 0 0 0 0 574 -173 0 0 0 0Tot 137 103 32 0 71 0 0 449 28 2,392 -571 1,593 24 1,554 -48
[ 0 - 3M [ 0 0 0 0 0 0 0 0 0 0 0 71 0 55 0
[ 3M - 1Y [ 17 1 0 0 1 0 0 750 16 0 0 208 1 259 -1
[ 1Y - 2Y [ 0 -3 0 0 -3 0 0 0 0 0 0 489 8 452 -7
[ 2Y - 3Y [ 1 1 0 0 1 0 0 0 0 0 0 488 10 443 -8
[3Y - 5Y [ 27 36 10 0 27 0 0 0 0 0 0 156 5 211 -7
[5Y - 10Y [ 430 40 0 0 40 0 0 4,700 384 0 0 118 4 137 -4
[10Y - more 0 -7 0 0 -7 0 0 0 0 0 0 0 0 0 0Tot 475 70 10 0 60 0 0 5,450 400 0 0 1,530 28 1,558 -26
Greece
Ireland
Finland
France
Germany
Croatia
Hungary

2016 EU-wide Stress Test: Sovereign
(mln EUR)
Deutsche Bank AG
31/12/2015
Residual Maturity Country / Region
GROSS DIRECT LONG
EXPOSURES
(accounting value gross
of provisions)
(1)
NET DIRECT EXPOSURES
(accounting value gross of provisions)
(1)
Notional value Fair-value (+) Fair-value (-) Notional value Fair-value (+)
DIRECT SOVEREIGN EXPOSURES IN DERIVATIVES (1) INDIRECT SOVEREIGN EXPOSURES (3) (on and off balance sheet)
Derivatives with positive fair value Derivatives with negative fair value Derivatives with positive fair value Derivatives with negative fair value
Notional value Fair-value (-)Notional valueof which: Loans and
receivablesof which: AFS
of which: FVO
(designated at fair
value through
profit&loss)
of which: HFT
(2)of which: HTM
Austria
[ 0 - 3M [ 88 86 0 0 23 0 63 0 0 430 -21 392 1 698 -2
[ 3M - 1Y [ 544 67 0 0 16 0 51 0 1 0 0 1,131 7 2,458 -17
[ 1Y - 2Y [ 647 43 0 0 43 0 0 7,000 504 0 0 2,760 25 3,862 -37
[ 2Y - 3Y [ 542 40 28 0 11 0 0 4,099 428 0 0 2,819 36 3,234 -38
[3Y - 5Y [ 524 299 18 0 281 0 0 1,000 103 0 0 6,442 78 8,451 -84
[5Y - 10Y [ 2,336 194 0 0 8 0 186 10,841 1,934 378 -388 6,237 66 4,708 -101
[10Y - more 351 30 7 0 22 0 0 364 194 207 -95 1,851 214 1,702 -113Tot 5,033 759 54 0 405 0 300 23,303 3,163 1,016 -504 21,631 428 25,114 -392
[ 0 - 3M [ 0 0 0 0 0 0 0 0 0 0 0 0 0 0 0
[ 3M - 1Y [ 0 0 0 0 0 0 0 0 0 0 0 2 0 3 0
[ 1Y - 2Y [ 3 3 0 0 3 0 0 0 0 0 0 170 2 163 -1
[ 2Y - 3Y [ 0 -9 0 0 -9 0 0 0 0 0 0 30 1 85 -6
[3Y - 5Y [ 12 12 0 0 12 0 0 0 0 0 0 0 0 10 -1
[5Y - 10Y [ 37 15 0 0 15 0 0 138 16 16 0 5 1 59 0
[10Y - more 191 0 0 0 0 0 0 225 189 2 0 0 0 0 0Tot 243 21 0 0 21 0 0 363 205 18 0 207 4 319 -8
[ 0 - 3M [ 0 -1 0 0 -1 0 0 0 0 0 0 0 0 10 0
[ 3M - 1Y [ 10 10 0 0 0 0 10 0 0 0 0 13 0 4 0
[ 1Y - 2Y [ 2 2 0 0 2 0 0 0 0 0 0 49 0 15 0
[ 2Y - 3Y [ 0 -5 0 0 -5 0 0 0 0 0 0 36 1 55 -2
[3Y - 5Y [ 8 8 0 0 8 0 0 0 0 230 -45 48 1 60 -2
[5Y - 10Y [ 13 8 0 0 8 0 0 0 0 413 -54 0 0 0 0
[10Y - more 0 -2 0 0 -2 0 0 0 0 0 0 0 0 0 0Tot 33 20 0 0 10 0 10 0 0 643 -99 147 2 144 -4
[ 0 - 3M [ 71 25 25 0 0 0 0 0 0 0 0 0 0 0 0
[ 3M - 1Y [ 277 181 181 0 0 0 0 0 0 0 0 0 0 0 0
[ 1Y - 2Y [ 661 492 491 0 1 0 0 0 0 0 0 0 0 0 0
[ 2Y - 3Y [ 910 685 685 0 0 0 0 0 0 0 0 0 0 0 0
[3Y - 5Y [ 599 485 492 0 -7 0 0 0 0 0 0 0 0 0 0
[5Y - 10Y [ 1,179 889 889 0 -1 0 0 0 0 0 0 0 0 0 0
[10Y - more 14 14 0 0 14 0 0 0 0 0 0 0 0 0 0Tot 3,711 2,770 2,763 0 8 0 0 0 0 0 0 0 0 0 0
[ 0 - 3M [ 0 0 0 0 0 0 0 0 0 0 0 0 0 0 0
[ 3M - 1Y [ 1 0 0 0 0 0 0 0 0 0 0 0 0 0 0
[ 1Y - 2Y [ 0 0 0 0 0 0 0 0 0 0 0 0 0 0 0
[ 2Y - 3Y [ 0 0 0 0 0 0 0 0 0 0 0 0 0 0 0
[3Y - 5Y [ 0 0 0 0 0 0 0 0 0 0 0 0 0 0 0
[5Y - 10Y [ 0 0 0 0 0 0 0 0 0 0 0 0 0 0 0
[10Y - more 0 0 0 0 0 0 0 0 0 0 0 0 0 0 0Tot 1 0 0 0 0 0 0 0 0 0 0 0 0 0 0
[ 0 - 3M [ 68 14 0 0 7 0 7 1,732 53 894 -25 53 0 53 0
[ 3M - 1Y [ 515 298 249 0 4 0 46 6,998 217 62 -2 35 0 119 0
[ 1Y - 2Y [ 1,716 1,426 1,386 0 37 0 2 5,575 304 500 -50 79 0 79 0
[ 2Y - 3Y [ 1,528 1,526 1,522 0 3 0 1 346 31 1,250 -155 47 0 47 0
[3Y - 5Y [ 649 656 615 0 25 0 17 10 2 3,652 -536 41 2 40 0
[5Y - 10Y [ 997 951 699 163 48 0 42 161 16 1,370 -331 34 0 35 -1
[10Y - more 535 118 304 73 -278 0 18 208 58 2,404 -1,029 0 0 0 0Tot 6,007 4,989 4,775 235 -153 0 133 15,030 681 10,132 -2,127 289 3 372 -2
[ 0 - 3M [ 13 13 0 0 13 0 0 0 0 0 0 39 0 27 0
[ 3M - 1Y [ 163 163 0 0 162 0 1 0 0 0 0 155 1 144 -1
[ 1Y - 2Y [ 4 0 0 0 0 0 0 0 0 0 0 159 1 176 -3
[ 2Y - 3Y [ 39 37 6 0 31 0 1 0 0 0 0 201 4 231 -6
[3Y - 5Y [ 212 207 63 0 144 0 0 0 0 0 0 112 4 143 -6
[5Y - 10Y [ 47 9 18 0 -14 0 5 0 0 0 0 36 0 18 0
[10Y - more 2 -2 0 0 -3 0 1 0 0 0 0 0 0 0 0Tot 480 428 87 0 332 0 9 0 0 0 0 701 12 738 -16
Italy
Latvia
Lithuania
Malta
Netherlands
Poland
Luxembourg

2016 EU-wide Stress Test: Sovereign
(mln EUR)
Deutsche Bank AG
31/12/2015
Residual Maturity Country / Region
GROSS DIRECT LONG
EXPOSURES
(accounting value gross
of provisions)
(1)
NET DIRECT EXPOSURES
(accounting value gross of provisions)
(1)
Notional value Fair-value (+) Fair-value (-) Notional value Fair-value (+)
DIRECT SOVEREIGN EXPOSURES IN DERIVATIVES (1) INDIRECT SOVEREIGN EXPOSURES (3) (on and off balance sheet)
Derivatives with positive fair value Derivatives with negative fair value Derivatives with positive fair value Derivatives with negative fair value
Notional value Fair-value (-)Notional valueof which: Loans and
receivablesof which: AFS
of which: FVO
(designated at fair
value through
profit&loss)
of which: HFT
(2)of which: HTM
Austria
[ 0 - 3M [ 1 1 0 0 1 0 0 0 0 91 -1 9 0 128 0
[ 3M - 1Y [ 226 226 0 0 5 0 220 0 0 134 -4 299 2 278 -2
[ 1Y - 2Y [ 21 21 0 0 21 0 0 0 0 0 0 326 7 283 -3
[ 2Y - 3Y [ 0 -77 0 0 -77 0 0 0 0 0 0 98 1 185 -1
[3Y - 5Y [ 0 -1 0 0 -1 0 0 0 0 0 0 616 8 613 -11
[5Y - 10Y [ 98 -24 0 0 -25 0 0 200 62 1,508 -292 205 6 114 -15
[10Y - more 3 -36 0 0 -36 0 0 0 0 0 0 0 0 0 0Tot 349 109 0 0 -112 0 221 200 62 1,733 -296 1,553 23 1,601 -32
[ 0 - 3M [ 136 136 0 0 136 0 0 0 0 0 0 18 0 0 0
[ 3M - 1Y [ 4 4 0 0 4 0 0 0 0 0 0 138 1 130 0
[ 1Y - 2Y [ 8 6 0 0 6 0 0 0 0 0 0 202 4 105 -2
[ 2Y - 3Y [ 9 9 0 0 9 0 0 0 0 0 0 139 3 138 -9
[3Y - 5Y [ 12 9 0 0 9 0 0 0 0 0 0 29 1 61 -4
[5Y - 10Y [ 26 -7 0 0 -7 0 0 0 0 0 0 0 0 0 0
[10Y - more 14 -19 0 0 -19 0 0 0 0 0 0 0 0 0 0Tot 209 140 0 0 140 0 0 0 0 0 0 527 9 435 -15
[ 0 - 3M [ 0 0 0 0 0 0 0 0 0 0 0 9 0 9 0
[ 3M - 1Y [ 0 0 0 0 0 0 0 0 0 0 0 119 0 99 0
[ 1Y - 2Y [ 4 4 0 0 4 0 0 0 0 0 0 102 1 86 -1
[ 2Y - 3Y [ 11 11 0 0 11 0 0 0 0 0 0 128 3 149 -1
[3Y - 5Y [ 2 2 0 0 2 0 0 0 0 0 0 35 1 27 0
[5Y - 10Y [ 21 9 0 0 9 0 0 57 10 0 0 27 0 33 -1
[10Y - more 12 2 0 0 2 0 0 57 10 0 0 0 0 0 0Tot 51 29 0 0 29 0 0 115 20 0 0 421 5 402 -3
[ 0 - 3M [ 0 0 0 0 0 0 0 0 0 0 0 0 0 5 0
[ 3M - 1Y [ 298 298 0 0 30 0 268 0 0 0 0 18 0 27 0
[ 1Y - 2Y [ 0 -2 0 0 -2 0 0 0 0 0 0 21 0 49 -1
[ 2Y - 3Y [ 54 53 45 0 8 0 0 0 0 459 -69 20 0 49 -1
[3Y - 5Y [ 6 2 0 0 2 0 0 0 0 0 0 17 0 17 0
[5Y - 10Y [ 23 11 0 0 11 0 0 0 0 1,951 -205 12 0 21 0
[10Y - more 11 10 0 0 10 0 0 0 0 0 0 0 0 0 0Tot 391 372 45 0 59 0 268 0 0 2,410 -274 88 1 167 -2
[ 0 - 3M [ 96 96 0 0 1 0 95 0 0 0 0 186 0 123 0
[ 3M - 1Y [ 157 3 0 0 0 0 2 70 2 20 -1 637 2 746 -3
[ 1Y - 2Y [ 71 58 0 0 27 0 30 0 0 173 -24 971 13 991 -8
[ 2Y - 3Y [ 82 70 0 0 32 0 38 50 5 0 0 608 8 528 -8
[3Y - 5Y [ 100 -6 0 0 -6 0 0 0 0 100 -8 512 7 717 -16
[5Y - 10Y [ 407 317 0 0 10 0 306 85 12 25 -8 552 1 328 -8
[10Y - more 197 120 2 0 118 0 0 20 3 0 0 0 0 0 0Tot 1,110 658 2 0 183 0 472 225 22 318 -40 3,465 32 3,433 -44
[ 0 - 3M [ 1 0 0 0 0 0 0 45 1 322 -3 26 0 0 0
[ 3M - 1Y [ 1 1 0 0 1 0 0 0 0 27 -1 34 0 95 0
[ 1Y - 2Y [ 0 0 0 0 0 0 0 0 0 0 0 73 0 72 -1
[ 2Y - 3Y [ 0 0 0 0 0 0 0 0 0 0 0 25 0 56 -1
[3Y - 5Y [ 284 282 262 0 21 0 0 60 4 54 -4 54 1 14 0
[5Y - 10Y [ 40 1 0 0 1 0 0 501 38 109 -12 0 0 40 0
[10Y - more 3 3 0 0 3 0 0 0 0 35 -2 0 0 0 0Tot 328 288 262 0 26 0 0 606 42 548 -22 212 2 276 -2
[ 0 - 3M [ 383 366 0 0 132 0 235 1,538 17 1,558 -41 75 0 52 0
[ 3M - 1Y [ 178 97 0 0 97 0 0 1,648 79 1,850 -83 611 4 606 -4
[ 1Y - 2Y [ 367 272 277 0 -5 0 0 1,315 50 1,450 -85 447 5 425 -6
[ 2Y - 3Y [ 243 106 139 0 -33 0 0 1,960 105 1,557 -51 244 3 496 -5
[3Y - 5Y [ 1,227 1,102 158 872 72 0 0 2,067 59 387 -3 1,465 42 1,439 -41
[5Y - 10Y [ 2,416 2,000 1,001 1,223 -225 0 0 15 1 0 0 415 14 336 -9
[10Y - more 2,366 1,705 2 1,438 266 0 0 29 1 160 -14 0 0 0 0Tot 7,181 5,647 1,576 3,533 303 0 235 8,571 311 6,964 -278 3,259 68 3,354 -66
Portugal
Romania
Slovakia
Slovenia
Spain
Sweden
United Kingdom

2016 EU-wide Stress Test: Sovereign
(mln EUR)
Deutsche Bank AG
31/12/2015
Residual Maturity Country / Region
GROSS DIRECT LONG
EXPOSURES
(accounting value gross
of provisions)
(1)
NET DIRECT EXPOSURES
(accounting value gross of provisions)
(1)
Notional value Fair-value (+) Fair-value (-) Notional value Fair-value (+)
DIRECT SOVEREIGN EXPOSURES IN DERIVATIVES (1) INDIRECT SOVEREIGN EXPOSURES (3) (on and off balance sheet)
Derivatives with positive fair value Derivatives with negative fair value Derivatives with positive fair value Derivatives with negative fair value
Notional value Fair-value (-)Notional valueof which: Loans and
receivablesof which: AFS
of which: FVO
(designated at fair
value through
profit&loss)
of which: HFT
(2)of which: HTM
Austria
[ 0 - 3M [ 0 0 0 0 0 0 0 0 0 0 0 28 0 4 0
[ 3M - 1Y [ 1 1 0 0 1 0 0 0 0 0 0 5 0 5 0
[ 1Y - 2Y [ 0 0 0 0 0 0 0 0 0 0 0 1 0 26 -1
[ 2Y - 3Y [ 0 0 0 0 0 0 0 0 0 0 0 17 1 49 -1
[3Y - 5Y [ 1 1 0 0 1 0 0 0 0 0 0 0 0 4 0
[5Y - 10Y [ 0 -4 0 0 -4 0 0 0 0 0 0 0 0 0 0
[10Y - more 0 0 0 0 0 0 0 0 0 0 0 0 0 0 0Tot 2 -2 0 0 -2 0 0 0 0 0 0 51 2 87 -2
[ 0 - 3M [ 0 0 0 0 0 0 0 0 0 0 0 0 0 0 0
[ 3M - 1Y [ 0 0 0 0 0 0 0 0 0 0 0 0 0 0 0
[ 1Y - 2Y [ 0 0 0 0 0 0 0 0 0 0 0 0 0 0 0
[ 2Y - 3Y [ 0 0 0 0 0 0 0 0 0 0 0 0 0 0 0
[3Y - 5Y [ 0 0 0 0 0 0 0 0 0 0 0 0 0 0 0
[5Y - 10Y [ 0 0 0 0 0 0 0 0 0 0 0 0 0 0 0
[10Y - more 0 0 0 0 0 0 0 0 0 0 0 0 0 0 0Tot 0 0 0 0 0 0 0 0 0 0 0 0 0 0 0
[ 0 - 3M [ 0 0 0 0 0 0 0 0 0 0 0 0 0 0 0
[ 3M - 1Y [ 0 0 0 0 0 0 0 0 0 0 0 160 0 131 -1
[ 1Y - 2Y [ 0 -1 0 0 -1 0 0 0 0 0 0 11 0 117 0
[ 2Y - 3Y [ 0 0 0 0 0 0 0 0 0 0 0 0 0 28 0
[3Y - 5Y [ 0 0 0 0 0 0 0 0 0 0 0 33 1 25 0
[5Y - 10Y [ 4 4 0 0 4 0 0 0 0 0 0 0 0 9 0
[10Y - more 0 0 0 0 0 0 0 0 0 0 0 0 0 0 0Tot 4 3 0 0 3 0 0 0 0 0 0 204 1 310 -1
[ 0 - 3M [ 232 233 223 0 2 0 8 74 1 92 -4 352 1 573 -1
[ 3M - 1Y [ 182 158 152 0 6 0 0 340 25 67 -1 717 5 1,003 -7
[ 1Y - 2Y [ 134 134 112 0 22 0 0 21 1 334 -18 577 8 587 -9
[ 2Y - 3Y [ 289 177 163 0 -4 0 17 72 5 0 0 606 13 796 -13
[3Y - 5Y [ 400 169 139 0 30 0 0 169 18 104 -14 740 19 753 -18
[5Y - 10Y [ 764 124 94 0 30 0 0 199 35 216 -18 8 0 19 -1
[10Y - more 337 -147 0 0 -147 0 0 55 19 26 -1 0 0 0 0Tot 2,338 848 884 0 -62 0 25 930 104 839 -56 3,001 46 3,730 -49
[ 0 - 3M [ 1,059 953 0 918 0 0 35 1,628 108 2,657 -106 0 0 0 0
[ 3M - 1Y [ 25 -3 0 0 -3 0 0 2,373 37 4,435 -190 0 0 0 0
[ 1Y - 2Y [ 12 -1 0 0 -1 0 0 147 12 66 -5 0 0 0 0
[ 2Y - 3Y [ 90 49 28 0 22 0 0 525 40 624 -47 0 0 0 0
[3Y - 5Y [ 544 59 62 0 -3 0 0 3,348 464 1,165 -192 0 0 0 0
[5Y - 10Y [ 394 393 381 0 12 0 0 69 1 289 -44 0 0 0 0
[10Y - more 237 46 0 0 46 0 0 425 163 46 0 0 0 0 0Tot 2,361 1,495 471 918 72 0 35 8,516 826 9,282 -584 0 0 0 0
[ 0 - 3M [ 0 0 0 0 0 0 0 2 0 0 0 0 0 0 0
[ 3M - 1Y [ 2 2 0 0 2 0 0 0 0 0 0 8 0 9 0
[ 1Y - 2Y [ 0 0 0 0 0 0 0 0 0 0 0 14 0 11 0
[ 2Y - 3Y [ 0 0 0 0 0 0 0 0 0 0 0 0 0 9 0
[3Y - 5Y [ 0 0 0 0 0 0 0 0 0 195 -4 0 0 0 0
[5Y - 10Y [ 0 0 0 0 0 0 0 0 0 0 0 0 0 0 0
[10Y - more 0 0 0 0 0 0 0 0 0 0 0 0 0 0 0Tot 3 3 0 0 3 0 0 2 0 195 -4 22 0 29 0
[ 0 - 3M [ 286 278 0 0 278 0 0 381 7 0 0 95 0 120 0
[ 3M - 1Y [ 278 272 0 0 272 0 0 391 4 0 0 191 1 226 -2
[ 1Y - 2Y [ 121 78 0 0 78 0 0 413 9 673 -45 280 4 342 -5
[ 2Y - 3Y [ 312 114 8 0 106 0 0 648 82 2,409 -24 699 14 823 -12
[3Y - 5Y [ 661 498 8 0 490 0 0 652 48 280 -15 277 8 297 -8
[5Y - 10Y [ 591 2 0 0 2 0 0 1,514 196 1,040 -62 136 4 62 -2
[10Y - more 816 192 0 0 192 0 0 469 40 10 -2 0 0 5 0Tot 3,064 1,434 16 0 1,419 0 0 4,469 386 4,411 -149 1,679 32 1,875 -29
Liechtenstein
Iceland
Norway
Australia
Canada
Hong Kong
Japan

2016 EU-wide Stress Test: Sovereign
(mln EUR)
Deutsche Bank AG
31/12/2015
Residual Maturity Country / Region
GROSS DIRECT LONG
EXPOSURES
(accounting value gross
of provisions)
(1)
NET DIRECT EXPOSURES
(accounting value gross of provisions)
(1)
Notional value Fair-value (+) Fair-value (-) Notional value Fair-value (+)
DIRECT SOVEREIGN EXPOSURES IN DERIVATIVES (1) INDIRECT SOVEREIGN EXPOSURES (3) (on and off balance sheet)
Derivatives with positive fair value Derivatives with negative fair value Derivatives with positive fair value Derivatives with negative fair value
Notional value Fair-value (-)Notional valueof which: Loans and
receivablesof which: AFS
of which: FVO
(designated at fair
value through
profit&loss)
of which: HFT
(2)of which: HTM
Austria
[ 0 - 3M [ 5,973 1,317 28 100 842 0 347 2,782 6 4,357 -60 626 11 79 -11
[ 3M - 1Y [ 2,578 942 87 26 825 0 5 8,040 34 6,803 -74 77 65 139 -3
[ 1Y - 2Y [ 3,763 1,811 28 480 1,301 0 1 3,412 3 6,359 -183 33 1 68 0
[ 2Y - 3Y [ 1,562 -491 19 0 -532 0 22 7,390 101 7,931 -389 186 2 146 -24
[3Y - 5Y [ 2,486 291 0 17 269 0 5 8,623 304 3,865 -81 99 5 243 -2
[5Y - 10Y [ 9,056 5,673 2,716 1,552 1,404 0 1 13,066 1,013 5,979 -198 523 465 92 -1
[10Y - more 12,810 10,187 4 872 9,122 0 190 7,384 959 5,003 -1,071 0 19 269 0Tot 38,229 19,729 2,882 3,046 13,230 0 571 50,696 2,421 40,297 -2,058 1,544 568 1,037 -41
[ 0 - 3M [ 762 754 0 462 225 0 67 3,349 7 731 -47 128 0 150 0
[ 3M - 1Y [ 107 106 0 0 106 0 0 670 1 69 0 1,111 6 1,053 -6
[ 1Y - 2Y [ 10 10 0 0 10 0 0 255 0 0 0 735 8 1,095 -11
[ 2Y - 3Y [ 150 147 0 0 147 0 0 28 2 0 0 1,113 12 1,361 -13
[3Y - 5Y [ 15 15 0 0 15 0 0 123 0 0 0 3,369 41 2,901 -40
[5Y - 10Y [ 16 1 0 0 1 0 0 1,498 15 0 0 333 7 258 -8
[10Y - more 0 0 0 0 0 0 0 0 0 694 -46 0 0 0 0Tot 1,059 1,034 0 462 504 0 67 5,924 25 1,494 -93 6,789 75 6,817 -79
[ 0 - 3M [ 15 2 5 0 -2 0 0 3,096 10 2,417 -49 0 0 0 0
[ 3M - 1Y [ 46 3 13 0 -11 0 0 2,928 32 6,243 -62 0 0 0 0
[ 1Y - 2Y [ 199 144 0 0 144 0 0 1,867 54 9,205 -134 0 0 0 0
[ 2Y - 3Y [ 86 34 5 0 29 0 0 2,124 51 4,478 -106 0 0 0 0
[3Y - 5Y [ 104 81 72 0 9 0 0 653 15 596 -14 0 0 0 0
[5Y - 10Y [ 155 125 84 0 41 0 0 47 1 0 0 0 0 0 0
[10Y - more 88 -37 0 0 -37 0 0 226 68 23 0 0 0 0 0Tot 691 352 179 0 173 0 0 10,942 231 22,962 -365 0 0 0 0
[ 0 - 3M [ 931 915 5 0 811 0 98 1,069 14 279 -12 331 1 345 -1[ 3M - 1Y [ 1,121 1,109 0 46 990 0 73 1,958 0 889 -38 890 7 721 -4
[ 1Y - 2Y [ 425 408 0 0 408 0 0 21 8 1,147 -69 1,176 13 1,088 -12
[ 2Y - 3Y [ 119 111 0 0 111 0 0 151 6 398 -4 1,591 32 1,673 -32
[3Y - 5Y [ 249 70 0 0 70 0 0 718 106 142 -2 2,338 49 2,380 -50
[5Y - 10Y [ 239 9 0 0 9 0 0 216 41 1,019 -44 1,026 21 1,273 -19
[10Y - more 212 131 0 0 131 0 0 244 15 170 -2 117 1 37 0Tot 3,295 2,753 5 46 2,531 0 171 4,378 191 4,044 -170 7,468 124 7,517 -119
[ 0 - 3M [ 0 -12 0 0 -12 0 0 0 0 0 0 168 1 214 -1[ 3M - 1Y [ 88 83 0 0 -2 0 85 95 2 0 0 1,105 14 757 -10
[ 1Y - 2Y [ 114 112 0 0 37 0 75 75 2 0 0 1,791 33 1,292 -25
[ 2Y - 3Y [ 4 4 0 0 4 0 0 0 0 0 0 1,455 44 1,194 -46
[3Y - 5Y [ 88 67 0 0 67 0 0 0 9 0 0 3,492 232 3,275 -241
[5Y - 10Y [ 94 80 0 0 77 0 3 0 0 0 0 173 12 162 -22
[10Y - more 12 -6 0 0 -6 0 0 12 0 0 0 0 0 12 0Tot 400 329 0 0 166 0 163 182 12 0 0 8,185 336 6,906 -345
[ 0 - 3M [ 5 0 0 0 0 0 0 0 0 0 0 101 0 77 0
[ 3M - 1Y [ 1 1 0 0 1 0 0 14 0 0 0 89 1 174 -1
[ 1Y - 2Y [ 0 -12 0 0 -12 0 0 0 0 0 0 353 4 278 -3
[ 2Y - 3Y [ 0 0 0 0 0 0 0 0 0 0 0 215 8 277 -5
[3Y - 5Y [ 239 217 0 0 -11 0 228 0 0 0 0 146 3 86 -9
[5Y - 10Y [ 10 -27 0 0 -27 0 0 0 0 0 0 0 0 14 0
[10Y - more 270 270 0 0 21 0 249 0 0 0 0 0 0 0 0Tot 525 449 0 0 -28 0 477 14 0 0 0 905 16 905 -18
[ 0 - 3M [ 146 139 0 0 84 0 55 1 1 0 0 1,081 34 1,187 -26[ 3M - 1Y [ 618 617 0 0 545 0 72 0 0 0 0 3,798 191 3,538 -187
[ 1Y - 2Y [ 214 176 0 0 120 0 56 81 36 50 -5 4,469 545 4,609 -594
[ 2Y - 3Y [ 109 79 0 0 40 0 39 0 0 0 0 4,141 394 4,051 -480
[3Y - 5Y [ 296 134 4 0 60 0 70 345 120 6 -1 14,946 1,794 15,109 -1,908
[5Y - 10Y [ 574 419 0 0 196 0 223 180 35 72 0 2,539 676 2,146 -759
[10Y - more 467 395 0 0 343 0 52 168 37 58 -4 50 7 150 -12Tot 2,423 1,960 4 0 1,387 0 569 776 229 186 -10 31,025 3,642 30,790 -3,965
Latin America and the
Caribbean
Middle East
U.S.
China
Switzerland
Other advanced
economies non EEA
Other Central and eastern
Europe countries non EEA
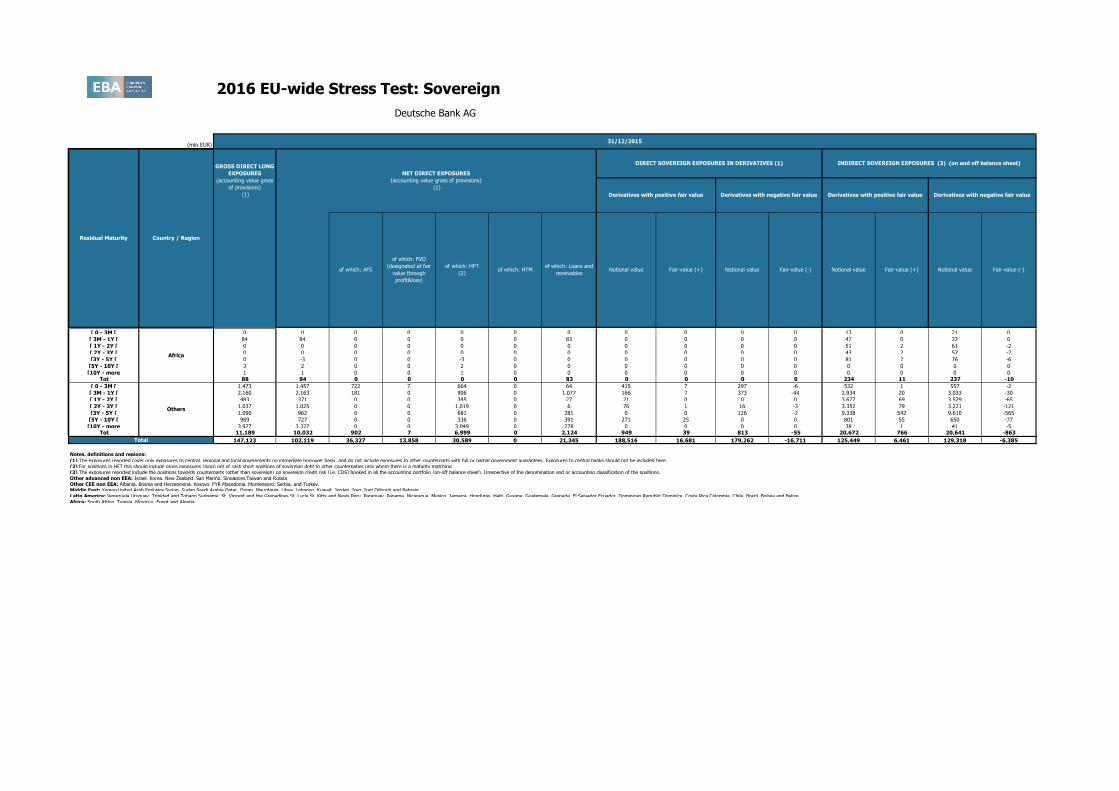
2016 EU-wide Stress Test: Sovereign
(mln EUR)
Deutsche Bank AG
31/12/2015
Residual Maturity Country / Region
GROSS DIRECT LONG
EXPOSURES
(accounting value gross
of provisions)
(1)
NET DIRECT EXPOSURES
(accounting value gross of provisions)
(1)
Notional value Fair-value (+) Fair-value (-) Notional value Fair-value (+)
DIRECT SOVEREIGN EXPOSURES IN DERIVATIVES (1) INDIRECT SOVEREIGN EXPOSURES (3) (on and off balance sheet)
Derivatives with positive fair value Derivatives with negative fair value Derivatives with positive fair value Derivatives with negative fair value
Notional value Fair-value (-)Notional valueof which: Loans and
receivablesof which: AFS
of which: FVO
(designated at fair
value through
profit&loss)
of which: HFT
(2)of which: HTM
Austria
[ 0 - 3M [ 0 0 0 0 0 0 0 0 0 0 0 13 0 21 0
[ 3M - 1Y [ 84 84 0 0 0 0 83 0 0 0 0 47 0 22 0
[ 1Y - 2Y [ 0 0 0 0 0 0 0 0 0 0 0 51 2 61 -2
[ 2Y - 3Y [ 0 0 0 0 0 0 0 0 0 0 0 43 2 57 -2
[3Y - 5Y [ 0 -3 0 0 -3 0 0 0 0 0 0 81 7 76 -6
[5Y - 10Y [ 3 2 0 0 2 0 0 0 0 0 0 0 0 0 0
[10Y - more 1 1 0 0 1 0 0 0 0 0 0 0 0 0 0Tot 88 84 0 0 0 0 83 0 0 0 0 234 11 237 -10
[ 0 - 3M [ 1,473 1,457 722 7 664 0 64 415 7 297 -6 532 1 557 -2
[ 3M - 1Y [ 2,160 2,163 181 0 906 0 1,077 166 7 373 -44 2,934 20 3,033 -30
[ 1Y - 2Y [ 483 371 0 0 345 0 27 21 0 0 0 3,677 69 3,529 -65
[ 2Y - 3Y [ 1,037 1,025 0 0 1,019 0 6 76 1 16 -3 3,352 79 3,221 -121
[3Y - 5Y [ 1,090 962 0 0 681 0 281 0 0 126 -2 9,338 542 9,610 -565
[5Y - 10Y [ 969 727 0 0 336 0 391 271 25 0 0 801 55 650 -77
[10Y - more 3,977 3,327 0 0 3,049 0 278 0 0 0 0 38 1 41 -5Tot 11,189 10,032 902 7 6,999 0 2,124 949 39 813 -55 20,672 766 20,641 -863
147,123 102,119 36,327 13,858 30,589 0 21,345 188,516 16,681 179,262 -16,711 125,449 6,461 129,318 -6,385
Notes, definitions and regions:
(1) The exposures reported cover only exposures to central, regional and local governments on immediate borrower basis, and do not include exposures to other counterparts with full or partial government guarantees. Exposures to central banks should not be included here.(2) For positions in HFT this should include gross exposures (long) net of cash short positions of sovereign debt to other counterpaties only where there is a maturity matching(3) The exposures reported include the positions towards counterparts (other than sovereign) on sovereign credit risk (i.e. CDS) booked in all the accounting portfolio (on-off balance sheet). Irrespective of the denomination and or accounting classification of the positions.Other advanced non EEA: Israel, Korea, New Zealand, San Marino, Singapore,Taiwan and RussiaOther CEE non EEA: Albania, Bosnia and Herzegovina, Kosovo, FYR Macedonia, Montenegro, Serbia, and Turkey.Middle East: Yemen,United Arab Emirates,Syrian ,Sudan,Saudi Arabia,Qatar ,Oman ,Mauritania ,Libya ,Lebanon ,Kuwait ,Jordan ,Iraq ,Iran,Djibouti and Bahrain.Latin America: Venezuela,Uruguay ,Trinidad and Tobago,Suriname ,St. Vincent and the Grenadines,St. Lucia,St. Kitts and Nevis,Peru ,Paraguay ,Panama ,Nicaragua ,Mexico ,Jamaica ,Honduras ,Haiti ,Guyana ,Guatemala ,Grenada ,El Salvador,Ecuador ,Dominican Republic,Dominica ,Costa Rica,Colombia ,Chile ,Brazil ,Bolivia and Belize.Africa: South Africa, Tunisia ,Morocco ,Egypt and Algeria.
Africa
Others
Total
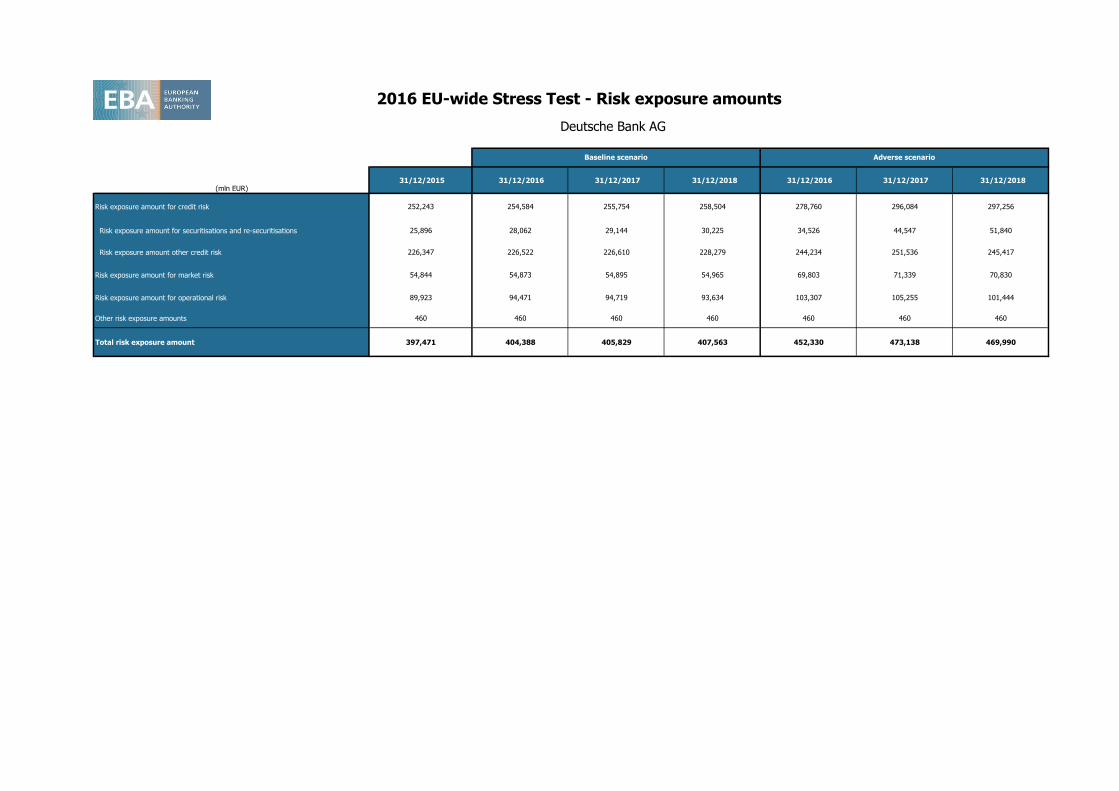
2016 EU-wide Stress Test - Risk exposure amounts
(mln EUR) 31/12/2015 31/12/2016 31/12/2017 31/12/2018 31/12/2016 31/12/2017 31/12/2018
Risk exposure amount for credit risk 252,243 254,584 255,754 258,504 278,760 296,084 297,256
Risk exposure amount for securitisations and re-securitisations 25,896 28,062 29,144 30,225 34,526 44,547 51,840
Risk exposure amount other credit risk 226,347 226,522 226,610 228,279 244,234 251,536 245,417
Risk exposure amount for market risk 54,844 54,873 54,895 54,965 69,803 71,339 70,830
Risk exposure amount for operational risk 89,923 94,471 94,719 93,634 103,307 105,255 101,444
Other risk exposure amounts 460 460 460 460 460 460 460
Total risk exposure amount 397,471 404,388 405,829 407,563 452,330 473,138 469,990
Baseline scenario Adverse scenario
Deutsche Bank AG
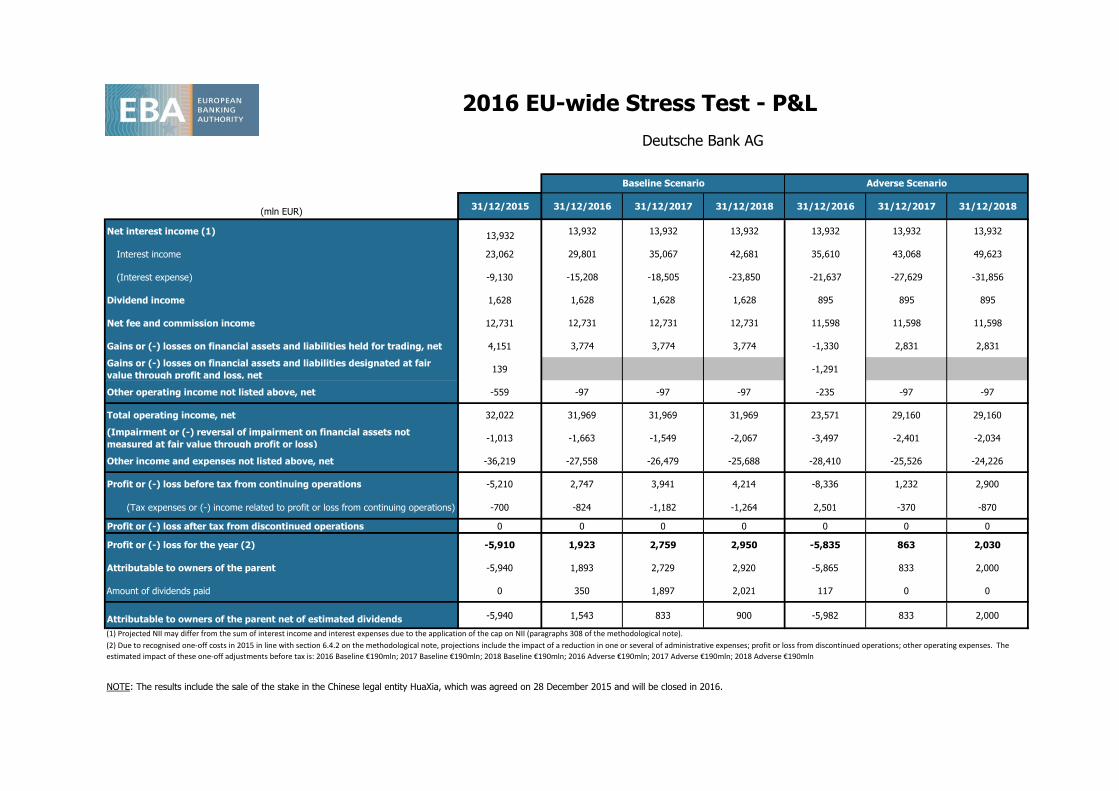
2016 EU-wide Stress Test - P&L
31/12/2015 31/12/2016 31/12/2017 31/12/2018 31/12/2016 31/12/2017 31/12/2018
Net interest income (1) 13,93213,932 13,932 13,932 13,932 13,932 13,932
Interest income 23,062 29,801 35,067 42,681 35,610 43,068 49,623
(Interest expense) -9,130 -15,208 -18,505 -23,850 -21,637 -27,629 -31,856
Dividend income 1,628 1,628 1,628 1,628 895 895 895
Net fee and commission income 12,731 12,731 12,731 12,731 11,598 11,598 11,598
Gains or (-) losses on financial assets and liabilities held for trading, net 4,151 3,774 3,774 3,774 -1,330 2,831 2,831
Gains or (-) losses on financial assets and liabilities designated at fair
value through profit and loss, net139 -1,291
Other operating income not listed above, net -559 -97 -97 -97 -235 -97 -97
Total operating income, net 32,022 31,969 31,969 31,969 23,571 29,160 29,160
(Impairment or (-) reversal of impairment on financial assets not
measured at fair value through profit or loss)-1,013 -1,663 -1,549 -2,067 -3,497 -2,401 -2,034
Other income and expenses not listed above, net -36,219 -27,558 -26,479 -25,688 -28,410 -25,526 -24,226
Profit or (-) loss before tax from continuing operations -5,210 2,747 3,941 4,214 -8,336 1,232 2,900
(Tax expenses or (-) income related to profit or loss from continuing operations) -700 -824 -1,182 -1,264 2,501 -370 -870
Profit or (-) loss after tax from discontinued operations 0 0 0 0 0 0 0
Profit or (-) loss for the year (2) -5,910 1,923 2,759 2,950 -5,835 863 2,030
Attributable to owners of the parent -5,940 1,893 2,729 2,920 -5,865 833 2,000
Amount of dividends paid 0 350 1,897 2,021 117 0 0
Attributable to owners of the parent net of estimated dividends -5,940 1,543 833 900 -5,982 833 2,000
Deutsche Bank AG
(1) Projected NII may differ from the sum of interest income and interest expenses due to the application of the cap on NII (paragraphs 308 of the methodological note).
(2) Due to recognised one‐off costs in 2015 in line with section 6.4.2 on the methodological note, projections include the impact of a reduction in one or several of administrative expenses; profit or loss from discontinued operations; other operating expenses. The
estimated impact of these one‐off adjustments before tax is: 2016 Baseline €190mln; 2017 Baseline €190mln; 2018 Baseline €190mln; 2016 Adverse €190mln; 2017 Adverse €190mln; 2018 Adverse €190mln
NOTE: The results include the sale of the stake in the Chinese legal entity HuaXia, which was agreed on 28 December 2015 and will be closed in 2016.
(mln EUR)
Baseline Scenario Adverse Scenario
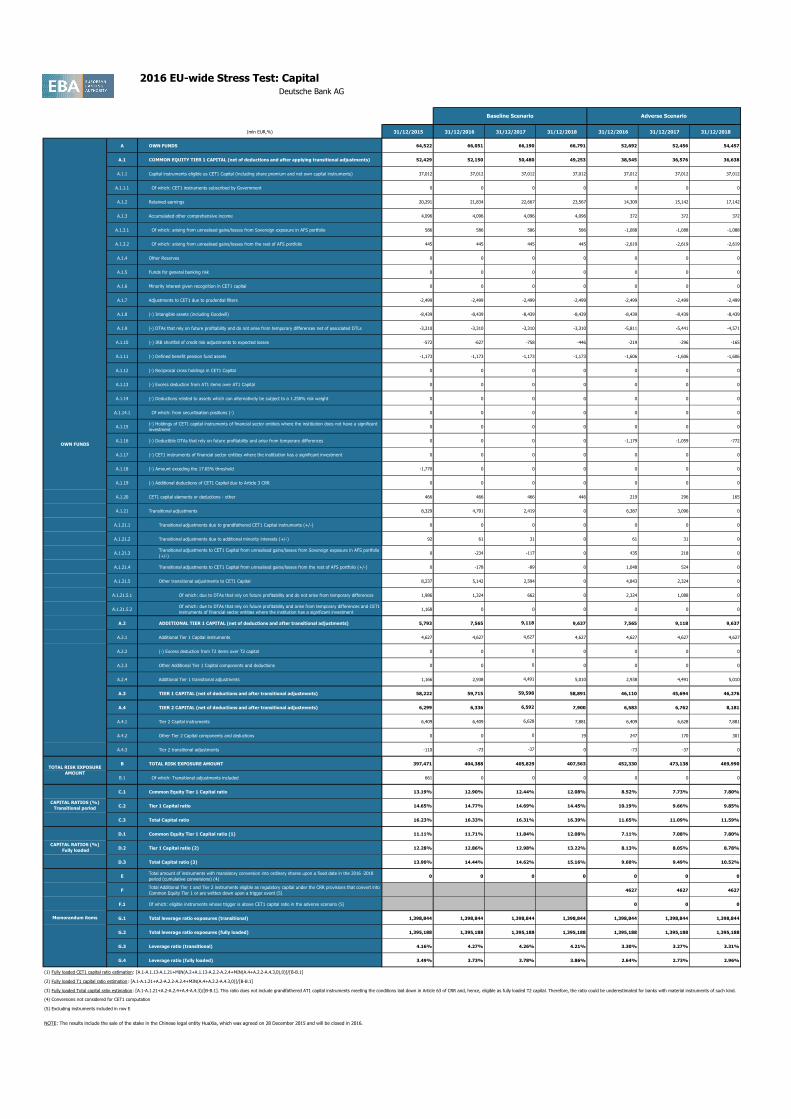
2016 EU-wide Stress Test: Capital
(mln EUR,%) 31/12/2015 31/12/2016 31/12/2017 31/12/2018 31/12/2016 31/12/2017 31/12/2018
A OWN FUNDS 64,522 66,051 66,190 66,791 52,692 52,456 54,457
A.1 COMMON EQUITY TIER 1 CAPITAL (net of deductions and after applying transitional adjustments) 52,429 52,150 50,480 49,253 38,545 36,576 36,638
A.1.1 Capital instruments eligible as CET1 Capital (including share premium and net own capital instruments) 37,012 37,012 37,012 37,012 37,012 37,012 37,012
A.1.1.1 Of which: CET1 instruments subscribed by Government 0 0 0 0 0 0 0
A.1.2 Retained earnings 20,291 21,834 22,667 23,567 14,309 15,142 17,142
A.1.3 Accumulated other comprehensive income 4,096 4,096 4,096 4,096 372 372 372
A.1.3.1 Of which: arising from unrealised gains/losses from Sovereign exposure in AFS portfolio 586 586 586 586 -1,088 -1,088 -1,088
A.1.3.2 Of which: arising from unrealised gains/losses from the rest of AFS portfolio 445 445 445 445 -2,619 -2,619 -2,619
A.1.4 Other Reserves 0 0 0 0 0 0 0
A.1.5 Funds for general banking risk 0 0 0 0 0 0 0
A.1.6 Minority interest given recognition in CET1 capital 0 0 0 0 0 0 0
A.1.7 Adjustments to CET1 due to prudential filters -2,499 -2,499 -2,499 -2,499 -2,499 -2,499 -2,499
A.1.8 (-) Intangible assets (including Goodwill) -8,439 -8,439 -8,439 -8,439 -8,439 -8,439 -8,439
A.1.9 (-) DTAs that rely on future profitability and do not arise from temporary differences net of associated DTLs -3,310 -3,310 -3,310 -3,310 -5,811 -5,441 -4,571
A.1.10 (-) IRB shortfall of credit risk adjustments to expected losses -572 -627 -758 -446 -219 -296 -165
A.1.11 (-) Defined benefit pension fund assets -1,173 -1,173 -1,173 -1,173 -1,606 -1,606 -1,606
A.1.12 (-) Reciprocal cross holdings in CET1 Capital 0 0 0 0 0 0 0
A.1.13 (-) Excess deduction from AT1 items over AT1 Capital 0 0 0 0 0 0 0
A.1.14 (-) Deductions related to assets which can alternatively be subject to a 1.250% risk weight 0 0 0 0 0 0 0
A.1.14.1 Of which: from securitisation positions (-) 0 0 0 0 0 0 0
A.1.15(-) Holdings of CET1 capital instruments of financial sector entities where the institiution does not have a significant
investment0 0 0 0 0 0 0
A.1.16 (-) Deductible DTAs that rely on future profitability and arise from temporary differences 0 0 0 0 -1,179 -1,059 -772
A.1.17 (-) CET1 instruments of financial sector entities where the institiution has a significant investment 0 0 0 0 0 0 0
A.1.18 (-) Amount exceding the 17.65% threshold -1,770 0 0 0 0 0 0
A.1.19 (-) Additional deductions of CET1 Capital due to Article 3 CRR 0 0 0 0 0 0 0
A.1.20 CET1 capital elements or deductions - other 466 466 466 446 219 296 165
A.1.21 Transitional adjustments 8,329 4,791 2,419 0 6,387 3,096 0
A.1.21.1 Transitional adjustments due to grandfathered CET1 Capital instruments (+/-) 0 0 0 0 0 0 0
A.1.21.2 Transitional adjustments due to additional minority interests (+/-) 92 61 31 0 61 31 0
A.1.21.3Transitional adjustments to CET1 Capital from unrealised gains/losses from Sovereign exposure in AFS portfolio
(+/-)0 -234 -117 0 435 218 0
A.1.21.4 Transitional adjustments to CET1 Capital from unrealised gains/losses from the rest of AFS portfolio (+/-) 0 -178 -89 0 1,048 524 0
A.1.21.5 Other transitional adjustments to CET1 Capital 8,237 5,142 2,594 0 4,843 2,324 0
A.1.21.5.1 Of which: due to DTAs that rely on future profitability and do not arise from temporary differences 1,986 1,324 662 0 2,324 1,088 0
A.1.21.5.2Of which: due to DTAs that rely on future profitability and arise from temporary differences and CET1
instruments of financial sector entities where the institution has a significant investment1,168 0 0 0 0 0 0
A.2 ADDITIONAL TIER 1 CAPITAL (net of deductions and after transitional adjustments) 5,793 7,565 9,118 9,637 7,565 9,118 9,637
A.2.1 Additional Tier 1 Capital instruments 4,627 4,627 4,627 4,627 4,627 4,627 4,627
A.2.2 (-) Excess deduction from T2 items over T2 capital 0 0 0 0 0 0 0
A.2.3 Other Additional Tier 1 Capital components and deductions 0 0 0 0 0 0 0
A.2.4 Additional Tier 1 transitional adjustments 1,166 2,938 4,491 5,010 2,938 4,491 5,010
A.3 TIER 1 CAPITAL (net of deductions and after transitional adjustments) 58,222 59,715 59,598 58,891 46,110 45,694 46,276
A.4 TIER 2 CAPITAL (net of deductions and after transitional adjustments) 6,299 6,336 6,592 7,900 6,583 6,762 8,181
A.4.1 Tier 2 Capital instruments 6,409 6,409 6,628 7,881 6,409 6,628 7,881
A.4.2 Other Tier 2 Capital components and deductions 0 0 0 19 247 170 301
A.4.3 Tier 2 transitional adjustments -110 -73 -37 0 -73 -37 0
B TOTAL RISK EXPOSURE AMOUNT 397,471 404,388 405,829 407,563 452,330 473,138 469,990
B.1 Of which: Transitional adjustments included 661 0 0 0 0 0 0
C.1 Common Equity Tier 1 Capital ratio 13.19% 12.90% 12.44% 12.08% 8.52% 7.73% 7.80%
C.2 Tier 1 Capital ratio 14.65% 14.77% 14.69% 14.45% 10.19% 9.66% 9.85%
C.3 Total Capital ratio 16.23% 16.33% 16.31% 16.39% 11.65% 11.09% 11.59%
D.1 Common Equity Tier 1 Capital ratio (1) 11.11% 11.71% 11.84% 12.08% 7.11% 7.08% 7.80%
D.2 Tier 1 Capital ratio (2) 12.28% 12.86% 12.98% 13.22% 8.13% 8.05% 8.78%
D.3 Total Capital ratio (3) 13.90% 14.44% 14.62% 15.16% 9.60% 9.49% 10.52%
ETotal amount of instruments with mandatory conversion into ordinary shares upon a fixed date in the 2016 -2018
period (cumulative conversions) (4)0 0 0 0 0 0 0
FTotal Additional Tier 1 and Tier 2 instruments eligible as regulatory capital under the CRR provisions that convert into
Common Equity Tier 1 or are written down upon a trigger event (5)4627 4627 4627
F.1 Of which: eligible instruments whose trigger is above CET1 capital ratio in the adverse scenario (5) 0 0 0
G.1 Total leverage ratio exposures (transitional) 1,398,844 1,398,844 1,398,844 1,398,844 1,398,844 1,398,844 1,398,844
G.2 Total leverage ratio exposures (fully loaded) 1,395,188 1,395,188 1,395,188 1,395,188 1,395,188 1,395,188 1,395,188
G.3 Leverage ratio (transitional) 4.16% 4.27% 4.26% 4.21% 3.30% 3.27% 3.31%
G.4 Leverage ratio (fully loaded) 3.49% 3.73% 3.78% 3.86% 2.64% 2.73% 2.96%
(1) Fully loaded CET1 capital ratio estimation: [A.1-A.1.13-A.1.21+MIN(A.2+A.1.13-A.2.2-A.2.4+MIN(A.4+A.2.2-A.4.3,0),0)]/[B-B.1]
(2) Fully loaded T1 capital ratio estimation: [A.1-A.1.21+A.2-A.2.2-A.2.4+MIN(A.4+A.2.2-A.4.3,0)]/[B-B.1]
(3) Fully loaded Total capital ratio estimation: [A.1-A.1.21+A.2-A.2.4+A.4-A.4.3)/[B-B.1]. This ratio does not include grandfathered AT1 capital instruments meeting the conditions laid down in Article 63 of CRR and, hence, eligible as fully loaded T2 capital. Therefore, the ratio could be underestimated for banks with material instruments of such kind.
(4) Conversions not considered for CET1 computation
(5) Excluding instruments included in row E
Deutsche Bank AG
OWN FUNDS
CAPITAL RATIOS (%)
Fully loaded
TOTAL RISK EXPOSURE
AMOUNT
NOTE: The results include the sale of the stake in the Chinese legal entity HuaXia, which was agreed on 28 December 2015 and will be closed in 2016.
Memorandum items
Baseline Scenario Adverse Scenario
CAPITAL RATIOS (%)
Transitional period
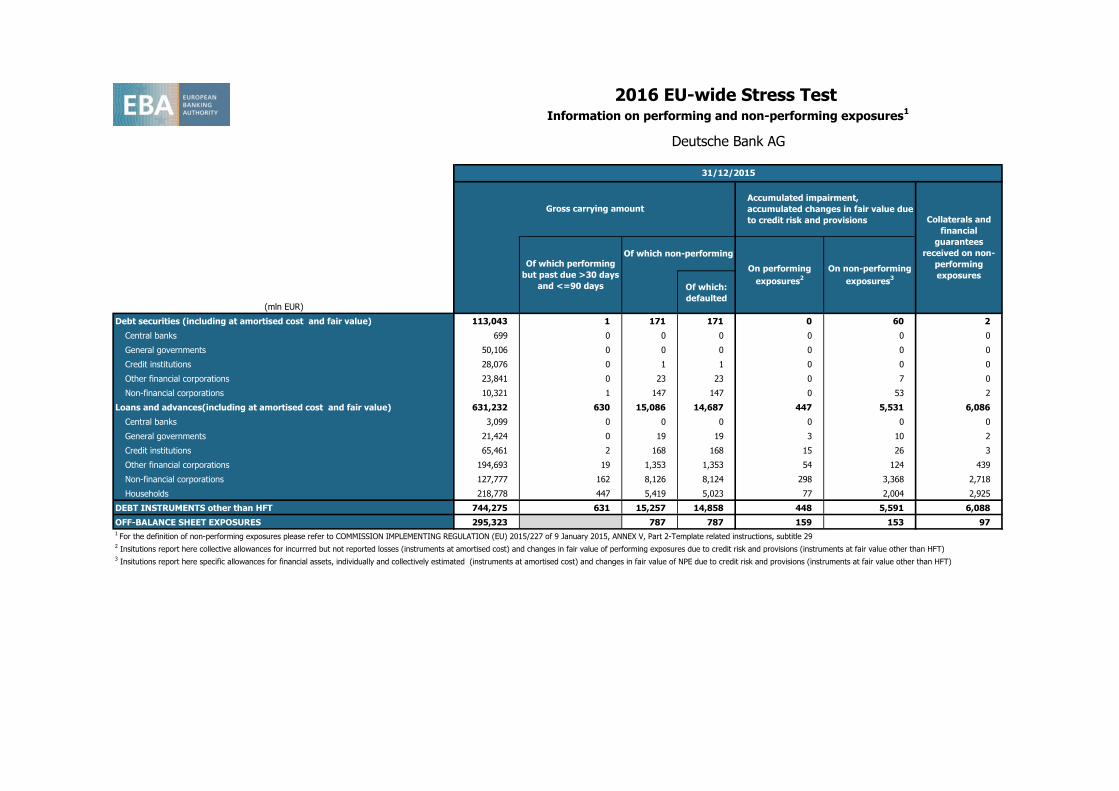
(mln EUR)
Of which:
defaulted
Debt securities (including at amortised cost and fair value) 113,043 1 171 171 0 60 2
Central banks 699 0 0 0 0 0 0
General governments 50,106 0 0 0 0 0 0
Credit institutions 28,076 0 1 1 0 0 0
Other financial corporations 23,841 0 23 23 0 7 0
Non-financial corporations 10,321 1 147 147 0 53 2
Loans and advances(including at amortised cost and fair value) 631,232 630 15,086 14,687 447 5,531 6,086
Central banks 3,099 0 0 0 0 0 0
General governments 21,424 0 19 19 3 10 2
Credit institutions 65,461 2 168 168 15 26 3
Other financial corporations 194,693 19 1,353 1,353 54 124 439
Non-financial corporations 127,777 162 8,126 8,124 298 3,368 2,718
Households 218,778 447 5,419 5,023 77 2,004 2,925
DEBT INSTRUMENTS other than HFT 744,275 631 15,257 14,858 448 5,591 6,088
OFF-BALANCE SHEET EXPOSURES 295,323 787 787 159 153 971 For the definition of non-performing exposures please refer to COMMISSION IMPLEMENTING REGULATION (EU) 2015/227 of 9 January 2015, ANNEX V, Part 2-Template related instructions, subtitle 29
2 Insitutions report here collective allowances for incurrred but not reported losses (instruments at amortised cost) and changes in fair value of performing exposures due to credit risk and provisions (instruments at fair value other than HFT)
3 Insitutions report here specific allowances for financial assets, individually and collectively estimated (instruments at amortised cost) and changes in fair value of NPE due to credit risk and provisions (instruments at fair value other than HFT)
On non-performing
exposures3
2016 EU-wide Stress Test Information on performing and non-performing exposures
1
31/12/2015
Gross carrying amount
Accumulated impairment,
accumulated changes in fair value due
to credit risk and provisions Collaterals and
financial
guarantees
received on non-
performing
exposures
Of which performing
but past due >30 days
and <=90 days
Of which non-performing
On performing
exposures2
Deutsche Bank AG
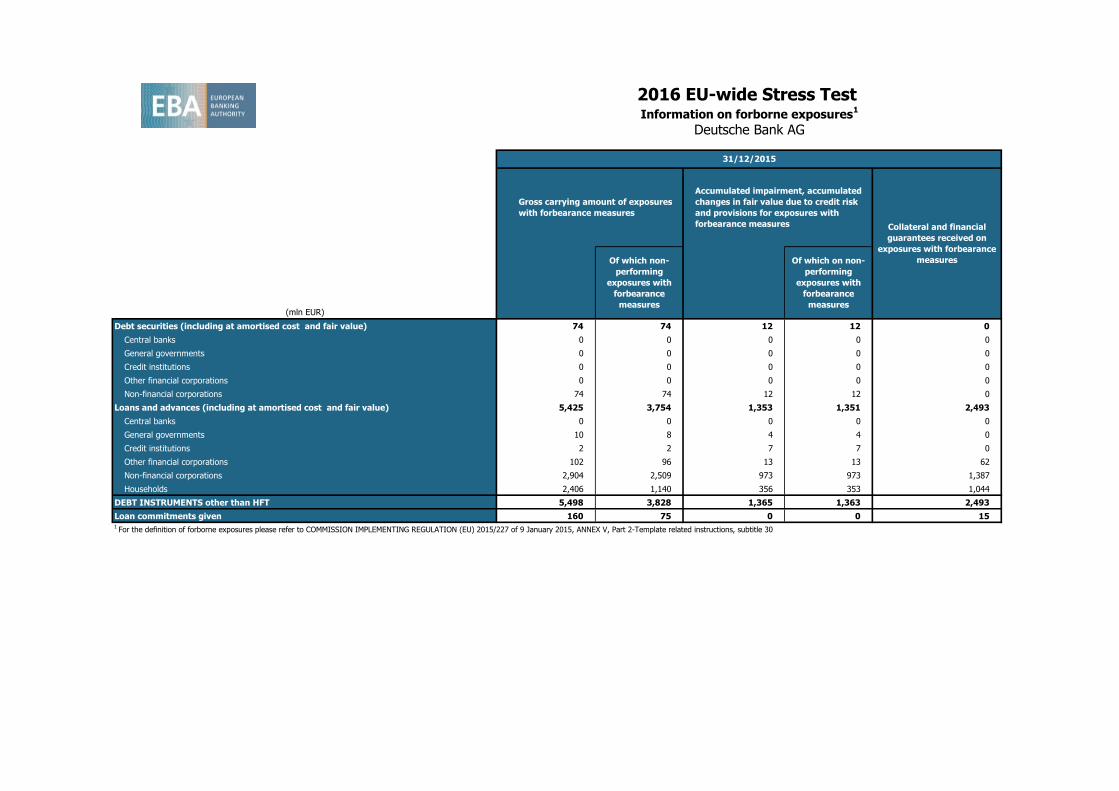
(mln EUR)
Debt securities (including at amortised cost and fair value) 74 74 12 12 0
Central banks 0 0 0 0 0
General governments 0 0 0 0 0
Credit institutions 0 0 0 0 0
Other financial corporations 0 0 0 0 0
Non-financial corporations 74 74 12 12 0
Loans and advances (including at amortised cost and fair value) 5,425 3,754 1,353 1,351 2,493
Central banks 0 0 0 0 0
General governments 10 8 4 4 0
Credit institutions 2 2 7 7 0
Other financial corporations 102 96 13 13 62
Non-financial corporations 2,904 2,509 973 973 1,387
Households 2,406 1,140 356 353 1,044
DEBT INSTRUMENTS other than HFT 5,498 3,828 1,365 1,363 2,493
Loan commitments given 160 75 0 0 151 For the definition of forborne exposures please refer to COMMISSION IMPLEMENTING REGULATION (EU) 2015/227 of 9 January 2015, ANNEX V, Part 2-Template related instructions, subtitle 30
2016 EU-wide Stress Test Information on forborne exposures
1
31/12/2015
Of which non-
performing
exposures with
forbearance
measures
Of which on non-
performing
exposures with
forbearance
measures
Gross carrying amount of exposures
with forbearance measures
Accumulated impairment, accumulated
changes in fair value due to credit risk
and provisions for exposures with
forbearance measures Collateral and financial
guarantees received on
exposures with forbearance
measures
Deutsche Bank AG