1-s2.0-S1440244004800045-main (1)
12
Training volume and strength and power development J Cronin & B Crewther sport Performance Research Centre, Auckland University of Technology, New Zealand. The purpose of this study was to determine if three training loads equated by volume differed in terms of the temporal, kinematic and kinetic characteristics of each set. Twelve experienced weightlifters (30.2_+10.6 years old and 75.8_+13.0 kg} performed three sets (6 x 30% 1RM, 3 x 60% 1RM and 2 x 90% 1RM) of ballistic squats on an instrumented supine squat machine. Repeated measures ANOVAand Tukey HSD post hoc comparisons were used to distinguish significant differences beiween the three training loads on a variety of temporal, kinematic and kinetic variables. Significantly {p< 0.05) greater total time under tension during the eccentric {41-53%) and concentric phases (27-31%) was observed for the 30% 1RM condition compared to the other two conditions. Similarly, the lighter loading intensity resulted in significantly greater total eccentric (9-19%) and concentric {14-24%) force output compared to the other two conditions. Greater total power output was associated with the 30% 1RM condition for both the eccentric (25-48%) and concentric (40- 69%) phases. Greater total work (9-24%) was also associated with the 30% 1RM condition. The 60% 1RM condition produced significantly greater total work, force and power compared to the 90% 1RM condition. However, greater concentric impulse (29-42%) was associated with the 90% 1RM condition. It is suggested that strength and power research needs to adopt a set kinematic and kinetic analysis approach within the research designs so that a better understanding of the nature of the neuromuscular adaptations elicited by different loading parameters is achieved. (J Sci Med Sport 2004;7:2:144-155 Introduction Muscular strength and power are important components of many athletic pursuits and everyday activities. Improving these two qualities therefore is the focus of strength, conditioning and rehabilitation practice. However, there is debate as to the most effective resistance strength training methods to develop strength and power. One key issue is which load, expressed as a percentage of one repetition maximum (% 1RM), best facilitates strength and power develop- ment. Loading the muscle with loads greater than 60-70% 1RM is thought fundamental to the development of maximal strength and an important stimulus for muscle hypertrophy 1-3. In strength-trained athletes even greater loading intensities (80-100% 1RM) are thought critical for the development of maximal strength 4. Though many studies have described the effect of load in inducing muscle growth and improving strength,the exact mechanism by which strength training elicits the synthesis of the contractile proteins to increase the cross sectional area (CSA) of muscle is yet to be determined a. The potential stimuli for increasing strength and CSA include hormonal, metabolic and mechanical factors 6,7. MacDougall 2 stated however that, whatever the exact 144
description
dtrd
Transcript of 1-s2.0-S1440244004800045-main (1)

Training volume and strength and power development
J Cronin & B Crewther
sport Performance Research Centre, Auckland University of Technology, New Zealand.
The purpose of this study was to determine if three training loads equated by volume differed in terms of the temporal, kinematic and kinetic characteristics of each set. Twelve experienced weightlifters (30.2_+10.6 years old and 75.8_+13.0 kg} performed three sets (6 x 30% 1RM, 3 x 60% 1RM and 2 x 90% 1RM) of ballistic squats on an instrumented supine squat machine. Repeated measures ANOVA and Tukey HSD post hoc comparisons were used to distinguish significant differences beiween the three training loads on a variety of temporal, kinematic and kinetic variables. Significantly {p< 0.05) greater total time under tension during the eccentric {41-53%) and concentric phases (27-31%) was observed for the 30% 1RM condition compared to the other two conditions. Similarly, the lighter loading intensity resulted in significantly greater total eccentric (9-19%) and concentric {14-24%) force output compared to the other two conditions. Greater total power output was associated with the 30% 1RM condition for both the eccentric (25-48%) and concentric (40- 69%) phases. Greater total work (9-24%) was also associated with the 30% 1RM condition. The 60% 1RM condition produced significantly greater total work, force and power compared to the 90% 1RM condition. However, greater concentric impulse (29-42%) was associated with the 90% 1RM condition. It is suggested that strength and power research needs to adopt a set kinematic and kinetic analysis approach within the research designs so that a better understanding of the nature of the neuromuscular adaptations elicited by different loading parameters is achieved.
(J Sci Med Sport 2004;7:2:144-155
Introduction Muscular strength and power are important components of many athletic p u r s u i t s a n d e v e r y d a y act iv i t ies . Improv ing t h e s e two qua l i t i e s the re fo re is t he focus of s t r eng th , c o n d i t i o n i n g a n d r e h a b i l i t a t i o n p rac t ice . However, t h e r e is d e b a t e a s to t he m o s t effective r e s i s t a n c e s t r e n g t h t r a i n i n g m e t h o d s to develop s t r e n g t h a n d power. One key i s s u e is w h i c h load, e x p r e s s e d a s a p e r c e n t a g e of one r epe t i t i on m a x i m u m (% 1RM), b e s t fac i l i t a tes s t r e n g t h a n d power develop- men t . Load ing the m u s c l e w i th l o a d s g r e a t e r t h a n 6 0 - 7 0 % 1RM is t h o u g h t f u n d a m e n t a l to t he d e v e l o p m e n t of m a x i m a l s t r e n g t h a n d a n i m p o r t a n t s t i m u l u s for m u s c l e h y p e r t r o p h y 1-3. In s t r e n g t h - t r a i n e d a t h l e t e s even g r e a t e r l oad ing i n t e n s i t i e s (80-100% 1RM) a re t h o u g h t c r i t ica l for t he d e v e l o p m e n t of m a x i m a l s t r e n g t h 4. T h o u g h m a n y s t u d i e s have d e s c r i b e d the effect of l oad in i n d u c i n g m u s c l e g rowth a n d improv ing s t r e n g t h , t h e e x a c t m e c h a n i s m b y w h i c h s t r e n g t h t r a i n i n g el ic i ts t he s y n t h e s i s of t he con t r ac t i l e p r o t e i n s to i n c r e a s e t he c r o s s s ec t iona l a r e a (CSA) of m u s c l e is y e t to be d e t e r m i n e d a. The p o t e n t i a l s t i m u l i for i n c r e a s i n g s t r e n g t h a n d CSA i n c l u d e h o r m o n a l , m e t a b o l i c a n d m e c h a n i c a l f ac to rs 6,7. MacDouga l l 2 s t a t e d however tha t , w h a t e v e r t he exac t
144

Training volume and strength and power development
m e c h a n i s m for s t imulat ing protein synthesis , loading intensity is the main factor tha t determines whether or not an increase in s t rength a n d / o r size will occur.
The impor tance of these higher loading intensities (>70% 1RM) in inducing maximal s t rength and hypertrophic changes however m a y be questioned in relation to research in this area. For example, m a x i m u m power training using a load of 30% 1RM was found to be equally effective in enhancing a variety of per formance measu re s (including bench press and squat 1RM strength) as compared to combined weight training (75-85% 1RM) and plyometric training. It was concluded tha t the 30% 1RM m a x i m u m power training resulted in significant s t rength gains, as the actual force ou tpu t was high due to a large acceleration component 8. Using a similar methodology, high force training (80- 85% 1RM) and high power training (30% 1RM) were found to be equally effect- ive in improving i/4 squa t 1RM and mid-thigh pull 1RM st rength 9. Similarly Dahl, Aaserud and J e n s e n 1° concluded tha t explosive s t rength training at 10% of 1RM was able to s t imulate muscle hyper t rophy and the hyper t rophy was of the same magni tude as tha t of t raining at 90% 1RM. Schmidtbleicher and Buehrle 11 compared the changes in force-time curves and cross-sect ional area of subjects who were allocated to a high load group (>90% MVC), a power group (45% MVC), a high repetition group (70% MVC) and a control group. After 12 weeks of training, similar changes in m a x i m u m force occurred in all the training groups (18-21%). Changes in cross-sect ional a rea were similar in the power and high load groups and superior in the high repetit ion group ll. An interesting research s tudy tha t raised quest ions as to the impor tance of load and tension in maximal s t rength development trained the elbow flexors of the non-dominan t a r m using loads of 15% (10 reps), 35% (7 reps) and 90% (2 reps) of 1RM 12. Training volume was equated by matching the total t ime under tension (as measured by EMG) between loads and subjects were encouraged to move their respective loads with maximal effort. After nine weeks of training, significant maximal s t rength gains were recorded (6-7%) bu t the differences between the light (15% 1RM) and heavy (90% 1RM) groups were non-sig- nificant. It was concluded by the au thors tha t the resul ts were not in conflict with the idea tha t high tension may be the s t imulus for increased maximal strength, albeit the high forces were of shor ter duration. It would seem from this l i terature tha t a m i n i m u m load or threshold tension is not as an impor tant t raining s t imulus as initially proposed.
Many of the discrepancies in the l i terature may be explained by research failing to equate training volume (load x repeti t ions x sets) between t rea tments groups. And, if training volume is equated, it is questionable whether or not other impor tan t temporal , Mnematic and kinetic variables are similar between t rea tments . Whilst there is a great deal of l i terature investigating the kine- mat ics and kinetics of a single repetit ion 13-17, there is no research to the knowledge of these au thors tha t has investigated kinemat ics and kinetics of sets. Research of this na ture would give bet ter insight into the changes and adapta t ions occurring with the repeated applicat ion of tha t training s t imulus and may provide a bet ter f ramework for unders tand ing some of the incon- sistencies cited earlier. Consequently, the purpose of this s tudy was to deter- mine if three training loads (30%, 60% and 90% 1RM), equated by volume, differed in t e rms of their temporal , k inemat ic and kinetic characteristics. It was
145

Training volume and strength and power development
hypothesised that the kinematics and kinetics of sets would differ even though total load lifted was equated.
Methods Subjects Twelve subjects (seven males and five females) volunteered to participate in this research. The subjects ' mean age and mass were 30.2_+10.6 years and 75.8_+13.0 kg respectively. All subjects were weight t rainers with a minimum of 12 months ' weight training experience. The Human Subject Ethics Committee of the Auckland University of Technology approved all the procedures under- taken and all subjects signed an informed consent prior to their participation in the research.
Equipment Assessment of leg strength and power was performed on an isoinertial supine squat machine (see Figure 1}. The supine squat machine was custom built (Fitness Works, Auckland, NZ) and utilised a 300kg pin loaded weight s tack at tached to a sled to assess the subjects. A linear t ransducer (P-80A, Uni- measure, Oregon-average sensitivity 0 .499mV/V/mm, linearity 0.05% full scale) was at tached to the weight stack and measured vertical displacement relative to the ground with an accuracy of 0. lcm. These data were sampled at 1000 Hz by a computer -based data acquisition and analysis program.
The supine squat machine was designed to allow subjects to perform maximal squats or explosive squat jumps, with the back rigidly supported, thus minimising the risk associated with such exercises in an upright position. The sled lay on top of an undercarriage, which enabled the sled to be pegged every 2 cm, allowing s tar t angles to be s tandardised according to the height of the subjects. The reliability of this equipment and protocols for measuring leg s trength and power has been reported previously 18.
Figure 2- Supine squat machine.
146

Training volume and strength and power development
Testing Procedures Testing was conducted over two sessions. During the first session the one repetition maximum (1RIM) of each subject was established. Subjects lay supine on the squat machine with their feet shoulder-width apart and their knees flexed at a 90 ° angle. A warm-up consisting of 50% (15 reps), 100% (10 reps) and 150% (5 reps) of the subject 's bodyweight was performed. Subjects rested for 2-3 minutes between each warm-up set during which lower body stretches for the calf, hamstr ing and quadrieeps muscle groups were performed. This warm-up was also used to familiarise the subjects with the testing equipment. To establish each subject 's 1RM a single repetition to failure protocol was used 19. A recovery period of three minutes between each repetition was used and, if the 1RM was not established within six attempts, the subjects were invited to re turn to complete their assessment 2°.
The second session began with the subject warming up similarly to the protocol used in the first session. The subjects then performed a set at three different load conditions: 30%, 60% and 90% of their 1RM. Each set was equated by volume (% 1RM x reps) to ensure that total mass lifted between conditions was identical (see Table 1). A rest period of five minutes between sets was used. The instructions to the subjects for all repetitions were to move the load as "explosively" as possible. The sequence in which each subject performed the three sets was randomised to negate order and fatigue effects.
Load % RM: 30% 60% 90%
Repetitions 6 3 x x
Load 30kg 60kg 90kg I TotalVolume 180kg 180kg 180kgl
I
Table 1: Example of loading parameters used in this study for a IRM of lOOkg.
Data analysis The displacement time data were filtered using a low pass Hamming filter with a cutoff frequency of 5 Hz. The filtered data were then differentiated using a five point derivative approximation (Lagrange polynomial 4th degree about each point) to determine velocity and acceleration data. The force data were determined by multiplying the mass by the acceleration data. From these data various temporal, kinematic and kinetic measures were calculated. The re- liability and validity of the measures under consideration have been reported previously 18,21.
Statistical analysis The mean values of each variable were compared across conditions (30%, 60% and 90% 1RM) using a repeated measures analysis of variance (ANOVA) with Tukey HSD post hoc comparisons. The criterion level for statistical significance was set at p< 0.05.
147
Training volume and strength and power development
R e s u l t s
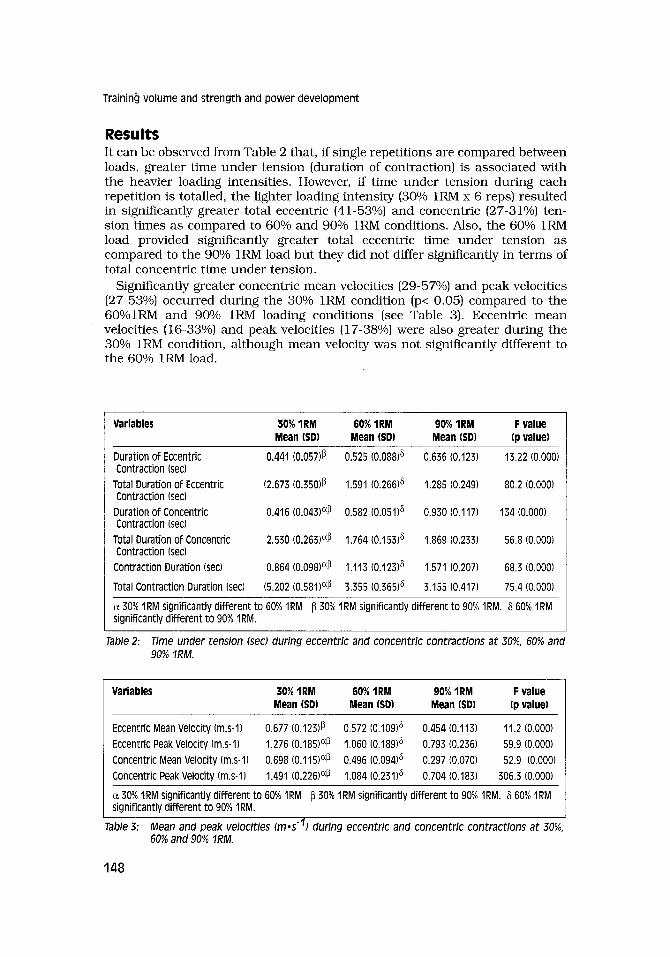
It can be observed from Table 2 that, if single repeti t ions are compared between loads, greater t ime unde r tension (duration of contraction) is associated with the heavier loading intensities. However, if t ime unde r tension dur ing each repetit ion is totalled, the lighter loading intensi ty (30% 1RM x 6 reps) resul ted in significantly greater total eccentric (41-53%) and concentric (27-31%) ten- sion t imes as compared to 60% and 90% 1RM conditions. Also, the 60% 1RM load provided significantly greater total eccentric t ime unde r tension as compared to the 90% 1RM load bu t they did not differ significantly in t e rms of total concentric t ime unde r tension.
Significantly greater concentric mean velocities (29-57%) and peak velocities (27-53%) occurred during the 30% 1RM condition (p< 0.05) compared to the 60%lRM and 90% 1RM loading conditions (see Table 3). Eccentric m e a n velocities (16-33%) and peak velocities (17-38%) were also greater during the 30% IRM condition, a l though mean velocity was not significantly different to the 60% 1RM load.
Variables 30% 1RM 60% 1RM 90% 1RM F value Mean (SD) Mean (SD) Mean (SD) (p value)
Duration of Eccentric 0.441 (0.057)13 0.525 (0.088) 8 0.636 (0.123) 13.22 (0.000) Contraction (sec)
Total Duration of Eccentric (2.673 (0.350)13 1.591 (0.266) 8 1.285 (0.249) 80.2 (0.000) Contraction (sec) Duration of Concentric 0.416 (0.043) ~13 0.582 (0.051) 8 0.930 (0.117) 134 (0.000) Contraction (sec)
Total Duration of Concentric 2.530 (0.263) ~ 1.764 (0.153) 8 1.869 (0.233) 56.8 (0.000) Contraction (sec) Contraction Duration (sec) 0.864 (0.098) ~13 1.113 (0.123) 8 1.571 (0.207) 68.3 (0.000)
Total Contraction Duration (sec) (5.202 (0.581) ~1~ 3.355 (0.365) 8 3.155 (0.417) 75.4 (0.000)
30% 1RM significantly different to 60% 1RM [3 30% 1RM significantly different to 90% 1RM. 3 60% 1RM significantly different to 90% 1RM.
Table 2: Time under tension (sec) during eccentric and concentric contractions at 30%, 60% and 90% 1RM.
Variables 30% 1RM 60% 1RM 90% 1RM F value Mean (SD) Mean (SD) Mean (SD) (p value)
Eccentric Mean Velocity (m.s-1) 0.677 (0.123)13 0.572 (0.109) 8 0.454 (0.113) 11.2 (0.000)
Eccentric Peak Velocity (m.s-1) 1.276 (0.185) ~13 1.060 (0.189) 8 0.793 (0.236) 59.9 (0.000)
Concentric Mean Velocity (m.s-1) 0.698 (0.115) ~13 0.496 (0.094) 8 0.297 (0.070) 52.9 (0.000)
Concentric Peak Velocity (m.s-1) 1.491 (0.226) El3 1.084 (0.231) 8 0.704 (0.183) 306.3 (0.000)
30% 1RM significantly different to 60% 1RM [3 30% 1RM significantly different to 90% 1RM. ~ 60% 1RM significantly different to 90% 1RM.
Table 3: Mean and peak velocities (m,s 1) during eccentric and concentric contractions at 30%, 60% and 90% 1RM.
148

Training volume and strength and power development
variables 30% 1RM 60% 1RM 90% 1RM F value Mean (SD) Mean (SD) Mean (SD) (p value)
Total Eccentric Mean Force (N)
Eccentric Mean Force (N) Eccentric Peak Force (N)
Total Concentric Mean Force (N)
Concentric Mean Force (N)
Concentric Peak Force (N)
4829 (1323) ~i3 4409 (1139) 5 3925 (1001) 62.1 (0.000)
804 (220) ~I3 1469 (379) 5 1962 (501) 27.3 {0.000) 970 (276) ~13 1874 (499) 5 2778 (782) 109 (0.000)
5084 (1370) ~13 4399 (1112) 5 3876 (984) 86.4 (0.000) 847 (228) El3 1466 (370) 5 1937 (492) 24.9 (0.000)
943 (258) ~13 1630 (406) 5 2214 (548) 215 (0.000)
a 30% 1RM significantly different to 60% 1RM 13 30% 1RIV] significantly different to 90% 1RM. 8 60% tRM significantly different to 90% 1RM.
Table 4: Mean, peak and total force output (N) during eccentric and concentric contractions at 30%, 60% and 90% 1RM.
Variables 30% 1RM 60% 1RM 90% 1RM F value Mean (SD) Mean (SD) Mean (SD) (p value)
Total Eccentric Mean Power (W)
Eccentric Mean Power (W)
Total Concentric Mean Power (W)
Concentric Mean Power (W)
Concentric Peak Power (W)
3233 (1001) ~13 2450 (763) 5 1704 (546) 36.6 (0.000)
538 (166) ~13 816 (254) 852 (273) 6.32 (0.005) 3626 (1123) ~13 2194 (684) 5 1139 (361) 92.1 (0.000)
604 (187) 731 (228) 569 (180) 2.17 (0.130)
1199 (369) ~13 1564 (519) 1406 (485) 14.4 (0.000)
30% 1RM significantly different to 60% 1RM [3 30% 1RM significantly different to 90% 1RM. 8 60% IRM significantly different to 90% 1RM.
Table 5: Mean, peak and total power output (W) during eccentric and concentric contractions at 30%, 60% and 90% 1RM.
The 90% 1RM condition resulted in significantly greater m e a n and peak force o u t p u t (p<0.05) during the eccentric and concentric phases (see Table 4). However, due to the higher n u m b e r of repetit ions of the 30% 1RM condition (six reps) compared to the 60% and 90% 1RM conditions (three reps and two reps) the total m e a n force ou tpu t was significantly higher during the eccentric (9- 19%) and concentric (14-24%) phases for the lighter condition.
It can be observed from Table 5 tha t greater power was absorbed (eccentric mean power) in the 90% 1RM condition when single repetit ions were compared. In t e rms of power product ion (concentric m e a n power), no load was found to be significantly different to the other. The greates t concentric peak power was found in the two heavier conditions. When the power ou tpu ts were totalled for each condition, significantly greater total mean power ou tpu t was found during the 30% 1RM loading during the eccentric (25-48%) and concentric (40-69%) phases . Greater eccentric and concentric total power ou tpu t can also be observed in the 60% 1RM condition as compared to the 90% 1RM condition.
If single repeti t ions are compared it can be observed from Table 6 tha t greater work is done during the 90% 1RM condition for both the eccentric and concentric phases as compared to the 30% 1RM and 60% 1RM conditions.
149

Trainingvolume and strength and power development
Variables 30% 1RM 60% 1RM 90% 1RM F value Mean ($D) Mean (SD) Mean (SD) (p value)
Eccentric Total Work Done (J) 1433 (414) ~13 1311 (372) 8 1168 (328) 66.2 (0.000) Eccentric Mean Work Done (J) 239 (69) El3 435 (125) 8 583 (164) 22.658 (0.000)
Concentric Total Work Done (J) 1510 (437)v 1309 (371) 5 1153 (321) 86.9 (0.000)
Concentric Mean Work Done (J) 262 (65) ~13 436 (123) 8 576 (160) 19.626 (0.000)
30% 1RM significantly different to 60% IRM 13 30% 1RM significantly different to 90% 1RM. 5 60% 1RM significantly different to 90% 1RM.
Table 6- Mean and total work done Uoules) during eccentric and concentric contractions at 30~ 60% and 90% 1RM.
variables 30% 1RM 60% 1RM 90% 1RM F value Mean (SD) Mean (SD) Mean (SD) (p value)
Total Eccentric Impulse (N-sec "1) 2116 (567 ) 2319(695) 2535 (936) 3.13 (0.063) Eccentric Impulse (N,sec "1) 352 (94) ~13 773 (231) 5 1239 (494) 23.1 (0.000) Total Concentric Impulse (N,sec 1) 2111 (536) ~13 2591 (724) 8 3632 (1093) 58.4 (0.000) Concentric Impulse (N,sec 1) 351 (89) ~ 863 (241) 8 1816 (546) 54.4 (0.000)
30% IRM significantly different to 60% 1RM 13 30% 1RM significantly different to 90% 1RM. ~ 60% 1RM significantly different to 90% 1RM.
Table 7: Mean and total impulse (N.sec. 1) during eccentric and concentric contractions at 30%. 60% and 90% 1RM.
Furthermore the 60% 1RM condition resulted in greater work as compared to the 30% 1RM condition. However, the total work done under the 30% 1RM condition (6x30% 1RM) was significantly greater during the eccentric (9%-19%) and concentric (13%-24%) phases as compared to the 60%lRM and 90% 1RM conditions.
It can be observed from Table 7 that, if single repetitions are compared, the impulse during the 90% 1RM condition was significantly greater (p<0.05) during the concentric phase. Total impulse values for the 90% 1RM condition were also significantly greater than the 30% IRM and 60% 1RM loads during the eccentric (9%-16%) and concentric (42%-29%) phases. Greater impulses were also associated with the 60% 1RM condition as compared to the 30% 1RM condition.
DiSCUSSiOn It is thought that training loads need to be maximal or near maximal and of sufficiently long durat ion if maximal strength and CSA are to increase 4,22,2a. In terms of time under tension, the utilisation of heavier loads (90% 1RM) no doubt increases the duration of the eccentric and concentric phases and hence the total time under tension if single repetitions are compared between loads (see Table 1). However, when equated by volume, the lighter load (30% 1RM) resulted in greater total time under tension due to the greater number of
150

Training volume and strength and power development
repeti t ions tha t were performed. If t ime under tension is a critical s t imulus for s t rength and hyper t rophy gains, the similar resul ts reported previously using lighter training intensities (<50% 1RM) as compared to the heavier paradigms (>70% 1RM) might be explained.
The relat ionship between force and velocity is impor tan t for unders tanding movement , as all movement is a combinat ion of these two qualities. This relat ionship is directly observable in Tables 3 and 4, which clearly show tha t velocity decreases as force increases due to increasing loads. At slower velocities,there is greater t ime for crossbridge s to generate tension and hence generate force output . The ballistic squat techniques utilised in this research allow superior force-velocity ou tpu ts as compared to more conventional s t rength training techniques. That is, movement tha t allows the projection of oneself or a load, as in j u m p or throw training, resul ts in improved kinematics and kinetics as opposed to non-projection s t rength training techniques la,14. One of the major benefits of ballistic t raining is tha t the velocity profiles bet ter s imulate those OCCUlTing during everyday activity. That is, higher velocities are achieved later in the concentric phase. Newton et a114 reported tha t the bench press throw allowed the ba r to be accelerated for 96% of the throw movement as opposed to 60% for a traditional bench press movement us ing a load of 45% 1RM. As a resul t higher accelerations and shor ter deceleration phases are products of this type of training. As acceleration and force are proportional, these acceleration characteris t ics have quite significant effects on force output and hence the variables described hereafter.
In t e rms of force output , a single repetit ion at 90% 1RM produced superior m e a n and peak forces during both the eccentric and concentric phases (see Table 4). However, when equated by volume, greater total eccentric and concentric force was observed in the 30% 1RM condition. If high force is a fundamenta l requi rement to increases in strength, power and hypertrophy, then the impor tance of heavier loads (>70% 1RM) once more appears question- able. These findings certainly enable a bet ter unders tand ing of the strength, power and hypertrophic adapta t ions found with lighter load (10-30% 1RM) training cited previously. That is, techniques tha t are explosive in intent and ballistic in nature , equated by volume, appear to produce superior force outputs and therefore may be equally effective to heavier load training in increasing CSA, s t rength and power s,12. Fur thermore it may be tha t these lighter loads produce higher s t rain ra tes during the stretching of the muscle, which has also been suggested as impor tant precursors to inducing hyper- t rophy 24,25. Certainly the necessi ty of a m i n i m u m load or threshold tension seems questionable.
It can be observed from the resul ts of this s tudy tha t the use of heavier loads resul ted in greater power absorpt ion (mean eccentric power) when single repeti t ions were compared. It should also be noted tha t the power absorbed for the two heavier conditions was greater than the power produced, whereas the opposite is t rue for the 30% 1RM condition. For the heavier loading intensity (60% and 90% 1RM), the power absorbed exceeded power product ion by 111- 149% respectively. If the mean power can be interpreted as an indicator of how effectively energy is t ransferred between body segments in the execution of a movement 26, load obviously affects this efficiency. It appears at heavier loading
151

Training vc)lume and strength and power development
intensities tha t the power product ion phase is unable to utilise all the power tha t has been absorbed or stored. It has been s ta ted that, if the potential energy were stored slowly, the energy would become available slowly 27. The longer eccentric phase and slower average and peak eccentric velocities of the heavier loading intensi ty suggest a slower rate of storage. It m a y be speculated tha t the slower rate of storage and release, increased coupling t imes and longer concentric phases affect the util isation of the power absorbed. Realising tha t rebound enhances the initial phase of the concentric contraction, it appea r s that, in conditions tha t allow for a subs tant ia l t ime to elapse, the benefits of the eccentric phase are not fully realised. This phenomenon may aid hyper- t rophy and s t rength development in tha t the potentiat ing effects of the eccentric contract ion have dissipated before the completion of the concentric phase. As such, there may be greater contr ibution from the contractile machinery to create the force to move the heavier loads, hence greater con- tractile damage. It may be speculated tha t one of the benefits of heavier loads is to maximise the concentric or contractile contr ibution and minimise the elastic and reflexive contr ibution to force production. If the s t imulus to exercise-induced hyper t rophy is micro-injury to the connective t issue and muscle t i ssue th rough high intensi ty loading 3, then such a hypothesis is attractive in explaining the potential benefits of utilising heavier loads. However, it m u s t also be acknowledged tha t a nea r m a x i m u m eccentric componen t of a musc le action can resul t in higher musc le tension and s t ra in ra tes and create more damage than typical concentric contract ions 2s. Fur ther research tha t is mechanis t ic in na tu re is needed to investigate whether the damage induced by eccentric- or concentric-only training is similar in quality and quantity.
In t e rms of power product ion (concentric mean and peak power), the resul ts when single repeti t ions are compared suggest tha t there is little difference in power ou tpu t s between the three conditions. The only significant difference was found between the 60% 1RM condition and the 30% 1RM condition for peak power output . However, if the total power produced (mean and peak) is compared between conditions, the total power ou tpu t associated with the 30% 1RM condition was 40-69% greater tha t the 60% 1RM and 90% 1RM conditions respectively. It is thought tha t maximal power ou tpu t occurs at approximate ly 30% of m a x i m u m isometric s t rength and 30% of m a x i m u m shortening velocity 29-31. However, recent findings us ing isoinertial mult iar t icular move- ments in vivo suggest tha t heavier loading intensities (50-70% 1RM) may be superior in maximising the power ou tpu t of musc le 13,32,aa. These findings are based on the compar i son of a single repetition. The findings of this s tudy unequivocally suggest however tha t the util isation of lighter loads maximise the mechanica l power ou tpu t of muscle if equi-volume loading pa rame te r s are compared.
It may be tha t force alone does not adequately account for increases in s t rength and CSA bu t ra ther the dis tance over which tha t force acts (work). Stone et al 2s argued tha t changes in body composit ion are to a large extent related to the a m o u n t of work accomplished. In a t tempt ing to explain the increases in 1RM st rength and CSA of their 35% 1RM-training group (G35), Moss and colleagues 12 found tha t G35 performed 70% more work t han their
152

Training volume and strength and power development
90% 1RM training group. They concluded tha t the total amoun t of work was impor tan t for musc le hypertrophy. Similarly, greater total work for both the eccentric and concentric phases (9-24%) was associated with the 30% 1RM condition as compared to the two heavier conditions in this study, though nowhere near the magni tude cited by Moss and colleagues. Given tha t greater total work is associated with the 30% 1RM condition, it m a y be p resumed that greater metabolic and mechanica l s t ress is associated with this condition, both of which are thought impor tan t for increasing s t rength and CSA 6. However, this interpretat ion may be somewhat simplistic given tha t maximal s t rength and hypertrophic gains may also depend on a related fatigue st imulus. It has been suggested that, if muscle fibres are recruited bu t not fatigued, they are not trained a4.35. Greater t raining-induced increases in MVC and cross-sectional area of the quadr iceps were associated with elevated changes in phospha te metaboli tes and pH 36. Carey Smith and Rutherford 5 found tha t concentric-only res is tance training with sub-maximal loads tha t resul ted in a higher metabolic cost was more effective in increasing m a x i m u m st rength than eccentric-only training using maximal loads with a lower metabolic cost. They concluded that metabolic cost and not high forces alone were involved in the stimuli for muscle hyper t rophy and s t rength gains 5. The relat ionship between load and fatigue is fur ther complicated given tha t loading such as the 90% 1RM condition is more likely to induce neural fatigue. This type of fatigue has been associated with neurochemical changes tha t may have t ime courses for recovery longer than tha t of muscle metabolic fatigue aT. It would seem from the resul ts of this s tudy tha t the 30% 1RM condition would be more likely to induce greater metabolic fatigue given the greater n u m b e r of maximal repetit ions completed. However, whether such a light loading intensity optimises the fatigue s t imulus and produce the metabolic changes necessary for hypertrophic and s t rength adapt- ation as compared to higher intensity loading, certainly war ran t s investigation.
Although the 30% 1RM condition resul ted in significantly greater total force output and total t ime under tension for both the eccentric and concentric phases , greater concentric and eccentric total impulse was associated with the 90%lRM condition. If high forces and greater t ime under tension were impor tan t for increasing the s t rength and CSA of muscle, then the 30% 1RM condition would appear the load of choice. However, the product of force and t ime (impulse) may be the more impor tant s t imulus to induce changes in s t rength and CSA. If so, heavier loads would appear a superior training s t imulus to achieve these changes, as heavier loads were associated with greater total impulse. The relat ionship between impulse and increases in s t rength and hyper t rophy however is not well documented.
Conclusions A great deal of research has failed to equate loading between training protocols in any form. Unfortunately the resul ts from such studies are difficult to interpret as the reported differences between various training protocols may in fact be contaminated by differences in training volume, ra ther than the specific kinematic and kinetic character is t ics of the training programs utilised. Making conclusions abou t the efficacy a n d / o r adapta t ions of various training protocols tha t are not equated in some m a n n e r would appear highly questionable. Research in this area tha t does a t tempt to equate training loads in some
153

Training ~/olume and strength and power development
m a n n e r when compar ing different protocols, usual ly does so by equat ing training volume. However, the resul ts of this s tudy indicate tha t equat ing by volume still resul ts in a great deal of difference in t e rms of the temporal , k inemat ic and kinetic character is t ics within a set. Tha t is, equat ing by volume can lead to very different total t ime under tensions, forces, power, etc. Therefore the adapta t ions elicited by equi-volume res is tance training is for the mos t par t not well unders tood. It may be tha t specific pa rame te r s need to be equated (eg, t ime under tension, force, power, etc) to truly unde r s t and the na tu re of the n e u r o m u s c u l a r adap ta t ions elicited by different t ra ining protocols. For example, to ascer ta in whether or not t ime under tension is a critical s t imulus for increased s t rength and hypertrophy, training programs would be equated on this pa rame te r and training induced adapta t ions noted thereafter. Similarly equat ing by volume is not adequate in compar ing the forces or powers associated with various loading parameters , as is obvious f rom the resul ts of this study. To gain a bet ter appreciat ion of how force affects s trength, power or hypertrophy, training p rograms need to be equated by force. To unde r s t and the effect of fatigue and associated metabolic changes on s t rength and hyper t rophic adaptat ion, loading protocols need to be equated by work. Unfortunately, the great majori ty of research in s t rength and con- ditioning does not adopt such an approach. As a result, m a n y of the suggested conclus ions and pract ical appl icat ions are fundamenta l ly flawed. Until s t rength and power research adopts a set k inemat ic and kinetic analysis within its research designs, m u c h of the research will not contr ibute greatly to our unders tand ing of how var ious training p rograms optimise s t rength and power development. With this in mind one should remain cognisant of the limitations tha t exist in the interpretat ion of research da ta in this field.
References 1. Atha J. Strengthening muscle. Exerc Sport Sci Rev 1981;9:1-73. 2. MacDougall JD. Hypertrophy or hyperplasia. In Komi PV (Ed), Hypertrophy or hyperplasia. Oxford. Blackwell Scientific Publications. 1992. 3. McDonagh MJN and Davies CTM. Adaptive response of mammalian skeletal muscle to exercise with high loads. Eur J Appl Physiol 1984;52:139-155. 4. Komi PV and Hakkinen K. Strength and power. In Dirix A, Knuttgen HG and Tittel K (Ed), Strength and power. Boston. Blackwell Scientific. 1988. 5. Carey Smith R and Rutherford OM. The role of metabolites in strength training. 1. Acomparison of eccentric and concentric contractions. Eur J Appl Physio11995;71:332-336. 6. Enoka R. Neuromechanical basis of kinesiology. Champaign, IL. Human Kinetics: 1994. 7. Jones DA, Rutherford OM and Parker DF. Physiological changes in skeletal muscle as a result of strength training. Quarterly Journal of Experimental Physiology 1989;74 {3):233-56. 8. Lyttle AD, Wilson GJ and Ostrowski KJ. Enhancing performance: maximal power versus combined weights and plyometrics training. J Strength Cond Res 1996; 10 (3): 173-179. 9. Harris GR, Stone MH, O'Bryant HS, et al. Short-term performance effects of high power, high force, or combined weight-training methods. J Strength Cond Res 2000;14 (1):14-20. 10. Dahl HA, Aaserud R and Jensen J. Muscle hypertrophy after light and heavy resistance training. Med Sci Sports Exerc 1992;24 (5):$55. 11. Schmidtbleicher D and Buehrle M. Neuronal adaptation and increase of cross-sectional area studying different s trength training methods. In Biomechanics: Champaign, Illinois. 1987. 615-617. 12. Moss B, Refsnes PF, Abildgaard A, et al. Effects of maximal effort strength training with different loads on dynamic strength, cross-sectional area, toad-power and load-velocity relationships. Eur J Appl Physiol 1997;75:193-199. 13. Cronin JB, McNair PJ and Marshall RN. Developing explosive power: a comparison of technique and training. J Sci Med Sport 2001;4 (1):59-70.
154

Training volume and strength and power development
14. Newton RU, Kraemer WJ, Hakkinen K, et al. Kinematics, kinetics and muscle activation during explosive upper body movements. J Appl Biomech 1996; 12:31-43. 15. Newton RU, Murphy AJ, Humphries BJ, et al. Influence of load and stretch shortening cycle on the kinematics, kinetics and muscle activation that occurs during explosive upper body movements. Eur J Appl Physiol 1997; 75:333-342. 16. Newton R and Wilson G. The kinetics and kinematics of powerful upper body movements: the effect of load. In X/Vth International Series on Biomechanics: Paris, France. 1993. 936-937. 17. Wilson G and Newton R. A comparison of velocity and muscular activity between plyometric and traditional weight training techniques. JAppl Sport Sci Res 1992;6 (3): 191. I8. Cronin JB, McNair PJ and Marshall RN. Relationship between strength qualities and motor skills associated with court performance. J Hum Movt Studies 2001;40:207-224. 19. Heyward VII. Assessing muscular strength and endurance. In (Ed), Assessing muscular strength and endurance. Champaign, IL. Human Kinetics. 1991. 20. Abernethy P, Wilson G and Logan P. Strength and power assessment: issues, controversies and challenges. Sports Med 1995;19 (6):41-417. 21. Cronin JB, McNair PJ and Marshall RN. The role of maximal strength and load on initial power production. Med Sci Sports Exerc 2000;32 (10): 1763-1769. 22. Komi PV and Buskirk ER. Effect of eccentric and concentric muscle conditioning on tension and electrical activity of human muscle. Ergonomics 1972;15 (4):417-434. 23. Moritani MA and deVries HA. Neural factors versus hypertrophy in the time course of muscle strength gain. American Journal of Physical Medicine 1979;58 (3): 115-130. 24. Antonio J. Nonuniform response of skeletal muscle to heavy resistance training: Can bodybuilders induce regional muscle hypertrophy? J Strength Cond Res 2000;14 (1): 102-113. 25. Lieber RL and Bodine-Fowler SC. Skeletal muscle mechanics: implications for rehabilitation. Phys Ther 1993;73 (12):844-856. 26. Dowling J and Vamos L. Identification of kinetic and temporal factors related to vertical jump performance. J Appl Biomech 1993;9:95-110. 27. Huijing PA. Elastic potential of muscle. In Komi PV {Ed), Elastic potential of muscle. Boston. Blaekwell Scientific Publications. 1992. 28. Stone MH, Plisk SS, Stone ME, et at. Athletic performance development: volume load - 1 set vs multiple sets, training velocity and training variation. Strength and Conditioning 1998;(December):22-31. 29. Faulkner JA, Claflin DR and Cully KK. Power output of fast and slow fibres from human skeletal muscles. In Jones NL, McCartney N and McComas AJ (Ed), Power output of fast and slow fibres ffom human skeletal muscles. Champaign, Illinois. Human Kinetics. 1986. 30. Moritani T. Time course of adaptations during strength and power training. In Komi PV (Ed), Time course of adaptations during strength and power training. Boston. Blackwell Scientific Publications. 1992. 31. Perrine JJ . The biophysics of maximal muscle power output: methods and problems of measurement. In Jones LM, McCartney N and McComas AJ (Ed), The biophysics of maximal muscle power output: methods and problems of measurement. Champaign, IL. Human Kinetics. 1986. 32. Baker D, Nance S and Moore M. The load that maximizes the average mechanical power output jump squats in power trained athletes. J Strength Cond Res 2001;15 (1):92-97. 33. Baker D, Nance S and Moore M. The load that maximizes the average mechanical power output during explosive bench press throws in highly trained athletes. J Strength Cond Res 2001;15 (1):20-24. 34. Sale DG. Influence of exercise and training on motor unit activation. In Pandolf KB (Ed), Influence of exercise and training on motor unit activation. New York. McMillan Publishing Company. 1987. 35. Zatsiorsky VM. Science and practice of strength training. Champaign. Illinois. Human Kinetics: 1995. 36. Schott J, McCully K and Rutherford OM. The role of metabolites in strength training.II. Short versus long isometric contractions. Eur J Appl Physiol 1995; 71 (337-341) 37. Bloomer RJ and Ives JC. Varying neural and hypertrophic influences on a strength program. J Strength Cond Res 2000;22 (2):30-35.
155