1 s2.0-s0377221710001219-main
12
Innovative Applications of O.R. Stakeholder preference elicitation and modelling in multi-criteria decision analysis – A case study on urban water supply P.N. Kodikara a, * , B.J.C. Perera a , M.D.U.P. Kularathna b a Victoria University, P.O. Box 14428, Melbourne, Victoria 8001, Australia b Melbourne Water, P.O. Box 4342, Melbourne, Victoria 3001, Australia article info Article history: Received 25 June 2008 Accepted 15 February 2010 Available online 19 February 2010 Keywords: Multiple criteria analysis Stakeholder preference elicitation Urban water supply systems abstract Integration of multiple objectives to evaluate the alternative operating rules for urban water supply res- ervoir systems can be effectively accomplished by multi-criteria decision aid techniques, where prefer- ence elicitation and modelling plays an important role. This paper describes a preference elicitation and modelling procedure involving the multi-criteria outranking method PROMETHEE in evaluating these alternative operating rules. The Melbourne water supply system was considered as the case study. Eight performance measures (PMs) were identified under four main objectives to evaluate the system performance under alternative operating rules. Three major hypothetical stakeholder groups namely, resource managers, water users, and environmental interest groups were considered in decision-making. An interviewer-assisted questionnaire survey was used to derive the preference functions and weights of the PMs. The evaluation of alternative operating rules is not covered in this paper, rather an approach to elicit and model stakeholder preferences in decision-making is described. Crown Copyright Ó 2010 Published by Elsevier B.V. All rights reserved. 1. Introduction Many years ago, when there was adequate supplies of water to meet the various demands, the traditional ways of managing water resources mainly focused on meeting a single objective; adopting the cost-benefit analysis or systems analysis approaches (Rogers et al., 2000). Mathematical modelling has been widely used in such instances for determining the optimum operating rules for multi- reservoir water supply systems. These modelling approaches, ranges from simulation (Draper et al., 2004; Perera et al., 2005; Sig- valdason, 1976; Wurbs, 2005; Zarriello, 2002) to stochastic optimi- sation (Krancman et al., 2006; Lund and Ferreira, 1996; Perera and Codner, 1996; Tejada-Guibert et al., 1993; Wang et al., 2005) have addressed the decision problem with respect to a single objective. Throughout the world today, the rise in water demand in urban areas coupled with possible adverse climate scenarios, increasing awareness on environmental issues, and lack of additional water resources, pose new challenges to water resource managers. Con- flicting objectives of stakeholders intensify these challenges, requiring the consideration of multiple objectives in terms of so- cial, economic, environmental and supply sustainability perspec- tives for long-term operation of urban water supply systems. One reasonable way to strike a balance between these conflicting objec- tives is to incorporate the stakeholder preferences in the decisions (Himes, 2007; Rogers et al., 2004; Tompkins et al., 2008). When the system performance of a water supply system is eval- uated using a series of performance measures (PMs), choosing an optimum operating rule could be a complex decision problem for the decision maker (DM). The DM could be a single person, a homogeneous group such as resource managers or a decision-mak- ing group with representations from different stakeholder groups. When dealing with multiple objectives that are characterized by a high degree of conflict, multi-criteria decision aiding (MCDA) methods that consider the stakeholder preferences could provide the DMs with promising results through exploration and learning (Pomerol and Barba-Romero, 2000). Among the discrete MCDA methods that consider the DM preferences, multi-attribute utility based methods (Jacquet-Lagréze and Siskos, 1982; Keeny and Raiffa, 1976; Saaty, 1980; Von Winterfeldt and Edwards, 1986) and outranking methods (Brans et al., 1986; Roy, 1968) have dem- onstrated their diversity through a vast range of applications. There is a growing shift towards the methodical inclusion of stakeholder preferences in practical decision-making situations re- lated to sustainable water resources management (e.g., Ghanbar- pour et al., 2005; Herath, 2004; Joubert et al., 2003; Larson and Denise, 2008; Leach and Pelky, 2001; Water Resources Strategy Committee, 2002). The need for consensus-seeking ways of sus- tainable management of water resources has become increasingly important due to the reasons such as the shortage of existing water supplies, the limited options for increasing water supplies and the increasing concerns for preserving the ecosystems (Ananda and 0377-2217/$ - see front matter Crown Copyright Ó 2010 Published by Elsevier B.V. All rights reserved. doi:10.1016/j.ejor.2010.02.016 * Corresponding author. Tel.: +61 3 9802 4856; fax: +61 3 8344 4616. E-mail addresses: [email protected] (P.N. Kodikara), chris.perera@vu. edu.au (B.J.C. Perera), [email protected] (M.D.U.P. Kular- athna). European Journal of Operational Research 206 (2010) 209–220 Contents lists available at ScienceDirect European Journal of Operational Research journal homepage: www.elsevier.com/locate/ejor
-
Upload
varuni-jayasooriya -
Category
Engineering
-
view
229 -
download
1
Transcript of 1 s2.0-s0377221710001219-main

European Journal of Operational Research 206 (2010) 209–220
Contents lists available at ScienceDirect
European Journal of Operational Research
journal homepage: www.elsevier .com/locate /e jor
Innovative Applications of O.R.
Stakeholder preference elicitation and modelling in multi-criteria decisionanalysis – A case study on urban water supply
P.N. Kodikara a,*, B.J.C. Perera a, M.D.U.P. Kularathna b
a Victoria University, P.O. Box 14428, Melbourne, Victoria 8001, Australiab Melbourne Water, P.O. Box 4342, Melbourne, Victoria 3001, Australia
a r t i c l e i n f o
Article history:Received 25 June 2008Accepted 15 February 2010Available online 19 February 2010
Keywords:Multiple criteria analysisStakeholder preference elicitationUrban water supply systems
0377-2217/$ - see front matter Crown Copyright � 2doi:10.1016/j.ejor.2010.02.016
* Corresponding author. Tel.: +61 3 9802 4856; faxE-mail addresses: [email protected] (P.N
edu.au (B.J.C. Perera), udaya.kularathna@melbournewathna).
a b s t r a c t
Integration of multiple objectives to evaluate the alternative operating rules for urban water supply res-ervoir systems can be effectively accomplished by multi-criteria decision aid techniques, where prefer-ence elicitation and modelling plays an important role. This paper describes a preference elicitationand modelling procedure involving the multi-criteria outranking method PROMETHEE in evaluatingthese alternative operating rules. The Melbourne water supply system was considered as the case study.Eight performance measures (PMs) were identified under four main objectives to evaluate the systemperformance under alternative operating rules. Three major hypothetical stakeholder groups namely,resource managers, water users, and environmental interest groups were considered in decision-making.An interviewer-assisted questionnaire survey was used to derive the preference functions and weights ofthe PMs. The evaluation of alternative operating rules is not covered in this paper, rather an approach toelicit and model stakeholder preferences in decision-making is described.
Crown Copyright � 2010 Published by Elsevier B.V. All rights reserved.
1. Introduction tives is to incorporate the stakeholder preferences in the decisions
Many years ago, when there was adequate supplies of water tomeet the various demands, the traditional ways of managing waterresources mainly focused on meeting a single objective; adoptingthe cost-benefit analysis or systems analysis approaches (Rogerset al., 2000). Mathematical modelling has been widely used in suchinstances for determining the optimum operating rules for multi-reservoir water supply systems. These modelling approaches,ranges from simulation (Draper et al., 2004; Perera et al., 2005; Sig-valdason, 1976; Wurbs, 2005; Zarriello, 2002) to stochastic optimi-sation (Krancman et al., 2006; Lund and Ferreira, 1996; Perera andCodner, 1996; Tejada-Guibert et al., 1993; Wang et al., 2005) haveaddressed the decision problem with respect to a single objective.
Throughout the world today, the rise in water demand in urbanareas coupled with possible adverse climate scenarios, increasingawareness on environmental issues, and lack of additional waterresources, pose new challenges to water resource managers. Con-flicting objectives of stakeholders intensify these challenges,requiring the consideration of multiple objectives in terms of so-cial, economic, environmental and supply sustainability perspec-tives for long-term operation of urban water supply systems. Onereasonable way to strike a balance between these conflicting objec-
010 Published by Elsevier B.V. All
: +61 3 8344 4616.. Kodikara), [email protected] (M.D.U.P. Kular-
(Himes, 2007; Rogers et al., 2004; Tompkins et al., 2008).When the system performance of a water supply system is eval-
uated using a series of performance measures (PMs), choosing anoptimum operating rule could be a complex decision problem forthe decision maker (DM). The DM could be a single person, ahomogeneous group such as resource managers or a decision-mak-ing group with representations from different stakeholder groups.When dealing with multiple objectives that are characterized by ahigh degree of conflict, multi-criteria decision aiding (MCDA)methods that consider the stakeholder preferences could providethe DMs with promising results through exploration and learning(Pomerol and Barba-Romero, 2000). Among the discrete MCDAmethods that consider the DM preferences, multi-attribute utilitybased methods (Jacquet-Lagréze and Siskos, 1982; Keeny andRaiffa, 1976; Saaty, 1980; Von Winterfeldt and Edwards, 1986)and outranking methods (Brans et al., 1986; Roy, 1968) have dem-onstrated their diversity through a vast range of applications.
There is a growing shift towards the methodical inclusion ofstakeholder preferences in practical decision-making situations re-lated to sustainable water resources management (e.g., Ghanbar-pour et al., 2005; Herath, 2004; Joubert et al., 2003; Larson andDenise, 2008; Leach and Pelky, 2001; Water Resources StrategyCommittee, 2002). The need for consensus-seeking ways of sus-tainable management of water resources has become increasinglyimportant due to the reasons such as the shortage of existing watersupplies, the limited options for increasing water supplies and theincreasing concerns for preserving the ecosystems (Ananda and
rights reserved.

210 P.N. Kodikara et al. / European Journal of Operational Research 206 (2010) 209–220
Herath, 2009; Galloway, 2005; Hajkowicz, 2008; McPhee and Yeh,2004; Whitmarsh and Palmieri, 2009).
The stakeholder preference elicitation and modelling has al-ways been seen as a difficult and intricate problem leading touncertainty, which involves a fair amount of time and effort (Figue-ira and Roy, 2002; Herath, 2004). Many experimental studies haveconfirmed that the DM preferences are highly variable due to var-ious factors and this could lead to bias in the evaluations of thesepreferences (e.g., Fischoff, 1980; Shapira, 1981). For example, theway one presents a question to a person could strongly influencehis/her behaviour in expressing the preference (Vincke, 1999).With the growing complexity of the decision situations, the appli-cation of MCDA methods often requires a considerable amount ofcomputation for exploration and analysis.
Available MCDA methods so far differ with each other in thequality and quantity of additional information they request, themethodology they use, their user-friendliness, the sensitivity toolsthey offer, and the mathematical properties they verify (Pomeroland Barba-Romero, 2000). The Preference Ranking OrganizationMETHod for Enrichment Evaluations (PROMETHEE) method (Branset al., 1986) and its computer software tool Decision Lab 2000 (Vi-sual Decision, 2003) was chosen for this study, primarily becauseof its transparent computational procedure and simplicity (i.e.comparatively low time and effort required of the DM to reach aconclusion).
The work presented here is part of a study to develop a DecisionSupport System based on PROMETHEE method (Brans et al., 1986)and its computer software tool Decision Lab 2000 (Visual Decision,2003) to evaluate alternative operating rules for urban water sup-ply reservoir systems considering a case study on the Melbournewater supply system. This paper proposes an indirect approachfor elicitation and modelling of stakeholder preference parametersfor PROMETHEE/Decision Lab 2000�. The evaluation of alternativeswill be discussed in a future publication.
2. Case study – alternatives and performance measures
Melbourne Water operates and maintains a multi-reservoir sys-tem that provides water supplies to a population of about 3.7 mil-lion people in Melbourne, Australia. The annual waterconsumption for Melbourne, based on 2003–2007 usages, is about
O’Maroondah Res
Sugarloaf Res
Yarra River
Greenvale Res
Tooorourrong Res
Yan Yean Res
Coranderr
Melbourne Area
Silvan Re
Cardinia
Fig. 1. Schematic diagram of Melbourne water s
440,000 Ml. Melbourne’s water supply system is shown schemati-cally in Fig. 1. It currently utilizes 10 major reservoirs includingharvesting reservoirs and seasonal balancing storages, having a to-tal storage capacity of 1,773,000 Ml.
A limited volume of water is also pumped from the Yarra Riverinto the Sugarloaf reservoir and is fully treated to provide highquality water, at a higher operating cost. There are environmentalflow release requirements to be met for all harvested streams. Alimited amount of hydropower is also generated as a by-productat two locations, Thomson reservoir and Cardinia reservoir, whenthe water is released or transferred to meet environmental require-ments or urban demands. Melbourne’s ‘Drought Response Plan’,developed by metropolitan water companies sets out four stagesof demand restrictions on outdoor water use depending on the to-tal storage volume in the reservoirs. For this study, a set of alterna-tive operating rules for assessment by PROMETHEE was identified.The alternative rules include one variation each to current rulesbased on:
(1) Stages of restrictions,(2) Amount of pumping from Yarra River,(3) Amount of hydropower to be generated, and(4) Minimum river releases.
Combining these four alternative operating rules with the cor-responding ‘current’ rules generated 16 alternative operating rulesto be evaluated. Long-term social, economic, environmental andtechnical aspects were taken into consideration when specifyingthe relevant objectives for the case study. A total of eight PMswas identified that summarised the system performance underthe four above broad objectives. The details of the objectives andthe corresponding PMs are given in Table 1. The PM values corre-sponding to each of the 16 operating rules can be computed usingthe water supply planning and simulation model of the Melbournesystem.
3. Preference parameters in PROMETHEE
Apart from the basic data required in the form of a decision ma-trix (i.e. values of each PM corresponding to each alternative),PROMETHEE requires some additional preference information
Armstrong CkThomson Res
Shannassy Res
McMahon Ck
Starvation Ck
k CkThomson Releases
Upper Yarra Res
Harvesting Storage
Seasonal Storage
Major Transfers / Inflows
Supply Area
s
Res
upply system. (Source: Perera et al. (2005)).

Table 1Objectives and performance measures (PMs).
Objective Performance measure (PM) Unit Definition
Maximize level of service SR – Monthly supply reliability % Percentage of months with no restrictions to thetotal number of months in the simulation period
WL – Worst restriction level – Worst stage of restriction reached during thesimulation period
DR – Duration of restrictions Months Maximum consecutive duration of any form ofrestrictions during the simulation period
FR – Frequency of restrictions – Average annual chance of a restriction event duringthe simulation period
Minimize pumping & treatmentcosts/maximize hydropower revenue
PC – Pumping/ treatment costs $mil/year Average annual cost of pumping and treatmentduring the simulation period
HR – Hydropower revenue $mil/year Average annual revenue from hydropowergeneration during the simulation period
Minimize the effects on environment RF – River flows Gl/year Average annual total river flows during thesimulation period
Maximize supply sustainability MS – Total system minimum storage Gl Minimum monthly total storage volume reachedduring the simulation period
P.N. Kodikara et al. / European Journal of Operational Research 206 (2010) 209–220 211
from the DMs. These preferences should be modelled in such a waythat it provides the specific input information in the required form.Two types of information derived for each DM facilitate preferencemodelling in PROMETHEE: (1) A ‘Preference Function’ for each PMand (2) relative importance of PMs (expressed by weights).
3.1. Preference function
A preference function, p(x) is introduced for each PM in order toallow the comparison of different PMs independently to their mea-surement units and also to control the unwanted compensatory ef-fects when aggregating the preferences. In pair-wise comparison ofalternatives, the preference function translates the deviation (x)between the evaluations of the two alternatives on a single PM,to a preference degree (i.e. preference intensity), which will havea value between 0 and 1. The preference function is an increasingfunction of the deviation; smaller deviations will contribute toweaker degrees of preference and larger ones to stronger degreesof preference. Negligible deviations would indicate indifferencein preferences (Visual Decision, 2003).
Fig. 2. Generalized preference function types of PRO
To facilitate the association of a preference function to each PM,the authors of the PROMETHEE method (Brans et al., 1986) haveproposed six specific shapes as shown in Fig. 2 and Decision Lab2000� software facilitates these six shapes. Each shape dependson up to two thresholds, i.e. indifference threshold (q), preferencethreshold (p) and Gaussian threshold (s). Type I, Type II and Type IIIare variants of Type V. To illustrate the meaning of thresholds, con-sider a Type V function for a particular PM, which has thresholds pand q. When comparing two alternatives, this would mean thatwith a difference of the values of the PM (of the alternatives) of lessthan q, the DM considers the alternatives are indifferent, while adifference of between q and p, DM would indicate a weak prefer-ence of the higher-valued alternative. With any difference abovep, the DM indicates a strong preference for the higher-valuedalternative.
There is hardly any literature on eliciting the preference thresh-olds (p, q and s) and deriving preference functions for use in thePROMETHEE method. Most of the applications employed the directmethod of asking the DMs to prescribe these parameters (e.g.Georgopoulou et al., 1998; Spengler et al., 1998) and there are nostated difficulties in determining the preference parameters from
METHEE. (Source: Brans and Mareschal, 2005).
212 P.N. Kodikara et al. / European Journal of Operational Research 206 (2010) 209–220
the DMs who may have had a good understanding of the decisionproblem in hand. However, in cases where some of the DMs arerepresenting and are selected from the general public, the prefer-ence elicitation process may have to be carefully designed in orderto accurately determine the preference parameters.
3.2. Weights
Often in MCDA, a DM sees one PM is more (or less) importantthan another; this may be for various reasons including personalpreferences which may be reasonably objective or completely sub-jective (Pomerol and Barba-Romero, 2000). To express these differ-ences, PROMETHEE requires a set of weights (or relativeimportance), {wj, j = 1,2, . . . ,n} for n number of PMs which are de-rived for each DM, where the normalised weights would add up to1 (i.e.
Pnj¼1wj ¼ 1).
The method first proposed by Simos (1990) uses a ‘Pack ofCards’ and a simple procedure, to determine the numerical valuesfor the weights of PMs in an indirect way. Rogers et al. (2000) de-scribe this ‘Simos’ Procedure’ (Figueira and Roy, 2002) as follows:
(1) A number of cards are handed to the DM, with the name ofeach PM on a separate card, together with the outline infor-mation concerning the nature of the PM. Several blank cardsare also supplied.
(2) The DM is then asked to order the cards from 1 to n in orderof importance, with the PM ranked first being the leastimportant and the one ranked last deemed the most impor-tant. If certain PMs are of the same importance in the opin-ion of the DM, their cards are grouped together.
(3) In order to represent smaller or greater gaps in the weights,the DM is asked to place blank cards between two succes-sively ranked cards (or groups of cards).
Subsequently, Figueira and Roy (2002), in their ‘Revised Simos’Procedure’ proposed a revision to the above ‘Simos’ Procedure’ toaccount for the:
� Information concerning the relationship between the weigh-tings of the most and least important PMs, and
� Modifications identified as necessary for the weight calcula-tion procedure.
This Revised Simos’ Procedure gathers the same basic informa-tion as the original Simos’ Procedure, as detailed in (1), (2) and (3)above, together with one additional question, i.e. (4) below:
(4) ‘How many times more important is the most important PM(or group of PMs), relative to the least important PM (orgroup of PMs)?’
A distinct advantage of both the original and revised Simos’weighting methods is their ability to express the weighting prefer-ences on an ordinal scale. The respondents often find it easier toexpress their weightings on an ordinal scale rather than on anumerical scale (Rogers et al., 2000). The active participation inthe procedure also gives the participants an intuitive understand-ing of the method. Therefore, the stakeholder preference informa-tion on PM weights in this case study was collected using the‘Revised Simos’ Procedure’ through face-to-face interviews. How-ever, one shortcoming observed with this method was that in caseswhere the DM’s spontaneous response to (4) above differed sub-stantially from the total number of cards used (including blankcards), the calculated normalised weights of PMs showed a distor-tion of the original PM rank order expressed by the DM. It is thendebatable whether the DM’s understanding of this scale (with
blank cards inserted) would be a ranking order or a ratio scale. Thisaspect related to the case study will be further discussed in Section5.1.2.
4. Stakeholder preference elicitation and modelling for the casestudy
To elicit the importance of PMs (i.e. weights) through the ‘Re-vised Simos’ Procedure’, this study required the interviewer tomeet each respondent individually. Therefore, a personal interviewsurvey with prepared questions was conducted for eliciting all thepreference information (including preference functions) from therepresentative stakeholder groups. The survey was carried out onthree potential stakeholder groups of the Melbourne water supplysystem, viz. resource managers, water users, and those represent-ing environmental interest groups.
Compared to the water users and environmental interestgroups, the resource managers were assumed to possess a goodknowledge of the system and well conversant with the definitionsof the PMs. Therefore, to derive the preference functions, two dif-ferent questionnaires were used one for water users and environ-mental interest groups, and another for the resource managers.The interviewing procedure and the questionnaire used foraccounting and quantifying the preference thresholds from waterusers and environmental interest groups contained more simpli-fied questions in relation to preference functions, whereas a morestraightforward approach was used for resource managers. In con-trast to the concept of preference function, the concept of weightswas considered to be more comprehensible to the participants andtherefore, to elicit information necessary to derive the numericalweights, a single method, i.e. ‘Revised Simos’ Procedure’ (Figueiraand Roy, 2002), was used across all three stakeholder groups.
Ninety-seven people were interviewed. Six staff members of theWater Resources Group at Melbourne Water represented the re-source managers. Six academic staff members/post-graduate stu-dents of Victoria University who are working on environmentalsustainability matters represented environmental interest groupsand a further 85 staff members represented the water users. Twowater user representatives’ responses could not be used as onedid not want to complete the weight elicitation and the other didnot agree with the overall goal. While these groups are relativelyselective samples, they were considered adequate consideringthe nature of the case study and the cost and time limitations.The staff members of Victoria University who participated in theproject were not only academics, and there were also technicaland administrative staff and post-graduate research students,which ensured different levels of society to a certain extent.
4.1. Survey methodology and responses – resource mangers
4.1.1. Preference functions on PMsSeparate interviews were conducted with each of the six re-
source managers to identify the preference functions for eachPM. To assist them with understanding the various parameters re-quired, an information attachment was provided to them prior tothe interview. At the interview, they were asked to select a prefer-ence function type for each of the eight PMs. Most resource man-agers wished to use the direct method of selecting a preferencefunction for each of the PMs from the six available types of gener-alised preference functions.
4.1.2. Weights on PMsIt was noted that the number of PMs considered under each
objective was different (Table 1); for example, there were fourPMs under the objective of ‘maximising the level of service’
P.N. Kodikara et al. / European Journal of Operational Research 206 (2010) 209–220 213
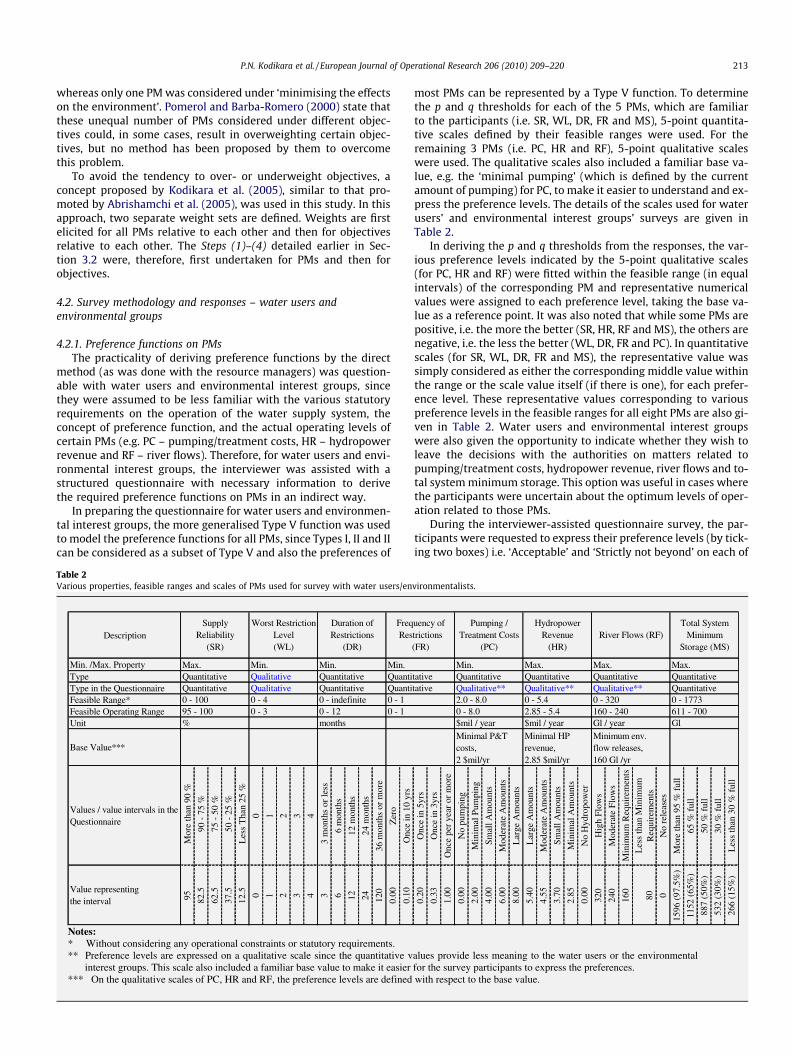
whereas only one PM was considered under ‘minimising the effectson the environment’. Pomerol and Barba-Romero (2000) state thatthese unequal number of PMs considered under different objec-tives could, in some cases, result in overweighting certain objec-tives, but no method has been proposed by them to overcomethis problem.
To avoid the tendency to over- or underweight objectives, aconcept proposed by Kodikara et al. (2005), similar to that pro-moted by Abrishamchi et al. (2005), was used in this study. In thisapproach, two separate weight sets are defined. Weights are firstelicited for all PMs relative to each other and then for objectivesrelative to each other. The Steps (1)–(4) detailed earlier in Sec-tion 3.2 were, therefore, first undertaken for PMs and then forobjectives.
4.2. Survey methodology and responses – water users andenvironmental groups
4.2.1. Preference functions on PMsThe practicality of deriving preference functions by the direct
method (as was done with the resource managers) was question-able with water users and environmental interest groups, sincethey were assumed to be less familiar with the various statutoryrequirements on the operation of the water supply system, theconcept of preference function, and the actual operating levels ofcertain PMs (e.g. PC – pumping/treatment costs, HR – hydropowerrevenue and RF – river flows). Therefore, for water users and envi-ronmental interest groups, the interviewer was assisted with astructured questionnaire with necessary information to derivethe required preference functions on PMs in an indirect way.
In preparing the questionnaire for water users and environmen-tal interest groups, the more generalised Type V function was usedto model the preference functions for all PMs, since Types I, II and IIcan be considered as a subset of Type V and also the preferences of
Table 2Various properties, feasible ranges and scales of PMs used for survey with water users/en
most PMs can be represented by a Type V function. To determinethe p and q thresholds for each of the 5 PMs, which are familiarto the participants (i.e. SR, WL, DR, FR and MS), 5-point quantita-tive scales defined by their feasible ranges were used. For theremaining 3 PMs (i.e. PC, HR and RF), 5-point qualitative scaleswere used. The qualitative scales also included a familiar base va-lue, e.g. the ‘minimal pumping’ (which is defined by the currentamount of pumping) for PC, to make it easier to understand and ex-press the preference levels. The details of the scales used for waterusers’ and environmental interest groups’ surveys are given inTable 2.
In deriving the p and q thresholds from the responses, the var-ious preference levels indicated by the 5-point qualitative scales(for PC, HR and RF) were fitted within the feasible range (in equalintervals) of the corresponding PM and representative numericalvalues were assigned to each preference level, taking the base va-lue as a reference point. It was also noted that while some PMs arepositive, i.e. the more the better (SR, HR, RF and MS), the others arenegative, i.e. the less the better (WL, DR, FR and PC). In quantitativescales (for SR, WL, DR, FR and MS), the representative value wassimply considered as either the corresponding middle value withinthe range or the scale value itself (if there is one), for each prefer-ence level. These representative values corresponding to variouspreference levels in the feasible ranges for all eight PMs are also gi-ven in Table 2. Water users and environmental interest groupswere also given the opportunity to indicate whether they wish toleave the decisions with the authorities on matters related topumping/treatment costs, hydropower revenue, river flows and to-tal system minimum storage. This option was useful in cases wherethe participants were uncertain about the optimum levels of oper-ation related to those PMs.
During the interviewer-assisted questionnaire survey, the par-ticipants were requested to express their preference levels (by tick-ing two boxes) i.e. ‘Acceptable’ and ‘Strictly not beyond’ on each of
vironmentalists.

214 P.N. Kodikara et al. / European Journal of Operational Research 206 (2010) 209–220
the PMs. Since the ‘q’ and ‘p’ thresholds in PROMETHEE interpreta-tion is not readily understandable to survey participants, it wasnecessary to make the scales of PMs clear to the participants (bythe interviewer) prior to recording the preference levels. For posi-tive PMs, if one starts at the ‘most desired’ end of the value scaleand gradually decreases the value through the acceptable region,it will eventually reach the lower end of the acceptable region. Itis this value/range that the interviewer recorded as ‘Acceptable’.The interviewer also made it clear to each participant that the‘Strictly not beyond’ level should be the lower end of the hesitantregion. Two alternatives with PM values within the acceptable re-gion would be indifferent to the DM, and in this case, the maxi-mum difference that the PM values could have is the differencebetween the ‘most desired’ and ‘Acceptable’ values. Once estab-lished, this maximum value was considered to be the differencebetween the alternatives with respect to that particular PM, irre-spective of where the PM values lie in the scale. In PROMETHEEinterpretation this is equivalent to ‘q’ value. A similar approachwas adopted to derive ‘p’ values.
Acceptable Strictly not beyond
More than 90%
90% - 75%
75% - 50%
50% - 25%
Less than 25%
Fig. 3. Typical preference levels of SR – monthly supply reliability.
Acceptable Strictly not beyond
No pumping
Minimal pumping
Small amounts
Moderate amounts
Large amounts
Fig. 4. Typical preference levels of PC – pumping/treatment costs.
Table 3Preference functions on PMs – resource managers.
Resource manager Performance measure (PM)
SR WL DR F
RM1 Type I Type I Type V Tq = 4 qp = 8 p
RM2 Type II Type VI Type II Tq = 2 s = 2 q = 6 q
RM3 Type III Type III Type III Tp = 5 p = 3 p = 12 q
p
RM4 Type II Type II Type II Tq = 5 q = 3 q = 10 q
p
RM5 Type II Type II Type II Tq = 5 q = 2 q = 12 q
RM6 Type II Type II Type II Tq = 5 q = 3 q = 12 q
Typical answers recorded by the interviewer during the ques-tionnaire survey on the preference levels of SR – monthly supplyreliability (with a quantitative scale) and PC – pumping/treatmentcost (with a qualitative scale) are given in Figs. 3 and 4, respec-tively. These answers were then converted to relevant p and qthresholds. In this case study, the value q was derived as the differ-ence between the most desired end of the preference scale (whichhas already been established) and the ‘Acceptable’ level (as indi-cated by the respondent). Similarly, p is derived as the differencebetween the most desired end of the preference scale and ‘strictlynot beyond’ level (as indicated by the respondent). For SR, the mostdesired end of the scale is 100%. Therefore, according to Table 2 andFig. 3, q = 100% � 82.5% = 17.5% and p = 100% � 37.5% = 62.5%. ForPC, the most desired end of the scale was ‘No pumping’ with itsrepresentative value of 0, and therefore, q = (4 � 0) = 4 andp = (6 � 0) = 6 (Table 2 and Fig. 4). The q and p values thus derivedfor 85 water users and six environmentalists are given in Sections5.2 and 5.3, respectively.
4.2.2. Weights on PMsThe information necessary for determining the weights for
water users and environmentalists were obtained using the sameprocedure adopted for the resource managers as described inSection 4.1.
5. Survey results – preference functions and weights
5.1. Survey results with resource managers
5.1.1. Preference functionsThe preference function types derived from the resource man-
agers responses are given in Table 3.
5.1.2. WeightsThe intermediate weights for PMs and weights for objectives
are calculated using the Revised Simos’ Procedure of Figueira andRoy (2002). These intermediate weights of the PMs are thenmultiplied by the corresponding objective’s weight factor to calcu-late the final PM weights. In order to illustrate the method on asample calculation, resource manager 1’s responses on PMs, whichare given in Fig. 5, are used.
Step (1) – Calculation of intermediate weights of PMs.The rank, r, of a PM is defined in the order of increasing impor-
tance. ‘z’ is the number (or value) given by resource manager 1 to
R PC HR RF MS
ype V Type V Type V Type I Type III= 0.06 q = 1 q = 0.15 p = 90= 0.1 p = 2 p = 2.15
ype II Type II Type II Type I Type V= 0.067 q = 3 q = 1 q = 270
p = 450
ype V Type V Type III Type III Type IV= 0.1 q = 1 p = 3.6 p = 80 q = 92= 0.2 p = 5 p = 184
ype V Type V Type V Type III Type III= 0.05 q = 2 q = 0.2 p = 80 p = 50= 0.2 p = 6 p = 3.2
ype II Type I Type II Type II Type II= 0.2 q = 1.9 q = 80 q = 39
ype II Type II Type II Type II Type I= 0.06 q = 2 q = 1.9 q = 30

P.N. Kodikara et al. / European Journal of Operational Research 206 (2010) 209–220 215
the question ‘How many times more important is the most impor-tant PM compared to the least important PM?’. When there are noblank cards placed in between two PM cards, it is taken as one gapexisting between them. Likewise, if there are three blank cardsplaced in between two PMs, there are four gaps in between them.If X is the total number of gaps between the highest ranked PM andthe lowest ranked PM (i.e. WL and HR for resource manager 1),then parameter u, such that u = (z � 1)/X, is defined to calculatethe non-normalised weights of PMs. It is noted that each gap willcontribute a weight value equal to u to the next highest rank.Therefore from Fig. 5, for resource manager 1, z = 100, and the totalnumber of gaps between highest and lowest ranked PMs, X = 17.Then, u = (z � 1)/X = (100 � 1)/17 = 5.824.
From this, the non-normalised weight k(1), . . . ,k(r), . . . ,k(n)associated with each PM, arranged in order of increasing impor-tance is calculated for, r = 1, . . . ,n where n = number of ranking lev-els as:
kðrÞ ¼ 1þ uXr�1
i¼0
xi;
where xi is the number of gaps between PMs with ranks i and (i + 1)with x0 = 0.
If there are several PMs on rank r, all the PMs are given the samenon-normalised weight k(r). The non-normalised weights are thennormalised to give the sum of weights as 100%. The intermediateweights of PMs thus derived from resource manager 1’s responsesare given in Table 4, showing the above calculation procedure.
As stated in Section 3.2, if the sum of original rank positions(with blank cards inserted) is substantially different from ‘z’, thismethod tends to distort the original ranking order of DM’s prefer-ence on PMs. Also, the effect is more noticeable on the lower-rank-ing PMs. For example, in the responses given in Table 4, the totalnumber of cards used (including blank cards) = 18 and z = 100.After giving the opportunity to insert the blank cards, the DM didnot insert any blank cards in between HR and PC. Therefore, theDM may have indicated that the weight of PC to be 2 times theweight of HR, i.e. PC to be 2 times more important than HR. How-
Number of bl
0 3 2 0
WL is 100 times more im
PC RF MSHR
Fig. 5. RM1’s respons
Table 4Sample calculation using ‘Revised Simos’ Procedure’ to derive intermediate weights of PM
Rank, ra PMs in therank ra
Number ofPMs in rank r
Number of blankcards followingrank ra
Rank with blankcards inserted
1 HR 1 0 12 PC 1 3 23 RF 1 2 64 MS 1 0 95 SR 1 0 106 FR 1 2 117 DR 1 3 148 WL 1 – 18
Sum 71
a RM1’s responses recorded at the interview survey are indicated in bold.
ever, the normalised intermediate weights calculated do not reflectthis ratio.
Step (2) – Calculation of objectives’ weights.In a similar calculation procedure, the ranks assigned by the re-
source manager 1 for each objective and the resultant objectives’weights (normalised) were computed using the Revised Simos’Procedure.
Step (3) – Calculation of final PM weights.As stated earlier, to compute the final weight of the PMs, which
takes into account the importance of the objectives, the normalisedintermediate weights derived for the PMs were multiplied by an‘Objective’s Weight Factor’ defined for each objective as:
Objective’s Weight Factor
¼ Corresponding objective’s weightðTotal aggregated intermediate PM weights in the objectiveÞ :
For example, the four PMs: SR, WL, DR and FR, all belong to ‘Level ofService’ objective. Resource manager 1’s intermediate weights forSR, WL, DR and FR are 14.25, 26.68, 20.46 and 15.80, respectively.The total aggregated intermediate PM weights within the ‘Level ofService’ objective is (14.25 + 26.68 + 20.46 + 15.80) = 77.19, andthe corresponding objective’s weight for ‘Level of Service’ computedusing the revised Simos’ procedure = 49.50. Therefore, resourcemanager 1’s final weight for SR = 14.25 � 49.50/77.19 = 9.14.
The final (rounded) PM weight sets thus calculated for resourcemanagers are shown bold in Table 5. These final weight values en-sured that resource managers’ priority preferences on objectiveswere accounted for in the final decision. Although most of thePM weights and objectives’ weights derived for participants wereconsistent with each other, there were few irrationalities observedin some cases. The final weight values of PMs were considered asthe input weight parameters for the individual resource managersin the decision analysis of the operating rules.
The Revised Simos’ Procedure, assumes that the insertion ofblank cards between the cards representing PMs or objectives,would mean that the number associated with the PM is simply arank order. However, as discussed in Section 3.2 and Step (1) above,
ank cards
0 2 3
portant than HR
SR FR DR WL
es on PM cards.
s on RM1’s responses.
No. of gapsbetween rand (r + 1), xr
Non-normalizedintermediateweight, k(r)
Total Normalizedweight
Intermediateweight
1 1.00 1.00 0.26675 0.274 6.82 6.82 1.820179 1.823 30.12 30.12 8.033893 8.031 47.59 47.59 12.69418 12.691 53.41 53.41 14.24761 14.253 59.24 59.24 15.80104 15.804 76.71 76.71 20.46132 20.46
– 100 100.00 26.67504 26.68
17 374.89 100 100

Table 5Final (rounded) weights of PMs – resource managers.
216 P.N. Kodikara et al. / European Journal of Operational Research 206 (2010) 209–220
it could well be the ratio scale that the respondent wished to ex-press. To eliminate any ambiguity, it is suggested in future workto extract a new piece of information prior to posing question(4), i.e. once the interviewer establishes the total number of cardsused (say ‘y’), the DM could be asked whether he/she meant thatthe most important PM to be ‘y’ times more important than theleast important PM. If the answer is ‘Yes’ then ‘z’ is considered as‘y’; otherwise a new ‘z’ could be introduced with the answer tothe above question. This is a new piece of information that wouldascertain the original order expressed by the DM (with blank cardsinserted) is a ranking order or a ratio scale.
5.2. Survey results with water users
5.2.1. Preference functions – water usersThe preference functions for water users were derived from the
questionnaire responses. Those who ‘strongly oppose restrictions’were assigned with Type I function for both SR – reliability of sup-ply and DR – duration of restrictions, indicating their zero toler-ance below 100% supply reliability. Those who ‘Preferred norestrictions’ were assigned with a Type III function (V-shaped gen-eralised function type where q = 0) for DR – duration of restric-tions. There was only one water user who strongly opposed therestrictions and eight water users who preferred not to have waterrestrictions. Those who preferred no restrictions were hesitantabout the issue of restrictions and they would neither strongly op-pose nor willingly accept the restrictions. There were a reasonablepercentage of water users expressed their desire for the decisionsto be taken by the water authority on matters relating to pump-ing/treatment costs (58% of all water users), hydropower revenue(53%), river flows (55%) and minimum reservoir storages (35%).
The p and q values were calculated from the survey responsesfor each water user as explained in Section 4.2.1. In special caseswhere water users indicated that the decision to be taken by the
water authority, their individual preferences on that particularPM were assumed to be similar to that of the preferences of themajority of resource managers. The numerical values of p and qare thus derived from the 84 water users’ survey responses. Sinceone’s judgement on the preference threshold value p is having aninfluence of his/her q value on any PM, p andq values are consid-ered to be dependent on each other. Therefore, the p and q valuesare always considered together, and are treated as ‘categorical’ (ornominal) data in the analysis. The paired p and q values for waterusers are graphically shown (bar charts) in Fig. 6. For each combi-nation of p (x-axis) and q (y-axis), a frequency, n is indicated (z-axis). There is a clear majority for combined p and q values onsix PMs, i.e. DR, FR, PC, HR, RF and MS. However, in the case ofSR and WL, the majority is not as prominent as for other PMs.
5.2.2. Weights – Water usersThe water user survey responses on weight elicitation were
used to calculate the final weight values of PMs for 83 water usersin the same way as that explained in Section 5.1.2 for resourcemanagers, employing the Revised Simos’ Procedure (Figueira andRoy, 2002). The frequency distributions for weight values of theeight PMs are given in Fig. 7. It is noted that the frequencydistributions of all four ‘Level of Service’ related PMs (i.e. SR, WL,DR and FR) and both the ‘Costs/Revenue’ related PMs (i.e. PC andHR) are positively skewed, whereas the remaining two PMs (i.e.RF and MS) are closer to normal distributions.
5.3. Survey results with environmental interest groups
Preference elicitation process and derivation of preferenceinformation from the survey responses for environmental interestgroups was undertaken in a similar way as for the water users. Theresults were similar to water users in Section 5.2, but with a re-duced number (6) of participants.

Fig. 6. Paired p and q values of the PMs – water users.
P.N. Kodikara et al. / European Journal of Operational Research 206 (2010) 209–220 217

0
5
10
15
20
1 5 9 13 17 21 25 29More
Weight - SR
Freq
uenc
y
0246810121416
1 5 9 13 17 21 25 29 33 37 M
Weight - WL
Freq
uenc
y
0
24
6
8
1012
14
1 3 5 7 9 11 13 15 17
Weight - DR
Freq
uenc
y
02468101214
1 5 9 13 17 21 25 29 33More
Weight - FR
Freq
uenc
y
0
24
6
8
1012
14
1 5 9 13 17 21 25 29
Weight - PC
Freq
uenc
y
0246810121416
1 3 5 7 9 11 13 15 17More
Weight - HR
Freq
uenc
y
0
2
4
6
8
10
12
1 7 13 19 25 31 37 43 49 55
Weight - RF
Freq
uenc
y
0123456789
1 7 13 19 25 31 37 43 49 55 61
Weight - MS
Freq
uenc
y
Fig. 7. Frequency distributions on PM weights – water users.
218 P.N. Kodikara et al. / European Journal of Operational Research 206 (2010) 209–220
6. Stakeholder preference parameters for group decisionanalysis
To illustrate the idea of group decision-making in this study, itwas decided to form decision-making groups comprising all indi-vidual resource managers and representatives from water usersand environmental groups. For this purpose, the input preferenceparameters (preference functions and weights on PMs) wereneeded for individual resource managers, representative wateruser (WUrep), and representative environmentalist (ENrep).
The details of individual resource managers’ preference func-tions and weights on PMs as derived earlier are given in Tables 3and 5 respectively. However, in modelling WUrep’s and ENrep’s pref-erence parameters, it was necessary to derive single sets of repre-sentative preference functions and weights for eight PMs. Asdescribed in Sections 5.2 and 5.3, the paired p and q values wereconsidered as ‘categorical’; the values of these variables are catego-
ries and there is no numerical meaning attached to the category la-bel. Therefore, a representative p and q for each PM was taken asthe modal value, representing the most number of occurrences ina category. However, in the special case of every participant givinga different p and q combination for a PM (e.g. PC – pumping/treat-ment costs for environmental interest groups), a random combina-tion for p and q was chosen as the representative value for thegroup. The values of p and q automatically identified the PF type(assuming Type V curve and its variants). The details of preferencefunctions thus derived for group decision-making for WUrep andENrep are presented in Table 6.
To arrive at single representative PM weight values for waterusers and environmental interest groups in a group decision-mak-ing situation, the median was considered as the representative va-lue, since it agrees with the majority view of the group (Hokkanenand Salminen, 1994). One other advantage of the median value isthat it is not as sensitive to extreme values as the mean value.

Table 6Representative water user and environmentalist preference functions.
SR WL DR FR PC HR RF MS
WUrep Type III Type II Type II Type II Type V Type V Type V Type Vq = 0 q = 4 q = 120 q = 1 q = 1.5 q = 0.86 q = 18.3 q = 208p = 87.5 p = 4 p = 120 p = 1 p = 3 p = 2.29 p = 45 p = 380
ENrep Type II Type II Type II Type II Type II Type V Type V Type IIq = 87.5 q = 4 q = 120 q = 1 p = 2 q = 0.85 q = 80 q = 621p = 87.5 p = 4 p = 120 p = 1 q = 2 p = 1.7 p = 160 p = 621
Table 7Final weights of PMs – individual decision makers.
Performance measure (PM)
SR WL DR FR PC HR RF MS
RM1 9.14 17.11 13.12 10.13 14.66 0.57 0.50 33.17RM2 7.00 8.00 8.00 7.00 12.56 10.77 26.67 20.00RM3 4.40 7.77 2.571 5.24 0.50 0.02 20.12 59.17RM4 1.39 3.69 1.06 4.67 10.28 8.64 27.03 43.24RM5 10.32 14.13 11.59 9.05 25.59 10.57 0.45 18.30RM6 8.22 3.39 6.61 5.00 1.70 0.17 37.46 37.46WUrep 4.70 4.03 5.15 4.60 5.82 3.77 32.00 35.00ENrep 4.21 3.70 4.19 4.14 1.61 4.14 39.50 36.50
P.N. Kodikara et al. / European Journal of Operational Research 206 (2010) 209–220 219
However, the geometric mean could also be used to arrive at singlerepresentative PM weight values. The final weights on PMs thusderived for WUrep and ENrep are presented in Table 7. This tablealso shows the final weights of six resource managers. These pref-erence parameters (preference functions and weights on PMs) ofthe three stakeholder groups can be used in several single DM sit-uations and group decision-making situations, as input parametersto Decision Lab 2000 software.
7. Summary
Recent literature suggest that there is a growing shift towardsthe methodical inclusion of stakeholder preferences in practicaldecision making situations related to sustainable water resourcemanagement. The stakeholder preferences often have a great influ-ence on the final decision, at the same time, bringing in someuncertainty into the decisions. This paper described a detailedmethodology used to elicit stakeholder preference parameters ofthe major stakeholder groups of the Melbourne water supply sys-tem, as required by PROMETHEE and Decision Lab 2000. The prefer-ence elicitation process comprised an interviewer-assistedquestionnaire survey to derive the preference functions andweights for the performance measures (PMs) from stakeholdersof the Melbourne water supply system. A total of 97 participantswere recruited for the survey from Melbourne Water and VictoriaUniversity representing the categorisation of hypothetical stake-holder groups, resource managers, water users and environmentalinterest groups. This paper described the process used to elicitpreference information from the stakeholders and how this infor-mation was used to compute the preference threshold values andthe corresponding weight values for the three stakeholder groupsfor use as input parameters to Decision Lab 2000 software.
Although eliciting preference intensities from the resourcemanagers seemed to be straightforward using the generalized pref-erence function types proposed in the PROMETHEE method, theneed for developing an indirect approach was identified for otherstakeholder groups who are not familiar with either the feasibleranges of the PM values or the generalised preference functiontypes described in the PROMETHEE method. The ‘Revised Simos’Procedure’, the technique used to collect information on weights,
proved to be well accepted by all participants. However, in caseswhere the DM’s spontaneous response to the question ‘How manytimes more important is the most important PM (or group of PMs),relative to the least important PM (or group of PMs)?’ differs sub-stantially from the total number of cards used (including blankcards), the calculated normalised weights of PMs shows a distor-tion of the original PM rank order expressed by the DM. Furtherstudy on this aspect is suggested to identify whether the DM’sunderstanding of this scale (with blank cards inserted) would bea ranking order or a ratio scale. An improvement to the surveyquestionnaire was also suggested in the paper to eliminate thisambiguity.
The approach of modelling preference parameters described inthis paper enabled the evaluation and comparison of the alterna-tive operating rules when PM values are available for each operat-ing rule. The evaluation of alternative operating rules, using thederived preference parameters including group decision-makingwill be discussed in a future publication.
Acknowledgements
This work was made possible by a joint grant from AustralianResearch Council and Melbourne Water. The authors wish to thankthe Strategy and Planning Group of Melbourne Water and the staffand post-graduate students of Victoria University who contributedto this research by exchange of ideas and their voluntary participa-tion in the survey. The contribution made by Professor MichaelHasofer on the statistical analysis is thankfully acknowledged.The authors also wish to thank the Editor and the two anonymousreviewers for their constructive comments, which led to improve-ments in the quality of the paper.
References
Abrishamchi, A., Ebrahimian, A., Tajrishi, M., Marino, M.A., 2005. Case study:Application of multicriteria decision making to urban water supply. Journal ofWater Resources Planning and Management 131 (4), 326–335.
Ananda, J., Herath, G., 2009. A critical review of multi-criteria decision makingmethods with special reference to forest management and planning. EcologicalEconomics 68 (10), 2535–2548.
Brans, J.P., Mareschal, B., 2005. PROMETHEE methods. In: Figueira, J., Greco, S.,Ehrgott, M. (Eds.), State of the Art Surveys. Springer, New York.
Brans, J.P., Mareschal, B., Vincke, P., 1986. How to select and how to rank projects:The PROMETHEE method. European Journal of Operational Research 24, 228–238.
Draper, A.J., Munevar, A., Arora, S.K., Reyes, E., Parker, N., Chung, F.I., Peterson, L.E.,2004. CalSim: Generalised model for reservoir system analysis. Journal of WaterResources Planning and Management 130 (6), 480–489.
Figueira, J., Roy, B., 2002. Determining the weights of criteria in the ELECTRE typemethods with a revised Simos’ procedure. European Journal of OperationalResearch 139, 317–326.
Fischoff, P.C., 1980. Clinical decision analysis. Operations Research 28, 28–43.Galloway, G.E., 2005. 2004 Julian Hinds water resources development award
lecture. Journal of Water Resources Planning and Management 131 (4), 251–252.
Georgopoulou, E., Sarafidis, Y., Diakoulaki, D., 1998. Design and implementation of agroup DSS for sustaining renewable energies exploitation. European Journal ofOperational Research 109, 483–500.
Ghanbarpour, M.R., Hipel, K.W., Abbaspour, K.C., 2005. Prioritizing long-termwatershed management strategies using group decision analysis. InternationalJournal of Water Resources Development 21 (2), 297–308.
220 P.N. Kodikara et al. / European Journal of Operational Research 206 (2010) 209–220
Hajkowicz, S.A., 2008. Supporting multi-stakeholder environmental decisions.Journal of Environmental Management 88 (4), 607–614.
Herath, G., 2004. Incorporating community objectives in improved wetlandmanagement: The use of the analytic hierarchy process. Journal ofEnvironmental Management 70 (3), 263–273.
Himes, A.H., 2007. Performance indicators in MPA management: Usingquestionnaires to analyze stakeholder preferences. Ocean and CoastalManagement 50 (5), 329–351.
Hokkanen, J., Salminen, P., 1994. The choice of a solid waste management system byusing the ELECTRE III decision-aid method. In: Paruccini, M. (Ed.), ApplyingMCDA for decision to Environmental Management. Kluwer, Dordrecht, Holland.
Jacquet-Lagréze, E., Siskos, J., 1982. Assessing a set of additive utility functions formulticriteria decision making; the UTA method. European Journal ofOperational Research 10 (2), 151–164.
Joubert, A., Stewart, T.J., Eberhard, R., 2003. Evaluation of water supplyaugmentation and water demand management options for the city of CapeTown. Journal of Multicriteria Decision Analysis 12, 17–25.
Keeny, R.L., Raiffa, H., 1976. Decisions with Multiple Objectives: Preferences andValue Trade-offs. Wiley, UK.
Kodikara, P.N., Perera, B.J.C., Kularathna, M.D.U.P., 2005. Preference modelling inmulti-objective operation of urban water supply systems – A case study onMelbourne water supply system. In: International Congress on Modelling andSimulation, Melbourne, Australia.
Krancman, D.R., McKinney, D.C., Watkins, D.W., Lasdon, L.s., 2006. Stochasticoptimisation of the highland lakes system in Texas. Journal of Water ResourcesPlanning and Management 132 (2), 62–70.
Larson, K.L., Denise, L., 2008. Participants and non-participants of place-basedgroups: An assessment of attitudes and implications for public participation inwater resource management. Journal of Environmental Management 88 (4),817–830.
Leach, W.D., Pelky, N.W., 2001. Making watershed partnerships work: A review ofthe empirical literature. Journal of Water Resources Planning and Management127, 378–385.
Lund, J.R., Ferreira, I., 1996. Operating rule optimisation for Missouri River reservoirsystem. Journal of Water Resources Planning and Management 122 (4), 287–295.
McPhee, J., Yeh, W.W.G., 2004. Multiobjective optimisation for sustainablegroundwater management in semiarid regions. Journal of Water ResourcesPlanning and Management 130 (6), 490–497.
Perera, B.J.C., Codner, G.P., 1996. Reservoir targets for urban water supply systems.Journal of Water Resources Planning and Management, ASCE 122 (4), 270–279.
Perera, B.J.C., James, B., Kularathna, M.D.U.P., 2005. Computer software tool REALMfor sustainable water allocation and management. Journal of EnvironmentalManagement 77, 291–300.
Pomerol, J.C., Barba-Romero, S., 2000. Multi-Criterion Decisions in Management:Principles and Practice. Kluwer, Massachusetts, USA.
Rogers, M., Breen, M., Maystre, L., 2000. ELECTRE and Decision Support. Kluwer,Massachusetts, USA.
Rogers, S.H., Seager, T.P., Gardner, K.H., 2004. Combining expert judgement andstakeholder values with Promethee: A case study in contaminated sedimentmanagement. In: Linkov, I., Ramadan, A.B. (Eds.), Comparative Risk Assessmentand Environmental Design Making. Kluwer, Boston, Massachusetts, pp. 305–322.
Roy, B., 1968. Classement et choix en présence de point de vue multiples: Leméthode ELECTRE. Revue Francaise d’Informatique et de RechercheOpérationnelle (8), 57–75.
Saaty, T.L., 1980. The Analytic Hierarchy Process. McGraw-Hill, New York.Shapira, Z., 1981. Making trade-offs between job attributes. Organisational
Behaviour and Human Decision Making 28, 331–355.Sigvaldason, O.T., 1976. A simulation model for operating a multipurpose multi-
reservoir system. Water Resources Research 12 (2), 263–278.Simos, J., 1990. Evaluer L’Impact sur L’Environment. Presses Polytechniques et
Universitaires, Romandes, Lausanne.Spengler, T., Geldermann, J., Hahre, A., Sieverdingbeck, A., Rentz, O., 1998.
Development of a multiple criteria based decision support system forenvironmental assessment of recycling measures in the iron and steel makingindustry. Journal of Cleaner Production 6, 37–52.
Tejada-Guibert, J.A., Johnson, S.a., Stedinger, J.R., 1993. Comparison of twoapproaches for implementing multi-reservoir operation policies derived usingstochastic dynamic programming. Water Resources Research 29 (12), 3969–3983.
Tompkins, E.L., Few, R., Brown, K., 2008. Scenario-based stakeholder engagement:Incorporating stakeholders preferences into coastal planning for climatechange. Journal of Environmental Management 88 (4), 1580–1592.
Vincke, P., 1999. Robust solutions and methods in decision-aid. Journal ofMulticriteria Decision Analysis 8, 181–187.
Visual Decision, 2003. Decision Lab 2000 – Executive edition, Getting started guide,Montreal, QC, Canada.
Von Winterfeldt, D., Edwards, W., 1986. Decision Analysis and Behavioral Research.Cambridge University Press, Cambridge.
Wang, Y.C., Yoshitani, J., Fukami, K., 2005. Stochastic multiobjective optimisation ofreservoirs in parallel. Hydrological Processes 19 (18), 3551–3567.
Water Resources Strategy Committee, 2002. Final report: Stage 3 in developing awater resources strategy for the greater Melbourne area. Government ofVictoria, Melbourne, Australia.
Whitmarsh, D., Palmieri, M.G., 2009. Social acceptability of marine aquaculture: Theuse of survey-based methods for eliciting public and stakeholder preferences.Marine Policy 33 (3), 452–457.
Wurbs, R.A., 2005. Modeling river/reservoir system management, water allocationand supply reliability. Journal of Hydrology 300 (1–4), 100–113.
Zarriello, P.J., 2002. Simulation of reservoir storage and firm yields of three surface-water supplies, Ipswich River basin, Massachusetts. US Geological SurveyMassachusetts–Rhode Island Water Science Centre, Massachusetts.