1 s2.0-0264837795000259-main
16
Pergamon 0264-8377(95)00025-9 Land Use Policy, Vol. 13, No. 1, pp. 69-84, 1996 Copyright ~) 1995 Elsevier Science Ltd Printed in Great Britain. All rights reserved 0264-8377/96 $10.(X) + 0.(~) Motorization and non- motorized transport in Asia Transport system evolution in China, Japan and Indonesia Walter Hook and Michael Replogle Growth in motor vehicle ownership and use is often seen as an inevitable out- come of increasing GDP and incomes. This paper reviews the range of modal orientations of contemporary metropo- litan areas and uses case studies from China, Japan and Indonesia to illustrate how motorization is influenced by pub- lic policies regarding street-space allocation and use, transportation sub- sidies and transportation system in- vestments, which in turn are influenced by both domestic and international commercial relations. Policies adopted across much of Asia are today promot- ing rapid motorization and the destruc- tion of economically and environmen- tally sustainable low-cost non- motorized transportation modes. Walter Hook is with the Institute for Trans- portation and Development Policy, 611 Broadway, Rm 616, New York, NY 10012. USA (Tel: 212 260 8144; fax: 212 260 7353). Michael Replogle is with the En- vironmental Defense Fund, 1875 Connec- ticut Avenue NW, Washington, DC 20009, USA (Tel: 202 387 3500; fax: 202 234 6049). ~lnternational Institute for Energy Con- servation Assessment of Transportation Growth in Asia and Its Effects on Energy Use, the Environment, and Traffic Conges- continued on page 70 This paper explores some of the dynamics shaping the motorization process in Asia and the characteristics of cities that are dependent on different mixes of transportation modes. Motorization is proceeding rapidly in most cities in Asia and poses a key challenge for transporta- tion planning and system management. Motor vehicle fleets are growing faster than GNP - with 14% yearly growth in China and 30% in Korea, for example. In Thailand between 1989 and 1990 alone the vehicle fleet grew by 40%. I In Indonesia the motor vehicle fleet has been increasing at 8% per year since 1982, and in Jakarta the growth is closer to 15% a year. The number of motorcycles is also increasing rapidly, particularly in India where ownership is growing at 17% annually. In Thailand, Malaysia, Indonesia and India motorcycles account for 70% of the total vehicle fleets, and are responsible for a large and growing proportion of total air pollution. 2 Rapid motorization combined with the relative lack of land dedicated to roads produces severe traffic congestion in most Asian cities, but especially in middle-income cities where non-motorized transportation has been recently displaced by motorized transport. Bangkok is the worst-case scenario, with travel speeds currently below 10 km per hour and falling. It can take four hours to travel from the outlying areas to the center of town. Jakarta and Surabaya are in similar shape, with the urban road network operating at 95% capacity. 3 Road travel speeds in Japan are also slow but average 14 km per hour. In Chinese and Vietnamese cities the number of motor vehicles and bicycles have both been increasing dramatically. The bicycle is gaining mode share in most Chinese cities at the expense of buses. Bicycle sales in China exploded with the initiation of market reforms, as sales 69
-
Upload
seguridad-vial -
Category
Documents
-
view
93 -
download
0
Transcript of 1 s2.0-0264837795000259-main
Pergamon 0264-8377(95)00025-9
Land Use Policy, Vol. 13, No. 1, pp. 69-84, 1996 Copyright ~) 1995 Elsevier Science Ltd
Printed in Great Britain. All rights reserved 0264-8377/96 $10.(X) + 0.(~)
Motorization and non- motorized transport in Asia
Transport system evolution in China, Japan and Indonesia
Walter Hook and Michael Replogle
Growth in motor vehicle ownership and use is often seen as an inevitable out- come of increasing GDP and incomes. This paper reviews the range of modal orientations of contemporary metropo- litan areas and uses case studies from China, Japan and Indonesia to illustrate how motorization is influenced by pub- lic policies regarding street-space allocation and use, transportation sub- sidies and transportation system in- vestments, which in turn are influenced by both domestic and international commercial relations. Policies adopted across much of Asia are today promot- ing rapid motorization and the destruc- tion of economically and environmen- ta l ly s u s t a i n a b l e low-cos t non- motorized transportation modes.
Walter Hook is with the Institute for Trans- portation and Development Policy, 611 Broadway, Rm 616, New York, NY 10012. USA (Tel: 212 260 8144; fax: 212 260 7353). Michael Replogle is with the En- vironmental Defense Fund, 1875 Connec- ticut Avenue NW, Washington, DC 20009, USA (Tel: 202 387 3500; fax: 202 234 6049).
~lnternational Institute for Energy Con- servation Assessment of Transportation Growth in Asia and Its Effects on Energy Use, the Environment, and Traffic Conges-
continued on page 70
This paper explores some of the dynamics shaping the motorization process in Asia and the characteristics of cities that are dependent on different mixes of transportation modes. Motorization is proceeding rapidly in most cities in Asia and poses a key challenge for transporta- tion planning and system management. Motor vehicle fleets are growing faster than GNP - with 14% yearly growth in China and 30% in Korea, for example. In Thailand between 1989 and 1990 alone the vehicle fleet grew by 40%. I In Indonesia the motor vehicle fleet has been increasing at 8% per year since 1982, and in Jakarta the growth is closer to 15% a year. The number of motorcycles is also increasing rapidly, particularly in India where ownership is growing at 17% annually. In Thailand, Malaysia, Indonesia and India motorcycles account for 70% of the total vehicle fleets, and are responsible for a large and growing proportion of total air pollution. 2
Rapid motorization combined with the relative lack of land dedicated to roads produces severe traffic congestion in most Asian cities, but especially in middle-income cities where non-motorized transportation has been recently displaced by motorized transport. Bangkok is the worst-case scenario, with travel speeds currently below 10 km per hour and falling. It can take four hours to travel from the outlying areas to the center of town. Jakarta and Surabaya are in similar shape, with the urban road network operating at 95% capacity. 3 Road travel speeds in Japan are also slow but average 14 km per hour.
In Chinese and Vietnamese cities the number of motor vehicles and bicycles have both been increasing dramatically. The bicycle is gaining mode share in most Chinese cities at the expense of buses. Bicycle sales in China exploded with the initiation of market reforms, as sales
69
Motorization and non-motorized transport in Asia: W Hook and M Replogle
increased from 10 million per year to 40 million per year between 1980 and 1990. In Shanghai bicycle mode share has increased from 30% in 1981 to 44% in 1991, with almost the entire shift at the expense of bus travel. Currently the motor vehicle lanes in Beijing, Shanghai and Guangzhou are gridlocked in the morning and afternoon rush hours for roughly two hours, although the bicycle lanes are still moving and bicyclists have taken to weaving in and out between the stationary cars, as in New York City. 4 Traffic congestion in both China and Vietnam is exacerbated by the lack of traffic management.
Factors associated with rapid motorization in Asia
While growth in gross domestic product (GDP) is a major driver for motorization, the rapid and profound changes in the modal orientation of Asian cities need to be examined in the light of additional factors, which are described generally and then explored through case studies of China, Indonesia and Japan. Tokyo, with a GNP per capita of over $25 000, has a lower private motor vehicle mode share than Malaysia, with a GNP per capita of less than $4000, and a comparable share to Bangkok, with a per capita GNP under $2000.
Factors positively associated with rapid motorization appear to in- clude decreasing urban densities, the amount of domestic oil production and motor vehicle manufacturing, and the degree of inequality in the distribution of wealth. There are nonetheless severe limitations on explaining these motorization rates in a purely national context. Rapid economic growth and motorization are also encouraged by foreign investment in Asia's motor vehicle infrastructure.
continued from page 69 tion: Case Study of Bangkok, Thailand IIEC, Washington, DC (1992) 2Weaver, C and Chang, L Motorcycle Emissions Standards and Emissions Con- trol Technology: Final Report World Bank and the Dept of Pollution Control, Ministry of Science, Technology, and the Environ- ment, Bangkok, Thailand (1994) " 3International Institute for Energy Con- servation Assessment of Transportation Growth in Asia and Its Effects on Energy Use, the Environment, and Traffic Conges- tion: Case Study of Surabaya, Indonesia IIEC, Washington, DC (1992) 4Cai Jin Xin 'Bicycle transport in Shanghai' The Wheel Extended Toyota Motor Cor- poration, Tokyo, 1994 (90) SAsian Development Bank Thailand 5th Highway Sector Loan Report ADB, Manila (1992)
The role of foreign investment
Japan should be seen as the center of a regional economic system, where the countries of Southeast Asia function not only as raw material suppliers to Japan, but also as a consumer market for Japanese products. As Japan's motor vehicle exports to the USA are levelling off, the Japanese government sees East and Southeast Asia as its primary growth market. In Thailand alone, between 1963 and 1986 Japan's Overseas Economic Cooperation Fund (OECF) invested $135 million in road infrastructure. Then, between 1987 and 1991 alone, another $283.5 million was spent on roads. OECF has recently announced plans to invest at least another $500 million in the next five years. 5 These funds have been loaned at 3% interest rates, with an 18-year repayment period. With Japan controlling over 80% of motor vehicle imports into Thailand, this largesse is not entirely surprising.
This rapid motorization in the mixed-traffic and non-motorized transport dominated countries of Southeast Asia differs markedly from the level of motorization in Japan at similar levels of GDP. Japan in 1960 had private motor vehicle mode shares of less than 10%, but already had a per capita GNP greater than in Bangkok today, which has a private motor vehicle mode share of over 24%. Japan's domestic development strategy, and that of Hong Kong, Singapore and Korea, differed markedly from the current development patterns in Thailand, Malaysia and Indonesia, and the differences in motorization trends are one indication of this. One way to examine these differences is by examining the variety of metropolitan modal mixes that provide access
70
6Replogle, Michael A Non-Motorized Vehi- cles in Asian Cities World Bank Technical Report, Washington, DC (1992) 7Newman, Peter and Kenworthy, Jeffery Cities and Automobile Dependence Gow- er, Aldershot, UK (1989); and see the article by Newman and Kenworthy in this issue 8Cai op cit Ref 4 9Replogle op cit Ref 6; Midgley, Peter Asian Urban Transport Sector Study World Bank, Washington, DC (1994); Newman and Kenworthy op cit Ref 7; Bertaud, A 'Land markets, urban form, and the en- vironment' Paper delivered at The Human Face of the Urban Environment Confer- ence, 19-21 September 1994 ~°Cai op cit Ref 4
Motorization and non-motorized transport in Asia: W Hook and M Replogle
for individuals and business and the characteristics of different city types.
The modal orientation of cities
There is tremendous variation in the use of different transportation modes in metropolitan regions with comparable levels of GDP in Asia and the world as a whole. Cities can be divided into four broad types: (1) the non-motorized transport dominated city, (2) the mixed traffic city, (3) the public transportation dominated city, and (4) the private motor vehicle dominated city. 6 As would be expected, there are significant differences in land use patterns that correspond to these different city types.
Three of the four types of cities can be found in contemporary Asia, where conditions generally will not support private motor vehicle dominated city patterns due to their intense land, energy and resource consumption. All Asian cities have density levels dramatically higher than in most OECD countries. 7 Private cars account for less than 50% of the mode share in all major Asian cities, including Japanese and Korean cities, with between 20% and 40% being the norm. This con- trasts sharply with Western European cities where private car mode shares tend to be 40-60% or with US and Australian cities where the share rises to 90% or more.
Non-motorized transport (NMT) dominant cities
These are cities where walking and non-motorized vehicles (NMVs) account for a greater share of trips than public transportation or private motorized transportation. Cities and regions with both very low and very high per capita GDP and levels of private motor vehicle ownership are represented in this group.
Low per capita G D P N M T dominant cities. This group includes all Chinese and Vietnamese cities, secondary cities in India (Kanpur, Ahmedabad, Bangalore, Visakhapatnam) and Indonesia (Bandung, Jogjakarta), Bangladesh and Nepal. In these cities non-motorized trips, including bicycling, walking and pedicabs, account for as much as 96% of total trips, while private motor vehicle trips generally account for less than 10% of total trips. In many of these cities, NMT mode shares are now stable or growing, but face a growing threat from rising motoriza- tion. In Shanghai, for example, a 1986 survey showed that 31% of trips were by bicycle, 24% by public transport, 41% by walking, and 4% by passenger car or other means. 8
The NMV dominated cities in Asia share a land use pattern of extremely high density in the central cities and a very steep decline in density as one moves from the city center. As can be seen in Figure 1, Shanghai has an extremely high density profile. The urban- ized area is restricted by and large to a 10 km radius from the city center, where roughly 530 000 people are concentrated per hectarefl These cities tend to dedicate very little land area to road space. Shanghai, for example, dedicates only 3.4% of its land area to road space. Io
High per capita G D P N M T dominant cities. At the other end of the GDP scale, one finds a substantial number of high-income cities in
71

Motorization and non-motorized transport in Asia: W Hook and M Replogle
12000000 /
10000000 ~--
8000000
"=
6000000 ©
4000000 t..)
2000000
Figure 1. Urban populat ion distr ibu- tion: cumulat ive profiles.
Seoul Q#,O ~O"Q
/ Moscow Paris
• g - /Shanghai/ r ~
,m'~"" . . . . /~ f Bangkok , , / x.xox
/ / A J
/,f;/ r x ~ f ~:.n..cr'y j I I ._1 I I I I I I
3 5 7 9 II 13 15 17 19 21 23 25 Distance from city center (kin)
11Glickman, N The Growth and Manage- ment of the Japanese Urban System Academic Press, New York (1979); New- man and Kenworthy op cit Ref 7; Bertaud op cit Ref 9 12Rooij, A de 'The role of the bicycle in an integrated approach towards mobility' in Proceedings of Velo City '87 International Congress on Planning for the Urban Cyc- list Groningen, Centre CROW, Ede, Netherlands (1983) 43 13Bracher, Tilman Policy and Provision for Cyclists in Europe Commission of the European Communit ies, Directorate- General for Transport, Brussels (1989) 16
Japan and Europe that have high and rising levels of motorization but where the plurality of trips are made by non-motorized modes. In 1987 a survey of households in 131 Japanese cities indicated that 27% of trips were walking, 2 2 . 5 % by bicycle, 6.5% by rail, 3.6% by bus and 40.4% by automobile. In cities over 1 million population, public transport accounted for 23% of trips, with the automobile accounting for only 28%. The combined walking and bicycle mode shares show little difference between city sizes.
High per capita GDP NMT dominant cities exhibit high densities even at a considerable distance from the central core, with many high-density satellite centers focused around rail stations. Tokyo has over 150 000 people per ha in its central city, and maintains densities of close to 60 people per ha far from the city center.l] Land dedicated to road space is higher than in non-motorized transport dominated cities, but much lower than Western cities at comparable levels of GNP. Tokyo, for example, has only 10-15% of its land area dedicated to roads, compared to typically 25% in private motor vehicle dominant US cities.
In the Randstad region of the Netherlands, a polycentric metropoli- tan agglomeration including Amsterdam, the Hague, Utrecht, Rotter- dam, Delft and many smaller centers, some 56% of all trips in 1986 were made by walking or cycling. 12 Half of all trips in Frankfurt (Germany) and Vasteras (Sweden) in the early 1980s were by walking or cycling; in Hannover (Germany) and Copenhagen (Denmark) over 40% of trips are by these modes, with the bicycle's share exceeding that of public transportation. ~3 In virtually all of these cities, motorization is growing, frequently accompanied by growing average trip lengths. However, in many of these cities, bicycle mode shares are stable or growing, often at the expense of walking, due to increasing trip lengths, growing traffic congestion, and measures taken to improve conditions for cyclists,
72
14Royal Commission on Environmental Pollution Transport and the Environment HMSO, London (1994) 195
Motorization and non-motorized transport in Asia: W Hook and M Replogle
pedestrians and public transport, to encourage clustered development and to manage automobile use in cities. For example, the share of trips by walking in Tokyo has fallen from 43% in 1968 to 27% in 1988, while the bicycle's share has risen from 8% to 18%.
In Copenhagen, Denmark, a city of 1.7 million people, road building was abandoned in the early 1970s, large numbers of bus priority lanes were introduced and a comprehensive network of segregated cycle paths built. In the context of high national taxes on gasoline and motor vehicles, this produced a 10% fall in traffic since 1970 and an 80% increase in the use of bicycles since 1980. Bicycles are used year-round by many despite cold, snowy winters. About one-third of commuters now use cars, one-third public transport and one-third bicycles, and bicycles are also a major means of access to the public transportation system. Cycling accidents have decreased slightly, despite the increase in bicycle use, because of the network of cycle paths, which in many cases were created by reallocating arterial street space from cars. 14
Mixed traffic cities
Mixed traffic cities are those in which neither public nor private transportation dominates in the share of trips, and where non-motorized modes generally account for less than a third of all trips. These tend to be found largely among the Newly Industrialized Countries. In Bang- kok, Manila, Jakarta and Kuala Lumpur, for example, automobiles and motorbikes make up from 23% to 46% of total passenger trips, buses and paratransit account for 40-70% of total trips, and non-motorized trips account for under 30% of total trips. These cities tend to have sprawling land use patterns but at much higher densities than the private motor vehicle dominated cities of the USA and Australia. Land area in these cities dedicated to road space is still quite low by international standards. In Bangkok, which is somewhat typical, 8% of the land area in the city is dedicated to roads.
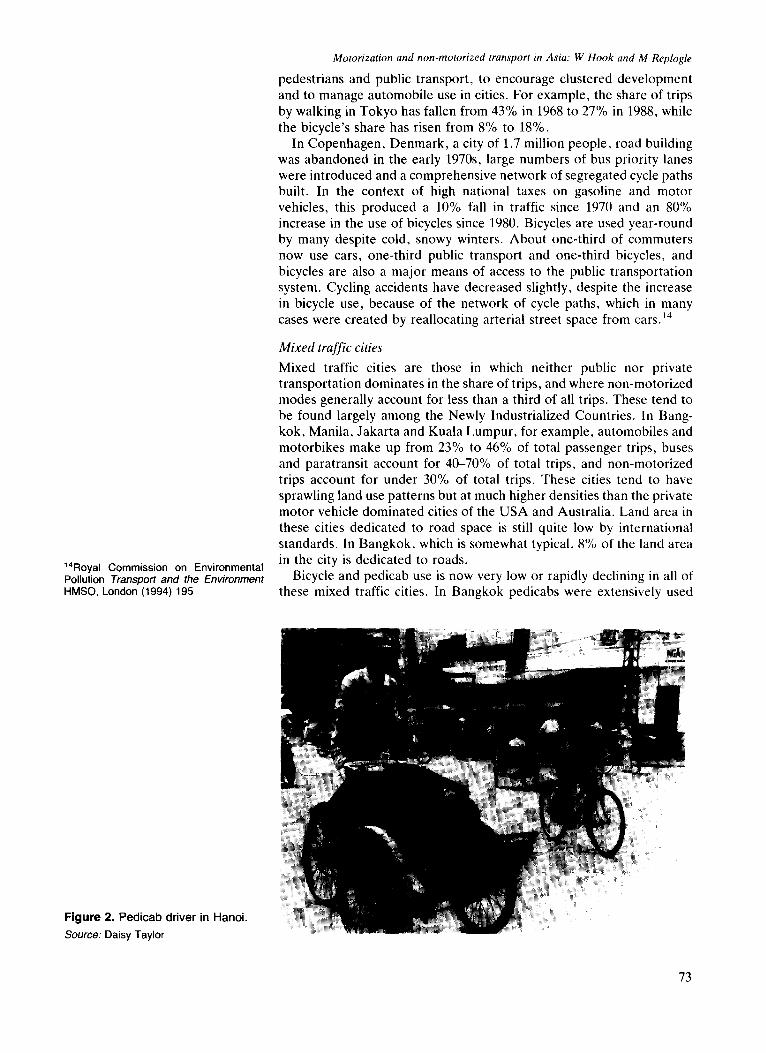
Bicycle and pedicab use is now very low or rapidly declining in all of these mixed traffic cities. In Bangkok pedicabs were extensively used
Figure 2. Pedicab driver in Hanoi. Source: Daisy Taylor
73
Motorization and non-motorized transport in Asia: W Hook and M Replogle
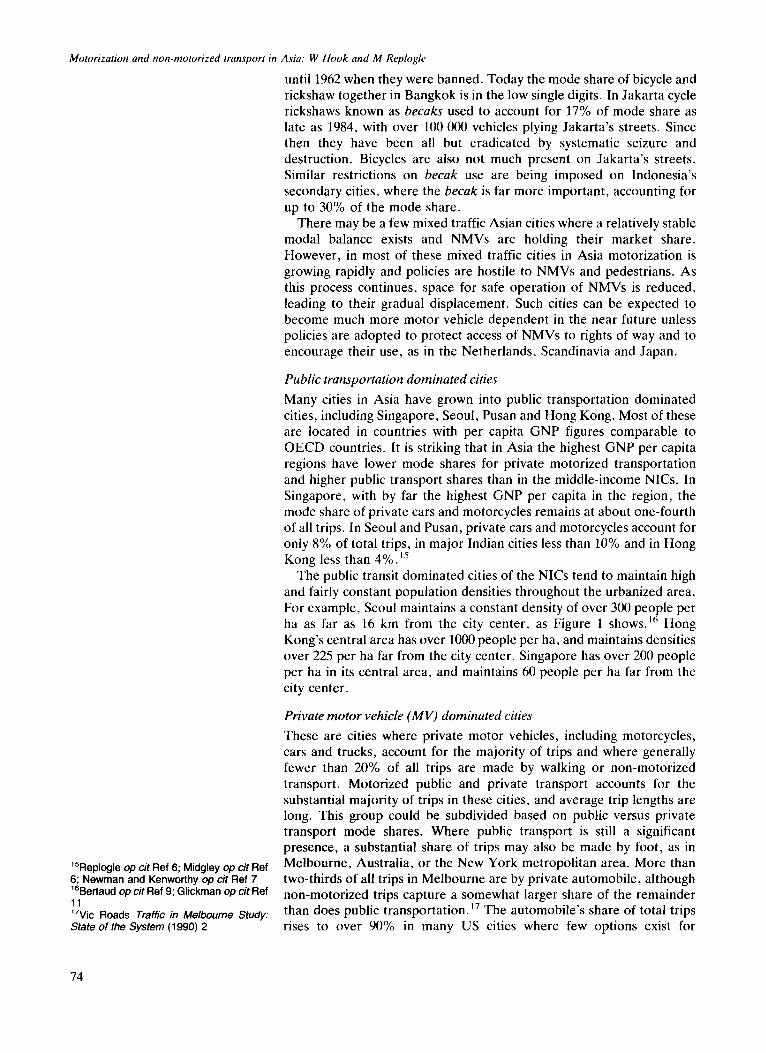
until 1962 when they were banned. Today the mode share of bicycle and rickshaw together in Bangkok is in the low single digits. In Jakarta cycle rickshaws known as becaks used to account for 17% of mode share as late as 1984, with over 100 000 vehicles plying Jakarta's streets. Since then they have been all but eradicated by systematic seizure and destruction. Bicycles are also not much present on Jakarta's streets. Similar restrictions on becak use are being imposed on Indonesia's secondary cities, where the becak is far more important, accounting for up to 30% of the mode share.
There may be a few mixed traffic Asian cities where a relatively stable modal balance exists and NMVs are holding their market share. However, in most of these mixed traffic cities in Asia motorization is growing rapidly and policies are hostile to NMVs and pedestrians. As this process continues, space for safe operation of NMVs is reduced, leading to their gradual displacement. Such cities can be expected to become much more motor vehicle dependent in the near future unless policies are adopted to protect access of NMVs to rights of way and to encourage their use, as in the Netherlands, Scandinavia and Japan.
Public transportation dominated cities
Many cities in Asia have grown into public transportation dominated cities, including Singapore, Seoul, Pusan and Hong Kong. Most of these are located in countries with per capita GNP figures comparable to OECD countries. It is striking that in Asia the highest GNP per capita regions have lower mode shares for private motorized transportation and higher public transport shares than in the middle-income NICs. In Singapore, with by far the highest GNP per capita in the region, the mode share of private cars and motorcycles remains at about one-fourth of all trips. In Seoul and Pusan, private cars and motorcycles account for only 8% of total trips, in major Indian cities less than 10% and in Hong Kong less than 4%. j5
The public transit dominated cities of the NICs tend to maintain high and fairly constant population densities throughout the urbanized area. For example, Seoul maintains a constant density of over 300 people per ha as far as 16 km from the city center, as Figure 1 s h o w s . 16 Hong Kong's central area has over 1000 people per ha, and maintains densities over 225 per ha far from the city center. Singapore has over 200 people per ha in its central area, and maintains 60 people per ha far from the city center.
Private m o t o r vehicle ( M V ) dominated cities
These are cities where private motor vehicles, including motorcycles, cars and trucks, account for the majority of trips and where generally fewer than 20% of all trips are made by walking or non-motorized transport. Motorized public and private transport accounts for the substantial majority of trips in these cities, and average trip lengths are long. This group could be subdivided based on public versus private transport mode shares. Where public transport is still a significant presence, a substantial share of trips may also be made by foot, as in
lSReplogle op cit Ref 6; Midgley op cit Ref Melbourne, Australia, or the New York metropolitan area. More than 6; Newman and Kenworthy op cit Ref 7 two-thirds of all trips in Melbourne are by private automobile, although 16Bertaud op cit Ref 9; Gliekman op cit Ref non-motorized trips capture a somewhat larger share of the remainder 11 17 17Vic Roads Traffic in Melbourne Study: than does public transportation. The automobile's share of total trips State of the System(1990)2 rises to over 90% in many US cities where few options exist for
74
Motorization and non-motorized transport in Asia: W Hook and M Replogle
convenient and safe pedestrian, bicycle and public transportation travel. Densities in motor vehicle dominant cities are rarely more than 20
people per ha overall, with central city densities around 50/ha and outer areas 10/ha. Population densities in Asian cities are generally too high to support private motor vehicle dominance, which would require substan- tially greater road capacity, thus destroying much of the city. Many cities in this category once had mixed traffic systems combining NMVs and motorized transport modes, but in recent decades have undergone rapid motorization and urban population growth, accompanied by policies hostile or indifferent to NMV use. Some retain core areas and lower-income areas with mixed traffic systems, as well as smaller enclaves where non-motorized modes are dominant. Most new areas are lower in density and are not connected to the rest of the city by modern transit or by NMV. For the most part these cities are large, sprawling, and exhibit long average trip lengths.
Japan: evolution of NMT dominant high-income cities
The economic structures of high savings and low consumption
Japan constrained the domestic consumption of private motor vehicles until its own private motor vehicle industry was able to capture the majority of the domestic market. Japan is 98% dependent on imported oil, and until the 1960s the lion's share of the domestic motor vehicle market was controlled by US firms. General Motors and Ford took over the Japanese motor vehicle market in 1926, and retained control until they were forced to leave in 1938. Economic nationalism in Japan, the promotion of Japanese firms, thus translated into public policies sup- porting rail and subway, which were domestically manufactured and relied on hydroelectric power and coal which were also domestically supplied. The promotion of rail was also supported by the large keiretsu firms because they had large real estate interests in the central cities which would have been threatened by urban dispersal. These keiretsu firms had virtually no investments in the automobile industry, which grew out of independent firms like Nissan and Toyota which were virtually created by the military government in the 1930s. As a result public investments in Japan into the road network were much lower than in the USA and other OECD countries, while investments into rail were higher. As late as 1956 the main road between Tokyo and Osaka was still unpaved in sections.
This all changed in the 1970s, however, when the Ministry of International Trade and Industry engineered a consolidation of the Japanese motor vehicle industry, at which time the interests of the keiretsu became linked with the motor vehicle industry. Since that time Japanese government investments and subsidies to the domestic road network have been much higher than in the USA, and motorization in Japan has increased rapidly.
Motorization was resisted in the 1970s. The control of local govern- ments by progressive political coalitions tied closely with community organizations meant that local resistance to new road projects was supported by the local government. With the slower economic growth of the 1980s, however, pro-growth Liberal Democratic Party candidates regained control of most municipal governments. Particularly beginning in the second half of the 1980s Japan has been building an enormous amount of new highways, with three ring roads around Tokyo alone,
75
Motorization and non-motorized transport in
18Calder, K 'Land use policy: exclusive circles of compensation' in Crisis and Compensation: Public Policy and Political Stability in Japan Princeton University Press, Princeton, NJ (1988); Woodall, B 'The politics of land in Japan's dual politic- al economy' in Haley and Yamamura (eds) Land Issues in Japan: A Public Policy Faiilure Society for Japanese Studies, Seattle, WA (1992)
Asia: W Hook and M Replogle
and two of them nearing completion. Nevertheless, despite enormous Japanese investments into roads, these investments have built far less infrastructure than similar spending would have built in other countries due to the cost of land. Land acquisition costs commonly account for over 70% of road construction costs in Japan, compared to around 25% in the USA.
High land costs and high density
Land costs in Japan are the primary cause of high-density cities, rather than the strength of land use controls, although controls reinforce the land price structure. The aggregate value of Japanese land, based on market prices, is estimated to be between two and four times the total value of land in the continental United States. 18 In Japan the extremely low level of taxes even on land in urban areas that is ostensibly used for agricultural purposes has allowed investors to speculate on land by growing a few vegetables. These tax policies, however, have been supported by a coalition of political interests. The major keiretsu firms all tend to have extensive, essentially monopolistic land holdings, and borrowing against this land was used to finance industrial investment.
In short, a history of investment into rail rather than road transport, and monopolistic conditions in the land market have led to extraordi- narily high land prices. These high land prices have allowed firms to collect monopoly profits which have been used to finance industrial expansion. High land prices have encouraged compact housing patterns and discouraged the use of space-intensive transport modes like the private car. This has been reinforced by the high cost of owning and operating private cars and by employer subsidies of commuter public transportation costs. These forces have led to a highly efficient urban form.
There is thus a connection between Japan's consumption-constraining and investment-encouraging urban form and its rapid economic growth. Its relatively low levels of motor vehicle use are a reflection of these underlying phenomena. As Japan can no longer rely on the West as an expanding market for its goods it is increasingly having to stimulate its own domestic consumer market and the market for its products in the Pacific Rim. This helps explain Japan's extensive investments into road infrastructure in the past 10 years both domestically and in Asia.
China: bicycle-based megacities at risk
The mode share for the bicycle is higher in China than anywhere else in the world, with bicycling and walking trips accounting for over 90% of total trips in some major cities. With the predominance of non- motorized transport, Chinese cities are extremely dense at the center, but density falls rapidly as you move from the center. As a-result, a person living in the center of Washington, DC, consumes 30 times more land than a person living in central Shanghai.
The rise of China's bicycle dominated cities
China's urban form is the result of very particular circumstances. There was virtually no urbanization during the 15 years of the Cultural Revolution which only finally ended in 1979. Public investments into both transport and housing infrastructure were minimal, and public investments were channeled into the countryside. Rural-urban migra-
76
Motorization and non-motorized transport in Asia: W Hook and M Replogle
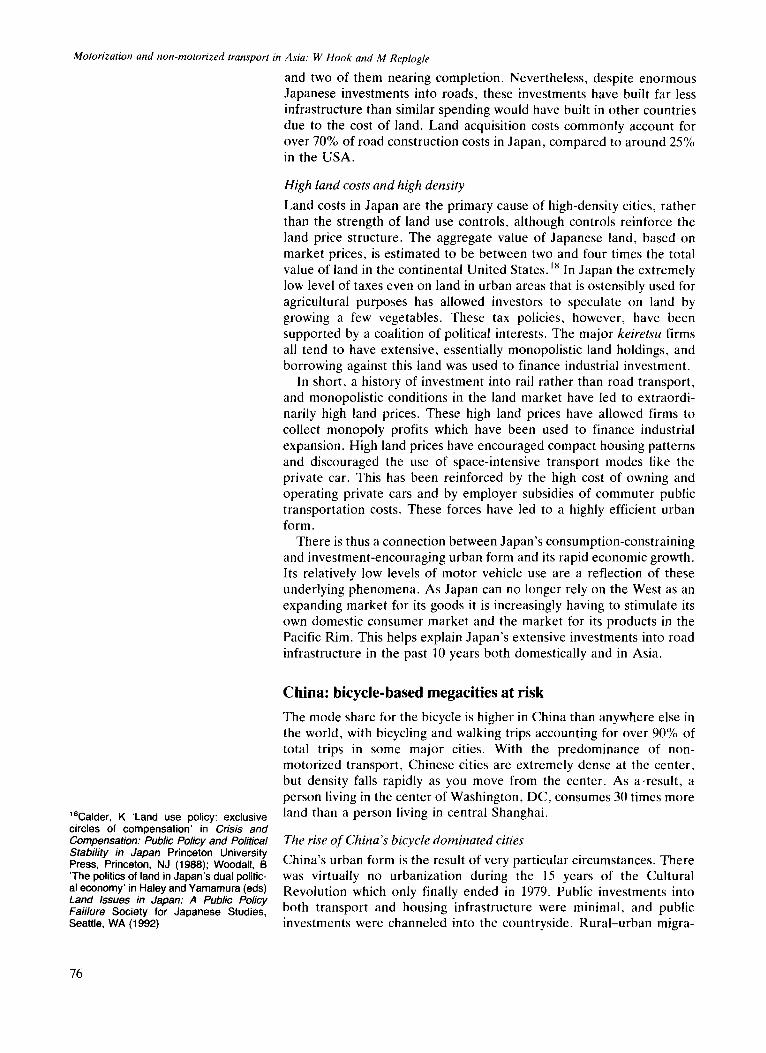
Figure 3. Road intersection in Beijing, China.
Source: Walter Hook
19World Bank China Highway Develop- ment and Management Issues, Options, and Strategies World Bank, Washington, DC (1994); Urban Land Use and Manage- ment in China Institute for Public Adminis- tration, New York (1992) 2°Brown, L and Ayres, E 'Bicycles surpas- sing automobiles as leading form of per- sonal transport' Vital Signs Brief World- watch Institute, Washington, DC, 1992 (6)
tion was tightly restricted by pass laws and government control over most employment. With the introduction of market reforms in 1979, rural-urban migration picked up again, and recently has accelerated rapidly. Since then the Chinese government has built numerous relative- ly uniform high- and medium-rise apartment buildings within city limits. Within city limits land use was determined by the enterprises which controlled the land, and until recently there was very little central coordination of land development. Strict controls remained in force, however, which prevented the development of land outside the city limits. As there was no private mechanism for farmers to sell land to developers, cities remained highly compact.~9
With this high-density urban form, and with minimal public invest- ment into either roads or public transit, Chinese cities became the most bicycle friendly in the world. Several factors led to the popularity of the bicycle in China. First, bicycles are affordable and until recently were subsidized by employers. With average incomes currently around $410 per year, ownership of a motorcycle or car is out of reach for the vast majority of people. Second, Chinese cities are flat, and urban planning has been used to create a safe and pleasant cycling environment. One-third of the road space has been reserved for bicycles and another third for pedestrians.
Before the reforms, owning a bicycle in China was a privilege. Bicycles were rationed to favored employees through the workplace, and only one person in four or five had a bicycle. The vast majority of the rest of the population, except very high level Communist Party officials and foreigners, traveled by public transport. As a result the bicycle was seen as a high-status consumer good, a way of avoiding riding on the crowded buses. Couples going out on a date tend to ride on a single bicycle the way in the USA they would drive in a car.
With the economic reforms, the use of the bicycle has exploded. As bicycle rationing came to an end, annual production of bicycles in China rose from under 10 million per year in 1980 to just under 40 million in 1990, accounting for some 40% of global production. 2° Currently there is one bicycle for every 2.2 inhabitants in Shanghai, one of the highest densities of bike ownership in the world. By comparison, there is only
77
Motorization and non-motorized transport in Asia: W Hook and M Replogle
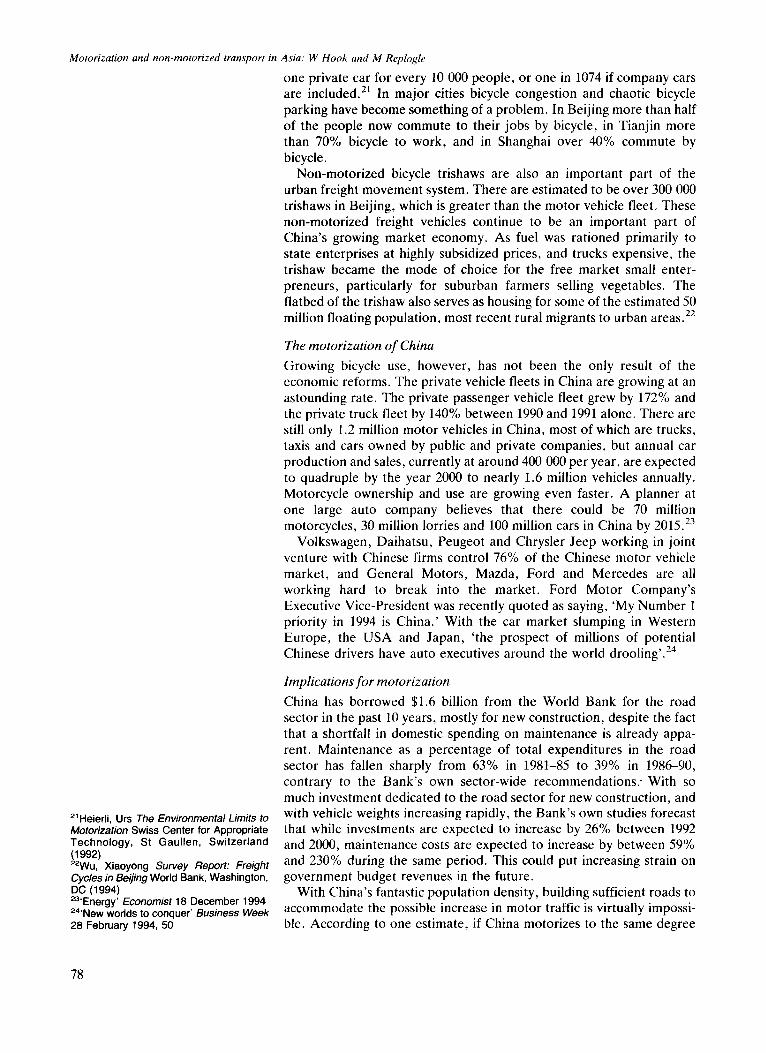
one private car for every 10 000 people, or one in 1074 if company cars are included. 2~ In major cities bicycle congestion and chaotic bicycle parking have become something of a problem. In Beijing more than half of the people now commute to their jobs by bicycle, in Tianjin more than 70% bicycle to work, and in Shanghai over 40% commute by bicycle.
Non-motorized bicycle trishaws are also an important part of the urban freight movement system. There are estimated to be over 300 000 trishaws in Beijing, which is greater than the motor vehicle fleet. These non-motorized freight vehicles continue to be an important part of China's growing market economy. As fuel was rationed primarily to state enterprises at highly subsidized prices, and trucks expensive, the trishaw became the mode of choice for the free market small enter- preneurs, particularly for suburban farmers selling vegetables. The flatbed of the trishaw also serves as housing for some of the estimated 50 million floating population, most recent rural migrants to urban areas. 22
The motorization o f China
Growing bicycle use, however, has not been the only result of the economic reforms. The private vehicle fleets in China are growing at an astounding rate. The private passenger vehicle fleet grew by 172% and the private truck fleet by 140% between 1990 and 1991 alone. There are still only 1.2 million motor vehicles in China, most of which are trucks, taxis and cars owned by public and private companies, but annual car production and sales, currently at around 400 000 per year, are expected to quadruple by the year 2000 to nearly 1.6 million vehicles annually. Motorcycle ownership and use are growing even faster. A planner at one large auto company believes that there could be 70 million motorcycles, 30 million lorries and 100 million cars in China by 2015. 23
Volkswagen, Daihatsu, Peugeot and Chrysler Jeep working in joint venture with Chinese firms control 76% of the Chinese motor vehicle market, and General Motors, Mazda, Ford and Mercedes are all working hard to break into the market. Ford Motor Company's Executive Vice-President was recently quoted as saying, 'My Number 1 priority in 1994 is China.' With the car market slumping in Western Europe, the USA and Japan, 'the prospect of millions of potential Chinese drivers have auto executives around the world drooling'. 24
Implications for motorization
China has borrowed $1.6 billion from the World Bank for the road sector in the past 10 years, mostly for new construction, despite the fact that a shortfall in domestic spending on maintenance is already appa- rent. Maintenance as a percentage of total expenditures in the road sector has fallen sharply from 63% in 1981-85 to 39% in 1986-90, contrary to the Bank's own sector-wide recommendations.-With so much investment dedicated to the road sector for new construction, and
21Heierli. Urs The Environmental Limits to with vehicle weights increasing rapidly, the Bank's own studies forecast Motorization Swiss Center for Appropriate that while investments are expected to increase by 26% between 1992 Technology, St Gaullen, Switzerland and 2000, maintenance costs are expected to increase by between 59% (1992) 22Wu, Xiaoyong Survey Report: Freight and 230% during the same period. This could put increasing strain on Cycles in Beijing World Bank, Washington, government budget revenues in the future. DC (1994) With China's fantastic population density, building sufficient roads to 23'Energy' Economist 18 December 1994 24'New worlds to conquer' Business Week accommodate the possible increase in motor traff ic is v i r tual ly impossi- 28 February 1994, 50 ble. According to one estimate, if China motorizes to the same degree
78
Motorization and non-motorized transport in Asia: W Hook and M Replogle
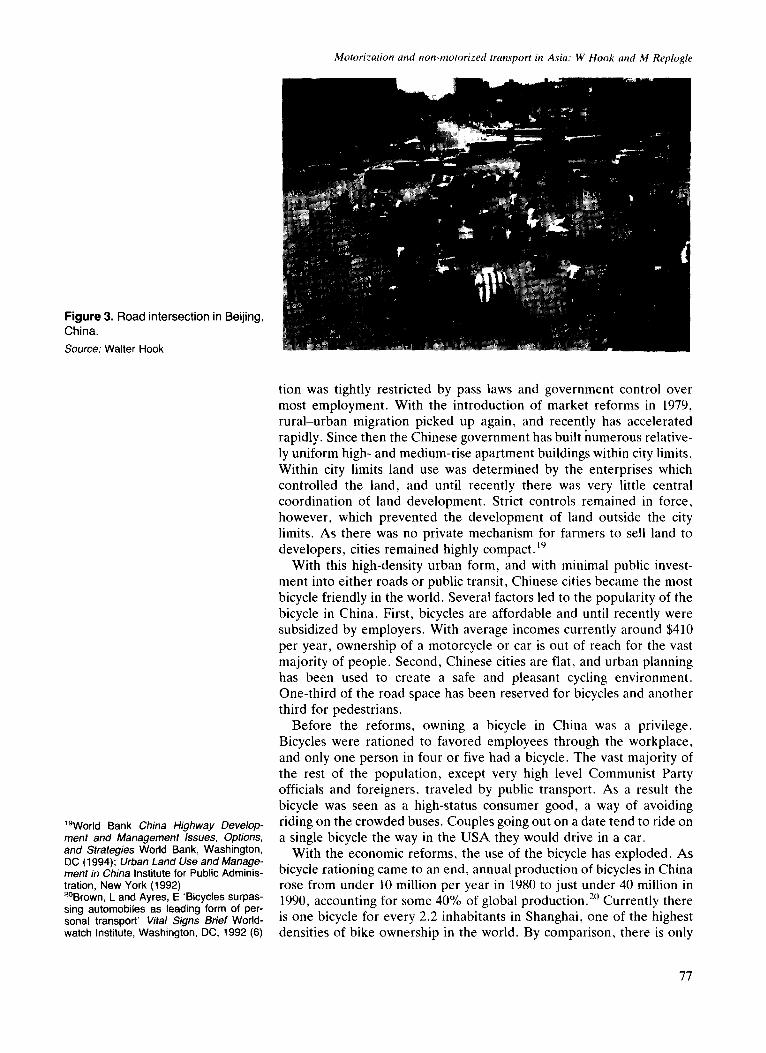
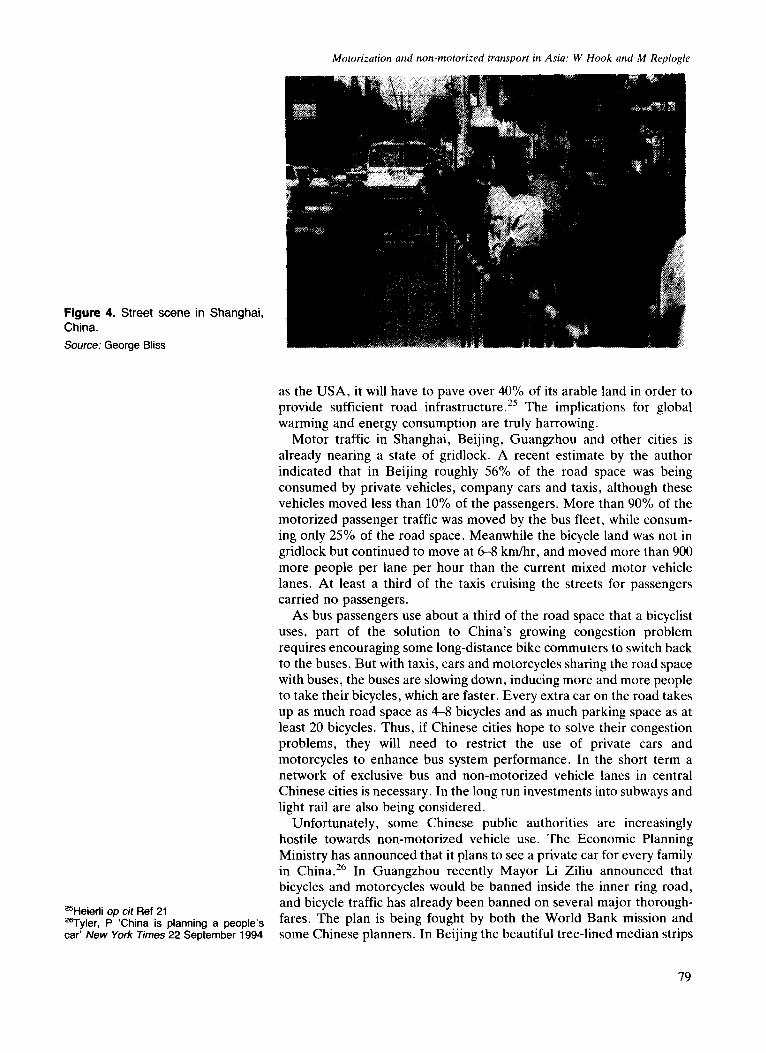
Figure 4. Street scene in Shanghai, China.
Source: George Bliss
2SHeierli op cit Ref 21 SSTyler, P 'China is planning a people's car' New York Times 22 September 1994
as the USA, it will have to pave over 40% of its arable land in order to provide sufficient road infrastructure. 25 The implications for global warming and energy consumption are truly harrowing.
Motor traffic in Shanghai, Beijing, Guangzhou and other cities is already nearing a state of gridlock. A recent estimate by the author indicated that in Beijing roughly 56% of the road space was being consumed by private vehicles, company cars and taxis, although these vehicles moved less than 10% of the passengers. More than 90% of the motorized passenger traffic was moved by the bus fleet, while consum- ing only 25% of the road space. Meanwhile the bicycle land was not in gridlock but continued to move at 6-8 km/hr, and moved more than 900 more people per lane per hour than the current mixed motor vehicle lanes. At least a third of the taxis cruising the streets for passengers carried no passengers.
As bus passengers use about a third of the road space that a bicyclist uses, part of the solution to China's growing congestion problem requires encouraging some long-distance bike commuters to switch back to the buses. But with taxis, cars and motorcycles sharing the road space with buses, the buses are slowing down, inducing more and more people to take their bicycles, which are faster. Every extra car on the road takes up as much road space as 4-8 bicycles and as much parking space as at least 20 bicycles. Thus, if Chinese cities hope to solve their congestion problems, they will need to restrict the use of private cars and motorcycles to enhance bus system performance. In the short term a network of exclusive bus and non-motorized vehicle lanes in central Chinese cities is necessary. In the long run investments into subways and light rail are also being considered.
Unfortunately, some Chinese public authorities are increasingly hostile towards non-motorized vehicle use. The Economic Planning Ministry has announced that it plans to see a private car for every family in China. 26 In Guangzhou recently Mayor Li Ziliu announced that bicycles and motorcycles would be banned inside the inner ring road, and bicycle traffic has already been banned on several major thorough- fares. The plan is being fought by both the World Bank mission and some Chinese planners. In Beijing the beautiful tree-lined median strips
79
Motorization and non-motorized transport in Asia: W Hook and M Replogle
which used to protect the bicycle path from the motorized vehicle lanes are being systematically torn out to make room for another lane of motor vehicle traffic, separating the bicycle lane with only a painted white line. Buses are now having to cross the bicycle lane to pick up bus passengers who before used to wait on the median strip, interrupting the bicycle traffic. Cars are also taking over the bicycle lanes during gridlock conditions, creating dangerous conflicts between motorized and non- motorized modes. On top of this, bicycle parking fees are being increased and bicycle taxes are being imposed, all to discourage their increasing use. The projections of the Beijing Traffic Bureau all show the current mode share for bicycle falling from 50% to 17% by the year 2040, being displaced by buses and private cars. This 50-year projection is a statement of public policy, not an unbiased assessment of likely future trends.
Current plans in the city of Shanghai are to divide motorized and non-motorized traffic, turning all major roads into motor vehicle only lanes, and relegating bicycles to secondary streets. While this Shanghai Traffic Management Program has been trumpeted by World Bank public relations as a pro-non-motorized transport project, 2v and the project does include a nominal amount of funds to complete a bicycle 'network' in Shanghai, in fact the sum total of the project is quite hostile to non-motorized transport. Currently bicycles can go on all streets and continue to move, while motor vehicles are trapped in congestion. This means that bicycles are by far the most convenient method of travel. With bicycles slowing down travel speeds on major shopping streets, walking is also relatively safe. The new plan will not only force the bicyclists to park on residential streets far from the shopping streets and walk the extra distance, but the increased speeds of motor traffic along the major roads will make walking less safe and far less pleasant. Thus the major beneficiaries of the plan are private car owners and taxis, and the major costs will be paid by the bicyclists. What would make far more sense is restricting private motor vehicle and taxi use along the major streets, sharing them between bicyclists and buses, and relegating private cars to a handful of secondary ~treets, or keeping them out of the central city altogether.
27Bank Notes April 1994
Indonesia: systematic destruction of non-motorized transport
The Indonesian experience illustrates how public policies and invest- ments can strongly direct modal orientation. The island of Java, which accounts for roughly half of the Indonesian population, has a population density more than double that of rail-intensive Japan, but unlike Japan its transportation system is dominated entirely by road transport. In Indonesia at least 88% of passenger transport travels by road, compared to only 5% by rail. As a result Indonesia's road sector consumes over 7% of its GNP, while Japan's road sector consumes less than 4% of its GNP. While rising per capita incomes have played a role in increasing the rate of motorization, Government of Indonesia policy has strongly encouraged motor vehicle ownership and use through massive subsidies to road users, underinvestment in public transport and rail systems, and a general public sector hostility to non-motorized modes of transporta- tion.
80
28World Bank Staff Appraisal Report for the Indonesia Second Highway Sector In- vestment Project World Bank, Washing- ton, DC (1992) 119 29Kuranami, C Non-Motorized Transporta- tion in Ten Asian Cities World Bank, Washington, DC (1994) ~°'Road development places efficiency above safety' Jakarta Post 12 October 1990 ZlWorld Bank Surabaya District Develop- ment Project Staff Appraisal Report World Bank, Washington, DC (1994)
Motorization and non-motorized transport in Asia: W Hook and M Replogle
Investment policies driving motorization
Road expenditures have increased by five times since 1985, at an annual average increase in government spending of 30% per year. Road expenditures have increased from 9% to 20% of the government's total budget. These expenditures, meanwhile, have not been compensated for by increases in vehicle user fees. State and local roads are financed almost entirely out of local property and value added taxes. The user of the local road network is thus increasingly subsidized by the general taxpayer. For national roads, total government revenues from road users have not covered total expenditures on roads any year in the past decade except for fiscal year 1986/87. From 1989 to 1991 the motorized road user charges were actually negative due to heavy subsidies on diesel fuel consumption. Gasoline in Indonesia in 1990 cost $0.44/I, less than half the price in Singapore and 20% cheaper than in the Philippines and Malaysia. With road user charges negative during a period of dramatically increasing new construction, the subsidy to road users has increased dramatically. In 1989 alone the subsidy to motorized road users was $1.6 billion, nearly 10% of the total annual expenditure on road transport. A large percentage of these subsidies is enjoyed by trucks, which account for over 50% of the motorized vehicles on intercity roads and which consume most of the heavily subsidized diesel fuel. 2s
Road safety problems are also fairly severe in Indonesia. Most of the victims are pedestrians or non-motorized vehicle users, while roughly 70% of the accidents were caused by motorcycles, trucks or automobiles. 29 The deteriorating safety situation is clearly related to the rapid increase in motorization coupled with both urban and intercity infrastructure which ignores the needs of non-motorized transport and a lack of traffic management more generally. In Jakarta, for example, 70% of city roads have no sidewalks despite the fact that 40% of all trips are made by foot. 3° As in many Southeast Asian countries, the ability of pedestrians and non-motorized vehicle users to cross major streets has been intentionally restricted to inconvenient overpasses by restrictive barriers, creating major severance problems on almost all major roads.
The heavy hand o f forced motorization
In urban areas the share of different modes of travel varies greatly between cities. In Surabaya, Indonesia's second largest city, in 1987 becaks and bicycles accounted for only 12% of trips, down sharply from earlier in the 1980s. Autos accounted for 31% of total trips. Motorcycle use is increasing even more rapidly than car use, and public transit and three wheeled motorized bemos at 10% are also losing mode share. The largest share of trips was made by walking, but walking is also losing mode share. While private cars and motorcycles represent 82% of the vehicles on the road, they accounted for only 60% of the passenger trips, while bicycles and becaks represent only 6% of the vehicles on the road but account for 12% of the trips. Buses only account for 2% of the vehicles on the road, but move 10% of the population. 3~ Thus a disproportionate and increasing amount of road space is consumed by private motor vehicle users who represent only the wealthiest 1% of the population.
Jakarta's transport system is more heavily dominated by public transport such as buses and various types of bemos. Roughly two-thirds of all motorized passenger trips are accounted for by public transport vehicles in Jakarta, while they only account for 4% of the total vehicles.
81
Motorization and non-motorized transport in
32Indonesia Reports University of Mary- land, College Park, MD, 1988 (30) 8 33'Petty commodity production and under- development' Progress in Planning 1981 16 105-178 34Gallagher, R The Rickshaws of Bang- ladesh University Press Ltd, Dhaka, Bang- ladesh (1992) 3SErlanger, S 'For Sueharto, his heirs are key to life after 1993' New York Times 11 November 1990 36'Bangkok's tuk-tuk vehicles to replace pedicabs' Jakarta Post 25 April 1990, 2 37'Peddlers file suit against governor, police, court chiefs' Jakarta Post 17 May 1990
Asia: W Hook and M Replogle
Jakarta used to have a system of trams until they were torn out in the late 1950s, and becaks were also extensively used in Jakarta until 1989, at which time they were banned by the Governor.
In all Indonesian cities the three-wheeled non-motorized pedicab known as a becak is being phased out. In Jakarta the use of the becak was banned throughout the entire city in 198%90 after having been previously restricted to side streets and low-income neighbourhoods in the 1970s. There were an estimated 100 000 becaks in Jakarta as of October 1988, and since that time an estimated 60 000 have been dumped into the Jakarta Bay without compensation. 32 Becak manufac- turers and drivers have faced harassment and been forced to close down. In Surabaya, Ujung Pandang and other major cities they have been restricted to non-commercial streets and the urban fringes, acting as a feeder system to the public transport system. In cities where they are tolerated they have been required to buy expensive licenses, and no new licenses have been issued. 33
Public sector hostility to the becak and other non-motorized modes has several sources. The first source is typical prejudice against non- motorized transport as being primitive and outmoded, even though the first trishaws were only introduced in Japan in the 1870s, and in Indonesia in the 1940s during the Japanese occupation. Second, in Jakarta many of the becak drivers were Bataks from Sumatra and faced prejudice from the Javanese. In other cities they are also often immigrants from the outer islands, and becak driver is a common first job for recent migrants from rural areas and outer islands. Third, becak drivers were heavily involved in the left-wing radicalism of the 1960s, making them politically suspect in the eyes of the government. Becaks have also been accused of worsening traffic congestion. While the passenger car equivalency in terms of capacity flow ratios is disputed, one study in Bangladesh indicated that pedicabs used roughly half the road space per passenger despite their slower speed, due to greater flexibility. 34
Probably more important, however, is that the becak business is not profitable to any of the President's relatives. According to an unidenti- fied official in the New York Times, 'At least 80% of the major government projects go in some form to the President's children or friends. '35 The becak industry is controlled by very small-scale indepen- dent manufacturers and operators, unlike all other transport businesses which are dominated by big business. At the same time that the becak was being banned in Jakarta, the Speaker of the Jakarta City Council announced that the three-wheeled open-sided motorized tuk-tuk had been approved by the Administration to replace the banned becak. The new tuk-tuks will be manufactured by PT Dharma Steel Mesh in cooperation with PT Tri Bhakti Karya Nusa, 36 both firms reputedly owned by members of the President's family. It is clear the banning of becaks has presidential approval. The Governor of Jakarta, a general in the military, was appointed by the President, and in response to the banning of the becaks Sueharto's response was that 'he wanted the public to find alternatives'. 37
Banning the becak has not only created severe employment problems for low-income minorities in Indonesia, it has also hastened the motorization rate. As becaks are used primarily by middle- and upper- income people, the loss of the becak as an option has encouraged these higher-income users to switch to taxis and bemos.
82
38World Bank Staff Appraisal Reports for Indonesia: East Java-Bail Urban Develop- ment Project, Highway Sector Project (1989); Second Highway Sector Invest- ment Project, Semarang and Surakarta Urban Development Project Kalimantan Urban Development Project, Sulawesi- Irian Jaya Urban Development Project, Surabaya Urban Development Project World Bank, Washington, DC 39World Bank World Development Report World Bank, Washington, DC (1994)
Motorization and non-motorized transport in Asia: W Hook and M Replogle
As non-motorized vehicles are systematically driven from the roads, rail systems remain underdeveloped, and buses are increasingly snarled in traffic jams. At the same time Indonesia's oil future is becoming considerably more bleak. Indonesia is expected to be a net importer of oil by the year 2010, and already imports gasoline as it does not have sufficient refinery capacity to satisfy its own domestic demand. Trans- portation consumes some 35% of the total demand for oil, and the vast majority of this is for motor vehicle transport. National fuel subsidies already cost the government over US$500 million annually.
The role o f Wor ld B a n k sector lending
Despite the lack of an independent NGO voice to appraise the actual impacts of government-implemented World Bank projects, the World Bank is increasingly turning over funds to the Government of Indonesia in the form of urban 'sector loans'. Sector loans are very difficult to monitor as the funds are disbursed to a multitude of sub-projects which are often difficult to locate geographically and which do not require independent environmental impact assessments or social impact assess- ments, It is also difficult to tell without close inspection whether the funds are used for water provision, sewage, sanitation or more roads. Nevertheless, further research indicates that a significant amount of World Bank funding which is apparently going to sanitation and water is in fact going to road construction programs and to projects which are hostile to the needs of poor people and to non-motorized transporta- tion. The World Bank, to its credit, has been able to convince the Government of Indonesia to include sidewalks in some of its urban infrastructure loans in secondary cities. 38
Impacts of modal orientation on economic performance
Globally, economic growth has been faster in the countries of the Pacific Rim in the past three decades than anywhere else in the world. The countries of East Asia collectively averaged an annual rate of per capita growth of GNP of 6.1% from 1980 to 1992, compared to a global average of 1.2%, negative growth in Africa and Latin America, and 2.3% growth in OECD countries. 39 As cities are the location for the production of most of this economic growth, it follows that differences in the nature of these cities could be related to this favorable economic performance. While there is wide diversity in the nature of urbanism in Pacific Rim countries, there are sufficient similarities to suggest that the 'export-oriented growth' model which has been credited with the region's economic success may have certain common spatial manifesta- tions.
High-density urbanism and a lack of dependence on private motor vehicle transport helped most Asian countries to weather the oil shocks of the 1970s and the debt crises of the 1980s. Instead of spending society's scarce resources on the consumption of private cars, in much of Asia these funds were saved and invested in production. With the labor force able to commute at low cost by bus or bicycle, the Asian labor force could live better at lower salaries. Are not Asia's high-density cities, with their reliance on non-motorized and public transportation use, the spatial manifestation of the 'export-oriented growth model'?
As negative growth in Africa and Latin America in the 1980s has been attributed largely to the debt crisis which led to a net capital outflow
83
Motorization and non-motorized transport in
4°International Energy Association World Energy Statistics and Balances 1971-87 OECD, Paris (1989) 41Standing Advisory Committee on Trunk Road Assessment Trunk Roads and the Generation of Traffic HMSO, London (1994) 4~l'anaboriboon, Y 'Demand management implementation in Southeast Asia' ITE 1992 (September) 21
Asia: W Hook and M Replogle
from many of these countries for nearly a decade, it is significant to note that more than half of low and lower-middle income countries import more than 90% of their commercial energy. Low-income developing countries, excluding China, spent an average of 33% of their merchan- dise export earnings in 1985 on energy imports, and many of them spent more than 50%.4° East Asia's transportation systems mix, with relative- ly low levels of private motor vehicle use compared to other parts of the developing world, would appear to have helped insulate much of the region from the shocks of the oil crises and related debt.
Conclusion
While Japan and the NICs of Hong Kong, Singapore and (until recently) Korea managed to control motorization, which has encour- aged savings and investment, the other economies of Asia are likely to become the consumer markets for these economic powerhouses if current motor vehicle consumption patterns continue.
Most governments in Asia are increasingly trying to solve their growing congestion problems by expanding highway capacity. Unfortu- nately, research indicates that new roads are a major stimulus to more traffic. 41 A recent study of Bangkok indicated that if all $15 billion of planned new road projects are actually built over the next 15 years, travel speeds will increase by only l mph. 42 While such investments will help assure an expanding market for Japanese and now Korean cars, Asian cities will need to do more to protect and enhance opportunities for non-motorized and public transportation or risk losing the competi- tive advantage offered by efficient, low-cost transportation modes and the spatial patterns of development they support and sustain.
84