080902 project 1676 response to request for review
29
Request for Review Dear Sirs, Please find below the response to the review formulated for the CDM project with the registra- tion number 1676. In case you have any further inquiries please let us know as we kindly assist you. Yours sincerely, Javier Castro Carbon Management Service Your reference/letter of Our reference/name Tel. extension/E-mail Fax extension Date/Document Page IS-CMS-MUC/ +49 89 5791-2526 +49 89 5791-2756 2008-09-02 1 of 34 Paula Auer [email protected]
Transcript of 080902 project 1676 response to request for review

Request for Review
Dear Sirs,
Please find below the response to the review formulated for the CDM project with the registra-tion number 1676. In case you have any further inquiries please let us know as we kindly assist you.
Yours sincerely,
Javier Castro Carbon Management Service
Your reference/letter of Our reference/name Tel. extension/E-mail Fax extension Date/Document Page
IS-CMS-MUC/ +49 89 5791-2526 +49 89 5791-2756 2008-09-02 1 of 34Paula Auer [email protected]

Response to the CDM Executive Board
Issue 1
The DOE is requested to confirm how it has validated that the project is additional based on the results of the investment analysis, in particular with reference to the applied benchmark for this and similar project activities.
ANDIssue 2
Further clarification is required on how the DOE has validated the suitability of the input values, as per the guidance of EB 38 paragraph 54(c).
ANDIssue 3
Further clarification is required on (a) how the DOE has validated the investment barriers, and (b) the common practice analysis, in particular the essential differences between the project activity and the similar projects using domestic technology and why the PP has not opted to use the domestic technology, or why the use of domestic technology has not been considered as an alternative baseline.
AND
Issue 4
If the barriers to the project activity cannot be further substantiated, an economic comparison of the proposed baseline and the project activity without CDM must be conducted to determine the baseline.

Referring to Issue 1
Response by Project Participant:
The project demonstrates additionality through a benchmark analysis using the company benchmark as the means of comparison. The benchmark has been selected and applied in accordance with the additionality tool, the further guidance from EB 39 Annex 35 and national guidance on investment appraisal.
Evidence for the benchmark has been audited through the use of publically available data in the calculation of the WACC as well as providing an official company policy document on in-vestment appraisal.
The selection of the benchmark for this project is therefore in compliance with all relevant na-tional and international standards and must be considered appropriate and correct. These points are further elaborated below.
---Compliance with the Guidance on the Assessment of Investment Analysis (EB 39 An-nex 35)
Since the project was submitted additional guidance has been issued by the EB at EB39 (an-nex 35). Paragraph 12 of this guidance states the following.
Guidance: Internal company benchmarks/expected returns (including those used as the ex-pected return on equity in the calculation of a weighted average cost of capital - WACC), should only be applied in cases where there is only one possible project developer and should be de-monstrated to have been used for similar projects with similar risks, developed by the same company or, if the company is brand new, would have been used for similar projects in the sa-me sector in the country/region. This shall require as a minimum clear evidence of the resoluti-on by the company’s Board and/or shareholders and will require the validating DOE to underta-ke a thorough assessment of the financial statements of the project developer - including the proposed WACC - to assess the past financial behavior of the entity during at least the last 3 years in relation to similar projects.
Rationale: Paragraph 4 of the Tool for the demonstration and assessment of additionality (ver-sion 3) requires that benchmarks should not include the subjective profitability expectations or risk profile of a particular project developer.
In response to this new guidance, the Project Participant presents the following:
1) “Only one possible project developer”
Zongyang Conch Cement Company Limited (ZCCCL) is the only potential developer. ZCCCL is subordinated to Anhui Conch Cement Company Limited (ACCCL) and investment decisions are made by ACCCL. The proposed project is an extension of a production process at an exis-ting cement plant. The waste heat project is based on the existing production facility and only utilizes waste heat from that facility. As such the project is integrated into the core business of ACCCL and a third party investor would not be appropriate for this investment.

2) “assess the past financial behavior of the entity during at least the last 3 years in relation to similar projects”
Since 2003 all of the investments undertaken by ACCCL have had equity returns above the benchmark of 18% and therefore the same financial behaviour is demonstrated for more than 3 years. The Project Participant has supplied the IRRs of all previous investments to the DOE and the full list of investments that have been undertaken by ACCCL since 2003 and prior to the investment in Zongyang Conch are shown below.
Year Project title
2003 4000 t/d Clinker Cement Production Retrofit Engineering of Baimashan Conch Cement Company Limited
2003 10000 t/d Clinker Cement Production line Retrofit Engineering of Tongling Conch Cement Company Limited
2004 Phase III 2x4500t/d clinker line of Digang conch cement Company Limited2004 1.65 million tone/a cement grinding line of Taizhou conch cement Company
Limited2004 Phase I 5000t/d clinker line of Wuhu conch cement Company Limited2004 Phase I 2×5000t/d cement clinker line of Xuancheng conch cement Compa-
ny Limited 2005 Phase I 4000t/d cement clinker line of Beiliu conch cement Company Limited2005 4x4500 t/d Cement Clinker Production Retrofit project of Chizhou Conch
Cement Company Limited2005 Phase II 2×4500t/d Cement Clinker Production Retrofit project Wuhu Conch
Cement Company Limited
This list includes both new build clinker lines and retrofit projects to existing clinker lines and all of these projects show returns higher than 18% (and indeed the more conservative benchmark of 17.86% used in the PDD). The IRRs range from 18% - 27%. Actual data has been omitted on request of ACCCL, but the FSR of this list of projects has been checked by the DOE and can be made available to the EB upon request.
3) “used for similar projects with similar risks” The investments listed above include both similar projects (retrofit) and other projects (new clinker lines). All projects are required to meet the same financial returns in ACCCL. Further-more, technologies that are not core business in ACCCL such as power generation from waste heat have much higher technology risk than those that are core business (clinker lines). As such the returns from projects that are not core business should be even higher.
4) “resolution by the company’s Board and/or shareholders”The internal benchmark applied in this project is required by the Board of Anhui Conch Cement Company Limited (ACCCL) and the resolution of the ACCCL Board that states this has been submitted to the DOE1.
5) “benchmarks should not include the subjective profitability expectations or risk pro-file of a particular project developer”
1 The resolution of the ACCCL Board on the Development Strategy of ACCCL during the Tenth Five-year Plan of China Social & Economic Development and the Company Internal Benchmark for the Investments

In order to demonstrate the validity of this benchmark the Project Participant has calculated the weighted average cost of capital (WACC) in 2005 (the year that the investment decision was taken). This showed a WACC of 17.86%. Given that this is lower than the 18% specified by Conch, 17.86% this has been applied as the benchmark in the investment analysis to be con-servative. The calculation of the WACC has been audited by the DOE and all data used is pub-lically available. The benchmark is therefore not subjective but rather has been calculated in a fully transparent manner.
In conclusion the project in fully in compliance with the EB39 Annex 35 guidance.
---Compliance with the Tool for the demonstration and assessment of additionality (Ver-sion 03)
The following text is extracted from version 3 of the additionality tool.
Sub-step 2b – Option III. Apply benchmark analysisThe benchmark is to represent standard returns in the market, considering the specific risk of the project type, but not linked to the subjective profitability expectation or risk profile of a parti-cular project developer. For example, benchmarks for IRR, NPV, etc. can be derived from:
(a) Government bond rates, increased by a suitable risk premium to reflect private investment and/or the project type, as substantiated by an independent (financial) expert;
(b) Estimates of the cost of financing and required return on capital (e.g. commercial lending rates and guarantees required for the country and the type of project activity concerned), based on bankers views and private equity investors/funds’ required return on comparable projects;
(c) A company internal benchmark (weighted average capital cost of the company) if there is only one potential project developer (e.g. when the project activity upgrades an existing process).
The project developers shall demonstrate that this benchmark has been consistently used in the past, i.e. that project activities under similar conditions developed by the same company used the same benchmark.
1) “standard returns in the market” The project participants have already demonstrated that the benchmark represents standard returns for ACCCL. ACCCL is the largest cement manufacturer in China and this alone should be sufficient to demonstrate that the returns from the projects within Conch are representative of standard returns in the market.
It should be noted at this point that whilst other project owners have selected to use published minimum benchmarks for the sector in their CDM applications in most cases these do not rep-resent expectation of standard returns in the market. This is Government data and therefore not necessarily consistent with standard returns that may be achieved in the cement market.
To demonstrate this point the PDD also states:

“Outside of the ACCCL it can also be demonstrated that equity returns on cement production investments will be above 18% and more attractive than waste heat recovery projects. Project owners would therefore prefer to invest in new production, upgrade and restructuring rather than waste heat recovery. For example:
• The 5500 t/d Clinker Production Line of Jiangshu United Cement Company Limited, equity IRR is 22.05%2;
• The 2x4500t/d clinker production line of Tongshan Copper Mine, Tongling Nonferrous Metal Group, equity IRR is 23.69%3;
• The 2x5000t/d clinker production line of Taiwan Cement (Yingde) Company Limited, equity IRR is 22.78%4; •
• The upgrade project of the 4000t/d clinker production line of Shanggao Hongshi Cement company Limited, equity IRR is 24.22%5;
• The 4500t/d clinker production line with a new dry approach of Hezhou Datong Cement Limited, Hunan, equity IRR is 26.48%; 6
• The 4500t/d clinker production lines of Huarun Cement (Pingnan) Company Limited, equity IRR is 19.87%7. “
This list of projects was accessed by the Design Institute also responsible for the FSRs of ACCCL. It represents the complete list of projects during the period 2003 to 2006 from that institute. Given that it would be impossible to access market returns for all projects from all companies and design institutes this considered to be comprehensive enough to further de-monstrate that the standard returns in the market are above the benchmark of 18%.
2) “can be derived from” “a company internal benchmark (weighted average capital cost of the company) if there is only one potential project developer (e.g. when the project activity upgrades an existing process)”
There is only one possible project developer as described above. It can be further clarified that the project is an upgrade to an existing process, which is further reason to substantiate that there is only one possible project developer. Therefore the benchmark can be derived from a company internal benchmark. Moreover as stated above the benchmark can be derived from the WACC. The benchmark selection is therefore permissible under the terms of this condition in the additionality tool.
Thus, the project in fully in compliance with the Tool for the demonstration and assess-ment of additionality (Version 03).
---Compliance with National StandardsIn China, minimum investment benchmarks are published in the “Methods and Parameters for Financial Evaluation of Construction projects (3rd Edition)”.
However, they are not a fair representation of what investors thresholds are in reality these are just guidance of minimum returns expected by the Government. Furthermore these bench-
2 FSR of 5500 t/d Clinker Production Line of Jiangshu United Cement Company Limited 3 FSR of 2x4500t/d clinker production line of Tongshan Copper Mine, Tongling Nonferrous metal Group,
4 FSR of 2x5000t/d clinker production line of Taiwan Cement (Yingde) Company Limited
5 FSR of Upgrading project with 4000t/d clinker production line of Shanggao Hongshi Cement Company
6 FSR of 4500t/d clinker production line with a new dry approach of Hezhou Datong Cement Limited, Hunan7 FSR of 4500t/d clinker production lines of Huarun Cement(Pingnan) Company Limited

marks are for investment projects to be undertaken with Government funding or are in the Go-vernment’s area of focus (sectors where products are priced by the Government and guided by government policies). These sectors include electricity, water supply, heat and gas supply, rail and airport8.
ACCCL is not required to use these benchmarks for their investment decisions. Indeed, the book emphasizes that the published benchmarks are not necessarily suitable for private investors. In fact, the Methods and Parameters book states that private investors or other investors can determine their own benchmark based on their cost of capital and risk premium on particular investment project9.
ACCCL is therefore fully in compliance with the national rules for benchmark determina-tion and has applied the WACC as suggested by the guidance for private investors.
Suitability of the BenchmarkAnhui Conch Cement Company limited (ACCCL) is a listed Company. ACCCL was established in 1997 and was listed in 2002 on the Shanghai Stock Exchange and so has multiple sharehol-ders. As such, its financing is from different capital channels that causes various costs of capi-tal.
ACCCL therefore has a higher cost of equity than fully State Owned Enterprises or enterprises or projects which are supported by government funding in China. This is due to the fact that it has to satisfy the minimum equity costs required by shareholders with a higher cost of capital. As such, ACCCL must meet the minimum equity costs required by shareholders as well as the debt cost required by banks in order to continue to obtain financing for their investments.
As such, ACCCL has their own internal benchmark of 18% return on equity and this represents their cost of capital in 2003. This is documented by the resolution of the Board10. This resoluti-on has been checked by the DOE. As described above at no time has ACCCL invested in pro-jects below this threshold and as such it is demonstrated to be both suitable and appropriate to use this benchmark for all investments within ACCCL.
A Government published benchmark would not be appropriate as governments are much less risk averse than private and listed companies and will always have lower investment thres-holds. These benchmarks would also not satisfy the shareholders of Conch and would put the profitability of the company at serious risk.
Under no circumstances would Conch knowingly invest in projects with returns of 12% to 18%. Therefore, these projects would not have happened had ACCCL not believed that they would be eligible for CDM financing.
8 P196, “Methodology and Parameters for Economical Appraisal of Construction Project”, China Planning Publishing House (version9 P196, p197, p199 “Methodology and Parameters for Economical Appraisal of Construction Project”, China Planning Publish-ing House (version 3)10The Resolution of the ACCCL Board on the Development Strategy of ACCCL during the Tenth Five-year Plan of China Social & Economic Development and the Company Internal Benchmark for the Investments

Whilst other projects have used the 12% benchmark for the purposes of CDM application this does not have any bearing on the decision that ACCCL took and under no circumstances would Conch have invested at such low returns.
In conclusion the benchmark is suitable for the project activity and meets all of the re-quirements of the CDM rules.
Response by TÜV SÜD:
In assessing the benchmark used in the investment analysis, TÜV SÜD has followed a 3-step approach:
Step 1: Assessment of the eligibility of the project participant to use WACCAccording to “The guidelines on the Assessment of Investment Analysis, WACC should only be used in cases where there is only one possible project developer and should be demonstrated to have been used for similar projects, developed by the same company. The project owner is Zongyang Conch Cement Company Limited (TCCCL) subordinated to ACCCL and decision of investment is made by ACCCL. They are the only project developer, as the project is located at their plant side. The project participant provided the DOE with an overview of the company investments since 2003. For all projects (from 2003 to 2005) mentioned above, the FSR has been checked and verified by TÜV SÜD. All investments, projects with similar risks/ lower risks and other ones, have crossed the announced benchmark of 17.86%. We are of the opinion that since project is not the core business of the company and has higher associated risks, so it is conservative to take the same benchmark applied to other projects in core business of the company.The internal benchmark of 18% was decided in a board meeting of ACCCL dated on 19th Janu-ary 2003. This document has been checked and validated by TÜV SÜD.Therefore, the DOE can confirm, that the benchmark was continuously applied by the project developer.
Step 2: Assessment of the formulae used to calculate WACCThe formula has been taken from Rechard P. and Bill N. (2003) “Corporate Finance (fourth edition)”, Prentice Hall and has been crosschecked with other financial definitions. The formula can be considered as valid and applicable.
Step 3: Assessment of the Input values to WACC calculationThe equity and dept balance of Zongyang Conch Cement Company Limited has been checked through the “Consolidated Balance sheet of Anhui Conch Cement Limited”. The values applied in the calculation are consistent to them. The shared market price has been evidenced through Yahoo stock market information „share price on 30th December 2005. The dividends have been evidenced by the Yahoo stock market information „dividends paid over the period of 2002-2006“.
By these procedures TÜV SÜD was able to confirm, that the benchmark applied is reasonable.
Compliance with the Guidance on the Assessment of Investment Analysis (EB 39 Annex 35) The named requirements are the following:
• The project involves only one project developer

• The benchmark has been used for projects with similar risks• The benchmark has been evidenced by the resolution by the company’s Board• The past financial behaviour of the entity, during at least the last three years has been
assessed. • The benchmark does not include subjective profitability expectations or risk profile of the
project developer.
Following the discussion above and supporting the statement of the project participant, TÜV SÜD can confirm that all requirements are fulfilled. Hence the benchmark is in compliance with this guidance.
Compliance with the Tool for the demonstration and assessment of additionality (Ver-sion 03)
The named requirements are the following: • The benchmark represents standard returns in the market. • The benchmark derives from the company internal benchmark (weight average capital
cost of the company (if there is, like in this case, only one project developer)• It is demonstrated, that the benchmark has consistently been used in the past (from
2003~2005)Following the discussion above and supporting the statement of the project participant, TÜV SÜD can confirm that all requirements are fulfilled. Hence the benchmark is in compliance with this guidance.
Compliance with National Standards
As ACCCL is a listed company and therefore has higher costs of equity than fully State Owned Enterprises, which is due to the requirements of the shareholders, the sector benchmark for cement industry is not the most appropriate benchmark for this project. Please also refer to „ Methods and Parameters for Financial Evaluation of construction projects (3rd edition)“. On page 196, 197, 199 it is stated that the benchmarks are not always suitable for private in-vestors and for sectors where the products are not governed by government.And the private investors can determine their own benchmark based on their cost of capital and risk premium.
Even though similar project activities have applied published, government sectoral benchmark, it is not a requirement. The additionality of every project should be considered on its own.
TÜV SÜD can confirm that the chosen benchmark is in compliance with all three guidelines (Additionality tool, Guidance on the Assessment of Investment Analysis and National Stan-dards). Hence the benchmark is reasonable and appropriate.
In the IRR calculation submitted for registration the equity IRR was calculated. The equity IRR of the project is below the benchmark of 17.86%.

Referring to issue 2:
Response by Project Participant:
The input values applied in the investment analysis are derived from the FSR of the project. The FSR was undertaken by Sinoma International Engineering Co., Ltd which is an indepen-dent design authority1112. The FSR was approved by the government authority which is Anhui Province Development and Reform Commission1314.
The key input values taken from the FSR are detailed and evidenced as follows:
1 Total Investment15
1.1 Construction investment
Value in FSR (Mil-lion RMB)
Construction Cost 12.041Key Equipment Cost 178.52- Imported 91.8823- Domestic 86.6377Installation Cost 33.5351Other Construction Engineering Costs (including land and other construction costs, duty and sur-charge for imported equipments)
38.1496
Preparation cost 7.3231TOTAL 269.5688
The Installation and construction costs are in accordance with the guidance for Anhui province. The construction cost is estimated based on the guidelines for similar size WHR projects and the installation cost is estimated based on the guidelines for installation charges of similar size projects.
All purchase costs for domestic equipment refer to the factory price or quoted prices. The im-ported equipment cost is estimated based on the foreign manufacturer quoted price (C.I.F). As such, the key equipment cost in the equipment purchase agreements is very close to that in the FSR. In the FSR the cost estimate of the AQC boiler is 13.824 million RMB, the PH boiler is 91.8223 million RMB and the Turbine generator is 33.79 million RMB respectively.16. In the equipment purchase agreement, the cost of the turbine generator is 34.16 million RMB(purchaseI18.08 m+purchase II 16.08 m) 17, the PH boiler is 124.8119 million RMB• purchase I 62.7691m +purchase II 65.0428m=124.8119m€ 18 ,exchange rate is 100JYP
11 Qualification rank: A. No. Gongzijia 2031312004, issued by National Development and Reform Commission of P.R China12 FSR of Zongyang WHR project13 No.Fagainengyuan<2005>81814 FSR Approval of Zongyang WHR project15 Total investment estimate table p,48 FSR of Zongyang WHR project16 P57 ,FSR of Zongyang WHR project17 Purchase and Selling Contract for turbine generator18 Purchase and Selling Contract for PH boiler

:8.1202 RMB19 at the date of contract signed. And AQC boiler is 13.9134 million RMB(purchase I 7.8077m+purchaseII 6.1057m=13.9134m)compared to estimate of 13.8240m RMB20. Actualcapital cost of PH boiler is124.8119 milllion RMB, being 32.9296 million higher than estimated cost of PH boiler in FSR. Actual costs of AQC, PH boiler and turbine generator are higher than estimate in FSR. Therefore the input value of capital cost applied in FSR is very conservative.
The calculation of the duty, VAT, financing and surcharge for exchange rates has been done in accordance with the list of levied duty on import of equipments.
Other costs of construction engineering is estimated in accordance with the Budgetary Norm for Engineering Construction of Building Material sector (1992), issued by the State Building Mate-rial Bureau that gives reference to the specific situation of the proposed project.
The basic preparation cost is calculated as 5% of construction engineering cost (construction engineering includes construction cost, installation cost and other construction engineering costs)
1.2 Interest During Construction
The interest rate is 5.7285% and the repayment period is 3 year, 5.91% and repayment period is 1 year21. This gives an interest during construction of 7.5925 million RMB. This is derived from FSR and also with reference of the loan agreement.
1.3 Working Capital
Working capital is calculated as 0.0265RMB/KWh, which equates to 6.8 million RMB. The ac-tual working capital required was 0.04-0.05RMB/KWh22.
2. Power Tariff
The power tariff (inclusive) is 0.453RMB/KWh in the FSR23. This is the purchase rate and the-refore reflects the power cost savings. This rate is confirmed by the invoice of purchase of electricity by the project owner.24Even though the tariff rate increased in 2006, it will certainly not affect the revenue from saving in the electricity as the tariff rate is priced by the govern-ment. The government increased tariff rate due to the rise of PI of operation cost of power ge-neration such as material, transportation, interest rate of the loan etc. For example, NDRC rai-sed power tariff rate due to the big increase in coal price, transportation and interest rate25 Therefore, the actual net tariff rate will not change.
The national growth rate of purchase prices for raw materials, fuels and power are 11.4% and 8.3%•6% respectively26, average annual growth rate is 8.67% from 2004 to 2006. A broad overview is extended to ex-factory prices of industrial products and labor rate, there are the
19http://www.boc.cn/cn/common/service.jsp20 Purchase and Selling Contract for AQC boiler21 Loan agreement22 The explanation of demanded working capital over operation period23 P 61, FSR of Zongyang WHR project24 Invoice of purchase electricity ,25 The Notice on Adjustment for Tariff Rate of ECPG from NDRC, No.1230, fagaijia(2006)26 9.14 Indices of Purchasing Prices of Raw Materials ,Fuesls and Powers, China Statistical Year Book 2007http://www.stats.gov.cn/tjsj/ndsj/2007/html/I0914e.htm

same up-trend. From 2004 to 2006, the ex-factory prices of industrial products increase by 6.1%, 4.9% and 3%27 respectively; average annual growth rate is 4.67%. Labor rate increases even faster, growth rate amounts to 14.1%, 14.6%, and 14.4%28, average annual growth rate is 14.37%. However, the average tariff rate of Anhui province in 2004 is 0.4986RMB/kWh29, and 0.5033RMB/kWh in 200630, the average annual growth rate is 0.22% from 2004 to 2006.
From the statistics, there is clearly a trend of increasing costs in the material, transportation and labor etc. Given a general trend for increasing in the key components of O&M costs is much higher than growth of tariff rate. The net increase in tariff rate is impossible. Therefore the tariff rate applied in investment analysis is reasonable.
3 Power Generation
The average of operation hours of clinker line is 7672 hours. The power generation of the pro-ject is estimated in a basis of near full operation hours. This optimistic estimate gives a power generation of:
33.5MW x 7672 hours=257,000MWh31
The installed capacity and load factor are based on the most optimistic expectations of the pro-ject. This is unlikely to happen in reality and there are a number of reasons for this.
Firstly, the waste heat and smoke from the back of kiln contain large amounts of dust that ac-cumulate on the face of boiler. This affects the heat efficiency of the boiler and therefore the amount of power generation.
Secondly, PH boilers have air leakage that can not only influence the heat efficiency but also the operation of the kiln and power consumption of cement production. Furthermore it may bring the kiln to a halt and therefore also the PH boilers operation32.
This means that the power generation from the project cannot be expected to be at such high levels throughout its lifetime. This can be seen from the operation records from Ningguo phase I (a similar project funded by the Japanese government in 1998).
The actual installed capacity of Ningguo Phase I is 7200KW and the designed power generati-on is 55,296 MWh (7200KW x 7680hours). However, the operation record from 2000 to 2007 shows that the average operation hours of the kiln is 7660 hours. They also show that the ope-ration of the WHR versus the kiln is 91.74%. The average capacity is 6699KW and the avera-
27 9.13 Ex-factory Price Indices of Industrial Products, China Statistical Year Book 2007http://www.stats.gov.cn/tjsj/ndsj/2007/html/I0913e.htm28 5-22 Indices of wage of Staff and Workers , China Statistical Year Book 2007 http://w ww.stats.gov.cn/tjsj/ndsj/2007/html/E0522e.htm29The transmit of approval on the implementation of varying power tariff rate in peak and low-load time from NDRC, No.106 Wanjiafu(2004) http://www.phdp.gov.cn/news/html/00200514200514161933.html30 The Notice on provincial grid selling price of electricity and price of transmission and distribution electricity in 2006, Fagaijiage (2007)1521 issued by NDRC)31 P59, FSR of Zongyang WHR project32The development of SH boiler for pure lower waste heat system http://www.ccement.com/news/2006/5-19/C176954294.htm

ge power generation is 47160 MWh. This is 85.3% of the designed power generation and this was certainly known at the time of the investment decision although not corrected in the FSR.
Therefore, the power generation based on full workload being applied investment analysis in PDD is very conservative.
4 Operation Period33
The AQC and PH boilers are the key equipment of the proposed project. Therefore, the lifetime of the boilers determines the lifetime of the project. In general, the lifetime of the boiler is 10-15 years. Considering that the waste heat and smoke from the kiln that contains large amounts of dust, this is expected to lower the lifetime of the boiler and turbine generator.
The AQC boiler utilizes the waste heat and smoke gas from the front of the kiln and the PH boiler takes the waste heat and gas from the back of the kiln. When the parameters of waste heat and gas fluctuate, the two boilers influence each other. The adjustment in operation is very difficult. Furthermore, if the AQC boiler has a fault then either the whole power plant will stop operating or the cool water was fed into the PH boiler. These effects cause wear of the PH boiler that impacts it’s lifetime as well as causing safety problems34.
Therefore, design institute adopts the 12-year lifetime in the proposed project in reference to the advice from the engineer of Ningguo phase I.
5 O & M cost 29.37 m
The total O & M cost is 29.37 m is broken down as follows:
5.1 Operation Costs
Operation Cost Value in FSR (RMB)Material and water, power (utility cost) 13,590,00035
Chemical cost 2,291,519- 35%HCL: 60.66t x 2500 RMB/t 151,662RMB- 35%NaOH: 60.66 t x 5800RMB/t 351,856RMB- CL2 : 17.61t x 6000RMB/t 105,674RMB- HEDP: 39.14t x 16,500RMB 645,788RMB- N2H4.H2O: 2.94t x 30,900RMB/t 90,704RMB- C4H9NO: 9.3t x 47,500RMB/t 441,533RMB- Na3PO4H2O: 52.841t x 5100RMB/t 269,470RMB- other cost 234,832RMBWater Cost (468x1.70x7669hours) 6,110,208 RMBConsumption 335t/h36
Water price 1.80MB/tPower Utility Cost (Charge by the grid company for con-nection to the grid)
6,667,441
Tariff rate 0.028RMB/KWh
33 P54, FSR of Tongling WHR project34 http://www.ccement.com/news/2005/11-11/C1764869363.htm35 P55, FSR of Tongling WHR project36 P30, FSR of Tongling WHR project

Annual Net power generation 239,010MWh
All of the above tariff rates are estimated in accordance with the average tariff rate of Anhui province in 2005.
Indeed, the actual power utility cost is much higher than estimated in FSR. The agreement for connection to the power grid shows that the actual power utility cost charged by the power grid company for the connection to the grid is 0.040 RMB/KWh37 compared to 0.028 RMB/KWh.
Therefore the actual power utility cost is as follows:
239,010MWhx 0.040 RMB/KWh=9,560,400RMB
This is 2,892,959 higher than the estimate. Therefore, the input value applied in the investment analysis of PDD is conservative.
5.2 Labour Cost38
The number of employees is 31 and the average salary and benefit per employee is 30,000RMB/year and therefore the total annual labor cost is 930,000 RMB.
The labor rate is estimated in accordance with the average rate of the cement plant in Anhui Province in 2005. The actual average salary and benefit per employee in the Conch Group is 490,00RMB/year in 2005, 54,600RMB in 2006 and 58,800RMB in 200739. The difference is therefore 589,000RMB (31x49,000RMB-930,000)
5.3 Repairs and Maintenance cost
The annual repairs and maintenance cost is estimated as 3.41% of fixed assets investment and is given as 9,460,000RMB.
5.4 Other O& M cost
Other O&M costs/overhead covers all management costs. This includes training cost, business cost, distribution cost, travel cost, entertainment, property tax, land tax, the share of board cost, cost of vehicles license, sewage treatment charge, green-built cost, insurance of assets, cost for legal advice, labor insurance, auditing charge, labor unit charge etc. It is calculated in 0.02RMB/KWh.
Power generation 257,000 MWhRate: 0.021RMB/KWh
Total annual other O&M cost/overhead=257,000MWh x 0.021=5,390,000RMB
37 The Contract for Power Connection to the Grid 38 P63, FSR of Tongling WHR project39 The statistics of employee’s salary and benefit in ACCCL

Comparison of key financial parameters for different types of Waste Heat Recovery pro-jects40
The table below compares key parameters from the ZongyangWHR project with other WHR projects in China. The primary source of data is from other projects available on the UNFCCC website (both submitted and registered).
ProjectUnit Ca-pital Cost (million RMB/MW)
Operation Hours (hour)
Unit O&M Cost (RMB/KWh)
Self Con-sumption (%) Reference
1 Zongyang conch WHR 8.27 7672 0.1148 7 FSR
2 Registered WHR projects 8.14 7048 0.2141 7.4 UNFCCC
3Registered with corrections WHR projects
6.98 6853 0.1753 7.9 UNFCCC
4 Under review WHR projects 7.047 5624 0.2407 5.8 UNFCCC
5
Other projects prepared by the Sinoma Design Institute
6.651 5971 0.1893 7.6 see atta-ched FSR
From the table it can be seen that the capital cost is not higher comparable with the other WHR projects and however that the O&M cost is much lower. Furthermore the operation hours are much higher. The values used in the PDD are therefore both consistent and conservative.
40 Attached Financial data

Response by TÜV SÜD
In assessing the input values used in the investment, TÜV SÜD has followed the following ap-proach:
Assessment of the sources of the input parameters used in the investment analyses:a) All the input parameters used in the financial analysis are taken from the feasibility study report (FSR), which was developed by Sinoma International Engineering Co., Ltd. SIMANO is accredited by relevant national authorities and has based its assumptions in line with national guidance. This has been checked and verified during validation. The input parameters used in the finan-cial analysis can thus be considered information provided by an independent and recognized source.
Confirmation that the values used in the PDD and investment analysis are fully consis-tent with the FSR TÜV SÜD compared the input parameters for the financial analysis included in the PDD andinvestment analysis with the parameters stated in the FSR, and was able to confirm that the values applied are consistent with the sources.
Cross-check of the parameters used in the financial analysis with the parameters used by other similar projectsThe input values have been validated by comparing the figures with statistical figures from 90 CDM Waste Heat Recovery projects in the Cement Industry (registered and under validation). Additionaly the input values have been cross-checked with actual invoices of the proposed pro-ject. The specific investment costs of 8.3 Mio. RMB/MW is slightly higher than the average of 7.5Mio. RMB/MW of the statistics, but lower than the maximum of 14 Mio. RMB/MW of the statis-tics. The operational costs are 0.87 Mio. RMB/MW compared to 1.0 Mio. RMB/MW average. The grid tariff (excluding VAT) is slightly higher than the average (0.387 RMB/kWh versa 0.351RMB/kWh). The operational hours are significantly higher than the average (7672 h versa 6379 h).
Total investment
The total investment has been crosschecked with available “purchasing contracts“. The input value can be considered as plausible.
Power TariffThe power tariff has been cross- checked by the Zongyang tariff rate. The price of 0.453 RMB/kWh (incl. VAT) is consistent with the value applied in the FSR. Hence the value is plau-sible and reasonable. According to the Notice on provincial grid selling price of electricity and price of transmission and distribution electricity in 2006, fagaijiage (2007)1521 issued by NDRC (see answer of project participant), the power tariff of the province of Anhui is 0.503 RMB/kWh, which is higher than the power tariff of the FSR.
With an increasing electricity tariff it is assumed, that the other input values, like investment costs and O&M costs will also rise. An increase of the electricity price will hike the IRR whilst an increase of O&M costs will lower them. Both parameters are disproportional to each other. And

if we consider the same inflation for the products, their increase will equal each other. It is rea-listic, that the electricity price will rise in the next years. But through the connected discountand inflation rate, it is likely that the O&M costs will rise in the same proportion.Giving that scenario an increase of the electricity price will not lead to a different outcome of the investment analysis. The IRR will still be below the benchmark.
Power Generation The operational hours of the project are estimated to be 7672 hours per year. That is equal to 320 days per year. Hence the project has 36 days a year for repair work or emergency shut downs. By applying our sectoral experience, TÜV SÜD can confirm that these values are very reasonable and plausible.
Taxes have been crosschecked with government requirements and can be considered as valid and applicable. By additionally applying our sectoral competence and local expertise, TÜV SÜD was able to confirm that the input parameters used in the financial analysis are reasonable and adequately represent the economic situation of the project at the time of the final investment decision.

Referring to issue 3:
Response by Project Participant:
(a) Investment barriers
This principal mechanism for demonstration of additionality for this project is through the use of an investment analysis. As such the barrier analysis need not to be applied and the project participant agrees to the removal of this section.
(b) Domestic Technology in the Common Practice Analysis and the Essential Differen-ces between them and the Project Activity
The common practice analysis has been undertaken for the East China Power Grid (ECPG).
The investment environment for each province in China is different. This is due to a variation of available natural resources (including coal), the economic development level, the industrial structure, the fundamental infrastructure, development strategy and the policy framework. These all affect the demand for products in terms of amount as well as the types of products and technologies.
As such a number of key economic factors vary from province to province. These include tariff rates of products, the cost of materials, the cost of electricity and other utilities such as water, the cost of labor and services and the types of loan that can be obtained. These all vary bet-ween provinces.
Therefore China cannot be considered to be a homogeneous country, but rather should be considered as a country made up of a number of “smaller countries” comparable in size and diversity to a “large European country”.
By way of example the table below shows the variation of average selling price of electricity by each grid and average wage of workers for each province in 2006. These factors have a very strong influence on the project economics especially when there is such high variation.
Labor41 and electricity rates in 200642
41 China statistical yearbook 200742 The Notice on provincial grid selling price of electricity and price of transmission and distribution electricity in 2006, fagaijiage (2007)1521 issued by NDRC)

Average wages of staff and workers(RMB/year)
Selling price of electricity by each grid(RMB/MWh -inclusive)
North East Chi-na Power Grid (NECPG)Liaoning 19624 508.55Jilin 16583 485.62Helongjiang 16505 482.22North China Po-wer Grid (NCPG)Beijing 40117 525.22Tianjin 28682 525.22Hebei 16590 440.92Shandong 19228 478.48Shanxi 18300 408.68Inner Mongolia 18469East China Po-wer Grid (ECPG)Shanghai 41188 649.6Jiangsu 23782 590.13Zhejiang 27820 569.28Fujiang 19318 490.13Anhui 17949 503.37North West Chi-na Power Grid (NWCPG)Shannxi 16918 420.74Gansu 17246 356.65Qinghai 22679 291.43Ningxia 21239 358.72Xinjiang 17819 417.13Central China Power Grid (CCPG)Henan 16981 516.75Hubei 16048 429.24Hunan 17850 496.41Jiangxi 15590 506.82Chongqing 19215 465.76Sichuan 17852 507.04South China Power GridGuangdong 26186 681.9Guangxi 18064 449.7Yunnan 18711 392.33Guizhou 16815 377.29Hainan Province 15890 615.23

This table shows the high degree of variation between provinces and there are many more fac-tors that could be presented in a similar manner. This demonstrates that similar projects loca-ted in different provinces will have different returns on investment.
Accordingly, only projects within the same province can be truly comparable. However, in order to give a higher sample size for the common practice analysis the list has been extended from the province to the ECPG. At least within a regional grid access to resources such as coal will be similar based purely on geography and therefore the comparison regionally is still more robust than doing the comparison for the whole of China.
In the PDD 3 CDM projects have been included in the list. However at EB 38 new guidance was issued (paragraph 60) that states “The Board clarified that in the context of conducting common practice analysis, project participants may exclude registered CDM project activities and project activities which have been published on the UNFCCC CDM website for global sta-keholder consultation as part of the validation process.”
This guidance was not available at the time of submission of this project, but the project partici-pant is able to make the necessary correction to the PDD as required. According to the gui-dance, two projects are registered (Ningguo Phase 243 and Zhejiang Hongshi44) and one is un-der validation (Changxing Xiaopu Zhongsheng45). As such they have now been removed from the common practice list as below.
A correction is made in the common practice as well since there was mistake in the projects listed in the common practice of the PDD. The project 5 Sanshi Zhejiang Changxing Cement Plant (2500+5000t/d) is the same as project 7 listed in the PDD. It means the same project ap-pear twice in the common practice. Therefore project 5 is deleted in the common practice list below.
Also, Project 9 in PDD was removed as the project was built based on a clinker line with capa-city of 1200t/d which is below the capacity of 2000t/d of clinker line. This cement line has been shut down already due to Government indistial policy therefore highlighting the risks associated with such investments. Indeed the project was shut down before the investment decision for the project activity had been taken. As such it is not thought appropriate to compare this failed small scale project. Furthermore it was developed as a demonstration of technology in 200346.
Excluding the projects mentioned above, by the end of 2005, there were totally 127 cement clinker lines using the dry technology with an output of more than 2000t/d in the ECPG. Of these 39 lines are in Anhui province, 50 lines in Zhejiang province, 30 lines in Jiangshu provin-ce, 7 lines in Fujian and 1 lines in Shanghai47. Among the 127 cement clinker lines; there are 7 WHR power generation projects on 8 clinker lines48 that have not applied for the CDM. These projects are presented below:
Other similar projects at similar sized cement plants and facilitating Circumstances in East China
43 http://cdm.unfccc.int/Projects/DB/TUEV-SUED1169802677.31/view44 http://cdm.unfccc.int/Projects/DB/DNV-CUK1183444695.42/view45 http://cdm.unfccc.int/Projects/Validation/DB/OYGCGG7Y4GMNY5T3PQYF2H8XX9LN35/view.html46 http://www.sinoma.cn/ReadNews.asp?NewsID=561947 Statistic figure of clinker lines with dried production method and output over 1000t/d in China, China Cement Association48 Statistic figure of WHR projects in China, China Cement Association.

No
Project Name Public Source / reference Facilitating circumstances
1 Anhui Ningguo Cement Plant(4000 t/d)
http://www.osti.gov/bridge/servlets/purl/926167-oYrbRc/926167.PDF
The project was Japanese NEDO granted Equipment in 1998
2 Zhejiang Huzhou Zhonglida Cement Plant (2500t/d)
http://www.ccement.com/news/2006/1-9/C1763443923.htm
Used domestic design and equipment. Funded by a foreign enterprise and thus eligible for tax reductions.
3 Sanshi Zhejiang Changxing Cement Plant (2500+5000t/d)
http://www.chinacements.com/news/2004/9-20/C1775652479.htm http://www.bm.cei.gov.cn/tabid/63/InfoID/81820/Default.aspxhttp://www.secidc.org.cn/newscontent.asp?id=786
Used domestic design and equipment. Sino-Hongkong joint-venture investment eligible for tax reductions.
4 Zhejiang Sanshi Cement Works(23.5MW)
http://www.zjskw.gov.cn/Index/Catalog327/928.aspx
Project undertaken by the State Owned Enterprise, Sanshi, as a domestic technology demonstration. Thus it was financed by Government.
5 Zhejiang Changxing Mei Shan Zong Sheng Cement Plant(5000t/d)
http://zjdaily.zjol.com.cn/html/2008-04/09/content_2179830.htm
Used domestic design and equipment. State Owned Enterprise and therefore funded as a demonstration by Government.
6 Zhejiang Tongxiang Shenhe Cement Plant(2500t/d)
http://www.jxet.gov.cn/gov/news/jjyx/200583154654.html
Used domestic design and equipment. Demonstration project of domestic techno-logy. Supported by Go-vernments and internatio-nal organizations.
7 Zhejiang Longyou Qinglongshan Cement Plant(2500t/d)
http://218.72.253.122/news/shownews.asp?newsid=408
Used domestic design and equipment. Key demons-tration project under the programme of circular eco-nomic development in Longshan.
There are a number of essential distinctions between the similar projects above and the Zon-gyang project.
The first is that project 1 is entirely funded by the Japanese Government as a demonstration of Japanese Kawasaki technology in China. Thus, the project is possible without the CDM sup-port.

The second distinction is that projects 2 and 3 are foreign investments which were built in 2004 and 2005 respectively and financed by foreign capital49 that meant that the project owner can enjoy preferential income tax policies. Hence, they pay less income tax compared to domestic company. And as such enjoy preferential tax policy that provides reductions on annual income tax. The first 2 years are tax free and the following next 3 income tax is at 50% of the normal rate of 30%50. As such these projects had additional financial benefits in order to make them economically attractive.
The third distinction is that project 4 has been implemented by a State Owned Enterprise as a demonstration of domestic technology. Thus all finance came from the Government at very low risk. Aside from the fact that financing of this project is very low risk, but also the investment thresholds of SOEs are lower and therefore a lower benchmark would be applied and in this case it would likely be closer to the 12% Government approved benchmark for the sector.
The fourth distinction is that projects 5 to 7 are demonstration projects for domestic technology for low-temperature waste heat for power generation. These projects were part of the Govern-ment’s Eighth Five-Year Plan to tackle key technology barriers and demonstrate domestic technology51. There is no doubt that these projects were given strong support by the state go-vernment to ensure implementation.
Project 5 is a part of key national demonstrate project of ten energy-saving programme projects over Eleventh Five-year Plan52. It is a subsidiary of China National Building Material Company Limited which is state owned company53. Thus, the project financing did not facing the any bar-riers.
As the first power generation project based on the utilization of waste heat from rotating kiln with new dried production method, project 6 had been greatly supported in either finance and policies by relevant national governments and international organizations such as National mi-nistry of agriculture, global environmental fund, UNDP, Industrial development organization of United Nation over the period from the project proposal approved to construction54. It also be-come a demonstrate project of emission reduction of green house gas for China rural enterpri-ses
Project 7 is a key part of the programme of projects to encourage the circular economy deve-lopment in Longshan County. This is also a key demonstration county of the Zhejiang Provin-cial circular economy development55. Therefore both Zhejiang province and Longshan County gave a great deal of political support to this project. This will also have been the case for the other two demonstration projects in Zhejiang.
The main difference between the two technologies is that the Kawasaki technology is more efficient and more expensive than domestic technology. The power generation of clinker per ton for the Japanese technology is 36•45kwh/t . This compares to 38-42 kwh/t for domestic
49 http://www.chinacements.com/news/2004/9-20/C1775652479.htm; http://www.ccement.com/news/2006/1-
9/C1763443923.htm; http://www.zhonglida.com/html/zld-4jt-1.htm50 Income tax law for foreign investment enterprises, Command 45 of President of China51 http://www1.dcement.com/Html/yrfd/yrfd_tj/2007-3/18/2007031822570866164.asp ;52 http://www.smezj.gov.cn/newzjsme/list.asp?id=504653 http://zjdaily.zjol.com.cn/html/2008-04/09/content_2179830.htm54 http://www.jxet.gov.cn/gov/news/jjyx/200583154654.html55 http://218.72.253.122/news/shownews.asp?newsid=408

technology. The inner efficiency of turbine for the Japanese technology is 83%-90% and for the domestic technology it is 80-87%56. This can also been seen from the comparison of key pa-rameters from Zongyang conch with other WHR projects in China showed in the table above.
Furthermore, the levelised cost of domestic technology presented in Question 4 is higher than the proposed project due to the lower efficiency. However, the initial investment of the propo-sed project is higher than for domestic technology. The capital cost is of the Japanese tech-nology is 9000 -12000RMB/KW compared to 5500-6500RMB/kW for domestic.57 The Japane-se technology therefore has a higher risk profile and has been more difficult to finance than domestic technology.
Given the lack of experience in the cement sector in waste heat recovery, companies tend to look at the lower cost initial investment and these technology applications have in the past been limited to demonstration projects as shown in the common practice analysis list.
(c) Why the PP has not Opted to use Domestic Technology
In 1998 Conch were awarded grant financing by the Japanese Government’s Green Fund to demonstrate the Japanese Kawasaki waste heat recovery technology at their Ningguo plant (Ningguo Phase I). Subsequent to this demonstration project, Conch did not invest in any addi-tional waste heat recovery plants since they were not core business and did not meet their fi-nancial objectives. Given that Conch already had some experience of the Kawasaki technolo-gy at one of their sites they only looked at roll out of this technology and not other less efficient technology options. Using domestic technology was therefore never an option that was consi-dered seriously by Conch.
Additionally, domestic technology is less efficient and is not financial attractiveness in terms of Conch internal hurdle rate set up by the board. And at the same time not significantly less ex-pensive. This is also shown in the answer to Questions 2 and 4. There is therefore no quanti-fiable economic benefit to using the domestic technology.
56 http://www.chinacements.com/news/2007/4-11/C134253705.htm57 http://www.chinacements.com/news/2007/4-11/C134253705.htm

Response by TÜV SÜD
a) The project participant will rely on the investment analysis. The barrier analysis will be skipped in the revised PDD. For that reason an answer to this question is not needed anymore.
b) In the common practice analysis Waste Heat Recovery Projects constructed in the Cement Sector in East China have been assessed. The investment environment for each province in China is different. This is due to variation of natural resources, the economic development level, the industrial structure, the infrastructure, development strategy and the policy framework. The different labour costs and electricity prices have been presented by the “labor and electric-ity rates in 2006”. As east china, is the region with the highest number of Cement plants and covers a large geo-graphical area, the audit team is of the opinion, that the geographical boundary chosen by the project proponent is reasonable.
The assessment shows, that there are 11 Waste Heat Recovery project have been imple-mented in the Cement Industry.One project (first phase of no.1 in PDD) was granted equipment by Japanese New Energy and Industrial Technology Development Organization. This has been checked and verified by the “Financing of Energy Efficiency Improvement for Cement Industry in China” issued by Globe Environment Institute (GEI).Two projects are already registered CDM projects (second phase of project no.1 and no.3 in the PDD).One project is applying CDM (no. 9 in the PDD). This has been checked and verified by the DOE by checking the UNFCCC webpage. Two projects (no. 4 and no.5 of the PDD, project no. 2 and 3 in the table above) used foreign investment, which means the project owner enjoyed preferential tax policies and had to pay less income tax compared to domestic companies. This has been checked and verified by the China Cement news58. A remark has to be made here, that project no.5 in the PDD and project no.7 in the PDD are the same projects. Hence project no.7 in the PDD is not separately listed in the table above. Following the description above project no. 7 of the PDD has a different financing background. One project (no 2 in PDD and no 4 in the table above) has been developed by a state owned enterprise. It was financed by the government and hence has a different investment back-ground than the proposed project. This has been checked by the official government page. 59
One project (no. 8 in the PDD and no. 5 in the table above) was part of the energy saving pro-gramme and got subsidies from the China National Building Material Company.60
One project was (no.10 in the PDD and no. 6 in the table above) supported by the national government and hence has been developed with a different investment background. 61
One project was (no. 11 in the PDD and no. 7 in the table above) part of the programme of pro-jects to encourage the circular economy development in Longshan County. Therefore the pro-ject received great political favour. 62
58 http://www.chinacements.com/news/2004/9-20/C1775652479.htm; 59 http://www.zjskw.gov.cn/Index/Catalog327/928.aspx60 http://zjdaily.zjol.com.cn/html/2008-04/09/content_2179830.htm61 http://www.jxet.gov.cn/gov/news/jjyx/200583154654.html62 62 http://218.72.253.122/news/shownews.asp?newsid=408

One project (no. 6 in the PDD) is much smaller than the proposed project. The project has been submitted for registration in March 2008, hence projects that have been implemented after that are not included into the analysis.
The DOE is of the opinion that the above mentioned explanation clearly shows the difference of the proposed project activity and the other Waste Heat Recovery Projects. Hence the project fulfils the criteria of step 4 of the additionality tool whereby it can be confirmed that similar ac-tivities are not widely observed without grants/subsidies etc.
For that reason the project 1675 is different to those mentioned in the common practice analy-sis.
c) The DOE confirms that the project proponent already had experience with the applied Kawa-saki equipment. They were awarded grant financing by the Japanese Government’s Green Fund to demonstrate the Japanese Kawasaki waste heat recovery technology. The project pro-ponent was satisfied with the equipment and hence chose to use it again.

Referring to issue 4
Response by Project Participant:
In accordance with the request for review questions the alternative baseline scenarios are as follows:
A. The proposed project activity undertaken without being registered as a CDM project activi-ty;
B. Import of equivalent electricity from the ECPG; C. Equivalent power supply from the existing or new captive plant on-site; D. Equivalent power from captive plant and the grid•E. Equivalent power supplied by a WHR power plant where the domestic technology is app-
liedF. Equivalent power supplied by a WHR power plant where the domestic technology is app-
lied and the shortfall is made up from purchase from the gridG. Other uses of the waste heat;
As analysed in the PDD, scenarios C, D and G are not feasible baseline scenarios.
In order to answer Questions 3, 4 and 5 of the review questions, the assessment of a credible baseline scenario is conducted by an economic comparison of levelized costs for scenario A, B, E and F.
The project participant has prepared a levelised cost analysis for these 4 possible baseline scenarios. This has been done through a Net Present Value of the costs of the four scenarios and a subsequent evaluation of the levelised cost of each.
The results of this analysis are presented in the tables below:
Power Generation
Reference 0 1 2 3 4 5 6 7 8 9 10 11 12
Annual Power Generation (MWh) A FSR - 215,109 239,010 239,010 239,010 239,010 239,010 239,010 239,010 239,010 239,010 239,010 239,010 Discount Factor B = 1 / (1 + DR)n 1 0.84746 0.71818 0.60863 0.51579 0.43711 0.37043 0.31392 0.26604 0.22546 0.19106 0.16192 0.13722 Present Value of Annual Generation(MWh) C = A x B - 182,296 171,652 145,469 123,279 104,474 88,536 75,030 63,586 53,887 45,665 38,700 32,797
Total Present Value of AnnualGeneration (MWh) D = Sum (Ci) 1,125,372
Net Power Price (RMB/MWh) E FSR 376
Scenario A. Zongyang conch WHR Project
Reference 0 1 2 3 4 5 6 7 8 9 10 11 12
capital cost F =G+H
Equity G FSR 139,568,800
Loan payment and interest payment H FSR 51,369,087 48,732,955 46,250,605 8,027,172
O&M Cost I FSR 28,011,000 29,370,000 29,370,000 29,370,000 29,370,000 29,370,000 29,370,000 29,370,000 29,370,000 29,370,000 29,370,000 29,370,000
production cost J FSR 58,843,120 57,565,988 55,083,638 52,601,288 52,166,366 52,166,366 52,166,366 52,166,366 52,166,366 52,166,366 52,166,366 52,166,366
Residue K FSR 3,604,652
Income Tax saved (@ 33%) L =( J-K) x 0.33 19,418,230 18,996,776 18,177,601 17,358,425 17,214,901 17,214,901 17,214,901 17,214,901 17,214,901 17,214,901 17,214,901 16,025,366
Total cost M = G+H+I-L 139,568,800 59,961,857 59,106,179 57,443,005 20,038,747 12,155,099 12,155,099 12,155,099 12,155,099 12,155,099 12,155,099 12,155,099 13,344,634
Discount Factor N = 1 / (1 + DR)n 1 0.84746 0.71818 0.60863 0.51579 0.43711 0.37043 0.31392 0.26604 0.22546 0.19106 0.16192 0.13722
Present Value of Total annual cost O = MxN 139,568,800 50,815,275 42,448,876 34,961,536 10,335,785 5,313,115 4,502,613 3,815,729 3,233,743 2,740,489 2,322,353 1,968,154 1,831,151
Total Present Value of annual cost P = Sum (Oi) 303,857,619
Levelised cost Q P/D 270
Scenario B. Power Purchase
Reference 0 1 2 3 4 5 6 7 8 9 10 11 12equity in capital Cost F FSRO&M Cost G FSR 80,878,833 89,865,370 89,865,370 89,865,370 89,865,370 89,865,370 89,865,370 89,865,370 89,865,370 89,865,370 89,865,370 89,865,370 Income Tax saved (@ 33%) H = G x 0.33 26,690,015 29,655,572 29,655,572 29,655,572 29,655,572 29,655,572 29,655,572 29,655,572 29,655,572 29,655,572 29,655,572 29,655,572 Total Cost J = F + G - H 54,188,818 60,209,798 60,209,798 60,209,798 60,209,798 60,209,798 60,209,798 60,209,798 60,209,798 60,209,798 60,209,798 60,209,798 Discount Factor K = 1 / (1 + DR)n 1 0.84746 0.71818 0.60863 0.51579 0.43711 0.37043 0.31392 0.26604 0.22546 0.19106 0.16192 0.13722 Present Value of Total Annual Cost L = J x K - 45,922,856 43,241,473 36,645,489 31,055,612 26,318,305 22,303,515 18,901,060 16,018,215 13,574,901 11,503,684 9,749,170 8,261,988 Total Present Value of Annual cost M = Sum (Mi) 283,496,268 Levelised cost Sum(Mi)/Sum(Li) 252
Scenario E. Domestic Technology to provide the equivalent power generation
MInstalled capacity withequivalent net annualelectrity supply
43.34 143,077,005
Reference 0 1 2 3 4 5 6 7 8 9 10 11 12
Capital Cost(million RMB) F
Average cost / MW takenfrom 4 domest WHR FSRsfrom the Sinoma DesignInstitute x M
288,209,349
where: equity 145,132,345 loan 135,182,110 interest 7,894,895
equity D 145,132,345 53,416,781 50,675,567 48,094,265 8,347,154
interest payment E 8,356,078 5,614,864 3,033,561 452,259 repayment of principal F 45,060,703 45,060,703 45,060,703 7,894,895 Depreciation(million RMB) G As above 23,056,748 23,056,748 23,056,748 23,056,748 23,056,748 23,056,748 23,056,748 23,056,748 23,056,748 23,056,748 23,056,748 23,056,748
Amortization H As above
O&M Cost(million RMB) J As above 44,080,068 48,977,854 48,977,854 48,977,854 48,977,854 48,977,854 48,977,854 48,977,854 48,977,854 48,977,854 48,977,854 48,977,854 Residue(million RMB) K As above 11,528,374
Income Tax saved (@ 33%) L = (G+H+J-K) x 0.33 22,155,149 23,771,419 23,771,419 23,771,419 23,771,419 23,771,419 23,771,419 23,771,419 23,771,419 23,771,419 23,771,419 19,967,055
Total Annual cost M = D+J-L 145,132,345 75,341,700 75,882,002 73,300,700 33,553,589 25,206,435 25,206,435 25,206,435 25,206,435 25,206,435 25,206,435 25,206,435 29,010,799 Discount Factor N = 1 / (1 + DR)n 1 0.84746 0.71818 0.60863 0.51579 0.43711 0.37043 0.31392 0.26604 0.22546 0.19106 0.16192 0.13722
Present Value of Total Annual cost O = MxN 145,132,345 63,849,077 54,496,936 44,613,005 17,306,606 11,017,985 9,337,220 7,912,804 6,705,920 5,683,043 4,815,942 4,081,426 3,980,862
Total Present Value of Annual costP = Sum (Oi) 378,933,170
Levelised cosT Q Sum(Oi)/Sum(Ci) 337
Scenario F. Domestic Technology and purchase from the grid to provide the equivalent power generation
Reference 0 1 2 3 4 5 6 7 8 9 10 11 12Propotion WHR in Baseline A = 33.5/ "Scenario E" M 77%
Propotion Grid in Baseline B = ("Scenario E" M - 33.5) /"Scenario E" M 23%
Capital Cost(million RMB) C = "Secnario E" x A 222,793,611 where: Equity D = "Secnario E" x A 112,191,222
Loan E = "Secnario E" x A 104,499,422 Interest F = "Secnario E" x A 6,102,967
equity E = "Secnario E" x A 112,191,222 41,292,614 39,173,582 37,178,166 6,452,576 - - interest payment F = "Secnario E" x A 6,459,474 4,340,441 2,345,025 349,608 - - principal repayment G = "Secnario E" x A 34,833,141 34,833,141 34,833,141 6,102,967 - - Depreciation(million RMB) H = "Secnario E" x A - 17,823,489 17,823,489 17,823,489 17,823,489 17,823,489 17,823,489 17,823,489 17,823,489 17,823,489 17,823,489 17,823,489 17,823,489
Amortization I = "Secnario E" x A +"Secnario B" x B
O&M Cost(million RMB) J= "Secnario E" x A +"Secnario B" x B - 52,432,394 58,258,216 58,258,216 58,258,216 58,258,216 58,258,216 58,258,216 58,258,216 58,258,216 58,258,216 58,258,216 58,258,216
Residue(million RMB) K = "Secnario E" x A - - - - - - - - - - - - 8,911,744 Income Tax saved (@ 33%) L = (H+I+J-K) x 0.33 23,184,441 25,106,962 25,106,962 25,106,962 25,106,962 25,106,962 25,106,962 25,106,962 25,106,962 25,106,962 25,106,962 22,166,087 Total Annual cost M = E +J--L 112,191,222 70,540,567 72,324,835 70,329,419 39,603,829 33,151,253 33,151,253 33,151,253 33,151,253 33,151,253 33,151,253 33,151,253 36,092,129 Discount Factor N = 1 / (1 + DR)n 1 0.84746 0.71818 0.60863 0.51579 0.43711 0.37043 0.31392 0.26604 0.22546 0.19106 0.16192 0.13722Present Value of Total Annual Cost O = M x N 112,191,222 59,780,309 51,942,250 42,804,594 20,427,259 14,490,744 12,280,219 10,406,841 8,819,559 7,474,282 6,333,878 5,367,851 4,952,562 Total Present Value of Annual Cost P = Sum (Oi) 357,271,570 Levelized cost Q Sum(Oi)/Sum(Ci) 317
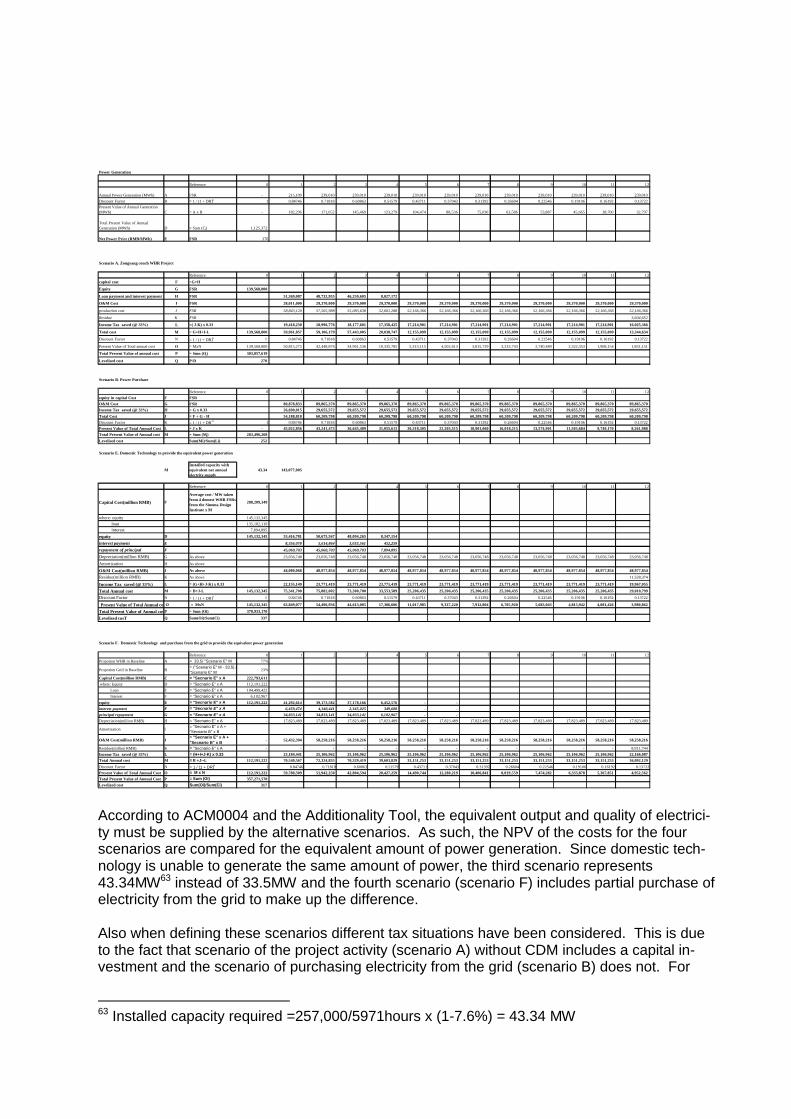
According to ACM0004 and the Additionality Tool, the equivalent output and quality of electrici-ty must be supplied by the alternative scenarios. As such, the NPV of the costs for the four scenarios are compared for the equivalent amount of power generation. Since domestic tech-nology is unable to generate the same amount of power, the third scenario represents 43.34MW63 instead of 33.5MW and the fourth scenario (scenario F) includes partial purchase of electricity from the grid to make up the difference.
Also when defining these scenarios different tax situations have been considered. This is due to the fact that scenario of the project activity (scenario A) without CDM includes a capital in-vestment and the scenario of purchasing electricity from the grid (scenario B) does not. For
63 Installed capacity required =257,000/5971hours x (1-7.6%) = 43.34 MW

scenarios A, E and F there is a capital allowance for the depreciation and amortization of the capital cost (excluding residue). For scenarios A and B, E and F income tax will be due. Inco-me tax is due on net income and this will be different in each case as there is a tax benefit in having higher annual costs i.e. less tax will be paid. In other words net annual income will be less when there are higher annual costs and therefore income tax will also be less. Converse-ly, when net annual income is higher then so are the taxes.
The calculation of levelised cost of scenario E is based on average parameters from the FSRs of four WHR projects that use domestic technology64. The parameters used are as follows65:
• Average operation hours under full load per year (5791 hours/year), • Unit capital cost per MW (6.651 million RMB/KWh), • Unit operation cost (0.1893 RMB/KWh), • Self-consumption rate (7.6%)
These four projects are the full set of feasibility studies undertaken by the Sinoma Design Insti-tute, which is the same Institute that has undertaken the feasibility reports for Conch66. The data from these projects has been used for the comparison and this data has also been compa-red with the data used in projects available from the UNFCCC web site (see question 2 above). This shows that the data used in this analysis is also consistent with the parameters used by other CDM projects.
When using the levelised cost analysis the scenario with the least cost is determined as the baseline. In this case the lowest levelised cost of power generation is for scenario B (purchase from the grid). Scenario B has a levelised cost of 252 RMB/MWh. This compares to 270 RMB/MWh for scenario A (the project), 337 RMB/MWh for scenario E (domestic technology) and 317 RMB/MWh for scenario F (domestic technology and grid purchase).
According to this, the baseline is purchase of power from the grid. This assessment further demonstrates the additionality of the project and is compliant with Sub-step 2b: Option II. Apply investment comparison analysis. This also further substantiates Question 1 above and de-monstrates that the project is additional based on the results of this investment analysis.
64 Attached relevant pages of FSR for these four projects65 Attached Key Financial data of projects with domestic technology 66 These are not related to the projects in the common practice list as information on the projects is not publically available and the feasibility study reports were developed in the past year, so are likely to be at an early stage

Response by TÜV SÜD:
The economical analysis of Zongyang Conch Cement Company limited to implement a CCPP project, was based on benchmark analysis during the investment decision, which revealed that calculated IRR was below the benchmark as validated by TÜV SÜD and confirmed in response to issue 1 above.The above described “levelised costs analysis” was conducted since the barrier analysis has been withdrawn in the PDD by the project participant and was required to fulfil the methodo-logical requirement as stated in the Request for Review. This analysis has been validated and is found to be appropriate and shows that scenario A (generating electricity at the ZongyangCement Plant) has higher levelised cost of 270 RMB/MWh than scenario B (purchasing elec-tricity from the grid) 252 RMB/MWh. In this scenario the project owner would continue purchase from grid since this option is more economically feasible.
Input values to this analysis are similar to the analysis presented earlier. These input values were already validated during validation process and have been further confirmed in response to issue 2 above. The method of comparison is appropriate in our opinion since it clearly presents the price to get a unit of electricity (kWh) in both scenarios. The discount rate used for project scenario is same as benchmark and is considered to be very appropriate. Additionally the scenario to continue purchase from grid does not require high initial investment and no further risks, where as the development of the project includes both. Hence the baseline scenario should be purchasing electricity from the grid. In scenario E the project proponent calculates the levelised cost of generation from domestic technology to provide equivalent power. This analysis has been validated and is found to be appropriate and input values have been validated. The operational hours, O&M costs and the investment costs for domestic technology has been validated from FSRs provided to TÜV SÜDfor four WHR projects using domestic technology.In scenario F the project proponent calculates the levelised cost of generation from domestic technology and importation from grid to provide equivalent power. This analysis has been vali-dated and is found to be appropriate and input values have been validated. This analysis shows that import of electricity from the grid is the most economical scenario from above four scenarios. The scenario of application of domestic technology is the more economi-cally unattractive compared to the project and hence is not a likely scenario without incentives.