


Languages
Pages
Legal

1
Tropical Cyclone Report Tropical Storm Florence
(AL062012) 3-6 August 2012
John P. Cangialosi
National Hurricane Center 14 October 2012
Florence was a short-lived tropical storm over the eastern Atlantic Ocean that dissipated east of the northern Leeward Islands. a. Synoptic History
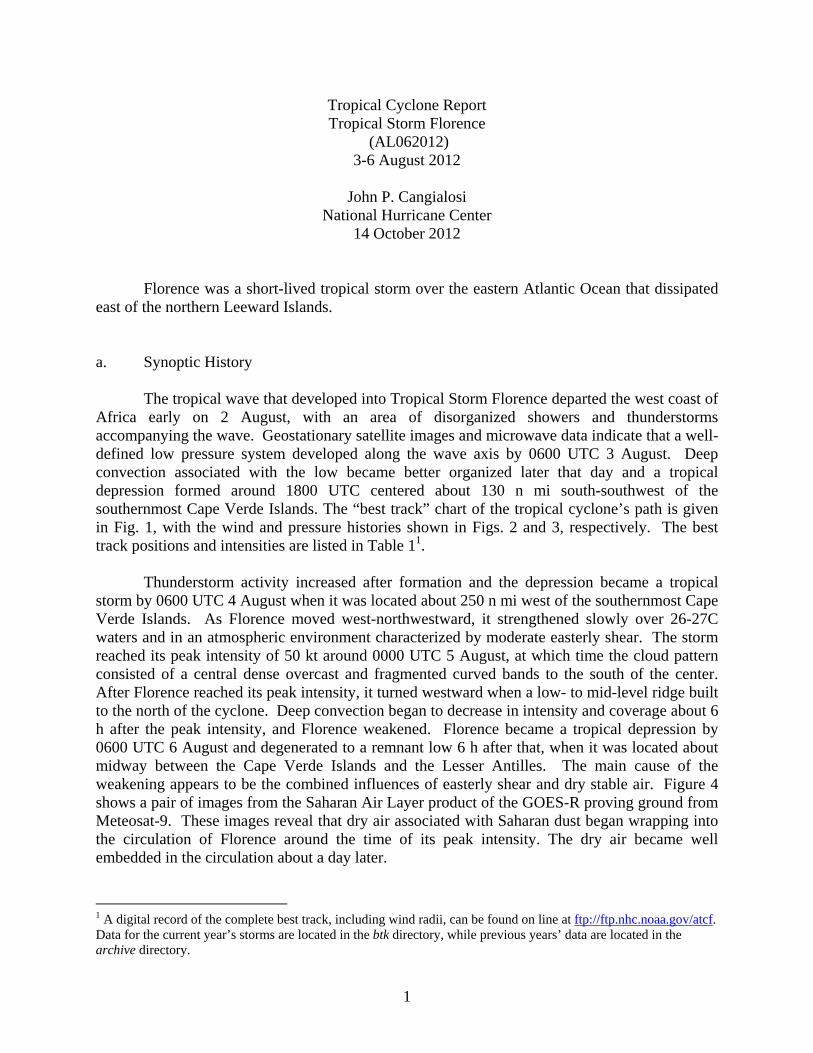
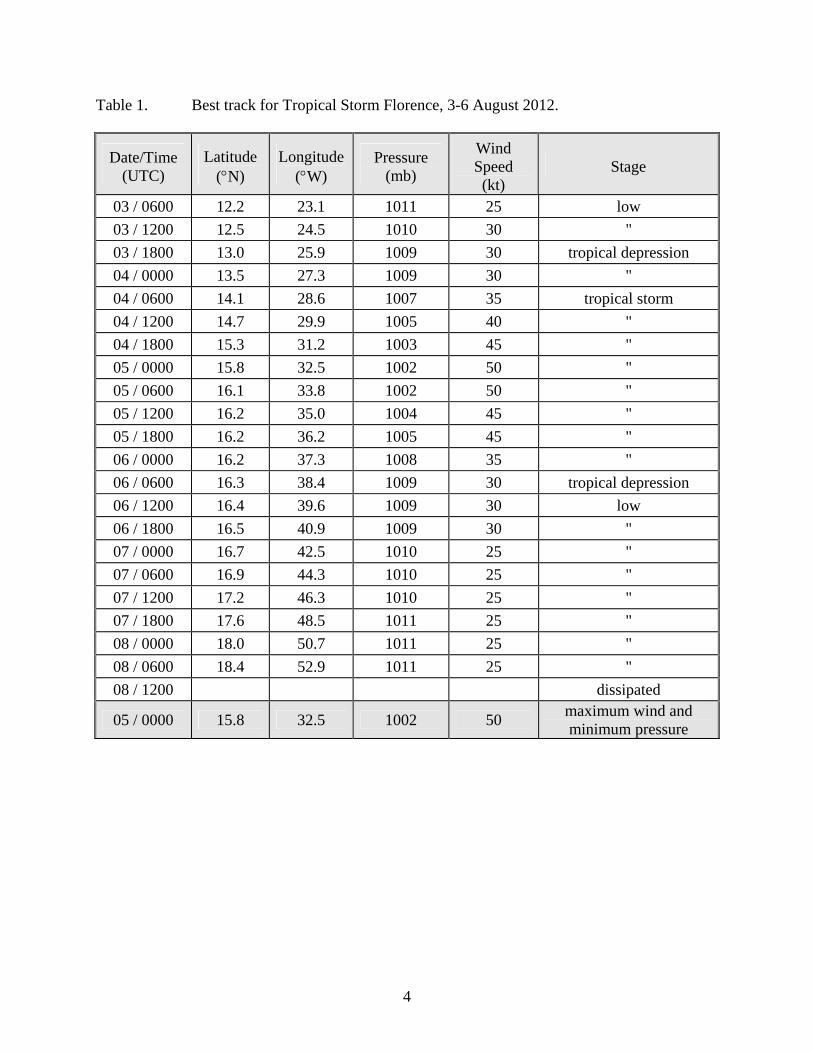
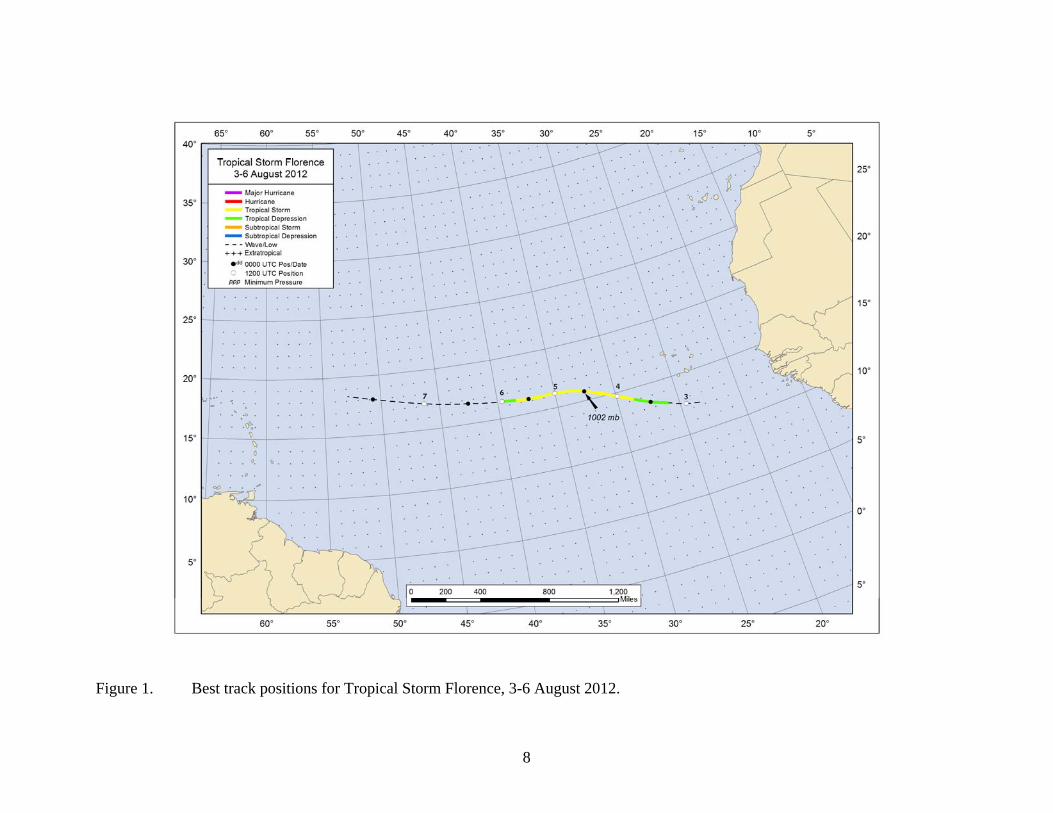
The tropical wave that developed into Tropical Storm Florence departed the west coast of Africa early on 2 August, with an area of disorganized showers and thunderstorms accompanying the wave. Geostationary satellite images and microwave data indicate that a well-defined low pressure system developed along the wave axis by 0600 UTC 3 August. Deep convection associated with the low became better organized later that day and a tropical depression formed around 1800 UTC centered about 130 n mi south-southwest of the southernmost Cape Verde Islands. The “best track” chart of the tropical cyclone’s path is given in Fig. 1, with the wind and pressure histories shown in Figs. 2 and 3, respectively. The best track positions and intensities are listed in Table 11.
Thunderstorm activity increased after formation and the depression became a tropical
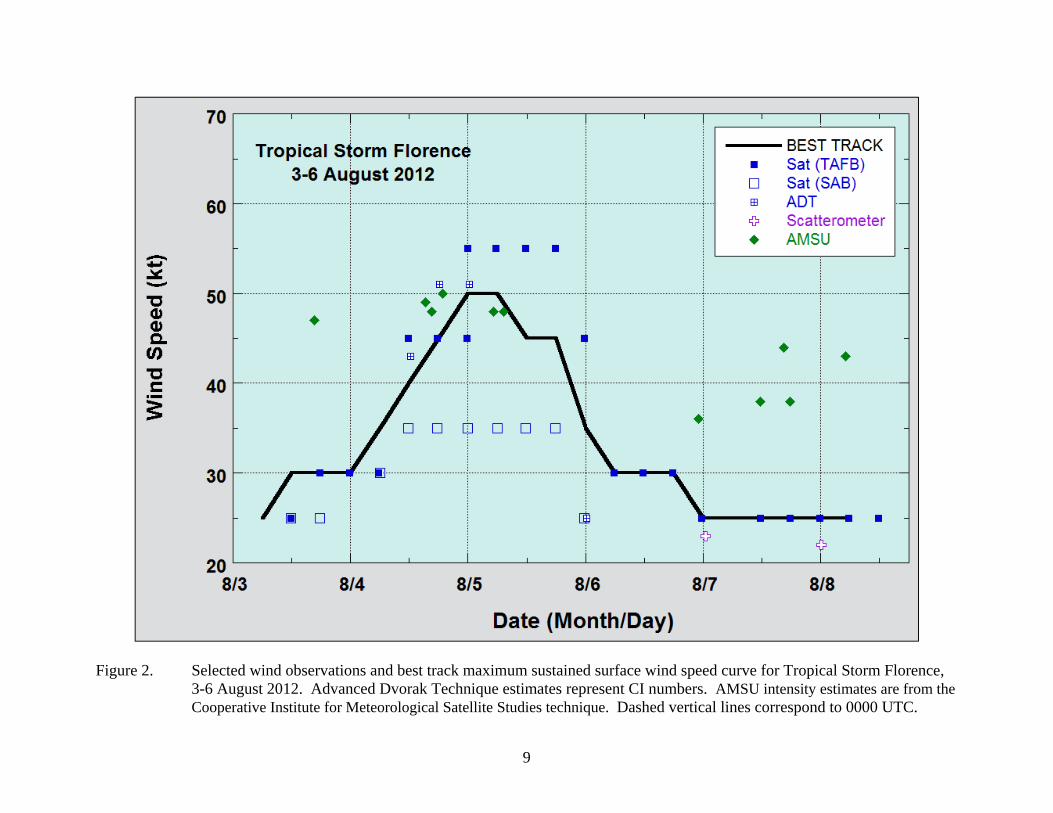
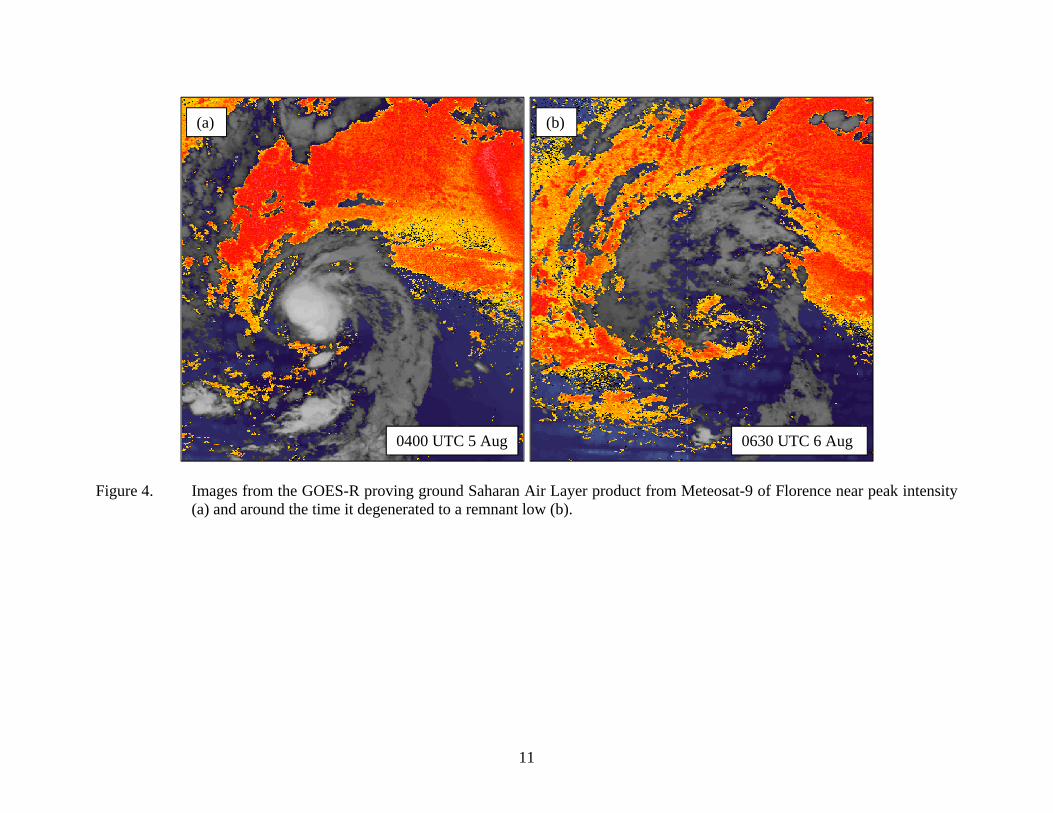
storm by 0600 UTC 4 August when it was located about 250 n mi west of the southernmost Cape Verde Islands. As Florence moved west-northwestward, it strengthened slowly over 26-27C waters and in an atmospheric environment characterized by moderate easterly shear. The storm reached its peak intensity of 50 kt around 0000 UTC 5 August, at which time the cloud pattern consisted of a central dense overcast and fragmented curved bands to the south of the center. After Florence reached its peak intensity, it turned westward when a low- to mid-level ridge built to the north of the cyclone. Deep convection began to decrease in intensity and coverage about 6 h after the peak intensity, and Florence weakened. Florence became a tropical depression by 0600 UTC 6 August and degenerated to a remnant low 6 h after that, when it was located about midway between the Cape Verde Islands and the Lesser Antilles. The main cause of the weakening appears to be the combined influences of easterly shear and dry stable air. Figure 4 shows a pair of images from the Saharan Air Layer product of the GOES-R proving ground from Meteosat-9. These images reveal that dry air associated with Saharan dust began wrapping into the circulation of Florence around the time of its peak intensity. The dry air became well embedded in the circulation about a day later.
1 A digital record of the complete best track, including wind radii, can be found on line at ftp://ftp.nhc.noaa.gov/atcf. Data for the current year’s storms are located in the btk directory, while previous years’ data are located in the archive directory.
2
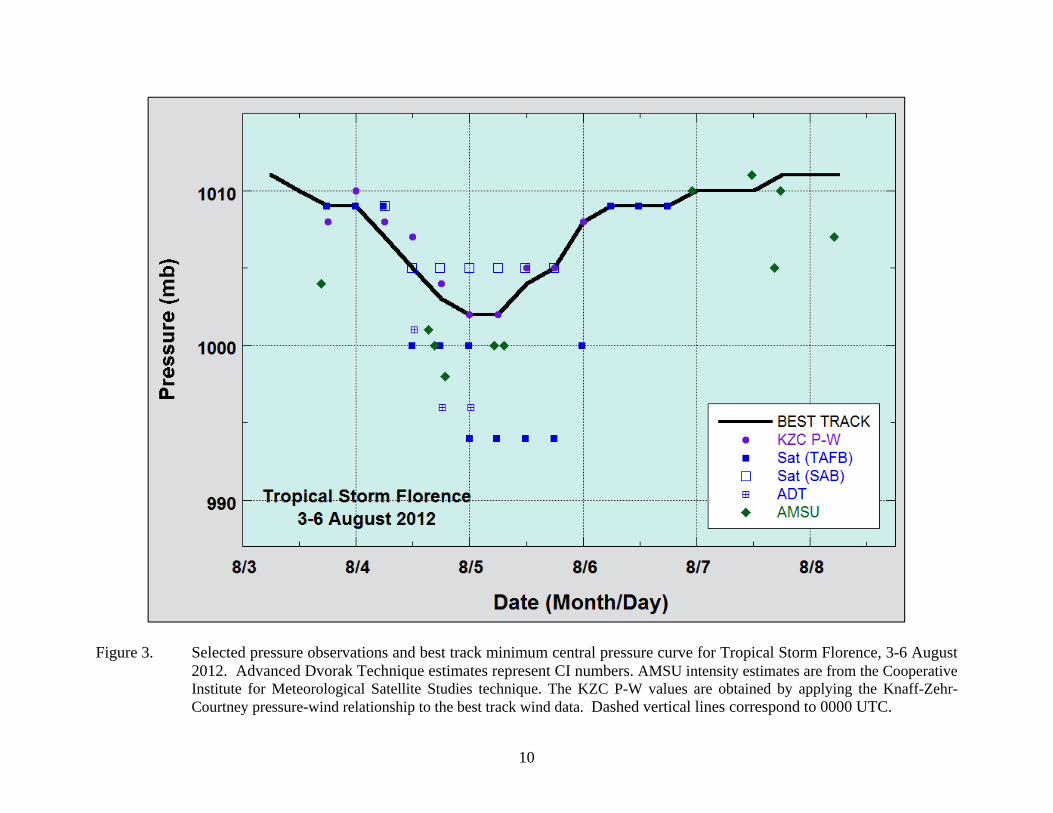
The remnant low continued westward at a faster forward speed occasionally producing small areas of deep convection. Satellite images and surface observations indicate that the remnant low opened into a trough about 400 n mi east of the northern Leeward Islands a little before 1200 UTC 8 August. The trough moved west-northwestward and became convectively active for a brief time when it interacted with an upper-level low to its west. The trough dissipated by 1200 UTC 10 August when it was located a few hundred nautical miles to the north of the Dominican Republic. b. Meteorological Statistics Observations in Florence (Figs. 2 and 3) include subjective satellite-based Dvorak technique intensity estimates from the Tropical Analysis and Forecast Branch (TAFB) and the Satellite Analysis Branch (SAB), and objective Advanced Dvorak Technique (ADT) estimates from the Cooperative Institute for Meteorological Satellite Studies/University of Wisconsin-Madison. Data and imagery from NOAA polar-orbiting satellites including the Advanced Microwave Sounding Unit (AMSU), the NASA Tropical Rainfall Measuring Mission (TRMM), the European Space Agency’s Advanced Scatterometer (ASCAT), and Defense Meteorological Satellite Program (DMSP) satellites, among others, were also useful in constructing the best track of Florence. The 50-kt peak intensity estimate of Florence at 0000 and 0600 UTC 5 August is based on a blend of Dvorak T-numbers of 3.5/55 kt from TAFB, 3.0/45 kt from SAB, and 3.3/51 kt from the UW-CIMSS ADT.
There were no ship reports of winds of tropical storm force associated with Florence. c. Casualty and Damage Statistics There were no reports of damage or casualties associated with Florence. d. Forecast and Warning Critique
The genesis of Florence was not well predicted. The tropical wave that developed into
Florence was introduced in the Tropical Weather Outlook with a low chance (< 30%) of development only 12 h before genesis. The probability was increased to the medium category (30-50%) 6 h later.
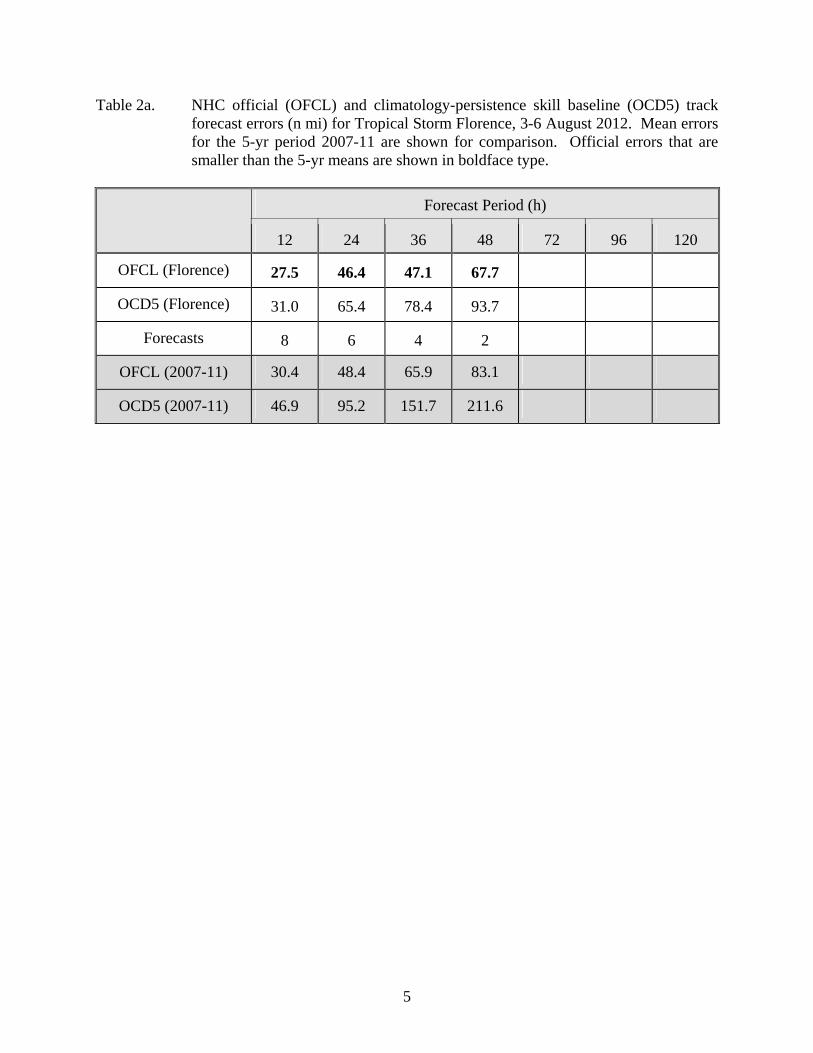
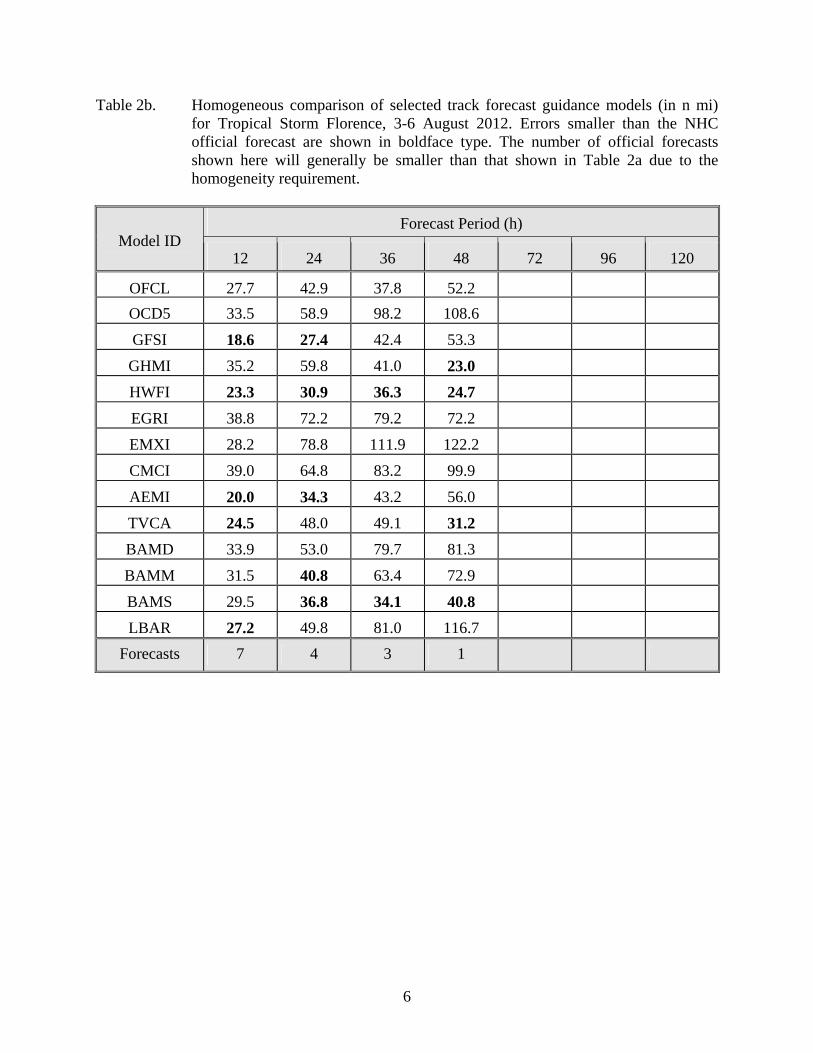
A verification of NHC official track forecasts for Florence is given in Table 2a. Official forecast track errors were lower than the mean official errors for the previous 5-yr period at all forecast times. The climatology and persistence model (OCD5) errors were also lower than their 5-yr mean, implying that Florence was an easier than average storm to forecast. A homogeneous comparison of the official track errors with selected guidance models is given in Table 2b. The best performing dynamical model was HWRF (HWFI), which was the only model that
3
consistently beat the official forecasts. The ECMWF (EMXI), which is typically one of the more reliable models, was a poor performer and had errors larger than OCD5. It should be noted, however, that the sample size is quite small.
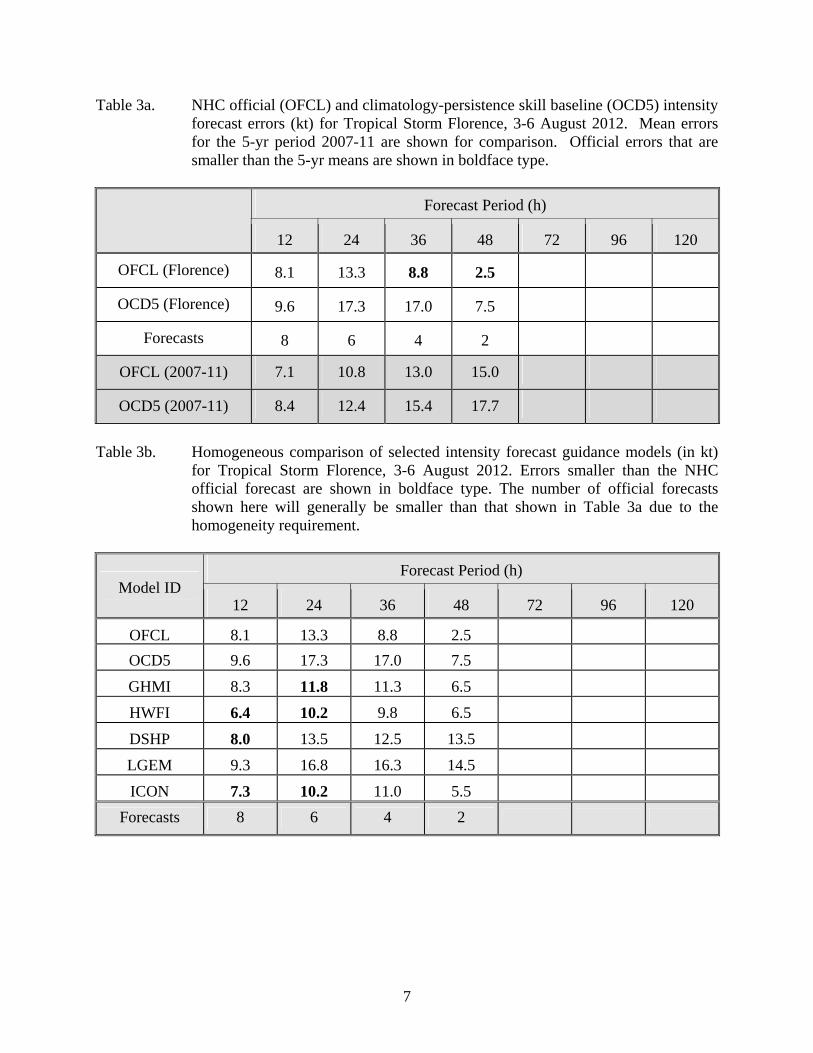
A verification of NHC official intensity forecasts for Florence is given in Table 3a.
Official forecast intensity errors were slightly higher than the mean official errors for the previous 5-yr period at 12 and 24 h, but were lower than the mean at the remaining forecast times. A homogeneous comparison of the official intensity errors with selected guidance models is given in Table 3b. The official forecasts had comparable errors to the guidance at 12 and 24 h and performed better than all of the models at 36 and 48 h.
There were no watches or warnings associated with Florence.
4
Table 1. Best track for Tropical Storm Florence, 3-6 August 2012.
Date/Time (UTC)
Latitude (N)
Longitude (W)
Pressure (mb)
Wind Speed (kt)
Stage
03 / 0600 12.2 23.1 1011 25 low
03 / 1200 12.5 24.5 1010 30 "
03 / 1800 13.0 25.9 1009 30 tropical depression
04 / 0000 13.5 27.3 1009 30 "
04 / 0600 14.1 28.6 1007 35 tropical storm
04 / 1200 14.7 29.9 1005 40 "
04 / 1800 15.3 31.2 1003 45 "
05 / 0000 15.8 32.5 1002 50 "
05 / 0600 16.1 33.8 1002 50 "
05 / 1200 16.2 35.0 1004 45 "
05 / 1800 16.2 36.2 1005 45 "
06 / 0000 16.2 37.3 1008 35 "
06 / 0600 16.3 38.4 1009 30 tropical depression
06 / 1200 16.4 39.6 1009 30 low
06 / 1800 16.5 40.9 1009 30 "
07 / 0000 16.7 42.5 1010 25 "
07 / 0600 16.9 44.3 1010 25 "
07 / 1200 17.2 46.3 1010 25 "
07 / 1800 17.6 48.5 1011 25 "
08 / 0000 18.0 50.7 1011 25 "
08 / 0600 18.4 52.9 1011 25 "
08 / 1200 dissipated
05 / 0000 15.8 32.5 1002 50 maximum wind and minimum pressure
5
Table 2a. NHC official (OFCL) and climatology-persistence skill baseline (OCD5) track forecast errors (n mi) for Tropical Storm Florence, 3-6 August 2012. Mean errors for the 5-yr period 2007-11 are shown for comparison. Official errors that are smaller than the 5-yr means are shown in boldface type.
Forecast Period (h)
12 24 36 48 72 96 120
OFCL (Florence) 27.5 46.4 47.1 67.7
OCD5 (Florence) 31.0 65.4 78.4 93.7
Forecasts 8 6 4 2
OFCL (2007-11) 30.4 48.4 65.9 83.1
OCD5 (2007-11) 46.9 95.2 151.7 211.6
6
Table 2b. Homogeneous comparison of selected track forecast guidance models (in n mi) for Tropical Storm Florence, 3-6 August 2012. Errors smaller than the NHC official forecast are shown in boldface type. The number of official forecasts shown here will generally be smaller than that shown in Table 2a due to the homogeneity requirement.
Model ID Forecast Period (h)
12 24 36 48 72 96 120
OFCL 27.7 42.9 37.8 52.2
OCD5 33.5 58.9 98.2 108.6
GFSI 18.6 27.4 42.4 53.3
GHMI 35.2 59.8 41.0 23.0
HWFI 23.3 30.9 36.3 24.7
EGRI 38.8 72.2 79.2 72.2
EMXI 28.2 78.8 111.9 122.2
CMCI 39.0 64.8 83.2 99.9
AEMI 20.0 34.3 43.2 56.0
TVCA 24.5 48.0 49.1 31.2
BAMD 33.9 53.0 79.7 81.3
BAMM 31.5 40.8 63.4 72.9
BAMS 29.5 36.8 34.1 40.8
LBAR 27.2 49.8 81.0 116.7
Forecasts 7 4 3 1
7
Table 3a. NHC official (OFCL) and climatology-persistence skill baseline (OCD5) intensity forecast errors (kt) for Tropical Storm Florence, 3-6 August 2012. Mean errors for the 5-yr period 2007-11 are shown for comparison. Official errors that are smaller than the 5-yr means are shown in boldface type.
Forecast Period (h)
12 24 36 48 72 96 120
OFCL (Florence) 8.1 13.3 8.8 2.5
OCD5 (Florence) 9.6 17.3 17.0 7.5
Forecasts 8 6 4 2
OFCL (2007-11) 7.1 10.8 13.0 15.0
OCD5 (2007-11) 8.4 12.4 15.4 17.7
Table 3b. Homogeneous comparison of selected intensity forecast guidance models (in kt)
for Tropical Storm Florence, 3-6 August 2012. Errors smaller than the NHC official forecast are shown in boldface type. The number of official forecasts shown here will generally be smaller than that shown in Table 3a due to the homogeneity requirement.
Model ID Forecast Period (h)
12 24 36 48 72 96 120
OFCL 8.1 13.3 8.8 2.5
OCD5 9.6 17.3 17.0 7.5
GHMI 8.3 11.8 11.3 6.5
HWFI 6.4 10.2 9.8 6.5
DSHP 8.0 13.5 12.5 13.5
LGEM 9.3 16.8 16.3 14.5
ICON 7.3 10.2 11.0 5.5
Forecasts 8 6 4 2
8
Figure 1. Best track positions for Tropical Storm Florence, 3-6 August 2012.
9
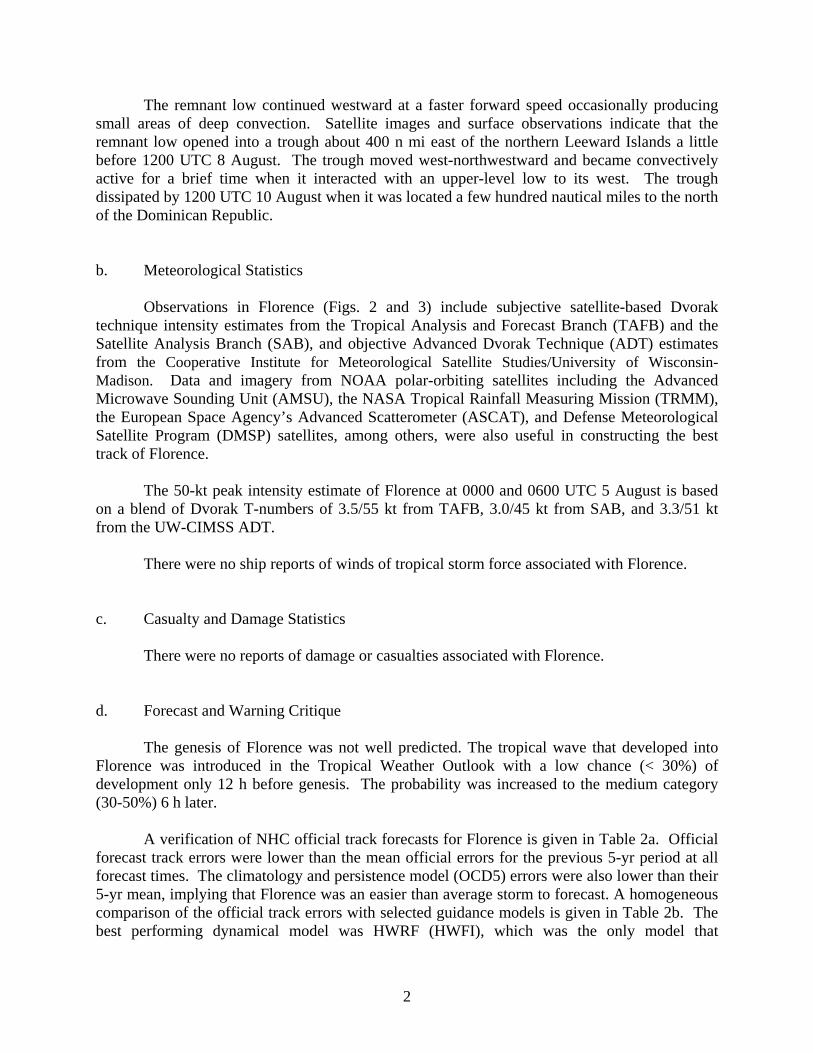
Figure 2. Selected wind observations and best track maximum sustained surface wind speed curve for Tropical Storm Florence,
3-6 August 2012. Advanced Dvorak Technique estimates represent CI numbers. AMSU intensity estimates are from the Cooperative Institute for Meteorological Satellite Studies technique. Dashed vertical lines correspond to 0000 UTC.
10
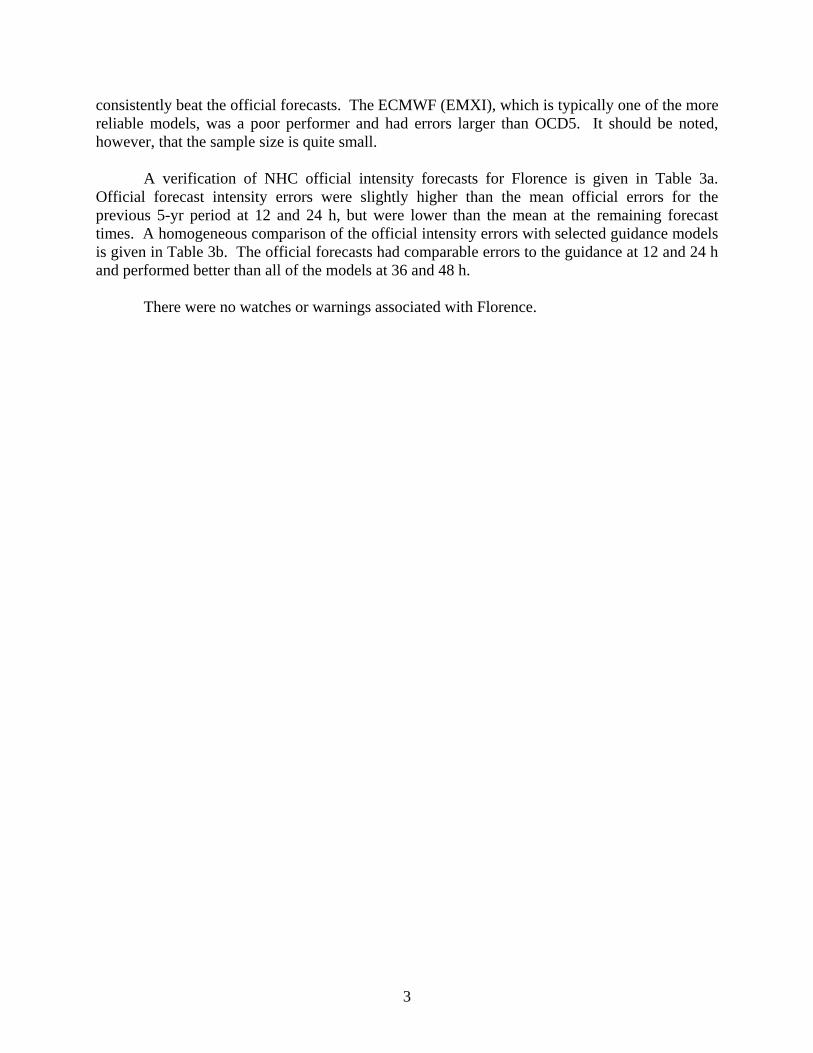
Figure 3. Selected pressure observations and best track minimum central pressure curve for Tropical Storm Florence, 3-6 August
2012. Advanced Dvorak Technique estimates represent CI numbers. AMSU intensity estimates are from the Cooperative Institute for Meteorological Satellite Studies technique. The KZC P-W values are obtained by applying the Knaff-Zehr-Courtney pressure-wind relationship to the best track wind data. Dashed vertical lines correspond to 0000 UTC.
11
Figure 4. Images from the GOES-R proving ground Saharan Air Layer product from Meteosat-9 of Florence near peak intensity
(a) and around the time it degenerated to a remnant low (b).
(a) (b)
0400 UTC 5 Aug 0630 UTC 6 Aug
Top Related