


Languages
Pages
Legal


1
Training and Occupational Choice of HighlySkilled Immigrants¤
Incomplete draft. Work in progress.
Sarit Cohen and Zvi Eckstein,y
March 7, 2000
¤WE thank Mike Keane, Yoram Weiss and Ken Wolpin for dicussions related to this paper. Osnat Lifshitzprovided excellent reasearch assistance. We are also grateful for …nancial support from NIH grant 1 R01HD34716-01.
yTel Aviv University ([email protected]), Tel Aviv University and Boston University ([email protected]).

2
1 Introduction
The transition pattern of post schooling individuals, displaced workers and immigrants to
the labor market has similar characteristics. Unemployment falls quickly as workers …rst …nd
blue-collar jobs, followed by a gradual movement to white-collar occupations. For immigrants
the transition includes the learning of the new country language as well as the skills demanded
by the new labor market. This paper focuses on male immigrants who moved from the former
Soviet Union to Israel and are characterized by their high levels of skills, education and
age. [see table 1]. We study the impact of participation in training programs, job search,
occupational choice and language acquisition of immigrants on their integration to the new
labor market. In particular, we formulate a dynamic choice model for employment in blue and
white collar occupations and training, where the labor market randomly o¤ered opportunities
are a¤ected by the immigrant past choices.1 The model provides a labor supply pattern that is
consistent with the observed choices and enables us to estimate the rate of return for training.
Government sponsored training programs are commonly viewed as the best method for
subsidizing human capital investment for displaced workers and immigrants. The vast litera-
ture on the return to government sponsored training program has been heavily occupied by
the sample selection problem and the result that the estimated return for training treatment is
not signi…cantly di¤erent from zero.2 While that literature is mainly based on data regarding
low skills disadvantaged workers, this paper considers a sample of highly skilled immigrants
who unexpectedly moved to a completely di¤erent labor market. Standard regression anal-
ysis, using our data, indicates a large but insigni…cant estimates for the rate of return to
training.3 In order to further investigate the role of training in the labor market transition of
workers, we formulate a model that jointly considers alternative motives for the participation
in training programs. In particular, the participation in training, which we separate by the
broadly de…ned blue and white-collar occupations, a¤ects the wage o¤ers and the job o¤ers
1White collar cccupations include engineers, physicians, professors, other professionals with an academicdegree, managers, teachers, technicians, nurses, artists and other professionals; blue collar occupation includeunskilled workers.
2See the recent survey by Heckman, LaLond and Smith (1999).3This is the common result in the literature (see a survey by Lalonde(1995)).

3
probabilities di¤erently in each occupation. Furthermore, the individual may have direct util-
ity from participating in training and we allow for each of these elements to be di¤erent for
two unobserved types of individuals (Heckman and Singer (1984)).
We follow a sample of about 400 men immigrants, who arrived to Israel between 1989-
1992, for at most their …rst 20 quarters (…ve years) in Israel. Most of them studied Hebrew
extensively during their …rst two quarters in Israel and then searched for work. Depending on
availability, they could attend one government sponsored training program that is supposed
to adjust or transform their imported skills. The participation in training started at the third
quarter, picked at the forth and ended after 3 years in Israel. Only about 30 percent attained
any training. Most immigrants left unemployment to blue collar occupations, although about
70 percent of them were working in white-collar jobs before the former USSR. After more than
three years the unemployment rate, which was initially about 28%, was stabilized at about
10% (above national average) and the transition to white-collar jobs continued throughout
the …fth year after migration. The mean wage per hour growth rate is about 9% annually,
which is 2.6% higher than the rate we …nd in a larger sample given by the income survey of
the CBS (See Eckstein and Weiss (1998)).
The point estimates
The rest of the introduction goes by the description of the results.
2. …t of the pattern.
3. policy and counterfactual experiments
4. comparison to the literature on training and the immigrants wage convergence.
2 Labor Supply Description: Data
DataThe data for this study is based on a survey conducted by the JDC - Brookdale Institute
of Gerontology and Human Development. The …rst survey was conducted during the summer
of 1992 on a random sample of 1,200 immigrants from the former USSR who entered Israel
between October 1989 and January 1992. The second survey was done in 1995 and only 901

4
of these immigrants were re-sampled. The original sample consists of immigrants in working-
ages (25-65) residing in 31 di¤erent locations in Israel at the time of the …rst survey. These
immigrants reported their residence, occupation, schooling and some other demographic char-
acteristics in the former USSR. Both surveys contain a complete history of jobs held from the
date of arrival to Israel until the interview. They also provide information on wages in each
job and detailed information on the participation in government sponsored training programs.
Furthermore, the data contains a detailed information on their knowledge of Hebrew at ar-
rival, the participation in the Hebrew learning classes (ULPAN in Hebrew) and the Hebrew
knowledge at the date of the surveys.
Our study is restricted to 419 male immigrants that at their arrival to Israel were 23 to
58 years old. Non of the individuals returned to be full time students and they were actively
looking for a job in Israel. The survey labor market history is based on a monthly report
which we converted to quarterly (three months) data set. For 316 of the immigrants we have
data from both surveys.
Skills at ArrivalTable 1 provides the descriptive information on the characteristics of the sample at their
arrival to Israel. The average schooling level is 14.6 years and it is high relatively to the Israeli
males (12.5 years of schooling). We divide jobs to two broad occupations, white and blue
collar. White collar jobs are related to work that require more than 12 years of schooling such
as managers, teachers, nurses, engineers, artist and other high skilled professionals and about.
The blue collar occupations consists of all other jobs which require mainly basic knowledge
of reading and writing. 68% of the males worked in the former USSR in jobs related to the
white collar occupation, while after four years in Israel only about 30% of the working males
have white collar jobs.
The knowledge of language is measured by four questions on the ability to understand, to
speak, to read and to write the language. The immigrants were asked these questions both
on Hebrew and English. We use an index that gives equal weights for all questions and has
a lowest value of one for those that have no knowledge and the number four for being ‡uent
in using the language. In table 1 we report the mean value of the English knowledge that is
collected at the …rst survey. We assume that this level of English is the same as the knowledge
the immigrants had as they arrived in Israel.
5
Table 1. Summary Statistics at Arrival
Obs. Percent Mean SD
Schooling 419 – 14.58 2.74
Age at arrival 419 – 38.05 9.15
White collar USSR 284 67.78 – –
Blue collar USSR 127 30.31 – –
Did not work in USSR 8 1.91
Married 363 86.63 – –
English 419 – 1.76 0.94
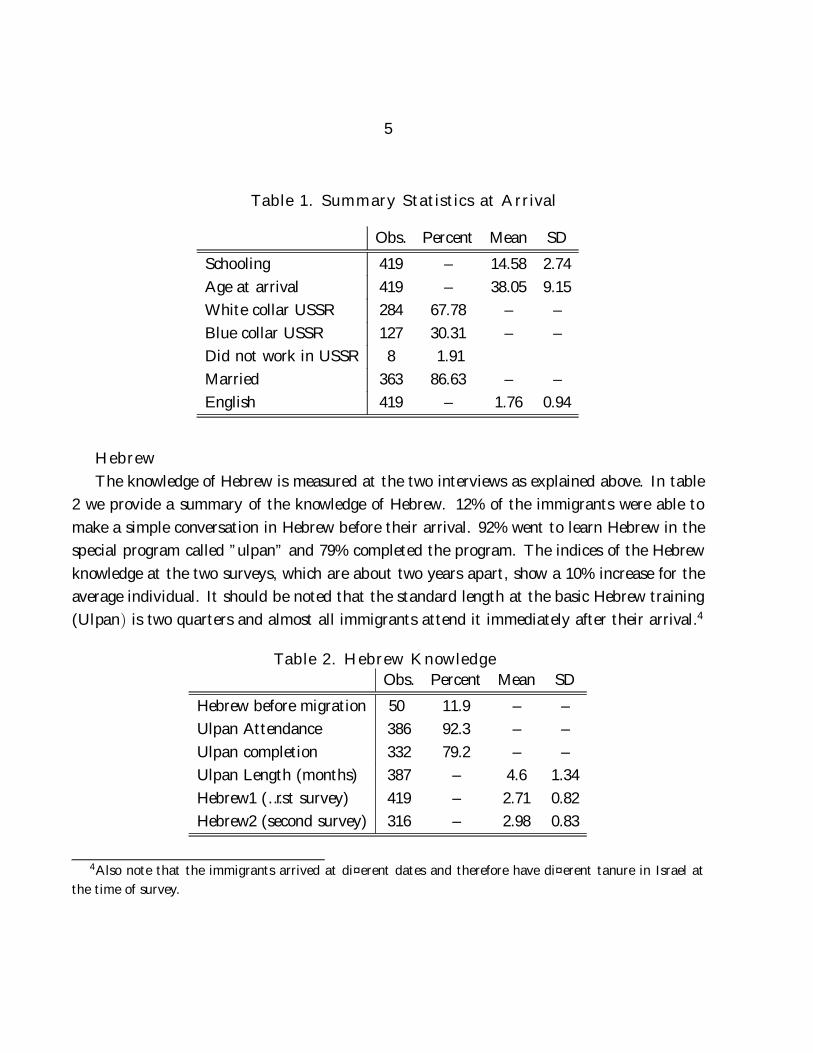
HebrewThe knowledge of Hebrew is measured at the two interviews as explained above. In table
2 we provide a summary of the knowledge of Hebrew. 12% of the immigrants were able to
make a simple conversation in Hebrew before their arrival. 92% went to learn Hebrew in the
special program called ”ulpan” and 79% completed the program. The indices of the Hebrew
knowledge at the two surveys, which are about two years apart, show a 10% increase for the
average individual. It should be noted that the standard length at the basic Hebrew training
(Ulpan) is two quarters and almost all immigrants attend it immediately after their arrival.4
Table 2. Hebrew KnowledgeObs. Percent Mean SD
Hebrew before migration 50 11.9 – –
Ulpan Attendance 386 92.3 – –
Ulpan completion 332 79.2 – –
Ulpan Length (months) 387 – 4.6 1.34
Hebrew1 (…rst survey) 419 – 2.71 0.82
Hebrew2 (second survey) 316 – 2.98 0.83
4Also note that the immigrants arrived at di¤erent dates and therefore have di¤erent tanure in Israel atthe time of survey.

6
In Table 3 we present results from the pooled regression where the dependent variable is
the index of Hebrew knowledge at the time of the …rst and second survey (thus the number of
observations is 419+316=735). As seen in the table, time since arrival is a signi…cant indicator
of Hebrew knowledge. Using the regression in table 3 we form a predicted Hebrew index for
each individual in the sample based on the regression. The main impact on the predicted
index are the time in Israel plus the individual residual (which we assume to be invariant over
time).
Table 3: Hebrew regressionVariable Estimate
bcons 1:69540:1690
bUlpan_length 0:09150:0145
bHebrew before migration 0:65740:0886
btime in Israel 0:07140:0307
btime in Israel_square ¡0:00140:0013
Num. of Obs. 735
R2 0.1680
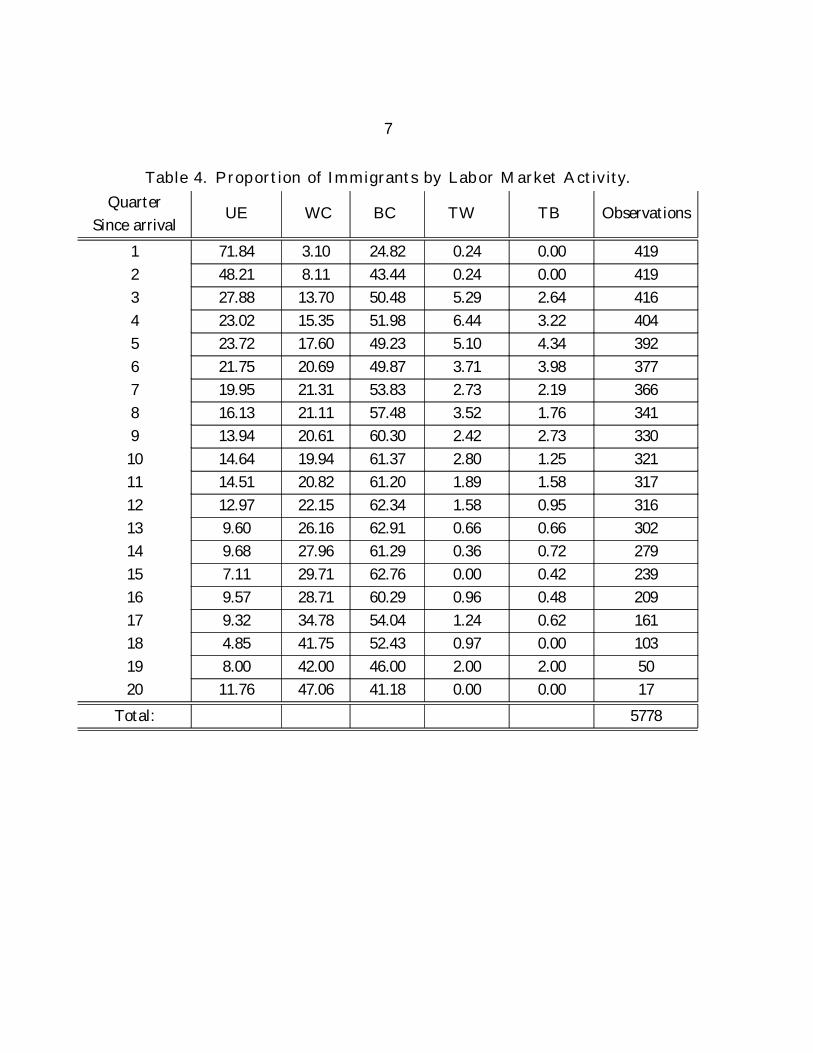
Labor Market ChoicesWe organized the data such that the labor market state in the data …t the state in the
model. At each quarter the immigrant could be in one out of …ve labor market states: unem-
ployed (UE), working in a white collar job (WC), working in a blue collar job (BC), attending
a training course in a white collar occupation (TW) or attending a training course in a blue
collar occupation (TB). Training in white collar jobs include courses in using computers, ad-
justing knowledge of engineers in a certain area and technicians in certain …elds. Training in
blue collar jobs include courses in sales, cosmetics, diamond cutters, electricians, travel agents,
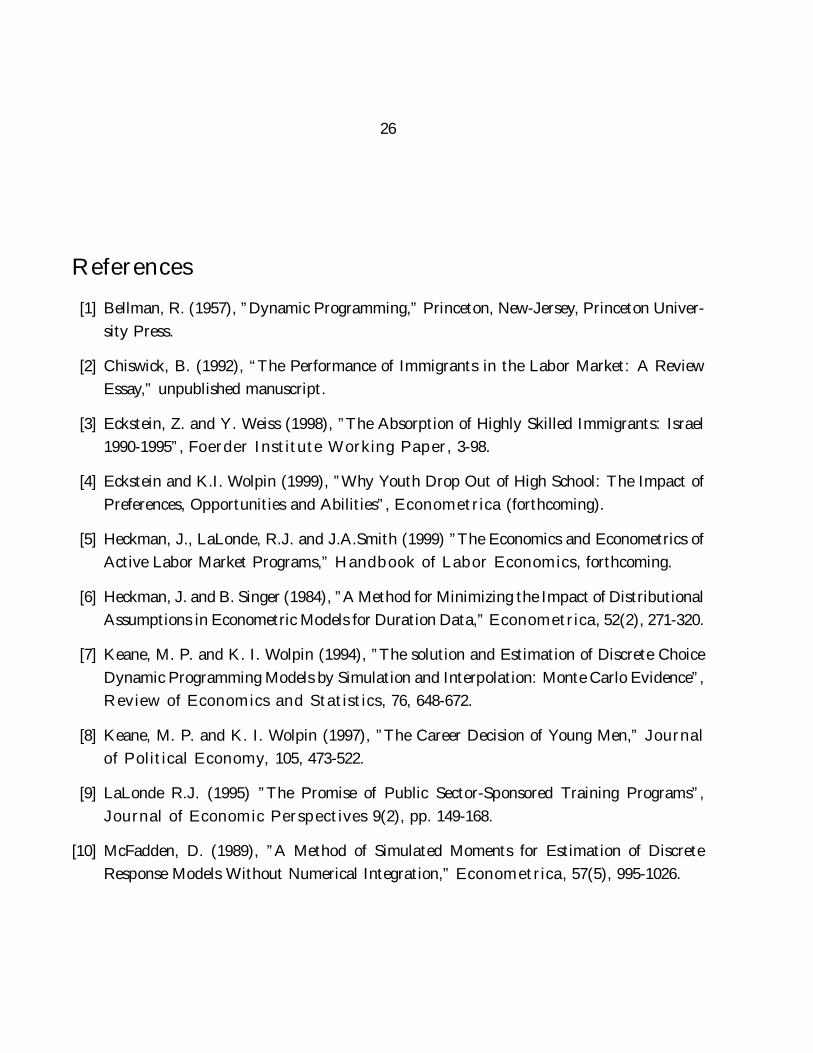
etc.. Table 4 presents the actual proportion of individuals in each state at each quarter since
the date of arrival to Israel for at most …ve years (20 quarters).Figures 1a and 1b describe the
actual proportions.
7
Table 4. Proportion of Immigrants by Labor Market Activity.
Quarter
Since arrivalUE WC BC TW TB Observations
1 71.84 3.10 24.82 0.24 0.00 419
2 48.21 8.11 43.44 0.24 0.00 419
3 27.88 13.70 50.48 5.29 2.64 416
4 23.02 15.35 51.98 6.44 3.22 404
5 23.72 17.60 49.23 5.10 4.34 392
6 21.75 20.69 49.87 3.71 3.98 377
7 19.95 21.31 53.83 2.73 2.19 366
8 16.13 21.11 57.48 3.52 1.76 341
9 13.94 20.61 60.30 2.42 2.73 330
10 14.64 19.94 61.37 2.80 1.25 321
11 14.51 20.82 61.20 1.89 1.58 317
12 12.97 22.15 62.34 1.58 0.95 316
13 9.60 26.16 62.91 0.66 0.66 302
14 9.68 27.96 61.29 0.36 0.72 279
15 7.11 29.71 62.76 0.00 0.42 239
16 9.57 28.71 60.29 0.96 0.48 209
17 9.32 34.78 54.04 1.24 0.62 161
18 4.85 41.75 52.43 0.97 0.00 103
19 8.00 42.00 46.00 2.00 2.00 50
20 11.76 47.06 41.18 0.00 0.00 17
Total: 5778

8
The unemployment rate reaches 23% after a year and stabilize at about 10% after 13
quarters ( more than 3 years) in Israel. A substantial number of immigrants join the labor
force and work in blue collar jobs during the …rst two years in Israel. The proportion of these
individuals reach more than 60 percent after two and a half years in Israel and stay at this
level for almost additional two years. However, we observe that during the …fth year in Israel
the proportion of working in blue collar jobs is reduced by almost 20% and the proportion
of white collar jobs increases in almost the same proportion. Hence, the movement between
occupations is long process. This pattern of slow dynamic transition is similar to what is
believed to be typical of immigrants behavior (Chiswick, (1992), Eckstein and Weiss (1998)).
Moreover, it is similar to the transition to work of high school graduates as described by Keane
and Wolpin (1997).
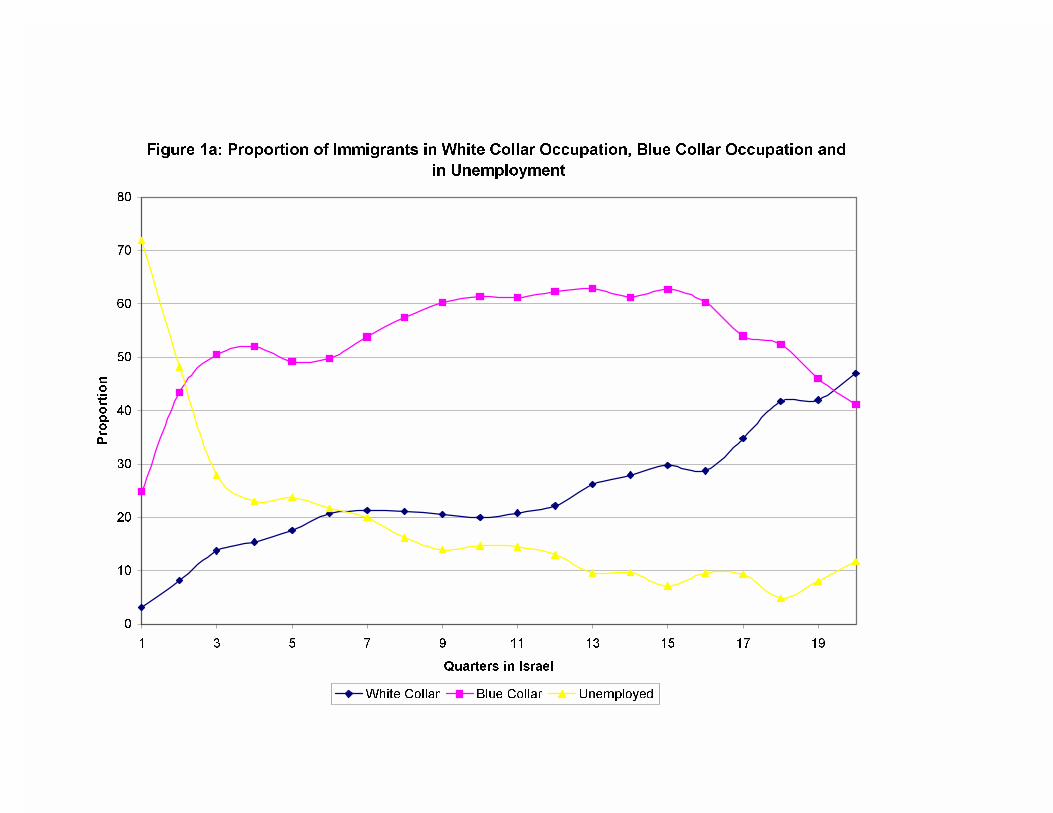
What might seem as a substantial reduction in job quality after 4 years in the new country,
gets a signi…cant change after four years in the new country.5 What could make it to happen?
Note that the participation in training programs peak between the fourth to the sixth quarter
after arrival and then the proportion goes down to almost no participation after more than
three and a half years in Israel (see …g.1b). What is the role of training in a¤ecting the increase
in working in white collar jobs? Alternatively, it is possible that the availability of jobs or
the accumulated experience and knowledge of the local labor market that cause the late move
to white collar jobs. The early peak in training is consistent with the human capital theory
which shows clearly that if you wish to study, then it is better to do it as soon as possible.
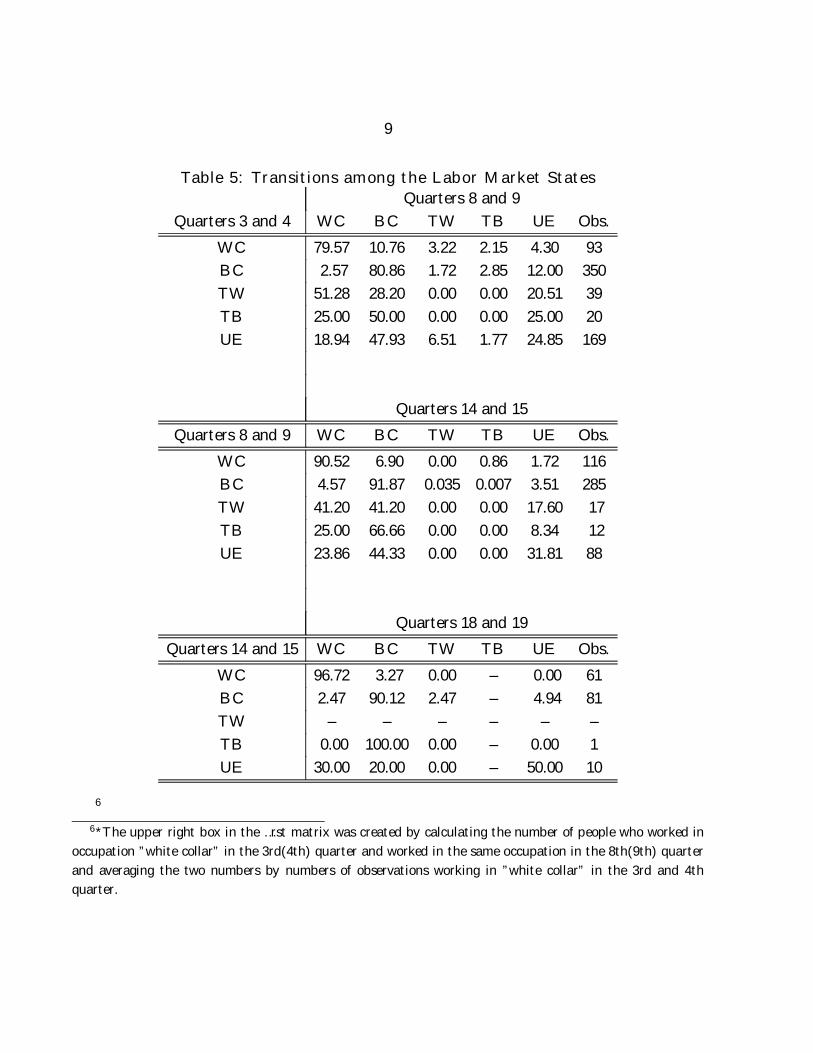
The transitions between the …ve labor market states are summarized in table 5.
5It should be noted that the number of observations at the …fth year is low.
9
Table 5: Transitions among the Labor Market StatesQuarters 8 and 9
Quarters 3 and 4 WC BC TW TB UE Obs.
WC 79.57 10.76 3.22 2.15 4.30 93
BC 2.57 80.86 1.72 2.85 12.00 350
TW 51.28 28.20 0.00 0.00 20.51 39
TB 25.00 50.00 0.00 0.00 25.00 20
UE 18.94 47.93 6.51 1.77 24.85 169
Quarters 14 and 15
Quarters 8 and 9 WC BC TW TB UE Obs.
WC 90.52 6.90 0.00 0.86 1.72 116
BC 4.57 91.87 0.035 0.007 3.51 285
TW 41.20 41.20 0.00 0.00 17.60 17
TB 25.00 66.66 0.00 0.00 8.34 12
UE 23.86 44.33 0.00 0.00 31.81 88
Quarters 18 and 19
Quarters 14 and 15 WC BC TW TB UE Obs.
WC 96.72 3.27 0.00 – 0.00 61
BC 2.47 90.12 2.47 – 4.94 81
TW – – – – – –
TB 0.00 100.00 0.00 – 0.00 1
UE 30.00 20.00 0.00 – 50.00 10
6
6*The upper right box in the …rst matrix was created by calculating the number of people who worked inoccupation ”white collar” in the 3rd(4th) quarter and worked in the same occupation in the 8th(9th) quarterand averaging the two numbers by numbers of observations working in ”white collar” in the 3rd and 4thquarter.

10
The main observation is that there is high persistence in occupational distribution. The
rate of remaining in white collar occupations (blue collar occupations) starts at 80% (81%),
increases to 91% (92%) and further increases to 97% (drops to 90%). This increase persistence
in white collar occupation account for much of the later increase in the proportion of workers
at this occupation. The transition from white collar jobs to blue collar jobs is decreasing
substantially over time. The rate of transition from work to unemployment, after more than
two and a half years in Israel, is about 5%, which is substantially lower than the transition to
unemployment from any other state. A job in white collar occupation shows more stability
than a blue collar job. The transitions from blue collar to white collar jobs starts at a low
rate, then increases to 4.6% and then goes down back to about 2.5%. These transitions
probabilities show that for an immigrant, who does not …nd a white collar job, we observe
frequent transitions between di¤erent labor market locations.
TrainingA key aspect of this paper is the role of training in the life time career decision of the high
skilled immigrants. The length of the training programs is distributed between one to three
quarters where training in blue collar jobs are shorter (see table 6). We view the value of the
program to be of the same, independently of the length. We assume that the actual length is
a function of an institutional setting that is exogenously determined.
Table 6. Distribution of Length in Trainingin Quarters.
Num:
of Quarers
Training in
White Collar
Training in
Blue CollarObservations
1 16:9 14:5 39
2 27:4 15:3 53
3 14:6 11:3 32
Total 58:9 41:6 124
Table 7 shows that 37% of immigrants who were working before migration in white collar
jobs and participated in training, took training in blue collar jobs. This observation indicates
the none trivial way the immigrants perceived their labor market opportunities in Israel. 84%

11
of the immigrants who went to training had worked in white collar jobs in the former USSR.
Hence, immigrants who arrived with more skills have a higher tendency to go to training. Yet,
a signi…cant number of immigrants are willing to downgrade their occupation. But, as can be
seen in table 8, it does not mean that they will necessarily end up working in blue collar jobs.
Table 7. Transition Matrix from Occupationin Former USSR to Training in Israel.
Occupation
in Former USSR
Training in
White Collar
Training in
Blue CollarProportions Observations
White Collar 54.03 30.65 84.68 105
Blue Collar 4.84 10.48 15.32 19
Proportions 58.87 41.13 100.00 –
Observations 73 51 – 124
Table 8 shows that the …rst job after training is not in the same occupation as the occu-
pation of the training program. There is more downgrading than upgrading. However, we can
not learn from that on the long term impact of training on the transition to the occupation
related to that training.
Table 8. First Job After Training in IsraelAccording to the Sector of Training.
First Job
After Training
Training in
White Collar
Training in
Blue CollarProportions Observations
White Collar 34.26 9.26 43.52 47
Blue Collar 25.93 30.56 56.48 61
Proportions 60.19 39.81 100.00 –
Observations 65 43 – 108
*16 immigrants haven’t found a job after training (out of 124 who have participated in
training)

12
A pooled multinomial logit regression for the immigrants’ choices in di¤erent periods is
presented in Table 9. The dependent variable indicates whether the immigrant was working
in WC, BC or was unemployed in time t. Note that each immigrant appears in this regression
several times and there is no individual …xed e¤ect.
The knowledge of Hebrew and English, age at arrival and working in white collar occu-
pation in the USSR increase the probability of both working in white collar job and being
unemployed relative to working in blue collar jobs. Education (years of schooling) has no
signi…cant e¤ect on these probabilities. The variable training in WC (BC) occupation is a
dummy variable that equals 1 if the immigrant has graduated in TW (TB) before time t
and equals zero otherwise. Training in white collar occupations increases the probability of
working in white collar job and being unemployed. While training in blue collar only af-
fects positively the probability of being unemployed. Work experience in Israel reduces the
probability of being unemployed. It is interesting to note that all variables that are related
to the level of human capital increase the probability of working in white collar jobs as well
as being unemployed. This observation indicates that the skilled immigrants invest more in
search assuming that search while unemployed is more intensive. However, this aspect will be
investigated by the structural model.

13
Table 9: Multinomial-logit on employment and unemployment
VariableWhite collarOccupation
Unemployed
bcons ¡4:4424(0:5034)
¡0:4753(0:4804)
bHebrew 0:9612(0:0761)
0:1342(0:0701)
benglish 0:6563(0:0428)
0:1529(0:0497)
bage at arrival 0:0135(0:0055)
0:0205(0:0052)
byears of schooling 0:0331(0:0212)
0:0332(0:0190)
btraining in WC 0:9421(0:1153)
0:8183(0:1658)
btraining in BC ¡0:2101(0:1594)
0:9586(0:1815)
baccumulated experience ¡0:0046(0:0100)
¡0:6807(0:0233)
boccupation in USSR 1:4837(0:1417)
0:2156(0:1137)
Num. of Obs. 5536
Log likelihood -3558.40
* the comparison group is employment in blue collar
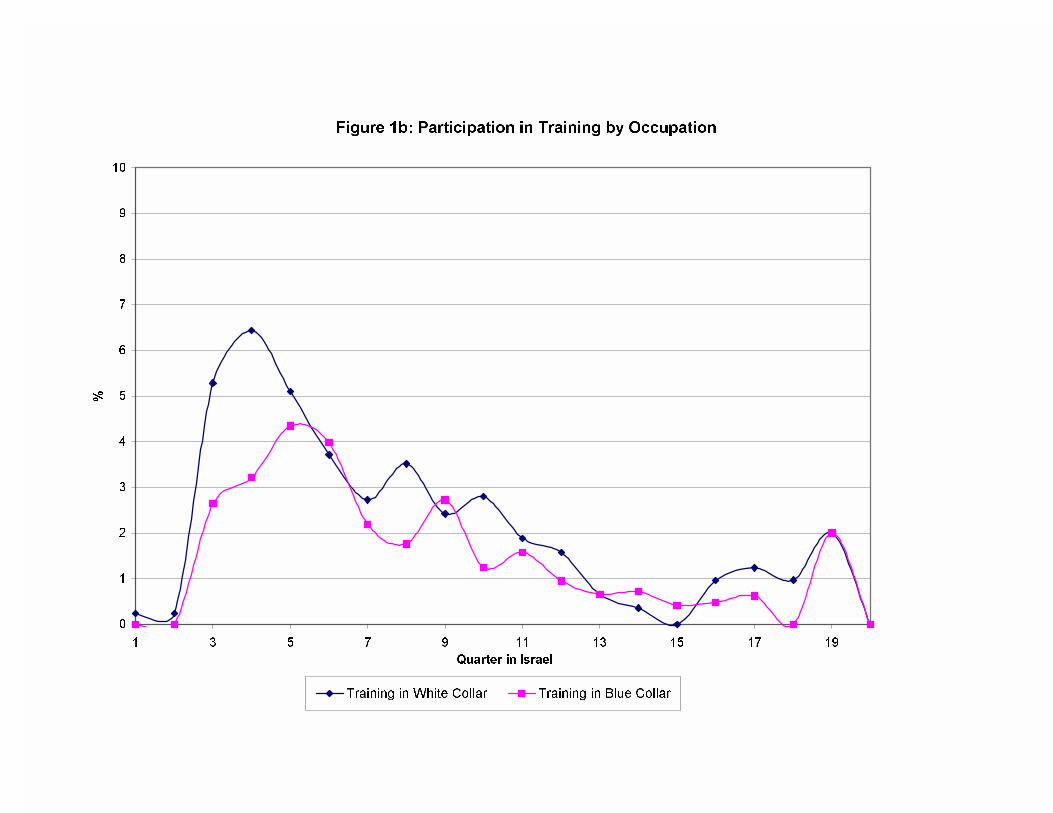
WagesFigure 2 displays the average wage in each quarter for both occupations. The wages in
white collar jobs are more volatile than those in blue collar jobs, and it is clear that the wage
is increasing in both occupations. The mean wage in both occupation is about 11 IS per hour
during the …rst 4 quarters in Israel and it is 17 IS per hour during the 5’th year in Israel.
The quarterly wage growth estimated by a simple regression of the means on time is 2.2-3%
per quarter. This growth rate is about 9% annually, which is 2.6% higher than the rate
we …nd in a larger sample given by the income survey of the CBS (See Eckstein and Weiss
(1998)). A simple pooled log wage regression is given in Table 10. Clearly we do not correct
for all the selections biases implied by the choices made by the individual. Training enters as
dummy only for wages reported after the graduation of the course. It is interesting to note
that this regression shows that training has no impact on wages. This result is consistent with

14
the …nding in the literature (see, e.g., Heckman et.al.). An additional year of experience in
Israel has a one percent wage return which is much lower than the coe¢cient on experience for
native Israelis (see Eckstein and Weiss (1998)). The rates of return on Hebrew and English are
substantial. The highest level of the Hebrew index is four which implies a return of 6% above
that of an average Hebrew knowledge, which is the level of 2.8. The premium for working
in white collar jobs rather than blue collar jobs, is 30% , but the return to education and
experience (age) at arrival to Israel, is zero.
Table 10: Ln Wage Regression
Variableln hourly wage
dummy occupation
ln hourly wage in
white collar
occupation
ln hourly wage in
blue collar
occupation
bcons 2:0029(0:1215)
1:0475(0:4261)
2:1663(0:1237)
bHebrew 0:0542(0:0252)
0:1274(0:0614)
0:0506(0:0270)
benglish 0:0340(0:0183)
0:1311(0:0363)
¡0:0100(0:0217)
bage at arrival ¡0:0003(0:0019)
0:0132(0:0052)
¡0:0029(0:0020)
byears of schooling 0:0068(0:0062)
0:0214(0:0225)
0:0083(0:0062)
btraining WC 0:0339(0:0480)
0:1146(0:0796)
¡0:0010(0:0625)
btraining BC 0:0209(0:0515)
¡0:0485(0:1301)
0:0642(0:0550)
baccumulated experience 0:0101(0:0125)
0:0300(0:0358)
0:0075(0:0128)
baccumulated experience2 0:0008(0:0007)
¡0:0007(0:0019)
0:0009(0:0007)
bwhite collar occupation 0:3023(0:0405)
¡¡ ¡¡Num. of Obs. 574 132 442
R2 0.277 0.230 0.156

15
3 The Model
The model follows the dynamic programing models of labor supply and schooling (for example,
Eckstein and Wolpin (1999) and Keane and Wolpin (1997)), where an individual chooses
among a …nite set of mutually exclusive alternatives in each period over a …nite horizon. Search
is represented by allowing immigrants to randomly receive job o¤ers and training programs
o¤ers in di¤erent occupations, which they can reject or accept. The random o¤er probabilities
depend on the individual’s current employment state, however, the continuation of working
at the same occupation is random as well. The occupational choice allows workers to select
among two broad occupational classes - white collar and blue collar. Training programs are
classi…ed in the same way. Labor market conditions (such as job availability) are captured
by allowing occupational speci…c time varying indicators to in‡uence the o¤er probabilities of
jobs and training programs. Finally, the model incorporates observed heterogeneity, such as,
schooling, occupation prior to immigration and other demographic characteristics as well as
unobserved heterogeneity (Heckman and Singer (1984)).
An immigrant i who arrives in Israel in time Di at age ¿ i and is expected to live L periods,
is facing a …nite horizon planning period of duration Ti = L ¡ ¿ i quarters. In each period
(quarter), t; t = 1; 2:::Ti he can choose one of …ve labor market alternatives. The index j;
j = 0; 1; 2:::J , J = 4;describes the alternatives. the index j = 1; 2; correspond to working
in the alternative two occupations; occupation 1 = white collar and occupation 2 = blue
collar. The index j = 3; 4 denote the two types of training programs, and j = 0 represents
unemployment. Let djit equal one if the individual chooses alternative j at time t, and be zero
otherwise, When djit = 1;and j = 1; 2; the individual works in occupation j. When dj
it = 1;
and j = 3; 4; the individual acquires training relevant for occupation j ¡ 2. When d0it = 1;
the immigrant neither works nor does he attend a training program. We denote by dit the
row vector of length J + 1, consisting of a single one and J zeros to indicate which activity is
chosen in period t.
A job o¤er is an opportunity to work in occupation j where we assume that there an
occupation speci…c separation rate. Regular jobs are usually associated with a wage path,
including promotions. Subsidized training programs usually pay some …xed positive income
and the opportunity to be o¤ered a training program is also uncertain.
Consider an individual i who chose alternative r in period t ¡ 1. At the end of this period
16
he will receive o¤ers from the set J +1 = 5 alternatives. The conditional probability that this
o¤er will be from alternative j is:
P rjit = P rj(mj
Di+t; xit; t): (1)
The vector mjDi+t represents time varying occupation speci…c demand indicators, such as
unemployment rates, number of immigrants relative to natives, and entry requirements for
training programs. Note that chronological time is given by Di + t, re‡ecting the fact that
immigrants arrive at di¤erent dates and therefore, the same tenure in Israel, t; may be asso-
ciated with di¤erent market conditions. The vector xit represents individual characteristics,
such as occupation in the country of origin, knowledge of Hebrew or/and English, age at ar-
rival and, most important, whether the individual has completed training program in a certain
occupation and general work experience in the new labor market.
The dependence of the o¤er probability on the current work activity, introduces a dynamic
element whereby training or work in a particular job can in‡uence the probability of alternative
job o¤ers. For instance, an immigrant who is working or is in training has less time to search
for a new job, therefore, his chance of receiving o¤ers for alternative jobs is lower than if
he would be unemployed. Similarly, the probability of receiving a job o¤er in an academic
occupation may be lower if one works in a non-academic job than if he would be unemployed.
Time in the new country, t; is allowed to in‡uence the o¤er probability in two ways. First,
there is a seniority e¤ect, representing the immigrant’s learning of local market conditions
and acquisition of language. This individual learning process must be distinguished from the
exogenous changes captured by mjDi+t which a¤ect all individuals at a given chronological time.
In addition to labor market conditions, these variables represent changes in the eligibility to
subsidized training program. Typically, eligibility expires after a period of 5 years. We assume
that the immigrant can attains a training program if he had not been in training before and
he is allowed to attain only one training program in his life time. In our data time in Israel
is distinguished from the work experience. That allows us to identify the direct experience
e¤ect from the tine e¤ect.
The wage o¤ered for jobs in occupation j; j = 1; 2 in period t is a function of: (i) the
person’s occupation-speci…c human capital, Kjt and (ii) a temporal i:i:d shock, zj
t . The wage
o¤ered in occupation j, j = 1; 2 at time t can be expressed by

17
lnwjit = Kj
it + zjit (2)
The random variable zjit can be interpreted in two di¤erent ways. Under the search interpre-
tation, it re‡ects heterogeneity in the distribution of wage o¤ers, implying that the particular
wage that an individual will receive, if an o¤er arrives, is random. Under the human capital
interpretation, zjit represent random shocks to productivity.
The accumulation of human capital for each j, j = 1; 2 is determined by the following
process
Kjit = ®0j + ®ejEXit + ®e1d1
itEXit + ®e2jEX2it + ®c1jC
1it + ®c2jC
2it + ®HjL
Hit + ®FjL
Fi + ®sjK
fi
(3)
where EXit is the general experience in the Israeli labor market, Cjit is an indicator that equals
one if the worker has taken a training course in occupation j; j = 1; 2. The parameters ®ej and
®cj represent the contribution of on the job learning and formal training in the formation of
human capital. The variables LHit and LF
i indicate the level of Hebrew skill acquisition and the
English knowledge at arrival, respectively, which, for simplicity, we assume to be exogenous.
The parameters ®Hj and ®F j describe the contribution of the two languages to the earning
capacity. The initial level of human capital from the foreign country at arrival to Israel is
Kfi: ®sj measures the value of that human capital at arrival to the new labor market. The
imported human capital, Kfi: ; depends on the immigrant’s personal characteristics, xit, which
includes variables such as schooling, age or experience at arrival and the existing knowledge
of English.
The ”wage” associated with a training program, j = 3; 4 and with unemployment, j = 0,
is determined exogenously by the government (typically, the government subsidizes these
activities) and it is indicated by trj ; j = 3; 4. The unemployment bene…t is set as ue: Let
Kit denote the vector of occupation speci…c human capital, that is, Kit = (K1it; K2
it): To be
concrete, current utility from labor market state j for individual i at time t in the new country

18
(U jit) is given by,
U0it = ue+ "o
it (4)
U jit = wj
it; for j = 1; 2
U jit = trj + "j
it; for j = 3; 4
where the vector "i = ["0it; z1
it ,z2it; "3
it; "4it] v N(o;); where is not restricted.
The Optimization ProblemThe immigrant is assumed to maximize the expected present value of life time utility
E
2664 LXt=¿ i
¯t¡¿ iX
j2J+1
U jitd
jit j Sit
3775 (5)
by the choice of djt for all t = ¿ i; ::::; L and where Sit is the vector of all the relevant state
variables. E denotes the expectation taken over the joint distribution of ² and the transition
probabilities P rjit .7 The state vector is given by Sit = [EXit; Cj
it; LHit ; LF
i ; Kfi ; dj
t¡1; "i; for
j = 0; 1; 2; 3; 4]: The state variables in t are the realized values of the shocks, "i; and the
given values of the state variables in t ¡ 1; according to equations (2) and (3). Note that
the realizations of the random variables occur at the beginning of period t. These shocks will
in‡uence, according to (2) the new wages that a person draws in each alternative. ¯ is a
discount factor, 0 < ¯ < 1.
Let V ji (Sit; t) be the maximum expected life time utility given by equation (5) such that
drt = 1, for an immigrant i. This value can be de…ned recursively, for t = ¿ i; ::::; L using the
Bellman equation,
V ri (Sit; t) = U r
it + ¯EmaxfV ji (Sit+1; t+ 1) ; for j = 0; ::; 4 j Sit; t; dr
it = 1g: (6)
7The optimization problem (5) is in the same format as in Eckstien and Wolpin(1989).

19
To simplify the model we assume that the optimization problem is divided to two sub
periods. During the …rst 20 quarters the model is solved explicitly. At the 21’st quarter
the immigrant utility is given by V ji (SiL+1; t = 21), which is assumed to be a given function
of (SiL+1; ¿ i) for j = 0; 1; :::4 (see Eckstein and Wolpin(1999)): The operator E denotes the
expectation taken over the joint distribution of ";
Note that, for a given time in Israel, t, the value associated with each state depends on
the immigrants date of arrival and on his age at arrival, respectively. The t subscript on the
value function, indicates that for given Sit changes in t are associated with changes in the
demand shifters, mjDi+t, as well as potential horizon e¤ects. Further more, perfect foresight is
assumed concerning the future behavior of the demand shifters.
Solution MethodThe model does not admit to analytical solution. Using the end conditions, and assuming
a known distribution of "i and a functional form for the job o¤er probability functions, it is
possible to solve numerically for the set of optimal decisions, using backwards induction for
any given values of the parameters. We solve the problem at each point of the state space. To
be speci…c, we …rst separate between the expectation operator taken in (6) on the transition
probabilities de…ned by (1) and the joint distribution of ²: Given the transition probabilities,
P rjit ; at each date t and state S there are at most 16 possible outcomes of feasible choice sets.8
At each choice set we can choose between being unemployed, j = 0; and possible outcome of
the four alternative labor market activities. Let gs be the feasible choice set s; s = 1; ::::; 16;
and let P (gsit+1 j Sit; t; dr
it) be the conditional probability of the choice set gsit+1, at time t+ 1:
Now we can rewrite (6) as follows,
V ji (Sit; t) = U j
it + ¯16X
s=1
P (gsit+1 j Sit; t; dr
it)E(maxfgsit+1 j Sit; t; dr
it = 1g): (7)
where E is the expectation operator taken only on the joint distribution of ²: The numerical
complexity arises because of the value function requires high-dimensional integrations for the
computation of the Emax function on the right hand side of (7). We follow the procedure
8We assume that the the individaul can always choose to be unemployed. Therefore, there are only 16possible independent transition probablities each is given by (1)

20
in Keane and Wolpin (1994), using Monte Carlo integrations to evaluate the integrals that
appear in (7).9
In the analysis of the initial transition period in Israel, we shall use quarterly data. Such
data is available for at most …ve years for each observation. The model assumes that decisions
within the sample period re‡ect expected circumstances and choices in subsequent periods. As
explained above, we split the planning horizon between the …rst 20 quarters in Israel and the
rest of the life time. As indicated above the value at t = 21 is assumed to be a linear function
of the state vector Si20 and the remaining periods of life, L ¡ 21 ¡ ¿ i. We then apply the
Bellman equation (6) and calculate the optimal policy backwards for t = 20; ::; 1 recursively.
ImplicationsThe model has several predictions regarding the dynamic pattern of the proportion of
immigrants to be observed at each of the labor market states of the model. Participation in a
training course related to each occupation is an investment in skills that are rewarded in that
occupation by higher wage as well as an increase in receiving a job o¤er in that occupation.
So far the standard human capital theory emphasized the earning impact of training. On
the other hand, labor market practice indicates that the impact of training might be more
important as a formal screening and licencing instruments in a¤ecting job availability than
direct wage gain. Both rewards to training investment are for the entire future, and therefore,
it is expected that training participation will take place next to arrival in Israel. In a dynamic
setting training can be viewed as a form of job search, and therefore, participation in training
could be expected in later periods. Moreover, the availability of training is random and,
therefore, it is possible to observe training in later periods.
The endogenous process of accumulating work experience can also be viewed in this model
as an investment in skills which are used in the labor market, since job o¤ers depend positively
on the general experience. Assuming that the availability of blue collar jobs is higher than
that of white collar jobs (more blue collar positions in the Israeli market), the model predicts
that initially the workers who arrive with high potential human capital (high schooling) will
initially invest by working in blue collar jobs and attain training, and later would …nd a job
in a white collar occupation. In general, the model predicts that the accumulation of work
experience and participation in a training program a¤ect future wages faced by the individual
9To compute the Emax function we simulate 150 draws at each point of the state space.

21
as well as work possibilities, which in turn a¤ect future participation and wages in the labor
market.
Estimation MethodConditional on values for the parameters and the observed state space of a given indi-
vidual the dynamic Bellman equation (6) looks like a standard indirect utility function in
a multinomial choice model for panel data. The main complications here, comparing to the
multinomial logit case, stem from the theory that does not permit additivity and independence
of the errors and, hence, the choices for each individual are correlated. Furthermore, we allow
for measurement error in observed wages . Speci…cally, We assume the log of the observed
wage of individual i at time t in occupation j , lnwjoit ; is of the form: lnwjo
it = lnwjit+´j
it, where
´jit~N(0; ¾2
´) is the multiplicative measurement error.
The model is estimated using smooth maximum likelihood (SML) (McFadden(1989) and
Keane and Wolpin (1997)). Let I be the number of individuals in the sample and each
individual is observed over the sample periods 1 to ti: The vector of observed outcomes for
individual i at date t is given by [djit; wjo
it ]: Note that the vector of parameters of the model
enters the likelihood through its e¤ect on the choice probabilities, the wage is observed only
while working and for each individual the sample is truncated at time ti. As such the likelihood
for a sample of I individuals is given by,
L(µ) =IY
i=1
Pr(dji1; wjo
i1 ; dji2; wjo
i2 ; ::::; djiti
; wjoiti
j Si0) (8)
where µ is the vector of parameters to be estimated. Given the assumption of joint serial
independence of the vector of errors, the likelihood function (8) can be written as a product of
within period conditional joint probabilities of the choices and the wage. These probabilities
are computed from the solution of the dynamic programming as explained above. To achieve
asymptotically e¢cient estimators using the simulated probabilities we smooth the probability
in the way suggested by Keane and Wolpin(1997).10
10For example, for the probability that djit = 1; we use the Kernel smoothing function:
exp( (V ji (Sit;t)¡max(V a
i (Sit;t))
¿ )=P4
k=0exp( (V ki (Sit;t)¡max(V a
i (Sit;t))¿ )

22
Unobserved HeterogeneitySo far the heterogeneity in the model is captured by the imported skills of the immigrants,
the knowledge of Hebrew and the arrival period. It is possible that individual gains from
working in certain occupation, the gain from training and the utility while being unemployed
is valued di¤erently among the immigrants. To capture the possible heterogeneity that is
unobserved (by us), we allow for M types of individuals, each comprising ¼m fraction of the
population (Heckman and Singer (1984)). We allow for this heterogeneity to enter to the
utility from each of the …ve choices as well as a¤ecting the job o¤er probabilities. As such the
model is solved for each type independently and the likelihood function is a weighted average
of the likelihood of each type, that is,
L(µ) =IY
i=1
MXm=1
Pr(dji1m; wjo
i1m; dji2m; wjo
i2m; ::::; djitim; wjo
itim j SiM0; type = m)£ ¼m: (9)
Speci…c Parameterization
In this section we provide the explicit functional forms that we use in the estimation of
the model.
The wage o¤er functions: A wage o¤er in occupation j , j = 1; 2, is as we specify in (3)
with the following speci…c form:
wjit = expf®0jm + ®ejEXit + ®e2jEX2
it + ®c1jmC1it + ®c2jmC2
it + ®HjLHit + ®F jL
Fi + (10)
®AjAGEi + ®SjEDUCi + zjitg
where AGEi (¿ i) indicates age at arrival and EDUCi is the imported years of schooling. Here
we assume that the unobserved types value di¤erently work in WC and BC occupations. The
natural way to model it is by adding a type speci…c parameter to the utility depending on the
occupational choice. However, the linearity implies that this parameter can not be identi…ed
separately from the constant in wage. Hence, we assume that the constant in the wage o¤er
function above, ®0jm; depends on the type m and so is the return to training.

23
The job o¤er rates:
The probabilities to receive job o¤ers in WC and BC have the following logistic form:
P rjit =
expfQijt g1 + expfQijtg ; (j = 1; 2) (11)
where the speci…cation of Qijt depends on j as speci…ed below.
The job o¤er rate in WC Occupation: During their …rst two quarters in Israel, only
immigrants who had some knowledge of Hebrew upon arrival can get a job o¤er in WC
occupation. Otherwise, the probability an individual i who chose alternative r in period
t¡1would receive a job o¤er in a white collar occupation (j = 1) depends on the labor market
state of the individual in the previous period (r), the unobserved type of the individual
(indexed by m), the knowledge of English, the occupation held before immigration in USSR,
(UOCCi), the accumulated experience in Israel, the participation in a white collar training
course, age at arrival and Hebrew knowledge. Speci…cally:
Qi1t = b01jmd1t¡1;i + b02jmd2
t¡1;i + b03jm(d0t¡1;i + d4
t¡1;i + d5t¡1;i) + b1L
Fi +
b2UOCCi + b31jI(EXit = 0) + b32jI(1 · EXit · 4) + b4jC1it + (12)
bsjLHi + b6jAGEi
where I(EXit = 0) is an indicator equals one if individual i has accumulated no work-
experience in Israel by time t, and I(1 · EXit · 4) is an indicator equals one if individual i
has accumulated one to four quarters of work-experience in Israel by time t:
The job o¤er rate in BC Occupation: The probability an individual i who chose alternative
r in period t ¡ 1; would receive a job o¤er in a blue collar occupation (j = 2) depends only
on activity the individual engaged in the previous period (r), the unobserved type of the
individual, accumulated experience in Israel, participation a blue collar training course, age
at arrival and Hebrew knowledge. Speci…cally:
Qi2t = b01jmd1t¡1;i + b02jmd2
t¡1;i + b03jm(d0t¡1;i + d4
t¡1;i + d5t¡1;i) +
b31jI(EXit = 0) + b32jI(1 · EXit · 4) + b4jC2it + (13)
bsjLHi + b6jAGEi

24
Note that the job o¤er rates in WC and BC occupations are independent. That is, an
immigrant can get at each period an o¤er in each type of occupation. Furthermore, we assume
that the constant terms, b01jm; b02jm; b03jm; vary across the M unobserved type of immigrants
(m = 1; ::; M). The above o¤er rates depend on the labor market state of the individual, as
we indicated in the speci…cation of the model, by being a function of dri;t¡1, r = 0; ::; 4:
The training o¤er rates: The probabilities of receiving an o¤er to participate in a training
program related to white collar or blue collar occupation are constant and independent of the
job o¤ers. An immigrant who has already participated in WC or BC training since his arrival,
does not get another training o¤er.
Utility from being unemployed and utility while participating in a training program ( ue; trj ;
j = 1; 2) di¤er across the unobserved M types.
Value after …ve years: We assume that the present value of utility of the individual i at
the 21st quarter takes the following approximation form of the state variables at that period,
that is,
V ji (SiL+1; t = 21) = ±1m + ±2EXi21 + ±3mC1
i21 + ±4EDUCi + ±5AGEi + (14)
±6LHi21 + ±7L
Fi21 + ±8d
1i20 + ±9d
0i20 + ±10mC2
i21
where m indicates the type of individual.
4 Estimation Fit and Results
In this section we present the processes of estimation. We use three methods. The …rst is the
”best …t estimates” for the choices and the wages separately. The second is as the …rst but
we use a simple method to correct for the selectivity bias in the estimation of the training
treatment a¤ect using the dynamic programing model. The main method is the maximum
likelihood that is set above.

25
MDE estimatorGiven the parameters of the wage in WC and BC obtained from OLS regressions (ta-
ble 10) we construct MDE estimator for the distance between predicted and actual choice
probabilities. The objective function is given by,
Min
20Xt=1
4Xj=0
(probpjt ¡ probrjt)2 ¤ obs(t)=20Xt=1
obs(t) (15)
where probpjt is the predicted proportion of individuals in alternative j at time t, probrjt is the
proportion of individuals in alternative j at time t in the data and obs(t) is the number of
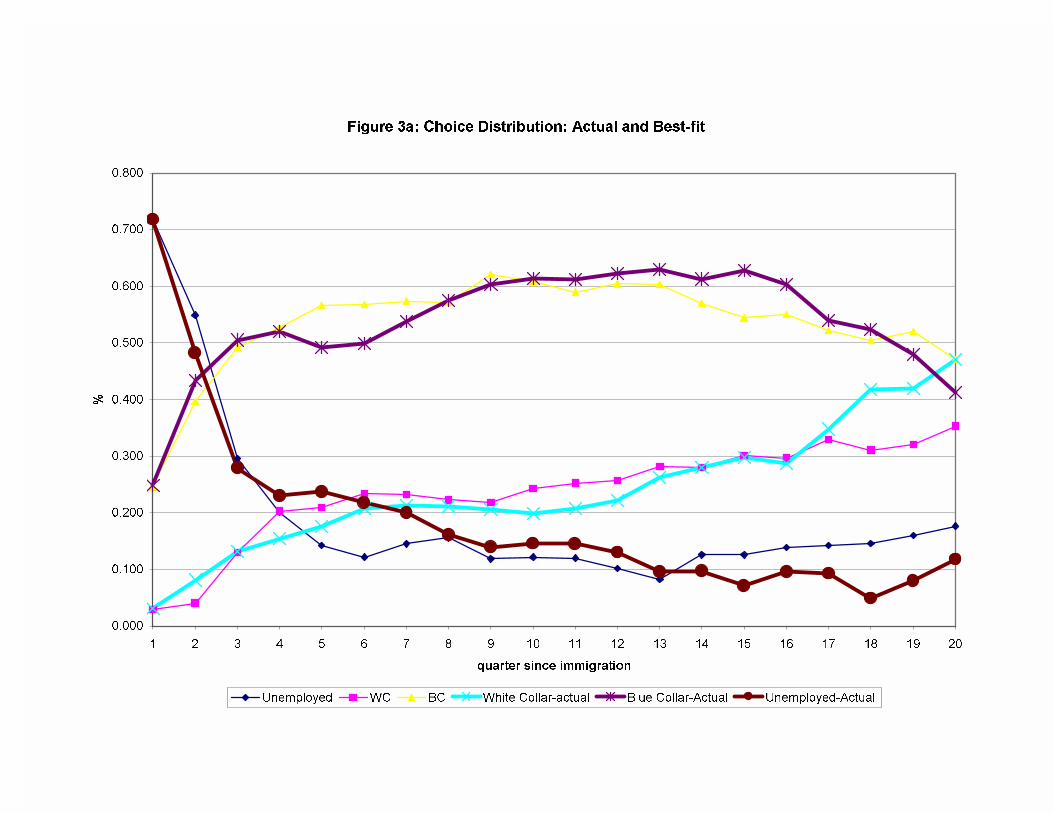
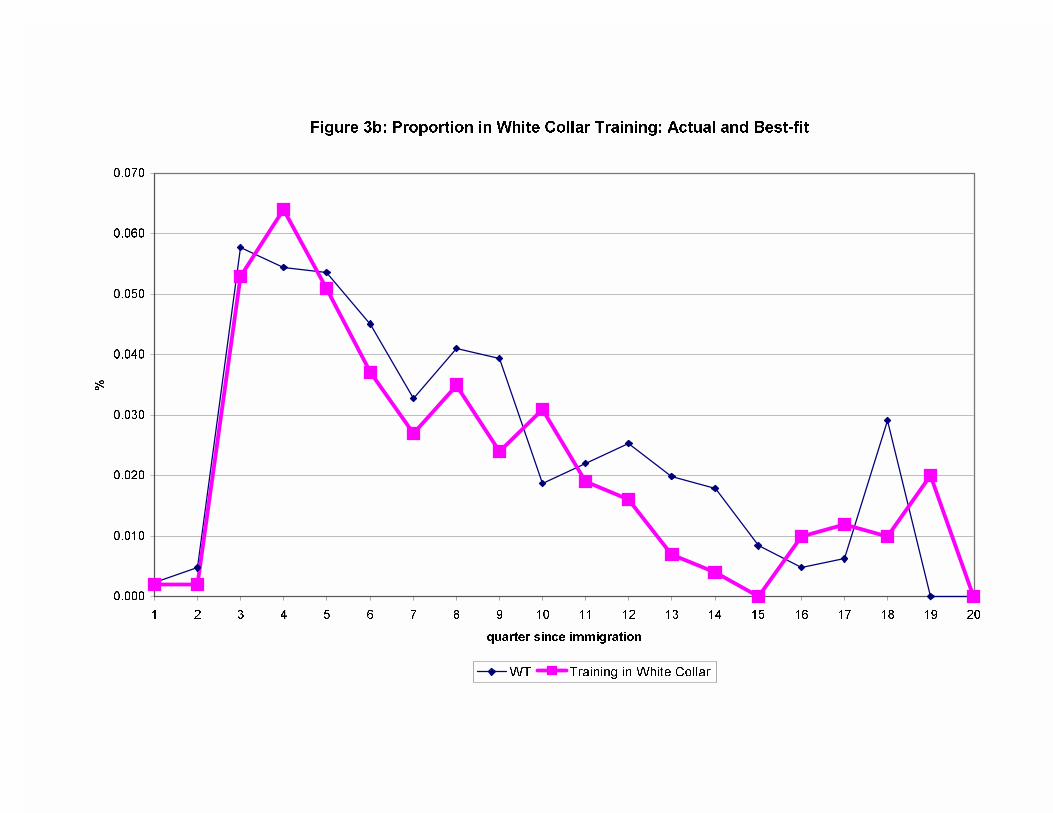
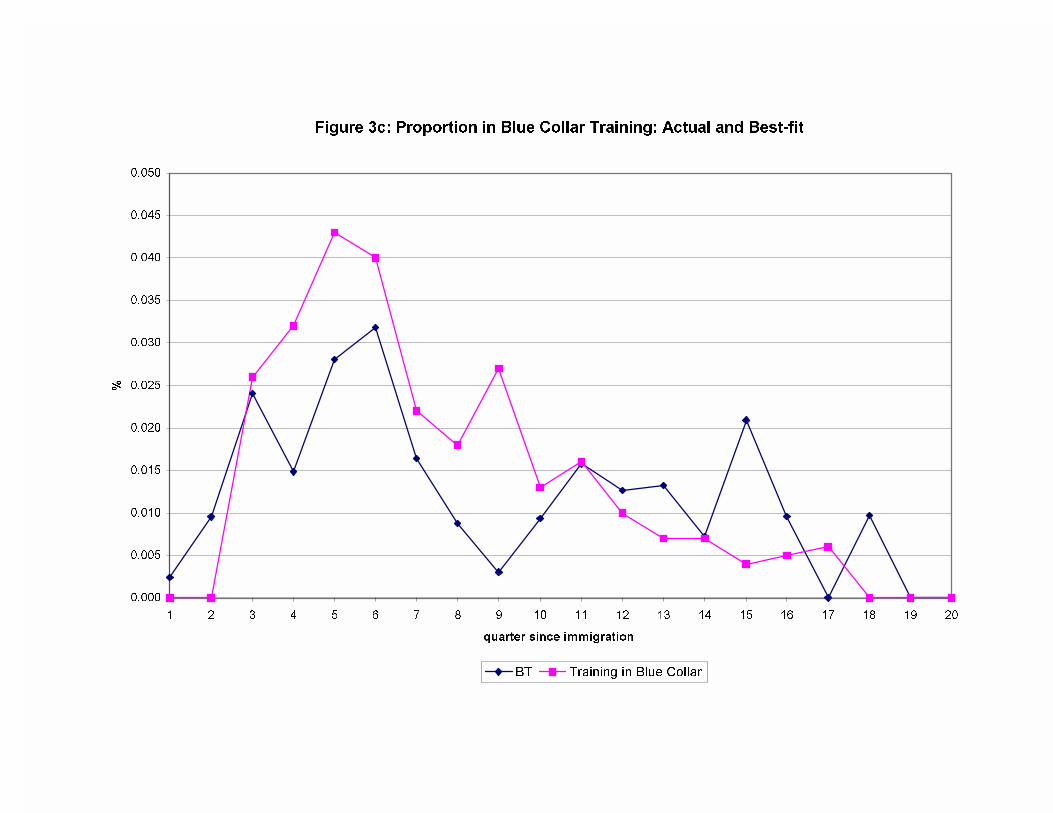
observations in the sample at time t. The actual and predicted proportions of immigrants at
each of the labor market states are presented in …gures 3a,3b and 3c. The predicted pattern
is based on 150 draws of the Emax’s in 6. We should also note that estimating the MDE
gives a good …t to the pattern of choices, but it does not necessarily …t other moments of the
data. For example, for the MDE parameters we obtain, we predict correctly the choices for
only 2436 observations out of 5778.
26
References
[1] Bellman, R. (1957), ”Dynamic Programming,” Princeton, New-Jersey, Princeton Univer-
sity Press.
[2] Chiswick, B. (1992), “The Performance of Immigrants in the Labor Market: A Review
Essay,” unpublished manuscript.
[3] Eckstein, Z. and Y. Weiss (1998), ”The Absorption of Highly Skilled Immigrants: Israel
1990-1995”, Foerder Institute Working Paper, 3-98.
[4] Eckstein and K.I. Wolpin (1999), ”Why Youth Drop Out of High School: The Impact of
Preferences, Opportunities and Abilities”, Econometrica (forthcoming).
[5] Heckman, J., LaLonde, R.J. and J.A.Smith (1999) ”The Economics and Econometrics of
Active Labor Market Programs,” Handbook of Labor Economics, forthcoming.
[6] Heckman, J. and B. Singer (1984), ”A Method for Minimizing the Impact of Distributional
Assumptions in Econometric Models for Duration Data,” Econometrica, 52(2), 271-320.
[7] Keane, M. P. and K. I. Wolpin (1994), ”The solution and Estimation of Discrete Choice
Dynamic Programming Models by Simulation and Interpolation: Monte Carlo Evidence”,
Review of Economics and Statistics, 76, 648-672.
[8] Keane, M. P. and K. I. Wolpin (1997), ”The Career Decision of Young Men,” Journalof Political Economy, 105, 473-522.
[9] LaLonde R.J. (1995) ”The Promise of Public Sector-Sponsored Training Programs”,
Journal of Economic Perspectives 9(2), pp. 149-168.
[10] McFadden, D. (1989), ”A Method of Simulated Moments for Estimation of Discrete
Response Models Without Numerical Integration,” Econometrica, 57(5), 995-1026.
)LJXUH �D� 3URSRUWLRQ RI ,PPLJUDQWV LQ :KLWH &ROODU 2FFXSDWLRQ� %OXH &ROODU 2FFXSDWLRQ DQG
LQ 8QHPSOR\PHQW
�
��
��
��
��
��
��
��
��
� � � � � �� �� �� �� ��
4XDUWHUV LQ ,VUDHO
3URSRUWLRQ
:KLWH &ROODU %OXH &ROODU 8QHPSOR\HG
)LJXUH �E� 3DUWLFLSDWLRQ LQ 7UDLQLQJ E\ 2FFXSDWLRQ
�
�
�
�
�
�
�
�
�
�
��
� � � � � �� �� �� �� ��
4XDUWHU LQ ,VUDHO
�
7UDLQLQJ LQ :KLWH &ROODU 7UDLQLQJ LQ %OXH &ROODU
),JXUH �� 0HDQ +RXUO\ :DJH E\ 4XDUWHU DQG 2FFXSDWLRQ
�
�
��
��
��
��
��
��
� � � � � �� �� �� �� �� ��
4XDUWHU LQ ,VUDHO
QHZ
,VUDHOLVKHNHOV
�����SULFHV�
PHDQ ZDJH ZKLWH PHDQ ZDJH EOXH
)LJXUH �D� &KRLFH 'LVWULEXWLRQ� $FWXDO DQG %HVW�ILW
�����
�����
�����
�����
�����
�����
�����
�����
�����
� � � � � � � � � �� �� �� �� �� �� �� �� �� �� ��
TXDUWHU VLQFH LPPLJUDWLRQ
�
8QHPSOR\HG :& %& :KLWH &ROODU�DFWXDO %OXH &ROODU�$FWXDO 8QHPSOR\HG�$FWXDO
)LJXUH �E� 3URSRUWLRQ LQ :KLWH &ROODU 7UDLQLQJ� $FWXDO DQG %HVW�ILW
�����
�����
�����
�����
�����
�����
�����
�����
� � � � � � � � � �� �� �� �� �� �� �� �� �� �� ��
TXDUWHU VLQFH LPPLJUDWLRQ
�
:7 7UDLQLQJ LQ :KLWH &ROODU
)LJXUH �F� 3URSRUWLRQ LQ %OXH &ROODU 7UDLQLQJ� $FWXDO DQG %HVW�ILW
�����
�����
�����
�����
�����
�����
�����
�����
�����
�����
�����
� � � � � � � � � �� �� �� �� �� �� �� �� �� �� ��
TXDUWHU VLQFH LPPLJUDWLRQ
�
%7 7UDLQLQJ LQ %OXH &ROODU
Top Related