Mobility of Highly Skilled Individuals and Local ... · Mobility of Highly Skilled Individuals and...
44
Mobility of Highly Skilled Individuals and Local Innovation Activity Dimitris Karamanis and Claire Economidou Document Identifier D3.10 Entrepreneurship and innovation – Report based on the study outlined in task 3.10 2 Version 4.0 Date Due M36 Submission date 15/03/2018 WorkPackage 3 Lead Beneficiary UPRC
Transcript of Mobility of Highly Skilled Individuals and Local ... · Mobility of Highly Skilled Individuals and...

Mobility of Highly Skilled Individuals
and Local Innovation Activity
DimitrisKaramanisandClaireEconomidou
DocumentIdentifier
D3.10Entrepreneurshipandinnovation–Reportbasedonthestudyoutlinedintask3.102Version4.0DateDueM36Submissiondate15/03/2018WorkPackage
3LeadBeneficiary
UPRC

ii
ChangelogVersion Date Amendedby Changes
1 03/09/2017 DimitrisKaramanis - Structure&Hypothesestesting
2 15/01/2018 MarkSanders - AdjustmentofΡesults
3 20/02/2018 ClaireEconomidou - MethodologyΕnhancement
4 09/03/2018 ClaireEconomidou - AdditionalSectionsPartnersinvolvedNumber Partnername Peopleinvolved
1 UPRC ClaireEconomidou,DimitrisKaramanisandKyriakosDrivas
2 UU MarkSanders

iii
ContentContent...................................................................................................................................................................iii
Executivesummary...............................................................................................................................................vii
MobilityofHighlySkilledIndividualsandLocalInnovationActivity
1.Introduction........................................................................................................................................................1
2.AFrameworkofAnalysis…………………………………………………………………………………………………………………………………3
2.1ModelingMigrationFlows............................................................................................................................3
2.2.EstimationApproach....................................................................................................................................7
3.DataDescriptionandAnalysis.............................................................................................................................8
4.EmpiricalResults...............................................................................................................................................11
4.1.WhatShapestheMovesofHighlySkilledMigrants?...................................................................................11
4.1.1.WhatShapestheMovesofInventorsfromtheTopandLessInnovativeCountries?............................15
4.1.2.Comparison:WhatShapestheMovesofNon-inventorMigrants?........................................................17
4.1.3.EntrepreneurshipandInventors'Moves................................................................................................20
4.1.4Robustness...............................................................................................................................................23
4.2.DoesInventorMobilityContributetoLocalInnovationActivity?................................................................24
Conclusion.............................................................................................................................................................26
References……………………………………………………………………………………………………………………………………………………….28Annex....................................................................................................................................................................31

iv
ListofAbbreviations
EU EuropeanUnion
R&D ResearchandDevelopment
WIPO WorldIntellectualPropertyOrganization
CIS CommunityInnovationSurvey
ZINB Zero-InflatedNegativeBinomial
LR LikelihoodRatio
WDI WorldDevelopmentIndicators
GDP GrossDomesticProduct
UK UnitedKingdom
USA UnitedStates
OECD OrganizationforEconomicCo-OperationandDevelopment
IPC InternationalPatentClassification
CIA CentralIntelligenceAgency
WGI WorldwideGovernanceIndicators
HRST HumanResourcesdevotedinScienceandTechnology
STEM Science,Technology,EngineeringandMathematics
EPL EmploymentProtectionLegislation
GEM GlobalEntrepreneurshipMonitor
APS AdultPopulationSurvey
TEA TotalEarly-stageEntrepreneurshipActivity
v
ListofTables
Table1:ZINBEstimatesofInternationalInventorMobility..................................................................................12
Table2:ZINBEstimatesofInternationalInventorMobilityfromMostandLeastInnovativeCountries.............16
Table3:ZINBEstimatesofInternationalInventorandNon-InventorMobility....................................................18
Table4:ZINBEstimatesofInternationalInventorMobility&EntrepreneurshipEnvironment...........................22
Table5:ElasticitiesofInnovationProductionFunction........................................................................................25
TableA.1:ListofCountries(andMembershiptoEurozone,Schengen)...............................................................31
TableA.2:SummaryStatistics(30OECDcountries,2000-2012)...........................................................................32
TableA.3:Inventors’TopDestinations(2000-2012).............................................................................................33
TableA.4:ZINBEstimatesofInternationalInventorMobility(Sensitivity)...........................................................34
TableA.5:TopDestinationandOriginCountriesofNon-InventorMigrantFlows...............................................35
TableA.6:2SRIEstimatesofInternationalInventors’Mobility(Robustness).......................................................37

vi
ListofFigures
Figure1:InventorInflowsinTechnologicallyAdvancedCountries,2000-2012...................................................10
Figure2:Top5%InventorFlowsAcrossTechnologicallyAdvancedCountries,2000-2012..................................10
Figure3:DecayofInventorFlowsDuetoGeographicalDistance........................................................................17
Figure4:DecayofInventor&MigrantFlowsDuetoGeographicalDistance.......................................................20
FigureA.1:Top5%Non-inventorMigrantFlowsAcrossTechnologicallyAdvancedCountries,2000-2012.........36

vii
ExecutiveSummary
Individuals are reservoirs of both skills and ideas and their location and mobility are keys to knowledge
accumulationanddiffusion.Inadvancedeconomies,innovationandtechnologicalknowledgehavebeenboth
foundtobestronglytiedtothetalentedmigrants.Thusfar,onlyascantfewstudieshavestudiedthemobility
ofinvetorsandevenfewerexaminedtheirimpactoninnovationperformance.
Thistaskstudiesthedriversofhighlyskilledmigrantsacrossspaceaswellastheirimpactonlocalinnovation
activity.Wefocusonpatentinventors,aspecifictypologyofskilledandinnovativeindividualswhoaredeeply
involvedintheproductionofinnovationandareimportantvehicleofknowledgecirculation.Employingpatent
datatotracktheirmoves,weuseagravitymodeltoexaminewhethergeographic,technologicalandcultural
proximities between countries and country level factors shape the flows of these talented individuals. As a
comparison,inthesameframework,wealsoanalyzetheflowsofnon-inventormigrants.Ourevidenceshows
that proximity matters for migration. Gravity emerges everywhere; in the mobility of inventor and non-
inventormigrantworkers; the former,however, are lessgeographically restricted. Similarity in technological
productionstructurebetweencountriesisthemaindriverofinventormoves-especiallyforinventorsfromthe
most innovative countries, whereas cultural proximity matters more for non-inventor migrants. Attractive
country features are the quality of institutions, job opportunities and early stage entrepreneurship at the
destinationaswellastradelinkagesbetweenoriginanddestinationcountry.Finally,knowledgeandskillsthat
movewiththeinventors-andparticularlytheirorigin-haveapositiveimpactonlocalinnovationproduction.
Theempiricalanalysispresentedinthepapershouldbeinterpretedbearinginmindsomekeylimitations.First
wefocusedourattentiononthemobilityofinventors,averyspecificclassofskilledandinnovativeindividuals.
Second, our analysis shares the strengths aswell as the limitations of other studies using patent data as a
measureofinnovation:theymayunder-representactualinnovation.Third,onemustnoteherethatinventors’
mobilitymaynotbeequallyimportantforallfirmsinacountry.Theat-tractionofhighlyskilledknowledgeable
individuals can be more effective in enhancing local innovation when this is part of a country innovation
strategythatstimulatestheinclusionoftheseinflowsintothenetworkstructureofthelocaleconomy.Future
researchshouldgointothedirectionofstudyingfirmleveldynamicsandmobilityofskilledindividuals.
Having acknowledged these limitations,weoffer somepolicy considerations.Given the important economic
contribution of inventors, countries should become more attentive to the quality, accountability and
effectivenessof theirhome institutionsand further to their immigrationpolicies,as the lattercouldbecome
morewelcomingtoskilledpeople.Fosteringskilledmigrationisapowerfulpolicyoption.Activepoliciesshould
be designed in order to remove existing barriers to labour mobility: from entry restrictions to
institutional/regulatory barriers. Conversely, taking a hard line stance on immigration policy, it would
potentially threaten a country’s ability to attract the brightest and bestmigrant innovators and hamper its
growthpotentials.
1. Introduction
In an open economy migration is a natural process. It certainly poses challenges for the host countriesbut also brings benefits, especially if skillful human capital is accumulated. Highly skilled migrants bringadvanced, or "upper-tail" human capital (Mokyr, 2002; Squicciarini and Voigtlaender, 2015) to the hostcountry and spur technological progress through creation and diffusion of knowledge (Lucas, 2009; Kerrand Lincoln, 2010; Gennaioli et al., 2013). In contrast, the loss of talents deprives their home countries of thescientists, entrepreneurs and other professionals who drive their economies to higher levels of efficiencyand productivity.
Evidence based on the World Intellectual Property Organization (WIPO) data shows that highly skilledindividuals appear to be more mobile than the general population, which is consistent with a positive doc-umented relation between skill and mobility. Fears of "brain drain" and exodus of economically valuableagents have led the revival of the interest of researchers and policy makers on what determines the mobil-ity of talented individuals and what polices could influence such flows (Docquier et al., 2014; Saint-Paul,2004; Kapur and McHale, 2005; Papademetriou and Sumption, 2013; Czaika and Parsons, 2015).1
While there has been an increasing attention to the highly skilled migrants’ contributions to knowledgestock (Bhagwati and Hanson, 2009), there is still scant systematic empirical evidence (Agrawal et al., 2008,2011; Breschi et al., 2017) and is far from being conclusive.
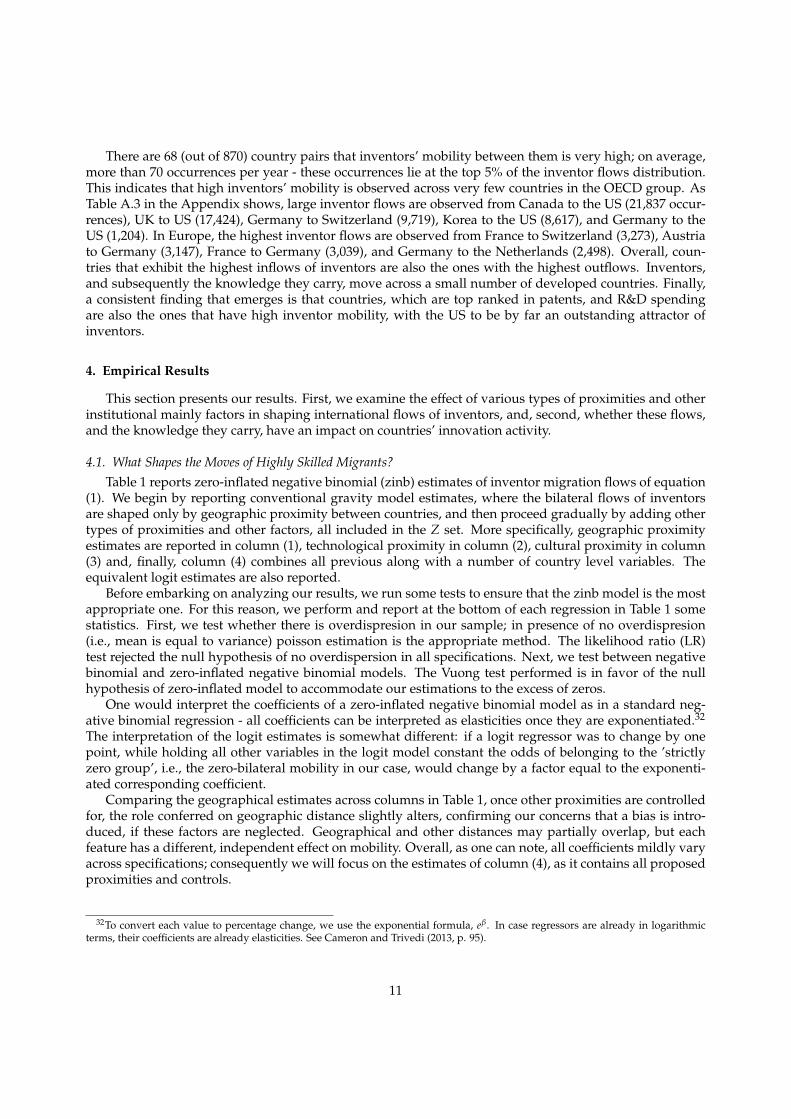
This paper aims to study the role of proximity, along with institutional and economic factors, in shapingthe international flows of highly skilled individuals. Our focus lies on patent inventors - a specific classof workers that belong to the upper tail of the skills distribution that is more homogeneous as a wholethan the tertiary educated workers.2 Although inventors are just a small proportion of the skilled labour,they have a significant economic contribution. They are deeply involved in the production of innovation,which in turn is the main driver of economic growth (Romer, 1990). They are also important vehicle ofknowledge transmission - knowledge that cannot be codified and transmitted through other informationchannels requires ’knowledge-carriers’ to physically move and create spillovers elsewhere (Lucas, 1988;Glaeser et al., 1995; Breschi and Lissoni, 2009).
Inventor’s mobility in our approach relates to the number of countries a patent inventor changes dur-ing lifetime every time she files for a new patent. To track inventor moves, we rely on a patent databasethat provides bilateral counts of "migrant inventors" for a large number of years as well as a considerablenumber of sending and receiving countries. By using a gravity model, we analyze how geographic, techno-logical, and cultural proximity among countries, along with other relevant country level factors, shape theflows of talented individuals. Our empirical gravity model is consistent with an underlying micro-foundedrandom utility model (Bertoli and Moraga, 2015), while importantly also accounting for recent innovationsin the empirical literature, namely a high proportion of zeroes in the dependent variable and multilateralresistance to migration. As a comparison, using the same framework of analysis, we also examine howthese proximities influence the mobility of ordinary, non-inventor migrants.
Growth is driven by innovation activity carried out not only locally but also by the ability of a regionto learn from external technological achievements (Romer, 1986; Grossman and Helpman, 1991). The flowof individuals between (firms, industries and) locations has been proposed as an important mechanism fortransferring knowledge to a place and significant conduit for firm demography, entrepreneurship and in-novation (Agarwal et al., 2006; Audretsch and Keilbach, 2007). Consequently, we are interested to examinewhether the knowledge that moves with the inventors - and particularly its origin - has any contributionto local innovation activity.
Our paper relates and adds to various strands in the literature. Broadly, our paper associates to theliterature on the determinants of international migration (Mayda, 2010; Grogger and Hanson, 2011; Beine
1The mobility of highly skilled personnel - researchers, scientists, engineers - has become one of the main pillars of the EuropeanResearch Area launched by the Lisbon Agenda back in 2000.
2Tertiary graduate movers can be individuals with non-university tertiary degrees, undergraduate university degrees, postgradu-ate and doctorate degrees; however, these degrees may not always be fully comparable across different countries. More importantly,their contribution to innovation processes is only ’potential’ and possibly delayed in time.
1

et al., 2011; Ortega and Peri, 2013; Czaika and Parsons, 2015) and how they shape migrant flows. Ourpaper, however, speaks most directly to the strand of literature that specifically focuses on inventors’ mo-bility. Along with other important studies in the field (Miguélez et al., 2010; Miguélez and Moreno, 2014),we also study inventor movers and the factors that shape their mobility across a large panel of countriesand contribute to the debate on whether geographical distance still plays any role in explaining economicphenomena - prominent paradigms of "death of distance" (Cairncross, 1997) and the "flatness of the world"(Friedman, 2005) have claimed the opposite - or technological advances have indeed overcome geography(McCann, 2008; Rodríguez-Pose and Crescenzi, 2008).
Additionally, we aim to examine the impact of inventor moves on a countries’ innovation activity. This,brings us closely to a rather newly developed stream of research that has evaluated the role of migrantinventors in the technological knowledge creation and diffusion (Hunt and Gauthier-Loiselle, 2010; Kerrand Lincoln, 2010; Miguélez and Moreno, 2013a; Crescenzi and Gagliardi, 2015; Drivas et al., 2016; Ak-cigit et al., 2017a,b; Breschi et al., 2017).3 More specifically, some recent works have explored the role ofimmigrant inventors in the process of technological development in the US from an historical perspec-tive (Akcigit et al., 2017a) and in recent time periods (Hunt and Gauthier-Loiselle, 2010; Kerr and Lincoln,2010).4 Unanimously these studies corroborate that America’s role as an innovation leader is strongly tiedto the talented foreigners. Other studies have focused on the role of knowledge networks through ethnicties between US ethnic research (diaspora) and their home countries (i.e., co-ethnic inventor migrants andnon-migrants cite disproportionately each other), and whether these diasporas contribute to output and in-novation at home (Kerr, 2008; Breschi et al., 2017). While there is some evidence on ethnic ties, conclusionsabout the effects of diasporas on knowledge absorption at home vary.5 The relative importance of variousmarket and non-market channels of knowledge transmission across states in the US, including the channelof inventors’ mobility, and their effect on a state’s innovation activity is explored by Drivas et al. (2016).
Finally, we also relate to to handful of studies that examine the contribution of inventors’ migration atregional or firm innovation in Europe. For example, the studies of Miguélez and Moreno (2013a,b), con-trolling for spatial interactions of patenting activity across regions in Europe, find a positive and robustcorrelation between intra-regional inventors’ mobility and regional innovation. Based on UK communityinnovation survey (CIS) data, the Crescenzi and Gagliardi (2015) findings suggests that firms located inareas experiencing inventors’ inflows are on average 20% more likely to develop process or product inno-vation.
Our paper adds to these important aforementioned studies by proving comprehensive evidence on thedrivers of inventors’ mobility across the most technologically advanced countries in the world. As everyinventor is a knowledge-carrier of her home knowledge stock, we further assess the inventor-weightedchannel of external knowledge flows on a country’s innovation activity.
Therefore, we apply our modeling approach to 30 countries over the period 2000-2012 with two keyquestions in mind: (i) What shapes the international mobility of inventors? (ii) What is the impact ofinventor movers on local innovation activity?
Our evidence shows that proximity matters for migration. Gravity emerges everywhere; in the flowsof inventor and non-inventor migrants; the former, however, stretch farther in space than the latter. Tech-
3Other studies have also explored the mobility of researchers and their impact on regional innovation activity, documenting apositive and strong link. See Gagliardi (2015) for a recent review of this literature.
4For example, the studies of Hunt and Gauthier-Loiselle (2010) and Kerr and Lincoln (2010) evaluate the impact of high-skilledimmigrants on the US technology formation. The former concludes that total science and engineering employment and invention inthe US has increased with higher admissions, primarily through direct contributions of immigrants and the latter, using a 1940-2000state panel, finds that a one percent-age point increase in immigrant college graduates’ population share has increased patents percapita by 9 to18 percent. Akcigit et al. (2017b,a), based on a large new data set matching millions of inventors from patent recordsto individuals in Federal Censuses, provide suggestive evidence that immigrant inventors were of central importance to Americaninnovation during the 19th and 20th centuries.
5Kerr (2008) using international patent citations confirms knowledge transfer through ethnic networks and finds that manufac-turing output in foreign countries increases with an elasticity of 0.1-0.3 to stronger scientific integration with the U.S. frontier. Insimilar vein, Breschi et al. (2017) examine the inventors’ diaspora effect in facilitating knowledge diffusion and in leading in ’braingains’ at home. While their findings support diaspora effects for some countries, such ties, however, do not appear to be of primaryimportance in conveying knowledge diffusion.
2

nological proximity, and particularly the similarity in countries’ technological production structure, is themain driver that mobilizes of an inventor - a finding that emerges particularly strong for inventors orig-inating from the most innovative countries. Geographic closeness and cultural similarity, though signif-icant, play a less important role - particularly the latter. In contrast, cultural proximity matters more fornon-inventor migrants. Attractive country features for an inventor to re-locate herself are the quality of in-stitutions and the job opportunities at the destination country as well as the trade linkages between originand host country. Finally, the knowledge that moves with the inventors - and particularly its origin - has asignificant and positive contribution to local innovation activity.
The implications of our findings for the growth literature are relevant. Theoretical studies (Grossmanand Helpman, 1991; Rivera-Batiz and Romer, 1991) have emphasized the important consequences of dis-embodied and embodied knowledge flows for growth. Our study makes an effort towards analyzingknowledge diffusion via the channel of highly skilled inventors’ mobility and its impact on local innova-tion activity. We find that knowledge flows are relevant to a country’s innovation production, as externalaccessible R&D gained through mobility of inventors has a positive effect, confirming thus the importanceof embodied knowledge flows for technology transfer and economic growth.
Our results further highlight the importance of policies and factors conductive to attract patent inven-tors. High quality, efficient and effective regulatory environment - mainly related to competition, taxation,finance, investment, and do businesses - job opportunities and early-stage entrepreneurship activity at thedestination country as well as intense trade activity are found to be important attractors for talented in-dividuals. To the extent that external knowledge is relevant for local innovation activity, we argue thatimmigration policies should be more conductive to welcoming skilled and innovative individuals.
The remainder of the paper proceeds as follows. Section 2 introduces the framework for analyzingmigration flows and the estimation technique. Section 3 discusses the data. Section 4 presents the results.Finally, section 5 summarizes the findings and concludes.
2. A Framework of Analysis
2.1. Modeling Migration FlowsThe decision of inventors to move is influenced by the comparison between expected utilities of the
origin and destination locations. Migrating across countries has costs, monetary and non-monetary. Thegeographical separation between countries proxies some of the distance-related costs such as the sunkcost of re-location that are difficult to measure empirically. Technological distance also proxies for costs ofadjusting in different (or similar) technological environments. Similarly, differences in culture, languageand religion, bring additional challenges and costs for the migrants. Other amenities of the host and origincountries can also shape the migrant’s expected utility.6 An inventor, therefore, will decide to move toanother country, if the expected utility of the destination country is greater than the expected utility of theorigin country.
We use a gravity-like equation to model migration flows, as conventionally has been proposed in the lit-erature.7 The micro-founded gravity model of international migration has arguably become the theoreticalworkhorse on which the majority of studies that examine the determinants of migrants’ location decisionare now based.8
We indicate as Flowsijt the flows of inventors between two countries, i (destination) and j (origin) at yeart. Therefore, for any country-pair i and j, we model the mobility of inventors to depend on geographic,technological, and cultural closeness, along with county-level factors, as follows:
6There are myriad non-economic factors that highly-skilled migrants likely value in their decision to move, such as the standardof living, the quality of schools, health services, infrastructure, presence of a well-established professional network among others(Papademetriou and Sumption, 2013).
7Gravity regressions have become very popular in analyzing trade flows (Anderson and van Wincoop, 2003; Helpman et al., 2008)primarily because they can be derived from an equilibrium model with optimizing firms.
8See, for instance, the studies of Grogger and Hanson (2011), Beine et al. (2011), Ortega and Peri (2013), and Mayda (2010).
3

Flowsijt = bi + b j + b1Neighbouring Countries [> 300 km]ij + b2Distance [< 1, 110 km]ij+
b3Distance [1, 110 � 1, 500 km]ij + b4Distance [> 1, 500 km]ij + b5Densityit + b6Densityjt
+b7 Inventorsit + b8 Inventorsjt + b9Zijt + eijt
(1)
where b j and bi are origin and destination, respectively, country fixed effects; Neighbouring Countries [>300 km] takes the value of 1 for flows exchanged between countries that share a common border andtheir geographical centers are located in a distance more than 300 km, and 0 otherwise; the generic termDistance [ ] denotes various distance classes and take the value of 1 for flows exchanged between countriesi and j that are located within a certain distance class, and 0 otherwise; Density is population over coun-try’s area; Inventors is the number of total inventors within a country; Z is a control vector that containstechnological, cultural and other country level factors; and, finally, e is an iid error term.
The coefficients b1 to b4 provide a characterization of how geographic factors shape inventor flowsacross countries. By model construction, each geographic coefficient captures the difference betweenknowledge flows diffused in geographic space to knowledge flows diffused within an area of 300 km.9We use the neighboring area of a country as a benchmark to perform comparisons of inventor mobilityflows across various distance classes. We opted for this distance taxonomy for the following reason: Thelongest distance between two neighboring countries in our sample is approximately 1,110 km and this is thedistance between the most populated cities of France and Italy, as the crow flies. There are also neighboringcountries that their geographic centers are located in less than 1,110 km; for instance Belgium (Brussels) andthe Netherlands (Amsterdam) are 174 km apart (as the crow flies). Therefore, neighboring countries arebroken down into two groups: Neighboring Countries [< 300 km] and Neighboring Countries [> 300 km],which take the value of 1 for flows exchanged between countries that do share a common border buttheir geographical centers are located in a distance less (more) than 300 km, and 0 otherwise. The cut-off value of 300 km was chosen simply because it gives equal number of neighboring countries withinthese two distance classes. We proceed till we exhaust the distance between the two farthest locatedcountries in our sample.10 The proposed classification, Distance [< 1, 110 km], Distance [1, 110 � 1, 500 km],and Distance [> 1, 500 km], allocates about equal number of countries in each distance class, which arenot neighbors, meanwhile keeping the number of classes as low as possible.11 Our benchmark distanceclass is the Neighboring Countries [< 300 km], and therefore not included in the model. All geographiccoefficients, consequently, will be compared to that benchmark area. For example, b1, the coefficient ofNeighboring Countries [> 300 km], captures the effect of geographic nearness of countries that share com-mon borders but are located in more than 300 km away, compared to flows exchanged in less than 300 km.Each one of the coefficients of the rest of the distance dummies, examines whether countries, located at aspecific distance class exchange less (or more) flows in comparison to flows that take place in an area of lessthan 300 km. One would expect that increasing geographic distance would reduce exchange among coun-tries, signaling that migration flows are bounded in space and characterized by spatial declining effect.12
As in any typical gravity model, we include the area and population or equivalently the density, Density( = Population/Area), of a country to control for the spatial distribution of economic activity (Frankel andRomer, 1999). Glaeser et al. (1995) argue that low density areas are highly attractive to migrant flows.One should expect, then, a negative influence of density on inventors inflows. However, it could be also
9As we do not have data on the mobility of inventors within a country, we use as a benchmark the 300 km ’neighboring’ area of acountry.
10The longest pair-country distance in our sample is the distance between Portugal and Japan: about 11,200 km and the shortestpair-country distance is between Slovakia and Austria: about 60 km.
11Alternative division of geographic space is not expected to modify results in any significant way. Continuous definitions ofdistance (e.g. polynomials) are not considered in this paper as we would like to stay close to the relevant literature (Peri, 2005;Mancusi, 2008), and further do not expect great loss of information.
12The localization of knowledge flows - exemplified by a variety of mechanisms such as citation, trade, and inventor flows - hasbeen considerably tested in the knowledge spillover literature, which has unanimously documented the geographic confinement ofknowledge diffusion (Jaffe et al., 1993; Peri, 2005; Thompson, 2006; Alcacer and Gittelman, 2006; Belenzon and Schankerman, 2013).
4

argued that dense urban areas may have a larger supply of producer and consumer amenities (Peruginiand Signorelli, 2010), so a positive effect of density might be also observed for the destination country andnegative for the origin. Further, we also include the total number of inventors, Inventors, to proxy for thesize of the labor market for inventors and to capture the job opportunities and synergies. We thereforeexpect a positive sign for inventors’ coefficient for the destination and a negative (or unambiguous) for theorigin country.
The Z-set includes variables that relate to the technological proximity and cultural similarity betweencountries as well as institutions and policies that could be attractive factors in both countries. Controllingfor the geographic distance, countries may exchange migration flows with each other simply because theyhave, for instance, similar technological efforts and/or technology specialization of production structuresor because they share common culture and roots or because some countries have very attractive conditionsand policies. Not accounting for such differences may lead to an overestimation of the geography effect.
Therefore, we also consider, along with the geographic proximity, the effect of the technological close-ness between two countries, which is proxied by two indices, technological effort and technological spe-cialization of production proximity.
More specifically, distance in the technological effort, TechE f f ortDistance, between two countries i andj for a given year, t, is proxied as13:
TechE f f ortDistance = ln R&DiScientistsi
� ln R&DjScientistsj
One would expect that the larger the technological distance, the bigger the inventor inflows, as hightechnological active places tend to be more attractive for inventors and generate more economic growth(Romer, 1986, 1989; Lucas, 2009).
The similarity in the technological specialization of production sectors, TechSpecialisationSimilarity,between two countries i and j for a given year t is proxied by the (uncentered) correlation of their patentprofiles and calculated as:14
TechSpecializationSimilarity =shi
0shjq
Â8s=1 sh2
is Â8s=1 sh2
js
where, sh are shares of patents issued in a technology field (out of eight, in total, fields) in countries iand j.
The constructed index ranges from zero (minimum similarity), which implies that the production struc-tures are orthogonal, to one (maximum similarity), which denotes identical sectoral structure (i.e., patent-ing in exactly the same sectors) in two countries. Researchers are expected to benefit more from otherresearchers who work in the same or related sectors (Bode, 2004). Consequently, one expects to find largerinventor flows between countries specialized in similar than in dissimilar sectors.
Another, less explored, proximity that could shape inventor flows is cultural closeness between coun-tries. Culture is history, religion, language, attitudes, values, beliefs and assumptions learned in earlychildhood that distinguish one group of individuals from another that can be critical also to innovationattitudes (Beck and Moore, 1985). The dominant view in the literature is that national culture has a strongimpact on organizational culture (Hofstede, 1980, 2001). Certain cultural norms and behaviors for instance,trust and openness, awards and rewards, autonomy and flexibility may facilitate an innovative climate inorganizations and help the organization to innovate more quickly, be agile in changing times, and get
13The level of technological capability of a region is often proxied in the literature (Peri, 2005) by the level of R&D activity andhuman capital (number of researchers). According to innovation-driven models of growth (Grossman and Helpman, 1991; Aghionand Howitt, 1998), R&D stimulates innovation and facilitates the imitation of others’ discoveries. Apart from contributing directly toinvention, human capital also accounts for aspects of innovation not captured by the R&D sector, including ‘learning-by-doing’ and‘on-the-job-training’ (Romer, 1989; Redding, 1996).
14Technological specialization proximity between two countries is measured as in Jaffe (1986). We first classify each patent, ac-cording to their primary international patent classification, in one of 8 technology fields (Human Necessities; Performing Operations,Transporting; Chemistry, Metallurgy; Textiles, Paper; Fixed Constructions; Mechanical Engineering, Lighting, Heating, Weapons,Blasting; Physics; and Electricity). Then, for each country, we create a patent profile by taking the vector of shares of patents issued intechnology field, Shi = (shi1, shi2, ..., shi8), for a given year.
5

products to market faster than competition, while other aspects can impede innovation process.15 Indi-viduals whose languages and religions share common roots may also share similar cultural backgrounds.Therefore, we introduce culture proximity in our model via language and religion similarity.
To construct a language similarity index, Linguistic Similarity, we assign each language of every coun-try in our sample to one of the six dominant Indo-European subfamilies, i.e., Germanic, Romance, Slavic,Baltic, Celtic and Greek, and one non Indo-European, the Uralic - the latter, includes Estonian, Finnish, andHungarian.16 The index gets the value of 1 if the country pair belongs in the same subfamily, and zerootherwise.
To construct an index of religion similarity, ReligionSimilarity, we follow Miguélez (2016) and proxyreligion similarity for each country pair, i, j and for a given year t, with an index built as follows:
ReligionSimilarityij = (%muslimi ⇤%muslimj)+ (%catholici ⇤%catholicj)+ (%orthodoxi ⇤%orthodoxj)+(%protestanti ⇤%protestantj)+ (%hinduismi ⇤%hinduismj)+ (%buddhisti ⇤%buddhistj)+ (%easterni ⇤%easternj)+(%judaismi ⇤ %judaismj)
The index ranges from 0 (no believers in common) to 1.Culture similarities tend to facilitate the formation of trust and mutual understanding of individuals,
smooth out communication problems, ease the screening of potential partners, help the managing andadministration of a common project and share similar attitudes towards approaching innovation. Inventorscan operate better in environments which are familiar in the way innovation is managed and supported.Therefore, we expect a positive association between cultural closeness between countries and inventormobility.
Additionally, we include country level factors that mainly relate to institutional environment and qual-ity that affect the innovation capabilities of a country and therefore the flows of inventors. Institutions areimportant conditions for financial development, which in turn associates with more innovation capabilities(Hsu et al., 2014), and for economic growth (Levine, 2004); they are also exogenous and therefore allevi-ate possible concerns of causality issues.17 The literature argues that the levels and modes of innovation aswell as the position of a place with respect to the technological frontier are shaped by the surrounding insti-tutions (Licht and Siegel, 2006; Busenitz et al., 2000; Edquist et al., 2001). Formal and informal governmentinstitutions, rules, regulations, laws, contracts, and policies affect economic incentives and thus the incen-tives to invest in technology, physical and human capital. They are also responsible for regulating learningprocesses, supporting the formation of mutual trust, facilitating the transmission of knowledge betweeninnovation agents (Acemoglu et al., 2005; Caselli and Coleman, 2001) and fostering economic growth.18 Weinclude the quality of regulations as a proxy of the institutional environment, which refers to regulationsrelated to finance and do businesses (regulatory burdens, competition policies, tax inconsistencies and taxdiscriminations, easiness of starting a business, financial and investment freedom).
15In his seminal study, Hofstede (1980) and subsequent studies (Herbig and Dunphy, 1998; Jones and Davis, 2000; Efrat, 2014)examine the effect of four dimensions of culture, i.e, power distance (acceptance of social stratification), individualism versus collec-tivism, masculinity, and uncertainty avoidance (the degree to which the members of a society feel uncomfortable with uncertaintyand ambiguity) on innovation activity. For example, the presence and level of social or organizational hierarchy, centralized power,formal vertical communication flows, top down control, formal rules and procedures, and resistance to change impede innovation.Further, individualistic societies value freedom more than collectivist societies and freedom is necessary for creativity. Characteristicsassociated with strong uncertainty avoidance, such as the need for consensus, formal rules and procedures, tend to inhibit innovationcapabilities.
16Germanic languages are spoken in central and northern Europe and include Danish, Dutch, English, German, and Swedish.Romance languages are spoken in western, southern European regions; they include French, Italian, Portuguese, Romanian, andSpanish. The Slavic languages are to be found in the central Europe and the Balkans in southern Europe. They include Bulgar-ian, Croatian, Czech, Polish, Slovak, and Slovene. The Baltic languages are Latvian and Lithuanian. The Celtic languages includeIrish. Finally, the Greek language which is spoken in Greece and Cyprus. Outside the Indo-European family, Estonian, Finnish andHungarian are Uralic languages. For further details, see www.ethnologue.com.
17Institutions have been used as proxies of economic and financial activity. Therefore, we refrain from using measures of output(for instance, gross domestic product) or financial development as these variables are endogenous and reverse causality could be aserious issue.
18Empirical evidence corroborates with the theoretical considerations. For instance, the study of Rodríguez-Pose and Cataldo (2014)finds that ineffective and corrupt governments represent a fundamental barrier for the innovative capacity and strongly underminingany potential effect of any measure aimed at promoting greater innovation.
6
We also include knowledge institutions proxied by the level and quality of human capital. Humancapital is an input in the innovation process and therefore serves as a complement to technology. Higherlevels of human capital lead to generation or diffusion of new technologies or to a more efficient adoption ofa given technology (Benhabib and Spiegel, 1994; Romer, 1990). Further, policies related to higher (tertiary)education could also be relevant for influencing the direction of inventor flows as higher level of educationleads to more economic growth (Aghion et al., 2009).
We further consider labor institutions and regulations but only for a subset of countries as data are notalways available. Labor regulations increase job security and greater enforceability of job contracts and,therefore, could increase worker investment in innovative activity; however, strict labor legislation alsoincreases firms’ adjustment costs, which may lead to underinvestment in activities that are likely to requireadjustment, including technologically advanced innovation (Griffith and Macartney, 2014).
Finally, we include the trade linkages between countries. The reason is that trade acts as conduit ofinformation and may also foster technological partnerships (Drivas et al., 2016). Particularly, imports offoreign capital and intermediate goods allow a recipient country to learn from the R&D-, or ‘technology’-content embodied in the traded good and consequently, merchandise trade serves as an important vehicleof knowledge exchange between trading partners (Grossman and Helpman, 1991; Eaton and Kortum, 2001;Keller, 2002; Caselli and Wilson, 2004).
2.2. Estimation ApproachThe first step of our analysis consists of estimating the coefficients of equation (1). As the response
variable is a discrete one with distribution that places the probability mass at non-negative integer values,count data models are suitable in this framework (Cameron and Trivedi, 2013).19
The most basic type of count data model is derived from the Poisson distribution and one can use aPoisson pseudo-maximum likelihood method of estimation. However, the Poisson distribution assumesequidispersion; that is, the conditional variance equals the conditional mean. In the case of overdispersion,which often appears due to the presence of individual unobserved heterogeneity in the data generatingprocess, the Poisson regression may lead to consistent, but inefficient estimates (Burger et al., 2009) withstandard errors biased downward (Cameron and Trivedi, 2013) and, therefore, a negative binomial (NB)estimation technique is more appropriate.
Although negative binomial (and count data, in general) models are explicitly designed to deal with thepresence of zeros in the dependent variable, these zeros may come from different data generating processes.In our context, the level of individual flows between countries is frequently zero. Small countries maynot show mobility of individuals with all possible partners or because statistical offices do not report suchflows below a certain threshold. The zero-inflated negative binomial (ZINB) model (Lambert, 1992; Greene,1994) applied to negative binomial models allows to better estimate a large amount of zero flows since itconsiders the existence of two groups within the population: the first having strictly zero counts and thesecond having a non-zero probability of having bilateral flows bigger than zero.
Consequently, our estimation approach, the ZINB model, may be viewed as a two-part extension, inwhich the distribution of the outcome is approximated by mixing two component distributions: the zero-inflated part that consists of a model to determine the probability of whether a particular origin-destinationflow will be zero or positive as a function of certain characteristics - a set of covariates that predict theprobability of belonging to the strictly-zero group20; and second the standard negative binomial gravitymodel to estimate the relationship between the mobility of flows and explanatory variables for each flowthat has a non- zero probability.21
19The logarithmic transformation of the data and OLS estimation techniques, often applied in gravity models, would lead to in-consistent estimates, as for some pairs of countries there is no exchange of inventors, making the logarithmic transformation of theseobservations impossible.
20Some factors may be more important in determining the increased utility because of the decision to move rather than the potentialvolume of bilateral flows. In principle, there is no formal restriction to including the same regressors both in the binary and thenegative binomial process, aside from possible theoretical considerations.
21Among others, Xiong and Beghin (2011) and Philippidis et al. (2013) have applied zero-inflated count models for the analysis ofinternational trade and Miguélez and Moreno (2014) for bilateral inventor flows.
7

We perform a number of tests to decide on the appropriateness of our estimation method. We firstexamine whether overdispersion is present and consequently negative binomial is preferred to poisson anddo a likelihood ratio (LR) test. Then, we assess whether the zero-inflated negative binomial is preferred toits poisson counterpart with the use of the Vuong statistic (Vuong, 1989).
The second step of our analysis is to estimate a knowledge function. In doing so, we first estimate equa-tion (1), using zero-inflated negative binomial estimation techniques as explained above, and calculate thefitted values. Then, we use these values as weights for the external accessible technological knowledge thatcomes from other countries via the moves of inventors, and assess the contribution of foreign knowledgeon a country’s innovation activity.
3. Data Description and Analysis
Our empirical analysis is based on 30 technologically advanced countries for the period 2000 to 2012.22
Data are obtained from a range of sources.Information on inventors’ mobility (Flows), defined as the number of countries a patent inventor changes
during lifetime every time she files for a new patent, is obtained from the World Intellectual Property Or-ganization (WIPO) Database, which is publicly available and described in detail by Miguélez and Fink(2013).23 An occurrence of inventor mobility is counted only if an inventor files for a patent either under adifferent owner (firm) or the same owner but in different country. We construct inventors’ mobility flowsby counting the number of occurrences in every year.24 From the WIPO dataset we also derive informationabout the total number of inventors per country.
Information on migrant flows (Flowsni), defined as the number of countries a migrant changes dur-ing her lifetime, is obtained from the Organization of Economic Cooperation and Development (OECD),International Migration Database.25 Data, however, we do not provide any further information on the com-position (engineers, doctors, scientists, etc) of these flows.
Geographical closeness (Neighbouring Countries [> 300Km] and various distance classes (of non-neighboring countries) denoted by Distance [ ]) is measured by the geographic distance (in kilometres) betweentwo countries’ geographical centers as the crow flies. This information is obtained from the Mayer andZignago (2011).26 Data on the geographical area and population to construct a country’s density (Density)- measured in millions of people per hundred thousands square km - are obtained from the World Bank,World Development Indicators (WDI).
Technological closeness between countries is proxied by their technological effort distance (TechE f f ortDistance) and by their technological specialization similarity (TechSpecializationSimilarity). To constructthe former, we use information on R&D expenditure and number of scientists (science, engineering, andhealth researchers) from the World Bank Science and Engineering State Profiles. To construct the latter, weallocate patents into eight technological fields based on International Patent Classification (IPC) system.Patents’ primary IPCs as well as patent file data are extracted from the OECD patent database, Science,Technology and Patents.27
Cultural closeness is proxied by language and religion similarities. To constructed the LinguisticSimilaritywe derive information from the Ethnologue Project28, while for the ReligionSimilarity the Central Intelli-
22These countries account for about 83% of the world’s R&D expenditure and 98% of its patenting (OECD, 2004). Countries in oursample are presented in Table A.1 in the Appendix.
23The WIPO maps migratory patterns of inventors extracted from information contained in patent applications filed un-der the Patent Cooperation Treaty (PCT). The database contains bilateral counts of "migrant inventors" for a large numberof years as well as a considerable number of "sending" and "receiving" countries. Information on the data is provided athttp://www.wipo.int/publications/en/series/index.jsp?id=138&sort=code.
24Mobility of inventors is measured in our paper through patent data. Clearly, our proposed measure does not include inventorsthat move without patenting.
25Only 22 (out of 30) countries have full information on bilateral migration flows for the period under investigation.26See "Notes on CEPII’s distances measures: The GeoDist database," CEPII Working Paper 2011-25, December 2011.27Available at https://stats.oecd.org/Index.aspx?DataSetCode=PATS_IPC.28Available at www.ethnologue.com.
8

gence Agency (CIA) World Factbook Dataset provides the percentage of population adhering to one of eightmajor religions.29
Data on a country’s institutions (Institutions), proxied by the ’regulatory quality’, are obtained from theWorld Bank, Worldwide Governance Indicators (WGI). The regulatory quality index captures perceptions ofthe ability of the government to formulate and implement sound policies and regulations that permit andpromote private sector development.30 For sensitivity, we also use the ’ease of doing business’ indicatorfrom the World Bank that captures all steps required to start a business in a country, and the ’rule of law’from the WGI that captures perceptions of the extent to which agents have confidence in and abide by therules of society and in particular the quality of contract enforcement, property rights, the police, and thecourts.
Knowledge is proxied by human capital (HumanCapital) and by government policies to enhance it.We use data on public spending on tertiary education (% GDP) obtained from the World Bank, WorldDevelopment Indicators to proxy governments’ knowledge-supporting policies. For robustness analysis andfor a limited number of countries in our sample due to data limitations, we use the share of population inscience, technology, engineering and mathematics at the manufacturing sector (STEM) from the Eurostatand human resources devoted in science and technology (HRST) as a share of the active population in theage group 25-64 from the OECD.
We also considered labor institutions. Data, however, were available only for a limited number ofcountries and years. Information on the strictness of employment protection legislation (EPL) for overall,regular, and temporary employment comes from the OECD Employment Database.31
Finally, bilateral merchandise trade flows (Trade) are derived from the OECD Structural Analysis (STAN)Bilateral Trade Database.
For the second stage of our analysis, we need information on a country’s innovation activity. Com-monly in the literature, innovation activity is proxied by patents. Information on the numbers of patentapplications (Patents) per country is derived from the WIPO database, WIPO Patent Report: Statistics onWorldwide Patent Activity.
Table A.2 in the Appendix provides summary statistics of the variables. For every pair of countries,in a given year, there are, on average, 18 occurrences of inventors’ mobility compared to almost 2,082moves of non-inventor migrants. On average, there are 9,300 inventors in each country. Each pair ofcountries is, on average, 5.5% likely to be neighboring with each other and to be located in more than 300km away from each other, 22.5% within a distance of 300 to 1,110 km, 16% in a distance of 1,110 to 1,500km, and 5.4% further than 1,500 km. The average country’s density is 13.6 million people per hundredthousands square km. In terms of technological effort, countries, on average, appear to be less distantthan the maximum potential distance, but not quite close in terms of technological specialization in theirproductions. On average, for a given pair of countries there are large cultural, in terms language andreligion, and institutional differences. Further, countries spend on average 1.3% of their GDP on tertiaryeducation and file for 105 patents per year. Finally, the trade intensity between any two countries is about4% of their total trade.
Figure 1, below, shows the inventor inflows for the period 2000-2012.
Intense inventor flows (dark blue) are concentrated in few OECD countries; US, Germany, France andthe UK attract large flows of inventors, whereas Greece, Portugal and Spain the least.
29Available at https://www.cia.gov/library/publications/the-world-factbook/30Regulatory quality index is a synthesis of policies and regulations related to finance and do businesses, namely regulatory bur-
dens, competition policies, tax inconsistencies and tax discriminations, easiness of starting a business, financial and investment free-dom among others.
31The employment protection legislation measures the procedures and costs involved in dismissing individuals or groups of work-ers and the procedures involved in hiring workers on fixed-term or temporary work agency contracts. EPL refers a dimension of acomplex set of factors that influence labour market flexibility. The EPL index ranges from 0 (least restrictive) to 6 (most restrictive).
9

Figure 1: Inventor Inflows in Technologically Advanced Countries, 2000-2012
�����������@������������@����������@>����@1R�GDWD
The country pairs with the highest exchange of inventors across all countries and over our time spanare shown in Figure 2.
Figure 2: Top 5% Inventor Flows Across Technologically Advanced Countries, 2000-2012
10
There are 68 (out of 870) country pairs that inventors’ mobility between them is very high; on average,more than 70 occurrences per year - these occurrences lie at the top 5% of the inventor flows distribution.This indicates that high inventors’ mobility is observed across very few countries in the OECD group. AsTable A.3 in the Appendix shows, large inventor flows are observed from Canada to the US (21,837 occur-rences), UK to US (17,424), Germany to Switzerland (9,719), Korea to the US (8,617), and Germany to theUS (1,204). In Europe, the highest inventor flows are observed from France to Switzerland (3,273), Austriato Germany (3,147), France to Germany (3,039), and Germany to the Netherlands (2,498). Overall, coun-tries that exhibit the highest inflows of inventors are also the ones with the highest outflows. Inventors,and subsequently the knowledge they carry, move across a small number of developed countries. Finally,a consistent finding that emerges is that countries, which are top ranked in patents, and R&D spendingare also the ones that have high inventor mobility, with the US to be by far an outstanding attractor ofinventors.
4. Empirical Results
This section presents our results. First, we examine the effect of various types of proximities and otherinstitutional mainly factors in shaping international flows of inventors, and, second, whether these flows,and the knowledge they carry, have an impact on countries’ innovation activity.
4.1. What Shapes the Moves of Highly Skilled Migrants?Table 1 reports zero-inflated negative binomial (zinb) estimates of inventor migration flows of equation
(1). We begin by reporting conventional gravity model estimates, where the bilateral flows of inventorsare shaped only by geographic proximity between countries, and then proceed gradually by adding othertypes of proximities and other factors, all included in the Z set. More specifically, geographic proximityestimates are reported in column (1), technological proximity in column (2), cultural proximity in column(3) and, finally, column (4) combines all previous along with a number of country level variables. Theequivalent logit estimates are also reported.
Before embarking on analyzing our results, we run some tests to ensure that the zinb model is the mostappropriate one. For this reason, we perform and report at the bottom of each regression in Table 1 somestatistics. First, we test whether there is overdispresion in our sample; in presence of no overdispresion(i.e., mean is equal to variance) poisson estimation is the appropriate method. The likelihood ratio (LR)test rejected the null hypothesis of no overdispersion in all specifications. Next, we test between negativebinomial and zero-inflated negative binomial models. The Vuong test performed is in favor of the nullhypothesis of zero-inflated model to accommodate our estimations to the excess of zeros.
One would interpret the coefficients of a zero-inflated negative binomial model as in a standard neg-ative binomial regression - all coefficients can be interpreted as elasticities once they are exponentiated.32
The interpretation of the logit estimates is somewhat different: if a logit regressor was to change by onepoint, while holding all other variables in the logit model constant the odds of belonging to the ’strictlyzero group’, i.e., the zero-bilateral mobility in our case, would change by a factor equal to the exponenti-ated corresponding coefficient.
Comparing the geographical estimates across columns in Table 1, once other proximities are controlledfor, the role conferred on geographic distance slightly alters, confirming our concerns that a bias is intro-duced, if these factors are neglected. Geographical and other distances may partially overlap, but eachfeature has a different, independent effect on mobility. Overall, as one can note, all coefficients mildly varyacross specifications; consequently we will focus on the estimates of column (4), as it contains all proposedproximities and controls.
32To convert each value to percentage change, we use the exponential formula, eb. In case regressors are already in logarithmicterms, their coefficients are already elasticities. See Cameron and Trivedi (2013, p. 95).
11

Table 1: ZINB Estimates of International Inventor Mobility (dep. var.: Flowsijt)
(1) (2) (3) (4)NB logit NB logit NB logit NB logit
Neighbouring Countries [> 300Km] -0.615** 18.98*** -0.609** 15.70*** -0.601*** 16.27*** -0.595*** 11.08***(0.247) (1.986) (0.242) (1.098) (0.215) (1.145) (0.205) (1.771)
Distance [< 1, 110Km] -1.469*** 2.177 -1.442*** 13.87*** -1.089*** 14.45*** -0.946*** 11.08***(0.211) (1.679) (0.207) (1.087) (0.207) (1.238) (0.198) (1.315)
Distance [1, 110 � 1, 500Km] -1.670*** 4.472 -1.654*** 13.74*** -1.253*** 14.20*** -1.073*** 11.26***(0.222) (5.747) (0.217) (1.364) (0.213) (1.742) (0.206) (1.298)
Distance [> 1, 500Km] -2.326*** 19.32 -2.277*** 15.41*** -1.799*** 15.77*** -1.602*** 10.15***(0.237) (12.34) (0.231) (0.714) (0.227) (1.048) (0.220) (1.488)
Densityi -0.037 0.015 -0.044 0.057*** -0.061 0.058*** -0.037 0.039***(0.051) (0.035) (0.051) (0.016) (0.051) (0.015) (0.050) (0.013)
Densityj -0.075* -0.156*** -0.076* -0.080*** -0.080* -0.074*** -0.084* -0.092***(0.045) (0.053) (0.046) (0.020) (0.046) (0.018) (0.044) (0.018)
lnInventorsi 0.876*** -0.598*** 0.840*** -0.311** 0.821*** -0.332*** 0.853*** -0.194(0.068) (0.137) (0.070) (0.125) (0.071) (0.119) (0.071) (0.130)
lnInventorsj 0.177*** -0.893** 0.231*** -0.677*** 0.220*** -0.660*** 0.250*** -0.414***(0.059) (0.383) (0.061) (0.133) (0.059) (0.119) (0.058) (0.144)
TechE f f ortDistance 0.403*** -0.622*** 0.388** -0.637*** 0.365*** -0.055(0.115) (0.221) (0.185) (0.231) (0.112) (0.316)
TechSpecialisationSimilarity 0.590** -7.621*** 0.578*** -6.981*** 0.531*** -2.774**(0.294) (1.637) (0.080) (1.333) (0.191) (1.167)
LinguisticSimilarity 0.294*** -12.99*** 0.265*** -0.170(0.073) (1.943) (0.089) (0.736)
ReligionSimilarity 0.305*** -0.454 0.298*** -0.892(0.010) (1.353) (0.096) (0.987)
Tradeij 0.330** -19.3**(0.155) (8.415)
Institutionsi 0.199* -2.262***(0.111) (0.489)
Institutionsj 0.016 0.416(0.110) (0.669)
HumanCapitali 0.023 0.855**(0.114) (0.392)
HumanCapitalj 0.099 -0.056(0.115) (0.458)
Observations 11,310 11,310 11,310 11,310 11,310 11,310 11,310 11,310Nonzero observations 5,056 5,056 5,056 5,056 5,056 5,056 5,056 5,056LR test for overdispresion 36,000 35,000 28,000 28,000p-value 0.000 0.000 0.000 0.000Vuong statistic 3.89 5.93 6.34 8.80p-value 0.000 0.000 0.000 0.000McFadden’s R2 0.300 0.303 0.308 0.313
All regressions include origin and destination country and year fixed effects; Coefficients of constant term are omitted forbrevity; All regressors are one period lagged; Robust standard errors in parentheses; (***): p<0.01, (**): p<0.05, (*): p<0.1significance at 1%, 5% and 10%, respectively. Overdispersion LR tests largely reject the null hypothesis of no overdispersion.Vuong statistic favors the hypothesis of zero-inflated model. The set of covariates in the logit specifications that predict theprobability of belonging to the strictly-zero mobility group are the same regressors as in the negative binomial model.
12
Each geographic coefficient captures the difference between knowledge flows diffused in geographicspace to knowledge flows within an area of 300 km, which is our benchmark area. For example, thecoefficient of Neighboring Countries [> 300Km] implies that neighboring countries that their geographiccenters are located in more than 300 km apart, exchange about 45% (=1 - e�0.595) less inventors to whatthey would exchange within a distance of 300 km. In other words, on crossing a distance of 300 km, knowl-edge, based on inventor flows, diminishes to about 55%. Further, the coefficient of Distance [< 1, 110Kmshows that non-neighboring countries that their geographic centers are located within 1,110 km exchangeabout 61% (=1 - e�0.946) less knowledge than what neighboring countries with their geographic centerslocated less than 300 miles apart would exchange. The coefficients of Distance [1, 110 � 1, 500Km] andDistance [> 1, 500Km] show that as distance grows the flows of inventors are further dissipated; the ex-change of inventors between countries that their geographic centers are located between 1,1100 and 1,500km (more than 1,500 km apart) drops to 34% (20%) compared to what they would exchange if their geo-graphical enters were located within a distance of 300 km.
In sum, geographic proximity plays an important role in shaping the spatial location choices of migrantinventors. The general finding in the literature of the geographic localization of knowledge flows, exem-plified via inventors’ moves (Miguélez and Moreno, 2014; Drivas et al., 2016)33 or via other mechanisms,namely patent citations (Jaffe et al., 1993) and merchandises trade (McCallum, 1995), also finds support inour study.34 Distance could be seen as informational barrier and serves as proxy for all types of informa-tional frictions. Agents within a close geographical distance tend to know much more about each otherand each other’s business, technologies, and cultures because of higher direct interactions between theircitizens.
Irrespective of the geographic distance, the presence of inventors in the origin and, most important, inthe destination country positively associates with inventor moves. Holding all other variables constant,a one percent increase in the number of inventors in the host country (lnInventorsi) would lead to about0.85% increase in the inventor inflows.35 This is because the size of the inventors’ community reflects jobopportunities and synergies among inventors and therefore is an attractive feature of the recipient country(Maggioni and Uberti, 2009; Miguélez, 2016; Miguélez and Moreno, 2013a). Countries that have a largepool of inventors, attract more inventors as well as send more inventors out (about 0.25% for a one percentincrease in the number of inventors at home), as the estimate of the number of inventors in the origincountry (lnInventorsj) indicates. Furthermore, the density (Density) of the population in the destinationor origin country appears to be negatively related with the flows of inventors. However, only the origin’scountry density is statistically significant; the more dense is the home country, less inventors move out.Arguably, dense, urban areas may have a larger supply of scientists, producer and consumer amenities,and therefore such association could be observed.
Besides the geographical proximity, countries located close to each other may exchange more knowl-edge with each other simply because of the technological effort they pour and/or technological similarityspecialization in their production. As the literature has argued, investment in R&D and human capitalmakes a region attractive to talented individuals Lucas (1988). This is indeed what our results support;a one unit increase in technological effort distance, TechE f f ortDistance, between countries, increases in-ventor inflows at the host country by about 44%. A country may also receive more inventor flows from
33The studies of Miguélez and Moreno (2014) and Drivas et al. (2016) examine the effect of geographic proximity on inventor flowsin Europe and the US, respectively. Both studies document a strong geographic effect on the stretch of inventors’ flows. For example,the study of Miguélez and Moreno (2014) find the geographic impact to range from -1.45 to -1.54, which is somewhat larger than ours(-0.595 to -1.602) and Drivas et al. (2016) show only 1.7% of knowledge embodied in inventors crosses the vicinity of 500 miles andthis percentage remains unaltered for any farther traveled distance implying that the die-out effect is large and sharp.
34Patent-citation literature, initiated by the seminal work of Jaffe et al. (1993) and followed by numerous subsequent studies(Branstetter, 2001; Peri, 2005; Mancusi, 2008), traces-out technological learning via citations of patents. The principal assumptionis that a citation from a patent to another indicates that inventors of the latter patent knew and used the former. A separate volumeof literature has documented the negative impact of geographic distance and borders on the flows of merchandize trade (McCallum,1995; Wolf, 2000; Chen, 2004).
35The logit coefficient can be read as follows: A one percent increase in the number of inventors in the host country leads to a 0.19%decrease in the probability of belonging to the "strictly zero" group - that is, the probability of zero bilateral mobility.
13

another country with technological sector specialization as itself than from a country with completely dis-similar technological specialization production structure. Specifically, a unit increase in structural simi-larity, TechSpecialisationSimilarity (i.e., countries become perfectly identical with respect to their patentportfolio), increases the exchange of inventors by about 70% compared to countries with completely mis-matched patent portfolio. Apparently, technological specialization is important for inventor’s mobility asinventors are expected to benefit more from other inventors who work in the same or related technologies(Bode, 2004; Peri, 2005).
Cultural closeness between origin and destination country also shapes the flows of inventors. As thecoefficient of the LinguisticSimilarity shows countries that share common language are about 30% moreprobable to attract inventor flows than countries that do not. Somewhat greater is the effect of religionsimilarity (ReligionSimilarity). Countries with identical religion composition exchange about 35% moreinventors than countries with virtually no common religion background. These findings are in line withother related studies (Ortega and Peri, 2013; Miguélez and Moreno, 2014) that corroborate the significanceof common cultural roots for the individuals’ mobility. The empirical trade literature also documents ev-idence on the role of religious bonds between trading partners in shaping bilateral trade flows De Grootet al. (2004). Besides of making people feel more ’at home’, cultural affinities facilitate the development oftrust and networks of economic agents, smooth out communication problems and help the managing andadministration of a common project.
Bilateral trade linkages between countries is also an important contributor. A one percent increasein the bilateral trade intensity increases inventors’ mobility between the trading partners by almost 39%.Trade may itself be a cause of innovative activities, as predicted by global-economy models of endogenousinnovation and growth (Grossman and Helpman, 1991; Young, 1991). More innovation could also relate tomore flows of inventors as certain links and information contacts are developed between trading partners.
Institutional variables, quality of government regulations and knowledge (human capital), carry theright sign; the better they are, the more attractive a place becomes. However, only the quality of regulationsat the host country has a statistically significant effect as one unit increase of their quality associates with a22% increase in the inventor inflows.
Table A.4 in the Appendix explores further the sensitivity of our results by using alternative proxiesfor the institutional environment and human capital. However, in all sensitivity analyses we perform,the number of observations drop ed almost by half, due to data limitations. Regarding human capitaland the public spending on tertiary education measure used here, we employ, in column (1), the shareof population in science technology engineering and mathematics (STEM) (Ortega and Peri, 2013) and,in column (2), the human resources devoted in science and technology (HRST) (Miguélez and Moreno,2014). Estimates carried the expected sign but only the HRST at destination was found to be statisticallysignificant with a 3.5% association with inventor inflows.36
Additionally, we explore labour market institutions on shaping inventors’ mobility and particularly theemployment protection legislation (EPL). According to column (3), we find that the stricter the EPL atthe host country, the larger the inflow of inventors is, as a one unit increase in the stringency of the EPL,associates with a 12.7% increase in the inventors’ inflows. Different patterns of innovation specializationcould require different types of labour market regulations. For instance, in incremental innovation patterns(as it is mainly the case in Germany), stable and cooperative relationships between employers and employ-ees are functional to the incremental path, while in countries which specialize in emerging radically newtechnologies (for instance, UK and US) more relaxed EPL is conductive to this path (Soskice, 1997).37 Fur-thermore, we examine whether Eurozone or Schengen membership associates with more flows. Estimatesare shown in column (4). We find that Schengen countries exchange about 19% more inventor flows com-pared to non-member countries. Eurozone membership has also a positive but statistically insignificant
36In place of quality of regulations, we also used an index that captures the easiness of doing business; estimates, available uponrequest, were statistically insignificant and size-wise similar to the substituted variable.
37Empirical evidence by Griffith and Macartney (2014) shows that the optimal level of investment in radical innovation decreaseswith EPL, but that the optimal level of investment in incremental innovation increases with EPL.
14
impact.38
Finally, we re-estimate our zero-inflated negative binomial model using different sub-sets of covariatesin the logit part of the model. Results, available upon request, did not change in any significant man-ner. Overall, our results remain stable across different specifications, alternative definitions and differenttaxonomies of distance.
Summing up, geographic proximity, technological closeness and cultural similarity across countries ap-pear to greatly shape the flows of inventors with the technological similarity in the production structure toexert the largest influence. Furthermore, the size of inventors community at the host country, intense bi-lateral trade linkages and quality institutions, regulations in particular, are conductive factors to attractinghighly skilled migrants.
4.1.1. What Shapes the Moves of Inventors from the Top and Less Innovative Countries?An interesting question to explore is whether the importance of the aforementioned proximities and
institutional mainly factors vary across different flows of inventors: inventors, who move from the mostinnovative countries, i.e., in our sample these countries are: US, Japan, Korea, Germany and Canada, whichrank very high in R&D spending and number of patents and together account for more than 90% of theWIPO patents, elsewhere and those who move from the rest, the less innovative, countries of our sample.
Table 2 presents the results. The first two columns report estimates of inventor flows only from the topfive most innovative to less innovative countries (column 1) and to all countries (column 2), while the lasttwo columns report estimates of inventor flows from less innovative countries to top five most innovative(column 3) and to all countries in our sample (column 4).
Inventors from top innovative countries are found to be less geographically restricted than inventorsfrom the ’average’ country as the comparison of geographic estimates reported in Table 2 and Table 1,respectively, reveal. A finding that becomes even stronger for inventors from less innovative countrieswhen they move to top 5 most innovative ones as estimates in column (3) document. Apparently, frontiercountries are attractive places to inventors from less technologically advanced countries irrespective ofthe geographic distance. In contrast, geography exerts the heaviest toll on inventors’ moves from lessinnovative countries to all countries in our sample, as estimates in column (4) show.
The main driver of an inventor from a top innovative country to relocate is the technological proximityand particular the technological production similarity. In fact, it is about five times more important to an in-ventor from a top innovative country than to an inventor from the ’average’ country. Cultural proximity isless important to inventors from top innovative economies compared to inventors from the ’average’ coun-try; the former, value institutions at the host country way more than latter as well as the job opportunities(number of inventors) at the destination.
What mobilizes inventors from less technologically advanced countries is again the technological sim-ilarity in the production structures of home and host country. Its effect is up to four times times strongercompared to an inventor from the ’average’ country. Cultural proximity appears to be more important tothis group of inventors than to inventors from an ’average’ country. Economic factors and policies suchas intense trade linkages between inventor’s country of origin and destination and public spending ontertiary education, at the host, increase the chances for this set of inventors to move abroad.
38We further considered additional controls, namely taxes and wages. Our estimates shown that higher top marginal tax rateat the host (home) country relates negatively (positively) to inventor inflows (outflows), as expected, but results were statisticallyinsignificant. Perhaps, such differences would be of importance for just a share of inventors, the very top ones (Akcigit et al., 2016).Similar evidence was supported for the wages.
15

Table 2: ZINB Estimates of International Inventor Mobility from Most and Least Innovative Countries (dep. var.: Flowsijt)
From top 5 most innovative toa From 25 less innovative tob
Low 25 All Top 5 All(1) (2) (3) (4)
Neighbouring Countries [> 300Km] -0.382 -0.114 -0.141 -0.664***(0.304) (0.378) (0.434) (0.208)
Distance [< 1, 110Km] -0.765*** -0.758** -0.148 -0.991***(0.275) (0.371) (0.445) (0.215)
Distance [1, 110 � 1, 500Km] -0.945 -0.828 -0.129 -1.145***(0.269) (0.343) (0.463) (0.218)
Distance [> 1, 500Km] -1.510*** -1.503*** -0.389 -1.207***(0.367) (0.425) (0.494) (0.242)
Densityi -0.055 -0.032 0.652* 0.030(0.108) (0.087) (0.373) (0.060)
Densityj 0.389*** -0.421*** -0.067 -0.158***(0.102) (0.152) (0.086) (0.057)
lnInventorsi 0.801*** 0.858*** 0.248 0.820***(0.166) (0.130) (0.330) (0.090)
lnInventorsj -0.445* -0.283 -0.917 -0.158**(0.228) (0.188) (0.852) (0.068)
TechE f f ortDistance 0.366 0.340 0.193 0.178(0.292) (0.263) (0.208) (0.130)
TechSpecialisationSimilarity 1.644** 1.249*** 1.352** 0.533*(0.743) (0.656) (0.575) (0.304)
LinguisticSimilarity 0.317*** 0.328*** 0.451*** 0.486***(0.060) (0.068) (0.174) (0.183)
ReligionSimilarity 0.604 0.544 0.619 0.504***(0.724) (0.964) (0.693) (0.111)
Tradeij 0.457 0.432 3.514 0.571***(0.342) (0.423) (2.298) (0.190)
Institutionsi 1.059*** 0.791** 0.933 0.911(0.390) (0.376) (0.806) (0.814)
Institutionsj -0.345 -0.125 -0.123 -0.189(0.580) (0.510) (0.206) (0.158)
HumanCapitali 0.232 0.222 0.495*** 0.174(0.201) (0.188) (0.143) (0.136)
HumanCapitalj 0.331 0.686 0.160 0.101(0.333) (0.688) (0.183) (0.128)
Observations 1,625 1,885 1,625 9,425Nonzero observations 797 1,056 1,058 4,000LR test for overdispresion 1,708 5,558 3,907 13,000p-value 0.000 0.000 0.000 0.000Vuong statistic 4.48 3.34 5.24 6.18p-value 0.000 0.004 0.000 0.000McFadden’s R2 0.358 0.331 0.307 0.322
All regressions include origin and destination country and year fixed effects; Constant and logit coefficients are omit-ted for brevity; All regressors are one period lagged; Robust standard errors in parentheses; (***): p<0.01, (**): p<0.05,(*): p<0.1 significance at 1%, 5% and 10%, respectively. Overdispersion LR tests largely reject the null hypothesis of nooverdispersion. Vuong statistic favors the hypothesis of zero-inflated model. The set of covariates in the logit speci-fications that predict the probability of belonging to the strictly-zero mobility group are the same regressors as in thenegative binomial model.a Inventor flows only from top five most innovative countries were included as senders (origin). Top innovative coun-tries are US, Japan, Korea, Germany and Canada. The remaining 25 countries were included as receivers (destination)in column (1) and all countries of our sample in column (2).b Inventor flows only from 25 less innovative countries were included as senders (origin). Column (3) reports estimateswhen the destination is the top five most innovative countries, while column (4) reports estimates when destination isall countries of our the sample.
16

Summing up, splitting the flows of inventors by the technological performance of the country of origin,it is the technological proximity, and specifically technological similarity that greatly shapes both sets offlows - particularly that of inventors from technologically frontier countries. Cultural proximity is moreimportant to inventors from less than to inventors from more innovative countries. The latter, are lessgeographically restricted than inventors from the ’average’ country, while inventors, who originate fromless prosperous in innovation backgrounds and aim to move to frontier countries, gravity plays no role atall. Inventors’ community at the destination is important for inventors from both less and top innovativeeconomies; the quality of institutions at the destination is crucial factor for the former group, while humancapital at the host country is significant for the latter group of inventors.
At this point, we can visualize some of our results with the use of a graph. Figure 3 below depictsthe estimated (dashed line) along with the actual (bold line) values of the geographic distance on inventorflows. The first panel shows the actual and estimated decay of inventor flows moving out of a nearby areaof 300 Km, 1,110 Km, and 1,500 Km. In similar fashion, the second and third panel present inventor flowsoriginating only from the most and the least values countries, respectively.
���
����
$OO�,QYHQWRU�)
ORZV
&ORVH�1HLJKERUV /RQJ�1HLJKERUV ������NP ���������NP !����NP
,QYHQWRU�)ORZV��DFWXDO�,QYHQWRU�)ORZV��ILWWHG�
���
����
,QYHQWRU�)ORZV��PRVW�LQQRYDWLYH�FRXQWULHV�
&ORVH�1HLJKERUV /RQJ�1HLJKERUV ������NP ���������NP !����NP
,QYHQWRU�)ORZV��DFWXDO��7RS�WR�/RZ,QYHQWRU�)ORZV��ILWWHG��7RS�WR�/RZ
���
����
,QYHQWRU�)ORZV��OHVV�LQQRYDWLYH�FRXQWULHV�
&ORVH�1HLJKERUV /RQJ�1HLJKERUV ������NP ���������NP !����NP
,QYHQWRU�)ORZV��DFWXDO��/RZ�WR�7RS,QYHQWRU�)ORZV��ILWWHG��/RZ�WR�7RS
Figure 3: Decay of Inventor Flows Due to Geographical Distance
The graphical evidence confirms the significant drop in the mobility of inventors for distances largerthan 700 km. Within a distance of 700 km, there are four pairs of countries (Czech Republic and Germany,USA and Canada, Germany and Austria, and Germany and France) that exchange large flows of inventorsand drive upwards the graph. Overall, knowledge flows, exemplified by the mobility of inventors, arerather geographically confined in space. Furthermore, one can observe that actual and estimated valuesare very close to each other indicating a good fit of our model.
4.1.2. Comparison: What Shapes the Moves of Non-inventor Migrants?As an exercise, in one common framework described by equation (1), we also study the flows of non-
inventor migrant individuals (Flowsni ijt). As not all 30 countries in our sample provide information onsuch migration flows, we narrow down our analysis to 22 countries.39 Estimates of non-inventor migrantflows are presented in column (2) of Table 3, above. For comparison purposes, column (1) reports estimatesof equation (1) of inventor flows, but for the new sample of 22 countries.
Before embarking on the analysis, we would like to briefly discuss first some descriptives of non-inventor migrant flows. Over our sample period 2000-2012, an average pair of countries has exchangedabout 2,082 migrant individuals. As shown in Table A.5 in the Appendix, the countries with the largestinflows are Germany (3,540,019), the UK (1,313,663) and Spain (962,090) in Europe and the US (1,183,853)and Japan (938,482). High mobility is observed between 38 (out of 459) country pairs (top 5% of the migrantflows distribution) - that is more than 9,974 occurrences per year. Large migrant flows are reported fromPoland to Germany (1,577,493), Korea to Japan (326,161), Italy to Germany (300,308), US to Japan (286,365)and Korea to the US (280,900). Figure A.1 in the Appendix graphs country interactions (network) with thelargest migrant moves.
39Due to lack of data, we dropped out eight countries: Bulgaria, Cyprus, France, Estonia, Greece, Hungary, Ireland and Portugal.
17
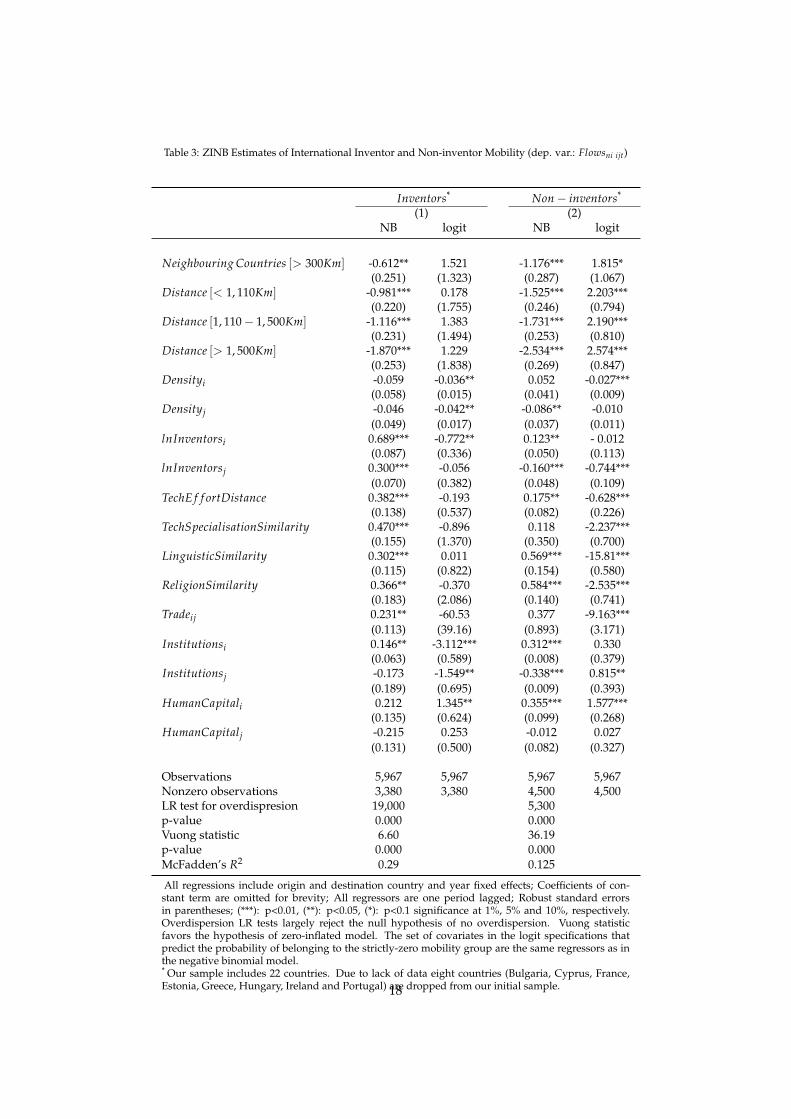
Table 3: ZINB Estimates of International Inventor and Non-inventor Mobility (dep. var.: Flowsni ijt)
Inventors* Non � inventors*
(1) (2)NB logit NB logit
Neighbouring Countries [> 300Km] -0.612** 1.521 -1.176*** 1.815*(0.251) (1.323) (0.287) (1.067)
Distance [< 1, 110Km] -0.981*** 0.178 -1.525*** 2.203***(0.220) (1.755) (0.246) (0.794)
Distance [1, 110 � 1, 500Km] -1.116*** 1.383 -1.731*** 2.190***(0.231) (1.494) (0.253) (0.810)
Distance [> 1, 500Km] -1.870*** 1.229 -2.534*** 2.574***(0.253) (1.838) (0.269) (0.847)
Densityi -0.059 -0.036** 0.052 -0.027***(0.058) (0.015) (0.041) (0.009)
Densityj -0.046 -0.042** -0.086** -0.010(0.049) (0.017) (0.037) (0.011)
lnInventorsi 0.689*** -0.772** 0.123** - 0.012(0.087) (0.336) (0.050) (0.113)
lnInventorsj 0.300*** -0.056 -0.160*** -0.744***(0.070) (0.382) (0.048) (0.109)
TechE f f ortDistance 0.382*** -0.193 0.175** -0.628***(0.138) (0.537) (0.082) (0.226)
TechSpecialisationSimilarity 0.470*** -0.896 0.118 -2.237***(0.155) (1.370) (0.350) (0.700)
LinguisticSimilarity 0.302*** 0.011 0.569*** -15.81***(0.115) (0.822) (0.154) (0.580)
ReligionSimilarity 0.366** -0.370 0.584*** -2.535***(0.183) (2.086) (0.140) (0.741)
Tradeij 0.231** -60.53 0.377 -9.163***(0.113) (39.16) (0.893) (3.171)
Institutionsi 0.146** -3.112*** 0.312*** 0.330(0.063) (0.589) (0.008) (0.379)
Institutionsj -0.173 -1.549** -0.338*** 0.815**(0.189) (0.695) (0.009) (0.393)
HumanCapitali 0.212 1.345** 0.355*** 1.577***(0.135) (0.624) (0.099) (0.268)
HumanCapitalj -0.215 0.253 -0.012 0.027(0.131) (0.500) (0.082) (0.327)
Observations 5,967 5,967 5,967 5,967Nonzero observations 3,380 3,380 4,500 4,500LR test for overdispresion 19,000 5,300p-value 0.000 0.000Vuong statistic 6.60 36.19p-value 0.000 0.000McFadden’s R2 0.29 0.125
All regressions include origin and destination country and year fixed effects; Coefficients of con-stant term are omitted for brevity; All regressors are one period lagged; Robust standard errorsin parentheses; (***): p<0.01, (**): p<0.05, (*): p<0.1 significance at 1%, 5% and 10%, respectively.Overdispersion LR tests largely reject the null hypothesis of no overdispersion. Vuong statisticfavors the hypothesis of zero-inflated model. The set of covariates in the logit specifications thatpredict the probability of belonging to the strictly-zero mobility group are the same regressors as inthe negative binomial model.* Our sample includes 22 countries. Due to lack of data eight countries (Bulgaria, Cyprus, France,Estonia, Greece, Hungary, Ireland and Portugal) are dropped from our initial sample.18

There are couple of points worth noting in this exercise. First, the geographic stretch of non-inventormigrant individuals is smaller than that of highly skilled migrants. For example, the flows of non-inventormigrants on crossing neighboring countries that their geographic centers are located more than 300 kmapart diminish to about 30% (= e�1.176) to its in-300 area level, whereas the flows of inventors diminish to54% for the same distance, as the coefficients of Neighboring Countries [> 300Km] indicate. Similarly, theflows of migrants (inventors) that cross a distance of 1,500 km drop to 8% (15%) to what would flow withina distance of 300 km. The relative geographic stretch of skill is also confirmed by the study of Czaika andParsons (2015), who examine migrations policies and geographic effects on the mobility of skillful and lessskillful ordinary migrants.
Second, technological proximity, as expected, matters more for inventors than for non-inventor mi-grants; nevertheless it is also relevant for the latter. Our results show that a one unit increase in tech-nological effort distance between countries, increases the inflows of migrants (inventors) by 19% (47%).Apparently, the technological level of the destination country and its distance to the origin is relevantfor non-inventor migrants as in this group there are individuals who are technically skilled (scientists,researchers, engineers, medical doctors among others) and therefore technological effort matters. The tech-nological similarity in the production, however, is only relevant for the inventors and not for the othermigrants. The inventor community at the host country is an attractive feature for non-inventor migrants;nevertheless, it has much smaller impact compared to that on inventors; perhaps, a large inventor com-munity may offer more opportunities for synergies for a subset of migrants. Additionally, the presence ofinventors, generally, reflects innovation capabilities of a country and economic growth potential.
Third, cultural proximity is about two times more important for non-inventor than for inventor mi-grants. Religion similarity, which captures a broad set of beliefs and attitudes important for shaping localculture and in turn innovative performance, is more important than linguistic similarity to both inventorsand other migrants. We find that two countries with exactly same religion exchange 79% (44%) more mi-grants (inventors) than countries that they do not. Also, two countries with exactly the same languageexchange 77% (35%) more migrants (inventors) than countries with dissimilar languages.
Quality of institutions play an important role for both types of flows. Bilateral trade is an importantattractor for inventors, while human capital appears to be important to non-inventor migrants.
For robustness purposes, we use two alternative proxies for human capital, namely (i) the share of pop-ulation in science technology, engineering and mathematics (STEM) and (ii) the human resources devotedin science and technology (HRST) at the host and origin, and re-estimate specifications (1) and (2). Overall,despite the drop of observations by half, the estimated coefficients did not vary in any significant manner.Additionally, we find that STEM presence at the host country is positively related only with migrant flows(1.6%), and when the HRST is used, estimates show that countries with high science and technology hu-man resources attract more inventors (4.6%) as well as migrants (4.4%). We also add into specifications (1)and (2) the stringency of employment protection legislation (EPL) at the destination and home country. Wefind that strict employment protection at the destination country positively relates only with more inventorflows (7.9%). Finally, we find no statistical significant impact of the 2007 financial crisis on either flows.40
We would like to note here that one should read these results with caution due to differences in defini-tions and measurement methods of migration patterns across countries.41
We can also graphically show the geographic stretch of inventor and non-inventor flows for this set of22 countries. Figure 4 below depicts the estimated (dashed line) along with the actual values (bold line) ofgeographic resistance factors on inventor and non-inventor migrant flows. As before, it shows the actualand estimated decay of inventor and non-inventor migrant flows moving out of a nearby area of 300 Km,1,110 Km, and 1,500 Km.
40Robustness analysis is available upon request.41See De Beer et al. (2010) for a discussion.
19

���
���
���
,QYHQWRU�)ORZV
&ORVH�1HLJKERUV /RQJ�1HLJKERUV ������NP ���������NP !����NP
,QYHQWRU�)ORZV��DFWXDO�
,QYHQWRU�)ORZV��ILWWHG�
�����
����
�����
1RQ�,QYHQWRU�0LJUDQW�)ORZV
&ORVH�1HLJKERUV /RQJ�1HLJKERUV ������NP ���������NP !����NP
1RQ�,QYHQWRU�0LJUDQW�)ORZV��DFWXDO�
1RQ�,QYHQWRU�0LJUDQW�)ORZV��ILWWHG�
Figure 4: Decay of Inventor & Migrant Flows Due to Geographical Distance
The graph confirms the dramatic drop in the mobility of inventors and non-inventors alike for distanceslarger than 700 km. Within the distance of 700 km, however, there are strong inventor flows between CzechRepublic and Germany, USA and Canada, Germany and Austria, and Germany and France, and large non-inventor flows between Poland and Germany, Austria and Germany, and Czech Republic and Germanythat drive the patterns upwards. After the distance of 700 km there is a sharp drop in both flows. Animportant difference, however, is that for long distances, higher than 1,500 km, while the flows of non-inventors continue to significantly decay, there is a small increase in the inventor flows - most probablybetween European countries (UK and Germany) and the US or between asian countries and the US, asother factors, such as technology, may have stronger impact than gravity.
4.1.3. Entrepreneurship and Inventors’ MovesGenerally, inventors and entrepreneurs are both able to come up with new ideas, and share some com-
mon characteristics; however, the key difference is that inventors are usually focused on the tangible in-vention, while entrepreneurs are more focused on the business opportunity. Inventors are interested in de-veloping a novel product but not necessarily bringing it to market (i.e. commercializing it). Entrepreneursprocure, organize and manage resources (human, capital and other) through a new venture to bring a prod-uct to market, without necessarily having invented the product. Some inventors are also entrepreneurs andvice versa. Inventors are an important source of invention and innovation. The patenting inventor is oftenthe agent of change if her firm will not commercialize, the inventor sometimes will. International mobil-ity of inventors will probably support such spin-outs and spillovers (Amesse et al., 1991; Astebro, 1998).Therefore, it is interesting to additionally explore whether an entrepreneurial environment could actuallyattract highly skilled individuals.
To examine such a relationship, we derive information on a country’s entrepreneurial environment,though limited in years and only for some countries, from the Global Entrepreneurship Monitor (GEM)database, Adult Population Survey (APS), which offers insights at the national context in which individualsstart businesses. Our main index of interest - among other indices the survey provides - is the index of totalearly-stage entrepreneurship activity (TEA), which is the percentage of the adult population between theages of 18 and 64 years who are in the process of starting a business or who have just started a business
20

which is less than 42 months old. For sensitivity analysis, we also explore the impact of the five otherrelevant indices, namely ‘new business ownership rate’ (NewBusiness), which is the percentage of the adultpopulation aged between 18 and 64 years that have started a business that is between 4 and 42 months oldand is paying salaries or wages, ‘established business ownership rate’ (EstablishedBusiness), which is thepercentage of the adult population aged between 18 and 64 years who are currently an owner-managerof an established business, i.e. earning and managing a running business that has paid salaries, wagesor any other payment, ‘growth expectation of total early-stage entrepreneurship’ (GrowthTEA), which isthe percentage of early-stage entrepreneurs who expect to employ at least 20 employees five years, ‘newproduct of the total early-stage entrepreneurship’ (NewProductTEA), which is the percentage of early-stageentrepreneurs who indicate that their product or service is new to at least some customers and indicate thatnot many businesses offer the same product or service, and the ‘international orientation of total early-stageof entrepreneurship’ (InternationalTEA), which is the percentage of early-stage entrepreneurs with morethan 25% of the customers coming from other countries.
Table 4 presents the results. One should not that the sharp drop in the number of observations is due tothe GEM indices, which are available only for 22 countries for the period 2001-2012. However, despite thelarge drop in the observations, coefficients have overall remained nearly stable across specifications (1) to(6) and very close to the rest of the results obtained so far in our analysis.
A notable difference is that geographic distance that has now become less important as coefficients aresmaller compared to the ones reported in previous Tables. Entrepreneurship activity at the host country,in general, does not appeal to migrant inventors. What seems to be attractive some of its aspects, namelythe new product (NewProductTEA) of the total early-stage entrepreneurship (i.e., products or serviceswhich are new to at least some customers and not many businesses offer the same product or service) andthe international orientation of the total early-stage entrepreneurship (i.e., early-stage entrepreneurs withmore than a quarter of customers coming from aboard).
21
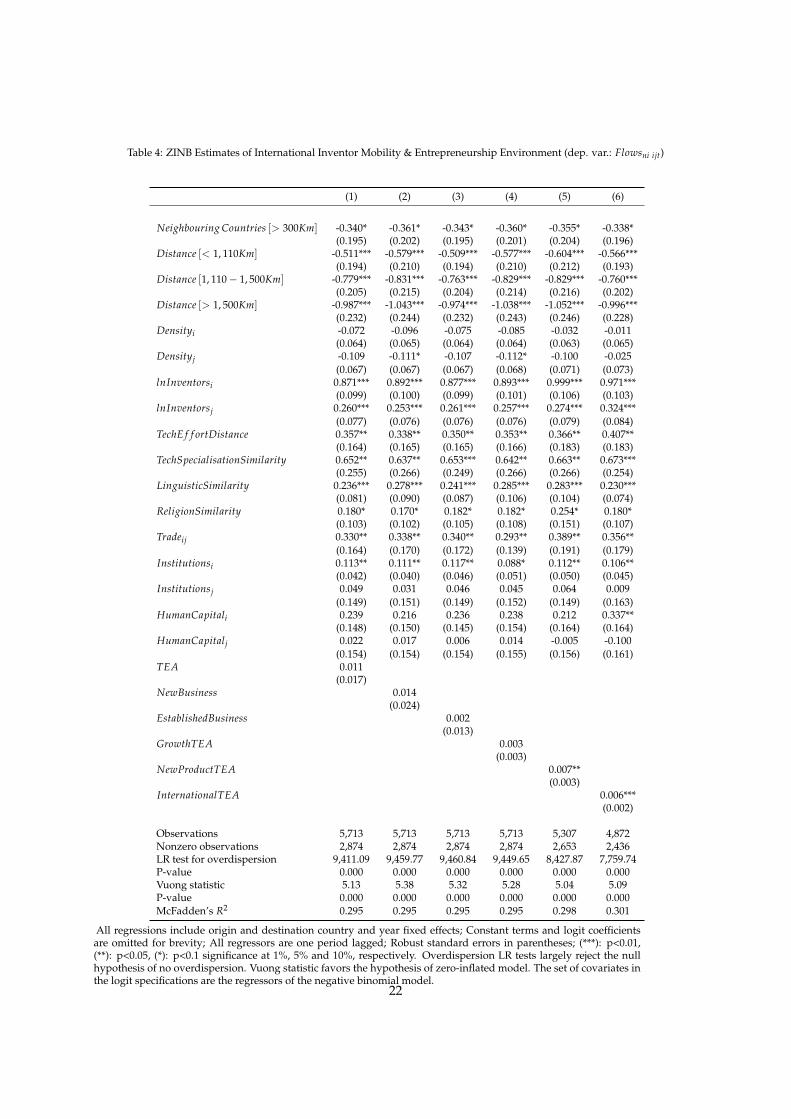
Table 4: ZINB Estimates of International Inventor Mobility & Entrepreneurship Environment (dep. var.: Flowsni ijt)
(1) (2) (3) (4) (5) (6)
Neighbouring Countries [> 300Km] -0.340* -0.361* -0.343* -0.360* -0.355* -0.338*(0.195) (0.202) (0.195) (0.201) (0.204) (0.196)
Distance [< 1, 110Km] -0.511*** -0.579*** -0.509*** -0.577*** -0.604*** -0.566***(0.194) (0.210) (0.194) (0.210) (0.212) (0.193)
Distance [1, 110 � 1, 500Km] -0.779*** -0.831*** -0.763*** -0.829*** -0.829*** -0.760***(0.205) (0.215) (0.204) (0.214) (0.216) (0.202)
Distance [> 1, 500Km] -0.987*** -1.043*** -0.974*** -1.038*** -1.052*** -0.996***(0.232) (0.244) (0.232) (0.243) (0.246) (0.228)
Densityi -0.072 -0.096 -0.075 -0.085 -0.032 -0.011(0.064) (0.065) (0.064) (0.064) (0.063) (0.065)
Densityj -0.109 -0.111* -0.107 -0.112* -0.100 -0.025(0.067) (0.067) (0.067) (0.068) (0.071) (0.073)
lnInventorsi 0.871*** 0.892*** 0.877*** 0.893*** 0.999*** 0.971***(0.099) (0.100) (0.099) (0.101) (0.106) (0.103)
lnInventorsj 0.260*** 0.253*** 0.261*** 0.257*** 0.274*** 0.324***(0.077) (0.076) (0.076) (0.076) (0.079) (0.084)
TechE f f ortDistance 0.357** 0.338** 0.350** 0.353** 0.366** 0.407**(0.164) (0.165) (0.165) (0.166) (0.183) (0.183)
TechSpecialisationSimilarity 0.652** 0.637** 0.653*** 0.642** 0.663** 0.673***(0.255) (0.266) (0.249) (0.266) (0.266) (0.254)
LinguisticSimilarity 0.236*** 0.278*** 0.241*** 0.285*** 0.283*** 0.230***(0.081) (0.090) (0.087) (0.106) (0.104) (0.074)
ReligionSimilarity 0.180* 0.170* 0.182* 0.182* 0.254* 0.180*(0.103) (0.102) (0.105) (0.108) (0.151) (0.107)
Tradeij 0.330** 0.338** 0.340** 0.293** 0.389** 0.356**(0.164) (0.170) (0.172) (0.139) (0.191) (0.179)
Institutionsi 0.113** 0.111** 0.117** 0.088* 0.112** 0.106**(0.042) (0.040) (0.046) (0.051) (0.050) (0.045)
Institutionsj 0.049 0.031 0.046 0.045 0.064 0.009(0.149) (0.151) (0.149) (0.152) (0.149) (0.163)
HumanCapitali 0.239 0.216 0.236 0.238 0.212 0.337**(0.148) (0.150) (0.145) (0.154) (0.164) (0.164)
HumanCapitalj 0.022 0.017 0.006 0.014 -0.005 -0.100(0.154) (0.154) (0.154) (0.155) (0.156) (0.161)
TEA 0.011(0.017)
NewBusiness 0.014(0.024)
EstablishedBusiness 0.002(0.013)
GrowthTEA 0.003(0.003)
NewProductTEA 0.007**(0.003)
InternationalTEA 0.006***(0.002)
Observations 5,713 5,713 5,713 5,713 5,307 4,872Nonzero observations 2,874 2,874 2,874 2,874 2,653 2,436LR test for overdispersion 9,411.09 9,459.77 9,460.84 9,449.65 8,427.87 7,759.74P-value 0.000 0.000 0.000 0.000 0.000 0.000Vuong statistic 5.13 5.38 5.32 5.28 5.04 5.09P-value 0.000 0.000 0.000 0.000 0.000 0.000McFadden’s R2 0.295 0.295 0.295 0.295 0.298 0.301
All regressions include origin and destination country and year fixed effects; Constant terms and logit coefficientsare omitted for brevity; All regressors are one period lagged; Robust standard errors in parentheses; (***): p<0.01,(**): p<0.05, (*): p<0.1 significance at 1%, 5% and 10%, respectively. Overdispersion LR tests largely reject the nullhypothesis of no overdispersion. Vuong statistic favors the hypothesis of zero-inflated model. The set of covariates inthe logit specifications are the regressors of the negative binomial model.
22

Both seem to have almost equal importance for migrant inventors, as one percent increase in either ofone of these indices associates with a 0.006% to 0.007% increase in the inventor inflows.
4.1.4. RobustnessA critical concern in any empirical analysis is endogeneity, which produces biased and inconsistent
estimates. A way to alleviate such a concern is to run our estimations with all regressors in time lags, as wedid so far.
However, omitted factors such as collaborations and networks among inventors not captured in ourestimations may induce endogeneity issues. Furthermore, as relevant literature on trade (Eichengreen andIrwin, 1998) or migration (Anjonami and Hariri, 1992) flows has argued, historical linkages and hysteresisbetween pairs of countries may also influence the exchange of people or goods. Country-pair and yearfixed effects, however, in all of our estimations account for all of unobserved and time invariant factors.In addition, we follow Wooldridge (2002) and allow for time lags in our dependent variable to control forany historical factors that are responsible for unobserved causes of migration. Table A.6 in the Appendixrepeats estimation (4) from Table 1 but includes one-year (column b), two-year (column c) and three-year(column d) lags of the dependent variable as additional controls. Results show that all coefficients remainstable. While the three lagged variables have remained statistically significant, their coefficients are almostzero. Therefore, there is no strong indication that unobserved factors, related to historical linkages betweencountries, exert any significant influence on the current values of our inventor migration flows.
Next, we examine whether the presence of inventors at the destination country biases our results due toreverse causality. We aim for suitable instruments - not a trivial task, though - which must be uncorrelatedto the unobservable time-varying error term and sufficiently correlated to the endogenous variable wewant to instrument (i.e., the number of inventors at the host country). Following the literature, amongthe potential candidates are the stock of foreigners in a country’s population (Hunt and Gauthier-Loiselle,2010; Kerr and Lincoln, 2010; Akcigit et al., 2017a,b) and innovation-enhancing institutions (Caselli andColeman, 2001; Acemoglu et al., 2005) as it was discussed earlier in this paper.42 Column (e) presents thenew estimates. Further, columns (f) and (g) instrument for technology proximity using as instrumentsthe stock of foreigners, rule of law, and additionally and the presence of universities at the host country(Universities per capita).43 Finally, column (h) instruments for the new product (NewProduct o f TEA) oftotal early-stage entrepreneurship activity using as instrument the ‘ease of doing business’ indicator.44
We apply two-stage residual inclusion (2SRI) estimation, the equivalent of two-stage least square (2SLS)for count data (Wooldridge, 2002). In doing so, we regress the instruments on our endogenous variable(s)in the first stage, conditional upon the other exogenous variables of the original model, and recover thepredicted residuals of this estimation to plug them into our original model (without excluding our en-dogenous variable, the number of inventors at the host country); the inference is based on bootstrappingover all two-step procedure, 1,000 iterations. The Hansen over-identification tests support no correlationbetween the instruments and the error term. In addition, the value of the F-statistic reassures us that theinstruments cannot be judged as weak. The negative coefficient of the control term included tells us, fur-thermore, that the latent factor captured by the instruments is negatively correlated with cross-countryinventors’ mobility. Hence, endogeneity seems to cause a small downward bias in the number of inventorsat the destination coefficient in our previous estimates. Note, however, that the bias is small and the controlterm is not statistically significant, therefore, the main conclusions of the analysis undertaken so far hold.
42Data on foreign-born individuals (over country’s population), who have residence in one country but were born in anothercountry (Foreigners), are obtained from the WDI. Information on the rule of law (Rule o f Law) comes from the World Bank, WorldwideGovernance Indicators and captures perceptions of the extent to which agents have confidence in and abide by the rules of society andin particular the quality of contract enforcement, property rights, the police, and the courts.
43Universities contribute to innovation of a country via various channels, most notably through technology develop-ment, technology transfer (licensing of universities patenting to the market) and business spin-offs from university research(Goldstein and Renault, 2004; Veugelers and Rey, 2014). Data on number of universities per capita are derived fromhttp://www.webometrics.info/en/node/54.
44We have also instrumented for the international orientation of early-stage entrepreneurship (International Orientation o f TEA).Results, not shown here, are qualitative similar.
23

4.2. Does Inventor Mobility Contribute to Local Innovation Activity?We have established thus far that inventor flows across countries are shaped by various proximities
among other country level factors. These flows, however, do not necessarily support existence of exter-nalities of knowledge on local innovation. Available knowledge originating in other countries may bring,along with new ideas, a reduction in innovation possibilities, thus generating a zero or even negative neteffect on the productivity of researchers in innovation. Therefore, the next task of this paper is to assess theeffect of external available knowledge on country’s innovation activity. In doing so, we estimate a functionof innovation production and assess the effect of this particular channel of knowledge flows, i.e., inventors’mobility, on local production of innovation.
In its simple form, the output of a production of innovation of a region (country, in our case) is deter-mined by the homegrown as well as by the external, but accessible (or ‘borrowed’) to the region techno-logical knowledge of other regions (Griliches, 1992; Peri, 2005; Drivas et al., 2016) and can be expressed asfollows:
Qit = Iit(Ait)d(Aa
it)µ (2)
where Q is the innovative output produced in country i; I is a set of innovation-enhancing institutions;A is own, homegrown knowledge stock, proxied by R&D stock accumulated from past and current R&Dinvestments in country i; and Aa is the stock of external and accessible (hence the a superscript) to countryi knowledge stock, proxied by R&D accumulated in countries other than i at time t.
Knowledge flows take place when an idea, generated in region, country or institution, is learned byanother region, country or institution. If knowledge flows manage to perfectly and completely spill over,then the amount of external knowledge that eventually reaches country i is simply the summation of allborrowed knowledge that comes from all other countries. In reality, however, the diffusion of knowledgeflows across countries may be less than complete; only a share of research results from other countriesreaches country i. Therefore, the external accessible to country i R&D activity can be described by:
Aait = Â
j 6=ifijt Ajt (3)
where fij is the share of knowledge learned in country i.Substituting equation (3) into equation (2) and by taking logs, equation (2) yields:
lnQit = gIit + dlnAit + µln(Âj 6=i
fijt Ajt) (4)
The dependent variable of equation (4) is the innovation output lnQ, proxied by the log of number ofpatents (Patents) filed in a country at year t and is a count variable.45
We apply ordinary least square (OLS) estimation, controlling for time effects and country-time fixedeffects.46 The use of country and year fixed effects implies that time-varying institutional or policy differ-ences across countries or any other factor changing with country and time, do not affect our estimates dand µ. We standardize f as follows: fijt = (Fijt/Inventorsjt)/(Fit/Inventorsit), where Fijt is the inventorflows between country of origin j and destination country, i, over the number of inventors at origin coun-try, Inventorsjt, while Fit is the total number of inventor flows from all countries at the destination overthe number of inventors Inventorsit at the destination country; Fijt are the fitted values of equation (1) (seeTable 1, specification in column (4)).47
45Not all inventions are patented and further patents proxy a subset of innovative activity. It is though a reliable way to trackinnovation activity. The idea of using patents counts as a metric for innovation output to examine R&D productivity dates at leastback to Hausman et al. (1984) - for a more extensive review of early work of using patent counts consult Hall et al. (2001).
46The log is a monotonic transformation and, as there are no zero patents in our sample, we can use OLS to estimate equation 4.47We also estimated equation (4) using the actual, raw flows of inventors in constructing f. The results, available upon request,
changed only marginally, as the correlation between fitted and actual flows is 0.91.
24

Table 5 reports the estimated innovation elasticities. Column (i) reports estimated coefficients of coun-try’s own R&D stock and external accessible to a country flow-weighted R&D stock gained via the mobil-ity of inventors channel. Column (ii) reports innovation elasticities, in similar fashion, but when externalaccessible flow-weighted R&D stock originates only from the top five most innovative countries in oursample. In fact, this column includes the top five countries in the regressions only as senders of knowl-edge flows and the remaining 25 countries as receivers. Consequently, Aa
ijt in equation (4) is defined asAa
ijt=Âj2Top 5(fijt Aijt). This allows us to minimize potential endogeneity in estimating the coefficient µ
of Aaijt. Finally, as an exercise, column (iii) reports innovation elasticities when external accessible flow-
weighted R&D stock is weighted by the relative importance of country pairs in terms of their innovationefficiency, Âj 6=i fijtrAjt, where r =
rjtrit
and r is a country’s innovation efficiency ( PatentsR&D ) standardized by
the innovation efficiency of the leader country⇣
PatentsR&D
⌘
leader, i.e., the country with the highest innovation
efficiency in each year in our sample, so r =⇣
PatentsR&D
⌘/⇣
PatentsR&D
⌘
leader.
Table 5: Elasticities of Innovation Production Function (dep. var.: log of patents)
All countriesa Top 5 Most Innovativeb All countries (weighted)c
(i) (ii) (iii)
lnR&Down 0.822*** 0.769*** 0.798***(0.168) (0.145) (0.130)
lnR&Dexternal 0.224***(0.076)
lnR&DexternalTop 0.242**(0.115)
lnR&DexternalRelative 0.229***(0.059)
Constant 10.88*** 7.108*** 6.676***(2.513) (1.902) (1.017)
R2 0.884 0.782 0.820Observations 378 313 378
All regressions include country and year fixed effects; All regressors are one period lagged; Robust standarderrors reported in parentheses; lnR&Down is country’s own R&D stock; lnR&Dexternal , lnR&DexternalRelative,and lnR&Dtop are external available to a country inventor-weighted external R&D stocks that originate fromall, top five most innovative countries and better in innovation efficient countries, respectively; All R&Dstocks are constructed using country level R&D spending and the perpetual inventory method (15% depre-ciation rate) as in the conventional literature (Guellec and van Pottelsberghe de la Potterie, 2004; Hall et al.,2005); Fitted values of equation (1) are used to weight all external R&D stocks; Coefficients of the variables invector I namely, share of population with science, technology, engineering, and mathematics education andproprietor rights policies, were statistically insignificant and therefore omitted. (***), (**), and (*): significanceat 1%, 5%, and 10% level, respectively.a All countries were included as senders (origin) of knowledge flows. All countries were included as receivers(destination) of knowledge flows.b Only the top 5 innovative countries were included as senders (origin) of knowledge flows. Only the re-maining 25 countries were included as receivers (destination) of knowledge flows. The top 5 most innovativecountries in our sample are: the US, Japan, Korea, Germany and Canada.c External flows are additionally weighted by r =
� PatentsR&D
�/� Patents
R&D�
leader .
25
As Table 5 shows, estimates of flows reported in columns (i) to (iii) are very close to each other. Thisalleviates concerns about endogeneity. Despite of the potential worsening of the endogeneity problemwhen external accessible R&D stock originates from all countries, estimates are overall quite close acrossdifferent specifications.
More specifically, results support that country’s own (lnR&Down) as well as external accessible R&Dstock (lnR&Dexternal) are important contributors to countries’ innovation production. We find that a onepercent increase of a country’s own R&D is associated with an increase in the local production of innovationfrom 0.77% (column ii) to 0.82% (column i).
Other countries’ R&D effort has also a positive effect on local production of patents. A one percent in-crease of external accessible inventor-weighted knowledge is associated with an increase in the productionof innovation by about 0.224% (column i). The external inventor-weighted knowledge when only flowsthat originate from the top innovative countries are considered is 0.242%. Apparently, the five most inno-vative countries in our sample invest heavily on home-produced technological knowledge, which in turnis transferred across other countries via the mobility of their inventors. Finally. when the external flows areweighted by the relative innovation efficiency competence of the countries, then a one percent increase ofexternal flows, associates with a 0.229% increase in local patenting activity.
In a nutshell, external accessible knowledge that reaches a country via the channel of inventors’ mobilitymatters. More particularly, countries benefit the most when external knowledge originates from the top-tier innovative countries, while there is a marginal higher benefit when knowledge comes from better ininnovation efficiency countries than themselves compared to knowledge that originates from all countries.
Overall, our estimates of own R&D elasticity (77%-82%) are in the vicinity of estimates reported in theinternational spillover literature, and in particular in the studies of Peri (2005) (60%-80%), Branstetter (2001)(72%), Pakes and Griliches (1980) (61%) and Bottazzi and Peri (2007) (78%) among other studies. Further-more, knowledge -carried through inventor moves- is relevant to local innovation production as it has apositive effect on a country’s innovation activity. Our inventor-weighted R&D estimates (22.4%-24.2%) areabout half to those reported in Peri (2005) (40%-50%) and Peri (2005) (40%-50%) - these elasticities, how-ever, refer to citation-weighted and not to inventor-weighted external knowledge, as we discuss here - andlarger than those reported in Drivas et al. (2016) for the case of the US. Our elasticity estimates corroboratewith those reported in the studies of Hunt and Gauthier-Loiselle (2010), Crescenzi and Gagliardi (2015)and Miguélez and Moreno (2013a) which focus on inventor mobility and on average are about 15% to 20%.
Summing up, we find that the flows of inventor movers carry technological knowledge, which is rel-evant to local innovation production as external accessible R&D, gained through the inventors mobilitychannel, has a positive effect on a country’s innovation activity.
5. Conclusion
Individuals are reservoirs of both skills and ideas and their location and mobility are keys to knowledgeaccumulation and diffusion. In advanced economies, innovation and technological knowledge have beenboth found to be strongly tied to the talented migrants. Thus far, only a scant few studies have studied themobility of inventors and even fewer examined their impact on innovation performance.
This paper focuses on patent inventors, as they are deeply involved in the production of innovation andare important knowledge-carriers. Employing patent data to track their moves, we use a gravity model toexamine whether geographic, technological and cultural proximities between countries and country levelfactors shape the flows of these talented individuals. As a comparison, in the same framework, we alsoanalyze the flows of ordinary, non-inventor migrants. Then, we evaluate potential benefits of inventors’mobility on local innovation production activity.
Our evidence shows that proximity matters for migration flows. Gravity emerges everywhere; in themobility of inventor and non-inventor migrant workers. We find, however, that inventors are less geo-graphically restricted and therefore their reach is beyond that of the non-inventor migrants. Similarityin technological structure of production between countries is the main driver of inventor moves - espe-cially for inventors from the most innovative countries, whereas cultural proximity matters more for the
26

non-inventor migrant flows. Quality regulatory environment, job opportunities and early stage entrepren-ership activity at the destination as well as trade linkages between origin and host country are attractivefactors for talented migrant individuals. Finally, knowledge and skills that move with the inventors havea significant positive impact on local innovation production.
The implications of our findings for the literature are relevant. Theoretical trade-growth studies (Gross-man and Helpman, 1991; Rivera-Batiz and Romer, 1991) have long emphasized the important conse-quences of knowledge flows for technology transfer and economic growth. Along with other importantstudies, this paper makes an effort towards this direction and empirically confirms the geographic scopeof embodied knowledge flows as well as their economic impact.
The empirical analysis presented in the paper should be interpreted bearing in mind some key limi-tations. First we focused our attention on the mobility of inventors, a very specific class of skilled andinnovative individuals. Second, our analysis shares the strengths as well as the limitations of other studiesusing patent data as a measure of innovation: they may under-represent actual innovation. Third, onemust note here that inventors’ mobility may not be equally important for all firms in a country. The at-traction of highly skilled knowledgeable individuals can be more effective in enhancing local innovationwhen this is part of a country innovation strategy that stimulates the inclusion of these inflows into thenetwork structure of the local economy. Future research should go into the direction of studying firm leveldynamics and mobility of skilled individuals.
Having acknowledged these limitations, we offer some policy considerations. Given the importanteconomic contribution of inventors, countries should become more attentive to the quality, accountabilityand effectiveness of their home institutions and further to their immigration policies, as the latter couldbecome more welcoming to skilled people. Fostering skilled migration is a powerful policy option. Activepolicies should be designed in order to remove existing barriers to labour mobility: from entry restrictionsto institutional/regulatory barriers. Conversely, taking a hard line stance on immigration policy, it wouldpotentially threaten a country’s ability to attract the brightest and best migrant innovators and hamper itsgrowth potentials.
27

References
Acemoglu, D., Johnson, S., Robinson, J. A., 2005. Institutions as a fundamental cause of long-run growth. In: Aghion, P., Durlauf, S.(Eds.), Handbook of Economic Growth. North Holland: Amsterdam, pp. 384–473.
Agarwal, R., Cockburn, I., McHale, J., 2006. Gone but not forgotten: knowledge flows, labor mobility, and enduring social relation-ships. Journal of Economic Geography 6(5), 571–591.
Aghion, P., Boustan, L., Hoxby, C., Vandenbussche, J., 2009. The causal impact of education on economic growth: Evidence from U.S.University of Harvard, Department of Economics, Working Paper.
Aghion, P., Howitt, P., 1998. Endogenous Growth Theory. Cambridge, MA: MIT Press, Massachusetts, USA.Agrawal, A., Kapur, D., McHale, J., Oettl, A., 2011. Brain drain or brain bank? the impact of skilled emigration on poor-country
innovation. Journal of Urban Economics 69(1), 43–55.Agrawal, A., Kapurc, D., McHaled, J., 2008. How do spatial and social proximity influence knowledge flows? evidence from patent
data. Journal of Urban Economics 64(2), 258–269.Akcigit, U., Baslandze, S., Stantcheva, S., 2016. Taxation and the international mobility of inventors. Amercn Economic Review 106(10),
2930–2981.Akcigit, U., Grigsby, J., Nicholas, T., 2017a. Immigration and the rise of american ingenuity. NBER Working Paper 23137.Akcigit, U., Grigsby, J., Nicholas, T., 2017b. The rise of american ingenuity: Innovation and inventors of the golden age. NBER Working
Paper No. 23047.Alcacer, J., Gittelman, M., 2006. Patent citations as a measure of knowledge flows: The influence of examiner citations. Review of
Economics and Statistics 88(4), 774–779.Amesse, F., Desranleau, C., Etemad, H., Fortier, Y., Seguin-Dulude, L., 1991. The individual inventor and the role of entrepreneurship:
A survey of the canadian evidence. Research Policy Ê20(1), 13–27.Anderson, J. E., van Wincoop, E., 2003. Gravity with gravitas: A solution to the border puzzle. American Economic Review 93(1),
170–192.Anjonami, A., Hariri, V., 1992. Migration stock and the issue of competing and complementary flows in united states interstate
migration. Journal of Population Economics 5(2), 87–100.Astebro, T., 1998. Basic statistics on the success rate and profits for independent inventors. Entrepreneurship: Theory and Practice
23(2), 41–49.Audretsch, D., Keilbach, M., 2007. The theory of knowledge spillover entrepreneurship. Journal of Management Studies 44(7), 1242–
1254.Beck, B., Moore, L., 1985. Linking the host culture to organizational variables. In: Organizational culture. Beverly Hills, CA: Sage, pp.
335–354.Beine, M., Docquier, F., Oz̈den, C., 2011. Diasporas. Journal of Economic Development 95(1), 30–41.Belenzon, S., Schankerman, M., 2013. Spreading the word: Geography, policy and knowledge spillovers. Review of Economics and
Statistics 95(3), 884–903.Benhabib, J., Spiegel, M. M., Oct. 1994. The role of human capital in economic development: Evidence from aggregate cross-country
data. Journal of Monetary Economics 34(2), 143–173.Bertoli, S., Moraga, J. F.-H., 2015. The size of the cliff at the border. Regional Science and Urban Economics 51, 1–6.Bhagwati, J., Hanson, G., 2009. Skilled immigration today: prospects, problems, and policies. Oxford University Press.Bode, E., 2004. The spatial pattern of localized r&d spillovers: an empirical investigation for germany. Journal of Economic Geography
4(1), 43–64.Bottazzi, L., Peri, G., 2007. The international dynamics of r&d and innovation in the long run and in the short run. Economic Journal
117(518), 486–511.Branstetter, L. G., 2001. Are knowledgespillovers international or intranational in scope?: Microeconometric evidence from the U.S.
and japan. Journal of International Economics 53(1), 53–79.Breschi, S., Lissoni, F., 2009. Knowledge networks from patent data: Methodological issues and research targets. Journal of Economic
Geography 9(2), 439–468.Breschi, S., Lissoni, F., Miguelez, E., 2017. Migrant inventors in the US: Testing for diaspora and brain gain effects. Journal of Economic
Geography 17(5), 1009–1038.Burger, M., van Oort, F., Linders, G., 2009. On the specification of the gravity model of trade: Zeros, excess zeros and zero-inflated
estimation. Spatial Economic Analysis 4(2), 167–190.Busenitz, L. W., Gómez, C., Spencer, J. W., 2000. Country institutional profiles: Unlocking entrepreneurial phenomena. Academy of
Management Journal 43(5), 994–1003.Cairncross, F., 1997. The Death of Distance: How Communications Revolution Will Change Our Lives. Orion Business Books, London.Cameron, C. A., Trivedi, P. K., 2013. Regression Analysis of Count Data, 2nd Edition. Econometric Society Monograph No. 53. Cam-
bridge University Press, 1998.Caselli, F., Coleman, J. W., 2001. Cross-country technology diffusion: The case of computers. American Economic Review 91(2), 328–
335.Caselli, F., Wilson, D., 2004. Importing technology. Journal of Monetary Economics 51(1), 1–32.Chen, N., 2004. Intra-national versus international trade in the european union: Why do national borders matter? Journal of Interna-
tional Economics 63(1), 93–118.Crescenzi, R., Gagliardi, L., 2015. Moving people with ideas innovation, inter-regional mobility and firm heterogeneity. SERC DIS-
CUSSION PAPER 174.Czaika, M., Parsons, C., 2015. The gravity of high skilled migration policies. IMI Working Paper No. 110.
28

De Beer, J., Raymer, J., van der Erf, R., van Wissen, L., 2010. Overcoming the problems of inconsistent international migration data: Anew method applied to flows in europe. European Journal of Population 26(4), 459–481.
De Groot, H., Linders, G.-J., Rietveld, P., Subramanian, U., 2004. The institutional determinants of bilateral trade patterns. Kyklos57(1), 103–123.
Docquier, F., Ozden, C., Peri, G., 2014. The labor market effects of immigration and emigration in OECD countries. Economic Journal124(579), 1106–1145.
Drivas, K., Economidou, C., Karkalakos, S., Tsionas, E. G., 2016. Mobility of knowledge and local innovation activity. EuropeanEconomic Review 85(C), 39–61.
Eaton, J., Kortum, S., 2001. Trade in capital goods. European Economic Review 45(7), 1195–1235.Edquist, C., Hommen, L., McKelvey, M., 2001. Innovation and employment: Process versus product innovation, cheltenham: Edward
elgar. Edquist, C., Hommen, L. and McKelvey, M. Innovation and Employment: Process versus Product Innovation, Cheltenham:Edward Elgar.
Efrat, K., 2014. The direct and indirect impact of culture on innovation. Technovation 34(1), 12–20.Eichengreen, B., Irwin, D. A., 1998. The regionalisation of the world economy. In: Frankel, J. A. (Ed.), The Role of History in Bilateral
Trade Flows. University of Chicago Press, Chicago, pp. 33–57.Frankel, J., Romer, D., 1999. Does trade cause growth? American Economic Review 89(3), 379–399.Friedman, T. L., 2005. The World Is Flat: A Brief History of the Twenty-First Century. Farrar, Straus, and Giroux: New York.Gagliardi, L., 2015. Does skilled migration foster innovative performance? evidence from british local areas. Regional Studies 94(4),
773–794.Gennaioli, N., Porta, R. L., de Silanes, F. L., Shleifer, A., 2013. Human capital and regional development. Quarterly Journal of Eco-
nomics 128(1), 105–164.Glaeser, E., J.A. Scheinkman, J., Shleifer, A., 1995. Economic growth in a cross-section of cities. Journal of Monetary Economics 36(1),
117–143.Goldstein, H., Renault, C., 2004. Contributions of universities to regional economic development: A quasi-experimental approach.
Regional Studies 38(7), 733–746.Greene, W. H., 1994. Accounting for excess zeros and sample selection in poisson and negative binomial regression models. NYU
Working Paper No. EC-94-10.Griffith, R., Macartney, G., 2014. Employment protection legislation, multinational firms, and innovation. Review of Economics and
Statistics 96(1), 135–150.Griliches, Z., 1992. The search for r&d spillovers. Scandinavian Journal of Economics 94(0), S29–47.Grogger, J., Hanson, G., 2011. Income maximization and the selection and sorting of international migrants. Journal of Development
Economics 95(1), 42–57.Grossman, G., Helpman, E., 1991. Innovation and Growth in the Global Economy. MIT Press, Massachusetts, USA.Guellec, D., van Pottelsberghe de la Potterie, B., 2004. From r&d to productivity growth: Do the institutional settings and the source
of funds of r&d matter? Oxford Bulletin of Economics and Statistics 66(3), 353–378.Hall, B. H., Jaffe, A. B., Trajtenberg, M., 2001. The nber patents citations data file: Lessons, insights and methodological tools. National
Bureau of Economic Research Working Paper No. 8498.Hall, B. H., Jaffe, A. B., Trajtenberg, M., 2005. Market value and patent citations. RAND Journal of Economics 36(1), 16–38.Hausman, J. A., Hall, B., Griliches, Z., 1984. Econometric models for count data with an application to the patents-r&d relationship.
NBER Working Paper No. 0017.Helpman, E., Melitz, M., Rubinstein, Y., 2008. Estimating trade flows: Trading partners and trading volumes. Quarterly Journal of
Economics 123(2), 441–487.Herbig, P., Dunphy, S., 1998. Culture and innovation. Cross Cultural Management 5(4), 13–21.Hofstede, G., 1980. Culture’s Consequences: International Differences in Work-Related Values. Beverly Hills CA: Sage Publications.Hofstede, G., 2001. Culture’s Consequences: Comparing Values, Behaviors, Institutions and Organizations Across Nations, 2nd Edi-
tion. Thousand Oaks CA: Sage Publications.Hsu, P.-H., Tian, X., Xu, Y., 2014. Financial development and innovation: Cross-country evidence. Journal of Financial Economics
112(1), 116–135.Hunt, J., Gauthier-Loiselle, M., 2010. How much does immigration boost innovation? American Economic Journal: Macroeconomics
2(2), 31–56.Jaffe, A. B., 1986. Technological opportunity and spillovers of r&d: Evidence from firms’ patents, profits, and market value. American
Economic Review 76(5), 984–1001.Jaffe, A. B., Trajtenberg, M., Henderson, R., 1993. Geographic localization of knowledge spillovers as evidenced by patent citations.
Quarterly Journal of Economics 108(3), 577–598.Jones, G. K., Davis, H., 2000. National culture and innovation: Implications for locating global r&d operations. Management Interna-
tional Review 40(1), 11–39.Kapur, D., McHale, J., 2005. Give us your best and brightest: the global hunt for talent and its impact on the developing world. Center
for Global Development, Washington.Keller, W., 2002. Trade and the transmission of technology. Journal of Economic Growth 7(1), 5–24.Kerr, W., 2008. Ethnic scientific communities and international technology diffusion. Review of Economics and Statistics 90(3), 518–
537.Kerr, W. R., Lincoln, W. F., 2010. The supply side of innovation: H-1b visa reforms and us ethnic invention. Journal of Labor Economics
28(3), 473–508.Lambert, D., 1992. Zero-inflated poisson regression, with an application to defects in manufacturing. Technometrics 34(1), 1–14.Levine, R., 2004. Finance and growth: Theory and evidence. NBER Working Paper No. 10766.
29
Licht, A., Siegel, J., 2006. The social dimensions of entrepreneurship. In: Casson, M., Yeung, B. (Eds.), Oxford Handbook of En-trepreneurship. Oxford University Press, Oxford.
Lucas, R., 1988. On the mechanics of economic development. Journal of Monetary Economics 22(1), 3–42.Lucas, R. E., 2009. Ideas and growth. Economica 76(301), 1–19.Maggioni, M. A., Uberti, T., 2009. Knowledge networks across europe: which distance matters? The Annals of Regional Science 43(3),
691–720.Mancusi, M. L., 2008. International spillovers and absorptive capacity: A cross-country cross-sector analysis based on patents and
citations. Journal of International Economics 76(2), 155–165.Mayda, A., 2010. International migration: A panel data analysis of the determinants of bilateral flows. Journal of Population Eco-
nomics 23(4), 1249–1274.Mayer, T., Zignago, S., 2011. Notes on CEPII’s distances measures: The geodist database. CEPII Research Center No. 2011 -25.McCallum, J., 1995. National borders matter: Canada-U.S. regional trade patterns. American Economic Review 85(3), 615–623.McCann, P., 2008. Globalization and economic geography: The world is curved, not flat. Journal of Regions, Economy and Society
1(3), 351–370.Miguélez, E., 2016. Inventor diasporas and the internationalization of technology. World Bank Economic Review (in press,
doi:10.1093/wber/lhw013), 1–28.Miguélez, E., Fink, C., 2013. Measuring the international mobility of inventors: A new database. WIPO Economics & Statistics Series,
Working Paper No. 8.Miguélez, E., Moreno, R., 2013a. Research networks and inventors’ mobility as drivers of innovation: Evidence from europe. Regional
Studies 47(10), 1668–1685.Miguélez, E., Moreno, R., 2013b. Skilled labour mobility, networks and knowledge creation in regions: a panel data approach. Annuals
of Regional Science 51(1), 191–212.Miguélez, E., Moreno, R., 2014. What attracts knowledge workers? the role of space, social networks. Journal of Regional Science
54(1), 33–60.Miguélez, E., Moreno, R., Surinach, J., 2010. Inventors on the move: Tracing inventors’ mobility and its spatial distribution. Papers in
Regional Science 89(2), 251–274.Mokyr, J., 2002. The Gifts of Athena: Historical Origins of the Knowledge Economy. Princeton University Press.OECD, 2004. Science and technology indicator scoreboard.Ortega, F., Peri, G., 2013. The effect of income and immigration policies on international migration. Migration Studies 1(1), 47–74.Pakes, A., Griliches, Z., 1980. Patents and r&d at the firm level: A first report. Economics Letters 5(4), 377–381.Papademetriou, D. G., Sumption, M., 2013. Attracting and selecting from the global talent pool-policy challenges. Migration Policy
Institute, Washington DC.Peri, G., 2005. Determinants of knowledge flows and their effect on innovation. Review of Economics and Statistics 87(2), 308–322.Perugini, C., Signorelli, M., 2010. Youth labour market performance in european regions. Economic Change and Restructuring 43(2),
151–185.Philippidis, G., Resano?Ezcaray, H., Sanjuán-López, A. I., 2013. Capturing zero?trade values in gravity equations of trade: an analysis
of protectionism in agro?food sectors. Agricultural Economics 44(2), 141–159.Redding, S., 1996. The low-skill, low-quality trap: Strategic complementarities between human capital and r&d. Economic Journal
106 (435), 458–470.Rivera-Batiz, L., Romer, P., 1991. Economic integration and endogenous growth. Quarterly Journal of Economics 106(2), 227–244.Rodríguez-Pose, A., Cataldo, M. D., 2014. Quality of government and innovative performance in the regions of Europe. Journal of
Economic Geography 15(4), 673–706.Rodríguez-Pose, A., Crescenzi, R., 2008. Mountains in a flat world: Why proximity still matters for the location of economic activity.
Cambridge Journal of Regions, Economy and Society 1(3), 371–388.Romer, P. M., 1986. Increasing returns and long-run growth. Journal of Political Economy 94(5), 1000–1037.Romer, P. M., 1989. Human capital and growth: Theory and evidence. National Bureau of Economic Research Working Paper Series
No. 3173.Romer, P. M., 1990. Endogeneous technological change. Journal of Political Economy 98(5), S71–102.Saint-Paul, G., 2004. The brain drain: Some evidence from european expatriates in the united states. IZA DP No. 1310.Soskice, D., 1997. German technology policy, innovation and national institutional frameworks. Industry and Innovation 4(1), 75–96.Squicciarini, M. P., Voigtlaender, N., 2015. Human capital and industrialization: Evidence from the age of enlightenment. Quarterly
Journal of Economics 130(4), 1825–1883.Thompson, P., 2006. Patent citations and the geography of knowledge spillovers: Evidence from inventor- and examiner-added
citations. Review of Economics and Statistics 88(2), 383–388.Veugelers, R., Rey, E. D., 2014. The contribution of universities to innovation, (regional) growth and employment. European Expert
Network on Economics of Education (EENEE) Analytical Report No. 18.Vuong, Q. H., 1989. Likelihood ratio tests for model selection and non-nested hypothesis. Econometrica 57(2), 307–333.Wolf, H. C., 2000. Intra-national home bias in trade. Review of Economics and Statistics 82(4), 555–563.Wooldridge, J. M., 2002. Econometric Analysis of Cross Section and Panel Data. Cambridge: MIT Press.Xiong, B., Beghin, J., 2011. Does european aflatoxin regulation hurt groundnut exporters from africa? European Review of Agricultural
Economics 39(4), 589–609.Young, A., 1991. Learning by doing and the dynamic effects of international trade. Journal of Economics 106(2), 369–405.
30
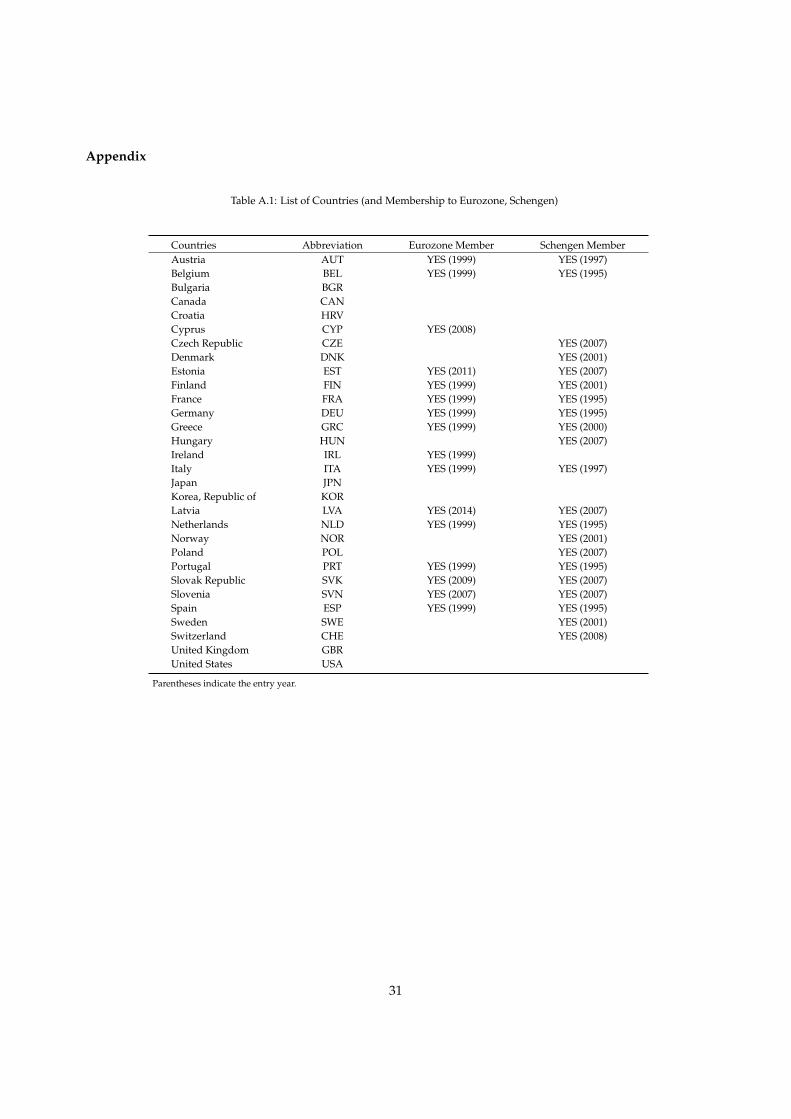
Appendix
Table A.1: List of Countries (and Membership to Eurozone, Schengen)
Countries Abbreviation Eurozone Member Schengen MemberAustria AUT YES (1999) YES (1997)Belgium BEL YES (1999) YES (1995)Bulgaria BGRCanada CANCroatia HRVCyprus CYP YES (2008)Czech Republic CZE YES (2007)Denmark DNK YES (2001)Estonia EST YES (2011) YES (2007)Finland FIN YES (1999) YES (2001)France FRA YES (1999) YES (1995)Germany DEU YES (1999) YES (1995)Greece GRC YES (1999) YES (2000)Hungary HUN YES (2007)Ireland IRL YES (1999)Italy ITA YES (1999) YES (1997)Japan JPNKorea, Republic of KORLatvia LVA YES (2014) YES (2007)Netherlands NLD YES (1999) YES (1995)Norway NOR YES (2001)Poland POL YES (2007)Portugal PRT YES (1999) YES (1995)Slovak Republic SVK YES (2009) YES (2007)Slovenia SVN YES (2007) YES (2007)Spain ESP YES (1999) YES (1995)Sweden SWE YES (2001)Switzerland CHE YES (2008)United Kingdom GBRUnited States USA
Parentheses indicate the entry year.
31

Table A.2: Summary Statistics (30 OECD countries, 2000-2012)
Proximity Variable Obs Mean St. Dev. Min Max
Inventor Flows Flows 11,310 18.071 100.934 0 2,415
Non-inventor Flows Flowsni 5,967 2082,281 7074 ,274 0 177,758
Geographic
Neighboring Countries [< 300Km] 11,310 0.028 0.164 0 1
Neighboring Countries [> 300Km] 11,310 0.055 0.228 0 1
Distance [< 1, 110Km] 11,310 0.225 0.418 0 1
Distance [1, 110 � 1, 500Km] 11,310 0.156 0.363 0 1
Distance [> 1, 500Km] 11,310 0.536 0.499 0 1
Density 11,310 13.614 11.840 0.308 49.930
Inventors Inventors 11,310 9,308.079 21,627.28 3 133,960
Technological
TechE f f ortDistance 11,310 0.968 0.779 0.00003 3.569
TechSpecialisationSimilarity 11,310 0.795 0.150 0.130 0.997
Cultural
LinguisticSimilarity 11,310 0.048 0.214 0 1
ReligionSimilarity 11,310 0.174 0.208 0 0.873
Institutions Regulation Quality 11,310 1.244 0.403 -0.039 2.077
Rule o f Law 11,310 1.198 0.583 -0.223 1.999
Doing Business 7,163 82.35 10.58 51.47 97.22
EPL 9,367 2.47 0.587 1 4.1
HumanCapital
TertiarySpending 11,310 1.341 0.513 0.540 2.71
STEM 7,279 25.810 5.315 2.112 35.2
HRST 6,032 40.888 8.017 21.4 55.4
Bilateral Trade Intensity Trade 11,310 0.0414 0.0860 0.00001 1.428
Instruments
Foreigners 11,310 9,771 5,845 0,528 27,655
Universities per capita
Innovation Activity Patents 10,962 39,289.8 104,536 8 542,815
Entrepreneurship
TEA 5,713 5.948 2.174 1.629 14.26
NewBusiness 5,713 2.506 1.090 0.328 6.263
EstablishedBusiness 5,713 5.742 2.735 0.496 19.61
GrowthTEA 5,713 25.67 9.091 0 52.81
NewProductTEA 5,307 42.52 10.79 13.21 79.28
InternationalTEA 4,872 20.73 8.623 2.728 59.74
32

Table A.3: Inventors’ Top Destinations (2000-2012)
Top Destination Countries Origin of Largest Flows Number of Inventors % out of total
USA 95,735Canada 21,837 22.81%UK 17,424 18.20%Germany 12,040 12.58%
Germany 22,453Austria 3,169 14.11%France 3,074 13.69%UK 2,429 10.82%
Switzerland 22,198Germany 9,719 43.78%France 3,341 15.05%Italy 1,824 8.22%
UK 13,008France 2,372 18.23%Germany 1,917 14.74%Italy 1,425 10.95%
Nederlands 8,400Germany 2,515 29.94%UK 1,633 19.44%Italy/France 656 7.81%
33

Table A.4: ZINB Estimates of International Inventor Mobility (Sensitivity) (dep. var.: Flowsijt)
(1) (2) (3) (4)NB logit NB logit NB logit NB logit
Neighbouring Countries [> 300Km] -0.533*** 4.962 -0.535*** 6.906 -0.619*** -4.061 -0.537** 11.94***(0.190) (9.191) (0.195) (94.42) (0.203) (2.523) (0.210) (1.631)
Distance [< 1, 110Km] -0.851*** 6.617 -0.834*** 8.514 -1.001*** 11.03*** -0.893*** 11.06***(0.196) (8.653) (0.188) (94.42) (0.199) (1.648) (0.206) (1.460)
Distance [1, 110 � 1, 500Km] -0.972*** 7.303 -0.958*** 8.900 -1.057*** 11.36*** -1.036*** 11.30***(0.204) (9.906) (0.207) (94.81) (0.206) (1.478) (0.211) (1.446)
Distance [> 1, 500Km] -1.108*** 7.160 -1.114*** 8.797 -1.619*** 10.76*** -1.527*** 10.25***(0.242) (9.747) (0.230) (94.75) (0.224) (1.724) (0.226) (1.534)
Densityi -0.070 -0.032 -0.079 -0.025 -0.106* 0.032* -0.050 0.038***(0.070) (0.037) (0.078) (0.044) (0.055) (0.017) (0.050) (0.012)
Densityj -0.083 -0.044 0.021 -0.033 -0.070 -0.075*** -0.095** 0.087***(0.069) (0.036) (0.071) (0.033) (0.046) (0.019) (0.044) (0.017)
lnInventorsi 0.858*** -0.084 0.868*** -0.134 0.873*** -0.291 0.846*** (0.114)(0.106) (0.164) (0.108) (0.143) (0.075) (0.251) (0.071) -0.445***
lnInventorsj 0.198*** -0.826*** 0.147 -0.629*** 0.278*** -0.310 0.238*** (0.130)(0.080) (0.155) (0.091) (0.182) (0.064) (0.235) (0.056) -0.363
TechE f f ortDistance 0.139*** -0.738* 0.248*** -0.671* 0.434*** -0.327 0.365*** -0.363(0.007) (0.430) (0.017) (0.396) (0.122) (0.535) (0.111) (0.242)
TechSpecialisationSimilarity 0.527** -1.052 0.559** -0.552 0.520** -2.194 0.500* -2.172**(0.160) (1.979) (0.282) (1.926) (0.260) (1.480) (0.279) (0.938)
LinguisticSimilarity 0.315*** -6.500 0.337*** 0.423 0.348*** 0.415 0.458*** 0.001(0.048) (6.409) (0.058) (2.624) (0.113) (0.850) (0.112) (0.902)
ReligionSimilarity 0.363*** 0.192 0.322*** -0.384 0.413*** -1.862 0.427** -1.171(0.029) (0.635) (0.024) (0.821) (0.019) (1.395) (0.205) (1.018)
Tradeij 0.335*** -3.169 0.417*** -0.696 0.390** -167.9* 0.369** -157.6*(0.006) (2.386) (0.016) (1.969) (0.162) (100.5) (0.289) (89.56)
Institutionsi 0.121 -1.351*** 0.143 -0.672 0.092 -2.462*** 0.178 -3.061***(0.282) (0.380) (0.335) (0.729) (0.198) (0.592) (0.111) (0.517)
Institutionsj -0.080 -0.102 -0.117 -0.305 -0.152 -0.135 0.232 -0.385(0.230) (1.391) (0.251) (0.458) (0.161) (0.645) (0.211) (0.662)
HumanCapitali 0.008 0.065 0.025** 0.021 0.012 0.033 0.046 0.801**(0.007) (0.052) (0.012) (0.042) (0.118) (0.541) (0.114) (0.341)
HumanCapitalj 0.005 0.124 0.035*** 0.045 0.011 0.228 0.090 0.197(0.006) (0.090) (0.012) (0.066) (0.111) (0.859) (0.112) (0.380)
EPLi 0.114* 0.509(0.060) (0.409)
EPLj -0.186 0.084(0.208) (0.537)
DummySchengen 0.171 0.467(0.105) (0.387)
DummyEurozone 0.176** -0.909*(0.078) (0.518)
Observations 6,106 6,106 5,200 5,200 7,718 7,718 11,310 11,310Nonzero observations 2,609 2,609 2,252 2,252 4,536 4,536 5,056 5,056LR test for overdispresion 9,501 8,047 22,100 27,080p-value 0.000 0.000 0.000 0.000Vuong statistic 4.57 3.92 7.95 9.29p-value 0.000 0.000 0.000 0.000McFadden’s R2 0.326 0.325 0.282 0.315
All regressions include origin and destination country and year fixed effects; All regressors are one period lagged; Coefficients of constant termsare omitted for brevity; Robust standard errors in parentheses; (***): p<0.01, (**): p<0.05, (*): p<0.1 significance at 1%, 5% and 10%, respectively.Columns (1) and (2) report estimates of HumanCapital proxied by STEM and HRST, respectively.Column (3) includes an additional institutional variable, the stringency of the employment protection legislation, EPL.Column (4) includes dummies for Eurozone and Schengen membership: Dummy is one if both countries are Eurozone (Schengen) membersand 0 otherwise.
34
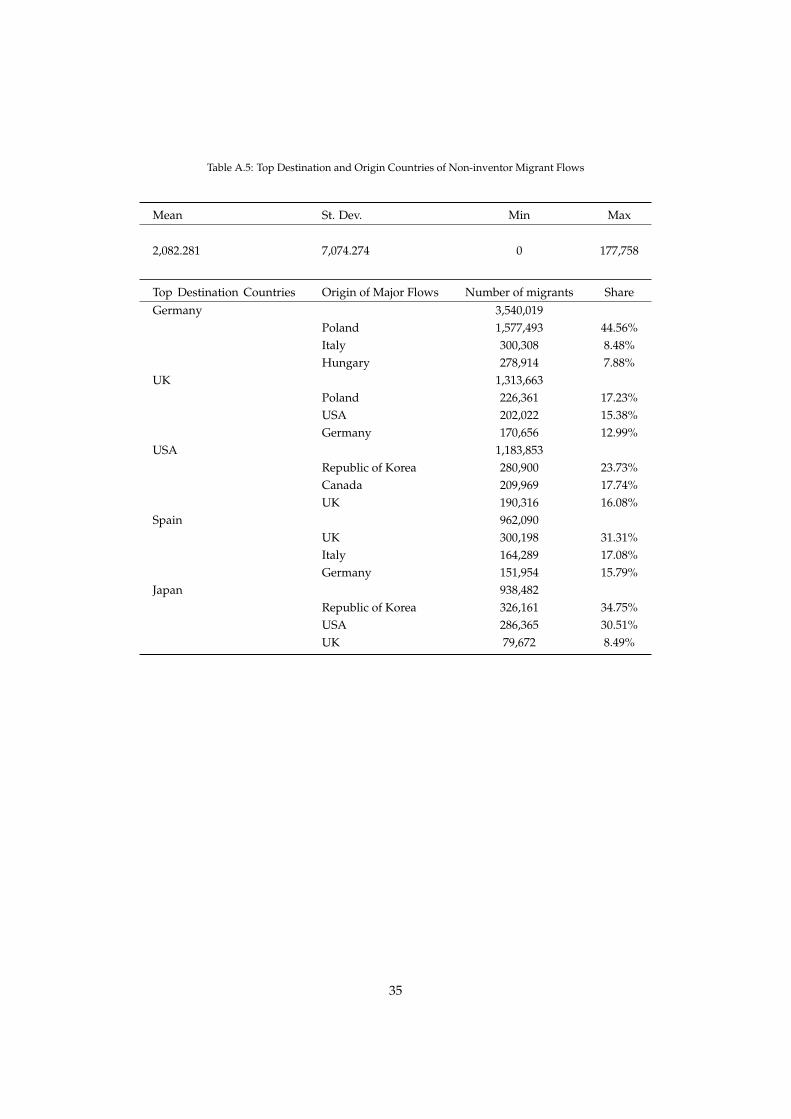
Table A.5: Top Destination and Origin Countries of Non-inventor Migrant Flows
Mean St. Dev. Min Max
2,082.281 7,074.274 0 177,758
Top Destination Countries Origin of Major Flows Number of migrants ShareGermany 3,540,019
Poland 1,577,493 44.56%Italy 300,308 8.48%Hungary 278,914 7.88%
UK 1,313,663Poland 226,361 17.23%USA 202,022 15.38%Germany 170,656 12.99%
USA 1,183,853Republic of Korea 280,900 23.73%Canada 209,969 17.74%UK 190,316 16.08%
Spain 962,090UK 300,198 31.31%Italy 164,289 17.08%Germany 151,954 15.79%
Japan 938,482Republic of Korea 326,161 34.75%USA 286,365 30.51%UK 79,672 8.49%
35

Figure A.1: Top 5% Non-inventor Migrant Flows Across Technologically Advanced Countries, 2000-2012
36
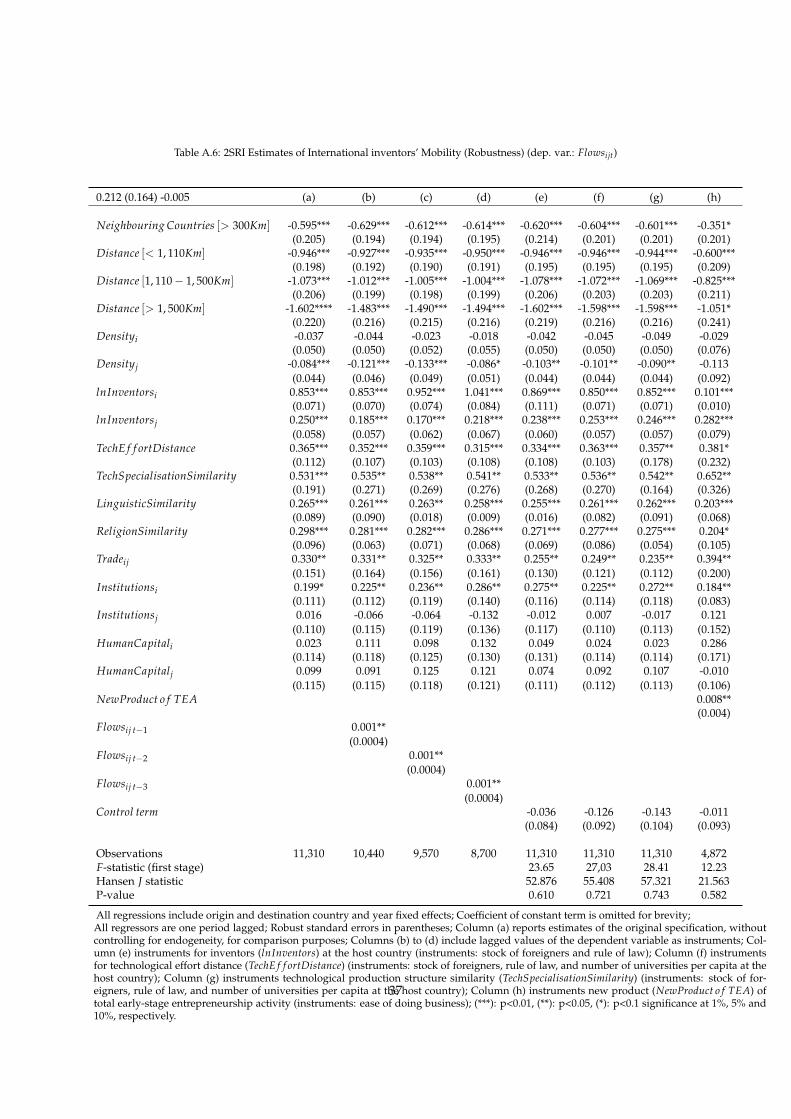
Table A.6: 2SRI Estimates of International inventors’ Mobility (Robustness) (dep. var.: Flowsijt)
0.212 (0.164) -0.005 (a) (b) (c) (d) (e) (f) (g) (h)
Neighbouring Countries [> 300Km] -0.595*** -0.629*** -0.612*** -0.614*** -0.620*** -0.604*** -0.601*** -0.351*(0.205) (0.194) (0.194) (0.195) (0.214) (0.201) (0.201) (0.201)
Distance [< 1, 110Km] -0.946*** -0.927*** -0.935*** -0.950*** -0.946*** -0.946*** -0.944*** -0.600***(0.198) (0.192) (0.190) (0.191) (0.195) (0.195) (0.195) (0.209)
Distance [1, 110 � 1, 500Km] -1.073*** -1.012*** -1.005*** -1.004*** -1.078*** -1.072*** -1.069*** -0.825***(0.206) (0.199) (0.198) (0.199) (0.206) (0.203) (0.203) (0.211)
Distance [> 1, 500Km] -1.602**** -1.483*** -1.490*** -1.494*** -1.602*** -1.598*** -1.598*** -1.051*(0.220) (0.216) (0.215) (0.216) (0.219) (0.216) (0.216) (0.241)
Densityi -0.037 -0.044 -0.023 -0.018 -0.042 -0.045 -0.049 -0.029(0.050) (0.050) (0.052) (0.055) (0.050) (0.050) (0.050) (0.076)
Densityj -0.084*** -0.121*** -0.133*** -0.086* -0.103** -0.101** -0.090** -0.113(0.044) (0.046) (0.049) (0.051) (0.044) (0.044) (0.044) (0.092)
lnInventorsi 0.853*** 0.853*** 0.952*** 1.041*** 0.869*** 0.850*** 0.852*** 0.101***(0.071) (0.070) (0.074) (0.084) (0.111) (0.071) (0.071) (0.010)
lnInventorsj 0.250*** 0.185*** 0.170*** 0.218*** 0.238*** 0.253*** 0.246*** 0.282***(0.058) (0.057) (0.062) (0.067) (0.060) (0.057) (0.057) (0.079)
TechE f f ortDistance 0.365*** 0.352*** 0.359*** 0.315*** 0.334*** 0.363*** 0.357** 0.381*(0.112) (0.107) (0.103) (0.108) (0.108) (0.103) (0.178) (0.232)
TechSpecialisationSimilarity 0.531*** 0.535** 0.538** 0.541** 0.533** 0.536** 0.542** 0.652**(0.191) (0.271) (0.269) (0.276) (0.268) (0.270) (0.164) (0.326)
LinguisticSimilarity 0.265*** 0.261*** 0.263** 0.258*** 0.255*** 0.261*** 0.262*** 0.203***(0.089) (0.090) (0.018) (0.009) (0.016) (0.082) (0.091) (0.068)
ReligionSimilarity 0.298*** 0.281*** 0.282*** 0.286*** 0.271*** 0.277*** 0.275*** 0.204*(0.096) (0.063) (0.071) (0.068) (0.069) (0.086) (0.054) (0.105)
Tradeij 0.330** 0.331** 0.325** 0.333** 0.255** 0.249** 0.235** 0.394**(0.151) (0.164) (0.156) (0.161) (0.130) (0.121) (0.112) (0.200)
Institutionsi 0.199* 0.225** 0.236** 0.286** 0.275** 0.225** 0.272** 0.184**(0.111) (0.112) (0.119) (0.140) (0.116) (0.114) (0.118) (0.083)
Institutionsj 0.016 -0.066 -0.064 -0.132 -0.012 0.007 -0.017 0.121(0.110) (0.115) (0.119) (0.136) (0.117) (0.110) (0.113) (0.152)
HumanCapitali 0.023 0.111 0.098 0.132 0.049 0.024 0.023 0.286(0.114) (0.118) (0.125) (0.130) (0.131) (0.114) (0.114) (0.171)
HumanCapitalj 0.099 0.091 0.125 0.121 0.074 0.092 0.107 -0.010(0.115) (0.115) (0.118) (0.121) (0.111) (0.112) (0.113) (0.106)
NewProduct o f TEA 0.008**(0.004)
Flowsij t�1 0.001**(0.0004)
Flowsij t�2 0.001**(0.0004)
Flowsij t�3 0.001**(0.0004)
Control term -0.036 -0.126 -0.143 -0.011(0.084) (0.092) (0.104) (0.093)
Observations 11,310 10,440 9,570 8,700 11,310 11,310 11,310 4,872F-statistic (first stage) 23.65 27,03 28.41 12.23Hansen J statistic 52.876 55.408 57.321 21.563P-value 0.610 0.721 0.743 0.582
All regressions include origin and destination country and year fixed effects; Coefficient of constant term is omitted for brevity;All regressors are one period lagged; Robust standard errors in parentheses; Column (a) reports estimates of the original specification, withoutcontrolling for endogeneity, for comparison purposes; Columns (b) to (d) include lagged values of the dependent variable as instruments; Col-umn (e) instruments for inventors (lnInventors) at the host country (instruments: stock of foreigners and rule of law); Column (f) instrumentsfor technological effort distance (TechE f f ortDistance) (instruments: stock of foreigners, rule of law, and number of universities per capita at thehost country); Column (g) instruments technological production structure similarity (TechSpecialisationSimilarity) (instruments: stock of for-eigners, rule of law, and number of universities per capita at the host country); Column (h) instruments new product (NewProduct o f TEA) oftotal early-stage entrepreneurship activity (instruments: ease of doing business); (***): p<0.01, (**): p<0.05, (*): p<0.1 significance at 1%, 5% and10%, respectively.
37