


Languages
Pages
Legal


The EY Financial Services Index
1st quarter 2016

The Financial Services Index – 1st quarter 2016 EY | 2
Table of contents
Executive Summary .................................................................................................................................... 3
The EY Financial Sector Confidence Index remains flat ................................................................................... 4
Retail bank confidence is marginally stronger ................................................................................................ 6
Investment bank confidence falls sharply ..................................................................................................... 11
Asset management confidence rebounds from 4Q15 lows ............................................................................ 15
Life insurance confidence recovers marginally ............................................................................................. 22
Technical note .......................................................................................................................................... 26

The Financial Services Index – 1st quarter 2016 EY | 3
Executive Summary
The EY Financial Services Confidence Index remains flat
• The EYFSI remained almost unchanged at 51 in the first quarter of 2016 (16Q1) compared to 52 in the fourth quarter of 2015 (15Q4).
• This means that financial sector confidence remained low, with the current reading well below the long-term average of 76, and remaining at low levels last seen at the time of the 2008-9 global financial crisis.
• Overall confidence remained unchanged in 16Q1, despite a 17 index point increase in asset manager confidence and moderately higher retail bank and life insurer confidence (four and five points respectively).
• The most dramatic movement in confidence came from investment banking, which fell 27 points.
Retail bank confidence is marginally stronger
• Growth in income decelerated further, as net interest income plummeted and that of non-interest (i.e. fee and investment) income remained subdued in the first quarter.
• Retail banks kept a strong focus on operating cost management, slowing the pace of increases. There was a reduction in headcount. Credit losses continued to move sideways.
• Retail banks maintained relatively tight credit standards through the quarter.
• First quarter profit growth remained weak in comparison with 2014 and 15Q1, but improved relative to the middle of 2015.
Investment banking confidence falls sharply
• An across the board slump in activity hit investment banks in 16Q1.
• However, income growth rebounded owing to an upsurge in net-interest and fee income.
• Investment banks struggled to contain operating costs.
• Credit losses, which surged in 15Q3, have continued to increase at a strong pace.
• Net profit growth weakened further.
Asset management confidence rebounds from 4Q15 lows
• The BER’s survey shows that after plunging in 15Q4, net inflows (unit trust and institutional) expanded slowly in 1Q16.
• In 16Q1, absolute return funds demand fell sharply since 15Q3.
• Although the demand for balanced funds also softened over this time period, they remain the most sought after.
• Growth in total income remained weak in 16Q1, although improved on 15Q4 levels.
• Asset managers kept a tight reign on cost increases in 16Q1.
• Although net profits after tax remain weak, there was a mild improvement from 15Q4 levels.
Life insurance confidence recovers marginally
• According to the BER’s survey, growth in premium income was minimal in 16Q1.
• Premium income from both risk and investment business contracted again, even more so than in 15Q4.
• Continued declines in new business premiums and rising lapses lead to a weak premium income outlook.
• After moving broadly sideways during 2015, growth in investment income fell in 16Q1.
• Growth in administrative and marketing expenses edged lower during 16Q1.
• In 16Q1, net profits after tax increased in line with 15Q4 levels.

The Financial Services Index – 1st quarter 2016 EY | 4
The EY Financial Sector Confidence Index remains flat
Continued sluggish economic growth is impacting sentiment across the financial services industry. Recent financial reporting
across all three financial services segments provided solid evidence of the problematic economic environment that banks, life
insurers and asset managers all face. Growth in profits slowed across all three sectors, and in the case of asset management,
even turned negative in some cases.
Given the circumstances, bank earnings held up strongly, growing at double digit figures in 2015, whilst life insurer’ earnings
were largely in low single digit territory – reflecting both squeezed premiums and pressured investment earnings.
Banking confidence in the first quarter was 23 index points below its long-term average level;
Asset Management confidence was 50 points below, and
Life Insurance index confidence is only 3 index points below long term average levels, continueing to be the most confident of
all financial services segments.
The EY Financial Sector Confidence Index (EY FSI) remained almost unchanged in the first quarter of 2016.1,2 A reading of 51
was registered, compared to 52 in the fourth quarter of 2015. At 51 points, financial sector confidence continues to be low,
well below the long-term average of 76 and at its lowest levels since the global financial crisis in 2009.
The percentage of respondents answering “satisfied” to the question “Are prevailing business conditions satisfactory or
unsatisfactory?” is taken as the indicator of financial sector confidence.
The EY FSI reflects the unweighted average confidence of four segments of the financial sector, namely:
• retail banking,
• investment banking,
• asset management, and
• life insurance.
1. During the first quarter of 2016, respondents were asked to provide their views on the estimated developments for the
period January to March and their expectations for the period April to June 2016. To improve the readability of the report, we refer to the first period as “estimation of the first quarter of 2016” (16Q1) and the second period as “expectations for the second quarter of 2016” (16Q2).
2. The Bureau for Economic Research (BER) at Stellenbosch University conducted the survey and processed the results on behalf of EY. The survey was conducted between 29 February and 16 March 2016. The results were processed on 17 March 2016. The number of responses processed was: retail banks (16), investment banks (10), asset managers (30) and life insurers (12).

The Financial Services Index – 1st quarter 2016 EY | 5
Survey data: Business
confidence *
Retail banking Investment banking and specialised
finance
Asset management
Life insurance EY Financial Services
Confidence Index **
06Q3 100 100 100 98 100
06Q4 100 100 100 100 100
07Q1 100 100 100 83 96
07Q2 100 100 98 90 97
07Q3 94 100 99 100 98
07Q4 96 100 97 100 98
08Q1 78 79 77 100 84
08Q2 57 79 81 63 70
08Q3 43 81 57 51 58
08Q4 53 46 42 48 47
09Q1 32 31 45 50 40
09Q2 28 50 60 53 48
09Q3 25 57 83 58 56
09Q4 26 42 99 71 60
10Q1 35 62 97 77 68
10Q2 40 25 75 91 58
10Q3 62 33 71 83 62
10Q4 38 41 89 79 62
11Q1 20 55 85 90 63
11Q2 50 67 77 90 71
11Q3 38 36 71 91 59
11Q4 50 50 59 93 63
12Q1 87 91 56 93 82
12Q2 69 86 59 81 74
12Q3 88 82 81 75 84
12Q4 88 79 84 93 86
13Q1 80 ##83 83 95 85
13Q2 46 78 85 83 73
13Q3 25 93 92 67 69
13Q4 ##30 ##82 96 80 72
14Q1 38 73 77 79 67
14Q2 46 69 66 64 61
14Q3 50 64 52 67 58
14Q4 ##60 ##89 33 81 66
15Q1 74 82 45 92 73
15Q2 67 75 74 93 77
15Q3 54 92 ##36 80 66
15Q4 42 80 10 74 52
16Q1 46 53 27 79 51
* Percentage of respondents rating prevailing business conditions as satisfactory. 0 = extreme lack of confidence, 100 =
extreme confidence ** The EY Financial Services Confidence Index is calculated as the un-weighted arithmetic mean of the business confidence
indices of retail banks, investment banks, asset managers and life insurers. The average for the period 2002 – 2015 is 76; a reading above 76 therefore indicates a relatively “high” confidence level and below 76 a relatively “low” confidence level.
# Data was revised after the questionnaires that arrived after the cut-off date for the quarter was processed. ## Lower than normal number of responses
The historical survey data could be downloaded after registration for free in MS Excel format on
https://www.ber.ac.za/BER%20Documents/EY-Financial-Services-Index/?doctypeid=1061

The Financial Services Index – 1st quarter 2016 EY | 6
Retail bank confidence was marginally stronger
While the confidence of retail bankers remained low when compared to the first half of 2015, when it averaged 70 index points,
it picked up marginally from 42 in 15Q4 to 46 in 16Q1.
This lower confidence level can primarily be attributed to noticeably weaker income growth and profit performance of retail
banks over the last year or so, which is, in turn, related to South Africa’s pedestrian economic growth and low consumer
confidence levels. Under these circumstances, it is becomes more difficult for banks to assess and price for credit worthiness.
According to the SA Reserve Bank’s March 2016 Quarterly Bulletin “despite a challenging business environment over the past
two years, credit demand by the corporate sector has been strong. By contrast, growth in the uptake of bank credit by
households has been lacklustre over the same period as consumers faced rising interest rates and tighter credit conditions”.
Another factor that weighed down banks’ confidence, was their one-notch downgrade alongside the sovereign downgrade of
the country, which adversely affected funding costs and access to liquidity.
According to the Bank Supervision Department’s BA120 income statement data, the growth in both net and non-interest
income was subdued in 2015 (see the first two charts below). Higher rates of increase in interest expenses dampened the
growth in net interest income (see the bottom left chart). Subdued economic growth, in turn, lowered growth in total bank
transactions3 (see the bottom right chart).
According to the BER’s survey, growth in total income decelerated further in the first quarter of 2016, as growth in net interest
income plummeted and that of non-interest (i.e. fee and investment) income remained weak.
3
Credit cards, cheques and electronic transactions.
The Financial Services Index – 1st quarter 2016 EY | 7
According to the Quarterly Bulletin, household credit growth (especially mortgage advances and vehicle financing) remained
lacklustre. In contrast, higher mortgage demand for commercial property investments lifted corporate credit growth.
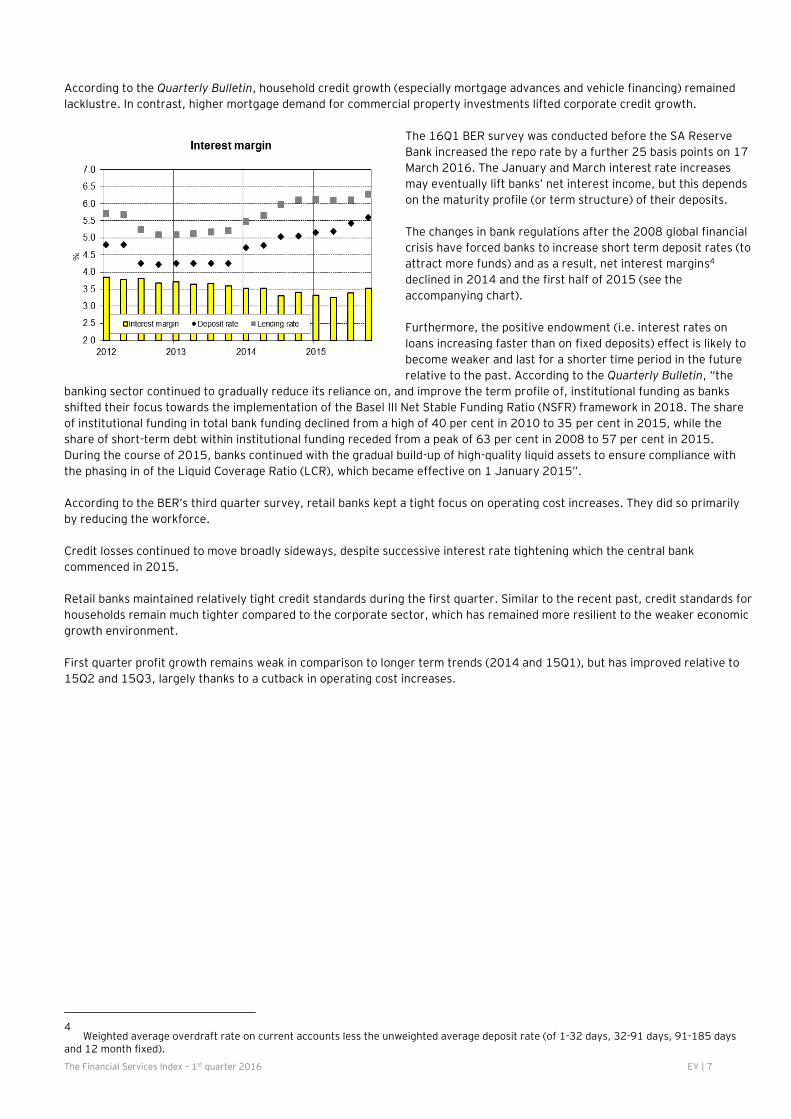
The 16Q1 BER survey was conducted before the SA Reserve
Bank increased the repo rate by a further 25 basis points on 17
March 2016. The January and March interest rate increases
may eventually lift banks’ net interest income, but this depends
on the maturity profile (or term structure) of their deposits.
The changes in bank regulations after the 2008 global financial
crisis have forced banks to increase short term deposit rates (to
attract more funds) and as a result, net interest margins4
declined in 2014 and the first half of 2015 (see the
accompanying chart).
Furthermore, the positive endowment (i.e. interest rates on
loans increasing faster than on fixed deposits) effect is likely to
become weaker and last for a shorter time period in the future
relative to the past. According to the Quarterly Bulletin, “the
banking sector continued to gradually reduce its reliance on, and improve the term profile of, institutional funding as banks
shifted their focus towards the implementation of the Basel III Net Stable Funding Ratio (NSFR) framework in 2018. The share
of institutional funding in total bank funding declined from a high of 40 per cent in 2010 to 35 per cent in 2015, while the
share of short-term debt within institutional funding receded from a peak of 63 per cent in 2008 to 57 per cent in 2015.
During the course of 2015, banks continued with the gradual build-up of high-quality liquid assets to ensure compliance with
the phasing in of the Liquid Coverage Ratio (LCR), which became effective on 1 January 2015”.
According to the BER’s third quarter survey, retail banks kept a tight focus on operating cost increases. They did so primarily
by reducing the workforce.
Credit losses continued to move broadly sideways, despite successive interest rate tightening which the central bank
commenced in 2015.
Retail banks maintained relatively tight credit standards during the first quarter. Similar to the recent past, credit standards for
households remain much tighter compared to the corporate sector, which has remained more resilient to the weaker economic
growth environment.
First quarter profit growth remains weak in comparison to longer term trends (2014 and 15Q1), but has improved relative to
15Q2 and 15Q3, largely thanks to a cutback in operating cost increases.
4
Weighted average overdraft rate on current accounts less the unweighted average deposit rate (of 1-32 days, 32-91 days, 91-185 days and 12 month fixed).

The Financial Services Index – 1st quarter 2016 EY | 8
Survey data: Retail Banking 1 2014 2015 2016
Q3 Q4## Q1 Q2 Q3 Q4 Q1 Q2*
1 Business confidence 2 50 60 74 67 54 42 46
2. Income
a) total income 3, 4 50 80 69 71 67 41 9 -28
b) net interest income 3, 5 75 90 82 72 65 65 19
c) fee income 3, 6 25 50 55 26 -6 29 4
d) investment income 3, 7 50 60 36 25 -8 6 -5
3. Expenditure
a) total operating expenses (excluding cost of funding) 3, 4 42 80 100 90 83 59 50 35
b) credit losses 3, 8 25 30 -46 5 45 6 25
c) total number of people employed 3 8 0 0 30 -5 -47 -41
4. Efficiency and profitability
a) cost-to-income ratio 3 -25 10 9 0 0 0 -9
b) net profit after tax 3 83 70 55 10 11 41 32
5. Credit standards for approving applications for loans 3, 9
a) total 3, 4 17 30 -16 17 46 64 57 41
b) households 3 33 25 0 19 61 75 58
c) firms 3 17 30 20 6 20 28 30
* Expected ## Lower than normal number of responses.
1. Retail banking consists of regular retail banking, private banking, micro lending, commercial banking and corporate banking.
2. % satisfactory 3. Net balance (see Technical Note at the end of the report) 4. The total reflects the responses of participants. It is therefore not calculated as the average of the responses to the
components. Each data series has to be considered on its own. Deviations between the total and components occur when participants reply “the same” given that the net balance statistic does not take “the same” responses into account. The fact that respondents only answer questions applicable to them and that missing items are not imputed also have an effect.
5. Interest income less interest expenses 6. Fees and commission 7. “Investment income” refers to all income from investments and not the investment return. It excludes deferred
income and capital depreciation, but includes realised and unrealised capital gains and losses on investments. 8. Value of non-performing loans until 09Q2 9. Credit standards refer to the terms of the loans and credit lines, such as maximum size, spread of loan rates over
bank’s cost of funds, premiums charged on riskier loans, collateral requirements etc.

The Financial Services Index – 1st quarter 2016 EY | 9

The Financial Services Index – 1st quarter 2016 EY | 10

The Financial Services Index – 1st quarter 2016 EY | 11
Investment banks
The confidence levels of investment bankers plunged sharply from 80 in 15Q4 to 53 in the first quarter of 2016. This fall can
be attributed to an across the board fall-off in activity levels, which is, in turn, relates to South Africa’s depressed economic
growth and poor (direct and indirect) investor confidence.
Private Equity and Stockbroking business volumes fell the most sharply, and this was the first quarter since the global financial
crisis in 2009 that all areas of activity witnessed shrinking business volumes. The magnitude of the shrinking volumes is also in
record territory, with overall business volumes down at their strongest pace ever.
Despite the significantly lower confidence, income growth recovered in 1Q16, owing to an upsurge in net-interest and fee
income. In part, investment banker confidence fell in 16Q1, because respondents expect income growth to plunge in 16Q2.
Investment banks struggled to contain operating costs. In addition, credit losses, which started rising sharply from the third
quarter of 2015, have continued increasing at a solid pace. This led to investment banks tightening credit standards in 16Q1,
for the first time since the first half of 2014.
Investment banks experienced the third successive quarter of flat efficiency ratios, indicating that despite the continued strong
cost pressures, they have nevertheless adjusted cost growth in line with revenue streams.
Net profit growth weakened once again, driven at least in part by a resilient rise in operating expenses, coupled with higher
credit losses.

The Financial Services Index – 1st quarter 2016 EY | 12
Survey data: Investment banking 1 2014 2015 2016
Q3 Q4## Q1 Q2 Q3 Q4 Q1 Q2*
1 Business confidence 2 64 89 82 75 92 80 53
2. Volume of business
a) treasury and specialised finance 3, 4 22 13 36 40 11 0 -14
b) private equity 3, 5 -18 -44 18 0 -33 11 -46
c) corporate finance 3, 6 -22 12 18 30 -11 -11 -30
d) project finance 3 26 -13 9 10 -23 -34 -20
e) stock broking 3 0 -38 9 30 -11 -56 -40
f) overall 3, 7 2 -14 18 22 -13 -18 -30
3. Income
a) total income 3, 8 28 56 64 50 11 0 53 -40
b) net interest income 3, 9 18 33 64 50 33 -11 60
c) fee income 3, 10 -18 22 64 70 0 -56 27
d) investment income 3, 11 18 33 64 70 44 11 -14
4. Expenditure
a) total operating expenses (excluding cost of
funding) 3, 8
64 67 73 70 44 78 60 27
b) credit losses 3, 12 -27 -34 -28 -30 56 56 34
d) total number of people employed 3 27 11 0 0 -22 11 -6
5. Efficiency and profitability
a) cost-to-income ratio 3 -18 0 18 10 0 0 0
b) net profit after tax 3 37 56 64 30 22 34 7
6. Credit standards for approving applications for
loans3,13
27 11 0 -34 0 25 56 62
* Expected ## Lower than normal number of responses
1. Investment banking and specialised finance consists of corporate finance, private equity, project finance, treasury and specialised finance.
2. % satisfactory 3. Net balance (see Technical Note at the end of the report) 4. Treasury and specialised finance comprise structured finance, asset finance, acquisition finance, financial products,
corporate treasury, debt restructuring, cash flow management, tax structuring and balance sheet management, as well as trading of commodities, foreign exchange and various financial instruments.
5. Private equity and direct investments comprise the active seek and selection of expansion and buy-out investments as principal in unlisted companies.
6. Corporate finance includes the provision of financial advisory services to listed companies related to mergers and acquisitions, divestitures, restructurings, spin-offs, joint ventures, capital raising and management buy-outs, as well as valuations, feasibility studies and due diligence reviews.
7. The unweighted average of treasury and specialised finance, private equity, corporate finance, project finance and stock broking.
8. The total reflects the responses of participants. It is therefore not calculated as the average of the responses to the components. Each data series has to be considered on its own. Deviations between the total and components occur when participants reply “the same” given that the net balance statistic does not take “the same” responses into account. The fact that respondents only answer questions applicable to them and that missing items are not imputed also have an effect.
9. Interest income less interest expenses 10. Fees and commission 11. “Investment income” refers to all income from investments and not the investment return. It excludes deferred
income and capital depreciation, but includes realised and unrealised capital gains and losses on investments. 12. Value of non-performing loans until 09Q2 13. Credit standards refer to the terms of the loans and credit lines, such as maximum size, spread of loan rates over
bank’s cost of funds, premiums charged on riskier loans, collateral requirements etc.

The Financial Services Index – 1st quarter 2016 EY | 13

The Financial Services Index – 1st quarter 2016 EY | 14

The Financial Services Index – 1st quarter 2016 EY | 15
Asset management
Weak sentiment towards emerging markets has prevailed for over two years already, although South Africa’s equity market
initially largely continued strengthening on the back of local dynamics. The second half of 2015 saw that situation reverse
markedly, exacerbated by continued sell-off of emerging markets assets by global investors generally. This contributed to a
weakening local currency, which in turn saw further sell-offs of South African equities.
After plunging to an all-time low of 10 in 15Q4, asset manager confidence recovered to 27 index points in 16Q1. This level is
some 50 basis points below long-term average levels. The rise is entirely driven by increased small manager confidence (from
38 to 55). In contrast, the confidence of large managers remained unchanged at zero, which means that all of the large
respondents regarded prevailing business conditions as unsatisfactory. This places the large managers at their least confident
level ever, with sentiment weaker than it was during the global financial crisis in 2009.
The low overall level of confidence is strongly related to weak net inflows (unit trust and institutional).
Historically, unit trust flows consisted heavily of money market
funds, but this changed after investors suffered capital losses
following African Bank’s placing under curatorship in 2014. As a
result, retail investors are re-allocating more monies to multi-
asset portfolios and bank deposits to offset lower money market
returns. Lastly, according to the Reserve Bank, “heightened net
selling by corporates due to the repositioning of funds
previously ring-fenced for developmental projects and other
investments”.
Institutional net inflows suffered, especially after the 2008
global financial crisis, as private employment levels fell, and
retirement saving inflows remained weak as a result.
The BER’s survey shows that after plunging in 15Q4, net inflows
continued at a slow pace in 16Q1.
In 16Q1, the demand for absolute return funds fell sharply from 15Q3 levels. Although the demand for balanced funds also
softened over this time period, they remain the most popular funds.
Among the higher risk products, specialist equity funds overtook general equity funds.
Growth in total income remained weak in 16Q1, albeit stronger than the weak 15Q4 levels. Income levels continue shrinking, in
line with a combination of falling average management fees, and net outflows.
Asset managers kept cost increases contained in 16Q1. This was done through further cuts in the employee headcount, and
slower distribution cost increases. Back office costs were also curbed. IT costs continued to increase at a high rate and
marketing costs also rose faster.
Although net profits continued to shrink in the first quarter, there was a mild improvement from 15Q4 levels, thanks to slightly
better income growth and a strong focus on cost containment. Even so, this was the third consecutive quarter of declining
profits for the industry.
-40
-20
0
20
40
60
80
100
00 02 04 06 08 10 12 14
R b
illio
n
Unit trust net inflows
Money market Equity funds Total

The Financial Services Index – 1st quarter 2016 EY | 16
Survey data: Asset management – All 2014 2015 2016
Q3 Q4 Q1 Q2 Q3# Q4 Q1 Q2*
1 Business confidence 1 52 33 45 74 36 10 27
2. Net inflows
a) Total net inflows 2, 3 -12 -37 29 20 -9 -38 -30 -7
b) Institutional net inflows 2, 4 9 -27 -19 -15 -44 -55 -49
c) Unit trust net inflows: total 2, 3 8 -4 22 -6 -15 -26 -12
i) Institutional 2, 4 17 -26 14 -20 -53 -73 -57
ii) Retail 2, 5 -5 45 46 -19 -25 -31 -27
d) Private client net inflows 2 -20 0 10 1 -21 -40 -19
3. Income
a) Total income 2, 3 42 42 26 18 -31 -63 -29 5
b) Average management fees charged 2 4 8 -12 -27 -12 -15 -14
4. Expenses
a) Total expenses 2, 3 68 61 19 32 22 23 19 22
b) number of people employed: total 2, 3 15 -3 9 6 20 5 -5
c) back office costs 2 53 38 23 15 22 47 34
d) IT and systems costs 2 69 67 3 10 33 49 42
e) marketing costs 2 50 23 -10 -13 -18 10 17
f) other distribution costs 2 57 57 58 47 31 28 10
g) bonuses paid 2 46 26 4 -30 -29 -54 -35
5. Profitability
Net profit after tax 2, 3 45 20 6 1 -29 -60 -14
* Expected # Data was revised after the questionnaires that arrived after the cut-off date for the quarter was processed. % satisfactory, weighted according to firm size
1. Net balance (see Technical Note at the end of the report), weighted according to firm size 2. The total reflects the responses of participants. It is therefore not calculated as the average of the responses to the
components. Each data series has to be considered on its own. Deviations between the total and components occur when participants reply “the same” given that the net balance statistic does not take “the same” responses into account. The fact that respondents only answer questions applicable to them and that missing items are not imputed also have an effect.
3. According to the Association of Collective Investments (ACI), an institutional fund is a fund in which an individual investor cannot invest. The units are held in the name of structures such as pension funds, provident funds, companies, endowment policies and structured funds.
4. According to the ACI, a retail fund is a fund in which individual investors can invest directly and indirectly and the investments are held in their names. Direct investments take place when individual investors deal directly with the management companies. Indirect investments take place when a reseller (LISP) or third party (e.g. a broker) acts as a go-between the individual investors and the management companies.

The Financial Services Index – 1st quarter 2016 EY | 17

The Financial Services Index – 1st quarter 2016 EY | 18

The Financial Services Index – 1st quarter 2016 EY | 19
Survey data: All firms (continued) 2012 2013 2014 2015 2016
Q3 Q1 Q3 Q1 Q3 Q1 Q3 Q1
Current situation
6. Capital expenditure on …
a) domestic infrastructure development 1 51 41 28 52 30 30 4 7
b) foreign infrastructure development 1 1 19 26 9 13 0 16 11
7. Products
a) Demand for
i) general equity index / tracker funds 1 -42 5 5 -9 -6 11 1 -5
ii) absolute return funds 1 -31 -27 -1 11 42 67 49 4
iii) fixed income funds 1 72 49 47 4 4 4 14 -1
iv) specialist equity funds 1 -15 -17 -9 -19 -32 9 11 7
v) style funds 1 -24 -41 -6 -19 -42 -55 -52 -42
vi) guaranteed funds 1 -9 -8 5 -9 -24 1 5 -2
vii) alternative products (e.g. hedge funds) 1 4 19 -11 -8 15 23 7 -22
viii) balanced funds 1 64 83 90 73 77 81 45 30
b) Demand for foreign exposure 1 27 45 55 77 87 72 63 77
c) Opportunities to introduce new funds 1 28 64 6 5 14 -15 -46 -20
8. Regulations
Restrictions caused by the regulatory environment 1 78 67 45 42 57 57 66 52
1. Net balance (see Technical Note at the end of the report), weighted according to firm size

The Financial Services Index – 1st quarter 2016 EY | 20
Survey data: Asset management – Small
Firms 1 2014 2015 2016*
Q3 Q4 Q1 Q2 Q3# Q4 Q1 Q2*
1 Business confidence 2 63 59 53 58 39 38 55
2. Net inflows
a) Total net inflows 3, 4 4 14 41 -6 -18 -19 4 41
b) Institutional net inflows 3, 5 7 0 35 -21 -74 -61 -16
c) Unit trust net inflows: total 3, 4 79 38 23 25 5 -18 18
i) Institutional 3 75 9 29 12 -16 -59 -14
ii) Retail 3 58 62 35 44 10 18 15
d) Private client net inflows 3 46 60 67 73 31 5 33
3. Income
a) Total income 3, 4 59 46 29 -11 -31 -24 15 36
b) Average management fees charged 3 11 0 0 0 -27 4 -3
4. Expenses
a) Total expenses 3, 4 75 76 71 78 70 48 20 11
b) number of people employed: total 3, 4 45 50 53 42 61 33 25
c) back office costs 3 18 4 0 16 4 -14 27
d) IT and systems costs 3 52 18 0 16 30 -4 32
e) marketing costs 3 37 9 0 0 13 5 23
f) other distribution costs 3 23 23 24 21 -9 9 8
g) bonuses paid 3 59 18 -35 -58 0 -9 4
5. Profitability
Net profit after tax:3, 4 58 46 12 -31 5 -10 16 * Expected # Data was revised after the questionnaires that arrived after the cut-off date for the quarter was processed.
1. Firms with funds under management of less than R40 billion in 2013. 2. % satisfactory 3. Net balance (see Technical Note at the end of the report), weighted according to firm size 4. The total reflects the responses of participants. It is therefore not calculated as the average of the responses to the
components. Each data series has to be considered on its own. Deviations between the total and components occur when participants reply “the same” given that the net balance statistic does not take “the same” responses into account. The fact that respondents only answer questions applicable to them and that missing items are not imputed also have an effect.
5. Private pension funds, public pension funds managed on behalf of the Public Investment Commissioners (PIC), life funds, medical aid funds, etc.

The Financial Services Index – 1st quarter 2016 EY | 21
Survey data: Asset management – Large firms 1
2014 2015 2016
Q3 Q4 Q1 Q2 Q3 Q4 Q1 Q2*
1 Business confidence 2 48 21 42 79 34 0 0
2. Net inflows
a) Total net inflows 3, 4 -19 -60 24 27 -6 -44 -63 -54
b) Institutional net inflows 3, 5 9 -40 -37 -13 -31 -52 -82
c) Unit trust net inflows: total 3, 4 -27 -32 21 -12 -22 -28 -44
i) Institutional 3 -5 -42 9 -28 -65 -76 -91
ii) Retail 3 -30 37 50 -35 -36 -44 -63
d) Private client net inflows 3 -47 -21 -8 -21 -40 -52 -63
3. Income
a) Total income 3, 4 35 39 24 26 -31 -76 -72 -29
b) Average management fees charged 3 0 12 -17 -33 -5 -20 -24
4. Expenses
a) Total expenses 3, 4 66 54 4 19 3 14 17 35
b) number of people employed: total 3, 4 3 -27 -6 -5 4 -5 -34
c) back office costs 3 67 52 31 14 29 66 41
d) IT and systems costs 3 76 90 4 8 33 66 52
e) marketing costs 3 56 30 -15 -17 -31 11 11
f) other distribution costs 3 71 73 71 56 46 35 11
g) bonuses paid 3 40 30 19 -22 -39 -68 -72
5. Profitability
Net profit after tax 3, 4 40 8 4 11 -40 -76 -47
* Expected 1. Firms with funds under management in excess of R40 billion in 2013. 2. % satisfactory 3. Net balance (see Technical Note at the end of the report), weighted according to firm size 4. The total reflects the responses of participants. It is therefore not calculated as the average of the responses to the
components. Each data series has to be considered on its own. Deviations between the total and components occur when participants reply “the same” given that the net balance statistic does not take “the same” responses into account. The fact that respondents only answer questions applicable to them and that missing items are not imputed also have an effect.
5. Private pension funds, public pension funds managed on behalf of the Public Investment Commissioners (PIC), life funds, medical aid funds, etc.

The Financial Services Index – 1st quarter 2016 EY | 22
Life insurance
Slow economic growth and weak investor confidence in emerging markets across the globe has resulted in a slowdown for life
insurers in both their main revenue earnings streams, namely premium income and investment earnings. With equity markets
falling across most of the globe, and asset prices weakening, this has inevitably slowed investment income growth. Added to
that, weak economic growth has seen a considerable slowdown in both corporate and individual premiums.
Life insurer confidence increased from 74 index points in 15Q4 to 79 in 16Q1, with life insurers returning to being the most
confident of all financial services segments (this after investment banker confidence fell sharply in the first quarter). Life
insurers are only marginally below their long-term average confidence level (82). The stronger confidence is in line with
marginally stronger profits growth, and a sharp recovery in new business value.
By historical measures, confidence levels are weak, although way stronger than the other financial services segments.
According to data from the SA Reserve Bank’s March 2016 Quarterly Bulletin, slow growth in premiums is ascribed to both
weak group and individual premiums (see the charts below).
According to the BER’s survey, there was close to zero growth in premiums in 16Q1, with both risk and investment business
contracting, albeit at an improved pace since 15Q4.
Continued declining new business premiums, coupled with rising lapses do not bode well for future premium income flows.
With the exception of the High Net Worth segment of the retail market, strong pressures are impacting household finances,
with rising prices and higher interest rates, coupled with limited job prospects all playing a role.
After moving broadly sideways during 2015, investment income growth shrank sharply in 16Q1.
Benefit pay-outs picked up noticeably in the third quarter and further in the fourth quarter of 2015 after a long period of
sedate growth between the middle of 2013 and the middle of 2015. Pay-outs slowed noticeably in 16Q1, but respondents
expect a rebound in 16Q2.
Life insurers reported lower administrative and marketing expenses growth in 16Q1. Lower costs were in line with considerably
lower headcount numbers, with both the sales force and administrative employee numbers declining. Life insurers have been
cutting back on the administrative headcount for a full year now, whilst the first quarter was the first to see sales force
numbers shrinking.
Net profits after tax increased again in the quarter, in line with 15Q4 levels.

The Financial Services Index – 1st quarter 2016 EY | 23
Survey data: Life Insurance 1 2014 2015 2016
Q3 Q4 Q1 Q2 Q3 Q4 Q1 Q2*
1 Business confidence 2 67 81 92 93 80 74 79
2. Inflow
a) total inflow 3, 4 50 64 -3 14 49 -22 23
b) total premium income 3, 5 52 73 -4 16 58 -28 34 27
i) risk business / no of new contracts 3 52 12 49 78 24 -9 27
ii) investment business (only individual business) 3 36 5 -50 -30 -70 -100 -51
c) new business premium income 3 49 78 89 76 40 9 28
d) lapses / no of contracts terminated 3 14 -20 -47 -25 -13 -9 26
e) investment income 3, 6 41 27 2 7 14 3 -20
3. Outflow
a) total outflow 3, 7 55 59 58 57 69 81 69
b) benefits 3 53 59 58 55 69 81 70 81
c) value of surrenders 3 11 31 -13 2 46 17 27
d) sales remuneration 3, 8 89 53 68 80 72 57 64
e) administration and marketing expenses 3 75 61 53 75 71 76 64
f) number of full-time admin employees 3, 9 41 53 14 -2 -7 -2 -18
g) number of in-house agents 3 33 -27 51 57 31 56 -13
4. Profitability
a) net profit after tax 3 70 39 -51 36 87 51 56
b) profitability of risk business 3 25 -30 -45 28 18 23 44
c) administration expenses as % of premium income 3 24 -10 69 41 16 61 38
d) value of new business 3 33 32 28 29 16 -54 42
* Expected
1. Individual life and retirement annuities business plus group life and employee benefit business. 2. % satisfactory, weighted according to firm size 3. Net balance (see Technical Note at the end of the report), weighted according to firm size 4. Weighted net balance (80% total premium income + 20% investment income) 5. The total reflects the responses of participants. It is therefore not calculated as the average of the responses to the
components. Each data series has to be considered on its own. Deviations between the total and components occur when participants reply “the same” given that the net balance statistic does not take “the same” responses into account. The fact that respondents only answer questions applicable to them and that missing items are not imputed also have an effect.
6. “Investment income” refers to all income from investments and not the investment return. It includes dividend, interest, rental and other non-capital investment income, as well as realised and unrealised capital gains and losses on investments.
7. Weighted net balance (90% benefits + 10% administration and marketing expenses) 8. Distribution costs and commissions. 9. Excluding field staff

The Financial Services Index – 1st quarter 2016 EY | 24

The Financial Services Index – 1st quarter 2016 EY | 25
The Financial Services Index – 1st quarter 2016 EY | 26
Technical note
A document with more information on the survey method is available on www.ber.ac.za . Click the button named “Services” and
then select “Surveys” and finally “Financial Services”. Alternatively, click on “EY Financial Survey” on the home page and then on
“Financial Services” under Quick Links.
Survey method
The BER started conducting surveys amongst retail and investment banks in 2002. The scope of the survey was expanded to asset
managers and life insurers in 2003.
EY, the international accounting and business advisory firm, not only supports the financial sector survey financially, but also made
valuable inputs to the design and makes the overall results public. However, the BER conducts the survey and interprets the
results. The BER treats the identities of participants and individual responses as confidential and does not reveal this information to
any third party, including the sponsoring firm.
The division heads of all the major retail banks, investment banks, asset managers and life insurers operating in South Africa
participate in the survey.
The survey results reveal current and expected changes in income, expenses and profitability for these firms’ South Africa
operations only. Industry specific issues, such as banks’ credit standards and the demand for various products of asset managers,
are covered during the first and third quarter surveys.
The surveys are conducted during March, June, September and December. The results reflect developments per calendar quarter,
i.e. the first quarter reflect developments during January, February and March; the second quarter reflects April, May and June
etc.
On occasion questionnaires reach us after the date on which the results of the current quarter are processed. Small revisions of the
survey results of the previous quarter could occur when we process such questionnaires at a later stage.
The need for the financial sector survey
South Africa has one of the most advanced financial sectors of all emerging market economies and its development is in many
respects on par with those of industrialised countries – and yet its performance is not measured regularly and consistently. There is
a general consensus on the need for a regular, consistent and impartial financial services survey, from managers in the financial
sector to financial analysts.
The contribution of the financial sector to GDP has in-creased over the past decade and stood at 9.7% during 2011. The
contribution of – for example – real estate (6.0%), transport (6.6%) and retail trade (7.2%) are all lower compared to that of the
financial sector. However, the general government (16.5%), manufacturing (12.8%) and mining (10.2%) are bigger.
Despite its importance, current information on the performance of the financial sector lags behind:
• Statistics SA publishes GDP and employment figures for the sector covering financial intermediation, insurance, real estate and business services with a lag of one quarter and no details about the sector’s financial performance.
• The compulsory monthly BA 120 (DI 200 until 2007) returns of banks to and the Annual Report of the Bank Supervision Department of the Reserve Bank, the Quarterly Financial Stability Review of the Financial Stability Department of the Reserve Bank and the Annual Report of the Financial Services Board (FSB) provide detailed information about the performance of banks and other financial institutions, but the information is made public with a lag in time except for the BA 120 returns.
• The interim and annual reports of listed financial companies provide information about their performance, but these reports appear at irregular intervals (their release dates depend on the financial year-ends of the different companies) and the results are not always comparable.
• The periodic Price Waterhouse Coopers (PWC) Survey, although entirely relevant in relation to its intended target market and ultimate aim, differs fundamentally from the EY financial services survey. The EY survey measures the same performance criteria of financial institutions over time, appears quarterly and the results are obtained by means of short questionnaires.

The Financial Services Index – 1st quarter 2016 EY | 27
• The quarterly unit trust and bi-annual life insurance reviews of the Association for Savings and Investment SA (ASISA) are useful. However, the unit trust review does not provide information on the financial performance of management companies and the life insurance review is only published twice a year.
• The investment performance and strategy of asset managers are measured regularly (e.g. Alexander Forbes and Plexus), but no regular, consistent measure of income and expenditure of asset managers exist.

The Financial Services Index – 1st quarter 2016 EY | 28
The international standing of the financial sector survey
The UK, Poland and Switzerland have the longest experience in conducting financial services surveys. In the UK, the Confederation
of British Industries (CBI) in London has been conducting comprehensive quarterly financial services surveys in partnership with
Price Waterhouse Coopers (PWC) since December 1989. In Poland, the Research Institute for Economic Development (RIED) at the
Warsaw School of Economics has been conducting a banking survey since 1999. The Swiss Business Cycle Institute (KOF) in Zurich
has been conducting a quarterly banking and insurance survey since the beginning of 2000.
In the USA, the Federal Reserve Bank has been conducting a “Senior Loan Officer Opinion Survey on Bank Lending Practices” for
many years, but unlike the UK, Polish and Swiss banking surveys, it focuses on bank lending practices and not the financial
performance of the bank sector.
The South African financial services survey is modelled on those of the UK and Switzerland. However, the questionnaire has been
adapted for South African conditions and needs. Furthermore, it also includes the questions on credit standards for approving
applications for loans and credit lines out of the US “Senior Loan Officer Opinion Survey”.
Ensuring the reliability and accuracy of the financial sector survey
The questionnaire has been designed for maximum efficiency and minimum input time. Only multiple-answer type ticks are
required. No figures are requested. For example, participants only have to tick if a particular activity (such as total income or
number of people employed) is “up”, “the same” or “down” compared to the same period a year ago and with respect to their
South African operations only.
Respondents are carefully selected and approached on the basis of their position in the financial world. The head of retail banking
or the head of group life insurance is quizzed and not the chairperson of the board of directors of the group or holding company.
Divisional heads tend to be best informed about their business units. The confidentiality of the responses adds to the honesty and
candour of participants. Furthermore, respondent quality is monitored.
The same group of participants is surveyed from one quarter to the next. Changes in the results from one quarter to the next can
therefore be attributed to an actual change in the performance yardstick in question and not because of the participation – or not –
of particular banks, asset managers or life insurers.
South Africa has relatively few banks, asset managers and life insurers. For example, four banks dominate the retail and six the
merchant and investment banking sector. Likewise, two companies dominate the life insurance industry. The number of potential
participants in a financial sector survey is therefore relatively low in South Africa.
The degree of presentation of the panel of participants has an important impact on the reliability of a quantitative survey, i.e. when
respondents have to indicate actual amounts for each activity and the rand value of the level and change are calculated. In
contrast, the financial sector survey is a qualitative survey, i.e. the majority view of respondents on a particular activity is taken as
an indication of the direction and strength of the trend in that activity. The degree of presentation of the panel of participants is
less of a concern in the case of qualitative surveys. Furthermore, the participation – or not – of a particular respondent has less of
an impact on the overall results in the case of qualitative surveys compared to quantitative ones, as the view of the majority is
established and not the actual size.
The participating retail and investment banks accounted for 95% of total assets of registered banks in December 2007. The value
of the total funds under management of the participating asset managers accounted for 63% of the total during the second quarter
of 2007.
For reasons of focus, the following financial institutions are not covered, namely short-term insurers, public financial institutions
(e.g. the Reserve Bank, Land Bank, Post Bank and official pension and provident funds), medical insurance savings schemes, the
informal micro-lending and savings industry, retailers providing credit and individual insurance brokers/agents. The survey also
only focuses on the supply of financial services and not on the demand for such services, which stems from government,
businesses, households and the rest of the world.
The survey results reveal trends and not actual figures. The net balance statistic is used to interpret the survey results. (See next
section for more details on the interpretation of the net balance statistic.) The net balance statistic is the percentage of
respondents replying “up” less the percentage replying “down”. The percentage of respondents replying “the same” is ignored.
Over the years, the net balance statistic has proved to be the most reliable indicator of the direction and size of change in the trend

The Financial Services Index – 1st quarter 2016 EY | 29
of the respective activities surveyed. The net balance statistic is a qualitative yardstick of the direction and size of the year-on-year
growth rate of a particular activity. A positive net balance implies positive year-on-year growth and vice versa. The higher the value
of the net balance (positive / negative), the larger the rate of increase / decrease of the activity in question.
To aggregate the sector performance, individual responses are weighted according to their relative size. It makes sense that the
response of a small participant has to count less compared to that of a large participant.
Results are published according to type of activity (e.g. retail banking, investment banking, life insurance and asset management)
and not per institution (e.g. ABSA, Investec, Sanlam or Coronation).
How to interpret the net balance statistic
We base our interpretation of the survey results on the net balance statistic. Over the years, the net balance statistic has proved to
be the most reliable indicator of the direction and size of change in the trend of the respective activities surveyed.
The net balance statistic is the percentage of respondents replying “up” less the percentage replying “down”. The percentage of
respondents replying “the same” is ignored. For example, if the percentage of respondents rating the volume of business higher /
the same / lower compared to the same period a year ago is as follows:
Higher Same Lower Net balance
70% 10% 20% 50%
Then we can conclude that the majority of participants experienced higher business volumes. A net majority (i.e. the percentage of
respondents rating the volume of business higher less the percentage rating the volume lower) of 50% is registered in the above
example.
The net balance statistic is an advanced qualitative yardstick / indicator of the direction (up, same or down) and size (small or
large) of the year-on-year percentage change of the corresponding quantitative data (if available) of a particular activity. A net
balance of zero tends to indicate no growth (marked “A” on the accompanying chart), between 0 and –100 a contraction (marked
“B”) and between 0 and 100 an expansion (marked “C”) compared to the same quarter a year ago. A positive net balance,
therefore, implies positive year-on-year growth and vice versa. The higher the value of the net balance (positive / negative), the
larger the rate of increase / decrease of the activity in question tend to be.
Note that a net balance of –50%, for instance, is therefore not
equivalent to a –50% decline (calculated year-on-year) in the
quantitative data series. A net balance of –50% may correspond to –
10% in the case of one set of quantitative data and –3% in another
case. The net balance and corresponding percentage change in the
quantitative data vary from one data set to the next and this
relationship could only be established if many data points are
available.

Published March 2016
Warning
This material has been prepared for general information purposes only and may
not be relied upon as accounting, tax, or other professional advice. EY
specifically renounces any liability for reliance on this material by either you or
any third party to whom this material may be distributed. Please refer to your
advisors for specific advice.
EY | Assurance | Tax | Transactions | Advisory
About EY
EY is a global leader in assurance, tax, transaction and advisory
services. The insights and quality services we deliver help build
trust and confidence in the capital markets and in economies the
world over. We develop outstanding leaders who team to deliver
on our promises to all of our stakeholders. In so doing, we play a
critical role in building a better working world for our people, for
our clients and for our communities.
EY refers to the global organization, and may refer to one or
more, of the member firms of Ernst & Young Global Limited,
each of which is a separate legal entity. Ernst & Young Global
Limited, a UK company limited by guarantee, does not provide
services to clients. For more information about our organization,
please visit ey.com.
© 2016 EYGM Limited.
All Rights Reserved.
Top Related