
MENA quarterly banking report - EY
33
MENA quarterly banking report Q3 2020
Transcript of MENA quarterly banking report - EY

MENA quarterly banking report
Q3 2020


About the reportThis report analyzes the Q3 2020 performance of 32 leading banks across the MENA region. The report is based on detailed financial information including balance sheets, income statements and management disclosures.All information is sourced from publicly available financial statements of banks.
Co
nte
nts
Executive summary04
01
Macroeconomicindicators
0602
Bankingperformance
1203
Sector insights
2004
Annexure
2405

The COVID-19 pandemic has significantly impacted the MENA region. The combination of the COVID-19 pandemic and the collapse in oil prices has not only affected the banking sector, but also all aspects of MENA economy.
MENA quarterly banking report: Q3 20204

Executive summary
While the oil prices have somewhat recovered; they still remain far below the levels prior to the first COVID-19 pandemic outbreak in the MENA region in February 2020.
A full-scale recovery of the banking sector depends on the function of health and economic policies, the response of individuals, firms, and the condition of the labor market.
In this report, we provide an overview of Q3 2020 macroeconomic indicators and banking sector performance coupled with sector insights and key trends. We hope that these will help MENA banks to adequately benchmark their performance and assess market positioning among their peers.
Below given is an overview of the key highlights from the results in Q3 2020 and a summary of the major themes and industry trends seen in the banking sector.
Key highlights in results of the banking sector in Q3 2020 include:
1. Negative revenue growth due to the stagnant project market activity as a result of the COVID-19 pandemic, and a fall in oil prices that led governments in prioritizing only critical projects. The rate cuts implemented in major MENA regions to provide an economic stimulus also affected interest earnings of the banking sector.
2. As a result of various long-term and short-term cost control measures such as digitalization, headcount reduction, and branch rationalizations the Cost-to-Income ratio declined both on a y-o-y and q-o-q basis.
3. Loans and deposits continued to grow at a moderate rate with the latter growing at a faster pace than the former. Continuation of this trend could affect the future profitability of banks, if the economy fails to recover in next two quarters.
Major market themes and industry trends that we have noted in Q3 2020 that will be relevant for the next few months include:
1. Growing focus on a cashless economy boosted by a thriving ecosystem for FinTechs: the MENA region is seeing a push towards cashless economy in a bid to speed up the economic development across the presently unregulated informal sector. Given the circumstances and challenges that the COVID-19 pandemic has presented, there must be a mechanism or platform in place to allow businesses to remain open and provide goods and services for their communities while simultaneously limiting the spread of the virus. Embracing digitization and creating a thriving ecosystem for FinTech companies to provide services digitally facilitating cashless transactions will go a long way to offset the challenges brought by the pandemic.
2. The role of digital in revenue enhancement, and cost optimization are priorities for MENA banking boards.
3. Sustainable finance is fast growing in the MENA region, as the oil rich MENA economies wants to reduce its dependence on oil
There is also a marked trend in revisiting IFRS 9 and credit risk models with several MENA banks initiating a relook at assumptions, scenarios and models to ensure that provisioning remains accurate.
While some regulatory changes such as Basel III have been pushed by a year, regulators are keeping up the pressure in other areas, particularly on the interbank lending rate (IBOR) transition front. UK’s Financial Conduct Authority (FCA), which oversees London Interbank Offer Rate (LIBOR), revealed that the notice of LIBOR’s cessation could arrive as soon as the end of 2020. Several MENA banks have initiated the IBOR transition process and are now assessing the impact of this transition on their products, processes, systems and models.
01
5MENA quarterly banking report: Q3 2020
Houssam ItaniPartner
EY MENA Banking &Capital Markets Leader
Gordon BennieManaging PartnerEY MENA Financial
Services
Duško DinčovPartner
EY MENA Financial Services

Due to the sudden outbreak of the COVID-19 pandemic, 2020 has been an exceptionally challenging year until now for global and regional economies. The scenario is not different for the GCC countries alongside Egypt and Jordan, and there still remains a great deal of uncertainty.
MENA quarterly banking report: Q3 20206

Macroeconomic indicators
Regional containment measures are weighing on domestic activity, while the global downturn is hurting external demand. Moreover, oil exporters are hit by lower average oil prices compared with 2019 and constrained oil production following the OPEC+ deal. However, the fiscal and monetary policy support in response to the COVID-19 pandemic has been swift in most economies such as the UAE, KSA, Kuwait, Oman and Qatar. These measures are expected to balance the economies and their outlook in the medium term.
In the KSA, tapering of the COVID-19 pandemic, expansion of hydrocarbon output, resumption of stalled capital projects, and recovery of tourism are expected to help the economy grow in the medium term.
In the UAE, the oil sector will remain a drag on growth, but the expected gradual improvement in non-oil activities including acceleration of planned projects should ease the overall scenario.
For Qatar, infrastructure related spending ahead of the FIFA World Cup in 2022, continued expansion of liquefied natural gas (LNG) capacity, and fiscal as well as monetary response are expected to mitigate the impact of the COVID-19 pandemic and sharp fall in hydrocarbon revenues.
In Kuwait, a slump in economic growth is expected due to subdued non-oil growth, prolonged public health measures, the constrained fiscal mitigation measures, and contracted oil gross domestic product (GDP) in compliance with the OPEC+ agreement.
Oman’s economic outlook remains bleak with the oil sector still weighed down and hit due to ongoing restrictions from the COVID-19 pandemic, especially with
tourism and hotel sectors.
The COVID-19 pandemic impact on Bahrain is predominantly coming from services and tourism sectors where Bahrain has heavily invested, while the sharp fall in oil prices also intensified macroeconomic vulnerabilities and widened fiscal imbalances.
Egypt’s economy is expected to recover in the medium term on account of efficient policies to deal positively and effectively with local and international variables. Jordan’s growth is projected to remain on a low plateau, unless the country’s deep structural issues and economic challenges are addressed quickly and comprehensively.
02 Section summary
MENA quarterly banking report: Q3 2020 7
Macroeconomic indicators
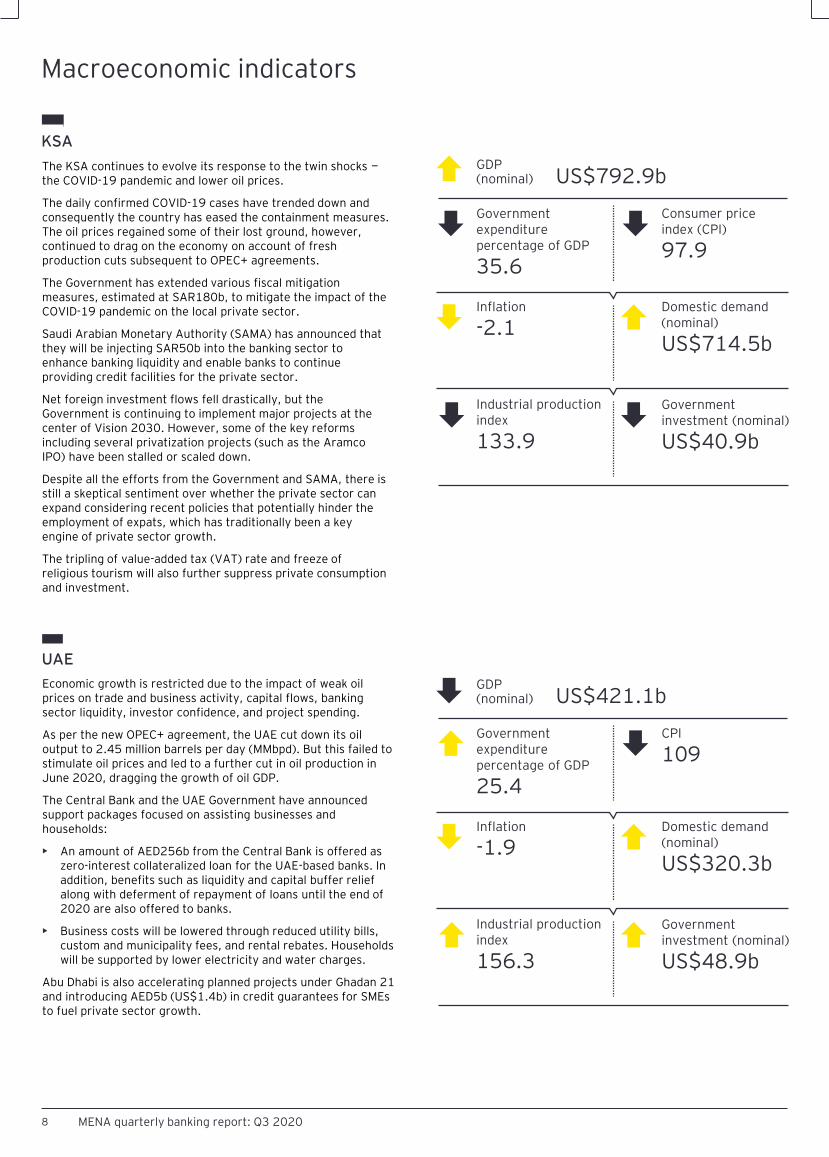
KSA
The KSA continues to evolve its response to the twin shocks —the COVID-19 pandemic and lower oil prices.
The daily confirmed COVID-19 cases have trended down and consequently the country has eased the containment measures. The oil prices regained some of their lost ground, however, continued to drag on the economy on account of fresh production cuts subsequent to OPEC+ agreements.
The Government has extended various fiscal mitigation measures, estimated at SAR180b, to mitigate the impact of the COVID-19 pandemic on the local private sector.
Saudi Arabian Monetary Authority (SAMA) has announced that they will be injecting SAR50b into the banking sector to enhance banking liquidity and enable banks to continue providing credit facilities for the private sector.
Net foreign investment flows fell drastically, but the Government is continuing to implement major projects at the center of Vision 2030. However, some of the key reforms including several privatization projects (such as the Aramco IPO) have been stalled or scaled down.
Despite all the efforts from the Government and SAMA, there is still a skeptical sentiment over whether the private sector can expand considering recent policies that potentially hinder the employment of expats, which has traditionally been a key engine of private sector growth.
The tripling of value-added tax (VAT) rate and freeze of religious tourism will also further suppress private consumption and investment.
Economic growth is restricted due to the impact of weak oil prices on trade and business activity, capital flows, banking sector liquidity, investor confidence, and project spending.
As per the new OPEC+ agreement, the UAE cut down its oil output to 2.45 million barrels per day (MMbpd). But this failed to stimulate oil prices and led to a further cut in oil production in June 2020, dragging the growth of oil GDP.
The Central Bank and the UAE Government have announced support packages focused on assisting businesses and households:
• An amount of AED256b from the Central Bank is offered as zero-interest collateralized loan for the UAE-based banks. In addition, benefits such as liquidity and capital buffer relief along with deferment of repayment of loans until the end of 2020 are also offered to banks.
• Business costs will be lowered through reduced utility bills, custom and municipality fees, and rental rebates. Households will be supported by lower electricity and water charges.
Abu Dhabi is also accelerating planned projects under Ghadan 21 and introducing AED5b (US$1.4b) in credit guarantees for SMEs to fuel private sector growth.
UAE
GDP(nominal) US$792.9b
Government expenditure percentage of GDP
35.6
Consumer price index (CPI)
97.9
Inflation
-2.1Domestic demand (nominal)
US$714.5b
Industrial production index
133.9
Government investment (nominal)
US$40.9b
MENA quarterly banking report: Q3 20208
GDP(nominal) US$421.1b
Government expenditure percentage of GDP
25.4
CPI
109
Inflation
-1.9Domestic demand (nominal)
US$320.3b
Industrial production index
156.3
Government investment (nominal)
US$48.9b
Macroeconomic indicators
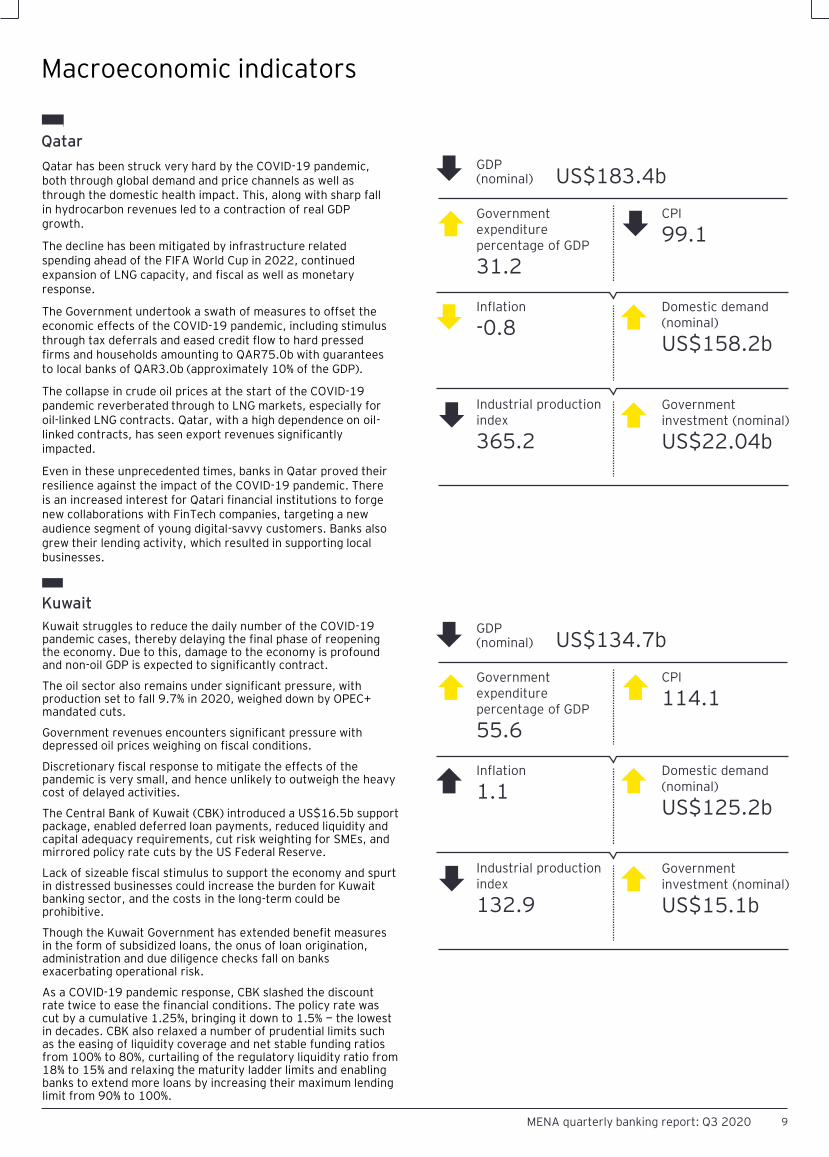
Qatar
Qatar has been struck very hard by the COVID-19 pandemic, both through global demand and price channels as well as through the domestic health impact. This, along with sharp fall in hydrocarbon revenues led to a contraction of real GDP growth.
The decline has been mitigated by infrastructure related spending ahead of the FIFA World Cup in 2022, continued expansion of LNG capacity, and fiscal as well as monetary response.
The Government undertook a swath of measures to offset the economic effects of the COVID-19 pandemic, including stimulus through tax deferrals and eased credit flow to hard pressed firms and households amounting to QAR75.0b with guarantees to local banks of QAR3.0b (approximately 10% of the GDP).
The collapse in crude oil prices at the start of the COVID-19 pandemic reverberated through to LNG markets, especially for oil-linked LNG contracts. Qatar, with a high dependence on oil-linked contracts, has seen export revenues significantly impacted.
Even in these unprecedented times, banks in Qatar proved their resilience against the impact of the COVID-19 pandemic. There is an increased interest for Qatari financial institutions to forge new collaborations with FinTech companies, targeting a new audience segment of young digital-savvy customers. Banks also grew their lending activity, which resulted in supporting local businesses.
Kuwait struggles to reduce the daily number of the COVID-19 pandemic cases, thereby delaying the final phase of reopening the economy. Due to this, damage to the economy is profound and non-oil GDP is expected to significantly contract.
The oil sector also remains under significant pressure, with production set to fall 9.7% in 2020, weighed down by OPEC+ mandated cuts.
Government revenues encounters significant pressure with depressed oil prices weighing on fiscal conditions.
Discretionary fiscal response to mitigate the effects of the pandemic is very small, and hence unlikely to outweigh the heavy cost of delayed activities.
The Central Bank of Kuwait (CBK) introduced a US$16.5b support package, enabled deferred loan payments, reduced liquidity and capital adequacy requirements, cut risk weighting for SMEs, and mirrored policy rate cuts by the US Federal Reserve.
Lack of sizeable fiscal stimulus to support the economy and spurt in distressed businesses could increase the burden for Kuwait banking sector, and the costs in the long-term could be prohibitive.
Though the Kuwait Government has extended benefit measures in the form of subsidized loans, the onus of loan origination, administration and due diligence checks fall on banks exacerbating operational risk.
As a COVID-19 pandemic response, CBK slashed the discount rate twice to ease the financial conditions. The policy rate was cut by a cumulative 1.25%, bringing it down to 1.5% — the lowest in decades. CBK also relaxed a number of prudential limits such as the easing of liquidity coverage and net stable funding ratios from 100% to 80%, curtailing of the regulatory liquidity ratio from 18% to 15% and relaxing the maturity ladder limits and enabling banks to extend more loans by increasing their maximum lending limit from 90% to 100%.
Kuwait
GDP(nominal) US$183.4b
Government expenditure percentage of GDP
31.2
CPI
99.1
Inflation
-0.8Domestic demand (nominal)
US$158.2b
Industrial production index
365.2
Government investment (nominal)
US$22.04b
9MENA quarterly banking report: Q3 2020
GDP(nominal) US$134.7b
Government expenditure percentage of GDP
55.6
CPI
114.1
Inflation
1.1Domestic demand (nominal)
US$125.2b
Industrial production index
132.9
Government investment (nominal)
US$15.1b

Macroeconomic indicators
Oman
The drop in oil prices and the COVID-19 pandemic are placing unprecedented strain on Oman’s economy. The sharp drop in oil prices in 2020 will take a heavy toll on public finances.
The new OPEC+ oil cut agreement is putting significant pressure on the hydrocarbon sector, which is expected to contract by over 12% in 2020.
Total revenue declined considerably and the major portion of the loss comes from a decline in oil receipts.
To compensate for the loss in revenues, the Government announced austerity measures to cut spending for all government agencies by 10% (about 5% of GDP).
The Central Bank of Oman (CBO) disclosed a draft of policy measures and financial incentives designed to unlock an estimated OMR8b in additional liquidity to help businesses impacted by the economic downturn and the COVID-19 pandemic threat. The stimulus measures primarily targeted at banks and financial leasing companies (FLCs), enable them to extend a measure of financial relief to companies embattled by the COVID-19 pandemic.
Inflation will likely pick up in 2021, reflecting the recovery of domestic demand and the introduction of VAT. Oman is also slipping below investment grade due to its large financing needs and diminishing buffers.
However, once the COVID-19 pandemic restrictions are lifted and the conditions ease, the economy is expected to benefit from stronger external demand in the form of greater non-oil exports, transshipment and tourism. The long-planned phase two of the Khazzan shale gas project will also substantially boost gas production to boost the economic prospect.
The decline in non-oil economy weighed down by the lockdown measures and travel restrictions, especially for services and tourism sectors where Bahrain has heavily invested and has impacted GDP of the country the most.
The plunge in oil prices and volatility in the global commodity markets and trade negatively impacted the demand for oil and aluminum (the key downstream sector), putting a significant strain on government revenues.
The collapse in the tourism industry that accounted for 2.5% of GDP is also weighing heavily on tax revenues and economic activity.
To bolster finances, the country secured a loan of about US$1.0b to repay a US$1.25b bond and raised US$2.0b from international markets.
Lower oil prices and large off-budgetary spending, along with constrained oil production capacity are projected to widen the overall fiscal deficit to over 13% of GDP in 2020. Faced with further, the COVID-19 pandemic disruptions coupled with only modest recovery in oil prices over the remainder of the year, real GDP is expected to contract by 5% at the end of 2020.
To overcome the fall in GDP, the Central Bank of Bahrain (CBB) issued several regulatory measures for retail banks such as concessionary repo arrangements, reducing cash reserve ratio (CRR) for a period of six months to control any financial repercussions on the banking sector due to the COVID-19 pandemic.
The measures aim to provide more liquidity and flexibility to enable banks to continue providing financing to their customers.
Bahrain
GDP(nominal) US$76.1b
Government expenditure percentage of GDP
49.6
CPI
113.5
Inflation
0.1Domestic demand (nominal)
US$70.8b
Industrial production index
128.1
Government investment (nominal)
US$6.1b
10 MENA quarterly banking report: Q3 2020
GDP(nominal) US$40.7b
Government expenditure percentage of GDP
24.8
CPI
118.5
Inflation
1.0Domestic demand (nominal)
US$36b
Industrial production index
157.6
Government investment (nominal)
US$0.9b

Macroeconomic indicators
Egypt
The gradual reopening of the economy from the COVID-19 pandemic lockdown is expected to support the growth of non-oil sector in the coming months.
Egypt’s Stand-By Arrangement (SBA), a support under the IMF’s Rapid Financing Instrument (RFI), aims to alleviate the economic impact of the COVID-19 pandemic, help in maintaining macroeconomic stability, strengthen the social safety net, and support reforms to spur private sector-led growth and job creation.
The SBA will also aim to support health as well as social spending, and also to improve fiscal transparency.
However, subdued inflation and weak domestic demand may increase the scope for further key policy rate cuts in 2020.
Subdued exports and foreign direct investment (FDI) showcase economic vulnerabilities, which may provoke the unsettling repercussions of the COVID-19 pandemic.
Egyptian banks aim to expand their foothold in Africa in order to boost intraregional trade. Egyptian banking sector continues to be one of the most stable sectors in the Middle East, despite the disruptive effects of the COVID-19 pandemic.
Central Bank of Egypt (CBE) took aggressive expansionary measures to help the financial system absorb the shocks of the COVID-19 pandemic which hit Egypt. The response include slashing interest rates to encourage industrial sector growth, capital expenditure (CapEx) and retail lending, as well as help shrink the budget deficit and stimulate foreign investments on the stock market.
The four-year IMF loan worth US$1.3b is expected to fuel economic activity of Jordan in the medium term. This loan is designed to stimulate fiscal reforms, attract FDI and create employment opportunities, particularly among the youth.
The export industry is anticipated to expand over the coming quarters as the border with Iraq reopens. This will offer lending opportunities to Jordanian banks.
Rising export activity and rate cuts by the Central Bank of Jordan, in response to the US Federal Reserve’s monetary easing, will support lending growth.
Austerity measures will limit public sector demand for products over the coming years and make banks more reliant on the private sector.
Fiscal consolidation and resultant weak domestic demand will prevent a more robust increase in lending activity over the coming quarters.
Central bank of Jordan has taken some precautionary measures to contain the negative repercussions of the COVID-19 pandemic on the performance of the local economy. These measures include postponing the credit facilities instalments granted to the economic sector clients affected by the spread of the COVID-19 pandemic, injecting JOD550m additional liquidity enabling banks to reduce the interest rates, JOD500m soft financing program for SMEs, and reduction of the financing costs of the Central Bank’s refinancing program that targets SME size projects.
Jordan
GDP(nominal) US$316.4b
Government expenditure percentage of GDP
25.7
CPI
288.7
Inflation
9.15Domestic demand (nominal)
US$360.3b
Industrial production index
133.4
Government investment (nominal)
US$8.5b
11MENA quarterly banking report: Q3 2020
GDP(nominal) US$43.6b
Government expenditure percentage of GDP
28.4
CPI
100.7
Inflation
0.7Domestic demand (nominal)
US$49.4b
Industrial production index
94.7
Government investment (nominal)
NA
Source: Oxford Economics, Fitch Solutions, Thomson ONE, IHS MARKIT.
CPI: Bahrain, Egypt, Jordan and Oman 2010 (base year) =100; Kuwait 2013 (base year) =100; Qatar and Saudi Arabia 2018 (base year) =100;United Arab Emirates 2014 (base year) =100.
Industrial production index: Bahrain, Kuwait, Oman, Qatar and United Arab Emirates 2000 (base year) =100; Egypt 2006/2007 (base year) =100;Jordan 2005 (base year) =100; Saudi Arabia 2010 (base year) =100.

Q3 2020 KPIs: a selection of median y-o-y percentage change of figures and ratios.
MENA quarterly banking report: Q3 202012
Banking performance
03 Section summary
MENA quarterly banking report: Q3 2020 13
Source: Company filings
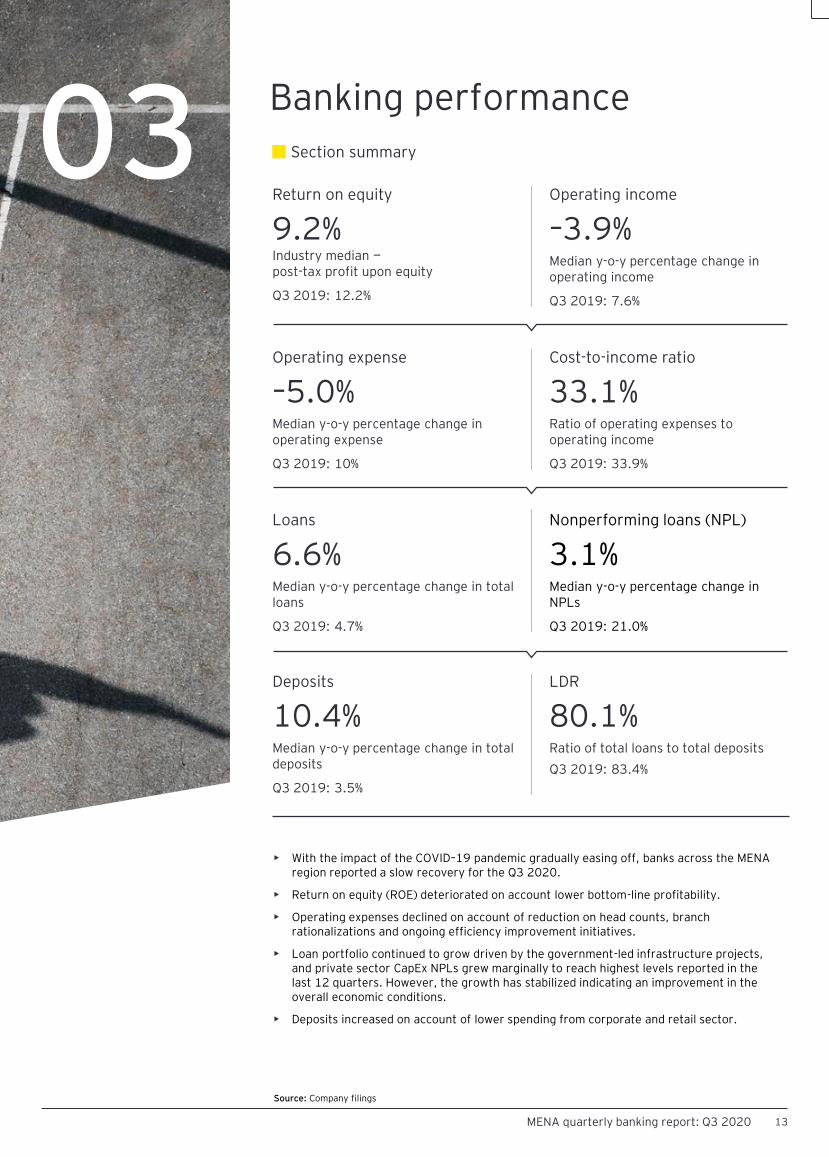
Return on equity
9.2%Industry median —post-tax profit upon equity
Q3 2019: 12.2%
• With the impact of the COVID–19 pandemic gradually easing off, banks across the MENA region reported a slow recovery for the Q3 2020.
• Return on equity (ROE) deteriorated on account lower bottom-line profitability.
• Operating expenses declined on account of reduction on head counts, branch rationalizations and ongoing efficiency improvement initiatives.
• Loan portfolio continued to grow driven by the government-led infrastructure projects, and private sector CapEx NPLs grew marginally to reach highest levels reported in the last 12 quarters. However, the growth has stabilized indicating an improvement in the overall economic conditions.
• Deposits increased on account of lower spending from corporate and retail sector.
Operating income
–3.9%Median y-o-y percentage change in operating income
Q3 2019: 7.6%
Operating expense
–5.0%Median y-o-y percentage change in operating expense
Q3 2019: 10%
Cost-to-income ratio
33.1%Ratio of operating expenses to operating income
Q3 2019: 33.9%
Loans
6.6%Median y-o-y percentage change in total loans
Q3 2019: 4.7%
Nonperforming loans (NPL)
3.1%Median y-o-y percentage change in NPLs
Q3 2019: 21.0%
Deposits
10.4%Median y-o-y percentage change in total deposits
Q3 2019: 3.5%
LDR
80.1%Ratio of total loans to total deposits
Q3 2019: 83.4%

Banking performance
14 MENA quarterly banking report: Q3 2020
14
.9%
13
.7%
14
.6%
9.4
%
7.6
% 9.6
%
27
.9%
10
.8%
12
.4%
10
.0% 1
3.4
%
7.6
%
4.2
%
8.4
%
19
.4%
4.0
%
0.0%
5.0%
10.0%
15.0%
20.0%
25.0%
30.0%
KS
A
UA
E
Qa
tar
Ku
wa
it
Om
an
Ba
hra
in
Eg
yp
t
Jo
rda
n
Q3 2019 Q3 2020
ROE: Q3 2019 to Q3 2020
Median ROE of the MENA region declined by 249.4 basis points (bps) to 9.2% in Q3 2020 as compared with 12.2% in the same period previous year.
While an environment of low interest rate is still weighing on the bottom-line growth, the banks are gradually emerging from the lows witnessed in the pervious two quarters of 2020, specially Q2 2020.
While the ROE continue its downward trend, this may provide an opportunity for banks to look into further consolidation, and focus on integrating new technologies to rationalize costs.
Profitability deteriorated as lower income weighed on return ratios
Operating expenses and income growth: Q3 2019 toQ3 2020
The total operating income for the banks across the region decreased by 8.8% and amounted to US$15,203m, even though the operating expenses fell by 4.4% and amounted to US$5,171.6m in Q3 2020.
Among the peers, only KSA recorded growth in operating income in excess of growth in operating expense.
Cost management remains critical to operating performance
Growth in operating expense
Gro
wth
in
op
era
tin
gin
co
me
KSA
UAE
Qatar
Kuwait
Oman
Bahrain
Egypt
Jordan
-25%
-20%
-15%
-10%
-5%
0%
5%
10%
-20% -10% 0% 10% 20% 30% 40%
Source: Company filings

Banking performance
15MENA quarterly banking report: Q3 2020
Cost-to-income ratio: Q3 2019 to Q3 2020
The median industry cost-to-income ratio improved marginally from 33.9% in Q3 2019 and 34.0% in Q2 2020 to 33.1% in Q3 2020.
The UAE and Jordan recorded sharp jump in cost-to-income due to the higher provision charges and lower offtake in fee and commission income.
Cost control has been one among the key areas of focus for MENA banks for the last few years. With the COVD-19 pandemic acting as a catalyst, past nine months have witnessed major initiatives such as digital transformation, addition of new channels for customer interaction, head count reduction and branch rationalizations. In the coming quarters, with the impact of the COVID-19 pandemic easing off, the results of these initiatives are expected to be more visible.
Cost-to-income ratio improved marginally fromthe pre-COVID-19 pandemic levels
Source: Company filings.
32
.1%
28
.0% 3
4.2
%
33
.5%
45
.3%
46
.3%
24
.7%
40
%
31
.3%
33
.4%
32
.7%
32
.9%
45
.2%
44
.9%
29
.6%
46
%0.0%
5.0%
10.0%
15.0%
20.0%
25.0%
30.0%
35.0%
40.0%
45.0%
50.0%
KS
A
UA
E
Qa
tar
Ku
wa
it
Om
an
Ba
hra
in
Eg
yp
t
Jo
rda
n
Q3 2019 Q3 2020
Industry operating revenue (US$m): Q3 2019 toQ3 2020
Industry operating expense (US$m): Q3 2019 toQ3 2020
4,1
12
.2 5,0
07
.0
3,1
09
.8
1,7
28
.2
59
7.5
70
9.6
25
6.7 71
0.3
4,3
97
.1
3,9
64
.0
3,0
66
.1
1,6
16
.7
55
9.5
69
9.1
26
3.4
63
7.2
0.0
1,000.0
2,000.0
3,000.0
4,000.0
5,000.0
6,000.0
KS
A
UA
E
Qa
tar
Ku
wa
it
Om
an
Ba
hra
in
Eg
yp
t
Jo
rda
n
Q3 2019 Q3 2020
1,3
19
.9
1,3
99
.9
1,0
62
.1
57
8.8
27
0.7
32
8.5
59
.5
28
5.2
1,3
77
.9
1,3
22
.8
1,0
01
.2
53
1.4
25
2.7
31
3.9
77
.8
29
3.9
0.0
200.0
400.0
600.0
800.0
1,000.0
1,200.0
1,400.0
1,600.0
KS
A
UA
E
Qa
tar
Ku
wa
it
Om
an
Ba
hra
in
Eg
yp
t
Jo
rda
n
Q3 2019 Q3 2020
Operating revenue growth by region: Q3 2019 toQ3 2020
Operating expense growth by region: Q3 2019 toQ3 2020
Q3 2019 Q3 2020
KSA 10.5% 6.9%
UAE 30.3% –20.8%
Qatar 10.7% –1.4%
Kuwait 4.8% –6.4%
Oman 1.1% –6.3%
Bahrain –10.0% –1.5%
Egypt 15.8% 2.6%
Jordan 4.4% –10.3%
Q3 2019 Q3 2020
KSA 6.0% 4.4%
UAE 12.9% –5.5%
Qatar 17.5% –5.7%
Kuwait 9.2% –8.2%
Oman 3.2% –6.6%
Bahrain 10.9% –4.5%
Egypt 24.1% 30.9%
Jordan 0.8% 3.0%

Banking performance
16 MENA quarterly banking report: Q3 2020
NII (US$m): Q3 2019 to Q3 2020
Aggregate net interest income (NII) decreased by 5% y-o-y and 4% q-o-q from US$11.9b in Q3 2019 and US$ 11.8b in Q2 2020 to US$11.3b in Q3 2020.
This is mainly due to lower interest and other operating income, which continued to impact profitability.
This trend is expected to continue in the coming quarters as well, which would likely limit credit and earnings growth and also result in higher NPLs.
Lower interest rates continues to put pressure on asset yields
Source: Company filings.
Lower interest rates continues to put pressure on bottom-line growth
3,2
44
.6
3,0
29
.5
2,3
66
.6
1,2
38
.0
43
4.5
53
6.9
22
1.2
46
3.4
3,3
35
.3
2,7
15
.2
2,4
47
.8
1,1
78
.2
42
5.6
52
9.4
23
2.7
41
2.6
0.0
500.0
1,000.0
1,500.0
2,000.0
2,500.0
3,000.0
3,500.0
4,000.0
KS
A
UA
E
Qa
tar
Ku
wa
it
Om
an
Ba
hra
in
Eg
yp
t
Jo
rda
n
Q3 2019 Q3 2020
The net profit of MENA banks rebounded from Q2 2020, although it continues to remain well below the pre-COVID-19 pandemic levels.
The growth was mainly led by a fall in provisions during the quarter, savings on cost of fund and increase in non-interest income.
Net profit (US$m): Q3 2019 to Q3 2020
2,1
56
.7 2,8
39
.1
1,6
29
.0
64
2.6
20
8.0
25
5.4
14
3.3
26
4.5
2,0
91
.7
1,4
62
.5
1,3
46
.0
40
8.0
16
7.2
10
2.1
11
5.1
79
.6
0.0
500.0
1,000.0
1,500.0
2,000.0
2,500.0
3,000.0
KS
A
UA
E
Qa
tar
Ku
wa
it
Om
an
Ba
hra
in
Eg
yp
t
Jo
rda
n
Q2 2019 Q2 2020
NII growth by region: Q3 2019 to Q3 2020
Q3 2019 Q3 2020
KSA 10.09% 2.8%
UAE 11.19% 10.37%
Qatar 8.71% 3.43%
Kuwait –3.10% –4.83%
Oman 5.49% –2.03%
Bahrain –6.73% –1.38%
Egypt 5.50% 5.2%
Jordan –0.11% –10.96%
Q2 2019 Q2 2020
KSA 16.26% –3.01%
UAE 30.31% –48.49%
Qatar 6.93% –17.37%
Kuwait 5.61% –36.50%
Oman –7.73% –19.63%
Bahrain 4.23% –60.01%
Egypt 16.36% –19.71%
Jordan 7.20% –69.91%
Trend of y-o-y net profit growth

Banking performance
17MENA quarterly banking report: Q3 2020
Total assets (US$b): Q3 2019 to Q3 2020
MENA banks continues to show resilient asset growth during the Q3 2020, with a y-o-y growth of 9.1% to US$1.9t in Q3 2020 from US$1.8t in Q3 2019. Saudi banks grew their assets base at the fastest pace of 15.2% y-o-y followed by the UAE banks that reported a y-o-y growth of 14.2%.
Aggregate loans increased by 7.4% y-o-y to US$1.2t in Q3 2020 from US$1.1t in Q3 2019. Saudi Arabian banks reported the biggest y-o-y growth in net loans for the second consecutive quarter followed by the UAE and Qatari banks.
Total loans as a percentage of assets declined by 94bps to 61.90% in Q3 2020 from 62.85% in Q3 2019.
Total assets continued to grow on back of economic recovery programs
Source: Company filings.
Loans (US$b): Q3 2019 to Q3 2020
37
7.9
53
0.5
38
4.5
19
2.2
66
.9 10
3.4
16
.6 60
.8
43
5.2
60
5.7
41
1.1
20
2.1
69
.0 10
7.0
18
.7 66
.80.0
100.0
200.0
300.0
400.0
500.0
600.0
700.0
KS
A
UA
E
Qa
tar
Ku
wa
it
Om
an
Ba
hra
in
Eg
yp
t
Jo
rda
n
Q3 2019 Q3 2020
Total asset growth by region: Q3 2019 to Q3 2020
Q2 2019 Q2 2020
KSA 5.5% 15.2%
UAE 14.9% 14.2%
Qatar 6.7% 6.9%
Kuwait 7.6% 5.1%
Oman 3.7% 3.1%
Bahrain 4.4% 3.5%
Egypt 10.4% 12.3%
Jordan -1.6% 9.9%
24
1.8
32
8.4
27
5.3
10
5.5
51
.4
51
.1
18
.0
32
.7
27
9.7
34
7.6
29
6.5
11
3.2
51
.4
51
.8
11
.0 34
.5
0.0
50.0
100.0
150.0
200.0
250.0
300.0
350.0
400.0
KS
A
UA
E
Qa
tar
Ku
wa
it
Om
an
Ba
hra
in
Eg
yp
t
Jo
rda
nQ3 2019 Q3 2020
Loans growth by region: Q3 2019 to Q3 2020Loan to asset ratio: Q3 2019 to Q3 2020
64
.0%
61
.9% 7
1.6
%
54
.9%
76
.8%
49
.4% 6
0.5
%
53
.8%6
4.3
%
57
.4%
72
.1%
56
.0%
74
.6%
48
.4% 5
9.1
%
51
.6%
0.0%
10.0%
20.0%
30.0%
40.0%
50.0%
60.0%
70.0%
80.0%
90.0%
KS
A
UA
E
Qa
tar
Ku
wa
it
Om
an
Ba
hra
in
Eg
yp
t
Jo
rda
n
Q3 2019 Q3 2020
Q2 2019 Q2 2020
KSA 4.65% 15.68%
UAE 13.17% 5.84%
Qatar 5.66% 7.73%
Kuwait 4.73% 7.30%
Oman 2.65% 0.01%
Bahrain 0.52% 1.42%
Egypt 12.01% –38.64%
Jordan –1.95% 5.47%

Banking performance
18 MENA quarterly banking report: Q3 2020
Total NPL (US$b): Q3 2019 to Q3 2020
Aggregate NPL (excluding Kuwait) stood at US$33.3b in Q3 2020, compared with US$29.3b in Q3 2019.
Among the peers, the UAE banks reported significant increase of 43.2% y-o-y to US$16.3b in Q3 2020 as compared with US$11.4b in same period previous year. This increase was fueled by high-profile corporate delinquencies due the COVID-19 pandemic.
Going forward with the impact of the COVID-19 pandemic easing off and with economy regaining its momentum, the NPLs are expected to stabilize in the coming quarters.
NPLs continue to be at record high
Source: Company filings.
4.6
11
.4
5.2
2.1
3.3
0.3
1.8
4.8
16
.3
4.7
2.3 3
.1
0.3
1.9
0.0
2.0
4.0
6.0
8.0
10.0
12.0
14.0
16.0
18.0
KSA UAE Qatar Oman Bahrain Egypt Jordan
Q2 2019 Q2 2020
NPL growth by region: Q3 2019 to Q3 2020 NPL to total loan: Q3 2019 to Q3 2020
Q3 2019 Q3 2020
KSA 24.3% 3.5%
UAE 17.8% 42.0%
Qatar 11.5% –9.3%
Kuwait – –
Oman 27.5% 7.3%
Bahrain 16.7% –6.4%
Egypt 36.9% 13.5%
Jordan 36. 4% 2.6%
1.9
%
3.8
%
1.9
%
4.1
%
6.5
%
4.1
%
5.6
%
1.7
%
5.1
%
1.6
%
4.4
%
6.0
%
3.0
%
5.4
%
0.0
0.0
0.0
0.0
0.0
0.1
0.1
0.1
KSA UAE Qatar Oman Bahrain Egypt Jordan
Q2 2019 Q2 2020

Banking performance
19MENA quarterly banking report: Q3 2020
Deposits (US$b): Q3 2019 to Q3 2020
Aggregate banking deposits increased to US$1.3t in Q3 2020 from US$1.2t in Q3 2019, recording a growth of 9.8%.
Region-wise, KSA banks reported the highest growth of 16.8% in deposits. Since the bank deposits are perceived as a safer alternative to volatile capital markets, the deposit base of the banks in the region is expected to increase in the coming quarters. Even so, government withdrawals of deposits to cover wide fiscal deficits remain a risk.
The loan to deposit ratio (LDR) for the regions declined from 83.4% in Q2 2019 to 77.4 % in Q3 2020
Deposits increased on back of lower spending and market volatility
28
2.1
36
0.0
22
1.2
12
2.4
48
.2
63
.9
13
.6 44
.4
32
9.7
41
6.3
23
4.8
13
3.8
48
.6
63
.5
15
.2 49
.50.0
50.0
100.0
150.0
200.0
250.0
300.0
350.0
400.0
450.0
KSA UAE Qatar Kuwait Oman Bahrain Egypt Jordan
Q3 2019 Q3 2020
Deposits growth by region: Q3 2019 to Q3 2020 Loan to deposit ratio: Q3 2019 to Q3 2020
Q3 2019 Q3 2020
KSA 4.4% 16.8%
UAE 13.0% 15.6%
Qatar 6.9% 6.2%
Kuwait 12.1% 9.3%
Oman 2.6% 0.7%
Bahrain –0.2% –0.7%
Egypt 1.2% 12.1%
Jordan –2.6% 11.4%
83
.5%
83
.4%
11
9.2
%
86
.2% 1
02
.2%
75
.9%
70
.5%
67
.1%8
2.7
%
76
.9%
12
1.1
%
84
.6% 1
01
.3%
77
.5%
68
.6%
62
.6%
0.0
0.2
0.4
0.6
0.8
1.0
1.2
1.4
KSA UAE Qatar Kuwait Oman Bahrain Egypt Jordan
Q3 2019 Q3 2020
Source: Company filings.

Banks in the MENA region faced a rough Q3 2020 due to the further spread of the COVID-19 pandemic. Many banks activated resilience measures to combat the impact of the situation. In general, the following trends were identified across the region.
MENA quarterly banking report: Q3 202020

Sector insights
04
MENA quarterly banking report: Q3 2020 21
1
2
Growing focus on cashless economy boosted by a thriving ecosystem for FinTechs
Top MENA banks set to focus on cost optimization
3Sustainable finance poised for growth in Middle East

22 MENA quarterly banking report: Q3 2020
Source: New articles.
Growing focus on cashless economy boosted by a thriving ecosystem for FinTechs
Technology and the emergence of complex capital markets are creating opportunities to expand the labor market, especially in the MENA region, where many countries have larger than average informal economies. The informal sector is fueled by cash transactions which results in difficulty in regulating a significant part of the economy. Compounded with the COVID-19 pandemic, informal economies are finding it hard to sustain themselves, which in turn has slowed down economic and social development.
This calls for a transition to a cashless economy in order to support the economic inclusion of underserved communities, increase development of the private sector and reduce corruption, while complying with the COVID-19 pandemic measures of limiting interactions that could potentially increase the transmission.
Sensing the potential opportunity, the FinTech industry in the Middle East is quickly adapting to this shift.
Rise of FinTech companies in the MENA region…
The opportunity of becoming a cashless economy has fueled a tidal wave of FinTech companies that aim to either disrupt banking and take a piece of their market share, or simply partner with them to give them a competitive edge.
The UAE and KSA lead the race in the region with companies such as PayTabs (KSA), Beehive (UAE) and Eureeca (UAE) securing well over US$50m in funding. Jordan and Egypt are also catching up with multimillion dollar funded FinTech companies like Liwwa (Jordan) and Vapulus(Egypt).
Central Bank’s response…
The Central Banks in the MENA countries have realized the potential benefits these FinTech companies can deliver to the citizen and the economies at large. Though initially reluctant, the Centrals Banks are encouraging the FinTech boom by providing subsidies, investments and also by getting into partnerships.
The CBUAE has launched a FinTech office which aims to develop a mature financial technology ecosystem within the country. The CBE has launched its own digital payment initiative, the Meeza debit card, to push toward more cashless payments. Saudi Arabia has it own electronic payments network, Mada, focusing on a wider acceptance of digital payment options across the region.
Regulating the FinTech industry…
The UAE remains the regional leader for FinTech, both in respect of the number of participants and forward thinking approaches of the UAE governmental authorities. From a regulatory standpoint, this is reflected in the rapid development of FinTech regulations covering payment services or mobile wallets, cryptocurrency trading or initial coin offering (ICO), crowdfunding and sandbox or regulatory testing license. Bahrain, on the other hand, is actively developing a FinTech industry involving different governmental authorities. The CBB, the regulator for the financial sector, has entered into a memorandum of understanding (MoU) with the Monetary Authority of Singapore (MAS) and the ADGM, with the aim of facilitating cooperation on innovation projects and regulatory initiatives. The CBB has also launched a regulatory sandbox (RS) to test FinTech solutions. With regulations such as SAMA-approved payment systems, the Capital Market Authority (CMA) issued “Financial Technology Experimental Permit Instructions”. KSA is also strengthening the regulatory framework and moving toward becoming a major FinTech hub in the region.
Expanding the regulatory frameworks to scale up the FinTech operations is something the MENA countries must consider for a thriving FinTech ecosystem. Foreign investment, data privacy and digital currencies are key areas that will require robust regulations keeping the future scale in vision.
Way forward…
Regulatory harmonization within the MENA countries (ultimately across countries) and developing trusting relationships between banks and FinTechs are the key drivers that can enable the FinTech industry reach its true potential.
Sector insights
23 MENA quarterly banking report: Q3 2020
Source: New articles.
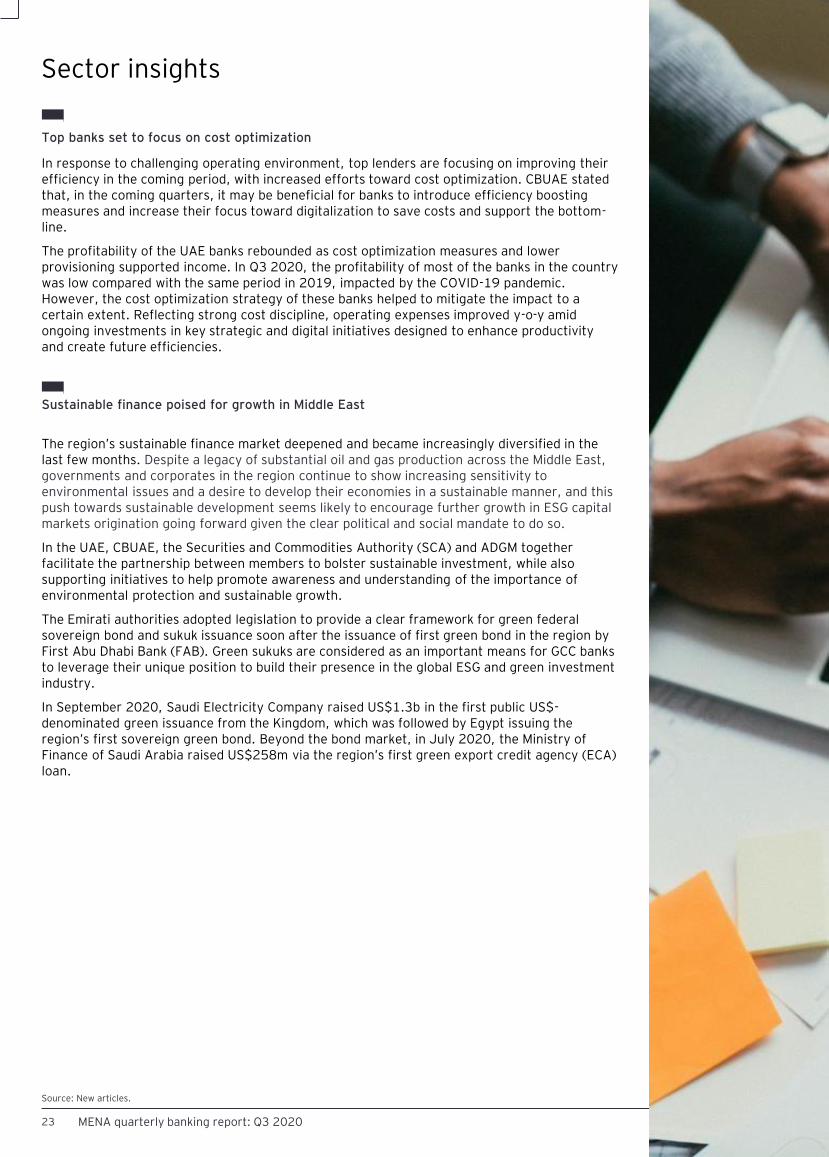
Top banks set to focus on cost optimization
In response to challenging operating environment, top lenders are focusing on improving their efficiency in the coming period, with increased efforts toward cost optimization. CBUAE stated that, in the coming quarters, it may be beneficial for banks to introduce efficiency boosting measures and increase their focus toward digitalization to save costs and support the bottom-line.
The profitability of the UAE banks rebounded as cost optimization measures and lower provisioning supported income. In Q3 2020, the profitability of most of the banks in the country was low compared with the same period in 2019, impacted by the COVID-19 pandemic. However, the cost optimization strategy of these banks helped to mitigate the impact to a certain extent. Reflecting strong cost discipline, operating expenses improved y-o-y amid ongoing investments in key strategic and digital initiatives designed to enhance productivity and create future efficiencies.
Sustainable finance poised for growth in Middle East
The region’s sustainable finance market deepened and became increasingly diversified in the last few months. Despite a legacy of substantial oil and gas production across the Middle East, governments and corporates in the region continue to show increasing sensitivity to environmental issues and a desire to develop their economies in a sustainable manner, and this push towards sustainable development seems likely to encourage further growth in ESG capital markets origination going forward given the clear political and social mandate to do so.
In the UAE, CBUAE, the Securities and Commodities Authority (SCA) and ADGM together facilitate the partnership between members to bolster sustainable investment, while also supporting initiatives to help promote awareness and understanding of the importance of environmental protection and sustainable growth.
The Emirati authorities adopted legislation to provide a clear framework for green federal sovereign bond and sukuk issuance soon after the issuance of first green bond in the region by First Abu Dhabi Bank (FAB). Green sukuks are considered as an important means for GCC banks to leverage their unique position to build their presence in the global ESG and green investment industry.
In September 2020, Saudi Electricity Company raised US$1.3b in the first public US$-denominated green issuance from the Kingdom, which was followed by Egypt issuing the region’s first sovereign green bond. Beyond the bond market, in July 2020, the Ministry of Finance of Saudi Arabia raised US$258m via the region’s first green export credit agency (ECA) loan.
Sector insights

24MENA quarterly banking report: Q3 2020

MENA quarterly banking report: Q3 202025
Glossary
Annexure
05
MENA quarterly banking report: Q3 2020 26
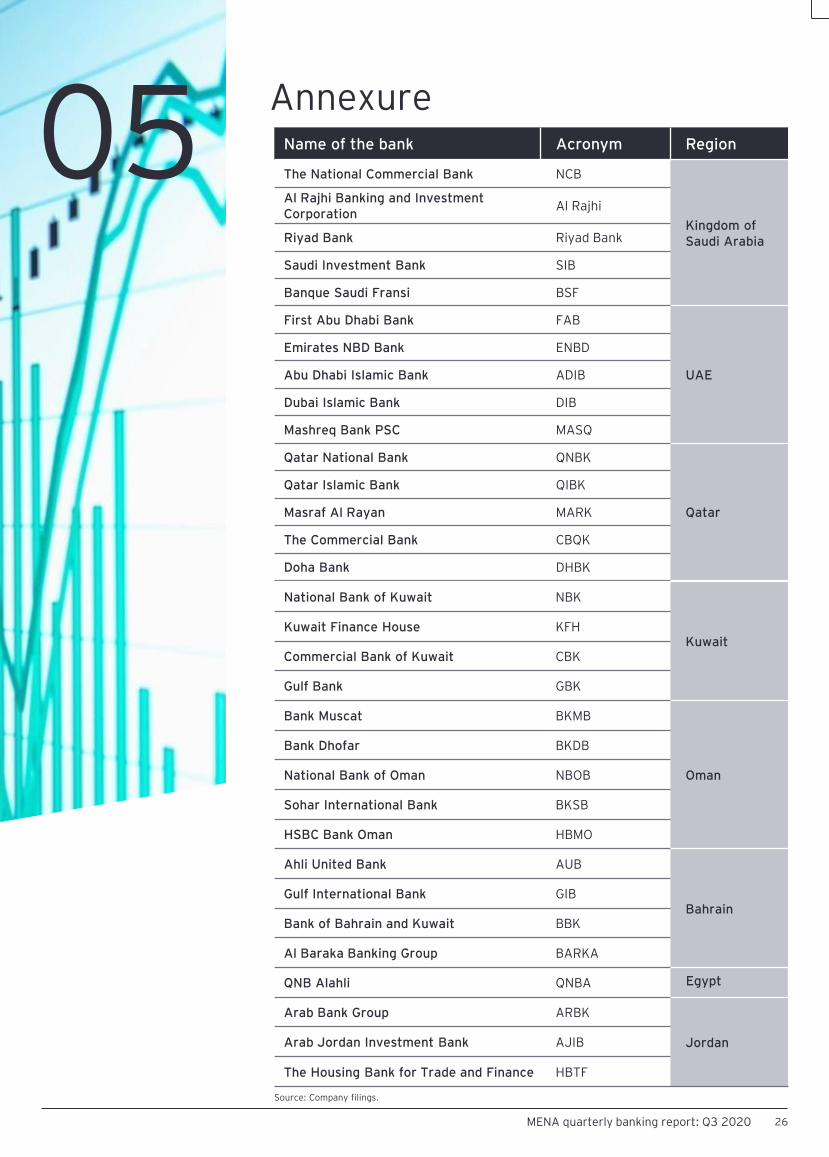
Name of the bank Acronym Region
The National Commercial Bank NCB
Kingdom ofSaudi Arabia
Al Rajhi Banking and Investment Corporation
Al Rajhi
Riyad Bank Riyad Bank
Saudi Investment Bank SIB
Banque Saudi Fransi BSF
First Abu Dhabi Bank FAB
UAE
Emirates NBD Bank ENBD
Abu Dhabi Islamic Bank ADIB
Dubai Islamic Bank DIB
Mashreq Bank PSC MASQ
Qatar National Bank QNBK
Qatar
Qatar Islamic Bank QIBK
Masraf Al Rayan MARK
The Commercial Bank CBQK
Doha Bank DHBK
National Bank of Kuwait NBK
KuwaitKuwait Finance House KFH
Commercial Bank of Kuwait CBK
Gulf Bank GBK
Bank Muscat BKMB
Oman
Bank Dhofar BKDB
National Bank of Oman NBOB
Sohar International Bank BKSB
HSBC Bank Oman HBMO
Ahli United Bank AUB
BahrainGulf International Bank GIB
Bank of Bahrain and Kuwait BBK
Al Baraka Banking Group BARKA
QNB Alahli QNBA Egypt
Arab Bank Group ARBK
JordanArab Jordan Investment Bank AJIB
The Housing Bank for Trade and Finance HBTF
Source: Company filings.

27 MENA quarterly banking report: Q3 2020
Name of the bank Fitch Moody’s S&P
NCB A– A1 –
Al Rajhi A– A1 –
Riyad Bank BBB+ – BBB+
SIB BBB+ A3 BBB
BSF BBB+ A1 BBB+
FAB AA– Aa3 AA–
ENBD A+ A3 –
ADIB A+ A2 –
DIB A A3 –
MASQ A Baa2 BBB+
QNBK A+ Aa3 A
QIBK A A1 A
MARK – A1 –
CBQK A A3 BBB+
DHBK A A3 –
NBK AA– Aa3 A
KFH A+ A1 –
CBK A+ A3 –
GBK – A3 A–
BKMB BB Ba2 BB–
BKDB BB– Ba3 –
NBOB BB– B1 –
BKSB B+ B1 –
HBMO BB+ Ba1 –
AUB BBB– A2 BBB
GIB BBB+ Baa1 –
BBK BB– – –
BARKA – – BB
QNBA B+ Ba2 –
ARBK BB– Ba2 BB+
AJIB – – –
HBTF – – -
Ratings
Source: Company filings.
28MENA quarterly banking report: Q3 2020
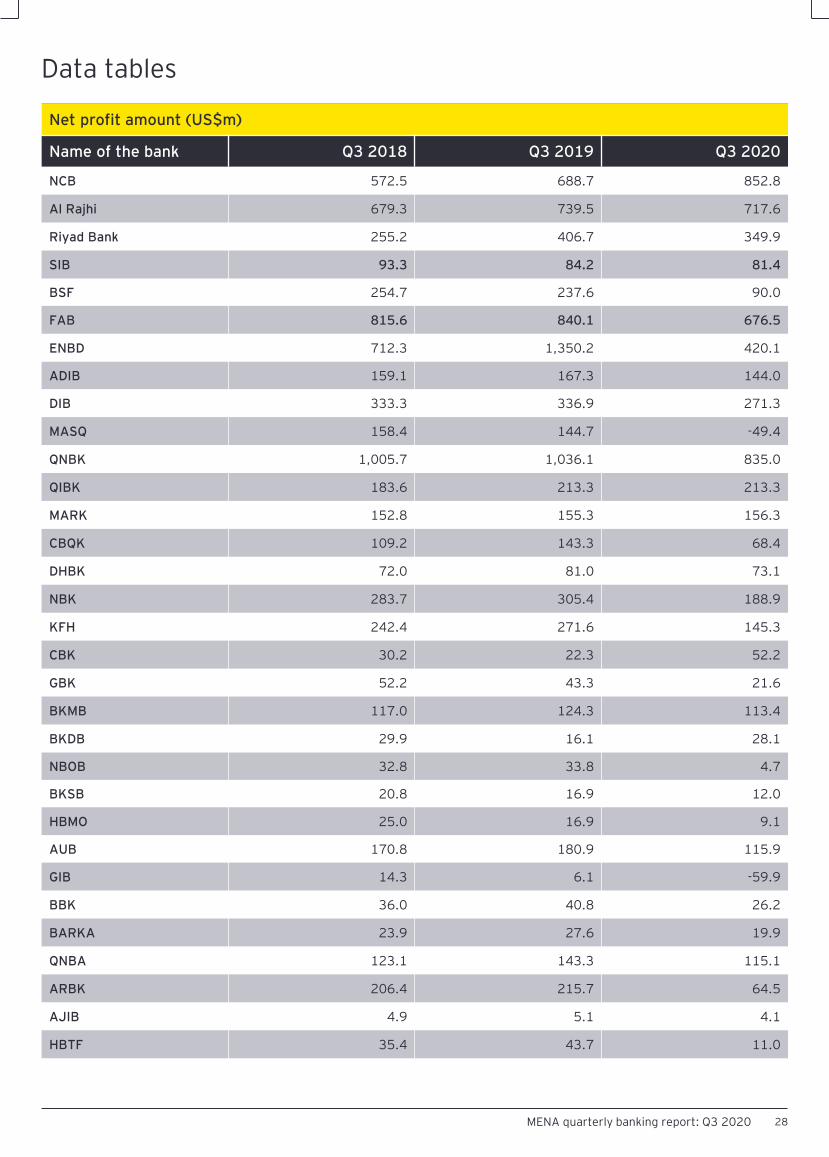
Net profit amount (US$m)
Name of the bank Q3 2018 Q3 2019 Q3 2020
NCB 572.5 688.7 852.8
Al Rajhi 679.3 739.5 717.6
Riyad Bank 255.2 406.7 349.9
SIB 93.3 84.2 81.4
BSF 254.7 237.6 90.0
FAB 815.6 840.1 676.5
ENBD 712.3 1,350.2 420.1
ADIB 159.1 167.3 144.0
DIB 333.3 336.9 271.3
MASQ 158.4 144.7 -49.4
QNBK 1,005.7 1,036.1 835.0
QIBK 183.6 213.3 213.3
MARK 152.8 155.3 156.3
CBQK 109.2 143.3 68.4
DHBK 72.0 81.0 73.1
NBK 283.7 305.4 188.9
KFH 242.4 271.6 145.3
CBK 30.2 22.3 52.2
GBK 52.2 43.3 21.6
BKMB 117.0 124.3 113.4
BKDB 29.9 16.1 28.1
NBOB 32.8 33.8 4.7
BKSB 20.8 16.9 12.0
HBMO 25.0 16.9 9.1
AUB 170.8 180.9 115.9
GIB 14.3 6.1 -59.9
BBK 36.0 40.8 26.2
BARKA 23.9 27.6 19.9
QNBA 123.1 143.3 115.1
ARBK 206.4 215.7 64.5
AJIB 4.9 5.1 4.1
HBTF 35.4 43.7 11.0
Data tables
29 MENA quarterly banking report: Q3 2020
Data tables
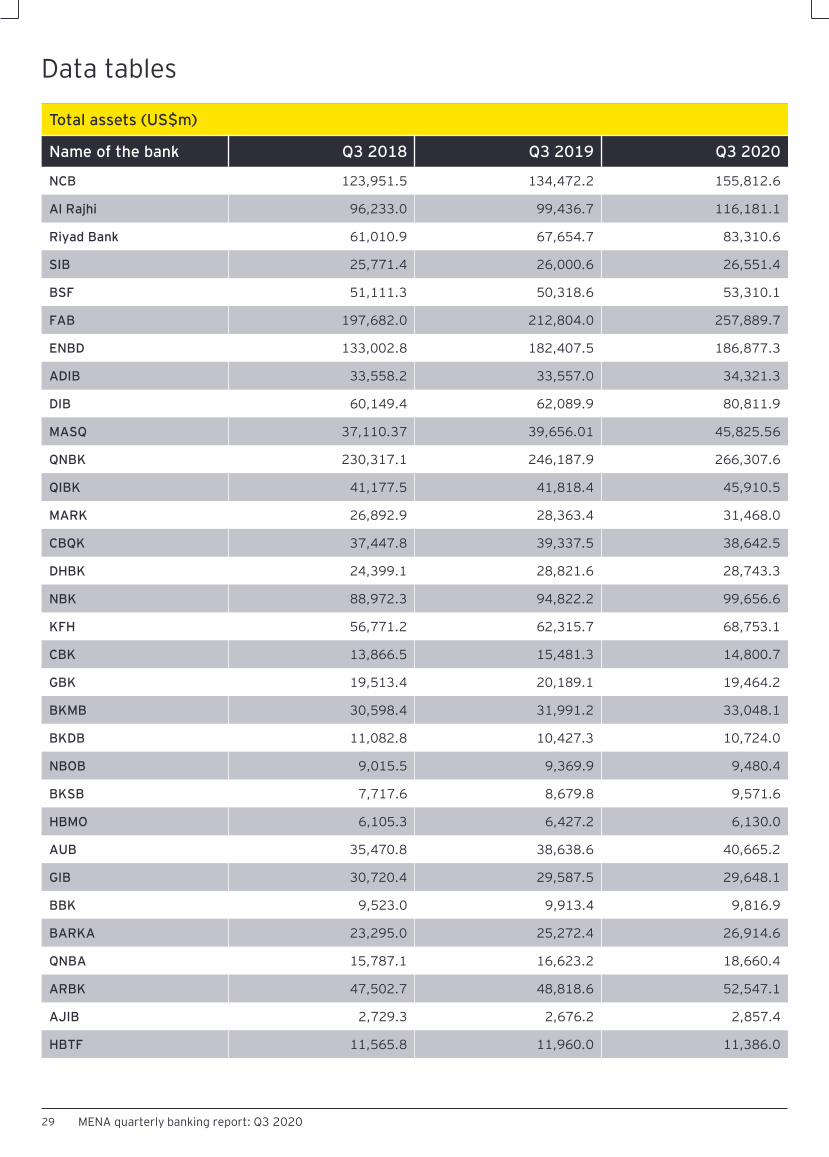
Total assets (US$m)
Name of the bank Q3 2018 Q3 2019 Q3 2020
NCB 123,951.5 134,472.2 155,812.6
Al Rajhi 96,233.0 99,436.7 116,181.1
Riyad Bank 61,010.9 67,654.7 83,310.6
SIB 25,771.4 26,000.6 26,551.4
BSF 51,111.3 50,318.6 53,310.1
FAB 197,682.0 212,804.0 257,889.7
ENBD 133,002.8 182,407.5 186,877.3
ADIB 33,558.2 33,557.0 34,321.3
DIB 60,149.4 62,089.9 80,811.9
MASQ 37,110.37 39,656.01 45,825.56
QNBK 230,317.1 246,187.9 266,307.6
QIBK 41,177.5 41,818.4 45,910.5
MARK 26,892.9 28,363.4 31,468.0
CBQK 37,447.8 39,337.5 38,642.5
DHBK 24,399.1 28,821.6 28,743.3
NBK 88,972.3 94,822.2 99,656.6
KFH 56,771.2 62,315.7 68,753.1
CBK 13,866.5 15,481.3 14,800.7
GBK 19,513.4 20,189.1 19,464.2
BKMB 30,598.4 31,991.2 33,048.1
BKDB 11,082.8 10,427.3 10,724.0
NBOB 9,015.5 9,369.9 9,480.4
BKSB 7,717.6 8,679.8 9,571.6
HBMO 6,105.3 6,427.2 6,130.0
AUB 35,470.8 38,638.6 40,665.2
GIB 30,720.4 29,587.5 29,648.1
BBK 9,523.0 9,913.4 9,816.9
BARKA 23,295.0 25,272.4 26,914.6
QNBA 15,787.1 16,623.2 18,660.4
ARBK 47,502.7 48,818.6 52,547.1
AJIB 2,729.3 2,676.2 2,857.4
HBTF 11,565.8 11,960.0 11,386.0
30MENA quarterly banking report: Q3 2020
Data tables
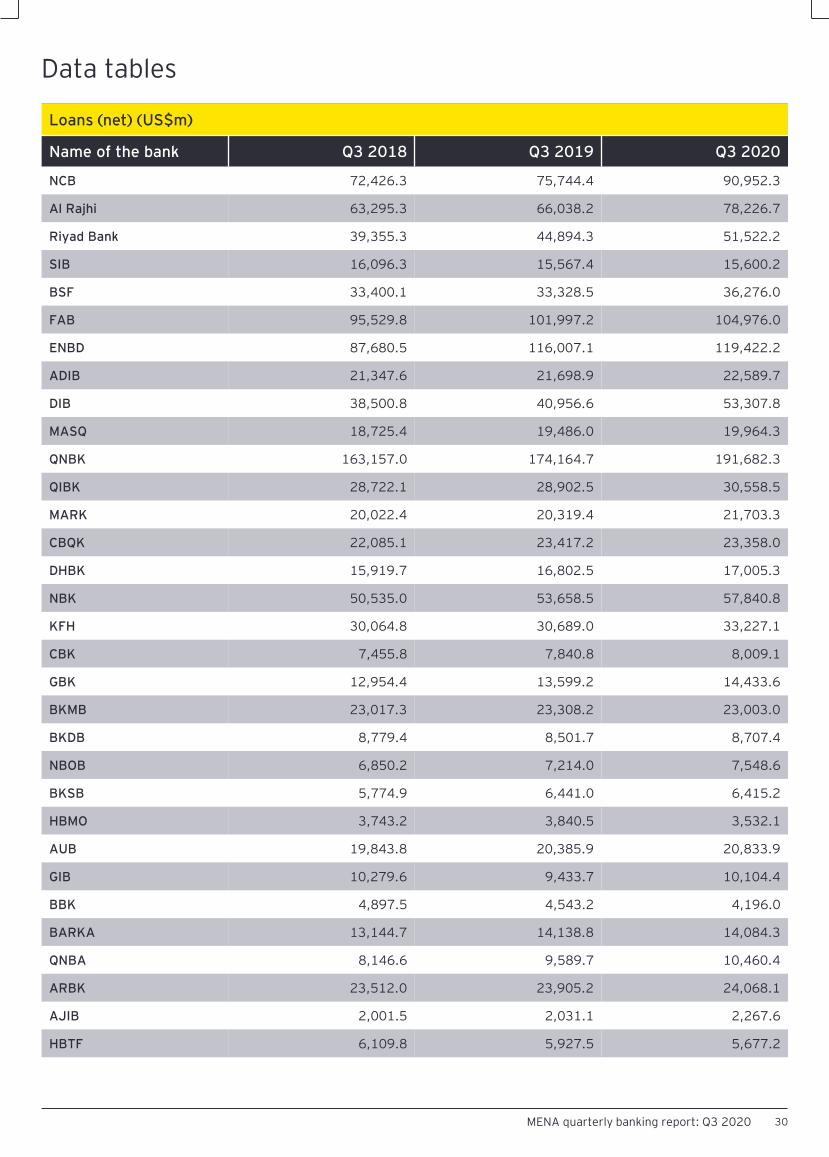
Loans (net) (US$m)
Name of the bank Q3 2018 Q3 2019 Q3 2020
NCB 72,426.3 75,744.4 90,952.3
Al Rajhi 63,295.3 66,038.2 78,226.7
Riyad Bank 39,355.3 44,894.3 51,522.2
SIB 16,096.3 15,567.4 15,600.2
BSF 33,400.1 33,328.5 36,276.0
FAB 95,529.8 101,997.2 104,976.0
ENBD 87,680.5 116,007.1 119,422.2
ADIB 21,347.6 21,698.9 22,589.7
DIB 38,500.8 40,956.6 53,307.8
MASQ 18,725.4 19,486.0 19,964.3
QNBK 163,157.0 174,164.7 191,682.3
QIBK 28,722.1 28,902.5 30,558.5
MARK 20,022.4 20,319.4 21,703.3
CBQK 22,085.1 23,417.2 23,358.0
DHBK 15,919.7 16,802.5 17,005.3
NBK 50,535.0 53,658.5 57,840.8
KFH 30,064.8 30,689.0 33,227.1
CBK 7,455.8 7,840.8 8,009.1
GBK 12,954.4 13,599.2 14,433.6
BKMB 23,017.3 23,308.2 23,003.0
BKDB 8,779.4 8,501.7 8,707.4
NBOB 6,850.2 7,214.0 7,548.6
BKSB 5,774.9 6,441.0 6,415.2
HBMO 3,743.2 3,840.5 3,532.1
AUB 19,843.8 20,385.9 20,833.9
GIB 10,279.6 9,433.7 10,104.4
BBK 4,897.5 4,543.2 4,196.0
BARKA 13,144.7 14,138.8 14,084.3
QNBA 8,146.6 9,589.7 10,460.4
ARBK 23,512.0 23,905.2 24,068.1
AJIB 2,001.5 2,031.1 2,267.6
HBTF 6,109.8 5,927.5 5,677.2

31 MENA quarterly banking report: Q3 2020
Data tables
Deposit (US$m)
Name of the bank Q3 2018 Q3 2019 Q3 2020
NCB 87,874.5 91,903.1 110,287.9
Al Rajhi 79,752.7 81,535.6 96,286.5
Riyad Bank 44,939.9 52,392.9 65,862.8
SIB 17,285.0 17,540.1 16,157.1
BSF 40,453.7 38,758.4 41,068.8
FAB 134,010.0 139,401.6 177,995.9
ENBD 92,116.7 126,421.7 123,662.0
ADIB 27,073.6 27,531.9 28,093.2
DIB 43,332.6 43,966.8 61,019.3
MASQ 22,203.0 22,709.3 25,573.2
QNBK 165,956.6 178,885.6 193,082.5
QIBK 4,093.7 4,086.5 4,340.2
MARK 1,913.2 1,960.6 2,411.2
CBQK 20,929.1 20,315.4 19,941.3
DHBK 14,006.1 15,902.2 15,072.0
NBK 48,181.6 54,066.9 60,509.1
KFH 37,729.8 43,451.8 48,917.9
CBK 6,795.8 7,924.5 8,012.7
GBK 16,838.9 17,309.5 16,759.5
BKMB 23,032.9 24,236.2 23,879.2
BKDB 7,907.1 7,088.4 6,874.7
NBOB 6,501.6 6,550.4 6,701.2
BKSB 4,511.5 5,186.7 6,107.4
HBMO 5,049.5 5,170.9 5,000.3
AUB 27,794.1 29,523.7 29,845.1
GIB 24,132.2 21,710.0 20,233.4
BBK 6,958.4 6,824.5 6,633.7
BARKA 5,185.4 5,857.4 6,783.0
QNBA 13,359.1 13,600.7 15,249.8
ARBK 34,588.50 35,115.30 38,691.40
AJIB 2,001.5 2,031.1 2,267.6
HBTF 9,041.8 9,329.3 8,555.6

EY MENA
We have a long history in MENA, having opened the first office of an EY member firm in 1923. We have over 6,600 talented people, in 14 countries and 21 offices, with a shared way of working and commitment to quality.
Further reading
How open banking could save branch banking
Read the complete report Read the complete report
How banks can reimagine the collections model
Ten ways FIs can address climate-related risks and opportunities
Read the complete report
EY locations in the Middle East
UAE
Jordan
Kuwait Oman EgyptQatarSaudi Arabia Bahrain
Lebanon Palestine Iraq Iran Libya Syria
32MENA quarterly banking report: Q3 2020

EY | Building a better working world
EY exists to build a better working world, helping to create long-term value for clients, people and society and build trust in the capital markets.
Enabled by data and technology, diverse EY teams in over 150 countries provide trust through assurance and help clients grow, transform and operate.
Working across assurance, consulting, law, strategy, tax and transactions, EY teams ask better questions to find new answers for the complex issues facing our world today.
EY refers to the global organization, and may refer to one or more, of the member firms of Ernst & Young Global Limited, each of which is a separate legal entity. Ernst & Young Global Limited, a UK company limited by guarantee, does not provide services to clients. Information about how EY collects and uses personal data and a description of the rights individuals have under data protection legislation are available via ey.com/privacy. EY member firms do not practice law where prohibited by local laws. For more information about our organization, please visit ey.com.
The MENA practice of EY has been operating in the region since 1923. For over 97 years, we have grown to over 7,500 people united across 21 offices and 16 countries, sharing the same values and an unwavering commitment to quality. As an organization, we continue to develop outstanding leaders who deliver exceptional services to our clients and who contribute to our communities. We are proud of our accomplishments over the years, reaffirming our position as the largest and most established professional services organization in the region.
© 2020 EYGM Limited.All Rights Reserved.
EYG no. 009005-20Gbl
ED None
This material has been prepared for general informational purposes only and is not intended to be relied upon as accounting, tax, legal or other professional advice. Please refer to your advisors for specific advice.
ey.com