The EY Financial Services Index 4th quarter 2013 · The Financial Services Index – 4th quarter...
33
The EY Financial Services Index 4 th quarter 2013 Weak GDP growth keeps confidence levels subdued
Transcript of The EY Financial Services Index 4th quarter 2013 · The Financial Services Index – 4th quarter...

The EY Financial ServicesIndex 4th quarter 2013Weak GDP growth keeps confidence levelssubdued

The Financial Services Index – 4th quarter 2013 EY | 1
Table of contentsExecutive Summary ....................................................................................................................................2
The EY Financial Services Confidence Index is marginally stronger ...................................................................3
Retail banks’ financials are sound, but confidence remains weak ......................................................................4
Investment banks face softer growth prospects ..............................................................................................5
Strong net inflows and income boost asset manager confidence ......................................................................6
Life insurers face continued weaker prospects ...............................................................................................7
Survey data ................................................................................................................................................8
Technical note ..........................................................................................................................................27

The Financial Services Index – 4th quarter 2013 EY | 2
Executive Summary
The EY Financial Services Confidence Index is marginally stronger• The EY FSI increased from 69 to 72, driven by three of the four financial services segments reporting stronger confidence.
• Retail bank, asset management and particularly life insurance confidence made up for weaker investment bank confidence.
Retail banks financials are sound, but confidence remains weak• Retail banks’ confidence remains low in comparison to the other financial services segments, driven by weak growth
prospects and slow credit growth.
• Growth in income slowed, due primarily to slower non-interest income.
• Although operating expenses growth slowed, they remains high.
• Nevertheless, net profits are growing, albeit more moderately than earlier in 2013.
Investment banks face softer growth prospects• In 13Q4 investment banking confidence fell back to 80.
• Total income growth moderated due to slower net and non-interest income.
• Operating expenses continued to increase rapidly.
• As a result, growth in net profits after tax slowed.
Strong net inflows and income boost asset manager confidence• Business confidence rose from already strong levels.
• Higher confidence was driven by continued strong net inflows, rising income and soaring profits, and supported by strongerstock prices, both locally and internationally.
• Higher base management and performance fees lifted total income.
• The pace at which costs are rising are considerably higher than expectations.
• Nevertheless, net profits after tax rose further.
Life insurers face continued weaker prospects• Business confidence rebounded from a weak 67 to 80.
• However, this rebound may prove temporary given some of the fundamentals. New business premiums, lapse rates,surrenders and risk business profitability all deteriorated in 4Q13.
• However, total premium income was stronger thanks primarily to risk products.
• Investment income growth was considerably weaker.
• Life insurers cut back admin and marketing expenses considerably in a very short space of time. This boosted net profitsafter tax in the short term.
The Financial Services Index – 4th quarter 2013 EY | 3
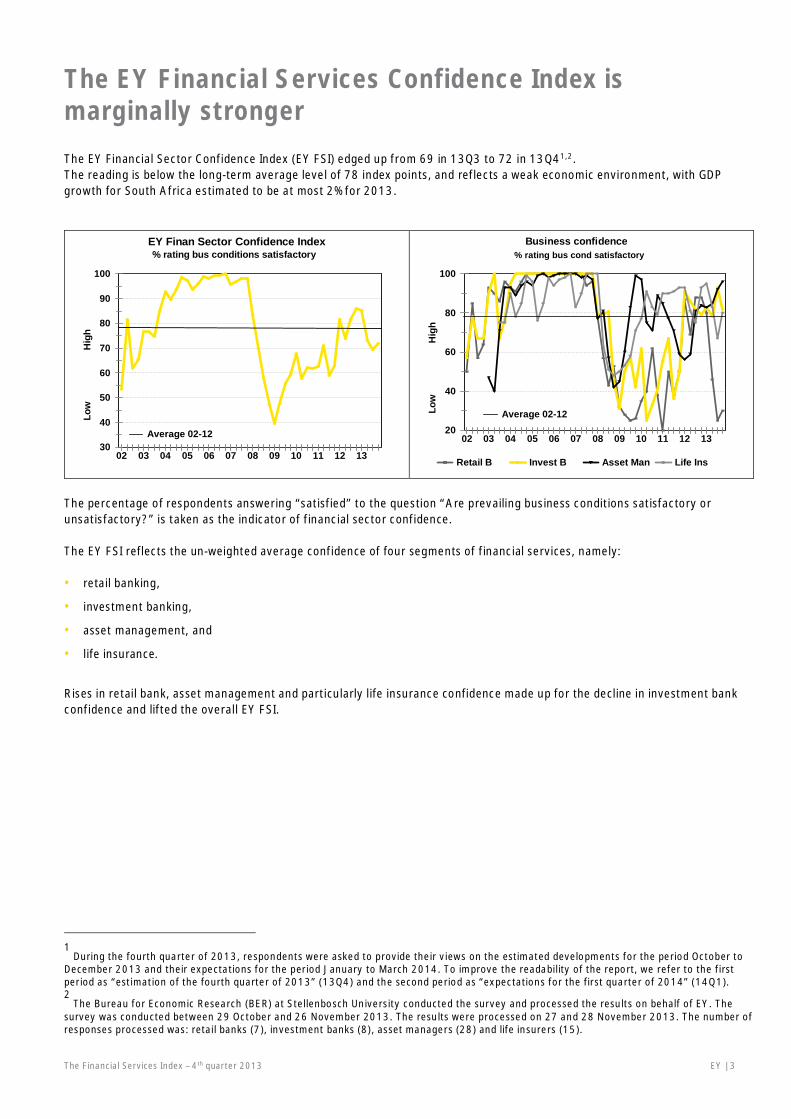
The EY Financial Services Confidence Index ismarginally strongerThe EY Financial Sector Confidence Index (EY FSI) edged up from 69 in 13Q3 to 72 in 13Q41,2.The reading is below the long-term average level of 78 index points, and reflects a weak economic environment, with GDPgrowth for South Africa estimated to be at most 2% for 2013.
30
40
50
60
70
80
90
100
Low
Hig
h
02 03 04 05 06 07 08 09 10 11 12 13
EY Finan Sector Confidence Index% rating bus conditions satisfactory
Average 02-12 20
40
60
80
100
Low
Hig
h02 03 04 05 06 07 08 09 10 11 12 13
Retail B Invest B Asset Man Life Ins
Business confidence% rating bus cond satisfactory
Average 02-12
The percentage of respondents answering “satisfied” to the question “Are prevailing business conditions satisfactory orunsatisfactory?” is taken as the indicator of financial sector confidence.
The EY FSI reflects the un-weighted average confidence of four segments of financial services, namely:
• retail banking,
• investment banking,
• asset management, and
• life insurance.
Rises in retail bank, asset management and particularly life insurance confidence made up for the decline in investment bankconfidence and lifted the overall EY FSI.
1 During the fourth quarter of 2013, respondents were asked to provide their views on the estimated developments for the period October to
December 2013 and their expectations for the period January to March 2014. To improve the readability of the report, we refer to the firstperiod as “estimation of the fourth quarter of 2013” (13Q4) and the second period as “expectations for the first quarter of 2014” (14Q1).2
The Bureau for Economic Research (BER) at Stellenbosch University conducted the survey and processed the results on behalf of EY. Thesurvey was conducted between 29 October and 26 November 2013. The results were processed on 27 and 28 November 2013. The number ofresponses processed was: retail banks (7), investment banks (8), asset managers (28) and life insurers (15).

The Financial Services Index – 4th quarter 2013 EY | 4
Retail banks financials are strong but confidenceremains weakAfter falling from 80 (of a possible 100 index points) in 13Q1 to 25 in 13Q3, retail bank confidence remains weak. Confidencereadings were slightly up in 13Q4 – to 30 points. Confidence is still considerably weaker than other financial services segments,and is considerably lower than the average 72 reading for the quarter. As pointed out in the previous edition, limited growthopportunities means weak retail bank prospects going into 2014.
Generally, stronger financial performance leads to higher confidence, but this relationship was not in evidence in the fourthquarter. Banks remain cautious in light of weak credit growth prospects across a number of key product areas, includingmortgages and unsecured lending. Over indebted consumers and weak GDP growth continue to create a generally unfavourableoutlook.
Total income growth moderated in 4Q13, due to slightly slower non-interest income. However, net interest income growthaccelerated. Slower fee income led was the main reason for slower non-interest income. Banks have been under considerablepressure to maintain bank charges, and as a result, all of the major banks have kept bank charge increases with CPI limits.
Although operating expenses (excluding the cost of funding) increased at a slightly slower pace than they had in the previousquarter, cost growth nevertheless remains high. The slower cost growth was aided by a lower headcount.
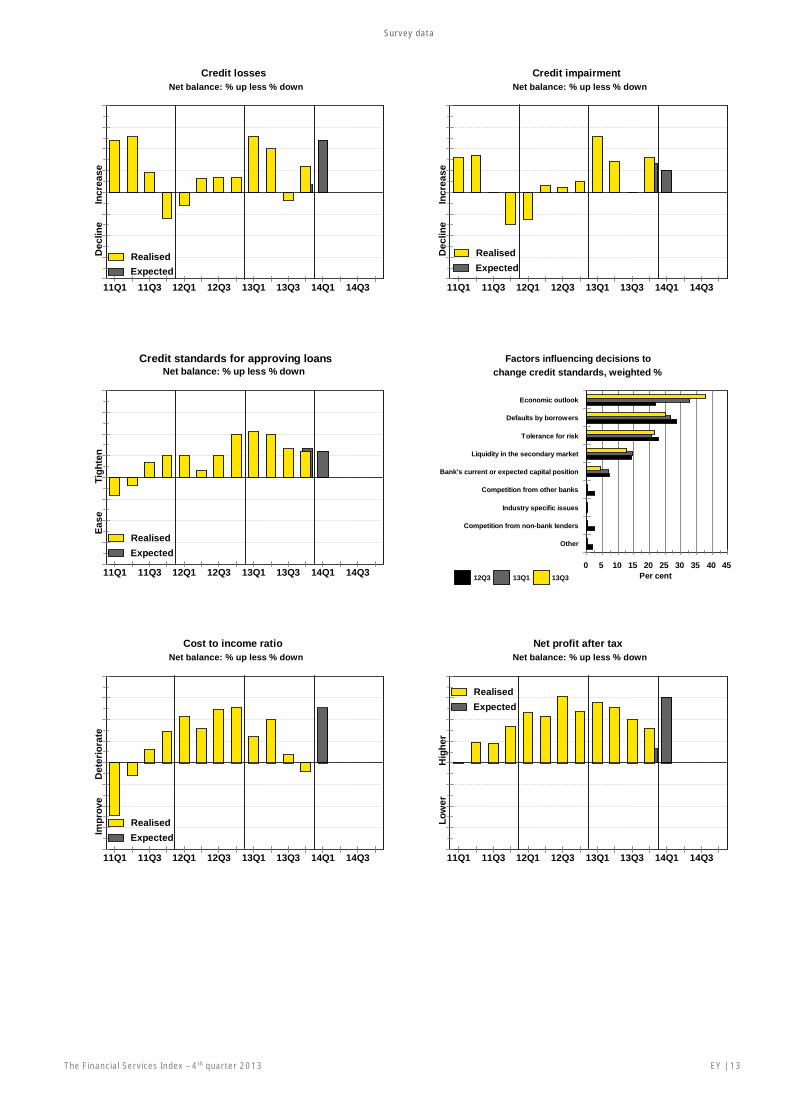
After slowing in 13Q3, credit losses rose again in 13Q4. As a result, retail banks kept their credit standards for approving loanapplications constant. Retail banks maintained relatively tight standards towards households, and easier ones towards firms.
Despite the slower income growth, and rising credit losses, net profits continued to grow in the fourth quarter, albeit moremoderately. To some extent this was aided by slowing cost growth, as banks are generally responsive to adjusting costs in linewith revenue trends.
The 13Q4 results of retail and investment banks should be taken as broad indication of the trend, as fewer than normal banksresponded by the cut-off time.

The Financial Services Index – 4th quarter 2013 EY | 5
Investment banks face softer growth prospectsCorporate and investment banks have struggled since the onset on the global financial crisis in 2008, and South Africaninvestment banks have similarly been required to reposition themselves in line with a much changed regulatory environment.In addition, slower local growth has kept corporate entities much less reluctant to invest, resulting in slow credit growth in thecorporate sector. 2013 proved to be a stronger year for CIB’s, although off a very low base, and earnings remain below theirpeak levels recorded pre 2008.
As a result of these much weaker prospects, investment banking confidence was considerably lower than that of retail banksprior to 2013. Since the beginning of the year however, local investment banks have experienced stronger demand for creditand services, resulting in much stronger confidence. In the second half of the year, investment banking confidence wasconsiderably ahead of retail banks, for the first time in many years.
Even so, investment banking confidence slowed somewhat in the fourth quarter, to 80 index points, in line with readingsrecorded since the first quarter of 2012. The 13Q3 jump to 93, therefore, turned out to be one-off.
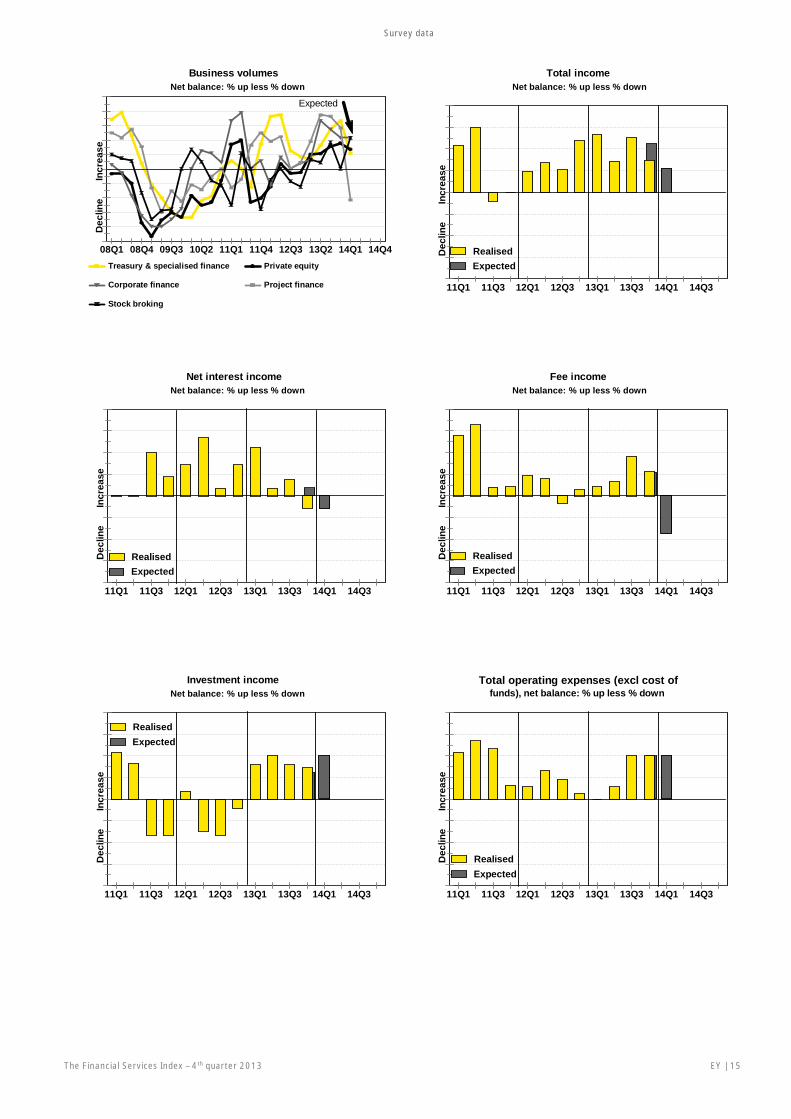
The slower confidence was driven by slower overall business volumes, which grew at 13Q2 levels, and somewhat below 13Q3levels.
Slower business volumes also impacted income levels, which slowed in the fourth quarter of 2013. Growth in total incomemoderated, driven by slowdowns in both net and non-interest income. Regarding non-interest income, fee income weakened,although investment income held steady.
Total operating expenses (excluding the cost of funding) continued to increase at a fast pace. This higher growth stemmedpartly from increases in new employment.
The slightly slower growth in income and continued relative strong rises in the cost base led to a slowing net profits growthtrend. Even so, overall growth in net profits remains strong.

The Financial Services Index – 4th quarter 2013 EY | 6
Strong net inflows and income boost asset managerconfidenceLocal stocks continued to rise through 2013, despite weak local economic fundamentals. To some extent, the continued risingshare prices are symptomatic of a corporate sector that is increasingly focused on Africa for growth. In addition, resourcestocks do not necessarily follow local economic growth, driven rather by global commodity demand drivers.The JSE ALSI rose 20% through 2013, with a 6% rise registered in the last quarter of the year.
Given the very favourable stock markets, asset manager confidence rose once again in the last quarter of 2013, from analready high 92 index points in 13Q3 to 96 in 13Q4. Strong net inflows, rising income and sharp profit rises were all stronglysupportive of the higher confidence readings. Asset managers remain the most confident segment of the financial servicessector, by a wide margin.
Rising stock markets are strongly supportive for inflows, which were strong again in the fourth quarter, across the board(institutional, unit trust and private clients). However, in the unit trust portfolio, institutional net inflows picked up, while retailnet inflows slowed. Respondents expect net inflows to remain strong in 14Q1.
Stronger stock markets are also broadly supportive of asset manager revenues. In the fourth quarter, higher base managementand performance fees both lifted total income. Not since 2006 has income grown at such a fast pace. Although respondentsexpect growth to moderate somewhat in 14Q1, they nevertheless expect it to remain relatively high by recent measures.
Buoyant market conditions also typically result in higher investment needs, and higher headcounts, both professional andadministrative. This was very much the case for fund managers in the fourth quarter, with costs rising at a continued strongpace. With the exception of bonus payments, all cost components increased at a higher rate than they had in the third quarter.
Given the very supportive environment, net profits growth accelerated again in 4Q13, as higher income growth offset thehigher cost base.

The Financial Services Index – 4th quarter 2013 EY | 7
Life insurers face continued weaker prospectsWeak economic growth characterised South Africa through 2013, as combined labour strife, a sharply depreciating currency,and stubbornly high unemployment collectively made the year difficult for business.Whilst economic growth remains subdued, and impacts the ability of life companies to grow their premium inflows, strong stockmarkets simultaneously provide a stimulus via investment income gains.
The third quarter had seen a sharp fall in life insurance confidence. In the fourth quarter, confidence levels returned to aboveaverage levels, from a weak 67 in 13Q3, to 80 in 13Q4. Whilst life insurers have recently lost their status as being the mostconfident across financial services, their confidence levels remain relatively high, and in line with long-term average levels. Thisis in sharp contrast with retail banks, which struggled in the second half of 2013, on slow growth and indebted consumers,making it difficult to grow their credit books.
For the most part, the stronger confidence is not in line with financial metrics, although there was some upside in a fewmetrics, including premium income and net profits after tax. Most metrics; – new business premiums, lapse rates, value ofsurrenders; and risk business profitability – indicate that underlying conditions are difficult.
Confidence in the life insurer segment may have been driven by premium income trends, which also rebounded in 13Q4 after aweak third quarter. This was largely driven by stronger risk business, whilst investment business remained moderate. Despitethe overall strong premium income trends, new business premium growth remains weak. Weaker new business premiumgrowth was exacerbated by rising lapse rates.
In terms of other income, investment income growth was also weaker in the fourth quarter, albeit following two strongquarters.
In terms of outflows, benefit payments growth slowed somewhat in 13Q4. In addition, life insurers cut back admin andmarketing expenses considerably during the quarter. This boosted net profits after tax in the short term, but weaker riskbusiness profitability is likely to make the environment challenging over the medium term.

The Financial Services Index – 4th quarter 2013 EY | 8
Survey data
Survey data:Business
confidence *
Retail banking Investmentbanking andspecialised
finance
Assetmanagement
Life insurance EY FinancialSector
ConfidenceIndex **
04Q1 93 95 93 90 9304Q2 91 100 89 78 9004Q3 96 100 94 85 9404Q4 100 100 96 99 9905Q1 100 100 94 96 9805Q2 100 100 99 76 9405Q3 100 100 100 85 9605Q4 100 100 98 98 9906Q1 100 100 99 94 9806Q2 100 100 100 97 9906Q3 100 100 100 98 10006Q4 100 100 100 100 10007Q1 100 100 100 83 9607Q2 100 100 98 90 9707Q3 94 100 99 100 9807Q4 96 100 97 100 9808Q1 78 79 77 100 8408Q2 57 79 81 63 7008Q3 43 81 57 51 5808Q4 53 46 42 48 4709Q1 32 31 45 50 4009Q2 28 50 60 53 4809Q3 25 57 83 58 5609Q4 26 42 99 71 6010Q1 35 62 97 77 6810Q2 40 25 75 91 5810Q3 62 33 71 83 6210Q4 38 41 89 79 6211Q1 20 55 85 90 6311Q2 50 67 77 90 7111Q3 38 36 71 91 5911Q4 50 50 59 93 6312Q1 87 91 56 93 8212Q2 69 86 59 81 7412Q3 88 82 81 75 8412Q3 88 79 84 93 8613Q1 80 83## 83 95 8513Q2 46 78 85 83 7313Q3 25 93# 92# 67 6913Q4 30## 82## 96 80 72
* Percentage of respondents rating prevailing business conditions as satisfactory. 0 = extreme lack of confidence, 100 = extreme confidence** The EY Financial Sector Confidence Index is calculated as the un-weighted arithmetic mean of the business confidence indices of retail
banks, investment banks, asset managers and life insurers. The average for the period 2002 – 2012 is 78; a reading above 78 thereforeindicates a relatively “high” confidence level and below 78 a relatively “low” confidence level.
# Data were revised after the questionnaires that arrived after the cut off date for the quarter were processed.## Lower than normal number of responses
The survey data is posted in MS Excel format on www.ber.ac.za
Click the button named “Surveys” on the top banner and then select “Financial Services” on the banner along the left handside.

Survey data
The Financial Services Index – 4th quarter 2013 EY | 9

Survey data
The Financial Services Index – 4th quarter 2013 EY | 10
Survey data: Retail Banking 1 2012 2013 2014Q2 Q3 Q4 Q1 Q2 Q3 Q4## Q1*
1 Business confidence 2 69 88 88 80 46 25 30
2. Income
a) total income 3, 4 100 89 70 65 57 50 40 70
b) net interest income 3, 5 69 72 53 35 29 25 30 50
c) fee income 3, 6 54 67 53 47 64 58 20 60
d) investment income 3, 7 16 7 -47 -19 -14 8 10 40
3. Expenditure
a) total operating expenses (excluding cost offunding) 3, 4
70 77 59 82 86 92 80 90
b) credit losses 3, 8 16 17 17 65 50 -8 30 60
c) credit impairment 3, 9 8 6 12 65 36 0 40 25
d) total number of people employed 3 0 44 -11 -17 29 33 10 30
4. Efficiency and profitability
a) cost-to-income ratio 3 39 61 64 30 50 9 -10 63
b) net profit after tax 3 54 77 59 70 64 50 40 75
5. Credit standards for approving applications for loans 3, 10
a) total 3, 4 8 25 50 53 50 33 30 30
b) households 3 -7 27 53 65 57 50 50 62
c) firms 3 33 20 21 19 25 11 29 29
* Expected## Lower than normal number of responses.1 Retail banking consists of regular retail banking, private banking, micro lending, commercial banking and corporate banking.2 % satisfactory3 Net balance (see Technical Note at the end of the report)4 The total reflects the responses of participants. It is therefore not calculated as the average of the responses to the components. Each data
series has to be considered on its own. Deviations between the total and components occur when participants reply “the same” given thatthe net balance statistic does not take “the same” responses into account. The fact that respondents only answer questions applicable tothem and that missing items are not imputed also have an effect.
5 Interest income less interest expenses6 Fees and commission7 “Investment income” refers to all income from investments and not the investment return. It excludes deferred income and capital
depreciation, but includes realised and unrealised capital losses.8 Value of non-performing loans until 09Q29 Provision for doubtful debt until 09Q210 Credit standards refer to the terms of the loans and credit lines, such as maximum size, spread of loan rates over bank’s cost of funds,
premiums charged on riskier loans, collateral requirements etc.

Survey data
The Financial Services Index – 4th quarter 2013 EY | 11
Dec
line
Incr
ease
11Q1 11Q3 12Q1 12Q3 13Q1 13Q3 14Q1 14Q3
Total incomeNet balance: % up less % down
ExpectedRealised D
eclin
eIn
crea
se
11Q1 11Q3 12Q1 12Q3 13Q1 13Q3 14Q1 14Q3
Net interest incomeNet balance: % up less % down
ExpectedRealised
Dec
line
Incr
ease
11Q1 11Q3 12Q1 12Q3 13Q1 13Q3 14Q1 14Q3
Fee incomeNet balance: % up less % down
ExpectedRealised D
eclin
eIn
crea
se
11Q1 11Q3 12Q1 12Q3 13Q1 13Q3 14Q1 14Q3
Investment incomeNet balance: % up less % down
ExpectedRealised
Dec
line
Incr
ease
11Q1 11Q3 12Q1 12Q3 13Q1 13Q3 14Q1 14Q3
Total operating expenses (excl cost offunds), net balance: % up less % down
ExpectedRealised D
eclin
eIn
crea
se
11Q1 11Q3 12Q1 12Q3 13Q1 13Q3 14Q1 14Q3
Number of people employedNet balance: % up less % down
ExpectedRealised

Survey data
The Financial Services Index – 4th quarter 2013 EY | 12
Survey data: Retail Banking (continued) 2010 2011 2012 2013Q1 Q3 Q1 Q3 Q1 Q3 Q1 Q3
6. Reasons for change in credit standards
A. Bank’s current or expected capital position 1 0 0 4 11 4 7 7 4
B. Economic outlook 1 40 41 28 18 18 22 32 38
C. Industry specific issues 1 3 10 13 10 2 0 0 0
D. Competition from other banks 1 6 0 8 10 8 2 0 0
E. Competition from non-bank lenders 1, 2 0 5 8 8 8 2 0 0
F. Tolerance for risk 1 17 17 19 6 20 23 21 21
H. Liquidity in the secondary market for these loans 1 10 9 3 6 8 14 14 13
I. Defaults by borrowers 1 25 18 18 24 25 28 27 25
J. Other 1 0 1 1 8 7 2 0 -1
7. i) Current situation
a) Marketing expenditure 3 17 81 64 20 7 26 0 10
b) Capital expenditure (land, buildings, vehicles) 3 -6 12 -11 11 23 20 11 0
c) IT expenditure (software, hardware, personnel) 3 45 81 46 -20 39 47 44 50
ii) In 12 months’ time
a) Overall business volumes 3 66 80 77 58 57 47 44 33
b) Marketing expenditure 3 88 93 100 69 29 20 33 50
c) Capital expenditure (land, buildings, vehicles) 3 17 25 15 -15 22 27 11 0
d) IT expenditure (software, hardware, personnel) 3 61 43 61 54 72 40 56 40
1 Weighted percentage (50% most important, 33% second most important and 17% third most important reason)2 Other financial intermediaries or the capital market3 Net balance (see Technical Note at the end of the report)
Survey data
The Financial Services Index – 4th quarter 2013 EY | 13
Dec
line
Incr
ease
11Q1 11Q3 12Q1 12Q3 13Q1 13Q3 14Q1 14Q3
Credit lossesNet balance: % up less % down
ExpectedRealised D
eclin
eIn
crea
se
11Q1 11Q3 12Q1 12Q3 13Q1 13Q3 14Q1 14Q3
Credit impairmentNet balance: % up less % down
ExpectedRealised
Ease
Tigh
ten
11Q1 11Q3 12Q1 12Q3 13Q1 13Q3 14Q1 14Q3
Credit standards for approving loansNet balance: % up less % down
ExpectedRealised
0 5 10 15 20 25 30 35 40 45Per cent
Other
Competition from non-bank lenders
Industry specific issues
Competition from other banks
Bank's current or expected capital position
Liquidity in the secondary market
Tolerance for risk
Defaults by borrowers
Economic outlook
12Q3 13Q1 13Q3
Factors influencing decisions tochange credit standards, weighted %
Impr
ove
Det
erio
rate
11Q1 11Q3 12Q1 12Q3 13Q1 13Q3 14Q1 14Q3
Cost to income ratioNet balance: % up less % down
ExpectedRealised Lo
wer
Hig
her
11Q1 11Q3 12Q1 12Q3 13Q1 13Q3 14Q1 14Q3
Net profit after taxNet balance: % up less % down
ExpectedRealised
Survey data
The Financial Services Index – 4th quarter 2013 EY | 14
Survey data: Investment banking 1 2012 2013 2014Q2 Q3 Q4 Q1## Q2# Q3# Q4## Q1*
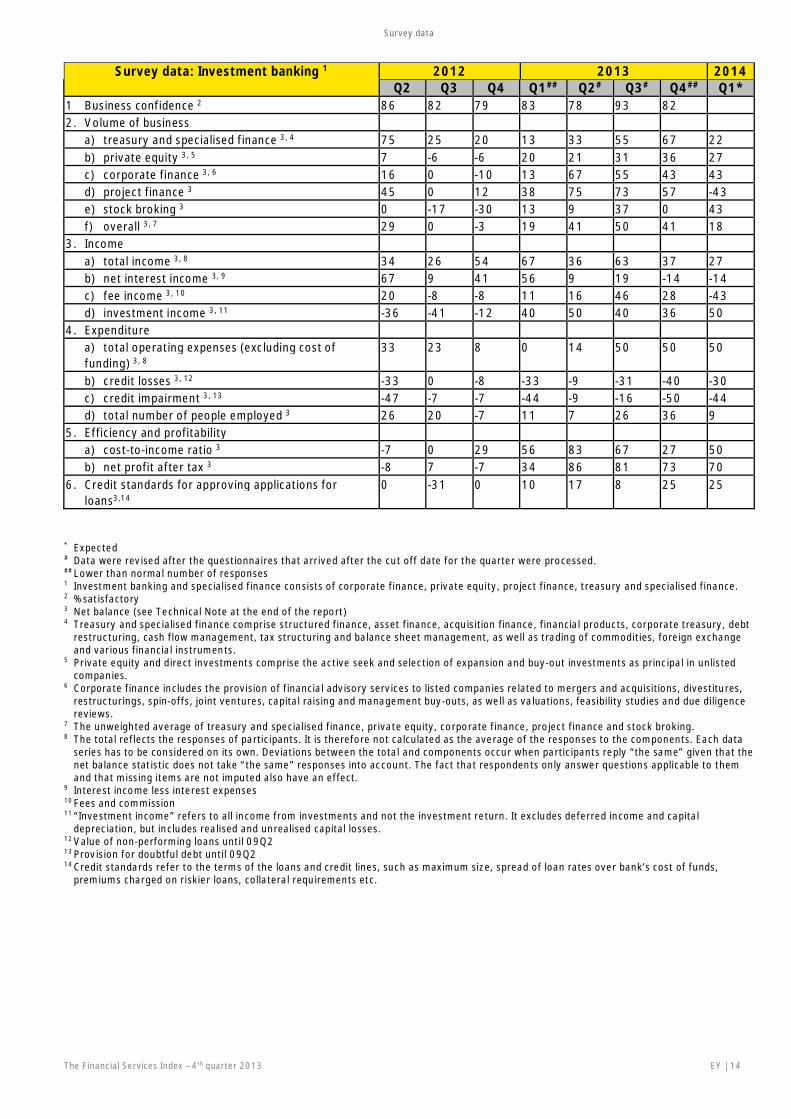
1 Business confidence 2 86 82 79 83 78 93 822. Volume of business
a) treasury and specialised finance 3, 4 75 25 20 13 33 55 67 22b) private equity 3, 5 7 -6 -6 20 21 31 36 27c) corporate finance 3, 6 16 0 -10 13 67 55 43 43d) project finance 3 45 0 12 38 75 73 57 -43e) stock broking 3 0 -17 -30 13 9 37 0 43f) overall 3, 7 29 0 -3 19 41 50 41 18
3. Incomea) total income 3, 8 34 26 54 67 36 63 37 27b) net interest income 3, 9 67 9 41 56 9 19 -14 -14c) fee income 3, 10 20 -8 -8 11 16 46 28 -43d) investment income 3, 11 -36 -41 -12 40 50 40 36 50
4. Expenditurea) total operating expenses (excluding cost offunding) 3, 8
33 23 8 0 14 50 50 50
b) credit losses 3, 12 -33 0 -8 -33 -9 -31 -40 -30c) credit impairment 3, 13 -47 -7 -7 -44 -9 -16 -50 -44d) total number of people employed 3 26 20 -7 11 7 26 36 9
5. Efficiency and profitabilitya) cost-to-income ratio 3 -7 0 29 56 83 67 27 50b) net profit after tax 3 -8 7 -7 34 86 81 73 70
6. Credit standards for approving applications forloans3,14
0 -31 0 10 17 8 25 25
* Expected# Data were revised after the questionnaires that arrived after the cut off date for the quarter were processed.## Lower than normal number of responses1 Investment banking and specialised finance consists of corporate finance, private equity, project finance, treasury and specialised finance.2 % satisfactory3 Net balance (see Technical Note at the end of the report)4 Treasury and specialised finance comprise structured finance, asset finance, acquisition finance, financial products, corporate treasury, debt
restructuring, cash flow management, tax structuring and balance sheet management, as well as trading of commodities, foreign exchangeand various financial instruments.
5 Private equity and direct investments comprise the active seek and selection of expansion and buy-out investments as principal in unlistedcompanies.
6 Corporate finance includes the provision of financial advisory services to listed companies related to mergers and acquisitions, divestitures,restructurings, spin-offs, joint ventures, capital raising and management buy-outs, as well as valuations, feasibility studies and due diligencereviews.
7 The unweighted average of treasury and specialised finance, private equity, corporate finance, project finance and stock broking.8 The total reflects the responses of participants. It is therefore not calculated as the average of the responses to the components. Each data
series has to be considered on its own. Deviations between the total and components occur when participants reply “the same” given that thenet balance statistic does not take “the same” responses into account. The fact that respondents only answer questions applicable to themand that missing items are not imputed also have an effect.
9 Interest income less interest expenses10 Fees and commission11 “Investment income” refers to all income from investments and not the investment return. It excludes deferred income and capital
depreciation, but includes realised and unrealised capital losses.12 Value of non-performing loans until 09Q213 Provision for doubtful debt until 09Q214 Credit standards refer to the terms of the loans and credit lines, such as maximum size, spread of loan rates over bank’s cost of funds,
premiums charged on riskier loans, collateral requirements etc.
Survey data
The Financial Services Index – 4th quarter 2013 EY | 15
Dec
line
Incr
ease
08Q1 08Q4 09Q3 10Q2 11Q1 11Q4 12Q3 13Q2 14Q1 14Q4Treasury & specialised finance Private equity
Corporate finance Project finance
Stock broking
Business volumesNet balance: % up less % down
Expected
Dec
line
Incr
ease
11Q1 11Q3 12Q1 12Q3 13Q1 13Q3 14Q1 14Q3
Total incomeNet balance: % up less % down
ExpectedRealised
Dec
line
Incr
ease
11Q1 11Q3 12Q1 12Q3 13Q1 13Q3 14Q1 14Q3
Net interest incomeNet balance: % up less % down
ExpectedRealised D
eclin
eIn
crea
se
11Q1 11Q3 12Q1 12Q3 13Q1 13Q3 14Q1 14Q3
Fee incomeNet balance: % up less % down
ExpectedRealised
Dec
line
Incr
ease
11Q1 11Q3 12Q1 12Q3 13Q1 13Q3 14Q1 14Q3
Investment incomeNet balance: % up less % down
ExpectedRealised
Dec
line
Incr
ease
11Q1 11Q3 12Q1 12Q3 13Q1 13Q3 14Q1 14Q3
Total operating expenses (excl cost offunds), net balance: % up less % down
ExpectedRealised

Survey data
The Financial Services Index – 4th quarter 2013 EY | 16
Survey data: Investment banking (continued)
2010 2011 2012 2013Q1 Q3 Q1 Q3 Q1 Q3 Q1## Q3#
7. Reasons for change in credit standardsA. Bank’s current and expected capital position 1 13 6 3 34 17 38 45 0B. Economic outlook 1 22 25 17 0 22 14 11 22C. Industry specific issues 1 6 27 42 17 0 0 0 6D. Competition from other banks 1 7 6 3 0 0 14 17 22E. Competition from non-bank lenders 1,2 0 0 0 0 0 5 6 28F. Tolerance for risk 1 22 17 20 11 0 14 17 0H. Liquidity in the secondary market for these loans 1 4 3 8 28 45 7 0 6I. Defaults by borrowers 1 26 18 9 11 17 7 6 17J. Other 1 1 0 -1 0 0 -1 1 1
# Data were revised after the questionnaires that arrived after the cut off date for the quarter were processed.## Lower than normal number of responses1 Weighted percentage (50% most important, 33% second most important and 17% third most important reason)2 Other financial intermediaries or the capital market3 Net balance (see Technical Note at the end of the report)

Survey data
The Financial Services Index – 4th quarter 2013 EY | 17
Dec
line
Incr
ease
11Q1 11Q3 12Q1 12Q3 13Q1 13Q3 14Q1 14Q3
Number of people employedNet balance: % up less % down
ExpectedRealised D
eclin
eIn
crea
se
11Q1 11Q3 12Q1 12Q3 13Q1 13Q3 14Q1 14Q3
Credit lossesNet balance: % up less % down
ExpectedRealised
Dec
line
Incr
ease
11Q1 11Q3 12Q1 12Q3 13Q1 13Q3 14Q1 14Q3
Credit impairmentNet balance: % up less % down
ExpectedRealised Ea
seTi
ghte
n
11Q1 11Q3 12Q1 12Q3 13Q1 13Q3 14Q1 14Q3
Credit standards for approving loansNet balance: % up less % down
ExpectedRealised
Impr
ove
Det
erio
rate
11Q1 11Q3 12Q1 12Q3 13Q1 13Q3 14Q1 14Q3
Cost to income ratioNet balance: % up less % down
ExpectedRealised
Low
erH
ighe
r
11Q1 11Q3 12Q1 12Q3 13Q1 13Q3 14Q1 14Q3
Net profit after taxNet balance: % up less % down
ExpectedRealised

Survey data
The Financial Services Index – 4th quarter 2013 EY | 18
Survey data: Asset management – All 2012 2013 2014Q2 Q3 Q4 Q1 Q2 Q3# Q4 Q1*
1 Business confidence 1 59 81 84 83 85 92 962. Net inflows
a) Total net inflows 2, 3 57 43 68 36 52 37 34 64b) Institutional net inflows 2, 4 31 32 64 29 48 36 41 47c) Unit trust net inflows: total 2, 3 70 44 43 45 53 49 46 54
i) Institutional 2, 4 47 31 53 1 25 50 58 57ii) Retail 2, 5 67 38 55 67 51 49 39 51iii) Unit trust net inflows excl. money market funds 2 57 20 15 31 57 39 45 55
d) Private client net inflows 2 15 0 25 24 21 14 15 153. Income
a) Total income 2, 3 28 16 42 58 56 79 89 69b) Base management fees 2 54 58 64 50 48 56 69 55c) Performance fees 2 19 -19 -20 -26 -18 13 28 3d) Average management fees charged 2 19 23 30 20 24 57 41 23
4. Expensesa) Total expenses 2, 3 55 73 73 58 53 70 66 43b) number of people employed: total 2, 3 32 52 43 54 48 50 64 46
i) portfolio managers and analysts 2 52 32 9 38 50 25 31 37ii) other 2 33 52 45 38 26 24 39 49
c) back office costs 2 48 61 68 63 47 57 67 48d) IT and systems costs 2 46 34 51 79 63 60 75 38e) marketing costs 2 34 34 46 53 34 21 36 30f) other distribution costs 2 1 31 56 40 27 30 37 35g) bonuses paid 2 11 0 8 29 25 35 28 46
5. Efficiency and profitabilitya) net profit after tax: total 2, 3 28 13 56 52 52 78 83 63
i) local operation 2 27 13 55 50 55 81 84 66ii) foreign operation 2 38 44 15 32 46 75 62 45
b) Operating margins relative to funds undermanagement 2
22 3 24 6 27 34 30 24
c) Remuneration costs relative to inflation 2 34 41 35 43 51 65 67 58
* Expected# Data were revised after the questionnaires that arrived after the cut off date for the quarter were processed.1 % satisfactory, weighted according to firm size2 Net balance (see Technical Note at the end of the report), weighted according to firm size3 The total reflects the responses of participants. It is therefore not calculated as the average of the responses to the components. Each data
series has to be considered on its own. Deviations between the total and components occur when participants reply “the same” given thatthe net balance statistic does not take “the same” responses into account. The fact that respondents only answer questions applicable tothem and that missing items are not imputed also have an effect.
4 According to the Association of Collective Investments (ACI), an institutional fund is a fund in which an individual investor cannot invest.The units are held in the name of structures such as pension funds, provident funds, companies, endowment policies and structured funds.
5 According to the ACI, a retail fund is a fund in which individual investors can invest directly and indirectly and the investments are held intheir names. Direct investments take place when individual investors deal directly with the management companies. Indirect investmentstake place when a reseller (LISP) or third party (e.g. a broker) acts as a go-between the individual investors and the managementcompanies.

Survey data
The Financial Services Index – 4th quarter 2013 EY | 19
Dec
line
Incr
ease
11Q1 11Q3 12Q1 12Q3 13Q1 13Q3 14Q1 14Q3
Total net inflows: All firmsWeighted,net balance: % up less % down
ExpectedRealised D
eclin
eIn
crea
se
11Q1 11Q3 12Q1 12Q3 13Q1 13Q3 14Q1 14Q3
Institutional net inflows: All firmsWeighted,net balance: % up less % down
ExpectedRealised
Dec
line
Incr
ease
11Q1 11Q3 12Q1 12Q3 13Q1 13Q3 14Q1 14Q3
Unit trust net inflows: All firmsWeighted,net balance: % up less % down
ExpectedRealised D
eclin
eIn
crea
se
11Q1 11Q3 12Q1 12Q3 13Q1 13Q3 14Q1 14Q3
Private client net inflows: All firmsWeighted,net balance: % up less % down
ExpectedRealised
Dec
line
Incr
ease
11Q1 11Q3 12Q1 12Q3 13Q1 13Q3 14Q1 14Q3
Total income: All firmsWeighted,net balance: % up less % down
ExpectedRealised D
eclin
eIn
crea
se
11Q1 11Q3 12Q1 12Q3 13Q1 13Q3 14Q1 14Q3
Avg management fees charged: All firmsWeighted,net balance: % up less % down
ExpectedRealised

Survey data
The Financial Services Index – 4th quarter 2013 EY | 20
Survey data: All firms (continued) 2010 2011 2012 2013Q1 Q3 Q1 Q3 Q1 Q3 Q1 Q3
Current situation6. Capital expenditure on …
a) domestic infrastructure development 1 24 17 19 30 45 51 41 31b) foreign infrastructure development 1 0 20 15 -1 3 1 19 29
7. Productsa) Demand for
i) general equity index / tracker funds 1 18 -12 -26 -10 -14 -42 5 6ii) absolute return funds 1 47 51 42 45 -9 -31 -27 -2iii) fixed income funds 1 13 -9 16 41 44 72 49 52iv) specialist equity funds 1 11 -9 -9 -17 -13 -15 -17 -10v) style funds 1 20 -7 -39 -12 1 -24 -41 -7vi) guaranteed funds 1 27 14 -3 -10 -50 -9 -8 7vii) alternative products (e.g. hedge funds) 1 16 -21 -2 -14 -7 4 19 -12viii) balanced funds 1 67 62 33 42 47 64 83 89
b) Demand for foreign exposure 1 45 51 56 59 52 27 45 61c) Opportunities to introduce new funds 1 32 -3 16 11 10 28 64 6
8. RegulationsRestrictions caused by the regulatory environment 1 56 62 69 68 78 78 67 40
In 12 months’ time6. Capital expenditure on …
a) domestic infrastructure development 1 23 10 39 42 43 23 9 13b) foreign infrastructure development 1 11 33 25 12 11 -15 30 30
7. Productsa) Demand for
i) general equity index / tracker funds 1 6 -8 -30 -4 23 4 22 7ii) absolute return funds 1 49 50 41 34 9 -6 -18 5iii) fixed income funds 1 1 -11 17 34 39 50 49 60iv) specialist equity funds 1 12 0 -25 -13 7 -9 -13 -18v) style funds 1 23 -10 -42 -23 3 -23 -26 3vi) guaranteed funds 1 17 17 -21 -39 -28 10 0 11vii) alternative products (e.g. hedge funds) 1 32 -14 18 15 16 38 51 2viii) balanced funds 1 52 61 57 39 39 52 77 84
b) Demand for foreign exposure 1 52 76 86 74 63 48 44 45c) Opportunities to introduce new funds 1 38 1 17 24 23 35 57 33
8. RegulationsRestrictions caused by the regulatory environment 1 55 59 62 56 73 78 64 46
1 Net balance (see Technical Note at the end of the report), weighted according to firm size

Survey data
The Financial Services Index – 4th quarter 2013 EY | 21
Dec
line
Incr
ease
04Q1 05Q1 06Q1 07Q1 08Q1 09Q1 10Q1 11Q1 12Q1 13Q1
absolute return funds fixed income funds guaranteed funds
alternative products balanced funds
Low risk products
Dec
line
Incr
ease
04Q1 05Q1 06Q1 07Q1 08Q1 09Q1 10Q1 11Q1 12Q1 13Q1
general equity funds specialist equity funds style funds
High risk productsD
eclin
eIn
crea
se
11Q1 11Q3 12Q1 12Q3 13Q1 13Q3 14Q1 14Q3
Total expenses: All firmsWeighted,net balance: % up less % down
ExpectedRealised D
eclin
eIn
crea
se
11Q1 11Q3 12Q1 12Q3 13Q1 13Q3 14Q1 14Q3
No of people employed: All firmsWeighted,net balance: % up less % down
ExpectedRealised
Dec
line
Incr
ease
11Q1 11Q3 12Q1 12Q3 13Q1 13Q3 14Q1 14Q3
Net profit after tax: All firmsWeighted,net balance: % up less % down
ExpectedRealised D
eclin
eIn
crea
se
11Q1 11Q3 12Q1 12Q3 13Q1 13Q3 14Q1 14Q3
Operating margin rel to fund u ManWeighted,net balance: % up less % down
ExpectedRealised

Survey data
The Financial Services Index – 4th quarter 2013 EY | 22
Survey data: Asset management – SmallFirms 1
2012 2013 2014Q2 Q3 Q4 Q1 Q2 Q3 Q4 Q1*
1 Business confidence 2 71 66 87 91 73 62 782. Net inflows
a) Total net inflows 3, 4 22 9 52 62 37 14 37 46b) Institutional net inflows 3, 5 0 -17 35 51 34 -8 19 34c) Unit trust net inflows: total 3, 4 70 20 48 63 23 21 23 53
i) Institutional 3 26 -24 31 32 -3 -12 12 53ii) Retail 3 55 28 37 74 36 46 35 29iii) Unit trust net inflows excl. money market funds 3 61 7 27 50 32 40 38 56
d) Private client net inflows 3 36 0 24 69 42 50 53 593. Income
a) Total income 3, 4 28 -9 55 58 19 36 50 59b) Base management fees 3 29 0 38 27 28 42 25 37c) Performance fees 3 0 -37 6 -3 -28 -8 13 4d) Average management fees charged 3 -6 -12 7 27 22 28 -17 -25
4. Expensesa) Total expenses 3, 4 57 40 83 92 53 68 83 54b) number of people employed: total 3, 4 38 49 55 82 59 71 95 67
i) portfolio managers and analysts 3 34 0 18 30 30 32 74 62ii) other 3 37 39 63 70 40 64 81 71
c) back office costs 3 37 27 48 67 47 46 75 46d) IT and systems costs 3 80 24 31 49 35 43 50 46e) marketing costs 3 52 24 45 68 40 53 54 38f) other distribution costs 3 18 12 56 62 30 28 46 21g) bonuses paid 3 6 -30 -13 24 0 11 42 42
5. Efficiency and profitabilitya) net profit after tax: total 3, 4 28 -19 31 29 21 29 46 21
i) local operation 3 28 -19 23 25 28 43 43 9ii) foreign operation 3 27 -21 -26 -4 16 31 26 -19
b) Operating margins relative to funds under management3
23 -18 10 -11 2 36 0 -4
c) Remuneration costs relative to inflation 3 46 30 49 43 40 46 38 46
* Expected1 Firms with funds under management of less than R20 billion in 2007.2 % satisfactory3 Net balance (see Technical Note at the end of the report), weighted according to firm size4 The total reflects the responses of participants. It is therefore not calculated as the average of the responses to the components. Each data
series has to be considered on its own. Deviations between the total and components occur when participants reply “the same” given thatthe net balance statistic does not take “the same” responses into account. The fact that respondents only answer questions applicable tothem and that missing items are not imputed also have an effect.
5 Private pension funds, public pension funds managed on behalf of the Public Investment Commissioners (PIC), life funds, medical aid funds,etc.

Survey data
The Financial Services Index – 4th quarter 2013 EY | 23
Survey data: Asset management – Largefirms 1
2012 2013Q2 Q3 Q4 Q1 Q2 Q3# Q4 Q1*
1 Business confidence 2 52 87 82 79 92 100 1002.Net inflows
a) Total net inflows 3, 4 75 57 76 20 61 44 33 69b) Institutional net inflows 3, 5 47 51 76 18 57 49 46 50c) Unit trust net inflows: total 3, 4 70 54 42 36 69 56 50 55
i) Institutional 3 57 51 60 -11 40 67 65 58ii) Retail 3 72 42 60 65 58 50 40 55iii) Unit trust net inflows excl. money market funds 3 56 23 11 24 69 39 46 55
d) Private client net inflows 3 0 0 25 -2 9 3 7 63.Income
a) Total income 3, 4 27 26 36 59 77 92 98 73b) Base management fees 3 68 81 76 61 61 60 80 59c) Performance fees 3 29 -12 -32 -37 -13 18 32 3d) Average management fees charged 3 32 37 41 16 25 66 55 35
4.Expensesa) Total expenses 3, 4 53 88 68 42 54 70 62 41b) number of people employed: total 3, 4 29 54 36 40 42 45 58 41
i) portfolio managers and analysts 3 61 45 5 42 61 24 22 32ii) other 3 32 57 36 23 18 9 29 44
c) back office costs 3 54 75 76 61 46 61 65 48d) IT and systems costs 3 29 38 60 94 77 66 82 36e) marketing costs 3 24 37 48 46 31 11 32 28f) other distribution costs 3 -8 39 56 31 25 31 35 39g) bonuses paid 3 14 12 17 30 41 42 24 47
5.Efficiency and profitabilitya) net profit after tax: total 3, 4 28 26 68 62 70 92 92 75
i) local operation 3 26 26 68 62 70 92 92 78ii) foreign operation 3 42 60 33 46 55 83 69 57
b) Operating margins relative to funds under management3
21 11 30 15 42 35 37 32
c) Remuneration costs relative to inflation 3 29 45 28 43 56 70 74 61
* Expected# Data were revised after the questionnaires that arrived after the cut off date for the quarter were processed.1 Firms with funds under management in excess of R20 billion in 2007.2 % satisfactory3 Net balance (see Technical Note at the end of the report), weighted according to firm size4 The total reflects the responses of participants. It is therefore not calculated as the average of the responses to the components. Each data
series has to be considered on its own. Deviations between the total and components occur when participants reply “the same” given thatthe net balance statistic does not take “the same” responses into account. The fact that respondents only answer questions applicable tothem and that missing items are not imputed also have an effect.
5 Private pension funds, public pension funds managed on behalf of the Public Investment Commissioners (PIC), life funds, medical aid funds,etc.

Survey data
The Financial Services Index – 4th quarter 2013 EY | 24
Survey data: Life Insurance 1 2012 2013 2014Q2 Q3 Q4# Q1 Q2 Q3 Q4 Q1*
1 Business confidence 2 81 75 93 95 83 67 802. Inflow
a) total inflow 3, 4 4 25 47 29 41 13 22 19b) total premium income 3, 5 3 26 56 36 44 13 30 18
i) risk business / no of new contracts 3 76 70 75 60 68 70 83 50ii) investment business (only individual business) 3 18 16 9 2 22 5 5 -40
c) new business premium income 3 57 45 40 54 80 20 -3 49d) lapses / no of contracts terminated 3 9 43 18 -9 14 4 27 0e) investment income 3, 6 10 20 12 0 31 23 -12 24
3. Outflowa) total outflow 3, 7 61 82 63 62 86 61 46 44b) benefits 3 61 81 61 61 87 62 50 47c) value of surrenders 3 30 71 74 64 36 23 75 50d) sales remuneration 3, 8 72 86 96 94 83 55 60 53e) administration and marketing expenses 3 59 94 81 73 77 55 12 15f) number of full-time admin employees 3, 9 -22 -30 -38 -40 -19 -36 -15 6g) number of in-house agents 3 41 -22 -10 -32 -27 -20 5 -2
4. Profitabilitya) net profit after tax 3 -38 31 42 29 44 29 50 26b) profitability of risk business 3 13 21 28 34 71 72 -4 -9c) administration expenses as % of premium income 3 -5 58 17 11 14 35 34 22d) value of new business 3 45 45 35 57 82 38 24 25
* Expected# Data were revised after the questionnaires that arrived after the cut off date for the quarter were processed.1 Individual life and retirement annuities business plus group life and employee benefit business.2 % satisfactory, weighted according to firm size3 Net balance (see Technical Note at the end of the report), weighted according to firm size4 Weighted net balance (80% total premium income + 20% investment income)5 The total reflects the responses of participants. It is therefore not calculated as the average of the responses to the components. Each data
series has to be considered on its own. Deviations between the total and components occur when participants reply “the same” given thatthe net balance statistic does not take “the same” responses into account. The fact that respondents only answer questions applicable tothem and that missing items are not imputed also have an effect.
6 “Investment income” refers to all income from investments and not the investment return. It excludes deferred income and capitaldepreciation, but includes realised and unrealised capital losses.
7 Weighted net balance (90% benefits + 10% administration and marketing expenses)8 Distribution costs and commissions.9 Excluding field staff

Survey data
The Financial Services Index – 4th quarter 2013 EY | 25
Dec
line
Incr
ease
11Q1 11Q3 12Q1 12Q3 13Q1 13Q3 14Q1 14Q3
InflowNet balance: % up less % down
RealisedExpected
Dec
line
Incr
ease
11Q1 11Q3 12Q1 12Q3 13Q1 13Q3 14Q1 14Q3
Total premium incomeNet balance: % up less % down
RealisedExpected
Dec
line
Incr
ease
11Q1 11Q3 12Q1 12Q3 13Q1 13Q3 14Q1 14Q3
Business volumesNet balance: % up less % down
RiskInvestment Expected
Dec
line
Incr
ease
11Q1 11Q3 12Q1 12Q3 13Q1 13Q3 14Q1 14Q3
Investment incomeNet balance: % up less % down
RealisedExpected
Dec
line
Incr
ease
11Q1 11Q3 12Q1 12Q3 13Q1 13Q3 14Q1 14Q3
New business premium incomeNet balance: % up less % down
RealisedExpected
Dec
line
Incr
ease
11Q1 11Q3 12Q1 12Q3 13Q1 13Q3 14Q1 14Q3
LapsesNet balance: % up less % down
RealisedExpected

Survey data
The Financial Services Index – 4th quarter 2013 EY | 26
Dec
line
Incr
ease
11Q1 11Q3 12Q1 12Q3 13Q1 13Q3 14Q1 14Q3
OutflowNet balance: % up less % down
RealisedExpected
Dec
line
Incr
ease
11Q1 11Q3 12Q1 12Q3 13Q1 13Q3 14Q1 14Q3
BenefitsNet balance: % up less % down
RealisedExpected
Dec
line
Incr
ease
11Q1 11Q3 12Q1 12Q3 13Q1 13Q3 14Q1 14Q3
Value of surrendersNet balance: % up less % down
RealisedExpected
Dec
line
Incr
ease
11Q1 11Q3 12Q1 12Q3 13Q1 13Q3 14Q1 14Q3
Administration and marketing expensesNet balance: % up less % down
RealisedExpected
Low
erH
ighe
r
11Q1 11Q3 12Q1 12Q3 13Q1 13Q3 14Q1 14Q3
Net profit after taxNet balance: % up less % down
RealisedExpected
Low
erH
ighe
r
11Q1 11Q3 12Q1 12Q3 13Q1 13Q3 14Q1 14Q3
Profitability of risk businessNet balance: % up less % down
RealisedExpected

The Financial Services Index – 4th quarter 2013 EY | 27
Technical noteA document with more information on the survey method is available on www.ber.ac.za . Click the button named “Services”and then select “Surveys” and finally “Financial Services”. Alternatively, click on “EY Financial Survey” on the home page andthen on “Financial Services” under Quick Links.
Survey methodThe BER started conducting surveys amongst retail and investment banks in 2002. The scope of the survey was expanded toasset managers and life insurers in 2003.
EY, the international accounting and business advisory firm, not only supports the financial sector survey financially, but alsomade valuable inputs to the design and makes the overall results public. However, the BER conducts the survey and interpretsthe results. The BER treats the identities of participants and individual responses as confidential and does not reveal thisinformation to any third party, including the sponsoring firm.
The division heads of all the major retail banks, investment banks, asset managers and life insurers operating in South Africaparticipate in the survey.
The survey results reveal current and expected changes in income, expenses and profitability for these firms’ South Africaoperations only. Industry specific issues, such as banks’ credit standards and the demand for various products of assetmanagers, are covered during the first and third quarter surveys.
The surveys are conducted during March, June, September and December. The results reflect developments per calendarquarter, i.e. the first quarter reflect developments during January, February and March; the second quarter reflects April, Mayand June etc.
On occasion questionnaires reach us after the date on which the results of the current quarter are processed. Small revisionsof the survey results of the previous quarter could occur when we process such questionnaires at a later stage.
The need for the financial sector surveySouth Africa has one of the most advanced financial sectors of all emerging market economies and its development is in manyrespects on par with those of industrialised countries – and yet its performance is not measured regularly and consistently.There is a general consensus on the need for a regular, consistent and impartial financial services survey, from managers in thefinancial sector to financial analysts.
The contribution of the financial sector to GDP has in-creased over the past decade and stood at 9.7% during 2011. Thecontribution of – for example – real estate (6.0%), transport (6.6%) and retail trade (7.2%) are all lower compared to that of thefinancial sector. However, the general government (16.5%), manufacturing (12.8%) and mining (10.2%) are bigger.
Despite its importance, current information on the performance of the financial sector lags behind:
• Statistics SA publishes GDP and employment figures for the sector covering financial intermediation, insurance, real estateand business services with a lag of one quarter and no details about the sector’s financial performance.
• The compulsory monthly BA 120 (DI 200 until 2007) returns of banks to and the Annual Report of the Bank SupervisionDepartment of the Reserve Bank, the Quarterly Financial Stability Review of the Financial Stability Department of theReserve Bank and the Annual Report of the Financial Services Board (FSB) provide detailed information about theperformance of banks and other financial institutions, but the information is made public with a lag in time except for the BA120 returns.
• The interim and annual reports of listed financial companies provide information about their performance, but these reportsappear at irregular intervals (their release dates depend on the financial year-ends of the different companies) and theresults are not always comparable.
• The periodic Price Waterhouse Coopers (PWC) Survey, although entirely relevant in relation to its intended target marketand ultimate aim, differs fundamentally from the EY financial services survey. The EY survey measures the sameperformance criteria of financial institutions over time, appears quarterly and the results are obtained by means of shortquestionnaires.

Technical note
The Financial Services Index – 4th quarter 2013 EY | 28
• The quarterly unit trust and bi-annual life insurance reviews of the Association for Savings and Investment SA (ASISA) areuseful. However, the unit trust review does not provide information on the financial performance of management companiesand the life insurance review is only published twice a year.
• The investment performance and strategy of asset managers are measured regularly (e.g. Alexander Forbes and Plexus), butno regular, consistent measure of income and expenditure of asset managers exist.

Technical note
The Financial Services Index – 4th quarter 2013 EY | 29
The international standing of the financial sector surveyThe UK, Poland and Switzerland have the longest experience in conducting financial services surveys. In the UK, theConfederation of British Industries (CBI) in London has been conducting comprehensive quarterly financial services surveys inpartnership with Price Waterhouse Coopers (PWC) since December 1989. In Poland, the Research Institute for EconomicDevelopment (RIED) at the Warsaw School of Economics has been conducting a banking survey since 1999. The Swiss BusinessCycle Institute (KOF) in Zurich has been conducting a quarterly banking and insurance survey since the beginning of 2000.
In the USA, the Federal Reserve Bank has been conducting a “Senior Loan Officer Opinion Survey on Bank Lending Practices”for many years, but unlike the UK, Polish and Swiss banking surveys, it focuses on bank lending practices and not the financialperformance of the bank sector.
The South African financial services survey is modelled on those of the UK and Switzerland. However, the questionnaire hasbeen adapted for South African conditions and needs. Furthermore, it also includes the questions on credit standards forapproving applications for loans and credit lines out of the US “Senior Loan Officer Opinion Survey”.
Ensuring the reliability and accuracy of the financial sector surveyThe questionnaire has been designed for maximum efficiency and minimum input time. Only multiple-answer type ticks arerequired. No figures are requested. For example, participants only have to tick if a particular activity (such as total income ornumber of people employed) is “up”, “the same” or “down” compared to the same period a year ago and with respect to theirSouth African operations only.
Respondents are carefully selected and approached on the basis of their position in the financial world. The head of retailbanking or the head of group life insurance is quizzed and not the chairperson of the board of directors of the group or holdingcompany. Divisional heads tend to be best informed about their business units. The confidentiality of the responses adds to thehonesty and candour of participants. Furthermore, respondent quality is monitored.
The same group of participants is surveyed from one quarter to the next. Changes in the results from one quarter to the nextcan therefore be attributed to an actual change in the performance yardstick in question and not because of the participation –or not – of particular banks, asset managers or life insurers.
South Africa has relatively few banks, asset managers and life insurers. For example, four banks dominate the retail and six themerchant and investment banking sector. Likewise, two companies dominate the life insurance industry. The number ofpotential participants in a financial sector survey is therefore relatively low in South Africa.
The degree of presentation of the panel of participants has an important impact on the reliability of a quantitative survey, i.e.when respondents have to indicate actual amounts for each activity and the rand value of the level and change are calculated.In contrast, the financial sector survey is a qualitative survey, i.e. the majority view of respondents on a particular activity istaken as an indication of the direction and strength of the trend in that activity. The degree of presentation of the panel ofparticipants is less of a concern in the case of qualitative surveys. Furthermore, the participation – or not – of a particularrespondent has less of an impact on the overall results in the case of qualitative surveys compared to quantitative ones, as theview of the majority is established and not the actual size.
The participating retail and investment banks accounted for 95% of total assets of registered banks in December 2007. Thevalue of the total funds under management of the participating asset managers accounted for 63% of the total during thesecond quarter of 2007.
For reasons of focus, the following financial institutions are not covered, namely short-term insurers, public financialinstitutions (e.g. the Reserve Bank, Land Bank, Post Bank and official pension and provident funds), medical insurance savingsschemes, the informal micro-lending and savings industry, retailers providing credit and individual insurance brokers/agents.The survey also only focuses on the supply of financial services and not on the demand for such services, which stems fromgovernment, businesses, households and the rest of the world.
The survey results reveal trends and not actual figures. The net balance statistic is used to interpret the survey results. (Seenext section for more details on the interpretation of the net balance statistic.) The net balance statistic is the percentage ofrespondents replying “up” less the percentage replying “down”. The percentage of respondents replying “the same” is ignored.Over the years, the net balance statistic has proved to be the most reliable indicator of the direction and size of change in thetrend of the respective activities surveyed. The net balance statistic is a qualitative yardstick of the direction and size of theyear-on-year growth rate of a particular activity. A positive net balance implies positive year-on-year growth and vice versa.The higher the value of the net balance (positive / negative), the larger the rate of increase / decrease of the activity inquestion.

Technical note
The Financial Services Index – 4th quarter 2013 EY | 30
To aggregate the sector performance, individual responses are weighted according to their relative size. It makes sense thatthe response of a small participant has to count less compared to that of a large participant.
Results are published according to type of activity (e.g. retail banking, investment banking, life insurance and assetmanagement) and not per institution (e.g. ABSA, Investec, Sanlam or Coronation).

Technical note
The Financial Services Index – 4th quarter 2013 EY | 31
-100
-50
0
50
100
Net
bala
nce
=%
uple
ss%
dow
n
-15
-10
-5
0
5
10
15
%ch
ange
,Qon
sam
eQ
aye
arag
o
04Q1 04Q4 05Q3 06Q2 07Q1 07Q4 08Q3
Net balance of survey data (lhs)
% change YoY of quantitative data (rhs
Net balance vs % change YoY
A
B B
C C
How to interpret the net balance statisticWe base our interpretation of the survey results on the net balance statistic. Over the years, the net balance statistic hasproved to be the most reliable indicator of the direction and size of change in the trend of the respective activities surveyed.The net balance statistic is the percentage of respondents replying “up” less the percentage replying “down”. The percentageof respondents replying “the same” is ignored. For example, if the percentage of respondents rating the volume of businesshigher / the same / lower compared to the same period a year ago is as follows:
Higher Same Lower Net balance70% 10% 20% 50%
Then we can conclude that the majority of participants experienced higher business volumes. A net majority (i.e. thepercentage of respondents rating the volume of business higher less the percentage rating the volume lower) of 50% isregistered in the above example.
The net balance statistic is an advanced qualitative yardstick / indicator of the direction (up, same or down) and size (small orlarge) of the year-on-year percentage change of the corresponding quantitative data (if available) of a particular activity. A netbalance of zero tends to indicate no growth (marked “A” on the accompanying chart), between 0 and –100 a contraction(marked “B”) and between 0 and 100 an expansion (marked “C”) compared to the same quarter a year ago. A positive netbalance, therefore, implies positive year-on-year growth and vice versa. The higher the value of the net balance (positive /negative), the larger the rate of increase / decrease of the activity in question tend to be.
Note that a net balance of –50%, for instance, is therefore not equivalent to a–50% decline (calculated year-on-year) in the quantitative data series. A netbalance of –50% may correspond to –10% in the case of one set of quantitativedata and –3% in another case. The net balance and corresponding percentagechange in the quantitative data vary from one data set to the next and thisrelationship could only be established if many data points are available.

EY | Assurance | Tax | Transactions | Advisory
About EYEY is a global leader in assurance, tax, transaction and advisoryservices. The insights and quality services we deliver help buildtrust and confidence in the capital markets and in economies theworld over. We develop outstanding leaders who team to deliveron our promises to all of our stakeholders. In so doing, we play acritical role in building a better working world for our people, forour clients and for our communities.
© 2013 EYGM Limited.All Rights Reserved.
EY refers to the global organization and/or one or more of themember firms of Ernst & Young Global Limited, each of which is aseparate legal entity.
Ernst & Young Global Limited, a UK company limited byguarantee, does not provide services to clients. For moreinformation about our organization, please visit ey.com.