


Languages
Pages
Legal


STUDY ON MARKET &
VALUE CHAIN MAPPING

Study on Market and
Value Chain Mapping
Study of SME Cluster Value Chain of 19 Provinces along
the Southern Economic Corridor and Southern Coastal Corridor of
the Greater Mekong Subregion
November 2016
Trade & Investment Facilitation Department
Mekong Institute

ii
The Study Team
Trade & Investment Facilitation Department
Mekong Institute
Madhurjya Kumar Dutta, Program Director
Quan Anh Nguyen, Program Specialist
Reza Iftekhar Patwary, Program Specialist
Sanga Sattanun, Program Manager
Toru Hisada, Sr. Project Coordinator
Seang Sopheak, Program Coordinator
Ronnarit Chaiyo-seang, Program Officer
Study of SME Cluster Value Chain of 19 Provinces along
the Southern Economic Corridor and Southern Coastal Corridor of
the Greater Mekong Subregion Study conducted in: Cambodia, Myanmar, Thailand & Vietnam
Period of Study: June 2016-July 2016
Project: Enhancing Competitiveness of Small and Medium-sized Enterprises (SME) along the Southern
Economic Corridor (SEC) of ASEAN Mekong Sub region (AMS)

iii
Abbreviations and Acronyms
ADB Asian Development Bank
AOBO Analysis of Business Operations
ASEAN Association of South East Asian Nations
B2B Business to Business
BDS Business Development Service(s)
BDSPs Business Development Service Provider(s)
BMO Business Membership Organisation
CCI Chamber of Commerce and Industry
CDE Community Development Enterprise
CFC Common Facility Centre
CIFR Cambodian International Financial Reporting Standards
CMTV Cambodia, Myanmar, Thailand, Vietnam
DOI Department of Industries
ERIA Economic Research Institute for ASEAN and East Asia
FGD Focus Group Discussion
FOB Freight On Board
FTI Federation of Thai Industries
GSO General Statistics Office (Vietnam)
GVC Global Value Chain
HACCP Hazard Analysis and Critical Control Points
HH Households
HP Horse Power
KHR Cambodian Riel
LC Letter of Credit
LVC Local Value Chain
OSMEP Office of SMEs Promotion (Thailand)
OTOP One Tambon One Product
ROCL Ratchaburi Organic Company Ltd.
SEC Southern Economic Corridor
SCC Southern Coastal Corridor
SEZ Special Economic Zone
SME Small and Medium Enterprises
SWOT Strengths, Weaknesses, Opportunities, Threats
THB Thai Baht (currency)
ToR Terms of Reference
ToT Training of Trainers
UNHCR United Nations High Commissioner for Refugees
UNIDO United Nations Industrial Development Organization
VA Value Addition
VC Value Chain
VASEP Vietnam Association of Seafood Exporters and Processors
VCCI Vietnam Chamber of Commerce and Industry
VD (or VND) Vietnamese Dong (currency)

iv
Contents
ABBREVIATIONS AND ACRONYMS .................................................................................................................................................. III
LIST OF TABLES ................................................................................................................................................................................. VIII
LIST OF FIGURES ................................................................................................................................................................................. IX
LIST OF MAPS ...................................................................................................................................................................................... X
EXECUTIVE SUMMARY ....................................................................................................................................................................... 1
CHAPTER A ......................................................................................................................................................................................... 4
INTRODUCTION, BACKGROUND OF THE STUDY & METHODOLOGY .......................................................................................... 4
1.1 INTRODUCTION ............................................................................................................................................................................ 5
1.2 BACKGROUND OF THE STUDY ................................................................................................................................................... 5
1.3 DEFINITION AND IMPORTANCE OF CLUSTERS: RECENT LITERATURE ...................................................................................... 6
1.3.1 About SME Clusters and Selection of SME clusters ............................................................................................................. 6
1.4 DEFINITION OF SMES IN CMTV ................................................................................................................................................... 7
1.4.1 Product Value Chain of SME clusters ................................................................................................................................... 8
1.5 TRADE FACILITATION ASSESSMENT ............................................................................................................................................ 8
1.5.1 Identification of investment needs ....................................................................................................................................... 8
1.5.2 Role of Trade Facilitators ........................................................................................................................................................ 8
1.6 METHODOLOGY .......................................................................................................................................................................... 8
1.6.1 Population Size (Total Number of SMEs in each country).................................................................................................. 9
1.6.2 Sampling ................................................................................................................................................................................... 9
1.6.3 Sources of Data ....................................................................................................................................................................... 9
1.6.3.1 Secondary Sources .......................................................................................................................................................... 9
1.6.3.2 Primary Sources ................................................................................................................................................................. 9
Details on Types and Numbers of Representatives ..................................................................................................................... 9
CHAPTER B ........................................................................................................................................................................................ 10
CLUSTERS & GENERAL ANALYSIS ................................................................................................................................................... 10
2.0 STAKEHOLDERS PERCEPTION ON TRADE POTENTIAL ............................................................................................................ 11
2.1 GENERAL ANALYSIS ................................................................................................................................................................... 11
ROADMAP MATRIX FOR THE CLUSTERS IN 19 PROVINCES OF VIETNAM, CAMBODIA, THAILAND, MYANMAR .................. 12
CHAPTER C ....................................................................................................................................................................................... 13
VALUE CHAINS OF SME CLUSTERS IN 19 PROVINCES .................................................................................................................. 13
3.1 CAMBODIA ................................................................................................................................................................................ 14
3.1.1 Banteay Meanchey Silk Weaving Cluster .......................................................................................................................... 15
3.1.1.1 Provincial Overview ....................................................................................................................................................... 15
3.1.1.2 Cluster Introduction and SWOT Analysis ..................................................................................................................... 15
3.1.1.3 Value Chain Map of Banteay Meanchey Silk Weaving Cluster ............................................................................. 16
3.1.1.4 Banteay Meanchey Silk Weaving Cluster VC in Numbers ....................................................................................... 17
3.1.1.5 Constraints of the Cluster and the Value Chain........................................................................................................ 17
3.1.1.6 Recommended Strategies for the Cluster Value Chain .......................................................................................... 17
3.1.2 Battambang Fish Sauce Cluster .......................................................................................................................................... 18
3.1.2.1 Provincial Overview ....................................................................................................................................................... 18
3.1.2.2 Cluster Introduction and SWOT Analysis ..................................................................................................................... 18
3.1.2.3 Processing of Fish Sauce ............................................................................................................................................... 19
3.1.2.4 Value Chain Map of Battambang Fish Sauce Cluster ............................................................................................. 19
3.1.2.5 Battambang Fish Sauce Cluster Value Chain in Numbers ...................................................................................... 20
3.1.2.6 Constraints of the Cluster and the Value Chain........................................................................................................ 20
3.1.2.7 Recommended Strategies for the Cluster Value Chain .......................................................................................... 21

v
3.1.3 Pursat Orange Cluster ........................................................................................................................................................... 21
3.1.3.1 Provincial Overview ....................................................................................................................................................... 21
3.1.3.2 Cluster Introduction and SWOT Analysis ..................................................................................................................... 21
3.1.3.3 Value Chain Map of Pursat Orange Cluster .............................................................................................................. 23
3.1.3.4 Pursat Orange Cluster the Value Chain in Numbers ................................................................................................ 24
3.1.3.5 Constraints of the Cluster and the Value Chain........................................................................................................ 24
3.1.3.6 Recommended Strategies for the Cluster Value Chain .......................................................................................... 24
3.1.4 Kampong Chhnang Pottery & Ceramics Cluster ............................................................................................................. 25
3.1.4.1 Provincial Overview ....................................................................................................................................................... 25
3.1.4.2 Cluster Introduction and SWOT Analysis ..................................................................................................................... 25
3.1.4.3 Pottery & Ceramics Production Process ..................................................................................................................... 25
3.1.4.4 Value Chain Map Kampong Chhnang Pottery Cluster ........................................................................................... 26
3.1.4.5 Kampong Chhnang Pottery Cluster Value Chain in Numbers ............................................................................... 27
3.1.4.5 Constraints of the Cluster and the Value Chain........................................................................................................ 27
3.1.4.6 Recommended Strategies for the Cluster Value Chain .......................................................................................... 27
3.1.5 Svay Rieng Rice Cluster ........................................................................................................................................................ 28
3.1.5.1 Provincial Overview ....................................................................................................................................................... 28
3.1.5.2 Cluster Introduction and SWOT Analysis ..................................................................................................................... 28
3.1.5.3 Value Chain Map of Svay Rieng Rice Cluster ............................................................................................................ 30
3.1.5.4 Svay Rieng Rice Cluster the Value Chain in Numbers .............................................................................................. 31
3.1.5.5 Constraints of the Cluster and the Value Chain........................................................................................................ 31
3.1.5.6 Recommended Strategies for the Cluster Value Chain .......................................................................................... 31
3.1.6 Koh Kong Fish Sauce Cluster ................................................................................................................................................ 32
3.1.6.1 Provincial Overview ....................................................................................................................................................... 32
3.1.6.2 Cluster Introduction and SWOT Analysis ..................................................................................................................... 32
3.1.6.3 Value Chain Map of Koh Kong Fish Sauce Cluster ................................................................................................... 33
3.1.6.4 Koh Kong Fish Sauce Cluster Value Chain in Numbers ............................................................................................ 34
3.1.6.5 Constraints of the Cluster and the Value Chain........................................................................................................ 34
3.1.6.6 Recommended Strategies for the Cluster Value Chain .......................................................................................... 35
3.1.7 Kampot Natural Salt Cluster ................................................................................................................................................. 35
3.1.7.1 Provincial Overview ....................................................................................................................................................... 35
3.1.7.2 Cluster Introduction and SWOT Analysis ..................................................................................................................... 35
3.1.7.3 Value Chain Map of Kampot Natural Salt Cluster .................................................................................................... 37
3.1.7.5 Constraints of the Cluster and the Value Chain........................................................................................................ 38
3.1.7.6 Recommended Strategies for the Cluster Value Chain .......................................................................................... 38
3.1.8 Preah Sihanouk Dry Shrimp Cluster ..................................................................................................................................... 39
3.1.8.1 Provincial Overview ....................................................................................................................................................... 39
3.1.8.2 Cluster Introduction and SWOT Analysis ..................................................................................................................... 39
3.1.8.3 Value Chain Map of Preah Sihanouk Dry Shrimp Cluster ........................................................................................ 40
3.1.8.4 Preah Sihanouk Dry Shrimp Cluster Value Chain in Numbers .................................................................................. 41
3.1.8.5 Constraints of the Cluster and the Value Chain........................................................................................................ 41
3.1.8.6 Recommended Strategies for the Cluster Value Chain .......................................................................................... 41
3.2 MYANMAR .................................................................................................................................................................................. 42
3.2.1 Dawei Mackerel (Pla Tu) Cluster ......................................................................................................................................... 43
3.2.1.1 Provincial Overview ....................................................................................................................................................... 43
3.2.1.2 Cluster Introduction and SWOT Analysis ..................................................................................................................... 43
3.2.1.3 Value Chain Map of Dawei Mackerel Cluster ........................................................................................................... 44
3.2.1.4 Value Chain of Dawei Mackerel Cluster in Numbers ............................................................................................... 45
3.2.1.5 Constraints of the Cluster and the Value Chain........................................................................................................ 45
3.2.1.6 Recommended Strategies for the Cluster Value Chain .......................................................................................... 45

vi
3.3 THAILAND ................................................................................................................................................................................... 46
3.3.1 Kanchanaburi Fruits Cluster ................................................................................................................................................. 47
3.3.1.1 Provincial Overview ....................................................................................................................................................... 47
3.3.1.2 Cluster Introduction and SWOT Analysis ..................................................................................................................... 47
3.3.1.3 Value Chain of Kanchanaburi Fruits Cluster (Prototype - Banana Processing) ................................................... 48
3.3.1.4 Value Chain Map of Kanchanaburi Fruit Processing Cluster .................................................................................. 49
3.3.1.5 Constraints of the Cluster and the Value Chain........................................................................................................ 50
3.3.1.6 Recommended Strategies for the Cluster Value Chain .......................................................................................... 50
3.3.2 Ratchaburi Aromatic Coconut Cluster .............................................................................................................................. 51
3.3.2.1 Provincial Overview ....................................................................................................................................................... 51
3.3.2.2 Cluster Introduction and SWOT Analysis ..................................................................................................................... 51
3.3.2.3 Value Chain Analysis of Ratchaburi Aromatic (Nam Hom) Coconut Cluster ...................................................... 52
3.3.2.4 Value Chain Map of Ratchaburi Aromatic Coconut Cluster ................................................................................. 53
3.3.2.5 Constraints of the Cluster and the Value Chain........................................................................................................ 54
3.3.2.6 Recommended Strategies for the Cluster Value Chain .......................................................................................... 54
3.3.3 Prachinburi Organic Rice Cluster ........................................................................................................................................ 54
3.3.3.1 Provincial Overview ....................................................................................................................................................... 54
3.3.3.2 Cluster Introduction and SWOT Analysis ..................................................................................................................... 55
3.3.3.3 Value Chain of Prachinburi Organic Rice Cluster ..................................................................................................... 56
3.3.3.4 Value Chain Map of Prachinburi Organic Rice Cluster ........................................................................................... 57
3.3.3.5 Constraints of the Cluster and the Value Chain........................................................................................................ 58
3.3.3.6 Recommended Strategies for the Cluster Value Chain .......................................................................................... 58
3.3.4 Sakaeo Herbs Cluster ............................................................................................................................................................ 59
3.3.4.1 Provincial Overview ....................................................................................................................................................... 59
3.3.4.2 Cluster Introduction and SWOT Analysis ..................................................................................................................... 59
3.3.4.3 Value Chain of Sakaeo Herbs Cluster ......................................................................................................................... 60
3.3.4.4 Value Chain Map of Sakaeo Herbs Cluster ............................................................................................................... 61
3.3.4.5 Constraints of the Cluster and the Value Chain........................................................................................................ 62
3.3.4.6 Recommended Strategies for the Cluster Value Chain .......................................................................................... 62
3.3.5 Chanthaburi Durian Production & Processing Cluster ..................................................................................................... 63
3.3.5.1 Provincial Overview ....................................................................................................................................................... 63
3.3.5.2 Cluster Introduction and SWOT Analysis ..................................................................................................................... 63
3.3.5.3 Value Chain of Chanthaburi Durian Production & Processing Cluster .................................................................. 64
3.3.5.4 VC Map of Chanthaburi Durian Production & Processing Cluster ......................................................................... 65
3.3.5.5 Constraints of the Cluster and the Value Chain........................................................................................................ 66
3.3.5.6 Recommended Strategies for the Cluster Value Chain .......................................................................................... 66
3.3.6 Trat Community Based Tourism Cluster .............................................................................................................................. 67
3.3.6.1 Provincial Overview ....................................................................................................................................................... 67
3.3.6.2 Value Chain of Trat Tourism Cluster ............................................................................................................................. 68
3.3.6.3 Value Chain Map of Trat Tourism Cluster ................................................................................................................... 69
3.3.6.4 Community Development Enterprises ........................................................................................................................ 70
3.3.6.5 Constraints of the Cluster and the Value Chain........................................................................................................ 70
3.3.6.6 Recommended Strategies for the Cluster Value Chain .......................................................................................... 70
3.4 VIETNAM ..................................................................................................................................................................................... 71
3.4.1 Tay Ninh Custard Apple Cluster .......................................................................................................................................... 72
3.4.1.1 Provincial Overview ....................................................................................................................................................... 72
3.4.1.2 Cluster Introduction and SWOT Analysis ..................................................................................................................... 72
3.4.1.3 Value Chain Map Tay Ninh Custard Apple Cluster .................................................................................................. 73
3.4.1.4 Value Chain of Tay Ninh Custard Apple Cluster in Numbers .................................................................................. 74

vii
3.4.1.5 Constraints of the Cluster and the Value Chain........................................................................................................ 74
3.4.1.6 Recommended Strategies for the Cluster Value Chain .......................................................................................... 75
3.4.2 Kien Giang Tiger Prawn Cluster ........................................................................................................................................... 76
3.4.2.1 Provincial Overview ....................................................................................................................................................... 76
3.4.2.2 Cluster Introduction and SWOT Analysis ..................................................................................................................... 76
3.4.2.3 Value Chain Map of Kien Giang Shrimp Cluster ....................................................................................................... 77
3.4.2.4 Shrimp Value Chain in Numbers .................................................................................................................................. 78
3.4.2.5 Constraints of the Cluster and the Value Chain........................................................................................................ 78
3.4.2.6 Recommended Strategies for the Cluster Value Chain .......................................................................................... 78
3.4.3 Can Tho Catfish Cluster ........................................................................................................................................................ 79
3.4.3.1 Provincial Overview ....................................................................................................................................................... 79
3.4.3.2 Cluster Introduction and SWOT Analysis ..................................................................................................................... 79
3.4.3.3 Value Chain Map of Can Tho Catfish Cluster ........................................................................................................... 80
3.4.3.4 Value Chain of Can Tho Catfish Cluster in Numbers ................................................................................................ 81
3.4.3.5 Constraints of the Cluster and the Value Chain........................................................................................................ 81
3.4.3.6 Recommended Strategies for the Cluster Value Chain .......................................................................................... 81
3.4.4 Ca Mau Dried Fish (Snakeskin Gourami) Cluster .............................................................................................................. 82
3.4.4.1 Provincial Overview ....................................................................................................................................................... 82
3.4.4.2 Cluster Introduction and SWOT Analysis ..................................................................................................................... 82
3.4.4.3 Value Chain of Ca Mau Dried Fish Cluster ................................................................................................................. 83
3.4.4.4 Ca Mau Dried Fish Cluster Value Chain in Numbers................................................................................................. 84
3.4.4.5 Constraints of the Cluster and the Value Chain........................................................................................................ 84
3.4.4.6 Recommended Strategies for the Cluster Value Chain .......................................................................................... 84
3.5 Overall Recommendation for the Selected 19 Clusters ..................................................................................................... 85
CHAPTER D ....................................................................................................................................................................................... 86
APPENDIX & BIBLIOGRAPHY ........................................................................................................................................................... 86
Appendix I: Numbers of Enterprises ............................................................................................................................................. 87
Appendix II: Definition of SMEs ...................................................................................................................................................... 89
Appendix III: List of People Interviewed ...................................................................................................................................... 90
BIBLIOGRAPHY ................................................................................................................................................................................. 96

viii
List of Tables
Table 1: SEC Corridors and Provinces ....................................................................................................................... 1
Table 2: Study Activities and Outcomes .................................................................................................................. 1
Table 3: Provinces and Products ............................................................................................................................... 2
Table 4: SEC Corridors and Provinces ....................................................................................................................... 5
Table 5: Product Selection Matrix ............................................................................................................................. 7
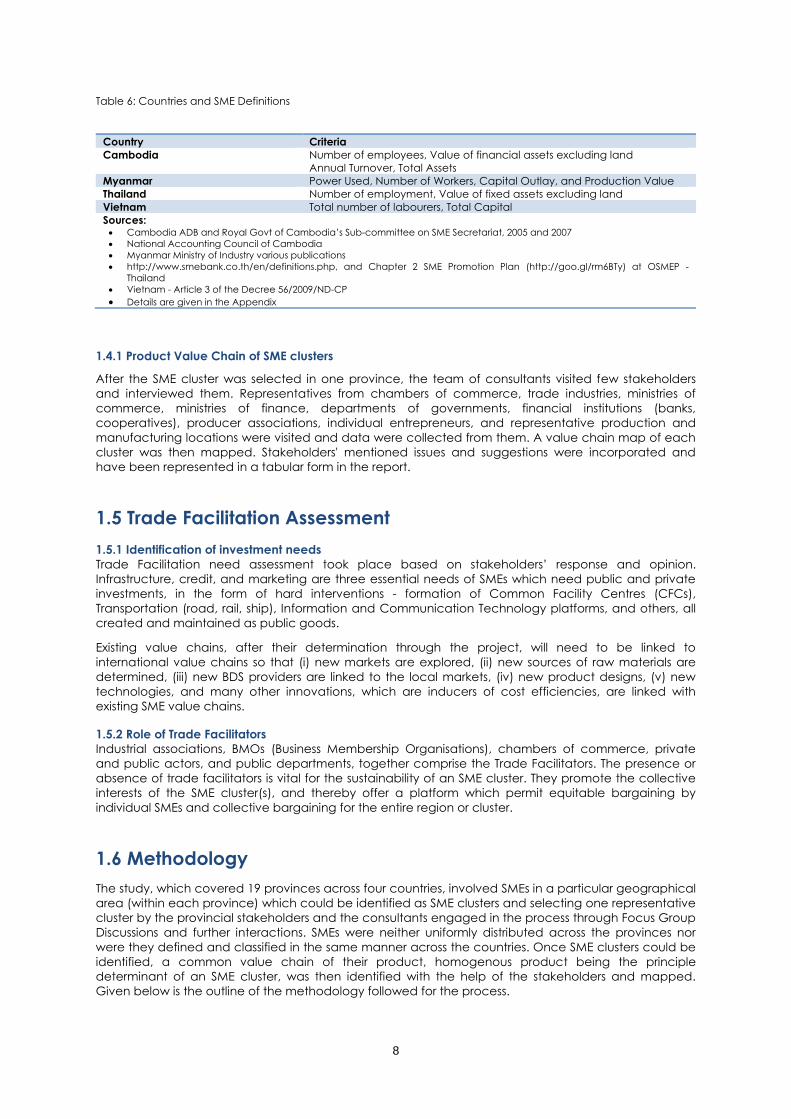
Table 6: Countries and SME Definitions .................................................................................................................... 8
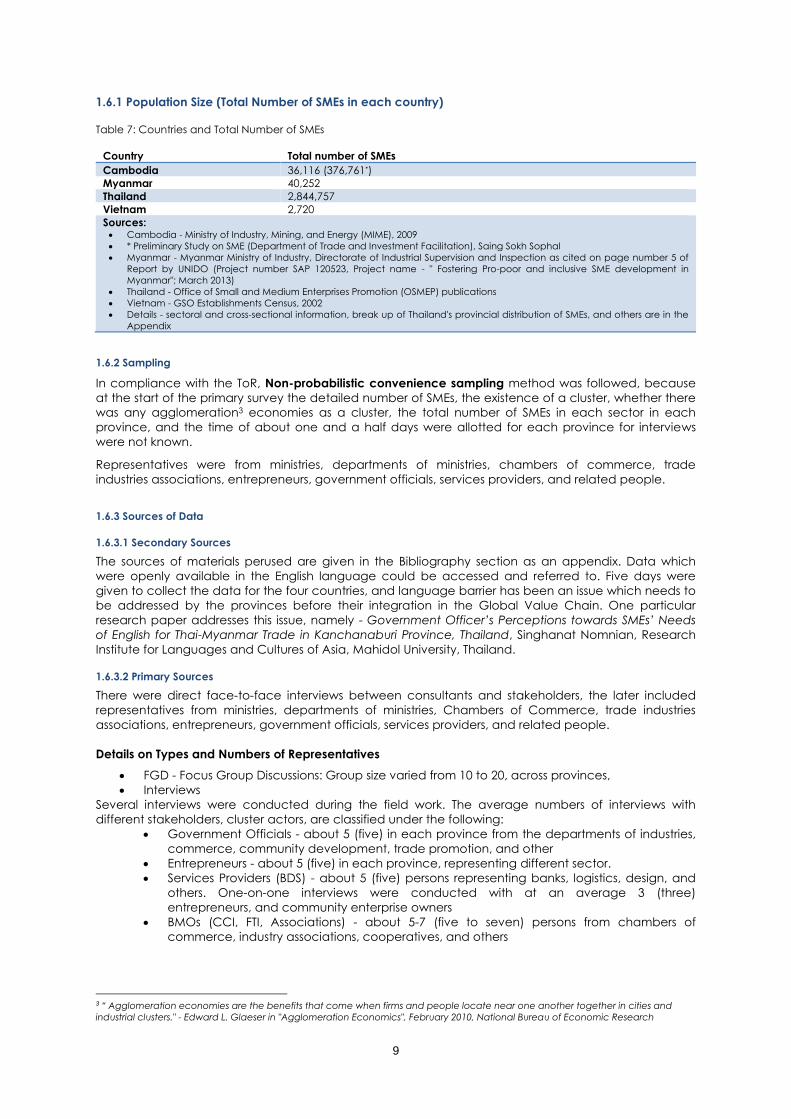
Table 7: Countries and Total Number of SMEs ........................................................................................................ 9
Table 8: Trade Potential Matrix ................................................................................................................................ 11
Table 9: Banteay Manchey Weaving Cluster SWOT Analysis............................................................................. 15
Table 10: Banteay Meanchey Silk Weaving Cluster in Numbers ....................................................................... 17
Table 11: Battambang Fish Sauce Cluster SWOT Analysis .................................................................................. 18
Table 12: Constraints of the Cluster and the Value Chain ................................................................................. 20
Table 13: Pursat Orange Cluster SWOT Analysis ................................................................................................... 22
Table 14: Pursat Orange Cluster the Value Chain in Numbers .......................................................................... 24
Table 15: Kampong Chhnang Pottery & Ceramics Cluster SWOT Analysis ..................................................... 25
Table 16: Kampong Chhnang Pottery Cluster Value Chain in Numbers ......................................................... 27
Table 17: Svay Rieng Rice Cluster SWOT Analysis ................................................................................................. 28
Table 18: Svay Rieng Rice Cluster the Value Chain in Numbers ....................................................................... 31
Table 19: Koh Kong Fish Sauce Cluster SWOT Analysis ........................................................................................ 32
Table 20: Koh Kong Fish Sauce Cluster Value Chain in Numbers ...................................................................... 34
Table 21: Kampot Natural Salt Cluster SWOT Analysis ......................................................................................... 36
Table 22: Kampot Natural Salt Cluster Value Chain in Numbers ....................................................................... 38
Table 23: Preah Sihanouk Dry Shrimp Cluster SWOT Analysis ............................................................................. 39
Table 24: Preah Sihanouk Dry Shrimp Cluster Value Chain in Numbers ........................................................... 41
Table 25: Dawei Mackerel (Pla Tu) Cluster SWOT Analysis ................................................................................. 43
Table 26: Overview of Dawei Fisheries ................................................................................................................... 45
Table 27: Kanchanaburi Fruits Cluster (Banana) SWOT Analysis ........................................................................ 47
Table 28: Value Chain of Kanchanaburi Fruits Cluster (Prototype - Banana Processing) ............................ 48
Table 29: Provincial Data of Ratchaburi ................................................................................................................ 51
Table 30: Production Data of Aromatic Coconuts .............................................................................................. 51
Table 31: Ratchaburi Aromatic Coconut Cluster SWOT Analysis ...................................................................... 51
Table 32: Value Chain Analysis of Ratchaburi Aromatic (Nam Hom) Coconut Cluster ............................... 52
Table 33: Prachinburi Organic Rice Cluster SWOT Analysis ................................................................................ 55
Table 34: Value Chain of Prachinburi Organic Rice Cluster .............................................................................. 56
Table 35: Sakaeo Provincial Overview ................................................................................................................... 59
Table 36: Sakaeo Provincial Overview Sector’s Contribution in Economy ...................................................... 59
Table 37: Sakaeo Herbs Cluster SWOT Analysis ..................................................................................................... 59
Table 38: Value Chain of Sakaeo Herbs Cluster ................................................................................................... 60
Table 39: Chanthaburi Provincial Overview .......................................................................................................... 63
Table 40: Durian Production Data .......................................................................................................................... 63
Table 41: Chanthaburi Durian Production & Processing Cluster SWOT Analysis ............................................. 63
Table 42: Value Chain of Chanthaburi Durian Production & Processing Cluster ........................................... 64
Table 43: Trat Provincial Overview .......................................................................................................................... 67
Table 44: Trat Community Development Enterprises ........................................................................................... 70
Table 45: Tay Ninh Custard Apple Cluster SWOT Analysis ................................................................................... 72
Table 46: Kien Giang Tiger Prawn Cluster SWOT Analysis .................................................................................... 76
Table 47: Shrimp Value Chain in Numbers ............................................................................................................ 78
Table 48: Can Tho Catfish Cluster SWOT Analysis ................................................................................................. 79
Table 49: Value Chain of Catfish Cluster in Numbers .......................................................................................... 81
Table 50: Ca Mau Dried Fish (Snakeskin Gourami) Cluster SWOT Analysis ...................................................... 82
Table 51: Ca Mau Dried Fish Cluster Value Chain in Numbers .......................................................................... 84
ix
List of Figures
Figure 1: SME Cluster Analysis ..................................................................................................................................... 6
Figure 2: Value Chain Map of Banteay Manchey Silk Weaving Cluster .......................................................... 16
Figure 3: Processing Steps of Fish Sauce ................................................................................................................ 19
Figure 4: Value Chain Map of Battambang Fish Sauce Cluster ........................................................................ 19
Figure 5: Value Chain Map of Pursat Orange Cluster ......................................................................................... 23
Figure 6: Pottery and Ceramics Production Processing Steps ........................................................................... 25
Figure 7: Value Chain Map Kampong Chhnang Pottery & Ceramics Cluster ............................................... 26
Figure 8: Value Chain Map of Svay Rieng Rice Cluster ...................................................................................... 30
Figure 9: Value Chain Map of Koh Kong Fish Sauce Cluster .............................................................................. 33
Figure 10: Value Chain Map of Koh Kong Fish Sauce Cluster............................................................................ 37
Figure 11: Value Chain Map of Preah Sihanouk Dry Shrimp Cluster ................................................................. 40
Figure 12: Value Chain Map of Dawei Mackerel Cluster ................................................................................... 44
Figure 13: Value Chain Map of Kanchanaburi Fruit Processing Cluster ........................................................... 49
Figure 14: Value Chain Map of Ratchaburi Aromatic Coconut Cluster .......................................................... 53
Figure 15: Value Chain Map of Prachinburi Organic Rice Cluster .................................................................... 57
Figure 16: Value Chain Map of Sakaeo Herbs Cluster ........................................................................................ 61
Figure 17: Durian Exports from Chanthaburi ......................................................................................................... 63
Figure 18: VC Map of Chanthaburi Durian Production and Processing Cluster ............................................. 65
Figure 19: Trat Tourist Trend ....................................................................................................................................... 67
Figure 20: Value Chain of Trat Tourism Cluster ...................................................................................................... 68
Figure 21: Value Chain Map of Trat Tourism Cluster ............................................................................................ 69
Figure 22: Value Chain Map Tay Ninh Custard Apple Cluster ........................................................................... 73
Figure 23: Value Chain of Tay Ninh Custard Apple Cluster in Numbers........................................................... 74
Figure 24: Shrimp Cluster Value Chain Steps ........................................................................................................ 77
Figure 25: Value Chain Map of Kien Giang Shrimp Cluster ................................................................................ 77
Figure 26: Value Chain Map of Can Tho Catfish Cluster .................................................................................... 80
Figure 27: Value Chain of Can Tho Catfish Cluster .............................................................................................. 81
Figure 28: Value Chain of Ca Mau Dried Fish Cluster .......................................................................................... 83

x
List of Maps
Map 1: Provinces and Clusters in Cambodia .................................................................................................. 14
Map 2: Banteay Manchey, Cambodia ............................................................................................................ 15
Map 3: Battambang, Cambodia ...................................................................................................................... 18
Map 4: Pursat, Cambodia ................................................................................................................................. 21
Map 5: Kampong Chhnang, Cambodia ......................................................................................................... 25
Map 6: Svay Rieng, Cambodia ......................................................................................................................... 28
Map 7: Koh Kong, Cambodia ........................................................................................................................... 32
Map 8: Kampot, Cambodia .............................................................................................................................. 35
Map 9: Preah Sihanouk, Cambodia ................................................................................................................. 39
Map 10: Provinces and Clusters in Myanmar ................................................................................................... 42
Map 11: Dawei, Myanmar ................................................................................................................................. 43
Map 12: Provinces and Clusters in Thailand ..................................................................................................... 46
Map 13: Kanchanaburi, Thailand ...................................................................................................................... 47
Map 14: Ratchaburi, Thailand ........................................................................................................................... 51
Map 15: Prachinburi, Thailand ........................................................................................................................... 54
Map 16: Sakaeo, Thailand ................................................................................................................................ 59
Map 17: Chanthaburi, Thailand ........................................................................................................................ 63
Map 18: Trat, Thailand ........................................................................................................................................ 67
Map 19: Provinces and Clusters in Vietnam ..................................................................................................... 71
Map 20: Tay Ninh, Vietnam ................................................................................................................................ 72
Map 21: Kien Giang, Vietnam ........................................................................................................................... 76
Map 22: Can Tho, Vietnam ................................................................................................................................ 79
Map 23: Ca Mau, Vietnan ................................................................................................................................. 82

1
Executive Summary
Background
The study supports Mekong Institute in implementing the project, ‘Enhancing Competitiveness of Small
and Medium-sized Enterprises in the Southern Economic Corridor (SEC) of ASEAN Mekong Subregion
(AMS)’ which is funded by the Government of Japan through Japan ASEAN Integration Fund (JAIF) for
a period of two years (2016-18). Cambodia, Myanmar, Thailand, and Vietnam are the four countries
where trade capacity building of the small and medium enterprises and related stakeholders along the
Southern Economic Corridor (SEC) will be developed.
Location of Study
The study was jointly conducted by the Entrepreneurship Development Institute of India (consultant)
and the Mekong Institution along the Southern Economic Corridor (SEC) across 19 provinces which are:
Table 1: SEC Corridors and Provinces
SEC
Countries
SEC Corridors and Provinces Total
Central Sub-Corridor Coastal Corridor
Myanmar Tanintharyi (Dawei) 1
Thailand Prachinburi, and Sa kaeo Kanchnaburi, Ratchaburi, Trat,
Chantaburi
6
Cambodia Banteay Meancheay, Battambang, Pursat,
Kampong Chhnang, and Svay Rieng
Koh Kong, Kampot, and Preah
Sihanouk
8
Vietnam Tay Ninh Kien Giang, Can Tho, and Ca Mau 4
Total 8 11 19
Objectives
Broadly, the project objectives include (i) capacity development for SME clusters and networks, (ii)
trade and investment promotion through public and private partnerships, and (iii) strengthening
business development services (BDS) providers. Integrating the SMEs with the regional and global value
chain is the inherent theme of the project design.
Specific objectives of the study are the following:
• Identify market chain actors and linkages;
• Identify enabling business environment factors;
• Identify sectoral and geographical concentration of value chains;
• Identify cluster constraints and solutions through improved linkages with markets and trade.
Methodology
The study was divided into two phases -
i. The desk study phase identified products in each province, taking into account number of
SMEs in the provinces, leading products in the provinces, and the supportive policy and
business environment. ‘Number of people employed’ in an establishment was the common
criterion for defining SMEs in each of the CMTV countries. Only public data available in English
were consulted.
ii. The field study took place in the four countries, simultaneously by three teams for a period of
around 30 days. The work schedule in each province was as follows:
Table 2: Study Activities and Outcomes
Day Activity Outcome
1 Focus Group Discussion for half day and interviews with
government representatives
Identification of clusters and selection of
products
2 Interviews with entrepreneurs, visit to premises of SMEs,
interactions with other stakeholders (banks, services providers,
and others)
AOBO and value chain identification.
Identifying issues and suggestions

2
From the findings above, the product value chain map for each SME cluster (one in each province) has
been developed together with the volume and price of outputs at each stage of the value chain,
number of actors involved in each stage, along with other findings. Each cluster analysis also includes a
SWOT analysis to help develop insight into the particular cluster supported by responses received from
FGDs conducted with direct value chain actors and local institutions. The cluster value chain is then
further analysed in terms of constraints and way forward.
Observations made in the Study
Products of the SME clusters identified in CMTV during the study were based on active discussion with
the stakeholders and economic benefits that can be derived from the intervention.
Table 3: Provinces and Products
Country Provinces Products
Cambodia
Banteay Meanchey Silk Handloom
Battambang Fish Sauce
Pursat Orange
Kampong Chhnang Pottery & Ceramics
Svay Rieng Rice
Koh Kong Fish Sauce
Kampot Natural Salt
Preah Sihanouk Dry Shrimp
Myanmar Tanintharyi (Dawei) Mackerel (Pla Tuu)
Thailand
Chantaburi Durian Production Processing
Kanchanaburi Banana Processing / Fruit Processing
Prachinburi Organic Rice
Ratchaburi Aromatic Coconut Production & Processing
Sa – Kaeo Herb
Trat Community Based Tourism
Vietnam
Ca Mau Dried fish (Snakeskin Gourami)
Can Tho Catfish
Kien Giang Tiger Prawn
Tay Ninh Custard apple
Each of the clusters and their products are unique in itself in terms of their respective markets, number
of people employed, turnover, or business potential -
• Chanthaburi Durian Cluster exported over 12 billion THB or about 342 million USD in 2014 which
was surprising because the produce was Durian which is not very popular;
• Sa Kaeo is a rich producer of herbs through its community enterprises and supply herbs to other
provinces which in turn are branded as 'herb city' and not Sa Kaeo;
• Vietnam is a pivoting supply chain node for sea food products especially shrimps;
• Myanmar's Dawei has evolved as a fishery hub employing more than 11000 people in
households based enterprises with a yearly turnover of 27 million USD; and
• Cambodian SME clusters are more traditional and artisanal based clusters.
The product value chains of the SME clusters are indicative and prototypical of the needs of the SMEs in
each province. For example, in case of agricultural produce and sea food items, quality and hygiene
may be pressing issues, because global standards require adherence to standards; these issues may
not be of immediate concerns for other produces, like rice. Further overall observations are mentioned
below:
• Development of a strong and sustainable linkage between the SMEs and BMOs (e.g. CCIs, FTIs,
and Business Associations) remains crucial to ensure the future sustainability of the cluster value
chain interventions. A strong linkage will encourage the informal sector to join the mainstream
and will provide a strong and common negotiating platform for all stakeholders and create a
dynamic information dissemination pathway;
• Strong representation to policymakers in the region regarding a common SME platform and
sustainable trade and industrial facilitation platform needs to be promoted. Traditional business
matching needs should be supported with modern digital B2B platforms, to ensure fast and
credible collaborations between producers, input suppliers and buyers;

3
• Across the provinces along the SEC, local businesses and producers are often in need of
practical understanding of clustering and the benefits of cluster-wide production in the survival
of SMEs. Awareness program on creating and / or maintaining a shared platform by SMEs,
BMOs, government, and the civil society, within permissible and traditional norms is desirable;
• ASEAN Strategic Action Plan (2016-25) mentions about three necessary actions: productivity;
innovation; and technology upgradation, adoption, and use. These factors remain much
relevant for the SEC region. SMEs are forced to be 'price takers' in the market. In some clusters
SMEs have tied up with local universities (for example - Prachinburi Organic Rice farmers with
Majeo University). Similar strong and sustainable linkages can be explored and established
between SMEs and specialized / educational institutions. Inter-cluster linkages and expanded
markets for sourcing raw materials and other services have been proven effective in other
cluster development approaches. However, these secondary linkages can only be promoted
once those primary linkages are well established.
Way Forward
There is no unique approach to address the needs of all the SMEs across the selected clusters in the
provinces along the SEC. The product value chains of the SME clusters are indicative and prototypical
of the needs of the SMEs in each province.
Support to Strengthening Clusters: Across the clusters along the SEC, there is a need for developing
strong cluster leadership and functioning to raise awareness among the cluster members about
producing and marketing in a united front to attract support from the respective governments and also
from development partners.
Formation of Export Consortia and Export Market Development: After strengthening the cluster
management the next step is to support selected cluster leadership in formation of export consortia
and develop the export market for the products developed in the clusters. This also helps to follow
particular quality programs for a particular cluster for the quality upgrade of all the products that are
produced in the cluster.
Structured Learning Visits: The southern economic corridor of the Mekong sub-region has similar clusters
in the provinces and learning visits from one country to another can significantly improve process
upgrade. Also, the learning visits can promote mutual trade discussion in case one cluster is in need of
raw input from another while input from the domestic market may turn out to be costly and time
consuming or simply not available.
Development of Interactive Database: Inclusion of the clusters and SMEs in the SEC in an interactive
database would facilitate to connect with prospective buyers and investors who can assist these
enterprises with superior technology and help them accessing new export markets. Inclusion in the SEC
database will also support the SMEs to interact with other clusters and prepare themselves for large
export orders.
Introduction of E-commerce: A selected number of cluster members and SMEs were identified who
showed greater strength and capacity to compete in international markets. To support these
entrepreneurs further in their business expansion, the prospective candidates should be screened and
linked with an online marketplace provider where they can register themselves and receive trainings on
how to successfully trade with overseas buyers.
Support Participation in Trade Fairs to Promote Cross-border Trade in the SEC: One of the major roles of
these interventions is to promote cross border trade among the GMS countries. From the study, it was
understood that some clusters in one country might be in a serious need of sourcing raw materials and
that they simply did not have ideas that those inputs could be easily procured from a neighbouring
cross-border provinces. These trade events will facilitate those enterprises further in engaging
themselves in trade and partnership negotiation with other enterprises across the borders.
Embedded Services: Creating services providers within the cluster itself (for example – packaging and
marketing service providers) can promote standards within;
4
Logistics development: Warehouse development, cold chain logistics (unbroken from farm to table),
better transportation, and ecologically sustainable real estate development and management have
been desired by cluster stakeholders to improve product quality and operational efficiency;
Soft skills training: Business management skills, negotiation skills, and cross border buyer-seller
communication skills may add value to the enterprises for expanding into international markets;
Financial issues: In some clusters, changing climate affected production and has harmed the debt
servicing capacity of SMEs. Lower interest rates, better banking practices (for example - decoupling
insurance as a precondition to loans), accountability and governance were needs of the SMEs to cope
better with the business cycles.
Chapter A
Introduction, Background of the Study & Methodology

5
1.1 Introduction
Economic activity across the globe possesses a complex natural dynamics. Multivariate preconditions,
direct and indirect effect of copious non-economic factors and probabilistic models of unknown future
tends to present these activities in a group based discourse rather than a single layer model. Cross
sections between several horizontal and vertical factors affect the success of a developmental
economy.
To strengthen the subregional cooperative activity in terms of trade facilitation through cluster, a large
project named as “Enhancing Competitiveness of Small and Medium-sized Enterprises in the Southern
Economic Corridor (SEC) of ASEAN Mekong Subregion (AMS)” has been initiated with help of
Government of Japan through Japan ASEAN Integration Fund (JAIF) for period of two years (2016-18).
Broadly, the project objectives include (i) capacity development for SME clusters and networks, (ii)
Trade and Investment promotion through public and private partnerships, and (iii) Strengthening
business development services (BDS) Providers. Integrating the SMEs with the Global Value Chain is the
inherent theme of the project design.
To determine the present circumstances prevailing in the subregion, this study has been initiated to find
our suitable clusters across 19 provinces spread in four target countries; i.e. Cambodia, Myanmar,
Thailand, and Vietnam. The objective of the study was to determine the Market and Value Chain in
various clusters identified by the suitable authority of the respective provinces.
1.2 Background of the Study
Project Name: “Enhancing Competitiveness of Small and Medium-sized Enterprises (SME) in the
Southern Economic Corridor (SEC) of ASEAN Mekong Sub region (AMS)”
Assignment Title: Study on Market and Value Chain Mapping
Specific Objectives of the Project, as mentioned in the ToR are given below:
• Objectives of Market Mapping
• Identified market chain actors and linkages
• Identified enabling business environment factors
• Identified Business Development Services (BDS) Providers
• Objectives of Value Chain Mapping
• Identified sectoral and geographical concentration of value chains
• Identified constraints and solutions
• Identified opportunities of increased and improved connections and linkages in the
value chains
As mentioned in the ToR, the project assignment covers 19 provinces in the Southern Economic Corridor
- eleven (11) provinces in the southern Coastal Corridor and eight (8) provinces in the Central sub-
corridor
Table 4: SEC Corridors and Provinces
SEC Countries SEC Corridors and Provinces Total
Central Sub-Corridor Coastal Corridor
Cambodia Banteay Meancheay, Battambang, Pursat,
Kampong nang, and Svay Rieng
Koh Kong, Kampot, and Preah
Sihanouk
8
Myanmar Tanintharyi (Dawei) 1
Thailand Prachinburi, and Sa kaeo Kanchnaburi, Ratchaburi, Trat,
and Chantaburi
6
Vietnam Tay Ninh Kien Giang, Can Tho, and Ca
Mau
4
8 11 19

6
1.3 Definition and Importance of Clusters: Recent Literature
Employment in the SME sector in CMTV is large and significant. About 51.7% (Vietnam) to 76.7%
(Thailand) people are employed in SMEs in CMTV, while the micro enterprises (i.e. employing upto 10
people) constitute about 88.8 % (Myanmar) through 99.8% (Thailand)1 of the total number of SMEs. SME
Cluster based approach for developing the value chains may be considered from two perspectives of
the present study:
i. Concept of SME clusters
The diagram summarises the structural, incidental, and factors concerning SME cluster, and
Figure 1: SME Cluster Analysis
ii. Policy vision and missions in the region
SME sector in each of the CMTV countries consists of formal and informal or unregistered enterprises. A
strategy for the development of SMEs under the overarching category of private sector development
was chalked out in the "Strategy and Action Plan for the Greater Mekong Subregion (GMS) Southern
Economic Corridor (SEC)" published by ADB in 2010, in which relevant objectives for this study were:
- Promote and facilitate trade and investment, and
- Enhance mechanisms for promoting private sector participation for the development of the SEC.
In addition, two strategic objectives were identified in the ASEAN Strategic Action Plan 2016-25 (Jakarta
Framework developed by ERIA in 2011) for the development of the SMEs in the region:
• First five years: To seamlessly integrate with the AEC and the regional value chains -
• Pathways - Industry Cluster, Global Supply Chain, Productivity
• Subsequent five years: To become globally competitive, innovative, inclusive and resilient
• Pathways - Innovation, Entrepreneurship, Export
In those objectives, the common pathway is enhancement of employment. In addition, those policy
documents also enforce that “SMEs perform better when they are allied with other SMEs or with large
enterprises including MNCs. From this perspective, industry clusters would help SMEs enhance
productivity and foster innovation." And this is where the SME cluster based development becomes a
significant tool for the project which the study supports.
1.3.1 About SME Clusters and Selection of SME clusters
"A cluster is a geographical proximate group of interconnected companies and associated institutions
in a particular field, linked by commonalities and externalities". (Michael E. Porter, 'On Competition')
1 Sources: Fig 1-1 in page 1 of Statistics of SMEs, ASEAN Strategic Action Plan for SME Development 2016-25, and ASEAN SME Policy
Index (2014) study, conducted by ERIA, OECD and the ASEAN SME Agencies Working Group
SME Cluster
Homogenous Product or
Product Group Agglomera
tion Economies
Geographical
Location
Common Externali
ties
Common Value Chain
Common Services
Shared Bargaining Power
Common Policy
Concerns and Impact
Common Business
Environment

7
"UNIDO defines clusters as sectoral and geographical concentrations of enterprises that produce and
sell a range of related or complementary products and, thus, face common challenges and
opportunities."2
During the Focus Group Discussions, the concept of clustering was described and thereafter the
stakeholders were asked to select the cluster which is best representative of the province - a prototype
cluster. Study of the cluster and its issues and stakeholder suggestions was to factor in during the
implementation of the development of product value chain, with an inherent objective of cluster
development.
Two methods were followed for cluster selection during the FGD -
i) using the product (cluster) selection matrix tool
An example of the Dawei product selection matrix is given below:
Table 5: Product Selection Matrix
Criteria – weight Products
Rubber Fishery Cashew
Nut
Betel nut Mining Crops Tourism Service
Total Production Value (from the
province)- 5
50 mil
US
27 mil
US
8 mil US 14 mil US 10 mil US 10 mil US 8 mil US 20 mil US
Demand in the Local/ Domestic
Market – 2
2 5 2 2 1 5 3 4
Extent of Value addition (today) -
3
2 1 2 2 3 1 3 3
Potential for higher VA -5 5 5 2 2 3 4 4 3
Contribution in GDP -5 5 5 3 3 2 2 5 4
Currently Exporting -3 3 1 5 5 5 3 2 2
Potential for Export -5 5 3 4 4 5 4 3 3
Employment Generation -2 5 3 2 2 2 5 3 3
Priority Sector Identified by the
Govt. – 2
5 5 2 2 4 3 5 2
Total Score 32 28 22 22 25 27 28 24
Source: Primary Field Work Notes
The top two products (with the top two highest scores) were selected. In the above case, both rubber
and fishery clusters were visited and their value chains were studied. Due to the relative importance of
the Fishery Cluster in Dawei's local community (prototype product Mackerel fish), the value chain of the
Mackerel cluster was mapped and has been represented in this study.
ii) expert opinion and consensus (brainstorming)
In several clusters, due to time constraints and other exogenous and uncontrollable factors, the FGD
could not come to an unanimous consensus regarding the selection of the product using the product
selection matrix. In these cases, a general discussion between provincial administration, chambers of
commerce and industries representatives was conducted. The final product was selected in these
brainstorming sessions.
1.4 Definition of SMEs in CMTV
Referring to all four countries criteria given below, it may have observed that “Number of Employment”
is a common factor in classifying the SMEs in the CMTV countries. It has also been observed that in case
of every country, the Micro enterprises are those establishments where number of employment is 10 or
less than that. 10 to 50/100 employment has been considered as Small and more than 50/100
employment been considered as Medium enterprise.
In brief, the criteria for defining SMEs are:
2 Source: Development Clusters and Networks of SMEs2, UNIDO, 2001
8
Table 6: Countries and SME Definitions
Country Criteria
Cambodia Number of employees, Value of financial assets excluding land
Annual Turnover, Total Assets
Myanmar Power Used, Number of Workers, Capital Outlay, and Production Value
Thailand Number of employment, Value of fixed assets excluding land
Vietnam Total number of labourers, Total Capital
Sources: • Cambodia ADB and Royal Govt of Cambodia’s Sub-committee on SME Secretariat, 2005 and 2007
• National Accounting Council of Cambodia
• Myanmar Ministry of Industry various publications
• http://www.smebank.co.th/en/definitions.php, and Chapter 2 SME Promotion Plan (http://goo.gl/rm6BTy) at OSMEP -
Thailand
• Vietnam - Article 3 of the Decree 56/2009/ND-CP
• Details are given in the Appendix
1.4.1 Product Value Chain of SME clusters
After the SME cluster was selected in one province, the team of consultants visited few stakeholders
and interviewed them. Representatives from chambers of commerce, trade industries, ministries of
commerce, ministries of finance, departments of governments, financial institutions (banks,
cooperatives), producer associations, individual entrepreneurs, and representative production and
manufacturing locations were visited and data were collected from them. A value chain map of each
cluster was then mapped. Stakeholders' mentioned issues and suggestions were incorporated and
have been represented in a tabular form in the report.
1.5 Trade Facilitation Assessment
1.5.1 Identification of investment needs
Trade Facilitation need assessment took place based on stakeholders’ response and opinion.
Infrastructure, credit, and marketing are three essential needs of SMEs which need public and private
investments, in the form of hard interventions - formation of Common Facility Centres (CFCs),
Transportation (road, rail, ship), Information and Communication Technology platforms, and others, all
created and maintained as public goods.
Existing value chains, after their determination through the project, will need to be linked to
international value chains so that (i) new markets are explored, (ii) new sources of raw materials are
determined, (iii) new BDS providers are linked to the local markets, (iv) new product designs, (v) new
technologies, and many other innovations, which are inducers of cost efficiencies, are linked with
existing SME value chains.
1.5.2 Role of Trade Facilitators
Industrial associations, BMOs (Business Membership Organisations), chambers of commerce, private
and public actors, and public departments, together comprise the Trade Facilitators. The presence or
absence of trade facilitators is vital for the sustainability of an SME cluster. They promote the collective
interests of the SME cluster(s), and thereby offer a platform which permit equitable bargaining by
individual SMEs and collective bargaining for the entire region or cluster.
1.6 Methodology
The study, which covered 19 provinces across four countries, involved SMEs in a particular geographical
area (within each province) which could be identified as SME clusters and selecting one representative
cluster by the provincial stakeholders and the consultants engaged in the process through Focus Group
Discussions and further interactions. SMEs were neither uniformly distributed across the provinces nor
were they defined and classified in the same manner across the countries. Once SME clusters could be
identified, a common value chain of their product, homogenous product being the principle
determinant of an SME cluster, was then identified with the help of the stakeholders and mapped.
Given below is the outline of the methodology followed for the process.
9
1.6.1 Population Size (Total Number of SMEs in each country) Table 7: Countries and Total Number of SMEs
Country Total number of SMEs
Cambodia 36,116 (376,761*)
Myanmar 40,252
Thailand 2,844,757
Vietnam 2,720
Sources: • Cambodia - Ministry of Industry, Mining, and Energy (MIME), 2009
• * Preliminary Study on SME (Department of Trade and Investment Facilitation), Saing Sokh Sophal
• Myanmar - Myanmar Ministry of Industry, Directorate of Industrial Supervision and Inspection as cited on page number 5 of
Report by UNIDO (Project number SAP 120523, Project name - " Fostering Pro-poor and inclusive SME development in
Myanmar"; March 2013)
• Thailand - Office of Small and Medium Enterprises Promotion (OSMEP) publications
• Vietnam - GSO Establishments Census, 2002
• Details - sectoral and cross-sectional information, break up of Thailand's provincial distribution of SMEs, and others are in the
Appendix
1.6.2 Sampling
In compliance with the ToR, Non-probabilistic convenience sampling method was followed, because
at the start of the primary survey the detailed number of SMEs, the existence of a cluster, whether there
was any agglomeration3 economies as a cluster, the total number of SMEs in each sector in each
province, and the time of about one and a half days were allotted for each province for interviews
were not known.
Representatives were from ministries, departments of ministries, chambers of commerce, trade
industries associations, entrepreneurs, government officials, services providers, and related people.
1.6.3 Sources of Data
1.6.3.1 Secondary Sources
The sources of materials perused are given in the Bibliography section as an appendix. Data which
were openly available in the English language could be accessed and referred to. Five days were
given to collect the data for the four countries, and language barrier has been an issue which needs to
be addressed by the provinces before their integration in the Global Value Chain. One particular
research paper addresses this issue, namely - Government Officer’s Perceptions towards SMEs’ Needs
of English for Thai-Myanmar Trade in Kanchanaburi Province, Thailand, Singhanat Nomnian, Research
Institute for Languages and Cultures of Asia, Mahidol University, Thailand.
1.6.3.2 Primary Sources
There were direct face-to-face interviews between consultants and stakeholders, the later included
representatives from ministries, departments of ministries, Chambers of Commerce, trade industries
associations, entrepreneurs, government officials, services providers, and related people.
Details on Types and Numbers of Representatives
• FGD - Focus Group Discussions: Group size varied from 10 to 20, across provinces,
• Interviews
Several interviews were conducted during the field work. The average numbers of interviews with
different stakeholders, cluster actors, are classified under the following:
• Government Officials - about 5 (five) in each province from the departments of industries,
commerce, community development, trade promotion, and other
• Entrepreneurs - about 5 (five) in each province, representing different sector.
• Services Providers (BDS) - about 5 (five) persons representing banks, logistics, design, and
others. One-on-one interviews were conducted with at an average 3 (three)
entrepreneurs, and community enterprise owners
• BMOs (CCI, FTI, Associations) - about 5-7 (five to seven) persons from chambers of
commerce, industry associations, cooperatives, and others
3 " Agglomeration economies are the benefits that come when firms and people locate near one another together in cities and
industrial clusters." - Edward L. Glaeser in "Agglomeration Economics", February 2010, National Bureau of Economic Research

10
Chapter B
Clusters & General Analysis

11
2.0 Stakeholders Perception on Trade Potential
2.1 General Analysis Table 8: Trade Potential Matrix
Country Cluster Name Potentiality Factors
International
Export
Regional
Trade
Domestic
Market
CAMBODIA
Bantey Meanchey Silk Weaving
Battambang Fish Sauce
Pursat Orange
Kampong Chhnang Pottery & Ceramics
Svay Rieng Rice
Koh Kong Fish Sauce
Kampot Natrual Salt
Preah Sihanouk Dry Shrimp
MYANMAR Dawei Mackerel
THAILAND
Kanchanburi Banana (Fruit)
Ratchaburi Aromatic Coconut
Prachinburi Organic Rice
Sakaeo Herb
Chanthaburi Durian
Trat Health & Well-being Tourism
VIETNAM
Ca Mau Dried Fish
Can Tho Catfish
Kien Giang Shrimp (Tiger Prawn)
Tay Ninh Custard Apple
.
A Cluster Trade Potential Matrix has been presented here to understand the potential of identified
clusters in terms of their export related development; i.e. linkage with Local and Global Value Chain
(LVC and GVC). The matrix has been derived from the perception of the stakeholders opined in FGD
and cluster stakeholders interview session. Suggested Action in terms of Pressure Points identified is
directly corelated with this matrix. The colour indications used here are: High Potential – Green;
Medium/Low potential – Orange and Very Less Potential – White.
It has been observed that out of 19 clusters, 10 clusters have very high potential for linkage in GVC. 9
clusters have very high potential for LVC linkage. But, it is an interesting fact that out of these 10, only 2
possesses very high potential for linkage in GVC.
The trend represents special characteristics of the cluster products. Out of 19 clusters selected, 15 are
representing some sort of Food products which is nearly 78% of the total clusters. The regional speciality
of these food products and their acceptability in other parts of the globe determines their trade
potential.

12
Roadmap Matrix for the Clusters in 19 provinces of Vietnam,
Cambodia, Thailand, Myanmar
Cluster
Sk
ill D
eve
lop
me
nt
Tra
inin
g
Ma
na
ge
ria
l Tr
ain
ing
Pro
du
ct
De
sig
n
Pro
du
ct
Div
ers
ific
atio
n
Tec
hn
olo
gy
BD
S
Ma
rke
tin
g B
DS
Exp
ort
BD
S
Pa
ck
ag
ing
BD
S
Fin
an
ce
Log
istic
s
Ra
w M
ate
ria
l
B2B
Po
rta
l
B2C
Po
rta
l
ICT
Too
ls -
MIS
, e
tc
Tra
de
Fa
ir
Exp
osu
re V
isits
Test
ing
La
bo
rato
ry
Co
mm
on
Fa
cility
Ce
ntr
e
Wo
me
n E
ntr
ep
ren
eu
rsh
ip
BM
O C
ap
ac
ity
Bu
ild
ing
Str
ate
gic
Ma
ste
r Pla
n
De
ve
lop
me
nt
Po
lic
y A
dvo
ca
cy
Cambodia
Bantey
Meanchey
Silk Weaving
+ +
++
+ + +
++
+
+ +
++
+
++
+
Battambang
Fish Sauce + + + + + + + +
+
+
+ +
+
Pursat
Orange + + + + + +
++ +
+
+
+ + +
Kampong
Chhnang
Pottery &
Ceramics
+ + + + + + + + ++
+ +
+ ++
+ ++ +
Svay Rieng
Rice + +
+
+
+
+
Koh Kong
Fish Sauce + +
++ ++ + + + + + + + + +
Kampot
Natrual Salt + + + + + +
+
+ +
+
+ +
Preah
Sihanouk
Dry Shrimp
+ + + + + +
++
+
+ + + +
++
+
Myanmar
Dawei
Mackerel +
+ ++
++ ++ + +
+ ++ + + ++ ++
Thailand
Kanchanburi
Banana
(Fruit)
+ +
+
+ + +
+
+
+ + + +
Ratchaburi
Aromatic
Coconut
+ +
+
+ + +
+
+
+ + + +
Prachinburi
Organic
Rice
+ +
+
+ +
++
+ + + + + +
Sakaeo
Herb + + +
+ + + +
++ +
+ + + + + + + +
Chanthaburi
Durian + +
+ + +
+ +
+ + + + +
Trat Health &
Well-being
Tourism
+ + + +
+
++
+ + + + + ++ ++
Vietnam
Ca Mau
Dried Fish +
++ + + +
++
+ + + +
Can Tho
Catfish + + +
+ + + +
+ + +
+ + + + + + + +
Kien Giang
Shrimp
(Tiger
Prawn)
+ +
+
+ + +
+ +
+ +
+ + + + + + + +
Tay Ninh
Custard
Apple
+
+
+ + ++
+
+
+ + + +
Table 9: Roadmap Matrix for the 19 Clusters
Notes: i. Summarised from the responses of the stakeholders.
ii. + and ++ signs are subjective weights or importance given where ++ sign means more important than a + sign

13
Chapter C
Value Chains of SME clusters in 19 Provinces

14
3.1 Cambodia
Provinces Name Cluster Name
➢ Banteay Meanchey • Silk Weaving Cluster
➢ Battambang • Fish Sauce Cluster
➢ Pursat • Orange Cluster
➢ Kampong Chhnang • Pottery & Ceramics Cluster
➢ Svay Rieng • Rice Cluster
➢ Koh Kong • Fish Sauce Cluster
➢ Kampot • Natural Salt Cluster
➢ Preah Sihanouk • Dry Shrimp Cluster
Map 1: Provinces and Clusters in Cambodia

15
3.1.1 Banteay Meanchey Silk Weaving Cluster
3.1.1.1 Provincial Overview
Agriculture
• Rice Production (925 rice milling
factories majority of which home
based)
• Silk Production
• Sauce and noodles production
Cross-border Trade
• 2 SEZ and 1 Industrial Park exist
• Some of the goods traded through
Thailand border route include plastics,
textiles, food and consumer goods.
• Good roads connectivity
Access to Finance
• Sathabana Commercial Bank
• 80% of banks lend to SMEs
Selected Product Cluster
Silk Weaving Cluster
Map 2: Banteay Manchey, Cambodia
About the Province
Area: 6679 sq. km area
Population: 678033 (2008)
GDP: Agriculture has the highest share of Provincial GDP
Border regions: International border with Thailand Source: “Economic Census of Cambodia 2011 – Provincial
Report”
By NIS; Ministry of Planning; Phnom Penh. February 2013
Map source: Google
3.1.1.2 Cluster Introduction and SWOT Analysis
Silk production is a widespread livelihood activity in many parts of the province. Silk in Cambodia is
generally produced on a small scale and it is a female dominated activity. Men however assist in making
and fixing the equipment. Today the production of raw silk in Cambodia is low compared to other silk
producing countries like Thailand and Vietnam. Local silk production (400 tons nationally) can satisfy only
2% of total domestic demand throughout the country. In order to meet this demand, raw silks are imported
from neighboring countries, primarily from Vietnam to produce silk products. The identified strengths,
weaknesses, opportunities and threats are listed below:
Table 9: Banteay Manchey Weaving Cluster SWOT Analysis
STRENGTHS
• Availability of skilled labour
• Indigenous knowledge
• Support from Department of Culture,
Govt. of Cambodia
• Easy to operate homemade looms
WEAKNESSES
• Traditional product items and no design variations
• Limited access to raw material
• Lack of market development
• Inadequate machine adoption
• Lack of coordination and cooperation between
different cluster actors
OPPORTUNITIES
• Availability of modern technology
• Availability of modern design
• Government-supported logistics facility
in preserving the sector
• Access to high value export market
THREATS
• Imported silk-based products
• Labour migration
• Fluctuating market price
• Decreasing domestic demand
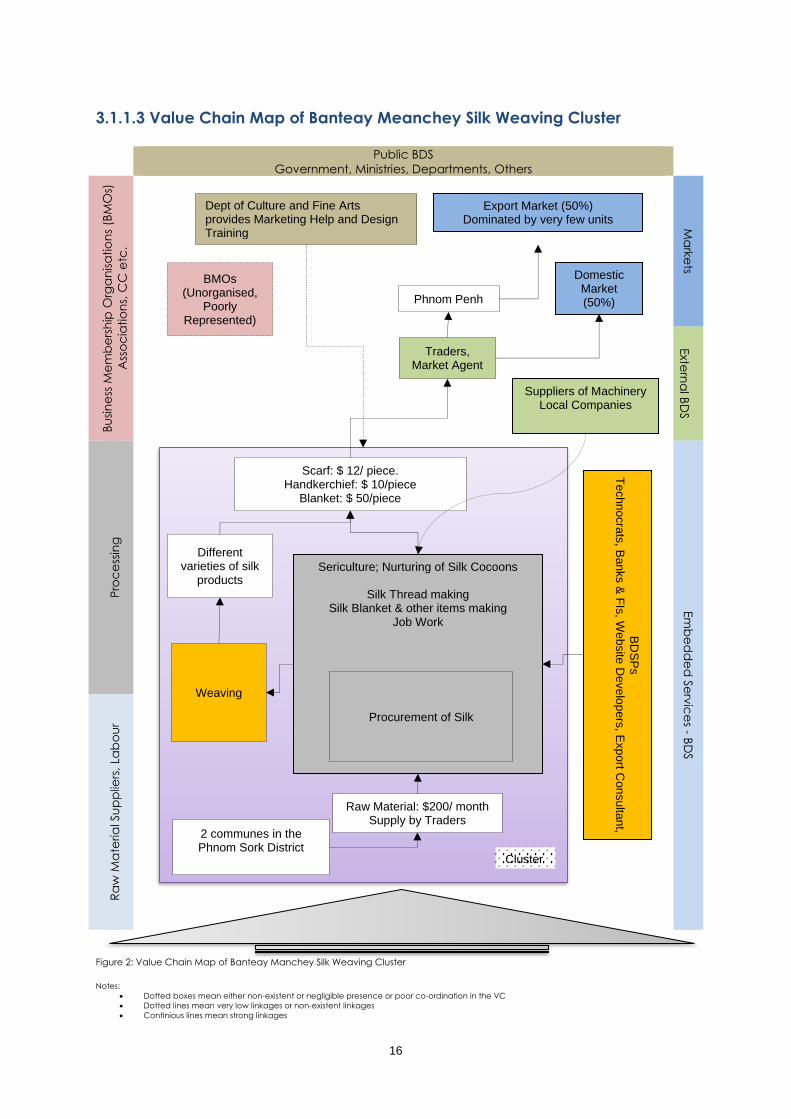
16
3.1.1.3 Value Chain Map of Banteay Meanchey Silk Weaving Cluster
Public BDS
Government, Ministries, Departments, Others
Bu
sin
ess
Me
mb
ers
hip
Org
an
isa
tio
ns
(BM
Os)
Ass
oc
iatio
ns,
CC
etc
.
Ma
rke
ts Exte
rna
l BD
S
Pro
ce
ssin
g
Em
be
dd
ed
Se
rvic
es - B
DS
Ra
w M
ate
ria
l Su
pp
liers
, La
bo
ur
Figure 2: Value Chain Map of Banteay Manchey Silk Weaving Cluster
Notes:
• Dotted boxes mean either non-existent or negligible presence or poor co-ordination in the VC
• Dotted lines mean very low linkages or non-existent linkages
• Continious lines mean strong linkages
Sericulture; Nurturing of Silk Cocoons
Silk Thread making Silk Blanket & other items making
Job Work
Procurement of Silk
Domestic Market (50%)
Export Market (50%) Dominated by very few units
Suppliers of Machinery Local Companies
Weaving
Different varieties of silk
products
Traders, Market Agent
Phnom Penh
BMOs (Unorganised,
Poorly Represented)
2 communes in the Phnom Sork District
Scarf: $ 12/ piece. Handkerchief: $ 10/piece
Blanket: $ 50/piece
Raw Material: $200/ month Supply by Traders
Dept of Culture and Fine Arts provides Marketing Help and Design Training
BD
SP
s
Technocra
ts, B
anks &
FIs
, Website
Deve
lope
rs, E
xp
ort C
on
su
ltant,
Cluster
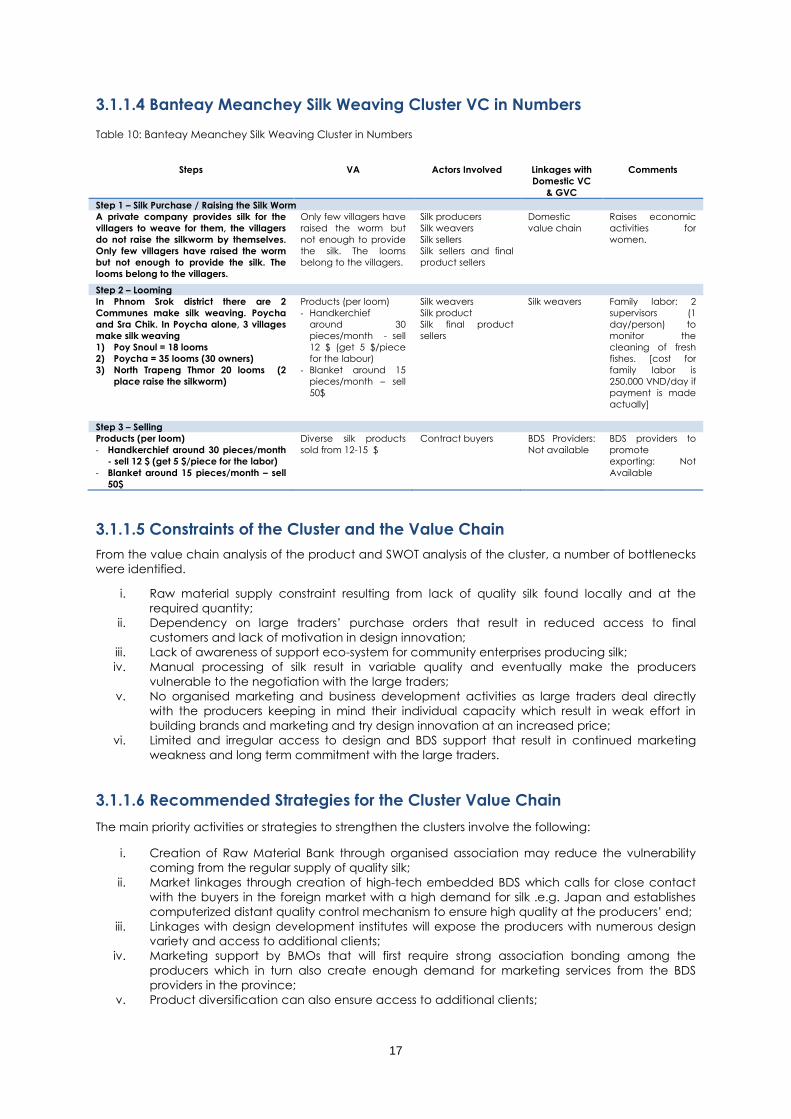
17
3.1.1.4 Banteay Meanchey Silk Weaving Cluster VC in Numbers Table 10: Banteay Meanchey Silk Weaving Cluster in Numbers
Steps VA Actors Involved Linkages with
Domestic VC
& GVC
Comments
Step 1 – Silk Purchase / Raising the Silk Worm
A private company provides silk for the
villagers to weave for them, the villagers
do not raise the silkworm by themselves.
Only few villagers have raised the worm
but not enough to provide the silk. The
looms belong to the villagers.
Only few villagers have
raised the worm but
not enough to provide
the silk. The looms
belong to the villagers.
Silk producers
Silk weavers
Silk sellers
Silk sellers and final
product sellers
Domestic
value chain
Raises economic
activities for
women.
Step 2 – Looming
In Phnom Srok district there are 2
Communes make silk weaving. Poycha
and Sra Chik. In Poycha alone, 3 villages
make silk weaving
1) Poy Snoul = 18 looms
2) Poycha = 35 looms (30 owners)
3) North Trapeng Thmor 20 looms (2
place raise the silkworm)
Products (per loom)
- Handkerchief
around 30
pieces/month - sell
12 $ (get 5 $/piece
for the labour)
- Blanket around 15
pieces/month – sell
50$
Silk weavers
Silk product
Silk final product
sellers
Silk weavers Family labor: 2
supervisors (1
day/person) to
monitor the
cleaning of fresh
fishes. [cost for
family labor is
250.000 VND/day if
payment is made
actually]
Step 3 – Selling
Products (per loom)
- Handkerchief around 30 pieces/month
- sell 12 $ (get 5 $/piece for the labor)
- Blanket around 15 pieces/month – sell
50$
Diverse silk products
sold from 12-15 $ Contract buyers BDS Providers:
Not available
BDS providers to
promote
exporting: Not
Available
3.1.1.5 Constraints of the Cluster and the Value Chain
From the value chain analysis of the product and SWOT analysis of the cluster, a number of bottlenecks
were identified.
i. Raw material supply constraint resulting from lack of quality silk found locally and at the
required quantity;
ii. Dependency on large traders’ purchase orders that result in reduced access to final
customers and lack of motivation in design innovation;
iii. Lack of awareness of support eco-system for community enterprises producing silk;
iv. Manual processing of silk result in variable quality and eventually make the producers
vulnerable to the negotiation with the large traders;
v. No organised marketing and business development activities as large traders deal directly
with the producers keeping in mind their individual capacity which result in weak effort in
building brands and marketing and try design innovation at an increased price;
vi. Limited and irregular access to design and BDS support that result in continued marketing
weakness and long term commitment with the large traders.
3.1.1.6 Recommended Strategies for the Cluster Value Chain
The main priority activities or strategies to strengthen the clusters involve the following:
i. Creation of Raw Material Bank through organised association may reduce the vulnerability
coming from the regular supply of quality silk;
ii. Market linkages through creation of high-tech embedded BDS which calls for close contact
with the buyers in the foreign market with a high demand for silk .e.g. Japan and establishes
computerized distant quality control mechanism to ensure high quality at the producers’ end;
iii. Linkages with design development institutes will expose the producers with numerous design
variety and access to additional clients;
iv. Marketing support by BMOs that will first require strong association bonding among the
producers which in turn also create enough demand for marketing services from the BDS
providers in the province;
v. Product diversification can also ensure access to additional clients;

18
vi. Policy advocacy for sericulture development can bring great changes to the way producers
run their enterprises, through accessing tax incentives and export cash subsidies, subsidized
fair events within the country and the region, government procurement for special purposes,
government supported campaigns in favour of using silk etc.
3.1.2 Battambang Fish Sauce Cluster
3.1.2.1 Provincial Overview
Main produces / products
• Main products in the province include:
- Battambang grapes & wine
- Battambang orange (no processing
facility / value addition )
- Fish meatball
- Fish sauce
- Rice
- Mug bean, green bean
- Balm oil
• Rice accounts for 75% of total trading
• Limited modern facilities available for
agro- processing
Access to Finance
Phnom Penh Bank
Loan to farmers (agriculture and fishing)
Commercial Loans are priority sector
AMK Microfinance
Loan to SMEs- priority
Business loan, personal loan
Total disbursement till June: 17 million USD
Selected Product Cluster
Fish Sauce Cluster
Total number of units are 7
Direct employment in total 150
Map 3: Battambang, Cambodia
About the Province
Area: 11,702 sq km
Population: 1126345
One of the most important trading City Source: “Economic Census of Cambodia 2011
– Provincial Report” By NIS; Ministry of Planning;
Phnom Penh. February 2013
Map source: Google
3.1.2.2 Cluster Introduction and SWOT Analysis
Fermented fish in the form of fish sauce, known as ‘Tuk Trey’ in Cambodia, is a very important culinary
adjunct providing micro minerals and micro nutrients essential to healthy life. Battambang host a large
number of fish sauce factories out of a total of nearly 800 fish sauce factories throughout Cambodia.
The identified strengths, weaknesses, opportunities and threats are listed below:
Table 11: Battambang Fish Sauce Cluster SWOT Analysis
STRENGTHS
• High market demand
• Availability of fresh fish
• Availability of other ingredients
WEAKNESSES
• Lack of pro-active BMO
• Units have limited market access
• No quality control
• No export / marketing brand
OPPORTUNITIES
• Regional market demand is very high
• Traditional skill is available
• Land Area for expansion is available
• Capacity expansion indicating positive outlook
THREATS
• Infiltration of Thailand-based products
• High tax for boiler
• Increasing competition from other AEC zone
countries; i.e. Vietnam

19
3.1.2.3 Processing of Fish Sauce
Figure 3: Processing Steps of Fish Sauce
3.1.2.4 Value Chain Map of Battambang Fish Sauce Cluster
Public BDS
Government, Ministries, Departments, Others
Bu
sin
ess
Me
mb
ers
hip
Org
an
isa
tio
ns
(BM
Os)
Ass
oc
iatio
ns,
CC
, FTI
, e
tc
Ma
rke
ts Exte
rna
l BD
S
Pro
ce
ssin
g
Em
be
dd
ed
BD
S
Lac
k o
f serv
ice
pro
vid
ers
Ra
w M
ate
ria
l Su
pp
liers
, La
bo
ur
Figure 4: Value Chain Map of Battambang Fish Sauce Cluster
Fish and Salt MiingNatural
DecompositionProcessing Marketing
CD
E (
Fre
sh W
ate
r F
ish)
Natural Salt
Sweet Water Fish
Domestic Markets
Need for
Technology BDS,
Knowledge BDS,
Marketing BDS
CC
FTI
Other BMOs
Ministry of
Vocational
Training
Ministry of
Industries Provincial Government
Domestic
Trading
Agents
Natural
Decompositi
on
Retail Trading
Fermented
Fish Sauce
Boiling & Processing Eq
uip
me
nt,
Pa
cka
gin
g, D
esig
n,
Ba
nks, O
the
rs
Cluster

20
Notes:
• Dotted boxes mean either non-existent or negligible presence or poor co-ordination in the VC
• Dotted lines mean very low linkages or non-existent linkages
• Continuous lines mean strong linkages
3.1.2.5 Battambang Fish Sauce Cluster Value Chain in Numbers Table 12: Constraints of the Cluster and the Value Chain
Steps VA Actors
Involved
Linkages with
Domestic VC & GVC
Step 1 – Procurement of Fish and Ingredients
From the cost and revenue analysis of Ponler
Preah Atit Fish Sauce, Romcheck 4 Village,
Ratanak District, Battambang City.
Procurement of fish:
During Nov. and Dec. 12 T (2 barrels) as
annual requirement.
Procurement of fermented fish sauce:
- One year 1200 baskets
- One basket = 30 Lit
- One basket = 40000 R
Cost of ingredients
- 1 kg = 2000 R
- Salt = 340 R/kg
- Salt is 30 % of 100%
- Renting stock for the fish 200 $
Fish traders,
input sellers
Domestic value
chain
Step 2 – Processing and boiling
One month of boiling with the fermented fish
sauce. Keep 6 months to get the fermented
fish sauce.
180 skets (1 day = 3 to 6 baskets)
Cost of processing
- Firewood 5 metre/day
(1 metre = 50000R)
- Electricity 160$/month
- Water 800000 R/month
- Salt 300kg/day
- Sugar 32kg/day (1kg=2000R)
- Kamel (for making fish sauce color)
=30$/month; Iron 3kg/day (1kg=10$)
HH members
Hired workers
Domestic and
regional value chain
Step 3 – Packaging and Selling
Packaging
- Bottle 1 unit = 300 R
- Cover 1 unit = 60 R
- Tag 1 unit = 50 R
- Cable 1 unit = 20 R
- Plastic 1 unit = 150 R
- Bag 1 unit = 30 R
- Rubber 1 unit = 0.5 R
- 1 bottle = 0.75 Litre
Selling: 6500 R/6 bottles
Cost of packaging (workers)
- 14 people
- Salary = 400000 R/person/month
- Food, water, electricity 8000 R/day
- Social security 60000 R/month
- Care insurance 280 $/year
- Security guard 140$/month
- First aids kid 150000 to 200000
R/month
Wholesalers
Traders
3.1.2.6 Constraints of the Cluster and the Value Chain
From the value chain analysis of the product and SWOT analysis of the cluster, a number of bottlenecks
were identified.
i. Scale of production (lack of economies of scale) coming from traditional smaller units of
production without strong business cooperation links among the producers;
ii. Investment capacity of producers is limited when it comes to purchasing capital
equipment like boiler and there has been little cooperation among the producers in the
use of shared capital assets;
iii. Mechanization, testing and international quality certification has been identified as a
major constraint as maintaining quality of the processing and ingredients proved to be a
concern;
iv. Failure in compliance of proper hygiene practices in processing also contribute to quality
of the products;
v. Producers / SMEs here have little experience in forming associations activate the same to
achieve strength in marketing and procurement affecting independent well-being of all
producers;
vi. Since there have been limited association-based activities or even consortia formation
among the producers, demand for business development services has never been
significant enough to encourage service providers to come forward and support the
producers.

21
3.1.2.7 Recommended Strategies for the Cluster Value Chain
The main priority activities or strategies to strengthen the clusters involve the following:
i. Support to mechanization of few large producers to ensure quality and build awareness
among the producers towards a common quality management;
ii. Introduce ToT (Training of Trainers) course to ensure standard and quality training and
dissemination and implementation of the quality programs among the producers;
iii. Quality program will also facilitate packaging with nutritional and quality label;
iv. Market development and market diversification which would include connection to new
clients and markets through an interactive database. This arrangement can also support
formation of export consortia among the producers and increase over-border and
overseas trade;
v. Introduction of embedded BDS which can emerge from ‘value business value partners’ or
investors and can improve the quality and capacity of the producers fit for an upper-end
consumer market;
vi. Business Matching Programs can be initiated with the help of online database requesting
technical support or it may also be supported physically or through face-to-face
communication.
3.1.3 Pursat Orange Cluster
3.1.3.1 Provincial Overview
Total producers = 2066 (out of which 202
producers are not registered)
SEZ: Province Is going to have 1 SEZ
Govt. Support: Govt. plans for developing the
SMEs in the province through diverse support
schemes
Products: Important products in the province
include: - Stone/marble
- Rice
- Maze
- Cassava
- Pepper
- Orange
- Palm sugar
• Non availability of resources
• Lack of entrepreneurship
Selected Cluster
Orange Cluster
Total farming area consisting of four villages - Angkrong Village
- Tades Village
- O Preal Village
- Rovieng Village
Map 4: Pursat, Cambodia
Area: 12692 sq km
Population: 425704
According to available economic census reports,
Pursat is ranked 14th as per number of establishment
(which is around 12075; including street business)
and 15th as per number of employee engagement. Source: “Economic Census of Cambodia 2011
– Provincial Report” By NIS; Ministry of Planning;
Phnom Penh. February 2013
Map source: Google
3.1.3.2 Cluster Introduction and SWOT Analysis
In Pursat province, orange orchards can be found in Dob Bath, Roleap village, Sampov Meas and Bak
Chenh Chean commune, and Phnom Kravanh district. Oranges are considered an special fruits in this
province and fresh oranges are usually displayed and sold along the sidewalk on the eastern side of

22
Pursat market. ‘270 Trees per hector’ is an average cultivation estimate while a total of 131298 trees are
estimated in the province, 40700 of those trees are in cultivation range. Average yield per tree is
estimated at 440 fruits in one season. Price varies from USD 5-10 per “Phloun” (44 fruit = 1 Phloun). The
identified strengths, weaknesses, opportunities and threats are listed below:
Table 13: Pursat Orange Cluster SWOT Analysis
STRENGTHS
• Unique natural and climatic conditions (soil,
tropical climate)
• Large available land for firming
• Traditional knowledge of farming
• Constant market demand
WEAKNESSES
• Shortage of irrigation facility
• Lack of market development with further
processing (e.g. juice making)
• Inadequate technology adoption
• Lack of cooperation among cluster actors
• No storage and processing facility available
OPPORTUNITIES
• Modern technology to boost sorting / processing
• Use of better seeds
• Emerging technologies in food processing
• Govt. support logistics facilities through SEZ
• Upcoming SEZ to facilitate further processing
• Contract farming and commercialization
THREATS
• Inadequate irrigation system
• Occasional dry climate and seasonality
causing drop in production and pushing up
prices
• Fluctuating market price of Orange

23
3.1.3.3 Value Chain Map of Pursat Orange Cluster
Public BDS
Government, Ministries, Departments, Others
Bu
sin
ess
Me
mb
ers
hip
Org
an
isa
tio
ns
(BM
Os)
Ass
oc
iatio
ns,
CC
, FTI
, e
tc
Ma
rke
ts Exte
rna
l BD
S
Pro
ce
ssin
g
Em
be
dd
ed
Se
rvic
es - B
DS
Ra
w M
ate
ria
l Su
pp
liers
, La
bo
ur
Figure 5: Value Chain Map of Pursat Orange Cluster
Notes: • Dotted boxes mean either non-existent or negligible presence or poor co-ordination in the VC
• Dotted lines mean very low linkages or non-existent linkages
• Strong lines mean strong linkages
Department
of Agriculture
Seeds
Dept. of
Industries
Dept. of Agriculture
Department of Commerce
Pursat
Angkrong
Orange
Association -
200 members
Food Safety
and Hygiene
Office
Packaging and Distribution
Collection
Farming
Nursery
Agents at
Phnom Penh
Vietnam
Thailand
Domestic
Markets
Wholesale
Markets
Local Seed Dealers/Nursery
Testing Lab

24
3.1.3.4 Pursat Orange Cluster the Value Chain in Numbers Table 14: Pursat Orange Cluster the Value Chain in Numbers
Steps VA Actors
Involved
Linkages with
Domestic VC & GVC
Step 1 – Plantation
Plantation area includes Angkrong
Village, Tades Village, O Preal Village
and Rovieng Village. Angkrong village
data shows total plantation of 131298
Trees with 270 tress in 1 hectare and
40,700 trees are being cultivated /
harvested
Yield
1 tree = 10 Phloun = 440 fruits
1 Phloun = 44 fruits
Farmers
Nursery
Domestic / Regional value
chain
Step 2 – Harvesting
Cultivating 2 times per year
- Sept – Dec
- Mar – Apr (20 to 30 % of the 1st
cultivation)
Selling price
1st : 1 Phloun = 20000 to 25000 R
2nd : 1 Phloun = 35000 to 40000 R
Farmers
Hired workers
Traders
Domestic and regional
value chain
Step 3 – Sorting and packaging
Selling channels through middlemen to
- Phnom Penh
- Battambang
Sold as generic products. Not much sorting and packaging functions available.
Traders
3.1.3.5 Constraints of the Cluster and the Value Chain
From the value chain analysis of the product and SWOT analysis of the cluster, a number of bottlenecks
were identified.
i. No processing facility (e.g. juice processing) nearby. Thus value addition becomes restricted to
farming practices, harvesting, sorting, grading, post-harvest storage, packaging and
transportation;
ii. Though there are many orange growers in the region, there is no organized efforts in
negotiating with the local authorities in technology upgrade and / or seeking marketing
services in a group;
iii. Overseas market competition is another constraint that needs to be addressed through
branding and packaging;
iv. Lack of export market research and limited contact with buyers result in dependency on the
channel intermediary about market information and prices;
v. Lack of value addition in improved industrial packaging results in low access to quality logistic
services;
vi. Information asymmetry leads to lack of awareness on the part of entrepreneurs about
Government-led supportive schemes;
vii. Non-compliance with good farming practices remains another key constraint.
3.1.3.6 Recommended Strategies for the Cluster Value Chain
The main priority activities or strategies to strengthen the clusters involve the following:
i. Organizing the cluster members so as to make them good candidate for common facilities
and cluster-wide investment or technical assistance;
ii. Cluster actor development that would enable better business relationship between growers,
transporters, processors and wholesalers / exporters;
iii. Development of export consortia through better organizing the cluster members is a key to
overcome organizing problems in the cluster;
iv. Export market research through interactive online database and access to e-commerce
platforms by lead / large institutional growers;
v. Hi-end testing lab for processed fruits can be initiated to promote further value addition by
processing of oranges.
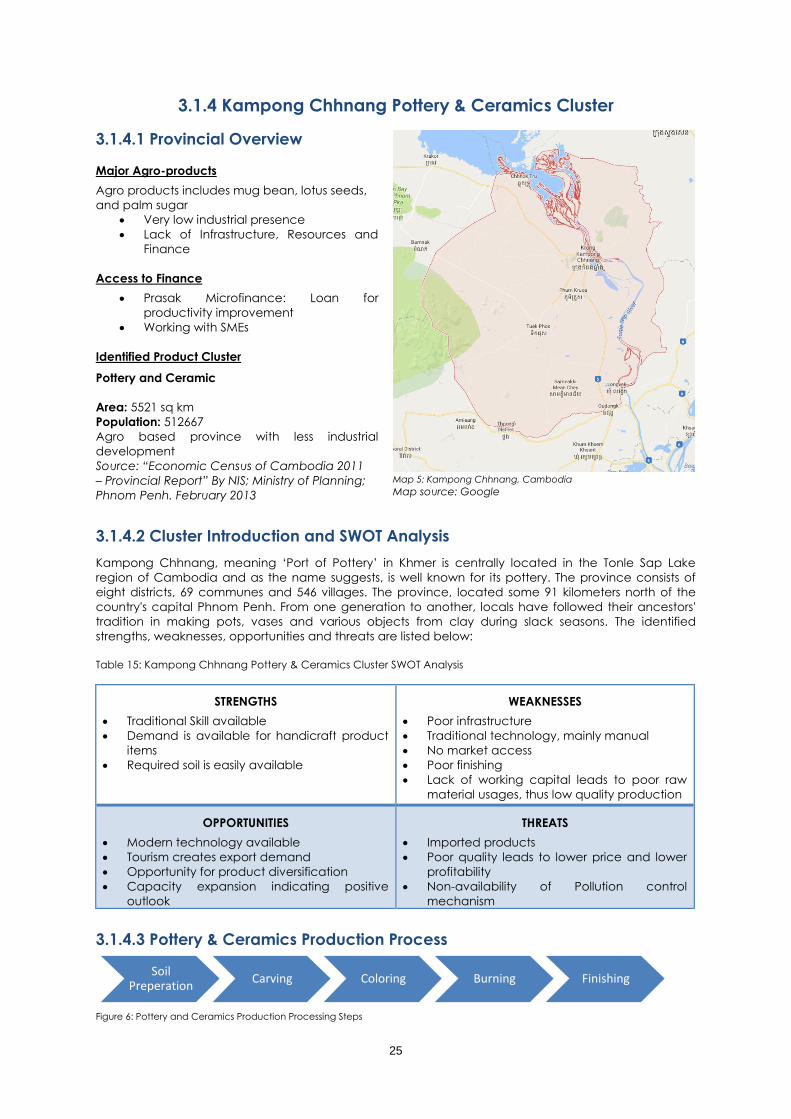
25
3.1.4 Kampong Chhnang Pottery & Ceramics Cluster
3.1.4.1 Provincial Overview
Major Agro-products
Agro products includes mug bean, lotus seeds,
and palm sugar
• Very low industrial presence
• Lack of Infrastructure, Resources and
Finance
Access to Finance
• Prasak Microfinance: Loan for
productivity improvement
• Working with SMEs
Identified Product Cluster
Pottery and Ceramic
Area: 5521 sq km
Population: 512667
Agro based province with less industrial
development
Source: “Economic Census of Cambodia 2011
– Provincial Report” By NIS; Ministry of Planning;
Phnom Penh. February 2013
Map 5: Kampong Chhnang, Cambodia
Map source: Google
3.1.4.2 Cluster Introduction and SWOT Analysis
Kampong Chhnang, meaning ‘Port of Pottery’ in Khmer is centrally located in the Tonle Sap Lake
region of Cambodia and as the name suggests, is well known for its pottery. The province consists of
eight districts, 69 communes and 546 villages. The province, located some 91 kilometers north of the
country's capital Phnom Penh. From one generation to another, locals have followed their ancestors'
tradition in making pots, vases and various objects from clay during slack seasons. The identified
strengths, weaknesses, opportunities and threats are listed below:
Table 15: Kampong Chhnang Pottery & Ceramics Cluster SWOT Analysis
STRENGTHS
• Traditional Skill available
• Demand is available for handicraft product
items
• Required soil is easily available
WEAKNESSES
• Poor infrastructure
• Traditional technology, mainly manual
• No market access
• Poor finishing
• Lack of working capital leads to poor raw
material usages, thus low quality production
OPPORTUNITIES
• Modern technology available
• Tourism creates export demand
• Opportunity for product diversification
• Capacity expansion indicating positive
outlook
THREATS
• Imported products
• Poor quality leads to lower price and lower
profitability
• Non-availability of Pollution control
mechanism
3.1.4.3 Pottery & Ceramics Production Process
Figure 6: Pottery and Ceramics Production Processing Steps
Soil Preperation
Carving Coloring Burning Finishing

26
3.1.4.4 Value Chain Map Kampong Chhnang Pottery Cluster
Public BDS
Government, Ministries, Departments, Others
Bu
sin
ess
Me
mb
ers
hip
Org
an
isa
tio
ns
(BM
Os)
Ass
oc
iatio
ns,
CC
, FTI
, e
tc
Ma
rke
ts Exte
rna
l BD
S
Pro
ce
ssin
g
Em
be
dd
ed
Se
rvic
es - B
DS
Ra
w M
ate
ria
l Su
pp
liers
, La
bo
ur
Figure 7: Value Chain Map Kampong Chhnang Pottery & Ceramics Cluster
Notes:
• Dotted boxes mean either non-existent or negligible presence or poor co-ordination in the VC
• Dotted lines mean very low linkages or non-existent linkages
• Strong lines mean strong linkages
Dept. of
Culture and
Fine Arts
Dept. of Industries
Department of Labour
and Vocational Training
Banh Chkol
Village
Burning & Finishing
Colouring
Carving
Processin
g
Export Agents
(20)
Phnom
Penh
Other Markets
Domestic
Markets
Wholesale
Markets
Local Soil Dealer

27
3.1.4.5 Kampong Chhnang Pottery Cluster Value Chain in Numbers Table 16: Kampong Chhnang Pottery Cluster Value Chain in Numbers
Steps VA Actors
Involved
Linkages with
Domestic VC & GVC
Step 1 – Soil collection and preparation
Collection and processing of soil
- One ton every 3 months = 5000 R
- Get the soil – dry – put in the water –
mix = 5 days (Grinding 6=7 kg = 600 R
Wages
- Making soil = 80 to 90 USD
- Curving = 150-200 USD
Producers
Soil traders
Domestic value
chain
Step 2 – Production
Making the product
curving – burn – ceramic = 2 weeks
Production cost
- Color water = 10 kg cost 40 USD
- Around 200 pieces
- Burn 2 times/month
- Firewood and gaze 110 USD
Producers
Hired workers
Domestic value
chain
Step 3 – Marketing and Sales
1 standard pack of pottery / ceramic
production = 100 USD
Marketing cost
- Send through bus to Siem reap around
1 to 2 packs/time
- 1 pack around 50 pieces = 10000 R
- Send to Phnom Penh by themselves, 1
time around 100000 R (5/6 packs)
Traders Domestic and
occasional regional
value chain
3.1.4.5 Constraints of the Cluster and the Value Chain
From the value chain analysis of the product and SWOT analysis of the cluster, a number of bottlenecks
were identified.
i. Like in many other clusters in Cambodia, Campong Chhnang is not organized very well to take
advantage of support services provided by the local authorities, to get benefitted from
marketing service providers etc.;
ii. The province promoted traditional art of pottery which has its significant share of market.
However, design innovation to adapt the design theme in other product line has not been
experimented and as result the pottery art is applied to a handful of traditional items;
iii. The Khmer traditional art is practiced in many villages and since there is no organized
marketing, the products remain at odd while competing in the overseas market with similar
products vying for their stake;
iv. There has not been enough research on finding new market or adapting the pottery design
theme to cater to new product ideas;
v. Limited cross border trade in GMS has also been identified as another constraint;
vi. As it has been mentioned earlier that the pottery has rather depended on traditional manual
operation with basic tools and techniques. However, the markets or clients often require that
the volume of the first orders should be large enough to cater to their client base. But without
access to and adoption of modern tools and technologies, the production cannot be scaled
up and hence the new market cannot be approached;
vii. Smaller lots of products translate into lack of quality logistic services.
3.1.4.6 Recommended Strategies for the Cluster Value Chain
The main priority activities or strategies to strengthen the clusters involve the following:
i. Clustering activity through awareness creation among the cluster members;
ii. Technology intervention through introduction of new tools to achieve time efficiency;
iii. VC up-gradation along the actors to particularly strengthen government support, marketing
and branding services, greater cooperation among the cluster members and promoting
access to new clients and markets;
iv. BDS market development through strengthening the cluster and making the sector attractive
to service providers to come forward benefitting each cluster members;
v. Formation of export consortia and development of export market to achieve new markets for
the cluster members and to boost total sales, total output and increase jobs;
vi. Export market research with the help of interactive online database and train the cluster
members to take most advantage out of it;

28
vii. Cross border trade facilitation by simplifying the trade procedures with a strong association by
the cluster members;
viii. Logistics service development by introducing suitable packaging and transport to support the
fragile nature of the products and to achieve cost advantage tagging with some other
products to be serviced together; Hi-end design and quality programs to facilitate export.
3.1.5 Svay Rieng Rice Cluster
3.1.5.1 Provincial Overview
Available Products
Rice (Srov Smach) – red color – total
cultivable area: 132 hec. (yield 1800kg/hec,
4000 riels/hec)
Sugar cane – total land 25000 hec (60T/hec)
Cassava – Total land 7000 hec (20T/hec.)
As per economic characteristics of Svay
Rieng province, the largest revenue earning
source of the province is “Wholesale and
Retail Trade” followed by “Manufacturing”
and “Arts, Entertainment and Recreation”.
Access to Finance
Improvement of agri-finance in recent years
Identified Produce Cluster
Rice
About the Province
Area: 2966 sq. km area,
Population: 500275
Long border with Vietnam
Map 6: Svay Rieng, Cambodia
Map Source: Google
Source: “Economic Census of Cambodia 2011
– Provincial Report” By NIS; Ministry of Planning;
Phnom Penh. February 2013
3.1.5.2 Cluster Introduction and SWOT Analysis
Rice has been chosen as the top priority agro- product of this province considering the growing export
of rice from this province and the numerous family-led farming and trading businesses that are un
operation and employ a large section of the working population in this province. Here, rice can both
be scaled-up for export, promoting improved farming practices, commercialization through contract
farming, facilitating access to finance to purchase high quality inputs during the sowing and cultivation
time. Rice can also be diversified (e.g. ecological rice) as value added products considering the
growing rice niches around the world. The identified strengths, weaknesses, opportunities and threats
are listed below:
Table 17: Svay Rieng Rice Cluster SWOT Analysis
STRENGTHS
• Unique natural and climatic conditions (soil,
tropical climate)
• Proximity to border
• Traditional knowledge of farming practices
with supportive natural resources and
conditions
WEAKNESSES
• Traditional farming practice and lack of exposure
in improved farming
• Weak market development for high value
products (e.g. ecological rice, sticky rice)
• Inadequate technology adoption to achieve
production efficiency
• Lack of coordination and cooperation between
different cluster actors
• No post-harvest storage facility

29
OPPORTUNITIES
• Modern technology may boost production
• Availability of variant good quality seeds
• Emerging technologies in rice cultivation /
milling
• Logistics facility is in good progress – thanks
to supportive programs and schemes
THREATS
• Dry climate and seasonal fluctuations with
inadequate irrigation facility
• No contract farming or modern production
partnerships that may lead to the possibility of
accruing stocks and loss of revenue and low
production of rice in the subsequent years

30
3.1.5.3 Value Chain Map of Svay Rieng Rice Cluster
Public BDS
Government, Ministries, Departments, Others
Bu
sin
ess
Me
mb
ers
hip
Org
an
isa
tio
ns
(BM
Os)
Ass
oc
iatio
ns,
CC
, FTI
, e
tc
Ma
rke
ts Exte
rna
l BD
S
Pro
ce
ssin
g
Em
be
dd
ed
Se
rvic
es - B
DS
Ra
w M
ate
ria
l Su
pp
liers
, La
bo
ur
Figure 8: Value Chain Map of Svay Rieng Rice Cluster
Notes:
• Dotted boxes mean either non-existent or negligible presence or poor co-ordination in the VC
• Dotted lines mean very low linkages or non-existent linkages
• Strong lines mean strong linkages
Local Labour
Local Farms (planted area 192,591 rai)
Farming
Harvesting
Packing
Processing
Export Agents
Vietnam
Other countries
Domestic Markets
CC
FTI
Other BMOs
Knowledge BDS
Ministry of Agriculture Ministry of Industries Provincial Government
Organic Rice
Rice Bran
Technology BDS
Households

31
3.1.5.4 Svay Rieng Rice Cluster the Value Chain in Numbers Table 18: Svay Rieng Rice Cluster the Value Chain in Numbers
Steps VA Actors
Involved
Linkages with
Domestic VC & GVC
Step 1 – Land preparation
Land area: 4400 hec.
Member of Rice Assoc. 58 farmers /
traders
Irrigation: Only depend on rainfall
one time a year for rice production
Water consumption underground water – 30
meters digging
Producers
Domestic value
chain
Step 2 – Plantation and farming practice
Rice production cost per hec.
Seed = 0 Sowing = 130000 R
Fertilizing= 130000R Watering/grassing= 0
Nutrient - Fertilizing = 290000 R x 3 times
Harvesting – rice reaping = 300000 R
Fertilizer commonly used
from Vietnam and from Japan
In the whole district
70% use Vietnam, 30 % use Japan
Input
manufactures
and traders
Domestic value
chain
Step 3 – Harvesting and Sales
Rice yield average 2T/hec (sell at
1kg=750r.)
Share pattern: 50 to 60% sell – the rest for family
consumption. Interest rate from Microfinace =
more than 1200000 r. at 3%/month
Traders Domestic and
occasional regional
value chain
3.1.5.5 Constraints of the Cluster and the Value Chain
From the value chain analysis of the product and SWOT analysis of the cluster, a number of bottlenecks
were identified:
i. There have not been much clustering activities among the rice producers which is crucial to
adapting to new farming practices and use of inputs;
ii. Irrigation has rather been traditional and based on rainfall. However, as production is scaled-
up, improved irrigation practices all over the year is necessary and drought-resistant rice
species needs to be introduced;
iii. Dependency on informal cross border trade for further processing mostly over the border to
Thailand provides alternation channel for the producers to sell. However, without formal
production arrangements, the producers may become vulnerable to market fluctuation and
channel cartel; Lack of marketing support for different products e.g. rice bran;
iv. Traditional farming techniques that are not suitable to scaling up production;
v. For high value products, modern packaging with nutritional label is necessary while for
mainstream products suitable industrial packaging is a priority;
vi. This is a major cross-border trade practice where paddy or rice-harvest is transported over
border for milling and further processing. However, value addition in the farming and post-
harvest facility is weak so as to strengthening and formalisation of the trade relationship
between the producers and the over-border millers.
3.1.5.6 Recommended Strategies for the Cluster Value Chain
The main priority activities or strategies to strengthen the clusters involve the following:
i. Efficient irrigation in the traditional low season and mechanisation of the agricultural practices
remains a priority. For this embedded services together with capital machinery is a key so that
users can take full advantage of mechanisation and achieve the required efficiency;
ii. Cluster strengthening can also be taken place by selecting and training of lead farmers to
convey farming knowledge to the rest of the cluster members through group learning sessions
and managing demo plot(s);
iii. Development of ‘agri-management support system’ can be initiated with online / mobile
enabled information about the weather and soil condition and the use of appropriate input to
reduce vulnerability at the producers’ end;
iv. On-the-field ‘quality testing’ would help farmers to reduce vulnerability and also support
harvest grading and storage priority while competing on storage facility;
v. Ecological rice is a growing demand from foreign markets where origin of rice weather and the
people, involved can also add value making it traditional or fair-value products. To tap this
market improved packaging, labelling and branding are significant steps forward;
vi. Access to finance in agriculture, though has been improved recently, is still needed to be
improved, particularly in rice farming. Since there is no contract farming, it becomes difficult for
the financial institutions to determine financial needs and follow proper assessment of the loan
applications. Over-border millers are not engaged directly with the farmers. As a result, there is

32
a vacuum of information in the Cambodian banking practices while it come to financing ricer
producers;
vii. Policy advocacy may bring solutions to many of the problems stated above including access
to finance which again requires strengthening of leadership in the cluster.
3.1.6 Koh Kong Fish Sauce Cluster
3.1.6.1 Provincial Overview Koh Kong province is largely a forested
mountainous area, not easily accessible by
road or other means. Total number of fish-
sauce establishments across the province is
around 5051.
Department of Commerce, Cambodia has
identified sea produce, honey, sugar and
banana wine as potential areas in Koh Kong
province to develop the market, strengthen
the quality and raise the income of the farmers.
However, ‘cluster’ is somewhat absent among
these producing communities who are rather
independent in producing fish sauce and is
entirely dependent on the market intermediary
for sale of their products.
Challenges of SMEs in the province:
- Access to finance;
- Technical and value chain development;
- Process and packaging development;
- Lack of interest and knowledge;
- No network/SME clusters;
- Marketing/lack of information.
Identified Product Cluster
Salt Water Fish Sauce
Map 7: Koh Kong, Cambodia
About the Province
• Area: 10090 sq km
• Population of the province: 133047
• One of the most important province in Mekong Delta Source: “Economic Census of Cambodia 2011
– Provincial Report” By NIS; Ministry of Planning;
Phnom Penh. February 2013
Map: Google
3.1.6.2 Cluster Introduction and SWOT Analysis
The fish-sauce cluster in the province plays a great role in local and regional gastronomy and provides
for part-time employment to many households in the province. Traditionally, women take the role of the
fish-sauce processing while the male members often contribute in technical fix-up, transportation of the
ingredients and processed products. The ingredients include one or more of diverse sea-sourced food
that are commonly used in the fish-sauce serving a range of culinary needs. The identified strengths,
weaknesses, opportunities and threats are listed below:
Table 19: Koh Kong Fish Sauce Cluster SWOT Analysis
STRENGTHS
• Constant regional high market demand
• Availability of fresh salt water fish and sea
food
• Aavailability of workers with indigenous
knowledge of producing fish sauce
WEAKNESSES
• Lack of pro-active BMOs to strengthen clusters
• Smaller units tend to depend on occasional sales
orders from channel intermediaries
• Lack of knowledge about hygiene and food
processing quality programs
• Poor packaging and weak access to packaging
services due to remote and disperse locations
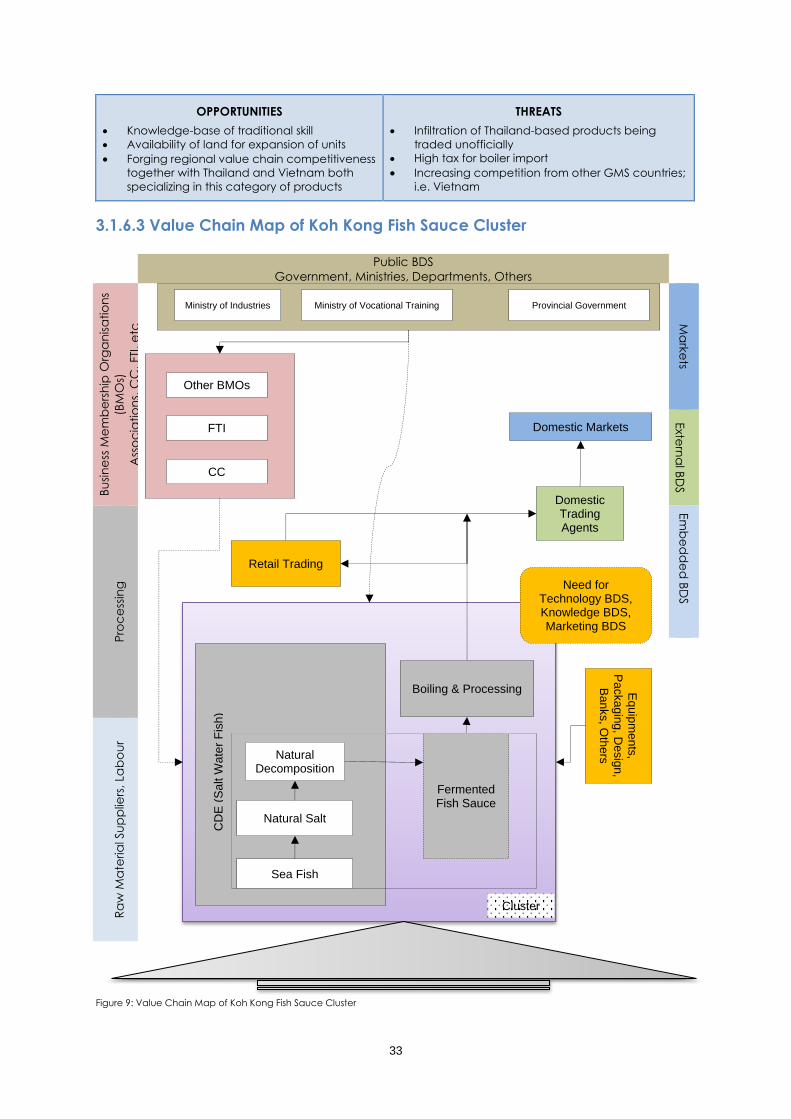
33
OPPORTUNITIES
• Knowledge-base of traditional skill
• Availability of land for expansion of units
• Forging regional value chain competitiveness
together with Thailand and Vietnam both
specializing in this category of products
THREATS
• Infiltration of Thailand-based products being
traded unofficially
• High tax for boiler import
• Increasing competition from other GMS countries;
i.e. Vietnam
3.1.6.3 Value Chain Map of Koh Kong Fish Sauce Cluster
Public BDS
Government, Ministries, Departments, Others
Bu
sin
ess
Me
mb
ers
hip
Org
an
isa
tio
ns
(BM
Os)
Ass
oc
iatio
ns,
CC
, FTI
, e
tc
Ma
rke
ts Exte
rna
l BD
S
Pro
ce
ssin
g
Em
be
dd
ed
BD
S
Ra
w M
ate
ria
l Su
pp
liers
, La
bo
ur
Figure 9: Value Chain Map of Koh Kong Fish Sauce Cluster
CD
E (
Salt W
ate
r F
ish)
Natural Salt
Sea Fish
Domestic Markets
Need for Technology BDS, Knowledge BDS, Marketing BDS
CC
FTI
Other BMOs
Ministry of Vocational Training Ministry of Industries Provincial Government
Domestic Trading Agents
Natural Decomposition
Retail Trading
Fermented Fish Sauce
Boiling & Processing Equip
ments
,
Packa
gin
g, D
esig
n,
Banks, O
thers
Cluster

34
Notes:
• Dotted boxes mean either non-existent or negligible presence or poor co-ordination in the VC
• Dotted lines mean very low linkages or non-existent linkages
• Strong lines mean strong linkage
3.1.6.4 Koh Kong Fish Sauce Cluster Value Chain in Numbers Table 20: Koh Kong Fish Sauce Cluster Value Chain in Numbers
Steps VA Actors
Involved
Linkages with
Domestic VC &
GVC
Step 1 – Procurement of Fish and Ingredients
Fish bought directly from fishermen’s
catch
A small producer can make 12 jars
of fish sauce
- One jar = 8 Ton
- Proportion 30% are salts
Fishermen
Producers
Domestic value
chain
Step 2 – Processing
- Fish mixed with salt
- Get the already mixed fishes (mix
with salt) and put into the jar
- 6 months of processing to get the
1st grade of fish sauce
- Next 0.5 month to get the 2nd grade
- Next 0.5 month to get the 3rd grade
Production volume
- Produce 8 jars per time
- 1 month could produce 10000
liters
Staffed mostly by household
members
HH
members
Hired
workers
Domestic and
regional value
chain
Step 3 – Packaging / bottling and Selling
Producers sell the fish sauce in large jars
No packaging or bottling functions take
place at producers’ end
- First grade 20000 R/liter
- 2nd and 3rd grade 3000 R
Wholesalers
Traders
Domestic value
chain
3.1.6.5 Constraints of the Cluster and the Value Chain
From the value chain analysis of the product and SWOT analysis of the cluster, a number of bottlenecks
were identified.
i. Scaling up of the production of the smaller units remains a challenge as many of the fish-
sauce producing units are traditional home-based production facilities;
ii. Cluster strengthening is a new concept to the disperse production units and many of the
producers are simply unaware that establishing market opportunity to each of the producers
separately is difficult;
iii. Investment capacity of SMEs is also limited and investing in a common purpose supported by
provincial authorities is also something has never been tried out;
iv. Technical development of the production process is tied to exposure to improved system
what has never taken place for most of the producers. Dissemination of newly gained
technical expertise can be carried out by the selected producers who have visited improved
facilities or attended technical courses;
v. Testing and international quality certification is a pre-condition to brand the products with
high value that can claim higher prices from export markets;
vi. Hygiene practices in processing is also a key issue if the export markets taken into account
seriously;
vii. No significant cluster-related or joint activities among the producers took place and the
producers are unaware of forging informal and formal alliances themselves to achieve
common good and increased income;
viii. Limited marketing and other business development services available due to the fact that
there has not been common branding and marketing attempts among the producers.

35
3.1.6.6 Recommended Strategies for the Cluster Value Chain
The main priority activities or strategies to strengthen the clusters involve the following:
i. There are opportunities to train these producers towards a common goal of contributing to
bulk production under common branding and packaging. Formal partnerships with larger
processors or the lead producers is needed to connect with the export market and get
benefitted from increased sales;
ii. Modern plant with less manual intervention is necessary to attain higher quality and to target
quality-sensitive export markets. In this case, the smaller producers can also follow quality
programs in their primary processing and connect with the lead processors as secondary input
suppliers for further processing / packaging;
iii. Market development and market diversification of fish sauce can be achieved by targeting
different regional and global niches and following appropriate packaging;
iv. Export consortia formation with the lead producers can contribute to achieving further
cooperation among the smaller and medium producers in the cluster and finally lead to
increased income for all the producers;
v. Embedded business development services can play a leading role in connecting the cluster
with the regional and overseas market where the service providers can train the producers on
quality programs, take care of the packaging and also establish good contacts with the export
markets directly and act both as a ‘quality and sales agent’ for the producers;
vi. The selected producers can join learning visits to cluster in the neighboring countries that follow
improved food-processing and quality programs. The learning can also come in the form of
joining trade fair and regional business matching programs;
3.1.7 Kampot Natural Salt Cluster
3.1.7.1 Provincial Overview
Kampot is a coastal province in Cambodia. The
province hosts 17042 salt processing establishments
which contribute to 1.1% of economic output to
the national economy.
The basic encumbrance across the province is lack
of market demand in domestic market. Thus, a
problem of over production occurs.
Priority products in the province are:
- Pepper
- Durian
- Coconut
- Mango
- Fish sauce and
- Salt
Product Cluster Identified
Salt (Kampot Natural Salt)
Map 8: Kampot, Cambodia
Land Area: 4873 sq. km.
Population: 613305 Source: “Economic Census of Cambodia 2011
– Provincial Report” By NIS; Ministry of Planning;
Phnom Penh. February 2013
Map Source: Google
3.1.7.2 Cluster Introduction and SWOT Analysis
Natural salt production is a well-known economic activity in Kampot province of Cambodia. The salt
fields are close to the ocean. At the start of the production process water is let in from the ocean to the
fields. The fields are then blocked from the ocean and the water is allowed to evaporate, leaving salt
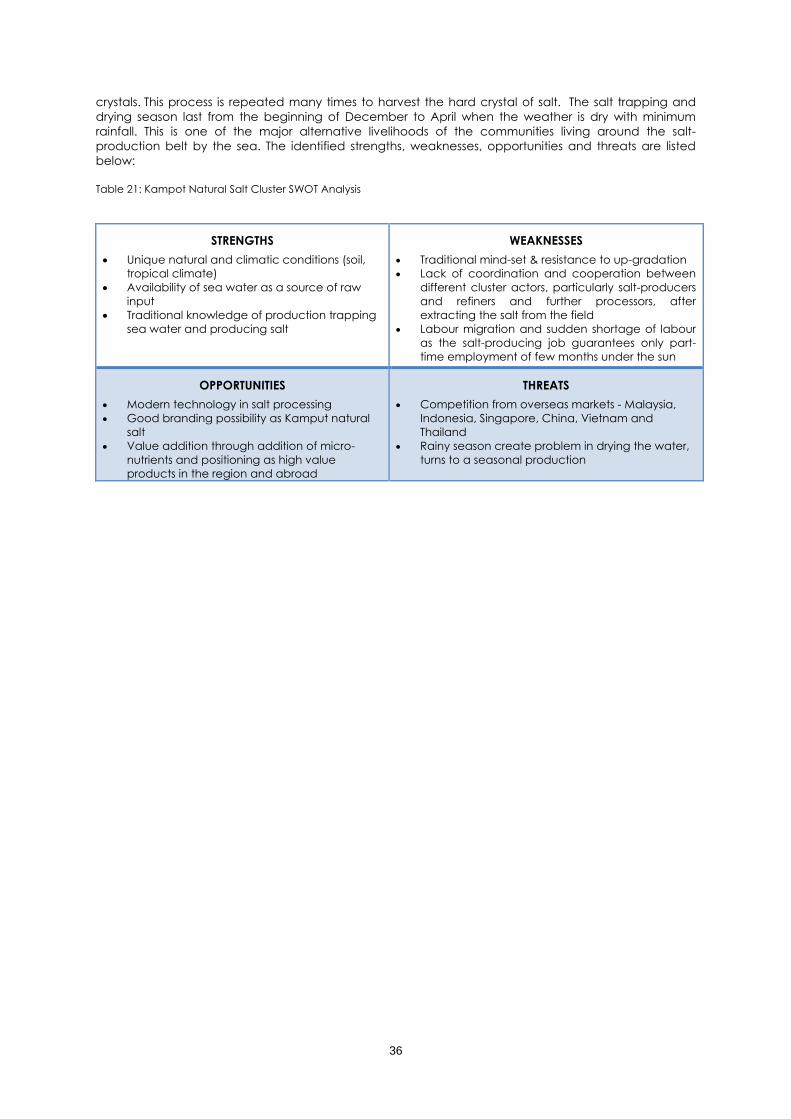
36
crystals. This process is repeated many times to harvest the hard crystal of salt. The salt trapping and
drying season last from the beginning of December to April when the weather is dry with minimum
rainfall. This is one of the major alternative livelihoods of the communities living around the salt-
production belt by the sea. The identified strengths, weaknesses, opportunities and threats are listed
below:
Table 21: Kampot Natural Salt Cluster SWOT Analysis
STRENGTHS
• Unique natural and climatic conditions (soil,
tropical climate)
• Availability of sea water as a source of raw
input
• Traditional knowledge of production trapping
sea water and producing salt
WEAKNESSES
• Traditional mind-set & resistance to up-gradation
• Lack of coordination and cooperation between
different cluster actors, particularly salt-producers
and refiners and further processors, after
extracting the salt from the field
• Labour migration and sudden shortage of labour
as the salt-producing job guarantees only part-
time employment of few months under the sun
OPPORTUNITIES
• Modern technology in salt processing
• Good branding possibility as Kamput natural
salt
• Value addition through addition of micro-
nutrients and positioning as high value
products in the region and abroad
THREATS
• Competition from overseas markets - Malaysia,
Indonesia, Singapore, China, Vietnam and
Thailand
• Rainy season create problem in drying the water,
turns to a seasonal production

37
3.1.7.3 Value Chain Map of Kampot Natural Salt Cluster
Public BDS
Government, Ministries, Departments, Others
Bu
sin
ess
Me
mb
ers
hip
Org
an
isa
tio
ns
(BM
Os)
Ass
oc
iatio
ns,
CC
, FTI
, e
tc
Ma
rke
ts Exte
rna
l BD
S
Pro
ce
ssin
g
Em
be
dd
ed
BD
S
Ra
w M
ate
ria
l Su
pp
liers
, La
bo
ur
Figure 10: Value Chain Map of Koh Kong Fish Sauce Cluster
Notes:
• Dotted boxes mean either non-existent or negligible presence or poor co-ordination in the VC
• Dotted lines mean very low linkages or non-existent linkages
• Strong lines mean strong linkages
CD
E (
fre
sh c
oc
on
ut)
Drying
Sea Water Input
Domestic Markets
Need for
Technology BDS,
Knowledge BDS,
Marketing BDS
CC
FTI
Other BMOs
Ministry of
Vocational
Training
Ministry of
Industries Provincial Government
Domestic
Trading
Agents
Collection of
Salt from Field
Salt Producers
Association
Processing
Raw Salt Granules Eq
uip
me
nts,
Pa
cka
gin
g, D
esig
n,
Ba
nks, O
the
rs
Cluster

38
3.1.7.4 Kampot Natural Salt Cluster Value Chain in Numbers
Table 22: Kampot Natural Salt Cluster Value Chain in Numbers
Steps VA Actors
Involved
Linkages with
Domestic VC & GVC
Step 1 – Land preparation
- 4500 hectare land (Kampot)
- 143000T of production (2016)
- 190 Salt producer group
Family break-down may change groups but
land area remains the same. The salt group
prepare the land for trapping the sea water.
Producers
Land-owners
Domestic value
chain
Step 2 – Salt Production
For producing 50 kg of salt:
- 3600 R (for workers, package and
association sustainability)
- 5000 R (provided by the association)
= 0 (means currently there is no profit)
Association provide capital of 5000 R per 50kg
to producers
Producers /
workers,
Association
Domestic value
chain
Step 3 – Selling
3675,95 Hec produce salt in Kampot and
current selling price is 8600 R
Overproduction continues which led to current
320000 T of salt in stock
Traders Domestic and
occasional regional
value chain
3.1.7.5 Constraints of the Cluster and the Value Chain
From the value chain analysis of the product and SWOT analysis of the cluster, a number of bottlenecks
were identified.
i. Manual production process cause several quality issues while quality control remains a pre-
condition to export the excess salt after national consumption;
ii. Lack of suitable storage and packaging technology remains one of the major bottlenecks.
After harvesting the salt, there is an immediate necessity to store the salt as both the weather
conditions and the workers situations becomes worse towards the end of the salt drying
season;
iii. Lack of infrastructure including transportation of the salt-harvest to the processing centre
remains a constraint;
iv. Cluster producers have limited cooperation among themselves and there is a high
dependency on the channel intermediaries.
3.1.7.6 Recommended Strategies for the Cluster Value Chain
The main priority activities or strategies to strengthen the cluster involve the following:
i. Introduction of proper technology and tools can reduce the time for processing significantly
and can also improve the quality of salt during sun-drying;
ii. Lead producers and processors can be taken on guided learning visits to have first-hand
experience about cooperation between cluster or community members and the processors.
This will also give the participants ideas about the modern salt production factories;
iii. Creating linkages with marketing / business development services or interactive database to
bring the producers in contact with technical collaborators and the buyers of natural salts;
iv. Find alternative use of sun-dried salts like in processing of leather and others which will give it
the opportunity to export of salts in bulk not conforming to the quality control of edible salts;
v. Capacity building of BMO can also be an important initiative foster cooperation among the
producers and connecting with investors / buyers.
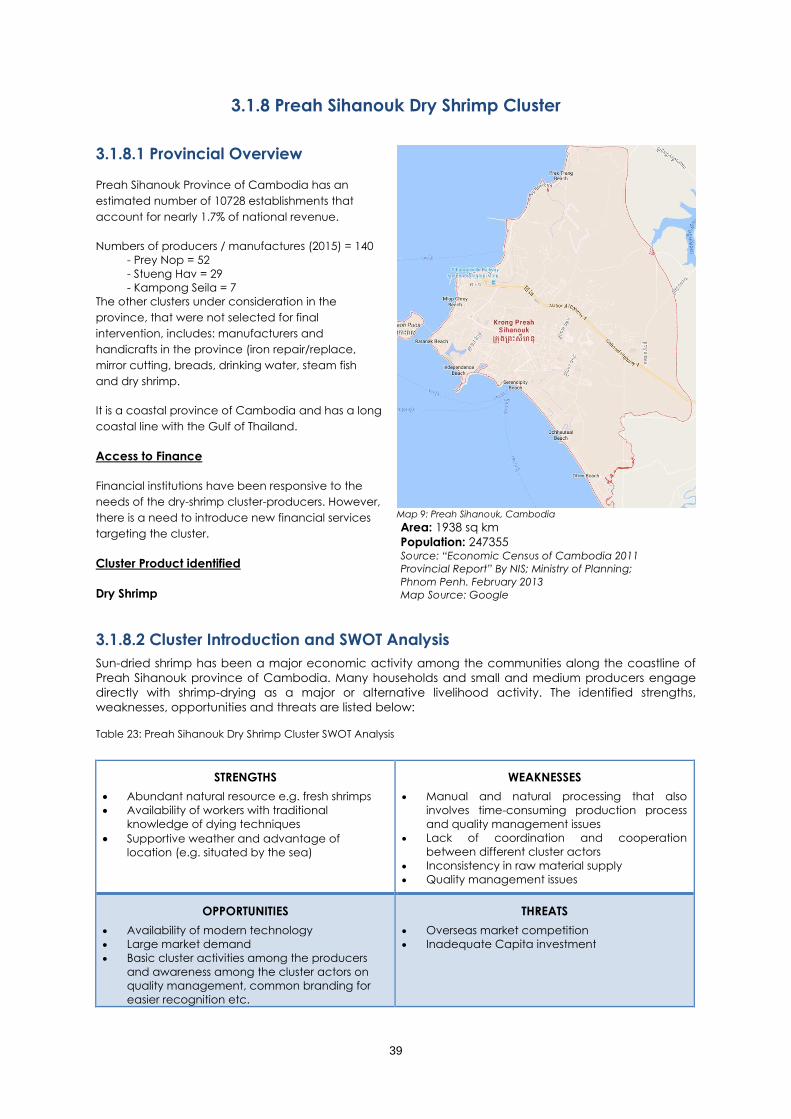
39
3.1.8 Preah Sihanouk Dry Shrimp Cluster
3.1.8.1 Provincial Overview Preah Sihanouk Province of Cambodia has an
estimated number of 10728 establishments that
account for nearly 1.7% of national revenue.
Numbers of producers / manufactures (2015) = 140
- Prey Nop = 52
- Stueng Hav = 29
- Kampong Seila = 7
The other clusters under consideration in the
province, that were not selected for final
intervention, includes: manufacturers and
handicrafts in the province (iron repair/replace,
mirror cutting, breads, drinking water, steam fish
and dry shrimp.
It is a coastal province of Cambodia and has a long
coastal line with the Gulf of Thailand.
Access to Finance
Financial institutions have been responsive to the
needs of the dry-shrimp cluster-producers. However,
there is a need to introduce new financial services
targeting the cluster.
Cluster Product identified
Dry Shrimp
Map 9: Preah Sihanouk, Cambodia
Area: 1938 sq km
Population: 247355 Source: “Economic Census of Cambodia 2011
Provincial Report” By NIS; Ministry of Planning;
Phnom Penh. February 2013
Map Source: Google
3.1.8.2 Cluster Introduction and SWOT Analysis
Sun-dried shrimp has been a major economic activity among the communities along the coastline of
Preah Sihanouk province of Cambodia. Many households and small and medium producers engage
directly with shrimp-drying as a major or alternative livelihood activity. The identified strengths,
weaknesses, opportunities and threats are listed below:
Table 23: Preah Sihanouk Dry Shrimp Cluster SWOT Analysis
STRENGTHS
• Abundant natural resource e.g. fresh shrimps
• Availability of workers with traditional
knowledge of dying techniques
• Supportive weather and advantage of
location (e.g. situated by the sea)
WEAKNESSES
• Manual and natural processing that also
involves time-consuming production process
and quality management issues
• Lack of coordination and cooperation
between different cluster actors
• Inconsistency in raw material supply
• Quality management issues
OPPORTUNITIES
• Availability of modern technology
• Large market demand
• Basic cluster activities among the producers
and awareness among the cluster actors on
quality management, common branding for
easier recognition etc.
THREATS
• Overseas market competition
• Inadequate Capita investment

40
3.1.8.3 Value Chain Map of Preah Sihanouk Dry Shrimp Cluster
Public BDS
Government, Ministries, Departments, Others
Bu
sin
ess
Me
mb
ers
hip
Org
an
isa
tio
ns
(BM
Os)
Ass
oc
iatio
ns,
CC
, FTI
, e
tc
Ma
rke
ts Exte
rna
l BD
S
Pro
ce
ssin
g
Em
be
dd
ed
BD
S
Ra
w M
ate
ria
l Su
pp
liers
, La
bo
ur
Figure 11: Value Chain Map of Preah Sihanouk Dry Shrimp Cluster
Notes:
• Dotted boxes mean either non-existent or negligible presence or poor co-ordination in the VC
• Dotted lines mean very low linkages or non-existent linkages
• Continuous lines mean strong linkages
CD
E (
fresh c
oconut)
Boiling & Drying
Procuring Shrimp
Domestic Markets
Need for
Technology BDS,
Knowledge BDS,
Marketing BDS
Dry Shrimp
Association
FTI
Other BMOs
Ministry of Vocational Training Ministry of Industries Provincial Government
Domestic
Trading
Agents
Cleaning
Logistic BDS
Grading
Packaging
Eq
uip
me
nts,
Pa
cka
gin
g, D
esig
n,
Ba
nks, O
the
rs
Cluster

41
3.1.8.4 Preah Sihanouk Dry Shrimp Cluster Value Chain in Numbers Table 24: Preah Sihanouk Dry Shrimp Cluster Value Chain in Numbers
Steps VA Actors
Involved
Linkages with
Domestic VC & GVC
Step 1 – Purchase and transport
Group members: Currently 12 groups
Production 300-500 kg
Purchase and transportation cost of 3 kinds of
shrimps (grade 1, 2 and 3,4,5)
- Grade 1 from 6000 to 7000 R / kg
- Grade 2 from 4000 to 6000 R / kg
- Grade 3 from 3000 to 5000 R / kg
Producers
Fish traders
Domestic value
chain
Step 2 – Processing (clean, dry, steam)
Buy – transfer – Clean – steam – Dry (Fire
and sunlight) – grading – packaging
10 kg (fresh shrimp) = 0.8 to 1 kg (dried shrimp) Producers /
workers,
Association
Domestic value
chain
Step 3 – Packaging and Selling
70% domestic sales, 30% international
sales
Final selling price at producers level
- Grade 1 = 80000 r
- Grade 2 = 60000 to 70000 R / kg
- Grade 3 = 55000 to 60000 R / kg
- Grade 4 = 45000 to 55000 R / kg
- Grade 5 = 30000 to 35000 R / kg
Traders /
Buyers
Domestic and
occasional regional
value chain
3.1.8.5 Constraints of the Cluster and the Value Chain
From the value chain analysis of the product and SWOT analysis of the cluster, a number of bottlenecks
were identified.
i. Scale of production of the dried-shrimp is mostly at house-hold / micro-level lacking
advantage in case of procuring fresh shrimps from the suppliers and taking advantage of
selling dried shrimps in a bulk;
ii. Investment capacity of SMEs is limited and that drives out the possibility of enterprise-level or
cluster-level investment-sharing together with provincial or development partners;
iii. Technical development of the drying process and accumulation and packaging remains a
key-constraint to scale up the drying and post-drying value chain functions;
iv. Very few producers observe the necessary hygiene practices in the process which may get
the product exposed to outside filth and wastes that cannot be cleaned properly under
traditional drying practices;
v. Extreme climatic condition affects the supply and drying of shrimps. Climate change affects
the timing and amount of rains in the seasons and that ultimately affects the amount of sun
and duration of no-rain period. As a result, natural drying process has been affected;
vi. To improve the quality of drying and to observe quality and hygiene programs among the
producers, it is necessary to organize the cluster for the common good of all the producers.
But there is little awareness of the local association and the common benefits that can bring
to producers;
vii. Scattered production / drying facilities have not been supportive to developing local
business development services like packaging, storing and the like.
3.1.8.6 Recommended Strategies for the Cluster Value Chain
The main priority activities or strategies to strengthen the cluster involve the following:
i. Standard and quality training program to all the members is a key to improve the quality of
the shrimps. This can be made easier by conducting a ToT program with some leading and
experienced producers who can further train the cluster members after completing their
trainings;
ii. Dried shrimp is used in different ways in different regions of the world and each of the
market requires its unique processing and sub-ingredients. Targeting different markets
differently will also increase the total sales of the dried shrimps and ensure diversification of
the markets; and
iii. Formation of export consortia by medium to large producers can also lead to sales increase
and subsequent integration of smaller producers in the export supply chains following
quality programs.

42
3.2 Myanmar
Provinces Name Cluster Name
➢ Dawei • Mackerel (Pla Tu) Cluster
Map 10: Provinces and Clusters in Myanmar
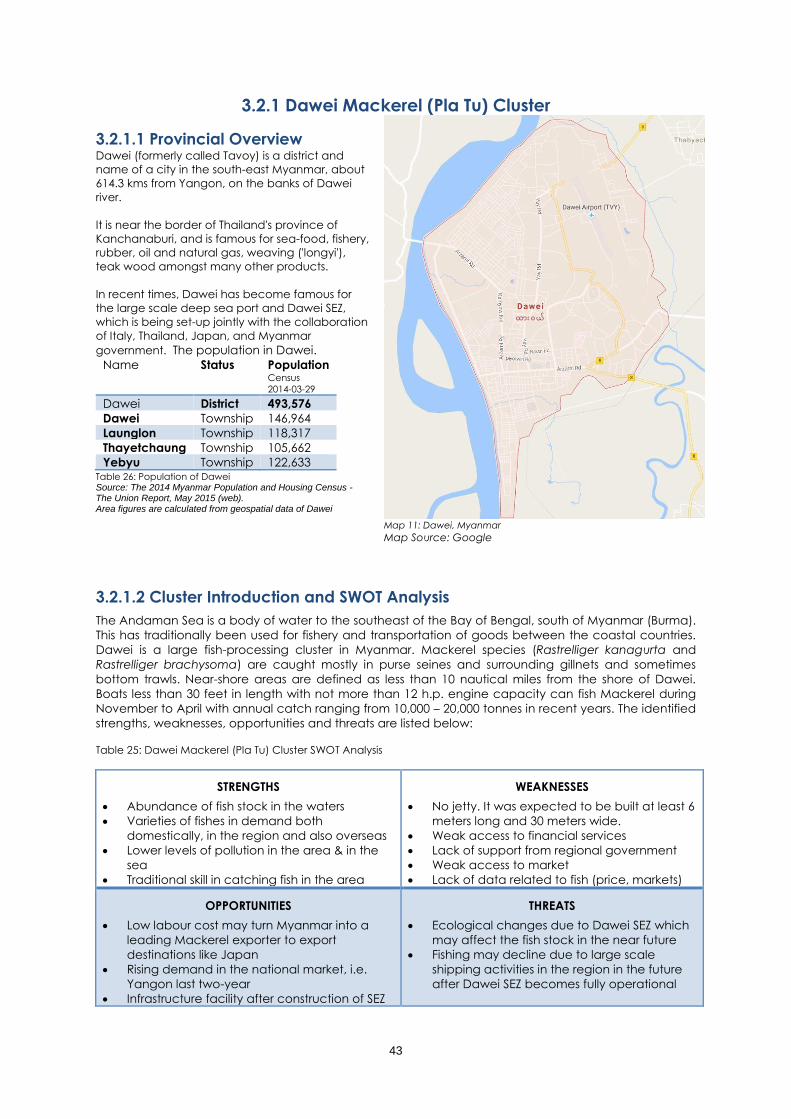
43
3.2.1 Dawei Mackerel (Pla Tu) Cluster
3.2.1.1 Provincial Overview Dawei (formerly called Tavoy) is a district and
name of a city in the south-east Myanmar, about
614.3 kms from Yangon, on the banks of Dawei
river.
It is near the border of Thailand's province of
Kanchanaburi, and is famous for sea-food, fishery,
rubber, oil and natural gas, weaving ('longyi'),
teak wood amongst many other products.
In recent times, Dawei has become famous for
the large scale deep sea port and Dawei SEZ,
which is being set-up jointly with the collaboration
of Italy, Thailand, Japan, and Myanmar
government. The population in Dawei.
Name Status Population Census
2014-03-29
Dawei District 493,576
Dawei Township 146,964
Launglon Township 118,317
Thayetchaung Township 105,662
Yebyu Township 122,633 Table 26: Population of Dawei Source: The 2014 Myanmar Population and Housing Census - The Union Report, May 2015 (web). Area figures are calculated from geospatial data of Dawei
Map 11: Dawei, Myanmar Map Source: Google
3.2.1.2 Cluster Introduction and SWOT Analysis
The Andaman Sea is a body of water to the southeast of the Bay of Bengal, south of Myanmar (Burma).
This has traditionally been used for fishery and transportation of goods between the coastal countries.
Dawei is a large fish-processing cluster in Myanmar. Mackerel species (Rastrelliger kanagurta and
Rastrelliger brachysoma) are caught mostly in purse seines and surrounding gillnets and sometimes
bottom trawls. Near-shore areas are defined as less than 10 nautical miles from the shore of Dawei.
Boats less than 30 feet in length with not more than 12 h.p. engine capacity can fish Mackerel during
November to April with annual catch ranging from 10,000 – 20,000 tonnes in recent years. The identified
strengths, weaknesses, opportunities and threats are listed below:
Table 25: Dawei Mackerel (Pla Tu) Cluster SWOT Analysis
STRENGTHS
• Abundance of fish stock in the waters
• Varieties of fishes in demand both
domestically, in the region and also overseas
• Lower levels of pollution in the area & in the
sea
• Traditional skill in catching fish in the area
WEAKNESSES
• No jetty. It was expected to be built at least 6
meters long and 30 meters wide.
• Weak access to financial services
• Lack of support from regional government
• Weak access to market
• Lack of data related to fish (price, markets)
OPPORTUNITIES
• Low labour cost may turn Myanmar into a
leading Mackerel exporter to export
destinations like Japan
• Rising demand in the national market, i.e.
Yangon last two-year
• Infrastructure facility after construction of SEZ
THREATS
• Ecological changes due to Dawei SEZ which
may affect the fish stock in the near future
• Fishing may decline due to large scale
shipping activities in the region in the future
after Dawei SEZ becomes fully operational
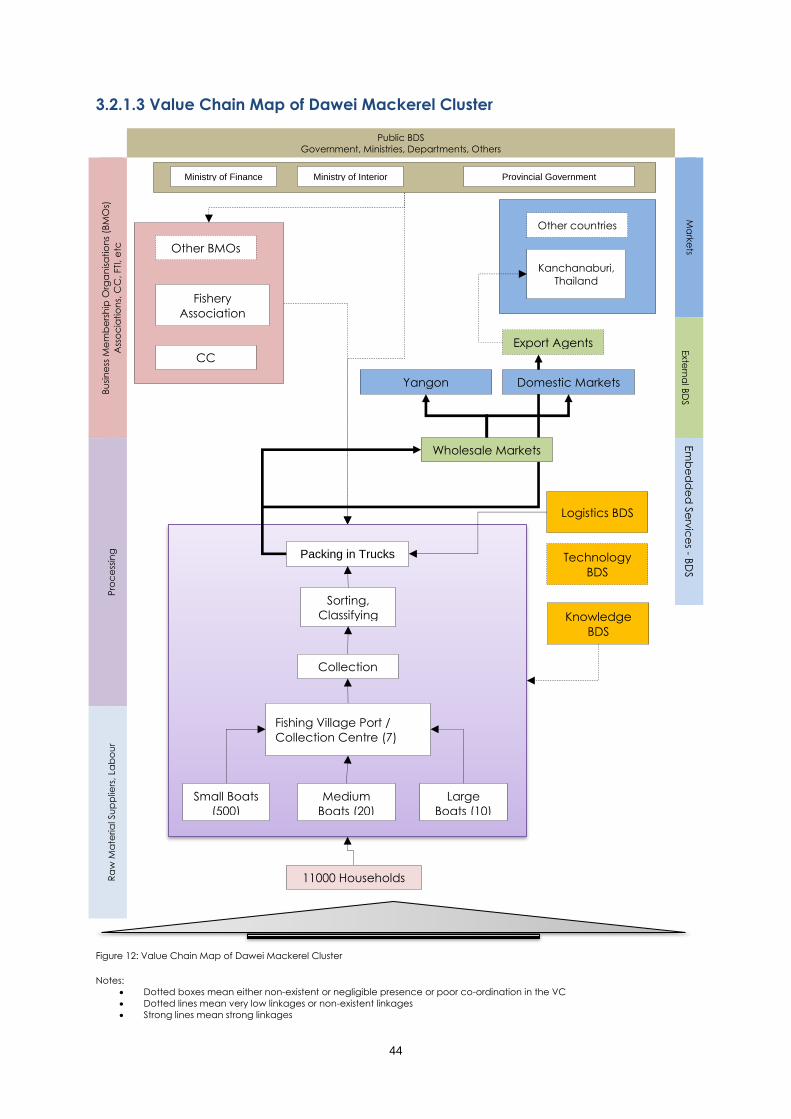
44
3.2.1.3 Value Chain Map of Dawei Mackerel Cluster
Public BDS
Government, Ministries, Departments, Others
Bu
sin
ess
Me
mb
ers
hip
Org
an
isa
tio
ns
(BM
Os)
Ass
oc
iatio
ns,
CC
, FTI
, e
tc
Ma
rke
ts Exte
rna
l BD
S
Pro
ce
ssin
g
Em
be
dd
ed
Se
rvic
es - B
DS
Ra
w M
ate
ria
l Su
pp
liers
, La
bo
ur
Figure 12: Value Chain Map of Dawei Mackerel Cluster
Notes:
• Dotted boxes mean either non-existent or negligible presence or poor co-ordination in the VC
• Dotted lines mean very low linkages or non-existent linkages
• Strong lines mean strong linkages
Fishing Village Port /
Collection Centre (7)
Collection
Sorting,
Classifying
Packing in Trucks
Export Agents
Kanchanaburi,
Thailand
Other countries
Domestic Markets
CC
Fishery
Association
Other BMOs
Knowledge
BDS
Ministry of Interior Ministry of Finance Provincial Government
Technology
BDS
11000 Households
Small Boats
(500)
Medium
Boats (20)
Large
Boats (10)
Yangon
Wholesale Markets
Logistics BDS

45
3.2.1.4 Value Chain of Dawei Mackerel Cluster in Numbers Table 26: Overview of Dawei Fisheries
Description
Fishing Boats and Trawlers
Off-shore region: beyond 10 miles of shore line of fish port
On-shore region: up to 10 mile of shore line of fish port
Type of fishing boats, trawlers
Size of
Boat
Total No. of
Boats
No. of Boat Owner in Selected
Port (At village Bauk Seik; Ref
Mr. Thet
Capacity of Fish Catching
Small
Boat
500 500 1.2 -1.5 metric tons of fish per day at every 2 day
Medium
Boat
20 20 15 – 20 metric tons per trip. Each trip is about 20
days during October – May of the year
Large
Boat
10 4 60-100 metric tons per trip. Each trip is about 20
days during October – May of the year
Total Catch (Production numbers)
• 1 Kg. of fish is 900 Kyat (minimum price) with maximum price of 13,000 Kyat for some type of fish.
• About 2000-2500 metric tons of fish per month
• Estimated 2 billion Kyat worth of fish is caught (calculated at base price of 900 Kyat / kg)
Transportation, Distribution, and Logistics
Only one transportation company operates from Dawei to Yangon with 3 trucks per day. Each truck carry at 15
metric tons
Transport routes:
• From fish port to Dawei local market
• From fish port to Yangon and thereon to China by unspecified logistic company
• From fish port to Kanchanaburi (salt fish) to Mahachai and thereon exported to Malaysia
Costs of Transport:
• Transportation cost from Dawei to Yangonis 130 Kyat per kg per trip
Markets
Total Production Value (from the province) is 27 million USD
Total Production Value is 843,750 US per month
• estimation of 15 metrics tons X 3 trucks X 25 days X 900 Kyat) and
• 1,218,075 USD maximum (estimation of 130,000 Kyat per Kg)
Regional market (Kanchanabur to Mahachai : TH)
• Plar Tho (type of fish) at 60 TH Baht per Kg. or 2100 Kyat
• Plar Leng (type of fish) at 90 TH baht
3.2.1.5 Constraints of the Cluster and the Value Chain
From the value chain analysis of the product and SWOT analysis of the cluster, a number of bottlenecks
were identified.
i. Lack of exposure and experience in sorting and processing of Mackerels in Myanmar which has
not been known as a traditional Mackerel exporters in Asian and Western export markets having
high demand;
ii. Absence of any common facilities, fishing jetty, logistics services, cold chains and packaging
makes it difficult to pursue a value product e.g. Mackerel which is a quality sensitive product;
iii. Marketing and branding of Dawei Mackerel does not exist unlike Thailand and Norway which
enjoy high recognition around the world.
3.2.1.6 Recommended Strategies for the Cluster Value Chain
The main priority activities or strategies to strengthen the cluster involve the following:
i. Training on Mackerel processing will boost the quality of products which would be beneficial to
many of the more than 11,000 households in 7 fishing villages whose livelihood that depend on
Dawei fishery;
ii. Fish collection, sorting, and packing processes need to be modernized led by the local authorities;
iii. Dawei Mackerel cluster needs to be directly brought in touch with upper-end export market like
Japan with buyers ready to offer technical collaboration for upgrading the processing
technology.
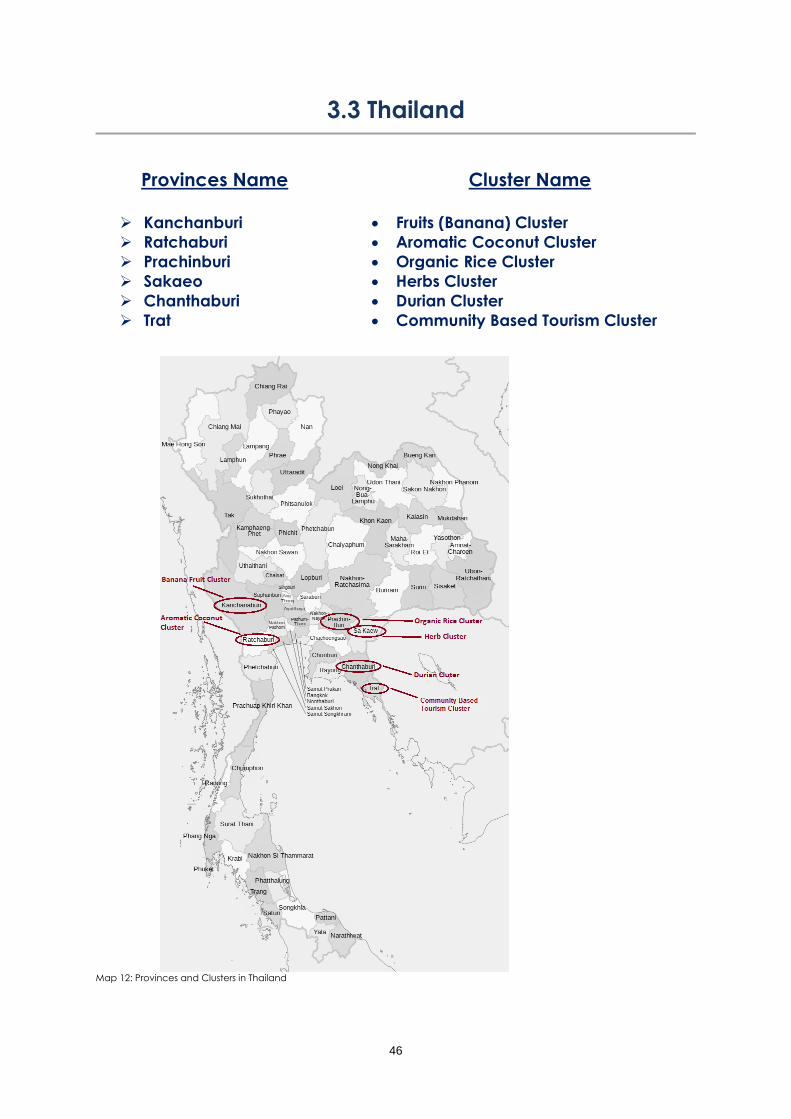
46
3.3 Thailand
Provinces Name Cluster Name
➢ Kanchanburi • Fruits (Banana) Cluster
➢ Ratchaburi • Aromatic Coconut Cluster
➢ Prachinburi • Organic Rice Cluster
➢ Sakaeo • Herbs Cluster
➢ Chanthaburi • Durian Cluster
➢ Trat • Community Based Tourism Cluster
Map 12: Provinces and Clusters in Thailand

47
3.3.1 Kanchanaburi Fruits Cluster
(Prototype - Banana Processing)
3.3.1.1 Provincial Overview Kanchanaburi province covers an area of
approximately 19,473 square kilometers and is the
3rd largest province in Thailand. The province
shares a border with Myanmar and enjoys around
10% of annual economic growth. The population of
the province is 848,198.
Kanchanaburi fruits processing cluster (banana
processing) is a large, diversified, and
differentiated cluster. There are considerable
differences between large enterprises and SMEs,
who are engaged in fruits processing.
The CCI / FTI offices estimate that amongst their
members, who are registered community
development enterprises, fruit processing cluster
has an aggregated annual revenue of THB 5-10
billion. These community enterprises employ more
than 500 workers and play a great social and
economic role in the province.
Different areas of the province is growing as mixed
cultivation farms with organic vegetables and
plants of various kinds, processed agricultural
products such as corn milk, vegetable juice,
dehydrated banana or jack-fruit, vegetable juice-
coated Krayasat dessert and others.
Map 13: Kanchanaburi, Thailand
Map Source: Google
3.3.1.2 Cluster Introduction and SWOT Analysis
Recognizing the diverse nature of Kanchanabury fruit clusters with many fruits and species of the same
fruits, banana processing was chosen as a prototype to develop a value chain and initiate value-chain
centred intervention through the project. The sectors experts from private sector and CCI, FTI members,
Department of Industries, Department of Commerce, and other participants at the FGDs during the
study supported the idea of choosing banana processing cluster. The identified strengths, weaknesses,
opportunities and threats are listed below:
Table 27: Kanchanaburi Fruits Cluster (Banana) SWOT Analysis
STRENTHS
• Good irrigation system for banana
plantation;
• Kanchanaburi is located near Myanmar
and also not far from Bangkok;
• Most of the area in Kanchanaburi are flat,
suitable for agriculture
WEAKNESSES
• Weak adaptation to modern technology
• Weak connection to markets
• Unregistered enterprises not supported by
CCI / FTI
• Weak association skills / BMO activities
• Lack of advocacy of common problems
OPPORUNITIES
• National and regional Government
schemes to support banana processing;
THREATS
• Competition from other GMS countries
• Drought and dry climate is lowering
production and pushing up prices
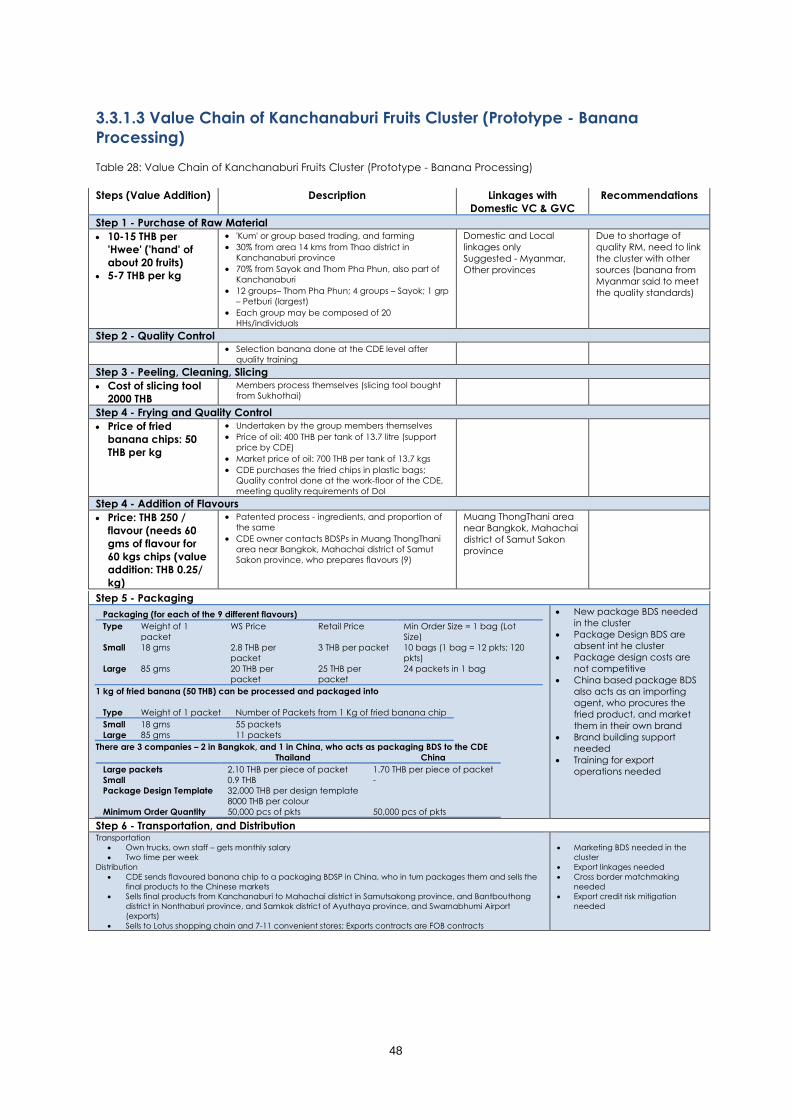
48
3.3.1.3 Value Chain of Kanchanaburi Fruits Cluster (Prototype - Banana
Processing) Table 28: Value Chain of Kanchanaburi Fruits Cluster (Prototype - Banana Processing)
Steps (Value Addition) Description Linkages with
Domestic VC & GVC
Recommendations
Step 1 - Purchase of Raw Material
• 10-15 THB per
'Hwee' ('hand' of
about 20 fruits)
• 5-7 THB per kg
• 'Kum' or group based trading, and farming
• 30% from area 14 kms from Thao district in
Kanchanaburi province
• 70% from Sayok and Thom Pha Phun, also part of
Kanchanaburi
• 12 groups– Thom Pha Phun; 4 groups – Sayok; 1 grp
– Petburi (largest)
• Each group may be composed of 20
HHs/individuals
Domestic and Local
linkages only
Suggested - Myanmar,
Other provinces
Due to shortage of
quality RM, need to link
the cluster with other
sources (banana from
Myanmar said to meet
the quality standards)
Step 2 - Quality Control
• Selection banana done at the CDE level after
quality training
Step 3 - Peeling, Cleaning, Slicing
• Cost of slicing tool
2000 THB
• Members process themselves (slicing tool bought
from Sukhothai)
Step 4 - Frying and Quality Control
• Price of fried
banana chips: 50
THB per kg
• Undertaken by the group members themselves
• Price of oil: 400 THB per tank of 13.7 litre (support
price by CDE)
• Market price of oil: 700 THB per tank of 13.7 kgs
• CDE purchases the fried chips in plastic bags;
Quality control done at the work-floor of the CDE,
meeting quality requirements of DoI
Step 4 - Addition of Flavours
• Price: THB 250 /
flavour (needs 60
gms of flavour for
60 kgs chips (value
addition: THB 0.25/
kg)
• Patented process - ingredients, and proportion of
the same
• CDE owner contacts BDSPs in Muang ThongThani
area near Bangkok, Mahachai district of Samut
Sakon province, who prepares flavours (9)
Muang ThongThani area
near Bangkok, Mahachai
district of Samut Sakon
province
Step 5 - Packaging
Packaging (for each of the 9 different flavours)
Type Weight of 1
packet
WS Price Retail Price Min Order Size = 1 bag (Lot
Size)
Small 18 gms 2.8 THB per
packet
3 THB per packet 10 bags (1 bag = 12 pkts; 120
pkts)
Large 85 gms 20 THB per
packet
25 THB per
packet
24 packets in 1 bag
1 kg of fried banana (50 THB) can be processed and packaged into
Type Weight of 1 packet Number of Packets from 1 Kg of fried banana chip
Small 18 gms 55 packets
Large 85 gms 11 packets
There are 3 companies – 2 in Bangkok, and 1 in China, who acts as packaging BDS to the CDE
Thailand China
Large packets 2,10 THB per piece of packet 1.70 THB per piece of packet
Small 0.9 THB -
Package Design Template 32,000 THB per design template
8000 THB per colour
Minimum Order Quantity 50,000 pcs of pkts 50,000 pcs of pkts
• New package BDS needed
in the cluster
• Package Design BDS are
absent int he cluster
• Package design costs are
not competitive
• China based package BDS
also acts as an importing
agent, who procures the
fried product, and market
them in their own brand
• Brand building support
needed
• Training for export
operations needed
Step 6 - Transportation, and Distribution Transportation
• Own trucks, own staff – gets monthly salary
• Two time per week
Distribution
• CDE sends flavoured banana chip to a packaging BDSP in China, who in turn packages them and sells the
final products to the Chinese markets
• Sells final products from Kanchanaburi to Mahachai district in Samutsakong province, and Bantbouthong
district in Nonthaburi province, and Samkok district of Ayuthaya province, and Swarnabhumi Airport
(exports)
• Sells to Lotus shopping chain and 7-11 convenient stores; Exports contracts are FOB contracts
• Marketing BDS needed in the
cluster
• Export linkages needed
• Cross border matchmaking
needed
• Export credit risk mitigation
needed

49
3.3.1.4 Value Chain Map of Kanchanaburi Fruit Processing Cluster
Public BDS
Government, Ministries, Departments, Others
Bu
sin
ess
Me
mb
ers
hip
Org
an
isa
tio
ns
(BM
Os)
Ass
oc
iatio
ns,
CC
, FTI
, e
tc
Ma
rke
ts Exte
rna
l BD
S
Pro
ce
ssin
g
Em
be
dd
ed
Se
rvic
es - B
DS
Ra
w M
ate
ria
l Su
pp
liers
, La
bo
ur
Figure 13: Value Chain Map of Kanchanaburi Fruit Processing Cluster
Notes:
• Dotted boxes mean either non-existent or negligible presence or poor co-ordination in the VC
• Dotted lines mean very low linkages or non-existent linkages
• Strong lines mean strong linkages
Kanchanaburi
CD
E,
Coo
pera
tives
Packaging
Fresh, Raw Fruit
Peeling, , Cutting, Washing
Collection
Export Agents
Domestic Markets
Overseas Markets
Need for Technology BDS, Knowledge BDS, Marketing BDS
CC
FTI
Other BMOs
Ministry of Interior CDD Ministry of Finance Provincial Govt.
Domestic Trading Agents
Wastes
Grading
Bio-fuel
Logistics BDS
Processing
Juices, Chips, Jelly, Jams, Ketchup, etc E
quip
ments
,
Packagin
g, D
esig
n,
Oth
ers
Other Provinces
Fruits
Imports
Cluster

50
3.3.1.5 Constraints of the Cluster and the Value Chain
From the value chain analysis of the product and SWOT analysis of the cluster, a number of bottlenecks
were identified.
i. Raw material supply i.e. fresh banana vary over time and lack stable quality. For producing
dried banana and producing banana chips, particular type of banana are considered suitable
than the others. The quality of supplied banana also determine the quality of the final products;
ii. Since most banana processing establishments are managed by the community enterprises,
coordination between community enterprises and groups of households / village communities
remain crucial which determines product quality, trade partnerships and delivery on time;
iii. Lack of awareness of support ecosystem for community enterprises offered by the national and
local authorities in Thailand which were initiated to promote community enterprises and cluster
activities, e.g. banana processing;
iv. Technology used are outdated and not modern (for e.g - use of hand held wooden slicer)
which makes it difficult to scale up the production;
v. Marketing and Branding - most households & community enterprises supply processed fruits (e.g.
banana) to others who in turn package them and market the products with their own brand;
vi. Protection of intellectual property rights for processing and product innovations.
3.3.1.6 Recommended Strategies for the Cluster Value Chain
The main priority activities or strategies to strengthen the cluster involve the following:
i. To scale-up production, it remains crucial to source raw materials (right type of fresh banana)
from other provinces, Cambodia, Lao or Myanmar which will help to scale-up supplies of the
fresh banana needed for the desired final products;
ii. Suppliers and providers of modern technology may be linked to the community enterprises.
Community enterprises can largely benefit from technical collaboration and guidance;
iii. Linkages with food processing institutes will help identify the many areas to improve the hygiene
practices and to maintain the necessary nutrient quantity and quality;
iv. Many community enterprises are connected to larger processors who buy and brand the semi-
processed fruits and sell them in and outside Thailand. However, provision for further value
addition at the producers and community enterprise level may raise the income of the
producers and also lessen the tasks at the end of larger processors. A campaign of embedded
services and quality programs can be introduced to benefit these actors in the value chain;
v. BMO-SME linkages can play a great role to enhance the capacity of the community enterprises
and productivity of the producers at different level who grow the banana, cut them and finally
dry them;
vi. Product diversification can be achieved by the involvement of the national research institutions
in the province or from Thailand who will identify diverse uses of banana;
vii. Quality testing laboratory and certification program is high on demand which can claim better
price in upper-end national and international markets.

51
3.3.2 Ratchaburi Aromatic Coconut Cluster
3.3.2.1 Provincial Overview
Nam Hom coconut is the name of the
cultivated coconut in the province whose
scientific name is Cocos nucifera L. Table 29: Provincial Data of Ratchaburi
Description Number Unit
Area of province 5,196.462 Sq. Km.
Administrative Subdivision 10 Districts
Population (January 6, 2015) 867,883 People
GPP (2013)
at current market prices
13,216 Mil. THB
Average income per capita 25,742 THB /
month
Unemployment (2015) 0,7 %
Minimum labour wage 300 THB/day
Source : Provincial Commercial Operation Center of
Ratchaburi at http://www.aecthaibiz.com/pcocaecreport/
fm/factsheet.aspx - monthly report as of May 2016)
Map Source: Google
Table 30: Production Data of Aromatic Coconuts
Map 14: Ratchaburi, Thailand
Production figures
Planted area (rai) Harvested area (rai) Production (tons.) Yield per rai (kgs.)
2013 17096 16678 38041 2281 Coconut
29709 27354 79864 2920 Young coconut
2014 17863 16796 31868 1897 Coconut
32092 28922 77089 2665 Young coconut
Source: Provincial Statistics, 2014, Tables 9.7.1, 9.7.2)
3.3.2.2 Cluster Introduction and SWOT Analysis
Ratchaburi is famous for its delicious Aromatic (Nam Hom) Coconut (Thai 'Nam Hom' means 'delicious
water' in English), which is cultivar typical around this geographical region. Ratchabury province is
home to the famous aromatic coconuts in Thailand. The value of total sales in local market is estimated
to be THB 3 billion coming from an estimated 80,000 tons of production of young coconut and further
40,000 tons of coconuts; making a total production of 120,000 tons.
Processed coconut (at local market price) is amounted to THB 1 billion for an estimated 500,000
coconut fruits that are processed in the region, with about a maximum of 200 times value addition to
the cost price of 10 THB per coconut. However, this is a conservative estimate from the discussions with
the stakeholders in the province4.
Exports value of the fresh coconuts has increased to 1.5-2 times the normal costs, due to the dry season
and fall in supplies. However, for a minimum order quantity of 9000 kgs of coconut the price per kg is
about 40-50 THB. The identified strengths, weaknesses, opportunities and threats are listed below:
Table 31: Ratchaburi Aromatic Coconut Cluster SWOT Analysis
STRENGTHS
• Unique natural and climatic conditions (soil,
tropical climate)
• Proximity to sea-ports and cold chain warehouses
• Close to Myanmar - source of migrant workers
• Traditional knowledge of farming
WEAKNESSES
• Traditional mindset in farming
• Government prioritises industry over agriculture
• Lack of coordination and cooperation between
different cluster actors
• Little support from local cooperatives for local
farmers development
OPPORTUNITIES
THREATS
4 One stakeholder adds value of about 300 times, if not more, to the cost of procuring raw coconuts from farmers.

52
• Modern technology in processing coconuts
• Ratchaburi is one of the 6 provinces promoted as
green province (organic food / art / culture);
• Ratchaburi has community markets in southern
Krabi); central (Ratchaburi) and northern (Tak) and
northeastern (Buriram) regions
• Competition from overseas markets - Malaysia,
Indonesia, Singapore
• Very dry climate and seasonal fluctuations
causing drop in production and pushing up
prices
3.3.2.3 Value Chain Analysis of Ratchaburi Aromatic (Nam Hom) Coconut
Cluster
The global demand of coconut comes in raw form, coconut water, pulp, and processed coconut.
Some producers are members of Ratchaburi Organics Co. Ltd or (ROCL.).
Table 32: Value Chain Analysis of Ratchaburi Aromatic (Nam Hom) Coconut Cluster
Steps VA Actors Involved Linkages with Domestic VC & GVC
Recommendations
Step 1 - Farm - Planting, Harvesting
• 138 farmers members of ROCL
(20 for coconut)
• Productivity: 8000 coconut per
rai per year
• 15 harvests per year
• 4 farming areas supply fruit to
DFCL
THB 8-30 /
coconut
(seasonal
variation)
Operating cost is
10-20% of sales
price
Local farmers
Nam Hom
coconut is being
cultivated too in
Malaysia
Domestic farmers
Malaysia, Indonesia farmers have
started to grow this cultivar too
Govt support,
Research in farming,
Technology
upgrading
Step 2 - Sorting, Peeling, Cutting, Washing,
• Coconuts are cleaned, of the
external fibre by hand using
knives
• Discarded parts are sold as
bio-fuel
• White shaped coconut fruits
are cleaned
Min wage rate
of 300 THB per
day
Burmese,
Cambodian and
local Thai workers
Women workers
from farms
Domestic labour markets
Cambodian and Myanmar Labour
markets
Knives are bought form
departmental stores (Germany
made knives)
Labour issues
Border point
problems for workers
from Myanmar and
Cambodia
Step 3a - Packaging of Fresh/ Raw Coconut Fruit
• Coconut fruits are wrapped in
plastic papers
• Packed into boxes, cartons,
loaded in containers
Min wage rate
of 300 THB per
day
Women workers
from farms
Domestic markets only
Quality check
required
Step 3b - Cold Chain Transport to Markets
• Cold chain logistics
• From farm, CDE to markets
Logistics agents
Trading agents
Domestic departmental stores;
Overseas Markets - ASEAN, India,
Europe, China, Japan
Logistics & export
training,
Management
training
Step 4 - Processing - Separation and Boiling of Coconut Milk and Coconut Meat (pulp) and Boiling
• Boil C/Milk for 30 mins at 100
degree Celsius
• Boil C/Meat for 20 mins at 100
degree Celsius
1150 THB per
tank of 48 kgs
LPG
LPG supplier (15
kg/day)
Labour - local,
Myanmar
Knife, Equipment
BDS
Equipments from Germany, China,
Japan
LPG from local agents
Technology for
boiling, past-
eurization needed;
Prese-rvation
training needed
Step 6 - Processing - Mixing with Jelly
• Mixing jelly with coconut milk
• Adding of coconut flesh
• Mixing in boiling coconut milk
& flesh
1 ton Jelly powder needed per
month
1000 THB per kg
of Jelly powder;
4000 THB per
stainless steel
mixing tank
Local traders
Equipment from Germany, China,
Japan
Jelly powder from one BDS in
Samut Prakan (about 1 km far)
Step 7 - Processing - Adding Flavours, and Other Fruit Pulps
• The mixture naturally cooled in
room temp.
• Addition of other fruit flavours
and fruit meat
1-2.9 THB per
cup (Rambutan,
Longan)
Local traders
Local workers
Boiling tanks - stainless steel,
bought from departmental stores
Technology
upgradation
needed
Step 8 - Packaging
• Label design done by owner of
DFCL, another social venture;
600,000 cups bought
• Packaging machines (semi-
automatic) about 12 in
number; Labels attached in-
house;
In-house design;
BDS in Bangkok;
Cups bought from
Nonthaburi (Y-Net
Systems); Local
traders
Local trader, Bangkok, Nonthaburi
Copyright on label
Packaging
technology needed
Preservation of
quality training
needed
Step 9 - Finished Product - Cold Chain Transport to Markets
• Price of 1 cup of Coconut Jelly
is 30 THB
• Different flavours
• Different product - Raspberry
jelly
Logistics BDS
Export BDS
Domestic traders
Sold to Bangkok, export agents Marketing BDS
needed and market
linkages needed;
Collaboration with
research institutions,
universities;

53
3.3.2.4 Value Chain Map of Ratchaburi Aromatic Coconut Cluster
Public BDS
Government, Ministries, Departments, Others
Bu
sin
ess
Me
mb
ers
hip
Org
an
isa
tio
ns
(BM
Os)
Ass
oc
iatio
ns,
CC
, FTI
, e
tc
Ma
rke
ts Exte
rna
l BD
S
Pro
ce
ssin
g
Em
be
dd
ed
Se
rvic
es - B
DS
Ra
w M
ate
ria
l Su
pp
liers
, La
bo
ur
Figure 14: Value Chain Map of Ratchaburi Aromatic Coconut Cluster
Notes:
• Dotted boxes mean either non-existent or negligible presence or poor co-ordination in the VC
• Dotted lines mean very low linkages or non-existent linkages
• Strong lines mean strong linkages
Ratchaburi
CD
E (
fresh c
oconut)
Packaging
Coconut Fruit
Peeling, , Cutting, Washing
Collection
Export Agents
Domestic Markets
Overseas Markets
Need for Technology BDS, Knowledge BDS, Marketing BDS
CC
FTI
Other BMOs
Ministry of Interior CDD Ministry of Finance Provincial Govt.
Domestic Trading Agents
Wastes
Grading
Bio-fuel
Logistics BDS
Processing
Coconut Jelly, Coconut Chips, etc
Equip
ments
,
Packagin
g, D
esig
n,
Banks, O
thers
Other Provinces
Coconut Fruits
Imports
Cluster

54
3.3.2.5 Constraints of the Cluster and the Value Chain
From the value chain analysis of the product and SWOT analysis of the cluster, a number of bottlenecks
were identified.
i. Lack of exposure to business management training makes it difficult for the SMEs to calculate
theirs costs and the prices they should charge for carrying out the business. The entrepreneurs
here also lack skill in people management, dealing with suppliers and diverse service providers;
ii. Lack of understanding of best practices make it difficult to upgrade the process and the quality
of the products;
iii. Marketing issues - lack of marketing BDS has made this product, a generic one and consumers
are largely unaware of the source of the products and the best practices it followed;
iv. Technology - lack of innovative technology for preservation, processing, and packaging
remains an issue. Lack of preservation makes it harder to store and sell later like other
commercialized bottled drinks
v. Preparation of aromatic coconuts requires a specialized skill that is mostly available among the
people living around the coconut cluster. To scale up the operation, workers with right kind of
skill in preparing the coconut and packing it are necessary.
3.3.2.6 Recommended Strategies for the Cluster Value Chain
The main priority activities or strategies to strengthen the cluster involve the following:
i. Training on the preparation to participate in the event (e.g., trade fair) is necessary to connect
with buyers interested in aromatic coconuts as the product has already attracted enough
attention mostly from the traveling expatriates;
ii. Soft skills training - English language, business meetings, negotiations is also necessary among
the selected entrepreneurs to spread the message of aromatic coconuts;
iii. Creating linkages with marketing services providers and also technical services providers in
choosing appropriate packaging for the right consumer niche would be necessary. Introduction
of e-commerce to this products will also help establishing access to regional and overseas
market;
iv. Quality BDS needed in the cluster who will train the community enterprises and the producers on
complying with best practices at every step of preparation and maintaining hygiene necessary
for dealing with food products;
v. Capacity building of common facility centres to deal with preparing large quantity of coconuts
and to load them into larger packaging is necessary.
3.3.3 Prachinburi Organic Rice Cluster
3.3.3.1 Provincial Overview Prachin Buri has plain areas and highlands. In the
south and east, there are plains and forests. Low-
lying plains suitable for agriculture, particularly rice
are in the west of the province. Prachin Buri has an
alternative climate of both dry and damp. Tropical
rain in the southeast monsoon season causes
damp and rain throughout the season – supportive
to rice cultivation.
About the Province
Area of province : 4,762.36 sq. km.
Administrative Subdivision : 7 Districts
Population : 482,195 (as of January 2016)
Map 15: Prachinburi, Thailand
Source: http://www.thailandmaps.net/prachinburi/
prachinburi.html
Map Source: Google

55
GPP (2014) : THB 217,106 million (at current market prices)
Average income per capita : THB 25,742 /month
Minimum labour wage : THB 300 /day
Economy Sector Value Units
GPP (2014) at current market prices 217,106 Mil. THB
Agriculture, hunting and forestry 6,533 Mil. THB
Industrial production 897 Mil. THB
Wholesale, retail trade, repair of motor vehicles, motorcycles and personal and
household goods
164,405 Mil. THB
Hotels and restaurants 20,337 Mil. THB
Construction 742 Mil. THB
Others 2,340 Mil. THB
Average income per capita (16,725 THB / month) 317,520 THB
Unemployment (2015) 1.45 %
Minimum labour wage 300 THB/day
Source: http://www.aecthaibiz.com/pcocaecreport/fm/factsheet.aspx : April 2016
3.3.3.2 Cluster Introduction and SWOT Analysis
The Prachinburi province is rich with several species of indigenous rice which is tolerant of problematic
soil condition such as acidic soil, resistance to blast fungus and bacterial blight, and so on. There is a
growing niche for organic rice in the international market and some parts of Thailand are promoting
organic rice through community enterprises and shared best practices. Some community enterprises
are certified with The Organic Thailand logo on a package that represents the certification of farming,
processing and packing of organic rice.
Table 33: Prachinburi Organic Rice Cluster SWOT Analysis
STRENGTHS
• Unique natural and climatic conditions (soil,
tropical climate)
• Stable high market demand internationally
due to nutrient contents and health benefits
• Traditional knowledge of farming
WEAKNESSES
• Traditional mindset in farming
• Lack of coordination and cooperation
between different cluster actors
• Capacity constraint in forming cooperatives
and collaborating around best practices
OPPORTUNITIES
• Ecological certification and branding (e.g.
The Organic Thailand)
• Also known as ‘hub of innovative and
organic agriculture’ qualify to receive
benefits from national and provincial
governments
THREATS
• Very dry climate and seasonal fluctuations
causing drop in production and pushing up
prices

56
3.3.3.3 Value Chain of Prachinburi Organic Rice Cluster
Respondent: Nakham Organic Rice Community Enterprise: Contact Person: Mr. Sivapoth Kuvichitsuwan
Table 34: Value Chain of Prachinburi Organic Rice Cluster
Steps Description Issues
Farming • Community Enterprise based organic rice
production and processing
• There are 10-15 different groups in Prachinburi
province; Other organic rice farmers are based
in Kabinburi province
• Average size of farm-holding : 600 rai (1 rai = 0.16
hectares)
• There are 2 (two) seasons of rice - single
(1 time / year): 530 rai; (ii) double (2
times / year): 70 rai
• Harvesting: 220 tons / year / 600 rai of land
• Organic Fertiliser - chicken and buffalo dung;
chemical fertilisers are not applied
• Price of organic fertiliser: 1000 THB
• Labour costs: 1200 THB / rai of land
• Modern farming techniques
• Linkages with agriculture
and research institutes
• Training of labours
Processing • Machines:
• Machine: vacuum (70,000 kg / per day);
• Rice mill (horsepower): 600 – 800kg / day;
• Cost of rice mill: 250, 000 THB. There are 3 labors
(30,000THB / per labor / month);
• Common Facility Centre -
feasibility study
• Training of modern
technology
• Technology BDS needed
Quality
Certification
• Certificate from Maejo University (MJU) in Chang
Mai more than 3 years ago.
• Certificate costs 70,000 THB which lasts for 3 years
• Quality certification linkages
with Department of
Industries, OTOP
• Process quality assurances
• Quality certification training
Products • Green Rice - Price 200 THB/kg
• Ordinary Rice - Price 15 THB/kg
• Riceberry Rice - Price 350 THB / pack of 1 kg
• Sinlek Rice
• Rice Bran Tea - 600 THB / kg; 1 kg is packed in 4
packs which can make 120 cups of rice bran
tea; Each cup of tea costs 10 THB
• Quality assurance of
products
• Innovative packaging
• Nutrition assurances
• Costing study and control
for product pricing
Distribution • Display of products at trade event e.g. IMPACT
exhibition center in Muang Thon Tani
• Majority of their products are sold at government
shop / family shop
• Participates in trade fair at Vietnam
• Has an agent in Singapore
• CE sells its organic rice products at Abhaibhuber
Hospital (500 kg / month); Kabinburi Hospital (1
ton / month); and Nari hospital (1 ton / month)
• Logistics
• Marketing BDS needed
• Government support for
marketing of products
• Export related regulations -
training and support

57
3.3.3.4 Value Chain Map of Prachinburi Organic Rice Cluster
Public BDS
Government, Ministries, Departments, Others
Bu
sin
ess
Me
mb
ers
hip
Org
an
isa
tio
ns
(BM
Os)
Ass
oc
iatio
ns,
CC
, FTI
, e
tc
Ma
rke
ts Exte
rna
l BD
S
Pro
ce
ssin
g
Em
be
dd
ed
Se
rvic
es - B
DS
Ra
w M
ate
ria
l Su
pp
liers
, La
bo
ur
Figure 15: Value Chain Map of Prachinburi Organic Rice Cluster
Notes:
• Dotted boxes mean either non-existent or negligible presence or poor co-ordination in the VC
• Dotted lines mean very low linkages or non-existent linkages
• Strong lines mean strong linkages
Local Labour
Local Farms
(planted area 192,591
rai)
Farming
Harvesting
Packing
Processing
Export Agents
Vietnam
Other countries
Domestic Markets
CC
FTI
Other BMOs
Knowledge
BDS
Ministry of Interior CDD Ministry of Finance Provincial Govt.
Organic Rice
Rice Bran Tea
Technology
BDS
Households
58
3.3.3.5 Constraints of the Cluster and the Value Chain
From the value chain analysis of the product and SWOT analysis of the cluster, a number of bottlenecks
were identified.
i. Product innovation cannot be made due to lack of technology and the constraint in scaling
up of the organic produce;
ii. Rice market is dominated by rice cartel and occasionally, community enterprises cannot
survive in this ecosystem;
iii. Lack of marketing support for different products both final organic produce i.e. rice and also
other products e.g. rice bran tea, rice-bran composed fuel and other uses of rice bran and
straw;
iv. Most community enterprises lack the skills and support to be in touch with the government and
BMO linkages with the cluster-producers;
v. Farming techniques are traditional among the cluster-members.
3.3.3.6 Recommended Strategies for the Cluster Value Chain
The main priority activities or strategies to strengthen the cluster involve the following:
i. Technology BDS linkages, particularly in irrigation and using manure to save cost and increase
effectiveness in using agri-inputs;
ii. Quality testing services to qualify a particular produce or product for an ‘organic label’ and
the necessary support for ToT and further farmers’ training in complying with organic best
practices;
iii. Packaging technology needed to effectively take advantage of organic label and penetrate
in health-conscious upper-end market;
iv. Make quality organic seeds available on time to the cluster producers and also to train the
producers effectively collect and store organic seeds through their common facilities;
v. BMO capacity building through training of the leadership so the cluster members and cluster
leadership can be made aware of being involved with such organization for common good of
the producers and the community enterprises;
vi. Legislative, Government and Policy advocacy for helping small enterprises or community
enterprises and farmers survive market inefficiencies.
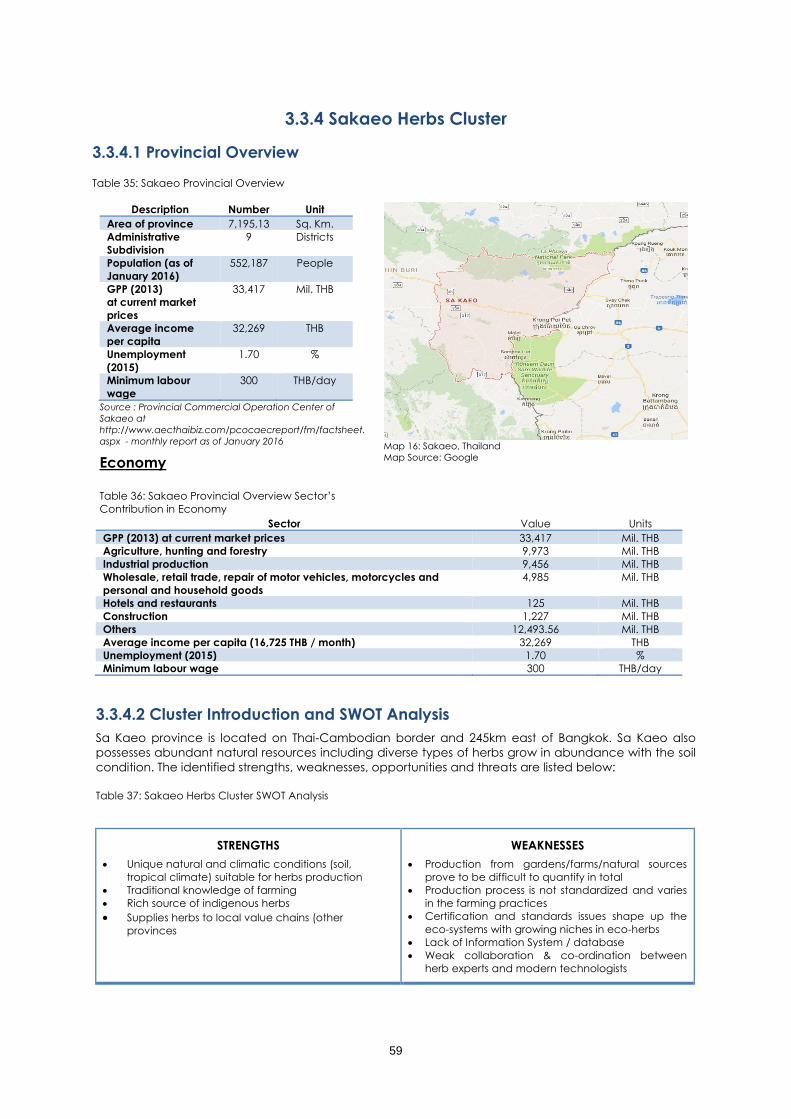
59
3.3.4 Sakaeo Herbs Cluster
3.3.4.1 Provincial Overview Table 35: Sakaeo Provincial Overview
Description Number Unit
Area of province 7,195,13 Sq. Km.
Administrative
Subdivision
9 Districts
Population (as of
January 2016)
552,187 People
GPP (2013)
at current market
prices
33,417 Mil. THB
Average income
per capita
32,269 THB
Unemployment
(2015)
1.70 %
Minimum labour
wage
300 THB/day
Source : Provincial Commercial Operation Center of
Sakaeo at
http://www.aecthaibiz.com/pcocaecreport/fm/factsheet.
aspx - monthly report as of January 2016
Economy
Table 36: Sakaeo Provincial Overview Sector’s
Contribution in Economy
Map 16: Sakaeo, Thailand
Map Source: Google
Sector Value Units
GPP (2013) at current market prices 33,417 Mil. THB
Agriculture, hunting and forestry 9,973 Mil. THB
Industrial production 9,456 Mil. THB
Wholesale, retail trade, repair of motor vehicles, motorcycles and
personal and household goods
4,985 Mil. THB
Hotels and restaurants 125 Mil. THB
Construction 1,227 Mil. THB
Others 12,493.56 Mil. THB
Average income per capita (16,725 THB / month) 32,269 THB
Unemployment (2015) 1.70 %
Minimum labour wage 300 THB/day
3.3.4.2 Cluster Introduction and SWOT Analysis
Sa Kaeo province is located on Thai-Cambodian border and 245km east of Bangkok. Sa Kaeo also
possesses abundant natural resources including diverse types of herbs grow in abundance with the soil
condition. The identified strengths, weaknesses, opportunities and threats are listed below:
Table 37: Sakaeo Herbs Cluster SWOT Analysis
STRENGTHS
• Unique natural and climatic conditions (soil,
tropical climate) suitable for herbs production
• Traditional knowledge of farming
• Rich source of indigenous herbs
• Supplies herbs to local value chains (other
provinces
WEAKNESSES
• Production from gardens/farms/natural sources
prove to be difficult to quantify in total
• Production process is not standardized and varies
in the farming practices
• Certification and standards issues shape up the
eco-systems with growing niches in eco-herbs
• Lack of Information System / database
• Weak collaboration & co-ordination between
herb experts and modern technologists

60
OPPORTUNITIES
• Growing interest in herbal/traditional medicine
• Traditional Thai medicine based hospitals (e.g.
Abhaibhubejr) are developing
• Wang Nam Yen hospital has R&D on herbal soap
• Burappa University, Community Enterprise College –
Vocational training about herbs
THREATS
• Very dry climate and seasonal fluctuations
causing drop in production and pushing up prices
• Branding of herbs sourced from Sa Kaeo by other
provinces and markets. Sa Kaeo is losing their
identity
3.3.4.3 Value Chain of Sakaeo Herbs Cluster
The following herbs cluster VC is based on the responses of 'Aroma Scent Community Enterprise Sakaeo'
(brand name 'Thammadi'), which is one of the groups based community development enterprises
based in Sakaeo and related to herbs. There are 68 similar CDEs (groups based enterprises) in Sakaeo
each involved in herbs collection, processing, and trading.
Table 38: Value Chain of Sakaeo Herbs Cluster
Steps Actors Involved Description Linkages with
Domestic VC &
GVC Values
Step 1 - Herbs Collection
From districts
• Wang Som
Boon
• Wang Nam
Yen
• Wat Thana
Nakhon
• Muang
• 30 Local HHs
(Households)
• Each HH is a member
of the CDE
• Each HH-member has
about 3-5 persons
• 7 (seven) staffs in the
CDE
• Types of herbs = 108; e.g. – Butterfly Pea,
Zingiber ottensii Valeton – Pai Dam / Pai
Pooksek, Aloe Vera, etc)
• Total collection about 1 tons of herbs per
month
• Cost of collection = 100,000 THB per month
• Main herb Zingiber: 20-50 THB per kg
Local, Domestic
sources of herbs
.
Step 2 - Grading, Classifying
• CDE staff
• CDE members
• Different herbs are graded according to types
and quality, use
• Finally they are classified as regards the process
Local
Step 3 – Processing
• CDE staff
• CDE supervisor
• Use directly as a poultice – 20 varieties
• Powdering, Drying
• Mixing with salt
• Extraction of liquid
• Vaporisation, Sublimation, etc.
Local
Step 4 – Packaging
• CDE staff
• CDE supervisor
• Packaging done by
CDE staff
• Box, bottles, plastic cups, etc purchased from
Bangkok
• Cloths – purchased from Sakaeo
• 30 different types of final products
• 100-500 pieces per month
• Cost about 30,000 – 50,000 THB per month
Traders from
Bangkok
Step 5 - Marketing / Selling
• CDE staff
• CDE owner, supervisor
• Trading agents
• Export agents
• Customers
• OTOP shop in Kanchanaburi,
• Spa shop, souvenir shops
• Customer order by phones, Existing customers
• Agents, Exhibition, Trade Fair participation
• Avg. sales 50,000 – 80,000 THB per month
Direct Exports to
Italy (7 years
back).
Now traders,
export agents
buy the herbs,
sell them under
their label.
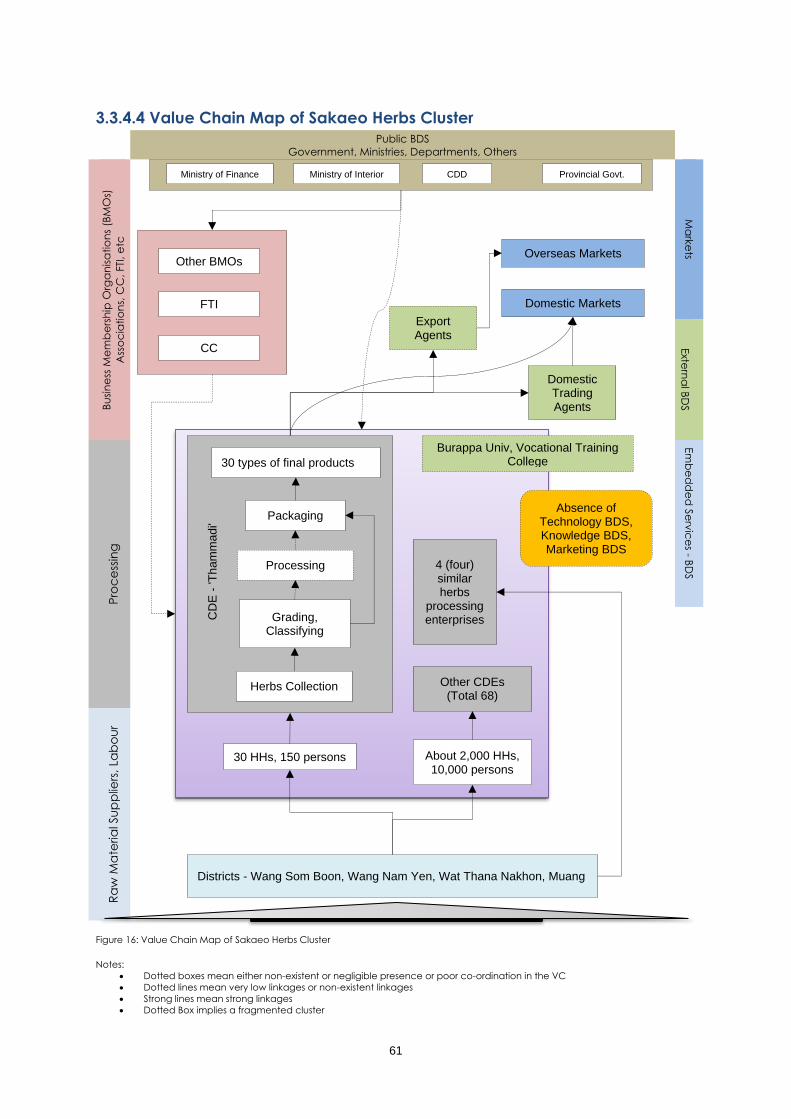
61
3.3.4.4 Value Chain Map of Sakaeo Herbs Cluster
Public BDS
Government, Ministries, Departments, Others
Bu
sin
ess
Me
mb
ers
hip
Org
an
isa
tio
ns
(BM
Os)
Ass
oc
iatio
ns,
CC
, FTI
, e
tc
Ma
rke
ts Exte
rna
l BD
S
Pro
ce
ssin
g
Em
be
dd
ed
Se
rvic
es - B
DS
Ra
w M
ate
ria
l Su
pp
liers
, La
bo
ur
Figure 16: Value Chain Map of Sakaeo Herbs Cluster
Notes:
• Dotted boxes mean either non-existent or negligible presence or poor co-ordination in the VC
• Dotted lines mean very low linkages or non-existent linkages
• Strong lines mean strong linkages
• Dotted Box implies a fragmented cluster
30 HHs, 150 persons
Other CDEs (Total 68)
About 2,000 HHs, 10,000 persons
Districts - Wang Som Boon, Wang Nam Yen, Wat Thana Nakhon, Muang
CD
E -
'T
ham
madi'
Packaging
30 types of final products
Processing
Grading, Classifying
Herbs Collection
Export Agents
Domestic Markets
Overseas Markets
Absence of Technology BDS, Knowledge BDS, Marketing BDS
4 (four) similar herbs
processing enterprises
CC
FTI
Other BMOs
Ministry of Interior CDD Ministry of Finance Provincial Govt.
Domestic Trading Agents
Burappa Univ, Vocational Training College

62
3.3.4.5 Constraints of the Cluster and the Value Chain
From the value chain analysis of the product and SWOT analysis of the cluster, a number of bottlenecks
were identified.
i. Being a comparatively new province – Sa Keo lacks government support and lack access to
BDS and lack awareness about BMOs;
ii. Underdeveloped business ecosystem - lack of cooperation between SMEs and other actors,
inadequate number of knowledge based OTOPs, comparatively less supportive government
schemes and new BMOs lacking good numbers of registration;
iii. Agrarian economy - young generation farmers tend to join other profession often choosing the
lives of urbanites;
iv. Farmers lack knowledge, information about good harvesting practice and promotional
schemes available to them;
v. Institutional deficiencies lead to information bottlenecks which deters the support available to
the direct beneficiaries.
3.3.4.6 Recommended Strategies for the Cluster Value Chain
The main priority activities or strategies to strengthen the cluster involve the following:
i. Integration of VCs of different agricultural and herbal produce to achieve economies of scale
of packaging and transportation and also achieve efficiency at the growers’ level, e.g. lemon
and honey;
ii. CFC capacity building is necessary for processing & manufacturing of herbs;
iii. Product diversification is necessary to grow several herbs together in the same field and also
together with different horticulture products;
iv. Government and policy advocacy is needed to bring in more small entrepreneurs having a
commitment to herbs production and passion into promotion of herbal products;
v. Young entrepreneurship development remains a key to the develop of this herb sector as
sometimes they are more connected to international market getting in touch directly the
government agencies, established enterprises, weaknesses of the value chains and scope for
contributing into the value chains.

63
3.3.5 Chanthaburi Durian Production & Processing Cluster
3.3.5.1 Provincial Overview
Chanthaburi, is an eastern province of Thailand
sharing the border of Battambang, and Pailin
provinces of Cambodia. Neighbouring Thai
provinces are Trat in the east and Rayong,
Chonburi, Chachoengsao, and Sa Kaeo to the
west and north. The Gulf of Thailand is on the west.
Table 39: Chanthaburi Provincial Overview
Description Number Unit
Area of province 6,338 Sq. Km.
Administrative Subdivision 10 Districts
Population (as of 2014) 527,350 People
GPP (2014)
at current market prices
104,204 Mil. THB
Average income per capita
(16,725 THB / month)
200,699 THB
Unemployment (2015) %
Minimum labour wage 300 THB/day
Source: http://www.aecthaibiz.com/pcocaecreport/
fm/factsheet.aspx - monthly report as of April 2016)
Map Source: Google
Plantation and Output
Map 17: Chanthaburi, Thailand
• Durian exports amounted to THB 12.4 billion in
2014, from Chanthaburi
• THB 15-20 billion market size of Durian P&P
cluster in Chanthaburi (estimated)
• Durian Production numbers
Table 40: Durian Production Data
Durian
Planted Area (rai) 192,591
Harvested Area (rai) 167,504
Production (tons) 242,686
Value (mil THB) 9,073
1 rai = 0.16 hectares
• Durian processing - there are some SMEs which
prepare durian chips or durian crackers, durian
pastes, or sell fried durian
• There are about 160 packing centres which
packs fresh durian fruits after some processes in
containers for exports.
Figure 17: Durian Exports from Chanthaburi
Source: Ministry of Commerce, collated and reported by
Officer of Commercial Affairs, Chanthaburi, pages 72 &
75
3.3.5.2 Cluster Introduction and SWOT Analysis
Durian (Scientific name: Durio zibethinus) is a tropical fruit, found in the South Eastern Asian countries like
Indonesia, Malaysia, Thailand, Myanmar, Cambodia, and also in other countries like India, etc. Of the 30
different species, about 100 are grown in Thailand. In Chanthaburi, the Durian variety is Mon Thong, which is
the best known for its thick, full-bodied creamy and mild sweet tasting. The identified strengths, weaknesses,
opportunities and threats are listed below.
Table 41: Chanthaburi Durian Production & Processing Cluster SWOT Analysis
STRENGHTS
• Suitable natural and climatic conditions
• Close to Cambodia - source of migrant workers
• Research facilities (3 universities in Chanthaburi)
• Traditional knowledge and proximity to seaport
WEAKNESSES
• Traditional mindset in farming
• Government prioritises industry over agriculture
and provides minimum support
• Lack of coordination among cluster actors
0.00
1,000.00
2,000.00
3,000.00
4,000.00
5,000.00
6,000.00
7,000.00
Hong Kong China Taiwan Indonesia Vietnam
Exp
ort
s in
mill
ion
TH
B
2011
2012
2013
2014

64
OPPORTUNITIES
• Modern technology
• Hydroponics in durian cultivation can change the
commercial landscape
• Increasing demand for durian from overseas
• Better research in durian processing across the
world,
THREATS
• Competition from other GMS / ASEAN countries
• Emerging production centres e.g. Hawaii based
Research Institute is trying to commercialise
production of durian in Hawaii
• High price of Thai service providers making Durian
less competitive compared to China
3.3.5.3 Value Chain of Chanthaburi Durian Production & Processing Cluster
Table 42: Value Chain of Chanthaburi Durian Production & Processing Cluster
Steps VA Actors Involved Linkages with
Domestic VC &
GVC
Recommendations
Step 1 - Farming / Planting
- 16-20 plants/rai
- fruiting after 5 year
- 3 person can
manage 50-100 rais
Farmers,
Department of
Agriculture,
Department of
Agricultural Extension
Fertiliser suppliers -
Local, Imported by
Bangkok agents from
Russia, China,
Scandinavia
Horticulture dept
Chambers of
commerce
Fertilisers
imported from
Russia, China,
Scandinavia
Scientific farming
techniques needed;
Expansion of watering
(irrigation)
Step 2 – Harvesting
- 6-9 months from
flowering to harvest
- 1 year after fruiting
starts
- 80-200 fruits per
plant
- production 200-300
kgs per plant
Local price:
100-120 THB/kg
Thai intermediaries of
Chinese packing
houses
Local farmers
Local exporters
Chinese packing
houses.
Harvesting is
done by Thai
intermediaries
who supply their
own labour.
Greater involvement
of Thai government.
Regulation of market.
Step 3 - Transportation & Packing
- harvest collected
by external BDS
- produce
transported by pick-
up trucks
- grading, cleaning,
fungicide soaking
- packing in
containers
Wholesale price
(Bangkok):
200 THB/kg
Chinese packing
houses operated by
Thai nominees
Containers - 80 tons
(40 feet long)
Chinese
importers /
agents.
Logistics
Chonburi
warehouses
Freight, Shipping,
Clearing agents
Shipping
companies
Insurance,
Financial BDS
Farm to Market: 9-10
days.
Logistics support
needed for local
farmers
Financial facilitation
Export credit
Risk mitigation
Regulation of markets
Step 4 – Processing
- Durian paste
- Durian crackers
- Durian chips
Local OTOPs and CDEs Local markets
OTOP B2C portals
Export agents
Better food processing
technology needed
Freeze drying
technology needed
Co-operative system
of Common
Processing Centre
needed
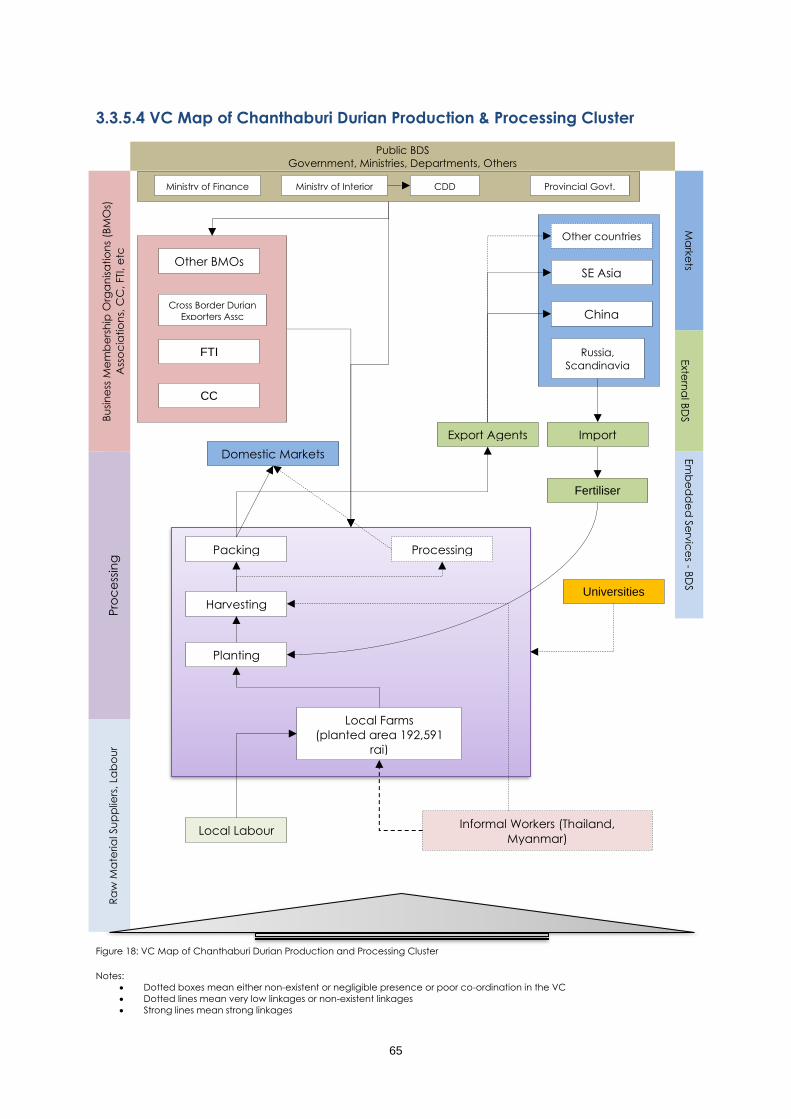
65
3.3.5.4 VC Map of Chanthaburi Durian Production & Processing Cluster
Public BDS
Government, Ministries, Departments, Others
Bu
sin
ess
Me
mb
ers
hip
Org
an
isa
tio
ns
(BM
Os)
Ass
oc
iatio
ns,
CC
, FTI
, e
tc
Ma
rke
ts Exte
rna
l BD
S
Pro
ce
ssin
g
Em
be
dd
ed
Se
rvic
es - B
DS
Ra
w M
ate
ria
l Su
pp
liers
, La
bo
ur
Figure 18: VC Map of Chanthaburi Durian Production and Processing Cluster
Notes:
• Dotted boxes mean either non-existent or negligible presence or poor co-ordination in the VC
• Dotted lines mean very low linkages or non-existent linkages
• Strong lines mean strong linkages
Local Labour Informal Workers (Thailand,
Myanmar)
Local Farms
(planted area 192,591
rai)
Planting
Harvesting
Packing Processing
Fertiliser
Import
Agents
Export Agents
Russia,
Scandinavia
China
SE Asia
Other countries
Domestic Markets
CC
FTI
Cross Border Durian
Exporters Assc
Other BMOs
Universities
Ministry of Interior CDD Ministry of Finance Provincial Govt.
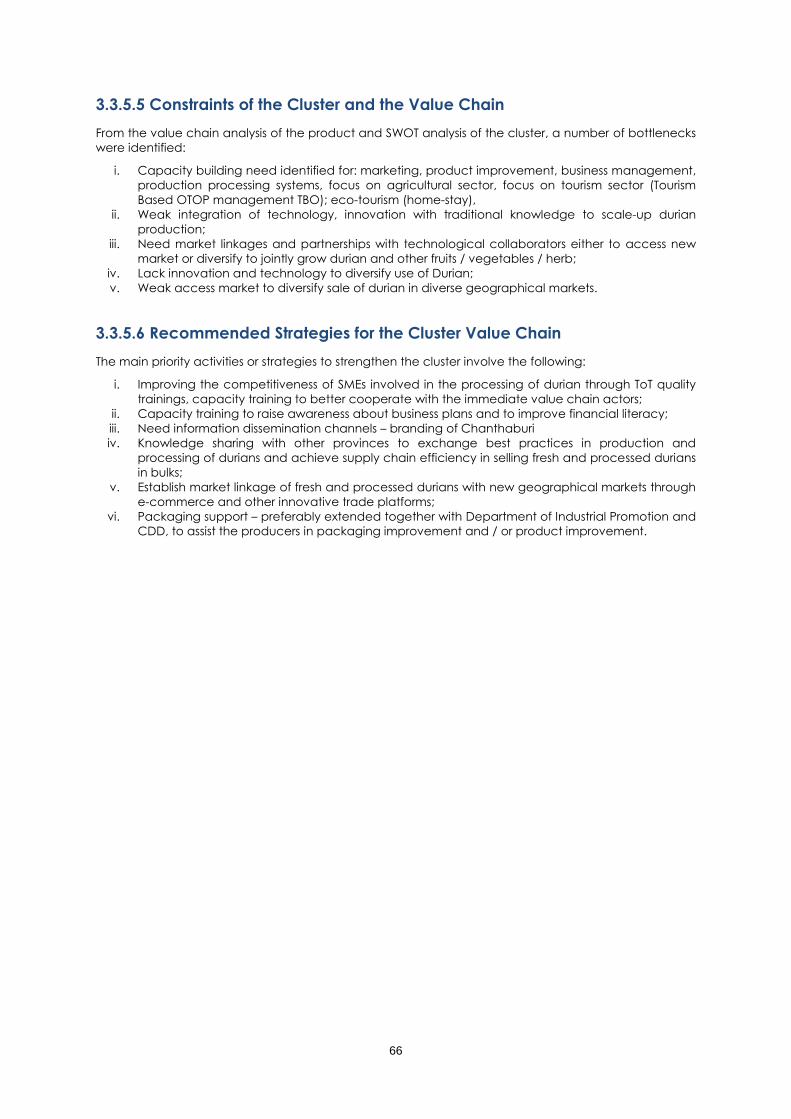
66
3.3.5.5 Constraints of the Cluster and the Value Chain
From the value chain analysis of the product and SWOT analysis of the cluster, a number of bottlenecks
were identified:
i. Capacity building need identified for: marketing, product improvement, business management,
production processing systems, focus on agricultural sector, focus on tourism sector (Tourism
Based OTOP management TBO); eco-tourism (home-stay),
ii. Weak integration of technology, innovation with traditional knowledge to scale-up durian
production;
iii. Need market linkages and partnerships with technological collaborators either to access new
market or diversify to jointly grow durian and other fruits / vegetables / herb;
iv. Lack innovation and technology to diversify use of Durian;
v. Weak access market to diversify sale of durian in diverse geographical markets.
3.3.5.6 Recommended Strategies for the Cluster Value Chain
The main priority activities or strategies to strengthen the cluster involve the following:
i. Improving the competitiveness of SMEs involved in the processing of durian through ToT quality
trainings, capacity training to better cooperate with the immediate value chain actors;
ii. Capacity training to raise awareness about business plans and to improve financial literacy;
iii. Need information dissemination channels – branding of Chanthaburi
iv. Knowledge sharing with other provinces to exchange best practices in production and
processing of durians and achieve supply chain efficiency in selling fresh and processed durians
in bulks;
v. Establish market linkage of fresh and processed durians with new geographical markets through
e-commerce and other innovative trade platforms;
vi. Packaging support – preferably extended together with Department of Industrial Promotion and
CDD, to assist the producers in packaging improvement and / or product improvement.

67
3.3.6 Trat Community Based Tourism Cluster
3.3.6.1 Provincial Overview
Trat is an eastern coastal province of Thailand, 315 kilometers from Bangkok. The town occupies the area of
2,819 sq kms. Trat has 5 districts: namely Muang, Khao Saming, Laem Ngob, Klong Yai, Bo Rai and 2 sub-
districts; Ko Kud and Ko Chang.
Table 43: Trat Provincial Overview
Description Number Unit
Area of province 2,819 Sq. Km.
Administrative Subdivision 7 Districts
Population (as of 2015) 222,855 People
GPP (2014)
at current market prices
36,999 Mil. THB
Average income per capita
(25,742 THB / month)
98,632 THB
Unemployment (2015) 0.10 %
Minimum labour wage 300 THB/day
Source: Provincial Commercial Operation Center of Trat
at http://www.aecthaibiz.com/pcocaecreport/fm/factsheet.aspx
- monthly report as of May 2016)
The province is known to be a family friendly
destination for tourists. Tourists from Australia, New
Zealand, Europe, Cambodia, China, and other
countries visit Trat as a part of their itinerary, including
visit to Angkor Wat, Cambodia. European tourists are
drawn to the natural serene atmosphere and to the
health regenerative services offered by the local
hospitality enterprises.
Size of Cluster
• In 2014, the Trat tourism sector earned c.a. THB 27
billion (Trat Provincial Statics, 2014);
Map 18: Trat, Thailand
Map Source: Google
• Estimated revenue of Trat Health and
Well-being Tourism Cluster (including
hotels, resorts, holistic medicine tourism) is
more than 50 bill THB;
• A 20 room hotel in Trat runs at 15-18%
capacity during the green season (or wet
season) and at a maximum level of 40%
capacity during the high season, can
earn THB 18 million annually;
• From 2012 to 2014, tourist turnout was very
low which is indicative of a sector
operating well below its capacity;
• The tourism related data is represented in
the figure on the right.
Hospitality sector
• There are 52 islands in the Trat
archipelago - most famous island is Koh
Chang (Elephant island);
• As of 2014, there were 9,937 rooms.
Transportation
Figure 19: Trat Tourist Trend
Source : Chapter 14 of Trat - Provincial Statistical Report 2015
• Very well connected by roads with Thailand and Cambodia
• Sustainable Tourism Trat is a designated area for sustainable tourism by the Tourism Administration5
5 Source: Gazette Volume 121, Special 105 dated 24 September 2547 i.e. 2004 BCE; http://www.dasta.or.th/en/
Thai Foreigner Thai Foreigner Thai Foreigner
Tourists (not visitors)Visitors (incld tourists and
Others)Excursionists
2014 12,64,619 3,90,630 13,25,966 3,90,630 61,347 26,025
2013 12,21,857 3,78,960 12,81,384 3,78,960 59,527 25,193
2012 11,99,712 3,47,486 12,55,511 3,47,486 55,799 22,921
-
5,00,000
10,00,000
15,00,000
20,00,000
25,00,000
30,00,000
35,00,000
40,00,000
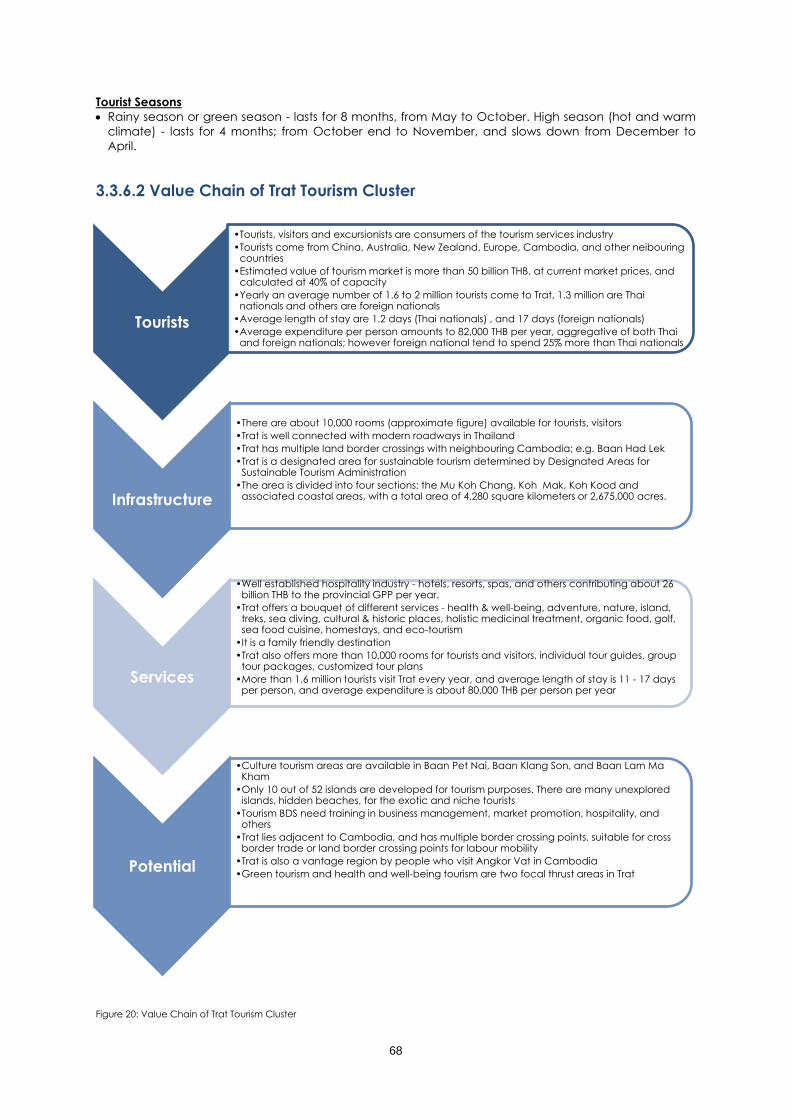
68
Tourist Seasons
• Rainy season or green season - lasts for 8 months, from May to October. High season (hot and warm
climate) - lasts for 4 months; from October end to November, and slows down from December to
April.
3.3.6.2 Value Chain of Trat Tourism Cluster
Figure 20: Value Chain of Trat Tourism Cluster
Tourists
•Tourists, visitors and excursionists are consumers of the tourism services industry
•Tourists come from China, Australia, New Zealand, Europe, Cambodia, and other neibouring countries
•Estimated value of tourism market is more than 50 billion THB, at current market prices, and calculated at 40% of capacity
•Yearly an average number of 1.6 to 2 million tourists come to Trat, 1.3 million are Thai nationals and others are foreign nationals
•Average length of stay are 1.2 days (Thai nationals) , and 17 days (foreign nationals)
•Average expenditure per person amounts to 82,000 THB per year, aggregative of both Thai and foreign nationals; however foreign national tend to spend 25% more than Thai nationals
Infrastructure
•There are about 10,000 rooms (approximate figure) available for tourists, visitors
•Trat is well connected with modern roadways in Thailand
•Trat has multiple land border crossings with neighbouring Cambodia; e.g. Baan Had Lek
•Trat is a designated area for sustainable tourism determined by Designated Areas for Sustainable Tourism Administration
•The area is divided into four sections: the Mu Koh Chang, Koh Mak, Koh Kood and associated coastal areas, with a total area of 4,280 square kilometers or 2,675,000 acres.
Services
•Well established hospitality industry - hotels, resorts, spas, and others contributing about 26 billion THB to the provincial GPP per year.
•Trat offers a bouquet of different services - health & well-being, adventure, nature, island, treks, sea diving, cultural & historic places, holistic medicinal treatment, organic food, golf, sea food cuisine, homestays, and eco-tourism
•It is a family friendly destination
•Trat also offers more than 10,000 rooms for tourists and visitors, individual tour guides, group tour packages, customized tour plans
•More than 1.6 million tourists visit Trat every year, and average length of stay is 11 - 17 days per person, and average expenditure is about 80,000 THB per person per year
Potential
•Culture tourism areas are available in Baan Pet Nai, Baan Klang Son, and Baan Lam Ma Kham
•Only 10 out of 52 islands are developed for tourism purposes. There are many unexplored islands, hidden beaches, for the exotic and niche tourists
•Tourism BDS need training in business management, market promotion, hospitality, and others
•Trat lies adjacent to Cambodia, and has multiple border crossing points, suitable for cross border trade or land border crossing points for labour mobility
•Trat is also a vantage region by people who visit Angkor Vat in Cambodia
•Green tourism and health and well-being tourism are two focal thrust areas in Trat

69
3.3.6.3 Value Chain Map of Trat Tourism Cluster
Public BDS
Government, Ministries, Departments, Others
Bu
sin
ess
Me
mb
ers
hip
Org
an
isa
tio
ns
(BM
Os)
Ass
oc
iatio
ns,
CC
, FTI
, e
tc
Exte
rna
l BD
S E
mb
ed
de
d S
erv
ice
s - BD
S
Infr
ast
ruc
ture
- R
oo
ms,
Tra
nsp
ort
, e
tc
Tou
rist
s, C
ou
ntr
ies
Figure 21: Value Chain Map of Trat Tourism Cluster
Notes:
• Dotted boxes mean either non-existent or negligible presence or poor co-ordination in the VC
• Dotted lines mean very low linkages or non-existent linkages
• Strong lines mean very strong linkages - e.g. most tourists come from China, Australia, New Zealand Europe, and
Cambodia. Tourists collect information either from online travel agencies (book their hotels, plan their itinerary, make tour
plans, etc.)
Thailand Other Countries
China Australia, NZ Europe Others
Tourists, Visitors, Excursionists
Rooms - avg 10,000 in number (Hotels, Resorts, Homestays)
Roadways
Trat Airport (operated by Bangkok Air)
Cambodia
Tour Operators
Travel Agencies (TAs)
Online TAs
Destination Mktg Agencies
Tourism Industry Federation
Hotel Association
Homestay Association
Trat Restaurant Club
Trat Chamber of Commerce
Ministry of Interior Ministry of Tourism Ministry of Finance Provincial Govt.
Technical
Knowledge
Others
Logistics

70
3.3.6.4 Community Development Enterprises
Community Development Enterprises (CDEs) are popularly known as OTOP enterprises, which are
products identified with a 'tambon' or sub-district of a province. The CDEs are mainly traditional artisans,
physicians, and other knowledge resources persons or communities, who have specialised skills in wood
work, herbal products, weaving, hand skills, processing of food, and / or produce very unique products,
which are identifiable with a particular community and geography. The indicative statistics of Trat CDEs
are given below:
Table 44: Trat Community Development Enterprises
Enterprises Registration Record
Location Community
Producer group
Single
Producer
SMEs Total
Country 25,234 14,851 614 40,699
Trat 60 114 6 180
Source: http://113.53.241.24/CDDReport/rpOverviewProvince.aspx (2014)
Type of Product Foods Drinks Fabric &
wearing
apparel
Apparatus
(Appliance,
decoration &
souvenir)
Herb
(non-food)
Total
Country 25,484 3,440 18,398 25,812 10,412 83,546
Trat 295 26 21 44 106 492
Source: http://113.53.241.24/CDDReport/rpCategories.aspx (2014)
3.3.6.5 Constraints of the Cluster and the Value Chain
From the sub-sector and value chain analysis of tourism in Trat province, a number of bottlenecks were
identified.
i. Logistical bottlenecks slowing down development of Trat particularly making it difficult to tourists
to visit, e.g. roadway from Chanthaburi; the province lacks a grand plan to develop all the
tourism related enterprises;
ii. Lack of coordination and cooperation between community development enterprises and
tourism sector.
3.3.6.6 Recommended Strategies for the Cluster Value Chain
The main priority activities or strategies to strengthen the cluster involve the following:
i. Tourism advertisement such as brochure, tourism information, leaflet, tour program / activities,
hotel / restaurant information should be well prepared by the tour operators with a focus on
cultural tourism;
ii. Integrating tourism into community development is needed to promote the community
enterprise;
iii. OTOP products are needed to promote as part of tourism on a selection basis alternatively to
reach out to new loyal customers;
iv. Capacity development on quality and packaging for OTOP enterprises is supported by
Community Development Office. However, greater involvement of the local authorities is
needed;
v. Culture tourism areas are available in Baan Pet Nai, Baan Klang Son, and Baan Lam Ma Kham
which can be promoted as part of the provincial development plant;
vi. Model of tourism development in short and long terms, and master plan for tourism sector are
needed to be shared by related agencies of the province. In this connection, this is to be noted
that Trat is a designated area for sustainable tourism determined by Designated Areas for
Sustainable Tourism Administration (Public organization (http://www.dasta.or.th/en/). Four
designated areas in Trat comprising of Koh Chang (Koh means Island), Koh Mak, Koh Kod and
associated coastal areas which is one of designated areas for sustainable tourism in Thailand
including Chiang Mai Night Safari, Pattaya city and related areas, Sokhothai – Kamphangphet
Historical Parks, Loei province, Old town of Nan province, and Ancient city of Ou-thong
province. The four designated areas of Trat cover 4,280 sq. km.

71
3.4 Vietnam
Provinces Name Cluster Name
➢ Tay Ninh
➢ Ca Mau
• Custard Apple Cluster
• Dried Fish Cluster
➢ Can Tho • Cat Fish Cluster
➢ Kien Glang • Shrimp (Tiger Prawn) Cluster
Map 19: Provinces and Clusters in Vietnam
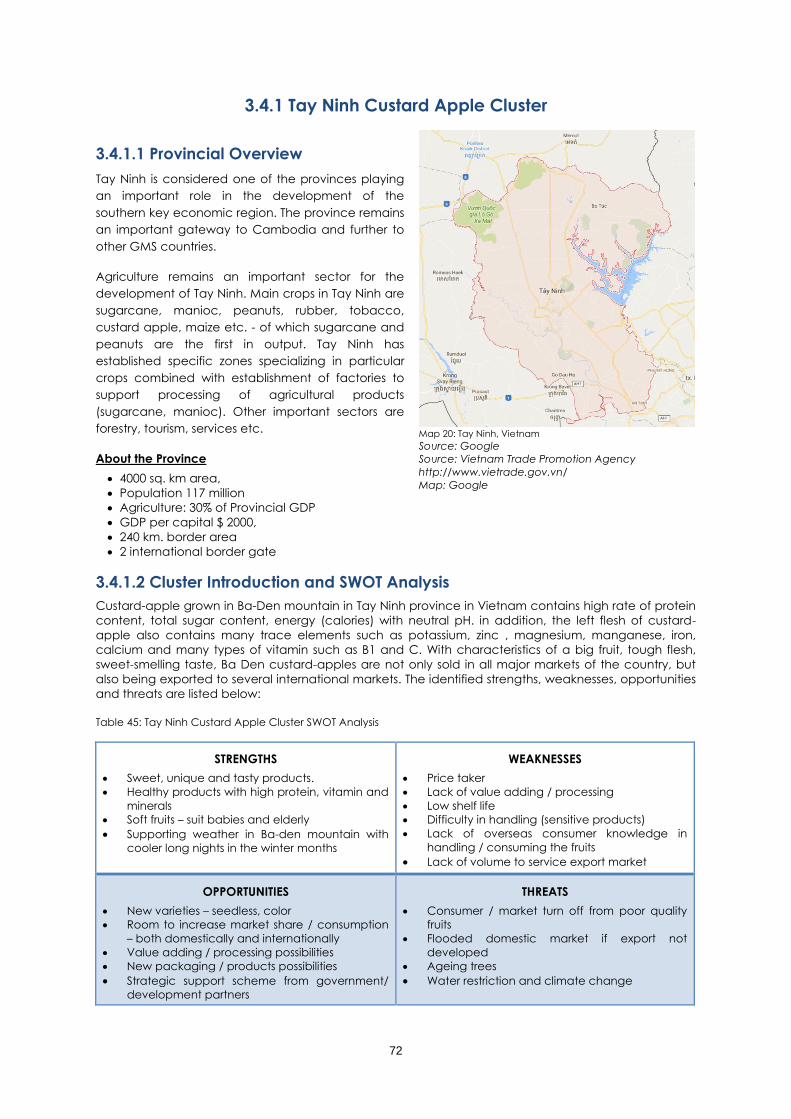
72
3.4.1 Tay Ninh Custard Apple Cluster
3.4.1.1 Provincial Overview
Tay Ninh is considered one of the provinces playing
an important role in the development of the
southern key economic region. The province remains
an important gateway to Cambodia and further to
other GMS countries.
Agriculture remains an important sector for the
development of Tay Ninh. Main crops in Tay Ninh are
sugarcane, manioc, peanuts, rubber, tobacco,
custard apple, maize etc. - of which sugarcane and
peanuts are the first in output. Tay Ninh has
established specific zones specializing in particular
crops combined with establishment of factories to
support processing of agricultural products
(sugarcane, manioc). Other important sectors are
forestry, tourism, services etc.
About the Province
• 4000 sq. km area,
• Population 117 million
• Agriculture: 30% of Provincial GDP
• GDP per capital $ 2000,
• 240 km. border area
• 2 international border gate
Map 20: Tay Ninh, Vietnam Source: Google
Source: Vietnam Trade Promotion Agency
http://www.vietrade.gov.vn/
Map: Google
3.4.1.2 Cluster Introduction and SWOT Analysis
Custard-apple grown in Ba-Den mountain in Tay Ninh province in Vietnam contains high rate of protein
content, total sugar content, energy (calories) with neutral pH. in addition, the left flesh of custard-
apple also contains many trace elements such as potassium, zinc , magnesium, manganese, iron,
calcium and many types of vitamin such as B1 and C. With characteristics of a big fruit, tough flesh,
sweet-smelling taste, Ba Den custard-apples are not only sold in all major markets of the country, but
also being exported to several international markets. The identified strengths, weaknesses, opportunities
and threats are listed below:
Table 45: Tay Ninh Custard Apple Cluster SWOT Analysis
STRENGTHS
• Sweet, unique and tasty products.
• Healthy products with high protein, vitamin and
minerals
• Soft fruits – suit babies and elderly
• Supporting weather in Ba-den mountain with
cooler long nights in the winter months
WEAKNESSES
• Price taker
• Lack of value adding / processing
• Low shelf life
• Difficulty in handling (sensitive products)
• Lack of overseas consumer knowledge in
handling / consuming the fruits
• Lack of volume to service export market
OPPORTUNITIES
• New varieties – seedless, color
• Room to increase market share / consumption
– both domestically and internationally
• Value adding / processing possibilities
• New packaging / products possibilities
• Strategic support scheme from government/
development partners
THREATS
• Consumer / market turn off from poor quality
fruits
• Flooded domestic market if export not
developed
• Ageing trees
• Water restriction and climate change
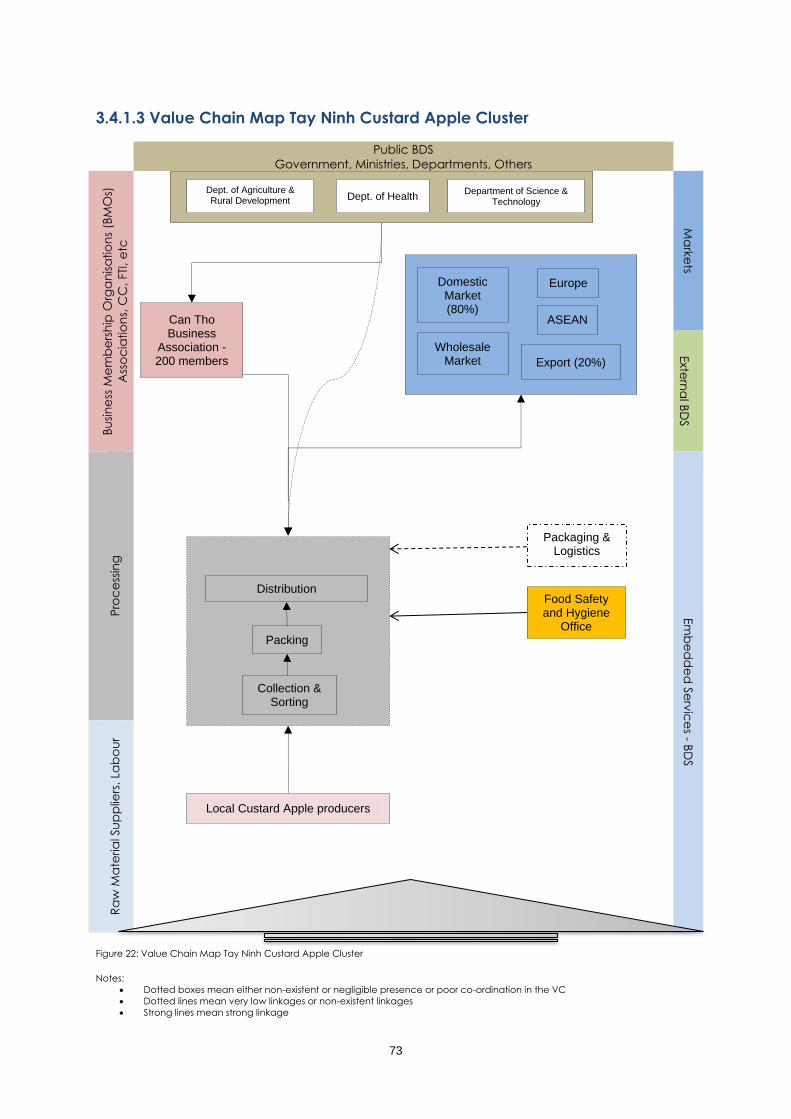
73
3.4.1.3 Value Chain Map Tay Ninh Custard Apple Cluster
Public BDS
Government, Ministries, Departments, Others
Bu
sin
ess
Me
mb
ers
hip
Org
an
isa
tio
ns
(BM
Os)
Ass
oc
iatio
ns,
CC
, FTI
, e
tc
Ma
rke
ts Exte
rna
l BD
S
Pro
ce
ssin
g
Em
be
dd
ed
Se
rvic
es - B
DS
Ra
w M
ate
ria
l Su
pp
liers
, La
bo
ur
Figure 22: Value Chain Map Tay Ninh Custard Apple Cluster
Notes:
• Dotted boxes mean either non-existent or negligible presence or poor co-ordination in the VC
• Dotted lines mean very low linkages or non-existent linkages
• Strong lines mean strong linkage
Dept. of Health Dept. of Agriculture & Rural Development
Department of Science & Technology
Can Tho Business
Association - 200 members
Food Safety and Hygiene
Office
Packaging & Logistics
Distribution
Packing
Collection & Sorting
Export (20%)
Europe Domestic Market (80%)
Wholesale Market
Local Custard Apple producers
ASEAN

74
3.4.1.4 Value Chain of Tay Ninh Custard Apple Cluster in Numbers
Area 1 ha (hectare)
Productivity 7 tons/season (2 seasons per year)
Total volume 14 tons (year)
Average price VND 18,000/kg (USD 0.8/kg)
Total revenue USD 11,325.84 (year)
Labor 1 male worker working full time (12 months/year) and 1 male worker
working for 150 days/year)
Costing (per hectare):
Figure 23: Value Chain of Tay Ninh Custard Apple Cluster in Numbers
3.4.1.5 Constraints of the Cluster and the Value Chain
From the value chain analysis of the product and SWOT analysis of the cluster, a number of bottlenecks
were identified.
i. With an excess of 20% custard apple production after meeting the domestic consumption and
future likely greater quantity harvest after adopting better farming and harvesting practices
and new plantation in and around Ba-Den mountain, new geographical market remains a key
to establish with competition from Australia and Hawaii;
ii. Lack of access to appropriate packaging leave a large amount of Durian with inferior quality
and reduced prices;
iii. Lack of understanding about the nutrient contents custard apple and the proper way to
consume remains a marketing constrain for custard apple in the new markets;
iv. Lack of research and development of processing of custard apple as new products has also
affected the better use of custard apples which has somewhat shorter shelf-life as ‘fresh fruits;
Havesting (27.1%)
Indirect cost (35.2%) (US$
2,481.87/year) Direct cost (64.8%) (US$
4,577.53/year)
Land acquisiti
on (36.2%)
Fertiliser/protection chemical
pumping machines (7.6%)
Land preparati
on (42.3%)
Watering piping and well/pond drilling (11.5%)
Water pumper (3.7%)
Micro-organic
and chemical
fertilizer
(39.8%)
Electricity for
watering (3.6%)
Plant protection chemicals
(20.2%)
Caring (72.9%)
Labors
for plant
care
(36.4%)
Electricity (low
voltage) (1.2%)
Labor for harvesting and
packaging (34.2%)
Nilon Packaging and
box (65.8%)
Seedling (05%)

75
v. Availability of good quality seeds and lack of new plantation are another constraint to
maintain the current level of custard apples production from the existing fruit-bearing trees
when they start ageing;
vi. Of the current domestic consumption of 80% of the total production, the cluster producers
remain vulnerable becoming price-takers during the high season as the ripe fresh fruits have
short shelf-lives.
3.4.1.6 Recommended Strategies for the Cluster Value Chain
The main priority activities or strategies to strengthen the cluster involve the following:
i. Training on export consortia formation with selected cluster producers to strengthen the export
potential of this sector;
ii. VC up gradation with good quality seed, improved farming practices, improved handling
system and packaging to respond to the sensitive nature of custard apples;
iii. Research and innovation to explore diversified use of custard apple rich in nutrients and
minerals;
iv. Connect cluster producers and SMEs in online marketplace to search for new large
international buyers within a short time and train them on getting the most of online
marketplace.

76
3.4.2 Kien Giang Tiger Prawn Cluster
3.4.2.1 Provincial Overview
About the Province
• Population of the province: 1.8 million
• One of the most important province in Mekong
Delta
Biggest in Vietnam in terms of land area and
agricultural development
• Total 8000 hectare for shrimp cultivation
• 40% shrimp of the province gets exported
• Employement in shrimp industry: 10,000
• Testing Lab for shrimp: NIFIQUAVEB
Access to Finance
Agribank:
Loan to farmers (agriculture and fishing)
Loan to traders & collectors
Rate of interest is 7%
Bank for Industry and Commerce:
Loan to SMEs- priority
Advocacy for SME policy development
SME banking
Rate of interest- 7-11%
Map 21: Kien Giang, Vietnam
Map Source: Google
Source: http://www.vietrade.gov.vn/en/index.php?option=
com_content&id=1353
3.4.2.2 Cluster Introduction and SWOT Analysis
Kien Giang is a coastal province in Vietnam and is suitable for farming tiger shrimps. Shrimp is a product
on demand in food menu. Annual sales of shrimps amounts to USD 50-60 bn worldwide and are
growing at an average of 9% a year. The main exporting countries remain as Thailand, Vietnam,
Indonesia, Pakistan, Bangladesh and some other countries from Asia and Latin America. The intensive
shrimp farming, particularly tiger shrimp is promoted by Vietnamese government and development
partners as raise income for the poor. The identified strengths, weaknesses, opportunities and threats
are listed below:
Table 46: Kien Giang Tiger Prawn Cluster SWOT Analysis
STRENGTHS
• Integrated farming, processing and marketing
including export
• Importers send their supervisors to guide adopting
‘best practices’ in farming and processing and to
check quality at every stage.
• Professionals working in the shrimp industry have
technical background (passed out from Fisheries &
Agriculture Dept of Can Tho University)
WEAKNESSES
• Lack of pro-active BMO
• Limited contract farming- contract farming
ensures better quality control
• Domestic brand (KTC FOOD) is okay but no
export brand developed so far
• Improper quality control across production chain
OPPORTUNITIES
• Modern technology
• Preferential Investment facilitation (lower land rate
than marker rate, relaxation in taxation)
• Support for trade fair participation: VIETFISH fair at
Baclieu, Vietnam Logistics facility getting developed-
Govt. is paying due attention to it
• Capacity expansion indicating positive outlook
THREATS
• Fluctuating market price
• Diseases of shrimps
• Increasing competition from other AEC zone
countries
• Use of illegal antibiotics
• Adverse effect on nature e.g. elimination of
mangrove forests
• Potential livelihood loss and social unrest

77
Value Chain of Kien Giang Shrimp Cluster
Figure 24: Shrimp Cluster Value Chain Steps
3.4.2.3 Value Chain Map of Kien Giang Shrimp Cluster
Public BDS
Government, Ministries, Departments, Others
Bu
sin
ess
Me
mb
ers
hip
Org
an
isa
tio
ns
(BM
Os)
Ass
oc
iatio
ns,
CC
, FTI
, e
tc
Ma
rke
ts Exte
rna
l BD
S
Pro
ce
ssin
g F
ina
nc
ial In
stitutio
ns, E
mb
ed
de
d S
erv
ice
s – B
DS
Ra
w M
ate
ria
l Su
pp
liers
, La
bo
ur
Figure 25: Value Chain Map of Kien Giang Shrimp Cluster
Breeding Farming Processing Marketing
Japan, EU
Machinery / tools
Department of Health
Department of Agriculture & Rural Development
Department of Science & Technology
Kien Giang Business
Association
Food Safety and Hygiene
Office
Processing Units
Collection / Distribution
Farming
Breeding / rearing
Europe
Middle East
Domestic Mkts
Wholesale Mkts
Local Shrimp fry collectors / producers
Testing Lab

78
Notes:
• Dotted boxes mean either non-existent or negligible presence or poor co-ordination in the VC
• Dotted lines mean very low linkages or non-existent linkages
• Strong lines mean strong linkages
3.4.2.4 Shrimp Value Chain in Numbers Table 47: Shrimp Value Chain in Numbers
White Shrimp
No. of companies- 100 No. of Firms; 7 large &20
medium &1000 small/
household
• Domestic
• Export: EU (Germany),
Middle East, USA and
Canada
Breeding time: 3 months 3 months for farming/
growing
2 days for processing
Price: VD 105,000-110,000/
100 shrimp
60% higher price from farming to
processing
Difference in domestic &
export market price 15 %
After processing, weight becomes
70-75% compared to raw fish
There is about 60-70% value
addition due to processing
Tiger Shrimp
RM price of Tiger Shrimp
VD 150,000-300,000/ kg.
40 shrimp/kg.
Other part of VC almost same as White Shrimp
Casadin
Raw material price: VD 18,000-
20,000/ kg.
Market Price (post
processing): VD 7000-8000/
150 gram
3.4.2.5 Constraints of the Cluster and the Value Chain
From the value chain analysis of the product and SWOT analysis of the cluster, a number of bottlenecks
were identified.
i. Investment capacity of SMEs is limited leaving it dependent on buyer-introduced quality
check on farming practices, harvesting and processing and thus losing itself of potential value
addition;
ii. Weak access to technical development of the shrimp processing facilities;
iii. Lack of capacity in complying with testing & international quality certification;
iv. Lack of understanding and compliances with hygiene practices in food processing has been
identified as another major constraint;
v. No clustering or joint activity
vi. No co-operation among the similar companies to opt for common good and lack of
association and government effort in branding Vietnamese shrimps;
vii. Lack of social compliance involving forcefully converting cultivable land into shrimp-ponds
discriminating against the native communities of their livelihood options;
viii. Potential environmental hazard damaging the coastal mangroves and the wildlife around
that;
ix. Image problem with use of antibiotics, traces of bacteria, coercive worker’s management
during high seasons, deprivation of local farmers and fishing communities and perceived
environmental hazard.
3.4.2.6 Recommended Strategies for the Cluster Value Chain
The main priority activities or strategies to strengthen the cluster involve the following:
i. Standard and quality training to the shrimp-processing SMEs to implement quality programs
across the value chain;
ii. Market development through implementation of different quality and social certification to
counter the bad press about shrimp farming and diversify shrimp export in Asia destinations;
iii. Export consortia formation training to the cluster producers to strengthen access to end
market;

79
iv. Promotion of cross border trade agreements to take most out of the regional trade
agreements;
v. Introduction of embedded BDS to streamline most of the producers – large or small to counter
the critics of quality of shrimps;
vi. BMO Capacity building to represent the sector with identified constraints and offered solutions
to attract proper policy intervention;
vii. Support participation in trade fairs, business matchmaking and structured learning visits.
3.4.3 Can Tho Catfish Cluster
3.4.3.1 Provincial Overview
Can Tho province is a fertile area suitable
for agriculture in Mekong delta. Along with
rice, the province is home to many orchards
and farms and floating market dotted
around the provincial capital attracting
tourists. Can Tho remain important as the
regional trade and transportation hub.
About the Province
• Total 37 SMEs involved in fish processing and
export
• Govt. plan for developing the 2 sectors:
• Prime Minister’s Decree 2013
• Investment in rural development- agri
products, harvesting, processing-private
sector promotion in agri including fish
sector
• Govt. support-tax benefit
• Financial support to promote technology
and innovation
Map 22: Can Tho, Vietnam
Map Source: Goolge
3.4.3.2 Cluster Introduction and SWOT Analysis
Catfish sub-sector (e.g. Pangasius) in Vietnam is largely dominated by export (roughly 90% leaving
around 10% for domestic consumption) and employ a large section of working population in catching,
breeding, rearing and processing catfishes for export and domestic markets. Processing companies are
the most powerful actors in the Pangasius chain, providing the biggest input of labour and capturing
nearly three quarters of the total net value added in the chain. Support is provided by the government
through VASEP (Vietnam Association of Seafood Exporters and Processors) and other actors. The
identified strengths, weaknesses, opportunities and threats are listed below:
Table 48: Can Tho Catfish Cluster SWOT Analysis
STRENGTHS
• Strong export market (90% of total production)
• Employ a large worksforce in the sector
• Active and influencing associations earning
foreign currency and securing government
support
• Supportive government policy for the
improvement of catfish sub-sector
• Supportive natural conditions for catfish farming
WEAKNESSES
• Scanty support to fishermen and fish-traders
(belonging to informal sector) compared to
exporters earning little motivation from some of the
important value chain actors
• Fishermen’s dependency for informal finance on
the informal value chain actor lacking proper
access to formal financial mechanism
• Lack of support to small scale processors
OPPORTUNITIES
• Growing export market
• Growing familiarity as Mekong Specialty in
upper-end restaurants catering also tourists
• Development in farming techniques to ensure
greater production
THREATS
• Bad press about cat-fish in general including
hormone treatment, antibiotics etc.
• Weak relationship among the channel actors with
restricted share of value on some actors (e.g.
fishermen)
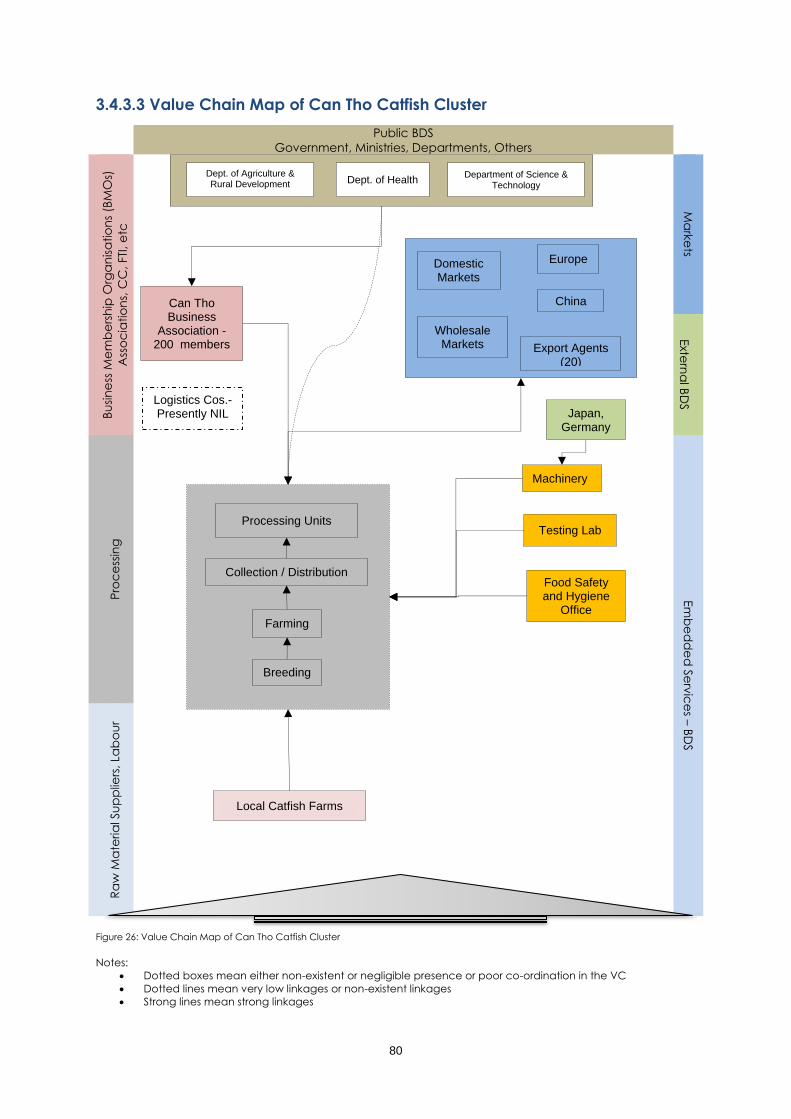
80
3.4.3.3 Value Chain Map of Can Tho Catfish Cluster
Public BDS
Government, Ministries, Departments, Others
Bu
sin
ess
Me
mb
ers
hip
Org
an
isa
tio
ns
(BM
Os)
Ass
oc
iatio
ns,
CC
, FTI
, e
tc
Ma
rke
ts Exte
rna
l BD
S
Pro
ce
ssin
g
Em
be
dd
ed
Se
rvic
es –
BD
S
Ra
w M
ate
ria
l Su
pp
liers
, La
bo
ur
Figure 26: Value Chain Map of Can Tho Catfish Cluster
Notes:
• Dotted boxes mean either non-existent or negligible presence or poor co-ordination in the VC
• Dotted lines mean very low linkages or non-existent linkages
• Strong lines mean strong linkages
Japan, Germany
Machinery
Dept. of Health Dept. of Agriculture & Rural Development
Department of Science & Technology
Can Tho Business
Association - 200 members
Food Safety and Hygiene
Office
Logistics Cos.-Presently NIL
Processing Units
Collection / Distribution
Farming
Breeding
Export Agents (20)
Europe
China
Domestic Markets
Wholesale Markets
Local Catfish Farms
Testing Lab

81
3.4.3.4 Value Chain of Can Tho Catfish Cluster in Numbers
Figure 27: Value Chain of Can Tho Catfish Cluster
Table 49: Value Chain of Catfish Cluster in Numbers
Catfish
No. of companies involved in
CT:
Breeding-5-7
Animal Feed supplier-10
20
25
Domestic-19
Export-20
Cost:
VD 500/kg for Type 1-100
pieces/kg type
VD 1500/ kg. for Type-2 - 50
pieces/kg type
VD 19000/kg.
Claims to pay 1000 more than
market price
Processing cost:
VD 5500-6500/kg.
Export price:
$ 1.95-2.00/ kg.
Compliance of Int. Standards:
o GLOBAL G.A.P.
o ASC-C-00282
o ASC-BV-014-VN
o ISO 17025 for in-
house/company
testing lab
o HACCP
o BRC
o IFS
Packaging:
IQF
Block interleaved
Shatter pack
Product Testing Facility/ Lab:
VINA Control
NAFICAT
No private lab. Yet
Brand name called ‘SOUTH
VINA’
Time taken: 8-10 months to grow in farming
Loss: Processing loss:1.5 kg becomes
1 kg after processing
Profit margin: 2% due to strong market
competition overseas
3.4.3.5 Constraints of the Cluster and the Value Chain
From the value chain analysis of the product and SWOT analysis of the cluster, a number of bottlenecks
were identified.
i. Lack of BDS support to smaller processors who lack the capacity in conforming with the quality
and standards and often end up in the low-value domestic market;
ii. Overseas market competition from mostly other GMS / ASEAN countries exporting catfish to
western markets;
iii. Lack of export market research to target niches differently;
iv. Limited cross border trade in GMS as most other GMS countries are also strong producers of
catfishes;
v. No VC up gradation in terms of value addition of catfish across stakeholders
vi. Lack of policy implementation- entrepreneurs started doubting efficacy of policy
implementation (e.g., VCCI is implementing a fishery sector value chain development project
with the support of the Govt; however, SMES are not actively participating in this project);
vii. Information asymmetry- lack of awareness on the part of entrepreneurs about Govt. schemes
leaving only the large processors in close contact with the policymakers;
viii. Government is not able to meet the requirements of catfish cluster SMEs like in other sectors.
3.4.3.6 Recommended Strategies for the Cluster Value Chain
The main priority activities or strategies to strengthen the cluster involve the following:
i. Cluster development in terms of capacity development and market development of the
smaller producers;
ii. VC up gradation with high-end technology adoption benefitting both large and smaller
enterprises;
iii. Export consortia formation and export market development by offering ToT trainings to the lead
SMEs who will conduct repeat trainings to raise awareness about farming practices and quality
assurance among smaller enterprises;
iv. Export market research to design different strategies for different market;
v. Logistics development in terms of common branding.
Breeding Farming Processing Marketing

82
3.4.4 Ca Mau Dried Fish (Snakeskin Gourami) Cluster
3.4.4.1 Provincial Overview
Ca Mau is the southernmost province in Vietnam, a
triangular stretch of land, with an average height of
seven feet above the sea level, mostly formed by
the deposits of the Mekong River. This low-lying area
is the host to a number of forests and gardens and
intersected canals and water-bodies that is
supportive to growing fish-stocks. An extensive
network of canals also supports a strong agricultural
sector, as well as providing a popular means of
transport.
Economy
The economy of the region is based on cultivated
as well as natural products. Rice, honey, wax, fiber
mats and fish are some of the things the locals of
the region trade and export. The province has a
large activity in fishing including catching and
processing fish e.g. drying. Drying of different fish
species is an indigenous economic activity suited to
this coastal region. However, quality control in the
drying process is still a question mark as there is little
indigenous knowledge available to prevent fungal
and maggot infection.
Area: 5,331 km²
Population: 1.22 million (2013)
Map 23: Ca Mau, Vietnam
Map Source: Google
3.4.4.2 Cluster Introduction and SWOT Analysis
More than 330 households together produce 10-15 tonnes of dried snakeskin gourami each year in Ca
Mau province making it one of the major economic activities in the province. A kilo of dried snakeskin
Gourami costs USD 18 in the market. The product has a strong domestic sales-base. Producers may
earn upto USD 9000 at the eve of ‘Tet’ or the Vietnamese new year. The identified strengths,
weaknesses, opportunities and threats are listed below:
Table 50: Ca Mau Dried Fish (Snakeskin Gourami) Cluster SWOT Analysis
STRENGTHS
• High domestic market demand all year round,
particularly during the time of Vietnamese new year
which witness large amount of domestic
consumption as a traditional food
• Indigenous knowledge about fish-drying
• Regular supply of gourami fishes, the raw material for
the dried fish
WEAKNESSES
• Lack of pro-active BMO to engage in active
negotiation with the policymakers to secure
support
• Limited contract farming- contract farming ensures
better quality control
• Improper quality control across production chain
• Support to the cluster similar to other clusters in
Vietnam
OPPORTUNITIES
• Modern technology
• Support government policy targeting dried snakeskin
gourami
• Technology upgrade, particularly drying
• Quality improvement together with other dried food
THREATS
• Fluctuating market price
• Irregular demand outside new year

83
3.4.4.3 Value Chain of Ca Mau Dried Fish Cluster
Public BDS
Government, Ministries, Departments, Others
Bu
sin
ess
Me
mb
ers
hip
Org
an
isa
tio
ns
(BM
Os)
Ass
oc
iatio
ns,
CC
, FTI
, e
tc
Ma
rke
ts Exte
rna
l BD
S
Pro
ce
ssin
g
Em
be
dd
ed
Se
rvic
es –
BD
S
Ra
w M
ate
ria
l Su
pp
liers
, La
bo
ur
Figure 28: Value Chain of Ca Mau Dried Fish Cluster
Notes:
• Dotted boxes mean either non-existent or negligible presence or poor co-ordination in the VC
• Dotted lines mean very low linkages or non-existent linkages
• Strong lines mean strong linkages
Dept. of Health Dept. of Agriculture & Rural Development
Department of Science & Technology
Ca Mau Business
Association
Food Safety and Hygiene
Office
Drying (4 days)
Collection and Processing (1 day)
Overseas Market (Ethnic
Vietnames)
Retailers (50%)
Wholesale Markets (50%)
Local Gourami producers / sellers
Packaging
Growing (9-10 months)
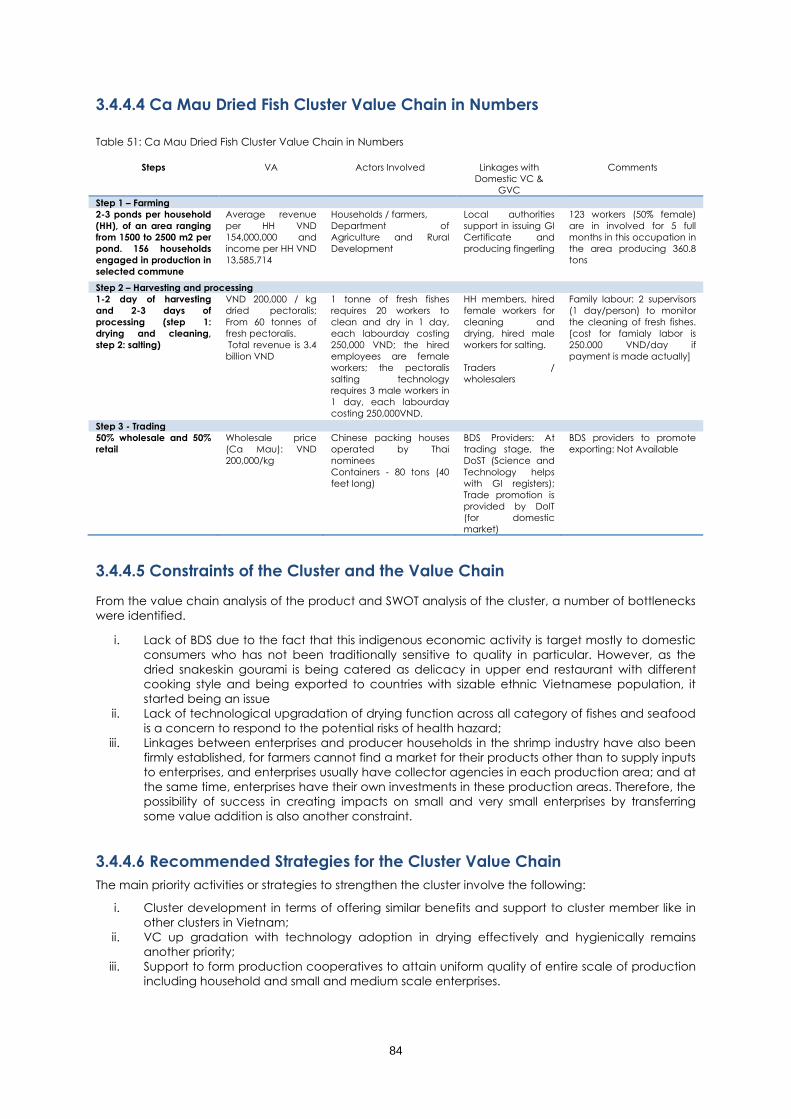
84
3.4.4.4 Ca Mau Dried Fish Cluster Value Chain in Numbers
Table 51: Ca Mau Dried Fish Cluster Value Chain in Numbers
Steps VA Actors Involved Linkages with
Domestic VC &
GVC
Comments
Step 1 – Farming
2-3 ponds per household
(HH), of an area ranging
from 1500 to 2500 m2 per
pond. 156 households
engaged in production in
selected commune
Average revenue
per HH VND
154,000,000 and
income per HH VND
13,585,714
Households / farmers,
Department of
Agriculture and Rural
Development
Local authorities
support in issuing GI
Certificate and
producing fingerling
123 workers (50% female)
are in involved for 5 full
months in this occupation in
the area producing 360.8
tons
Step 2 – Harvesting and processing
1-2 day of harvesting
and 2-3 days of
processing (step 1:
drying and cleaning,
step 2: salting)
VND 200,000 / kg
dried pectoralis;
From 60 tonnes of
fresh pectoralis.
Total revenue is 3.4
billion VND
1 tonne of fresh fishes
requires 20 workers to
clean and dry in 1 day,
each labourday costing
250,000 VND; the hired
employees are female
workers; the pectoralis
salting technology
requires 3 male workers in
1 day, each labourday
costing 250,000VND.
HH members, hired
female workers for
cleaning and
drying, hired male
workers for salting.
Traders /
wholesalers
Family labour: 2 supervisors
(1 day/person) to monitor
the cleaning of fresh fishes.
[cost for famialy labor is
250.000 VND/day if
payment is made actually]
Step 3 - Trading
50% wholesale and 50%
retail
Wholesale price
(Ca Mau): VND
200,000/kg
Chinese packing houses
operated by Thai
nominees
Containers - 80 tons (40
feet long)
BDS Providers: At
trading stage, the
DoST (Science and
Technology helps
with GI registers);
Trade promotion is
provided by DoIT
(for domestic
market)
BDS providers to promote
exporting: Not Available
3.4.4.5 Constraints of the Cluster and the Value Chain
From the value chain analysis of the product and SWOT analysis of the cluster, a number of bottlenecks
were identified.
i. Lack of BDS due to the fact that this indigenous economic activity is target mostly to domestic
consumers who has not been traditionally sensitive to quality in particular. However, as the
dried snakeskin gourami is being catered as delicacy in upper end restaurant with different
cooking style and being exported to countries with sizable ethnic Vietnamese population, it
started being an issue
ii. Lack of technological upgradation of drying function across all category of fishes and seafood
is a concern to respond to the potential risks of health hazard;
iii. Linkages between enterprises and producer households in the shrimp industry have also been
firmly established, for farmers cannot find a market for their products other than to supply inputs
to enterprises, and enterprises usually have collector agencies in each production area; and at
the same time, enterprises have their own investments in these production areas. Therefore, the
possibility of success in creating impacts on small and very small enterprises by transferring
some value addition is also another constraint.
3.4.4.6 Recommended Strategies for the Cluster Value Chain
The main priority activities or strategies to strengthen the cluster involve the following:
i. Cluster development in terms of offering similar benefits and support to cluster member like in
other clusters in Vietnam;
ii. VC up gradation with technology adoption in drying effectively and hygienically remains
another priority;
iii. Support to form production cooperatives to attain uniform quality of entire scale of production
including household and small and medium scale enterprises.
85
3.5 Overall Recommendation for the Selected 19 Clusters
There is no single strategy set which may address the needs of all the SMEs across the provinces along
the SEC, selected clusters and others. The product value chains of the SME clusters are indicative and
prototypical of the needs of the SMEs in each province. It will also be presumptive to apply one
strategy applicable in one SME sector for the development in another group of SMEs. For example, in
case of agricultural produce and sea food items, quality and hygiene may be pressing issues, because
there is an increasing awareness and demand for adhering to food processing quality standards. These
issues need to be addressed in a more practical and implementable manner. Some overarching
suggestions are mentioned below:
Support to Strengthening Clusters: Across the clusters along the SEC, there is a need for developing
strong cluster leadership and functioning to raise awareness among the cluster members about
producing and marketing in a united front to attract support from the respective governments and also
from development partners.
Formation of Export Consortia and Export Market Development: After strengthening the cluster
management the next step is to support selected cluster leadership in formation of export consortia
and develop the export market for the products developed in the clusters. This also helps to follow
particular quality programs for a particular cluster for the quality upgrade of all the products that are
produced in the cluster.
Structured Learning Visits: The southern economic corridor of the Mekong sub-region has similar clusters
in the provinces and learning visits from one country to another can significantly improve process
upgrade. Also, the learning visits can promote mutual trade discussion in case one cluster is in need of
raw input from another while input from the domestic market may turn out to be costly and time
consuming or simply not available.
Development of Interactive Database: Inclusion of the clusters and SMEs in the SEC in an interactive
database would facilitate to connect with prospective buyers and investors who can assist these
enterprises with superior technology and help them accessing new export markets. Inclusion in the SEC
database will also support the SMEs to interact with other clusters and prepare themselves for large
export orders.
Introduction of E-commerce: A selected number of cluster members and SMEs were identified who
showed greater strength and capacity to compete in international markets. To support these
entrepreneurs further in their business expansion, the prospective candidates should be screened and
linked with an online marketplace provider where they can register themselves and receive trainings on
how to successfully trade with overseas buyers.
Support Participation in Trade Fairs to Promote Cross-border Trade in the SEC: One of the major roles of
these interventions is to promote cross border trade among the GMS countries. From the study, it was
understood that some clusters in one country might be in a serious need of sourcing raw materials and
that they simply did not have ideas that those inputs could be easily procured from a neighbouring
cross-border provinces. These trade events will facilitate those enterprises further in engaging
themselves in trade and partnership negotiation with other enterprises across the borders.

86
Chapter D
Appendix & Bibliography

87
Appendix I: Numbers of Enterprises Cambodia
Table T.1 - Types of Enterprises in Cambodia
Year 1999 2000 2001 2002 2003 2004 2005 2006 2007 2008 2009
Large Industry 309 368 320 336 372 413 490 481 564 542 556
Small, Medium
Industry
25,049 25,601 27,155 26,940 25,985 28,131 29,297 31,149 32,619 32,800 35,560
Total 25,358 25,969 27,475 27,276 26,357 28,544 29,787 31,630 33,183 33,342 36,116
Growth Rate 2.41% 5.80% -0.72% -3.37% 8.30% 4.35% 6.19% 4.91% 0.48% 8.32%
Source: Ministry of Industry, Mining, and Energy (MIME), 2009
Myanmar
Table T.2 - Types of Enterprises in Myanmar
Subsector Large Small Medium Total Share (%)
Food & Beverages 1778 22282 3683 25965 64.51%
Clothing & Wearing Apparel 247 1494 373 1867 4.64%
Construction materials 478 2388 560 2948 7.32%
Personal goods 253 495 273 768 1.91%
Household goods 105 122 97 219 0.54%
Printing & publishing 18 249 90 339 0.84%
Industrial raw material 110 668 256 924 2.30%
Mineral & petroleum 196 1141 389 1530 3.80%
Agriculture & equipment 8 35 21 56 0.14%
Machinery & equipment 12 195 56 251 0.62%
Transport vehicles 91 70 17 87 0.22%
Electrical goods 36 16 12 28 0.07%
Miscellaneous 151 4694 576 5270 13.09%
Total 3483 33849 6403 40252 100.00%
Source: Myanmar Ministry of Industry, Directorate of Industrial Supervision and Inspection as cited on page number 5 of Report by
UNIDO (Project number SAP 120523, Project name - " Fostering Pro-poor and inclusive SME development in Myanmar"; March 2013)
Thailand
Table T.2 - Types of Enterprises in Thailand
2012 2013
Number
of
Enterprises
Ratio to
Total
Num. of
Enterprises
Ratio
to
SMEs
Number
of
Enterprises
Ratio to
Total
Num. of
Enterprises
Ratio
to
SMEs
1 - Small and Medium Enterprises (SMEs) 27,30,591 97.20% 100.00% 27,63,997 97.16% 100.00%
1a - Small Enterprises (SEs) 27,17,649 96.74% 99.53% 27,50,750 96.70% 99.52%
1b - Medium Enterprises (MEs) 12942 0.46% 0.47% 13,247 0.47% 0.48%
2 - Larger Enterprises (LEs) 7127 0.25% - 7,349 0.26% -
3 - NA 71396 2.54% - 73,411 2.58% -
Total Number of Enterprises (1+2+3) 28,09,114 100.00% - 28,44,757 100.00% -
Source: Office of Small and Medium Enterprises Promotion (OSMEP) publications
From the Office of Small and Medium Enterprises Promotion (OSMEP), the number of SMEs in the
provinces of Thailand covered under this study are as follows:
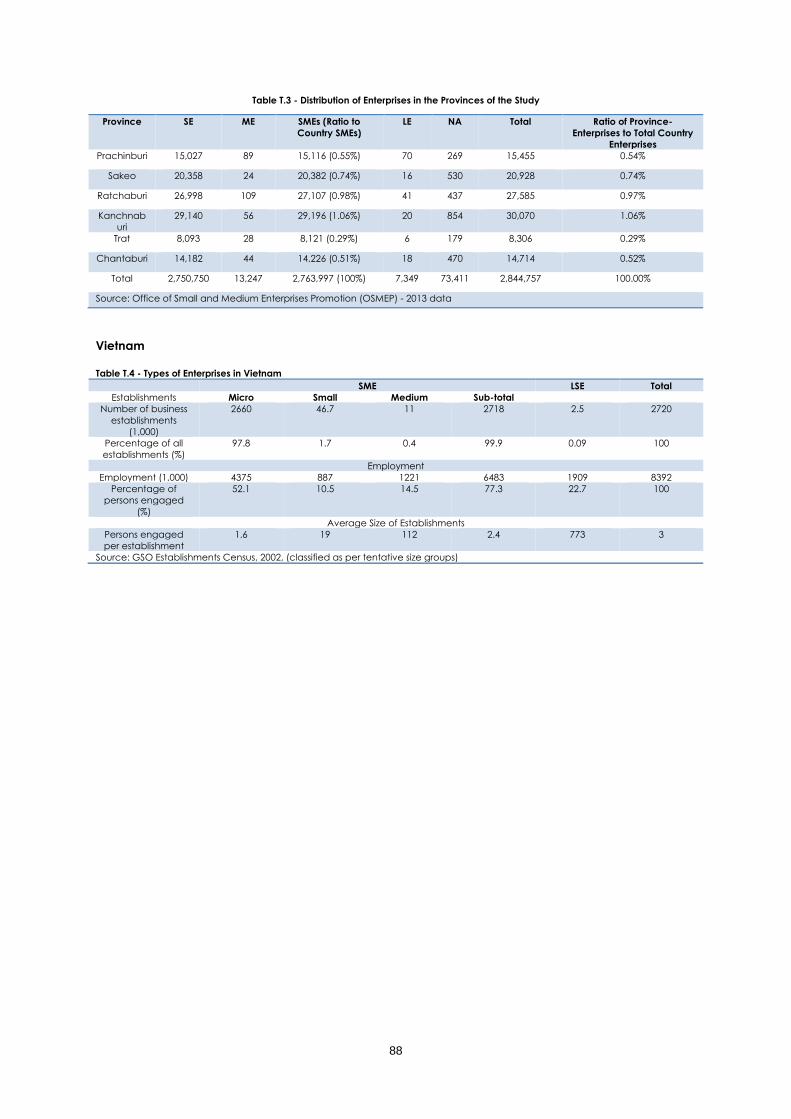
88
Table T.3 - Distribution of Enterprises in the Provinces of the Study
Province SE ME SMEs (Ratio to
Country SMEs)
LE NA Total Ratio of Province-
Enterprises to Total Country
Enterprises
Prachinburi 15,027 89 15,116 (0.55%) 70 269 15,455 0.54%
Sakeo 20,358 24 20,382 (0.74%) 16 530 20,928 0.74%
Ratchaburi 26,998 109 27,107 (0.98%) 41 437 27,585 0.97%
Kanchnab
uri
29,140 56 29,196 (1.06%) 20 854 30,070 1.06%
Trat 8,093 28 8,121 (0.29%) 6 179 8,306 0.29%
Chantaburi 14,182 44 14,226 (0.51%) 18 470 14,714 0.52%
Total 2,750,750 13,247 2,763,997 (100%) 7,349 73,411 2,844,757 100.00%
Source: Office of Small and Medium Enterprises Promotion (OSMEP) - 2013 data
Vietnam
Table T.4 - Types of Enterprises in Vietnam
SME LSE Total
Establishments Micro Small Medium Sub-total
Number of business
establishments
(1,000)
2660 46.7 11 2718 2.5 2720
Percentage of all
establishments (%)
97.8 1.7 0.4 99.9 0.09 100
Employment
Employment (1,000) 4375 887 1221 6483 1909 8392
Percentage of
persons engaged
(%)
52.1 10.5 14.5 77.3 22.7 100
Average Size of Establishments
Persons engaged
per establishment
1.6 19 112 2.4 773 3
Source: GSO Establishments Census, 2002, (classified as per tentative size groups)

89
Appendix II: Definition of SMEs
Vietnam
As per Decree 56/2009/ND-CP, the following table was presented in the "Action Research on Vietnam
SME Cluster Development and Value Chain Integration A Case Study of Tea and Ceramics Clusters",
Mekong Institute, ((Phan Manh Tuan, 2013)
Sector Micro enterprises Small enterprises Medium enterprises
Number of
Labourers
Total Capital
(VND)
Number of
Labourers
Total Capital
(VND)
Number of
Labourers
Agriculture,
forestry, fishery
Under 10 Under 20 billion 10 to 200 20-100 billion 200 – 300
Industry and
Construction
Under 10 Under 20 billion
10 to 200 20 to 100 billion 200 – 300
Trade and
Services
Under 10 Under 20 billion
10 to 50 10 to 50 billion 50 – 100
Note: 1 USD = 21,000 VND
Source: Following the Decree 56/2009/ND-CP, the information was summarised and the following table was
presented in the "Action Research on Vietnam SME Cluster Development and Value Chain Integration A Case Study
of Tea and Ceramics Clusters", Mekong Institute, (Phan Manh Tuan, 2013)
Cambodia
Numbers of Employee Financial Assets excluding Land (USD)
Micro < 10 < 50,000
Small 11 – 50 50,000 - 250,000
Medium 51 – 100 250,000 - 500,000
Large > 100 > 500,000
Source: ADB and Royal Govt of Cambodia’s Sub-committee on SME Secretariat, 2005 and 2007
Besides the above classification, the National Accounting Council6 of Cambodia defines an SME as
any establishment which carries on business and is not subject to the obligation of preparing financial
statements in accordance with Cambodian Accounting Standards, and meets any two of the
following three criteria:
1. Total maximum workers-employees from 11 to 100.
2. Annual turnover is from KHR 100 million to less than KHR 250 million.
3. Total assets are from KHR 100 million to KHR 250 million
Thailand
Small and Medium Enterprises (SMEs) in Thailand have been defined under the SME Master plans.
Chapter 2 (two) of the SME Master plan (2012-2016) gives the bases for classifying SMEs, the following
table is compiled for easy reference.
Type Small Medium
No. of Employee Fixed Asset- Excluding
Land (THB Mil.)
No. of Employee Fixed Asset- Excluding
Land (THB Mil.)
Manufacturing 50 or less ≤ 50 51 - 200 >50 to 200
Services 50 or less ≤ 50 51 - 200 >50 to 200
Wholesale 50 or less ≤ 50 26 - 50 >50 to 100
Retail 50 or less ≤ 30 16 - 30 >30 to 60
Source: http://www.smebank.co.th/en/definitions.php, and Chapter 2 SME Promotion Plan (http://goo.gl/rm6BTy) at OSMEP
Myanmar
Two separate laws in Myanmar define SMEs, based on four (4) criteria - power used, number of workers,
capital outlay, and production value. The following table summarises the classification.
Table V.1 Cottage Industries Promotion Law, 1991 Private Industrial Enterprises Law, 1990
Criteria Micro Small Medium
Power (HP) used < 3 H.P. 3 - 25 (H.P.) 26 - 50 (H.P.)
Num of Workers < 10 10 – 50 51 - 100
Capital Outlay (Kyat Million) ≤ 1 million kyat 1 - 5 million kyat
Production Value per year
(million)
≤ 2.5 2.5 - 10
Source: Ministry of Industry
6 SMEs need to comply with Cambodian International Financial Reporting Standards (CIFRSs) and Cambodian International Financial Reporting Standards for Small and Medium-sized Entities (CIFRSs for SMEs) in accordance with the Articles 3 and 4 of 'Law on Corporate Accounts, their Audit and the Accounting Profession'.

90
Appendix III: List of People Interviewed
Cambodia
Svay Rieng Province
1 Mr. Long Sokhum Director of Department of Industry and Handicraft
2 Ms. Ngov Sopha Vice Director
3 Mr. Tom Thoeun Chief of Office of Industry and Handicraft
4 Mr. Ob Nan Vice Director Department of Commerce
5 Mr. Ou Sokhoeun Vice Director Department of Vocational Training
6 Mr. Sok Burin SME
7 Mr. Keo Tola SME
8 Mr. Lo Savann, SME (clay)
9 Mr. Chan Sat, Rice Miller
10 Mr. Sok Vutha Prasac Microfinance
11 Ms. Chea Sokha Rice Miller
Kampot Province
12 Mr. Khan Chanvuthy Chief Officer Department of Industry and Handicraft
13 Mr. Im Kim Sophorn Chief Officer Department of Industry and Handicraft
14 Mr. Chuon Rin Chief Officer Department of Labour and Vocational Training
15 Mr. Chan Sopheak SME
16 Mr. Vuthy Ren SME (Mango)
17 Mr. Pheng Siphorn SME (Mango)
18 Mr. Sim Nin Microfinance
19 Mr. Chhon Chhang Vice President Chamber of Commerce
20 Mr. Sam Visal Chamber of Commerce
21 Mr. Houn Sovanny Chamber of Commerce
22 Mr. Ung Sophan Chamber of Commerce
Preah Sihanouk Province
23 Mr. Phrom Sokcheavanna Director Department of Commerce
24 Ms. Seng Samnang Chief Office, Department of Commerce
25 Ms. Ton Vanny Vice Director, Department of Labour and Vacational Training
26 Mr. Phorn Ratanak Department of Industry and Hadicraft
27 Mr. Vann Sokheng President FASMEC
28 Mr. Preap Sopheap Chamber of Commerce
29 Mr. Sok Proekpreang Chamber of Commerce
30 Mr. Chin Samnang Dry Shrimp Production
31 Mr. Chhun Sarom Bamboo Production
32 Ms. Vong Chanratana President ANP Drinking water
33 Mr. Ros Samnang FBP Drinking Water
34 Mr. Chea Thu Steam Fish
35 Mr. Ngy Channarin steam fish
36 Mr. Va Sokhan Seller Bestlife
Koh Kong Province
37 Mr. Iean Savan Vice Director Department of Industry and Handicraft
38 Mr. Sang Veasna Chief Office Department of Industry and Handicraft
39 Mr. Tieng Saret Chief Office, Department of Labour
40 Mr. Leng Bunthea Vice Chief Office, Department of Commerce
41 Mr. Koe Kimya Vince Director Chamber of Commerce
42 Mr. Pen Sokha Advicer Chamber of Commerce
43 Ms. Soh Sopheap Hengkea Import and Export
44 Mr. Chi Lyhieng Manager Koh Kong Fish Sauce
45 Ms. Sambath Romneath Reaksmey Phkaypich Drinking Water
46 Mr. Mer Sarat Ice Production
47 Mr. Sire Phorn SME
48 Mr. Sorn Kimtong Hatha Kasikor Microfinance
49 Mr. Pen Chansavoen ACLEDA Bank
50 Mr. Rin Sokha Prasac MFI
Kampong Chhnang
51 Mr. Tith Nan Director Department of Industry and Handicraft
52 Mr. Sar Piseth Cheif Officer
53 Mr. Prak Vutha Chief Officer Department of Commerce
54 Mr. Khat Samboeun Vice Chief Department of Commerce
55 Mr. Tep Sambath Prasac MFI
56 Ms. Mang Salon Vice President Bamboo Association

91
57 Ms. Lon Sokchoen Bamboo Association
58 Ms. Yung Sokha President Pottery Association
59 Mr. Sam Samnang Pottery Association
Pursat
60 Mr. Sen Saen Vice Director, Department of Commerce
61 Mr. Um Norm Chief Office, Department of Industry and Handicraft
62 Mr. Khoen Chanseiha Department of Industry and Handicraft
63 Ms. Hun Sophal Vice Director, Department of Culture
64 Ms. Kim Channary Chamber of Commerce
65 Ms. Su Khorn SME, Drinking water
66 Mr. Ik Sale Drinking water
67 Mr. Chea Bola Rice Miller
68 Mr. Oeng Veasna Rice Miller
69 Mr. Svay Pok SME stone carving
70 Mr. San Pov SME stone carving
71 Ms. Sao Sambath SME wood carving
Battambang
72 Ms. Ho Dany Vice Director, Department of Industry and Handicraft
73 Mr. Tim Bomrong Vice Chief Office Department of Industry
74 Mr. Yem Samart President Drinking water
75 Mr. Iea Bunhur Presidet Intri Mean Fish Sauce
76 Mr. Prak Chanthoeun Vice Director Phnom Meas Association
77 Mr. Ly Hot SMS Bread
78 Mr. Tieng Rasive Rice Miller
79 Mr. Kov Chinbung Meatball
80 Mr. Chan Senghong Grape Wine SME
81 Mr. Phal Sovann Microfinance LOLC
82 Mr. Thoen Thany SME
83 Mr. Kim Iem SME cake
84 Mr. Oun Sokun Balm Oil SME
85 Mr. Tit Vina Golden Company
86 Ms. Ly Leangly Chamber of Commerce
87 Ms. Doen Sokvon Chamber of Commerce
89 Ms. Vong Sokyem President Fish sauce
90 Mr. To Chanratana Sell AMK MFI
91 Mr. Chiv Kokchak President SME noodle
92 Mr. Pheach Seiha Vice President SME noodle
93 Mr. Rol Manmuy President Agriplanet
94 Mr. Soe Sophaly President SME noodle
Banteay Meanchey Province
95 Mr. Thong Thina Director, Department of Commerce
96 Mr. Dok Saroeung Department of Commerce
97 Me. Heng Sopheang Vice Director, Department of Industry and Handicraft
98 Mr. Sok sina Vice Chief , Department of Industry and Handicraft
99 Mr. Chun Narin Officer, Department of Labur
100 Mr. Kim Sopheap Chief Office, Department of Culture
101 Mr. Tim Sina Chamber of Commerce
102 Mr. Chhun Sophan Chamber of Commerce
103 Mr. Sok Sereimanot Sathabana Bank
104 Ms. Soy Khoun SME
105 Mr. Lon Sina Rice Miller
106 Ms. Ret Chanrit Weaver
107 Ms. Lon Samphors Wever
108 Ms. Dam Sreymom Silk worm producer
109 Mr. Yin Sarit SME stone carving
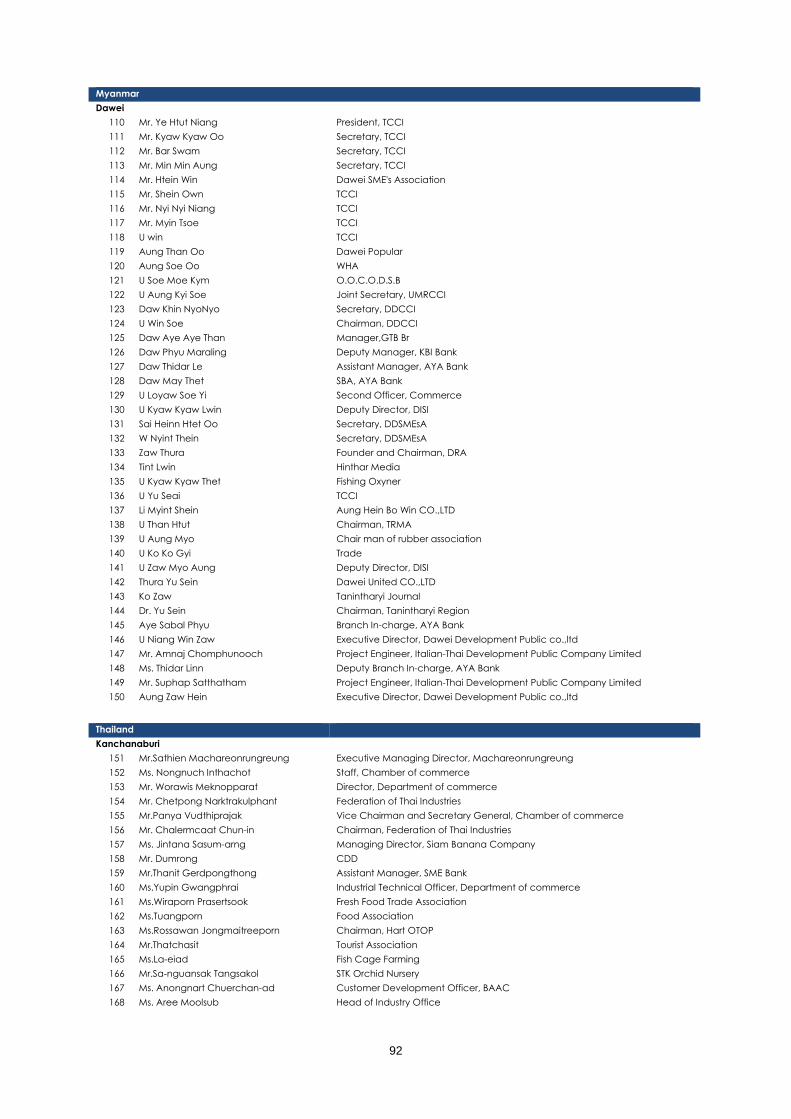
92
Myanmar
Dawei
110 Mr. Ye Htut Niang President, TCCI
111 Mr. Kyaw Kyaw Oo Secretary, TCCI
112 Mr. Bar Swam Secretary, TCCI
113 Mr. Min Min Aung Secretary, TCCI
114 Mr. Htein Win Dawei SME's Association
115 Mr. Shein Own TCCI
116 Mr. Nyi Nyi Niang TCCI
117 Mr. Myin Tsoe TCCI
118 U win TCCI
119 Aung Than Oo Dawei Popular
120 Aung Soe Oo WHA
121 U Soe Moe Kym O.O.C.O.D.S.B
122 U Aung Kyi Soe Joint Secretary, UMRCCI
123 Daw Khin NyoNyo Secretary, DDCCI
124 U Win Soe Chairman, DDCCI
125 Daw Aye Aye Than Manager,GTB Br
126 Daw Phyu Maraling Deputy Manager, KBI Bank
127 Daw Thidar Le Assistant Manager, AYA Bank
128 Daw May Thet SBA, AYA Bank
129 U Loyaw Soe Yi Second Officer, Commerce
130 U Kyaw Kyaw Lwin Deputy Director, DISI
131 Sai Heinn Htet Oo Secretary, DDSMEsA
132 W Nyint Thein Secretary, DDSMEsA
133 Zaw Thura Founder and Chairman, DRA
134 Tint Lwin Hinthar Media
135 U Kyaw Kyaw Thet Fishing Oxyner
136 U Yu Seai TCCI
137 Li Myint Shein Aung Hein Bo Win CO.,LTD
138 U Than Htut Chairman, TRMA
139 U Aung Myo Chair man of rubber association
140 U Ko Ko Gyi Trade
141 U Zaw Myo Aung Deputy Director, DISI
142 Thura Yu Sein Dawei United CO.,LTD
143 Ko Zaw Tanintharyi Journal
144 Dr. Yu Sein Chairman, Tanintharyi Region
145 Aye Sabal Phyu Branch In-charge, AYA Bank
146 U Niang Win Zaw Executive Director, Dawei Development Public co.,ltd
147 Mr. Amnaj Chomphunooch Project Engineer, Italian-Thai Development Public Company Limited
148 Ms. Thidar Linn Deputy Branch In-charge, AYA Bank
149 Mr. Suphap Satthatham Project Engineer, Italian-Thai Development Public Company Limited
150 Aung Zaw Hein Executive Director, Dawei Development Public co.,ltd
Thailand
Kanchanaburi
151 Mr.Sathien Machareonrungreung Executive Managing Director, Machareonrungreung
152 Ms. Nongnuch Inthachot Staff, Chamber of commerce
153 Mr. Worawis Meknopparat Director, Department of commerce
154 Mr. Chetpong Narktrakulphant Federation of Thai Industries
155 Mr.Panya Vudthiprajak Vice Chairman and Secretary General, Chamber of commerce
156 Mr. Chalermcaat Chun-in Chairman, Federation of Thai Industries
157 Ms. Jintana Sasum-arng Managing Director, Siam Banana Company
158 Mr. Dumrong CDD
159 Mr.Thanit Gerdpongthong Assistant Manager, SME Bank
160 Ms.Yupin Gwangphrai Industrial Technical Officer, Department of commerce
161 Ms.Wiraporn Prasertsook Fresh Food Trade Association
162 Ms.Tuangporn Food Association
163 Ms.Rossawan Jongmaitreeporn Chairman, Hart OTOP
164 Mr.Thatchasit Tourist Association
165 Ms.La-eiad Fish Cage Farming
166 Mr.Sa-nguansak Tangsakol STK Orchid Nursery
167 Ms. Anongnart Chuerchan-ad Customer Development Officer, BAAC
168 Ms. Aree Moolsub Head of Industry Office
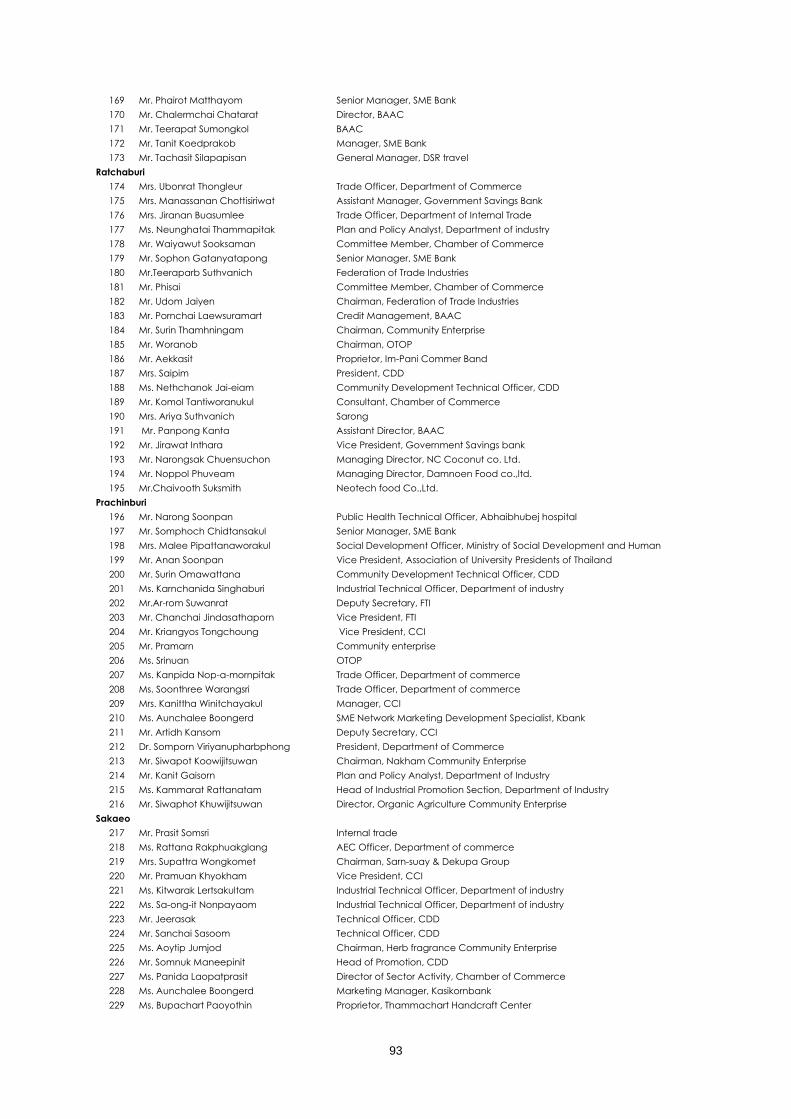
93
Ratchaburi
174 Mrs. Ubonrat Thongleur Trade Officer, Department of Commerce
175 Mrs. Manassanan Chottisiriwat Assistant Manager, Government Savings Bank
176 Mrs. Jiranan Buasumlee Trade Officer, Department of Internal Trade
177 Ms. Neunghatai Thammapitak Plan and Policy Analyst, Department of industry
178 Mr. Waiyawut Sooksaman Committee Member, Chamber of Commerce
179 Mr. Sophon Gatanyatapong Senior Manager, SME Bank
180 Mr.Teeraparb Suthvanich Federation of Trade Industries
181 Mr. Phisai Committee Member, Chamber of Commerce
182 Mr. Udom Jaiyen Chairman, Federation of Trade Industries
183 Mr. Pornchai Laewsuramart Credit Management, BAAC
184 Mr. Surin Thamhningam Chairman, Community Enterprise
185 Mr. Woranob Chairman, OTOP
186 Mr. Aekkasit Proprietor, Im-Pani Commer Band
187 Mrs. Saipim President, CDD
188 Ms. Nethchanok Jai-eiam Community Development Technical Officer, CDD
189 Mr. Komol Tantiworanukul Consultant, Chamber of Commerce
190 Mrs. Ariya Suthvanich Sarong
191 Mr. Panpong Kanta Assistant Director, BAAC
192 Mr. Jirawat Inthara Vice President, Government Savings bank
193 Mr. Narongsak Chuensuchon Managing Director, NC Coconut co. Ltd.
194 Mr. Noppol Phuveam Managing Director, Damnoen Food co.,ltd.
195 Mr.Chaivooth Suksmith Neotech food Co.,Ltd.
Prachinburi
196 Mr. Narong Soonpan Public Health Technical Officer, Abhaibhubej hospital
197 Mr. Somphoch Chidtansakul Senior Manager, SME Bank
198 Mrs. Malee Pipattanaworakul Social Development Officer, Ministry of Social Development and Human
Security 199 Mr. Anan Soonpan Vice President, Association of University Presidents of Thailand
200 Mr. Surin Omawattana Community Development Technical Officer, CDD
201 Ms. Karnchanida Singhaburi Industrial Technical Officer, Department of industry
202 Mr.Ar-rom Suwanrat Deputy Secretary, FTI
203 Mr. Chanchai Jindasathaporn Vice President, FTI
204 Mr. Kriangyos Tongchoung Vice President, CCI
205 Mr. Pramarn Community enterprise
206 Ms. Srinuan OTOP
207 Ms. Kanpida Nop-a-mornpitak Trade Officer, Department of commerce
208 Ms. Soonthree Warangsri Trade Officer, Department of commerce
209 Mrs. Kanittha Winitchayakul Manager, CCI
210 Ms. Aunchalee Boongerd SME Network Marketing Development Specialist, Kbank
211 Mr. Artidh Kansom Deputy Secretary, CCI
212 Dr. Somporn Viriyanupharbphong President, Department of Commerce
213 Mr. Siwapot Koowijitsuwan Chairman, Nakham Community Enterprise
214 Mr. Kanit Gaisorn Plan and Policy Analyst, Department of Industry
215 Ms. Kammarat Rattanatam Head of Industrial Promotion Section, Department of Industry
216 Mr. Siwaphot Khuwijitsuwan Director, Organic Agriculture Community Enterprise
Sakaeo
217 Mr. Prasit Somsri Internal trade
218 Ms. Rattana Rakphuakglang AEC Officer, Department of commerce
219 Mrs. Supattra Wongkomet Chairman, Sarn-suay & Dekupa Group
220 Mr. Pramuan Khyokham Vice President, CCI
221 Ms. Kitwarak Lertsakultam Industrial Technical Officer, Department of industry
222 Ms. Sa-ong-it Nonpayaom Industrial Technical Officer, Department of industry
223 Mr. Jeerasak Technical Officer, CDD
224 Mr. Sanchai Sasoom Technical Officer, CDD
225 Ms. Aoytip Jumjod Chairman, Herb fragrance Community Enterprise
226 Mr. Somnuk Maneepinit Head of Promotion, CDD
227 Ms. Panida Laopatprasit Director of Sector Activity, Chamber of Commerce
228 Ms. Aunchalee Boongerd Marketing Manager, Kasikornbank
229 Ms. Bupachart Paoyothin Proprietor, Thammachart Handcraft Center
169 Mr. Phairot Matthayom Senior Manager, SME Bank
170 Mr. Chalermchai Chatarat Director, BAAC
171 Mr. Teerapat Sumongkol BAAC
172 Mr. Tanit Koedprakob Manager, SME Bank
173 Mr. Tachasit Silapapisan General Manager, DSR travel
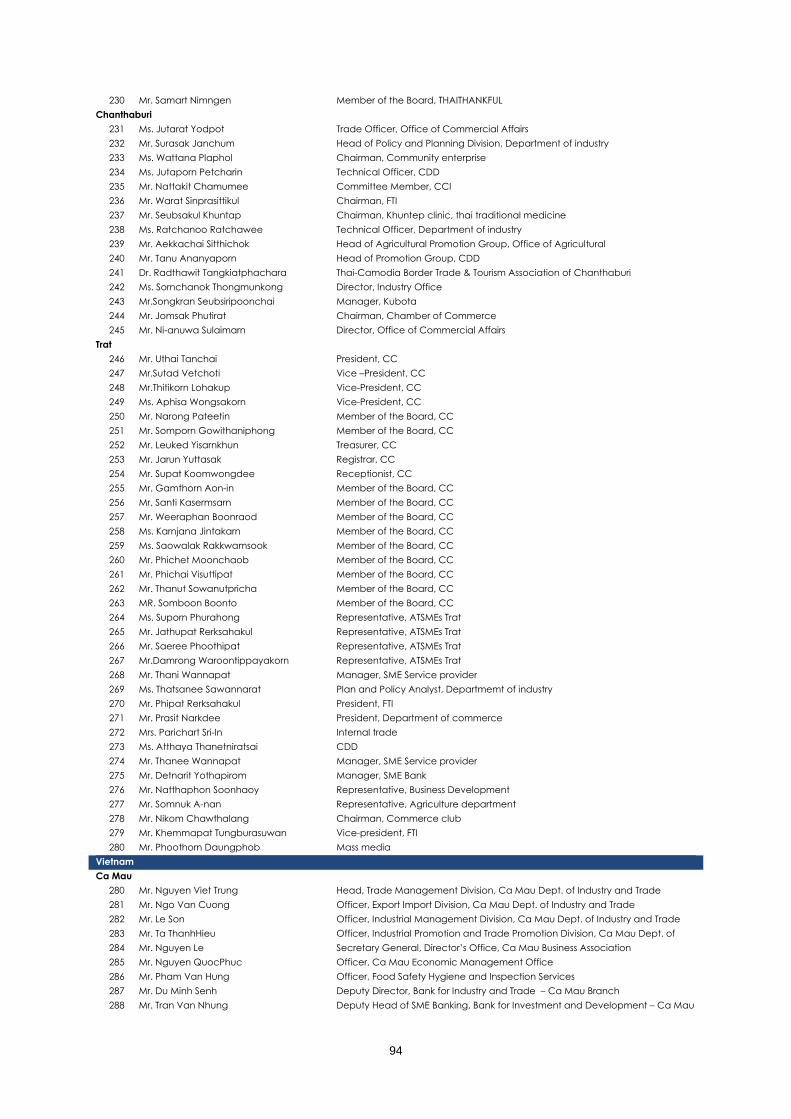
94
230 Mr. Samart Nimngen Member of the Board, THAITHANKFUL
Chanthaburi
231 Ms. Jutarat Yodpot Trade Officer, Office of Commercial Affairs
232 Mr. Surasak Janchum Head of Policy and Planning Division, Department of industry
233 Ms. Wattana Plaphol Chairman, Community enterprise
234 Ms. Jutaporn Petcharin Technical Officer, CDD
235 Mr. Nattakit Chamumee Committee Member, CCI
236 Mr. Warat Sinprasittikul Chairman, FTI
237 Mr. Seubsakul Khuntap Chairman, Khuntep clinic, thai traditional medicine
238 Ms. Ratchanoo Ratchawee Technical Officer, Department of industry
239 Mr. Aekkachai Sitthichok Head of Agricultural Promotion Group, Office of Agricultural
240 Mr. Tanu Ananyaporn Head of Promotion Group, CDD
241 Dr. Radthawit Tangkiatphachara Thai-Camodia Border Trade & Tourism Association of Chanthaburi
242 Ms. Sornchanok Thongmunkong Director, Industry Office
243 Mr.Songkran Seubsiripoonchai Manager, Kubota
244 Mr. Jomsak Phutirat Chairman, Chamber of Commerce
245 Mr. Ni-anuwa Sulaimarn Director, Office of Commercial Affairs
Trat
246 Mr. Uthai Tanchai President, CC
247 Mr.Sutad Vetchoti Vice –President, CC
248 Mr.Thitikorn Lohakup Vice-President, CC
249 Ms. Aphisa Wongsakorn Vice-President, CC
250 Mr. Narong Pateetin Member of the Board, CC
251 Mr. Somporn Gowithaniphong Member of the Board, CC
252 Mr. Leuked Yisarnkhun Treasurer, CC
253 Mr. Jarun Yuttasak Registrar, CC
254 Mr. Supat Koomwongdee Receptionist, CC
255 Mr. Gamthorn Aon-in Member of the Board, CC
256 Mr. Santi Kasermsarn Member of the Board, CC
257 Mr. Weeraphan Boonraod Member of the Board, CC
258 Ms. Karnjana Jintakarn Member of the Board, CC
259 Ms. Saowalak Rakkwamsook Member of the Board, CC
260 Mr. Phichet Moonchaob Member of the Board, CC
261 Mr. Phichai Visuttipat Member of the Board, CC
262 Mr. Thanut Sowanutpricha Member of the Board, CC
263 MR. Somboon Boonto Member of the Board, CC
264 Ms. Suporn Phurahong Representative, ATSMEs Trat
265 Mr. Jathupat Rerksahakul Representative, ATSMEs Trat
266 Mr. Saeree Phoothipat Representative, ATSMEs Trat
267 Mr.Damrong Waroontippayakorn Representative, ATSMEs Trat
268 Mr. Thani Wannapat Manager, SME Service provider
269 Ms. Thatsanee Sawannarat Plan and Policy Analyst, Departmemt of industry
270 Mr. Phipat Rerksahakul President, FTI
271 Mr. Prasit Narkdee President, Department of commerce
272 Mrs. Parichart Sri-In Internal trade
273 Ms. Atthaya Thanetniratsai CDD
274 Mr. Thanee Wannapat Manager, SME Service provider
275 Mr. Detnarit Yothapirom Manager, SME Bank
276 Mr. Natthaphon Soonhaoy Representative, Business Development
277 Mr. Somnuk A-nan Representative, Agriculture department
278 Mr. Nikom Chawthalang Chairman, Commerce club
279 Mr. Khemmapat Tungburasuwan Vice-president, FTI
280 Mr. Phoothorn Daungphob Mass media
Vietnam
Ca Mau
280 Mr. Nguyen Viet Trung Head, Trade Management Division, Ca Mau Dept. of Industry and Trade
281 Mr. Ngo Van Cuong
Officer, Export Import Division, Ca Mau Dept. of Industry and Trade
282 Mr. Le Son Officer, Industrial Management Division, Ca Mau Dept. of Industry and Trade
283 Mr. Ta ThanhHieu Officer, Industrial Promotion and Trade Promotion Division, Ca Mau Dept. of
Industry and Trade 284 Mr. Nguyen Le Secretary General, Director’s Office, Ca Mau Business Association
285 Mr. Nguyen QuocPhuc Officer, Ca Mau Economic Management Office
286 Mr. Pham Van Hung Officer, Food Safety Hygiene and Inspection Services
287 Mr. Du Minh Senh Deputy Director, Bank for Industry and Trade – Ca Mau Branch
288 Mr. Tran Van Nhung Deputy Head of SME Banking, Bank for Investment and Development – Ca Mau
Branch

95
289 Mr. Huynh Chi Thong Owner / Director, PhongPhu Shrimp Private Business
290 Mr. Le Minh Son Owner / Director, ThanhDat Private Business (Dried Shrimp)
Can Tho
291 Ms. Nguyen ThiNinhThuan Head, Import – Export Management Division, Can Tho Dept. of Industry and
Trade 292 Mr. Vo Quoc Hung Deputy Head, Industrial Management Division,
Can Tho Dept. of Industry and Trade
293 Ms. Phan Mai Hue Officer, Can ThoBusiness Association
294 Mr. Vo Thi Kim Cuong Head, Legal Office, Vietnam Chamber of Commerce and Industry
295 Mr. Tran XuanPhu Deputy Director, Vietnam Chamber of Commerce and Industry, Can Tho
Branch 296 Mr. Nguyen ToanQuoc Officer, Vietnam Chamber of Commerce and Industry, Can Tho Branch
297 Ms. Le ThiThanhHien Deputy Head of Inspection and Supervision Department, State Bank of Vietnam
– Can Tho Branch 298 Mr. Nguyen Minh TrungDuc Deputy Head of Investment Department, GENTRACO Corporation
299 Ms. Ho Thi Kim Loan Business Owner of ThangLoi 2 Private Business – Rice Miller for Export
300 Ms. LuuThiLan Vice-president of GENTRACO Corporation
301 Mr. Nguyen PhucLoc Deputy Director of Southern Fishery Industries Company Limited
KeinGiang
302 Ms. Le ThiNhut Deputy Director, Kien Giang Dept. of Industry and Trade
303 Mr. Cao Phuoc Son Deputy Head, Import – Export Management Division | DOIT
304 Mr. Huynh Minh Thiet Deputy Head, Trade Management Division
305 Ms. Le ThiThuy Tran Officer, Industrial Management Division | DOIT
306 Mr. Phan Dinh Manh Officer, Finance and Planning Division | DOIT
307 Mr. Nguyen GiaiPhong Director, Kien Giang Trade – Investment – Tourism Promotion Center
308 Mr. Tran ThanhKiet Head, Trade Promotion and SME Support Division
309 Mr. Bui Van Ho Vice-Chairman, KienGiangYoung Entrepreneur Association
310 Mr. Dang Thanh Hoa Head of SME Banking, Bank for Agriculture and Rural Development (VBARD) –
KienGiang Branch 311 Mr. Ma Thanh Tan Deputy Director, Bank for Industry and Trade – KienGiangBranch
312 Mr. Doan Hung Dung Deputy Director, KienGiang Import – Export Company
313 Mr. Bui Quoc Thai Deputy Director, Kien Giang Tourism Company
314 Mr. Vo Van Phung Head of Administrative Department, Kien Giang Brick and Tile Company
315 Mr. Nguyen Duc Hung Deputy Director of KTC Canned Foodstuff Manufactory (KTCFOOD)
316 Mr. Nguyen Ba Thuan Director of Shrimp Farm – Trung Son Seafood Joint Stock Company
Tay Ninh
317 Mr. Le Thanh Cong Director, Tay Ninh Department of Industry and Trade (DOIT)
318 Mr. Le Ngoc Thach Manager, Trade Promotion Center | DOIT
319 Ms. Bui ThiThuy Hang Head, Planning Division | DOIT
320 Ms. Le Kim Phuong Head, Industrial Management Division | DOIT
321 Ms. Le Thi My Dung Officer, Trade Management Division
322 Mr. Le Khanh Trinh Officer, Trade Promotion Center
323 Ms. Pham Thi Bich Van Office Administrator, Provincial Business Association
324 Mr. Cao Tan Trinh Deputy Director, Bank for Agriculture and Rural Development (VBARD) – Tay
Ninh Branch 325 Mr. Tong Duc Huong Head of SME Banking Department , VBARD Tay Ninh Branch
326 Ms. Phan Huynh Ngoc Vinh Head of SME Banking, Bank for Industry and Commerce – TayNinh Branch
327 Ms. Bui Thi Kim Hoa Deputy Director – Marketing, Tam Lan Tea 1-Member Co., Limited
338 Mr. Nguyen QuocTrung Deputy Director, Nam Phong Wine – Private Business
339 Mr. Hoang Van Thac Head of Planning and Sales Department, Yen Hung Cashew 1-Member Co., Ltd
340 Mr. Le ManhChuong Head of Planning and Sales Department, Lien Anh Rubber Company Limited
341 Ms. Trinh Ngoc Lan Director, HoaLan Foods Company Ltd (Cashew)
342 Ms. Pham Thi Thuy Linh Deputy Director, Dinh Khue Tapioca Starch - Private Business
343 Ms. PhanThiXuanTruc Sales Staff, Hung Duy Tapioca Starch Company Limited
344 Mr. Pham Dinh Thang Director General, ATM Advertisement – Television – Communication Company
Limited 345 Mr. Le CanhTinh Deputy Director, Hoa Viet Tobacco Joint Stock Company – TayNinh Branch
346 Mr. Nguyen Van Bay Head of Internal Control, Safe and Healthy Vegetable Cooperative
347 Mr. Dang Duy Phuong Cassava Farmer, PhuocVinh Commune, ChauThanh District, TayNinh
348 Mr. Nguyen Van Tung Cassava Farmer, PhuocVinh Commune, ChauThanh District, TayNinh
349 Mr. Duong Van Tuan Cassava Farmer, PhuocVinh Commune, ChauThanh District, TayNinh
350 Ms. Sam NguonNhat Director, of Sam Nhut Tapioca Starch, HoaHiep Commune, Tan Bien District,
TayNinh

96
Bibliography
Cambodia
1. "The Garment Industry in Cambodia: Its Role in Poverty Reduction through Export-Oriented Development",
Yamagata, T, 2006-06, IDE Discussion Paper No. 62, 2006.06
2. Preliminary Study on SME (Department of Trade and Investment Facilitation), Saing Sokh Sophal
3. SAU, Sisovanna 2012. " A Study on Cross-Border Trade Facilitation and Regional Development along Economic
Corridors in Cambodia" in Emerging Economic Corridors in the Mekong Region, edited by Masami Ishida, BC
Research Report No. 8, Bangkok Research Center, IDE-JETRO, Bangkok, Thailand
4. Challenges to Make Cambodian SMEs Participate in Global Value Chains: Towards Addressing Poverty and
Inequality, Hatsukano, N, and Tanaka, K
5. Sector Assessment (Summary): Private Sector and SME Development, Promoting Economic Diversification,
Subprogram 3 (RRP CAM 38421-072)
6. Cambodia Industrial Development Policy 2015 – 2025, royal Government of Cambodia, Approved on 06-Mar-
2015
7. Structural Policy Country Notes Cambodia, Economic Outlook for Southeast Asia, China and India 2014: Beyond
the Middle-Income Trap
8. “Economic Census of Cambodia – Provincial Report”, national Institute of Statistics; Ministry of Planning, Phnom
Penh, Cambodia; Supported by Government of Japan and Japan International Cooperation Agency (JICA),
February 2013
Myanmar
9. Tanintharyi Region Profile Updated: June 2014, UNHCR
10. http://www.mmsis.gov.mm/
11. UNIDO, Project number: SAP ID 120523, Project title: Fostering Pro-poor and inclusive SME development in
Myanmar, March 2013
12. Financing SMEs in Myanmar, IDE Discussion Paper 18, Aung Kyaw, April 2008
13. Preparatory Survey for the Integrated Regional Development for Ethnic Minorities in the South-East Myanmar,
Final Report, October 2013, Japan International Cooperation Agency (JICA)
14. Masato Abe and Madhurjya Kumar Dutta (2014). A New Policy Framework for Myanmar’s SME Development.
ARTNeT Working Paper Series No. 142, February 2014, Bangkok, ESCAP.
15. http://www.smedevelopmentcenter.gov.mm/
16. Small and Medium Enterprises Development Law (2015)
17. Small and Medium Enterprise Development Policy (2015)
18. Clustering and Supply Chain Strategy for Myanmar’s Small and Medium Manufacturing Industries Development:
A Focus on the Electronic and Electrical Industry, Aye Aye Kyuu and Tun Aung, Mekong Institute Working Paper
Series No. 06/2008
Thailand
19. An Assessment of SME Development in the Border Twin Cities of the GMS: A Case Study of Aranyaprathet, Sa
Kaeo Province, Thailand, Mekong Institute Research Working Paper Series No. 05/2009
20. BOI Policy Update, 01-Mar-2016, Duangjai Asawachintachit, Deputy Secretary General Office of the Board of
Investment
21. OSMEP Executive Summary, SMEs, Part 2 Chapter 4
22. Economic Mobility of Migrants in Kanchanaburi DSS, Thailand, Aree Jampaklay, Kim Korinek, Sindhu Ratchasee,
JOURNAL OF POPULATION AND SOCIAL STUDIES Volume 19 Number 1 July 2010
23. The Study on Development of Consulting Services to Promote SME Cluster and Regional Development in the
Kingdom of Thailand, Japan International Cooperation Agency (JICA) and Department of Industrial Promotion,
Ministry of Industry, The Kingdom of Thailand, October 2005
24. SME-Master-Plan-2-2010-11-Thailand
25. The Study on the Strengthening Mechanisms for the Regional SME Promotion and Consultancy Service Quality
Development In the Kingdom of Thailand, Japan International Cooperation Agency (JICA) and Department of
Industrial Promotion, Ministry of Industry, The Kingdom of Thailand, September 2011
26. Thailand Moving Ahead with Cluster Development, Presentation by Ms. Atchaka Sibunruang Minister of Industry
23 November 2015
27. The Potential of the “Thailand-Plus-One” Business Model, Keiichiro Oizumi, Pacific Business and Industries Vol. XIII,
2013 No. 50
28. Strengthening mutually beneficial cross border value chain (GVC) linkages Source: Abonyi and Zola (ADB,
2015); Abe et al (UNESCAP, 2013/14)
29. http://www.aecthaibiz.com/pcocaecreport/fm/factsheet.aspx
30. Government Officer’s Perceptions towards SMEs’ Needs of English for Thai-Myanmar Trade in Kanchanaburi
Province, Thailand, Singhanat Nomnian, Research Institute for Languages and Cultures of Asia, Mahidol
University, Thailand

97
Vietnam
31. The Participation of the Poor in Agricultural Value Chain: A Case Study of Cassava Discussion Paper, September
2005, Nguyen Do Anh Tuan, Luigi Cuna
32. AJIF-SEC_Market and Value Chain Mapping_Check List
33. Better Rice initiative to help Mekong farmers_Society_Vietnam News (16 Nov 2015), Vietnam News Article
34. Case Study_ Vietnam Crab Fishery Prototype Gains Buy-In at Critical Points in the Supply Chain, www.50in10.org
35. The Vietnamese seafood sector - A value chain analysis (Mar, 2012), Arie Pieter van Duijn, Rik Beukers, Willem
van der Pijl
36. Upgrading small-holders in the Vietnamese Pangasius value chain (ODI grant no. RO334), Nguyen Tri Khiem,
Simon R. Bush, Nguyen Minh Chau, Vo Thi Thanh Loc
37. Workshop on Improving Pitaya Production and Marketing_Value Chain1 www.fftc.agnet.org
38. Tran, T. C., X. S. Le and K. A. Nguyen (2008), ‘Vietnam’s Small and Medium Sized Enterprises Development:
Characteristics, Constraints and Policy Recommendations’’, in Lim, H. (ed.), SME in Asia and Globalization, ERIA
Research Project Report 2007-5, pp.323-364.
39. Vietnam Statistical Yearbook 2014 - General Statistical Office (GSO)
Top Related