VALUE CHAIN MAPPING AND MARKETING EFFICIENCY OF …
73
VALUE CHAIN MAPPING AND MARKETING EFFICIENCY OF COWPEA FARMERS IN CAPRICORN AND WATERBERG DISTRICTS OF LIMPOPO PROVINCE, SOUTH AFRICA by Christina Magosea Masegela MINI DISSERTATION Submitted in partial fulfilment of the requirements for the degree of Master of Science in Agriculture (Agricultural Economics) in the Faculty of Science and Agriculture (School of Agricultural and Environmental Sciences) at the UNIVERSITY OF LIMPOPO Supervisor: Prof I.B Oluwatayo 2019
Transcript of VALUE CHAIN MAPPING AND MARKETING EFFICIENCY OF …

VALUE CHAIN MAPPING AND MARKETING EFFICIENCY OF COWPEA FARMERS IN CAPRICORN AND WATERBERG DISTRICTS OF LIMPOPO
PROVINCE, SOUTH AFRICA
by
Christina Magosea Masegela
MINI DISSERTATION Submitted in partial fulfilment of the requirements for the
degree
of
Master of Science
in
Agriculture (Agricultural Economics)
in the
Faculty of Science and Agriculture
(School of Agricultural and Environmental Sciences)
at the
UNIVERSITY OF LIMPOPO
Supervisor: Prof I.B Oluwatayo
2019

i
DECLARATION
I, Christina Magosea Masegela declare that the mini-dissertation hereby submitted
by me to the University of Limpopo, for the degree Master of Science in Agriculture
(Agricultural Economics) has not previously been submitted by me for a degree at
this or any other university. This is my own work in design and execution, and that all
material contained herein has been duly acknowledged.
…………………………….. ………………………
Masegela C. M Date
ii
DEDICATION
This study is dedicated to my parents, for their never-ending support and words of
encouragement throughout my years of studying. To my siblings, my son and my
husband thank you for the love you have showed me.

iii
ACKNOWLEDGEMENTS
First and foremost, I would like to thank God almighty for giving me the strength and
courage to carry out this study, it was through His will and grace that I was able to
endure and soldier on. I would like to send my gratitude to my supervisor Professor
I.B Oluwatayo for his constant guidance and patience throughout this study. It was
not an easy road from the formulation of a research proposal until the report came all
together, I am forever grateful. I would like to thank the Water Research Commission
(WRC) for the funding they have provided me with to carry out this study. I would
also like to thank Professor J.A.N Asiwe who made sure that we were able to visit
the farmers in Ga-Molepo and Bela-Bela.
I would like to thank our HOD Dr J.J Hlongwane for his help in my data collection in
terms of making transport available when I needed it, for that I am grateful. To all the
staff in Agricultural Economics department, thank you for the lessons and knowledge
of agricultural economics you embedded in me. I would like to show my appreciation
to the following people who contributed a lot to the success of my data collection:
Sedima Seopa, Koketso Madimabe, Mary Sekgobela and Katlego Maimela, I’m
forever grateful for your help in interviewing the farmers.
I am mostly thankful and grateful to God for the parents that I have, Mr Josias
Molepana Masegela and Mrs Phuti Ruth Masegela. No amount of words can
describe how appreciative I am for your love, care and the opportunities you gave
me so I can have a better future than you had. You have truly showed me what
unconditional love is. You have been parents to both my son and me when I was not
there, he grew up to be a bright young man under your care and guidance and for
that, I’m eternally grateful. To my siblings, may God bless them abundantly and grant
them all their heart’s desires, family is everything.
I would like to thank my husband for his constant support, believing and never giving
up on me throughout all the years of my studies, may the good lord bless you in
everything you do. Last but not the least, I would like to send my sincere gratitude to
the farmers at Bela-Bela and Ga-Molepo for their tireless participation in this study,
this study would not be possible had it not been for them.

iv
ABSTRACT
Agriculture plays a significant role also serves as a critical economic sector in
Limpopo province in terms of its contribution to the economy, and the number of
employment opportunities it produces within local communities. The majority of
people involved in agricultural practices are emerging farmers and smallholder/small
scale farmers. These farmers try to earn a living from the production of livestock,
broilers, fruits & vegetables, and cereals. Cowpea is a drought-tolerant legume that
also serves as a staple food for the majority of Africans alongside maize and other
typical staple foods consumed by most Africans. The crop is regarded as a key
protein source for urban and rural poor, and plays an important role as a cash crop.
Despite several nutritional benefits, economic importance and welfare enhancing
potential of cowpea, farmers still do not have sufficient information on knowledge
about the value that can be added to their cowpea production also the potential and
competitiveness of this traditional leafy vegetable.
The aim of the study was to map the value chain and determine the marketing
efficiency of smallholder cowpea farmers in Capricorn and Waterberg districts of
Limpopo province. The specific objectives were to: identify and describe
socioeconomic characteristics of smallholder cowpea farmers in Capricorn and
Waterberg districts of Limpopo province, identify and define the participants along
the cowpea value chain and identify marketing constraints among smallholder
cowpea farmers. Structured questionnaire was used to collect data from 80
smallholder cowpea farmers in Ga-Molepo of Capricorn district and Bela-Bela of
Waterberg district using purposive sampling technique. Value chain mapping,
descriptive statistics and binary logistic regression model were used in addressing
the objectives.
In identifying and defining the participants along the cowpea value chain, a value
chain map was constructed to show the different stages cowpea goes through before
reaching the final consumer. Two null hypotheses were formulated. The first
hypothesis that stated smallholder cowpea farmers were inefficient in marketing
cowpea was rejected. Marketing efficiency measure used to determine each farmer’s
marketing efficiency revealed that 66% of smallholder cowpea farmers were efficient.
The determinants of marketing efficiency were examined using binary logistic
regression model. The second hypothesis stated that socioeconomic characteristics
of smallholder cowpea farmers have no effect on the marketing efficiency. The

v
hypothesis was also rejected based on binary logistic results that revealed that age,
household size, years in schooling, years in farming cowpea, income generated from
selling cowpea, quantities of cowpea sold and occupation of the farmers were found
to be significant in determining marketing efficiency of smallholder cowpea farmers.
Pests, lack of access to formal markets and lack of information on how to process
cowpea were major constraints farmers were faced with.
It was recommended that value chain analysts, policy makers and extension workers
together with other stakeholders assist in ensuring that food value chain
relationships are established so that market opportunities can be created for
smallholder cowpea farmers. In addition, farmer schools need to be introduced in
rural areas were agricultural practices are dominant. At these schools, farmers can
be taught about basic knowledge relating to agricultural production. Training should
also be given to farmers on adopting technology as it can potentially assist in making
production more efficient.

vi
TABLE OF CONTENTS PAGE
DECLARATION ..................................................................................................................... i
DEDICATION........................................................................................................................ ii
ACKNOWLEDGEMENTS .................................................................................................... iii
ABSTRACT ......................................................................................................................... iv
LIST OF TABLES ................................................................................................................ ix
LIST OF FIGURES ............................................................................................................... x
LIST OF ACRONYMS ......................................................................................................... xi
CHAPTER ONE .................................................................................................................... 1
INTRODUCTION .................................................................................................................. 1
1.1. Background............................................................................................................. 1
1.1.1. Cowpea production in Limpopo Province ......................................................... 1
1.1.2. Access to markets and agricultural food value chains ...................................... 2
1.1.3. Water scarcity and food security in South Africa .............................................. 3
1.2. Problem statement .................................................................................................. 5
1.3. Rationale for the study ............................................................................................ 6
1.4. Aim of the study ...................................................................................................... 6
1.5. Objectives of the study ............................................................................................ 6
1.6. Research hypotheses ............................................................................................. 6
1.7. Justification of the study .......................................................................................... 7
1.8. Organisation of the study ........................................................................................ 7
CHAPTER TWO ................................................................................................................... 8
LITERATURE REVIEW ........................................................................................................ 8
2.1. Introduction ............................................................................................................. 8
2.2. Definition of concepts .............................................................................................. 8
2.2.1. Small scale/smallholder farmers ...................................................................... 8
2.2.2. Value chain mapping ....................................................................................... 9
2.2.3. Marketing efficiency ....................................................................................... 10
2.3. Conceptual framework on cowpea production in South Africa ............................... 10
2.4. Cowpea production and consumption in other African countries and in the world . 13
2.5. Value chain and marketing of cowpea................................................................... 15
CHAPTER THREE ............................................................................................................. 17
RESEARCH METHODOLOGY ........................................................................................... 17
3.1. Introduction ........................................................................................................... 17
3.2. Study area ............................................................................................................ 17
3.3. Data collection ...................................................................................................... 20

vii
3.3.1. Sampling procedure ....................................................................................... 21
3.3.2. Data analysis ................................................................................................. 21
3.4. Analytical methods ................................................................................................ 21
3.4.1. Descriptive statistics ...................................................................................... 21
3.4.2. Value chain mapping ..................................................................................... 22
3.4.3. Marketing efficiency measure ........................................................................ 22
3.4.4. Binary logistic regression model..................................................................... 22
CHAPTER FOUR ............................................................................................................... 25
RESULTS AND DISCUSSION ........................................................................................... 25
4.1. Introduction ........................................................................................................... 25
4.2. Value chain mapping ............................................................................................ 25
4.2.1. Participants on the cowpea value chain and their roles at Ga-Molepo ........... 27
4.2.2. Participants and their roles on the cowpea value chain in Bela-Bela .............. 30
4.3. Marketing efficiency .............................................................................................. 31
4.4. Descriptive statistics of cowpea farmers in Ga-Molepo of Capricorn district and Bela-Bela of Waterberg district. ....................................................................................... 31
4.4.1. Age ................................................................................................................ 31
4.4.2. Household size (Number of people in the household) .................................... 32
4.4.3. Years in schooling ......................................................................................... 32
4.4.4. Years in farming ............................................................................................. 32
4.4.5. Income generated from selling cowpea .......................................................... 32
4.4.6. Gender of cowpea farmers ............................................................................. 33
4.4.7. Occupation of cowpea farmers ...................................................................... 33
4.4.8. Land ownership of cowpea farmers ............................................................... 34
4.4.9. Quantities of cowpea sold .............................................................................. 35
4.4.10. Formal market access of cowpea farmers ...................................................... 36
4.5. Results and discussion from binary logistic regression model ............................... 37
4.5.1. Age ................................................................................................................ 38
4.5.2. Household size .............................................................................................. 38
4.5.3. Years of schooling ......................................................................................... 39
4.5.4. Occupation of cowpea farmers ...................................................................... 39
4.5.5. Years of growing cowpea ............................................................................... 40
4.5.6. Quantities of cowpea sold .............................................................................. 40
4.5.7. Income generated from selling cowpea .......................................................... 40
4.6. Identifying marketing constraints among smallholder cowpea farmers. ................. 41
CHAPTER FIVE .................................................................................................................. 43
SUMMARY, CONCLUSION AND RECOMMENDATIONS ................................................. 43
viii
5.1. Introduction ........................................................................................................... 43
5.2. Summary .............................................................................................................. 43
5.3. Conclusion ............................................................................................................ 44
5.4. Recommendations ................................................................................................ 46
5.5. Areas of further research ...................................................................................... 47
REFERENCES ................................................................................................................... 48
APPENDIX A: QUESTIONNAIRE ...................................................................................... 56

ix
LIST OF TABLES
LIST PAGE
Table 3.1: Description of variables 24
Table 4.2: Frequencies and percentages of farmers being market efficient and inefficient 31
Table 4.3: Frequencies of some determinants and socioeconomic characteristics of
the sampled farmers 31
Table 4.4: Results from binary logistic regression model for examining the
determinants of marketing efficiency of cowpea farmers 37
Table 4.5: Constraints when producing, marketing and selling cowpea 41

x
LIST OF FIGURES
LIST PAGE
Figure 1.1: Southern Africa cereal production, 2013-2015 4
Figure 1.2: South Africa cereal production, 2013-2015 5
Figure 2.3: Value chain map of Hog meat in the Cayagan valley, Philippines 9
Figure 2.4: Different improved varieties of cowpea seeds 15
Figure 3.5: Limpopo province map 18
Figure 3.6: Capricorn district map (Polokwane municipality) 19
Figure 3.7: Waterberg district map (Bela-Bela municipality) 20
Figure 4.8: Value chain mapping of cowpea in Ga-Molepo 26
Figure 4.9: Value chain mapping of cowpea in Bela-Bela 29
Figure 4.10: Gender of the cowpea farmer 32
Figure 4.11: Occupation of cowpea farmer 33
Figure 4.12: Land ownership of cowpea farmer 34
Figure 4.13: Quantities of cowpea sold 35
Figure 4.14: Formal Market access of cowpea farmer 36
xi
LIST OF ACRONYMS
DAFF : Department of Agriculture, Forestry and Fisheries
FAO : Food Agriculture Organization
GDP : Gross Domestic Product
IDP : Integrated Development Plan
IITA : International Institute of Tropical Agriculture
LIM : Limpopo
LN : Natural Logarithms
ME : Marketing Efficiency
NFP : Net Price received by Farmers
SDC : Swiss Agency for Development and Cooperation
SSA : Sub-Saharan Africa
STATSSA : Statistics South Africa
TMC : Total Marketing Costs
TMM : Total Marketing Margin
WRC : Water Research Commission

1
CHAPTER ONE INTRODUCTION
1.1. Background
Cowpea is one of the most ancient crops known to humankind, with its centre of
origin being Africa. The crop has the ability to provide the earliest food for millions of
Africans during the hungry season before the cereals can mature for food
consumption (Black, 2015). Most farmers grow cowpea intercropped with other crops
such as maize and sorghum because of its ability to fix nitrogen, which is essential
for maize production in particular. The nutrients not only come from the pods, but
cowpea leaves can also be consumed to supplement staple food like maize meal.
The crop has various common names such as crowder pea, black eye pea, southern
pea, but all these names account for one scientific name of the crop being Vigna
Unguiculata (Mbene, 2005). Cowpea is a food and animal feed crop that originated
and was domesticated in Southern Africa. It is a warm season crop that is relatively
easy to grow in various types of soil, ranging from acid to alkaline and it is tolerant to
low soil fertility. These agronomical attributes make it possible for the crop to be
produced across a wide range of agro-ecological zones.
However, Singh et al (2003) argues that cultivating and storing the crop (cowpea)
comes with its challenges; insect pests are the biggest constraints and a problem
when it comes to cowpea production. Different obstacles such as drought and heat
limit high productivity. For some time now, research and production of cowpea in
South Africa has been neglected due to lack of improved varieties, knowledge of
good agronomic practices, availability of good seeds and the discouraging poor
marginal returns to farmers (Asiwe, 2009).
1.1.1. Cowpea production in Limpopo Province
Agriculture plays a significant role and also serves as a critical economic sector in
Limpopo province in terms of its contribution to the economy, and the number of
employment opportunities it produces within local communities as stated by Baloyi
(2010). To this day, agriculture remains to be highly labour intensive, and a source of
economic relief from poverty for the majority of people residing in rural areas in
Limpopo province.

2
The majority of people involved in agricultural practices are emerging farmers and
smallholder/small scale farmers. These farmers try to earn a living from the
production of livestock, broilers, fruits & vegetables, and cereals. Maize being the
most consumed staple food in Limpopo province and in South Africa as a whole
more especially in rural areas; it is the most grown cereal crop among emerging
farmers, smallholder/small scale and commercial farmers. The prices of both the
white and yellow maize have risen significantly during the extremely serious drought
conditions that fell upon the country in the year 2015/2016 (Limpopo Environmental
Outlook Report, 2016). As a result, South Africa was forced to import maize from
other countries. Cowpea is a drought-tolerant legume which also serves as a staple
food for the majority of African alongside maize, especially the rural poor.
Many people in Limpopo province, the rural poor in particular depend on producing
indigenous crops for their livelihood. Cowpea being regarded as one of the staple
food needed for consumption mainly because of its inexpensive source of protein
and the ability to survive in drought-prone areas, it is no wonder that it’s called the
“poor man’s meat”.
1.1.2. Access to markets and agricultural food value chains
Access to formal agricultural markets remains a challenge for smallholder farmers
more especially in rural areas. Besides poor infrastructural facility, the main reason
for this dilemma is that smallholder farmers do not have the most advanced
technology as commercial farmers do that will enable them produce the quantity and
quality of products needed to be marketable (Baloyi, 2010). For smallholder farmers
to enjoy the benefits of agriculture, they need sustainable markets where they can
take their produce after every harvest.
Food value chains and access to markets are interrelated in a sense that, more
value will be added to the products if formal markets are realised. The study done by
Swiss Agency for Development and Cooperation SDC (2013) emphasised that the
efforts of poor smallholder farmers to have better market access are often hindered
by factors such as insufficient information and poor linkages between different actors
along the value chains. Seville et al (2011) highlighted that agriculture remains to be
the only alternative and the best opportunity for the 1.5 to 2 billion people worldwide
residing in smallholder households to work and trade their way out of poverty.

3
Therefore, it is important and vital for smallholder farmers to have access to
sustainable markets; thereby increasing the food value chain of agricultural
commodities.
Access to formal markets will not only benefit the smallholder farmers participating,
but will also contribute to community development. Food value chains do not
comprise only the stakeholders directly involved in the production of products in
question, but smallholder farmers can also be involved in the value chains as wage
labourers in production and processing and also as providers in the service markets
that support value chains as further explained by Seville et al (2011). Thereby value
chain mapping is essential to understanding of markets, their relationships, the
participation of different actors and the critical constraints that limit the growth of
agricultural production and consequently the competitiveness of smallholder farmers.
1.1.3. Water scarcity and food security in South Africa
With water being a scarce resource at national level (South Africa, A water-scarce
country, 2011); drought-tolerant crops such as cowpea should be produced in
masses to ensure food security and minimal use of water. It is further highlighted that
the improvement of water conservation, water quality and water-use efficiency is of
key national priority.
Water plays a crucial part in the agricultural sector mainly because most crops rely
on irrigation for growth and sustainability; hence severe climatic conditions (be it
floods or droughts) are famers’ worst nightmare. Piesse (2016) explains that South
Africa is the region’s (Sub-Saharan Africa) largest food producer, therefore when
severe climatic conditions; in this case being drought, hit the country agricultural
production is decreased. It is further emphasised that if South Africa is to transition to
a new climate pattern, the feasibility of producing alternative food crops, the ones
that will require less water usage will need to be explored.
Cowpea, sorghum and millet are some of the cereal crops that are considered as
staple food as much as maize, rice and wheat are for most African countries and
worldwide. Unlike the latter mentioned crops; cowpea, sorghum and millet have
higher heat and drought tolerance and they can be the alternative cereal crops that
can be grown in this water crisis that the country is faced with.

4
Figures 1.1 and 1.2 below represent the comparison in production of crop cereals
that are mostly consumed in Southern Africa and South Africa from 2013-2015. The
years 2013-2015 are the ones taken into account because of the drought that
incurred during this time period.
Figure 1.1: Southern Africa Cereal Production, 2013-2015.
Source: Food Agriculture Organization as cited by Piesse (2016).
Between 2013 and 2015 wheat produced was more or less the same in both parts of
the continent, being about 2 million tonnes. However, drought had a great impact on
the production of rice in South Africa where it is evident that there was no production
during that time period. Based on the information given, it could possibly mean that
between 2013 and 2015; South Africa imported a lot of rice from other Southern
African countries. Coarse grain and total cereal crops were produced in much higher
tonnes as compared to wheat and rice during the same period.

5
Figure 1.2: South Africa Cereal Production, 2013-2015.
Source: Food Agriculture organization as cited by Piesse (2016).
Cowpea, sorghum and millet falls under the total cereal crops classification, and that
may possibly be the reason why total cereal crops yield was not too low despite the
serious drought that attacked the country.
1.2. Problem statement
According to Faith et al. (2014), cowpea is regarded as a key protein source for
urban and rural poor, and also plays an important role as a cash crop. Leafy
vegetable crops such as cowpea are considered to be food legumes since they are
consumed in most African countries because of its drought tolerance, inexpensive to
plant as well as to harvest. Most people especially the rural poor rely on this
indigenous leafy vegetable as a source of protein. A study done by Chagomoka et al.
(2014) has shown that traditional leafy vegetables have high market potential, and
contribute substantially to household incomes and nutrition. Despite several
nutritional benefits and welfare enhancing potential of cowpea, farmers still do not
have sufficient information on knowledge about the value that can be added to their
cowpea production, and also the potential and competitiveness of this traditional
leafy vegetable. There is therefore a need to understand the interaction of various
actors along the value chain of cowpea in order to understand the role of these
actors and improving the profitability and marketing efficiency of cowpea.
6
1.3. Rationale for the study
Chagomoka et al. (2014) states that few studies have been done on traditional leafy
vegetables value chains and related subjects in Southern Africa. Scientific research
previously gave less attention to research on traditional vegetables value chains.
Therefore, value chain mapping is important in identifying the different role players
along the chain and addressing constraints faced by these role players at different
node of the chain. With the new improved cowpea variety which is high yielding,
drought and pest resistant; cowpea farmers will be able to produce more. Most
smallholder farmers usually sell their produce just to have an income but do not take
into consideration all the costs incurred from production until the product gets to the
final consumer. This results in low bargaining power on the part of these farmers
because of lack of information with regard to marketing their produce.
1.4. Aim of the study
The aim of the study is to map the value chain and determine marketing efficiency of
smallholder cowpea farmers in Capricorn and Waterberg districts of Limpopo
province.
1.5. Objectives of the study
The specific objectives of the study are to:
i. Identify and describe socioeconomic characteristics of smallholder cowpea
farmers.
ii. Identify and define role players along the cowpea value chain.
iii. Determine marketing efficiency of smallholder cowpea farmers.
iv. Examine the determinants of marketing efficiency among cowpea farmers.
v. Identify marketing constraints among smallholder cowpea farmers.
1.6. Research hypotheses
i. Smallholder cowpea farmers are inefficient in marketing cowpea.
ii. Socioeconomic characteristics of smallholder cowpea farmers have no effect
on their marketing efficiency.

7
1.7. Justification of the study
The study was aimed at mapping the value chain of cowpea and determining the
marketing efficiency of smallholder cowpea farmers in the Capricorn and Waterberg
districts of Limpopo province. Smallholder farming forms part of an integral part in
creating jobs in the agricultural sector; however, this type of farming it’s not given
enough attention in order for it to progress.
Smallholder farmers in Ga-Molepo and Bela-Bela are successful in farming various
kinds of agricultural crops ranging from maize, sorghum, watermelons, butternuts,
cowpea and many other traditional agricultural crops. The farmers are passionate
about what they do since it is their way of surviving. Farmers in these areas are not
exposed to opportunities that will enable them to be even more successful in their
farming venture. Opportunities such as linking them to high-value formal markets;
Baloyi (2010) claims that in accessing high-value formal markets, smallholder
farmers need to be integrated into the value chain and be supported along the chain
so that they become competent.
1.8. Organisation of the study
This study comprises of chapter one, which is made up of the introduction outlining a
background of the study, problem statement, rationale for the study, aim, objectives
directing the study and the hypotheses. Theoretical reviews of issues related to the
study are presented in chapter two. Chapter three entails research methodology
employed in the study, which includes the description of the study area, data
collection procedures and analytical techniques used in analysis.
8
CHAPTER TWO LITERATURE REVIEW
2.1. Introduction
This chapter presents an overview of cowpea production, value chain mapping and
marketing efficiency of smallholder cowpea farmers in South Africa. Issues related to
this study such as definitions of smallholder farmers, value chain mapping, marketing
efficiency and other cowpea issues which are not only limited to South Africa will be
discussed in this chapter.
2.2. Definition of concepts
2.2.1. Small scale/smallholder farmers
Smallholder farmers are defined in many ways depending on the context, country
and even ecological zone; they are the drivers of many economies in Africa even
though their potential is often not brought forward. According to Department of
Agriculture, Forestry and Fisheries (2012), smallholder farmers are defined as those
farmers that own small-based plots of land on which they grow subsistence crops
and one or two cash crops relying almost entirely on family labour. The term
“smallholder” often is interchangeably used with “small-scale”. These farmers are
regarded as such, because of the limited resources and the not-so advanced
technologies they work with, but still produce enough for their own consumption and
income generation.
On the other hand, while some literature perceives smallholder or small-scale
farming as operating on small land; and not having adequate turnover Kirsten and
Van Zyl (1998) argue that defining a smallholder/small-scale farmer does not entirely
depend on the size of the land. However, the authors continue to highlight on the
contrary, smallholder/small-scale farmers who operate on a 1 hectare of irrigated
peri-urban land farming vegetables; have a higher profit potential than the 500
hectares of low quality land in the Karoo. Emphasis is not on the size of the land, but
rather the capability of what that land can produce.
Kirsten and Van Zyl (1998) further highlight that, mind-set of smallholder/small-scale
farmers is deep-rooted in South Africa, it is no wonder that smallholder/small-scale
were always considered in a negative light; and why smallholder/small-scale farming
in the country never really had a chance.

9
2.2.2. Value chain mapping
Kaplinsky and Morris (2001), defined value chain as a description of full range of
activities which are required to bring a product or a service from conception, through
the different phases of production which involves a combination of physical
transformation and input of various producer services to final consumers. Value
chain approach is a descriptive tool that shows the interactions between different
actors, making it important in knowing the major role players in bringing a product to
the final consumer. This helps in understanding the costs associated with the
product.
McComick and Schmitz (2001), on the other hand define value chain mapping as
creating visual representation of the connections between actors in value chain
analysis as well as other stakeholders. Value chain mapping is considered a
standard tool in value chain research and analysis. It helps in explaining and
understanding the process by which a product goes through before and until it
reaches the final consumer. One of the methods used to map a value chain is the
flow chart. It is said that a flow chart is an easier tool that is used to demonstrate the
several stages in the value chain by which a product goes through until it reaches
the final consumer.
Figure 2.3 below is an example of a value chain map in the Cayagan Valley, which
shows how a product moves from point of production to final consumption and all the
stakeholders involved in the process.
Figure 2.3: Value chain map of Hog meat in the Cayagan Valley, Philippines. Source: Perez (2014) as cited by Sumalde and Quilloy (2015)
Inbound logistics Production Outbound logistic
Sales and marketing
Inputs suppliers
Veterinary service provider
Backyard raisers
Contract growers
Commercial farms
Canvasser
Butcher
Wholesaler
Meat processor
Institutional buyers (Supermarkets food services industries) Retailers
Servicing: Support and extension services, technology upgrades

10
2.2.3. Marketing efficiency
Rit (2014) described marketing efficiency as the ratio of market output (satisfaction)
to marketing input (cost of resources). An increase in this ratio represent increased
efficiency, a decrease denotes low efficiency. Furthermore, Sumalde and Quilloy
(2015), emphasised that efficiency is one of the most important goals in agricultural
and food marketing as it directly affects food security, particularly the economic and
physical access to food households. It is important that the farmers are efficient in
marketing their products; this will ensure that they have a greater marketing margin.
Pabuayon et al. (2014) as cited by Sumalde and Quilloy (2015), highlighted that
efficient and effective flow of food from production point (farmers) to consumption
point (consumers) can facilitate the availability, accessibility and affordability of
adequate food to consumers.
Marketing efficiency can benefit all the key actors in a market chain. An efficient
marketing system is achieved when the resulting marketing costs (including losses)
are minimized and profits of market intermediaries are reasonable; meaning that the
marketing margin is just enough to cover the costs of marketing services.
2.3. Conceptual framework on cowpea production in South Africa
Agriculture in South Africa is important in alleviating poverty through creation of jobs
and income generation. Leafy vegetables farming can be crucial to the economic
growth of the country in a sense that food security can be guaranteed. Hlungwani
(2011) emphasises that about 90% of the population of South Africa relies on
agriculture for their livelihoods. Severe climatic conditions such as drought can
hamper the agricultural production especially for smallholder farmers, making it
impossible for them to harvest, to sell and for own consumption. Cowpea is a
drought tolerant crop that is essential for maize production. Most smallholder farmers
during the planting season, they intercrop cowpea with maize and sorghum, mainly
because of nitrogen fixing cowpea holds. Cowpea intercropped with sorghum in a
strip cropping method, which believed to allow a better management of the crops
than the broadcasting method and therefore have high yields.
South Africa being a water-scarce country as it is, there is a need to promote the
utilization of traditional heat-drought-tolerant crops (Hlungwani, 2011). However,
traditional leafy vegetables such as cowpea are amongst drought tolerant crops

11
which are least researched and given attention to. Unlike maize, in South Africa
cowpea is considered a subsistence crop, whereas in other African countries it is
produced in masses. Due to lack of quality seeds, farmers have no other alternative
but to carry on planting cowpea seeds with low production, late maturing and prone
to insects (Asiwe, 2009). This therefore limits cowpea to be produced in high
quantities. As compared to Nigeria, in South Africa domestic utilization of cowpea is
poor because production is still at subsistence level under smallholder farmers.
Currently, in Limpopo province the leaves from cowpea are harvested fresh, and
consumed as green leafy vegetable and dried for future use (Asiwe, 2009).
A study done by Van Rensburg et al. (2007), showed the importance of leafy
vegetables as protein enriching also as a way of ensuring food security. The study
focused on different leafy vegetables consumed in South Africa, cowpea included.
The authors further highlighted that the leafy vegetable dishes can be prepared from
a single species or from a combination of different species of leafy vegetables. It is
believed that preparing the combination of different species adds more taste to these
leafy vegetables than when it is prepared as a single species. However, cowpea
unlike other leafy vegetables is prepared as a single species, but can be mixed with
other ingredients such as tomatoes and onions to enhance its taste.
Van Rensburg et al. (2007) maintained that, South Africa possesses a huge diversity
of indigenous food crops, which includes grains, leafy vegetables and wild fruit types.
Major production areas for cowpea in South Africa are Limpopo, Mpumalanga, North
West and Kwa-Zulu Natal provinces. This is mainly because these provinces are
characterized by hot and dry climatic conditions and good rainy seasons making
cowpea to mature well. The rural poor in these provinces rely on indigenous leafy
vegetables such as cowpea (Vigna Unguiculata L.), young pumpkin leaves and
spider flower (Cleome gynandra L.) for food security. In most cases, these
vegetables are consumed as relish with maize meal and other staple food.
In South Africa, the preparation and consumption of cowpea is only limited to boiling
the leaves (dried or fresh) and eaten as relish or cook the pods. Other African
countries such as Nigeria, also the largest producer of cowpea have extensive
knowledge on how to prepare different dishes from cowpea. According to IITA (2011)
as cited by Coker et al. (2014), Nigeria is the largest producer and consumer of
cowpea both in West Africa and in the world. It was noted that cowpea has a wide

12
role in contributing to food security, income generation and sustainable environment
for millions of smallholder farmers in the region (Tarawali et al. 2002) as cited by
(Coker et al. 2014). Presently, cowpea production is still at subsistence level in
South Africa and the largest producer of cowpea Nigeria included. In Niger state, like
in other parts of Nigeria cowpea is currently produced by smallholder farmers using
basic implements (Coker et al. 2014).
Most studies in South Africa done on cowpea focus more on the agronomic part of
the crop rather than its economic importance. A study done by Asiwe (2009),
highlighted that lack of sound knowledge of effective agronomic practices, absence
of good seeds for planting and discouraging marginal returns to farmers; further
worsen the limitations to cowpea production in some provinces more especially Kwa-
Zulu Natal, Limpopo and Mpumalanga. Although it is important to have the right
seeds that will ensure maximum yield, it is important to realise the crucial part
processing and profitability of cowpea can be to farmers. Cowpea seed is the most
important part of the cowpea plant for human consumption. Van Rensburg et al.
(2007), emphasised that the seeds are usually harvested and dried for storage and
consumption at a later stage, either after cooking completely or after being milled
into a flour product used in various recipes. Farmers can be able to generate more
income from cowpea seeds also in the processed form.
Cowpea is not only important for human consumption, but also for animal ingestion.
Tarawali et al. (1997; 2002) highlighted that cowpea also serves as an important
source of high quality hay for livestock feed. Several studies can attest to the fact
that cowpea also serves as an important source of protein for animals, being an
essential particularly to layer chickens. This is evidenced by Hlungwani (2011),
indicating that cowpea can be an excellent source of protein component in animal
nutrition especially where conventional plant proteins are in short supply and highly
priced. The author focused on the importance of protein intake from cowpea in layers
and the quality of the egg thereafter. Hlungwani (2011) further emphasised that the
conventional dietary feedstuffs fed to layer chickens consists of maize and soya
beans as the main energy and protein sources. However, maize and soya beans are
considered as staple foods and consumption of these two by both humans and
animals, can lead to scarcity of the crops making it expensive for the smallholder
farmers to purchase. Thereby identification of alternative readily available sources of

13
protein is of great value to producers. Cowpea, known to be drought-tolerant and an
important source of protein to most rural poor and the ability to fix nitrogen seems to
be a valuable solution for smallholder livestock farmers.
2.4. Cowpea production and consumption in other African countries and in the
world
Hallensleben (2009) explains cowpea as an important food legume and its use as a
leafy vegetable is vital in many African countries. Drought-tolerance, short growing
period and its multipurpose use make cowpea an attractive alternative for farmers
who cultivate in marginal, drought-prone areas with low rainfall and less developed
irrigation systems; where infrastructure, food security and diminishing malnutrition
are major challenges. Cowpea is an ancient crop, which its origin and domestication
occurred in Africa. Its importance to human nutrition made it to be recognised
throughout the world; however, cowpea production still dominates in Africa with 68%,
Brazil 17%, rest of the world 10%, Asia at 3% and lastly the United States with 2%
(Gómez, 2004). Regardless of where in the world the crop is produced, it is still
consumed in the same manner. Coker et al. (2014), adds that cowpea is cultivated
as a vegetable, which means that it can be eaten as leafy green vegetables, green
pods, shelled dried peas and fresh shelled green peas; and it is significant as animal
feeds as well.
As compared to other African countries that produce cowpea and the world as a
whole, Nigeria remains the largest producer and consumer of cowpea (IITA, 2011).
According to Faye et al. (2004), as cited by Faith et al. (2014), nearly every
developing country has some chronic protein deficiency and there has been reported
cases of malnutrition and deaths of infants attributed to deficiency, therefore
increasing consumption of food rich proteins such as cowpea which is affordable for
many of the rural poor is vital. With that being highlighted, cowpea as basis for
inexpensive source of protein provides the cheapest supplement to the urban and
rural poor in Nigeria (Faith et al. 2014). Akibode (2011), further emphasises on a vital
role cowpea plays as a source of livelihood for millions of people in west and central
Africa. The author further adds that cowpea contributes to the sustainability of
cropping systems and soil fertility improvements in marginal lands by providing
ground cover which provides moisture (important in more drier regions), fixing
nitrogen and suppressing weeds.
14
Studies done by Sawadogo et al. (1985), Diehl and Sipkins (1985), Mortimore et al.
(1997), Blade et al. (1997) as cited by Akibode (2011), highlighted that in most
countries (African countries in particular) cowpea yields are low due to the use of low
yielding traditional varieties, poor soil fertility, unfavourable weather and insect pests
and diseases. However, Akibode (2011) stands to argue that over the past 14 years
cowpea yields have shown a positive trend in all of the sub-region of Sub-Saharan
Africa. This may have been attributed to the adoption of improved varieties of
cowpea in major producing countries in Sub-Saharan Africa. Akibode (2011), further
goes on to indicate that, in 2009 the adoption rate of these improved varieties in
some western African countries was estimated to be as high as 82%, 70%, 60%,
38%, 27% and 10% in Ghana, Cameroon, Niger, Nigeria, Senegal and Burkina Faso
respectively. This shows that improved varieties of cowpea had significant impact on
production of cowpea. Chadha et al. (2008), as cited by Chagomoka et al. (2014),
adds that vegetable cultivar and breeding research has significant national priority in
Malawi. Major research objectives in the horticulture sector in Malawi are to address
increased availability of high yielding cultivars; adaptability of improved cultivars to
both pest and disease resistance and heat tolerance, improvement of soil fertility,
good on-farm agricultural practices and minimization of post-harvest losses.
The green leaves of cowpea are also prepared like spinach and can be consumed
with pap (maize meal) or rice. Several authors have emphasised on the importance
of cowpea as a food legume for both human and animal consumption, as every
component of the plant can be consumed.
Figure 2.4 below demonstrates different varieties of matured cowpea seeds, which
are some of the high yielding varieties of cowpea. Coulibaly and Lowenberg-DeBoer
(2014) emphasised that the reason behind varied use of cowpea technologies is the
profitability of the legume. Since cowpea in most countries is being grown in
subsistence farming systems, farmers are able to benefit a lot from producing on
smaller areas of land. However, even though improved varieties have proven to be
more profitable than the local varieties, cropping practices and management still play
major role in ensuring high yields of cowpea (Coulibaly and Lowenberg-DeBoer,
2014).

15
Figure 2.4: Different improved varieties of cowpea seeds
Source: Gómez, 2014.
2.5. Value chain and marketing of cowpea
Cowpea is an important stable food, affordable and cheap protein source to rural and
urban dwellers worldwide (Faith et al., 2011). Domestic production of cowpea is
mostly done in rural areas by smallholder farmers who most of the times obtain low
yields due to the subsistence level of production characterized by lack of improved
technologies, inputs and agronomic practices. Although cowpea is produced by
smallholder farmers at a subsistence level, they still harvest enough to be marketed.
Marketing of cowpea in countries like Nigeria remains one of the most lucrative
businesses engaged in by most agricultural produce merchants, reason being that
the crop has high economic value (Faith et al., 2011). According to Weinberger and
Lumpkin (2007) as cited by Chagomoka et al., (2014), even though vegetable
production in the Eastern and Southern Africa constitute only a small share of the
arable land area, it has the potential to be highly profitable, provide employment
opportunities and generate income. However, to understand this potential; farmers
and other value chain actors must improve the competitiveness of their vegetable
production and marketing commodities to increase market share and profits
(Chagomoka et al., 2014).

16
Value addition to cowpea can improve the livelihoods of farmers and increase their
income generation. Farmers will be able to sell their cowpeas also in the processed
form, thereby increasing the market in which they are selling their produce. This is
evidenced by Mzeyece (2010), stating that if local cowpea production increased,
there was every possibility that marketers could get cowpeas at lower prices and
makes more money; consequently, with increased market participation, all actors in
the cowpea value chain are likely to have increased returns to their sales. However,
the unequal distribution of agricultural inputs such as land, farm assets, support
service, market access, infrastructure and income that persists in South Africa
(Matsane and Oyekale, 2014) hampers the growth of smallholder farmers’
businesses. The majority of smallholder farmers in South Africa lack the adequate
marketing facilities, of which when they do exist; they are completely
underdeveloped and inefficient (Adeleke et al., 2010) as cited by (Matsane and
Oyekale, 2014).
Matsane and Oyekale (2014), further highlights that marketing plays a critical role in
meeting the overall goals of economic development, food security, poverty alleviation
and sustainable agriculture, especially among smallholder farmers in developing
countries. Marketing constraints are attributed to a number of factors such as
knowledge and use market information, high transactional costs, distance from the
markets, poor quality of products, lack of financial support (Antwi and Seahlodi,
2011) as cited by Matsane and Oyekale, 2014). These marketing constraints can
constitute a paramount obstacle for smallholder farmers when it comes to marketing
their products efficiently.

17
CHAPTER THREE RESEARCH METHODOLOGY
3.1. Introduction
This chapter is aimed at describing the study areas, to explain the methods used in
data collection and research techniques used to analyse data. The aim of the study
was to map the value chain of cowpea also determine the marketing efficiency of
smallholder/small-scale cowpea farmers in Capricorn and Waterberg districts of
Limpopo province. A value chain map was used to illustrate the different stages
cowpea goes through before reaching the final consumer; and in determining the
determinants of marketing efficiency, the binary logistic regression model was used.
Marketing efficiency measure by Acharya and Agarwal (2001) was used to check
how efficient cowpea farmers are in the two locations.
3.2. Study area
Limpopo province is the fifth largest province in South Africa in terms of population
size, with 5.8 million people living in the province (Limpopo community survey,
statssa 2016). There are nine provinces in South Africa; Limpopo province, Gauteng,
Kwa-Zulu Natal, Mpumalanga, North-west, Northern Cape, Western Cape, Eastern
Cape and the Free-state province (Limpopo community survey, statssa 2016).
Limpopo province is situated at the northern part of the country and shares borders
with Zimbabwe, Mozambique and Botswana. The province was formerly known as
Northern Transvaal, then the Northern Province, which was in 2002 changed to
Limpopo province. It was named Limpopo province after the Limpopo River, which
forms the border between South Africa and Zimbabwe. The capital city of Limpopo
province is Polokwane, formerly known as Pietersburg; which was changed the
same time as the name change of the province.
Limpopo province covers an area of 125 755 km2 which is about 10.3% of the
country’s total area (Limpopo province, an overview 2017) which explains the
province being the 5th largest in the country in terms of population size. The most
spoken languages in the province are Sepedi, Xitsonga and Tshivenda with 52,9%,
17% and 16,7% respectively. Limpopo is comprised of five districts which are;
Capricorn District, Waterberg District, Sekhukhune District, Mopani District and
Vhembe District; and within these districts there are local municipalities (Limpopo
Province, an overview 2017).

18
Figure 3.5: Limpopo province map
Source: Limpopo Department of Transport, 2015.
Capricorn District is divided into five local municipalities, which are Aganang,
Blouberg, Lepelle-Nkumpi, Molemole and Polokwane. Polokwane Local municipality
covers only 3% of the total of Limpopo province, however over 10% of the population
resides within its boundaries (Polokwane city, history of Limpopo. 2017). Polokwane
municipality serves as the economic hub of the province and has the highest
population density in the Capricorn District. Polokwane in Northern Sotho means
“place of safety”. Ga-Molepo village is a rural community, which falls under
Polokwane local municipality. Ga-Molepo is situated South-West of Polokwane city;
about 50 km from the city (Kganyago, 2008). Ga-Molepo translated in English means
“place of relaxation”. Ga-Molepo is amongst the poorest areas in Polokwane
municipality, which makes it practical for the majority of the population to be involved
in subsistence agriculture (Chaminuka et al., 2006).

19
Figure 3.6: Capricorn District map (Polokwane Local Municipality)
Source: Municipalities, 2017.
Waterberg is one of the districts in Limpopo province. The district is situated in the
western part of Limpopo province and is considered the largest district in the
province (Phala, 2015) with more local municipalities than any other district in the
province. However, Waterberg district is the least when it comes to the largest share
of households in the province as compared to other districts (Limpopo Community
Survey, statssa. 2016). Waterberg district is comprised of six local municipalities,
namely: Bela-bela, Lephalale, Modimolle, Mogalakwena, Mookgopong, and
Thabazimbi. Bela-bela is one of the local municipalities in Waterberg district formerly
known as Warmbad, of which the name change happened the same time Northern
Province was changed to Limpopo province in 2002. Bela-bela local municipality
covers an area of 4000 km2 of 49 504 km2 of the entire Waterberg district (Limpopo
Community Survey, statssa. 2016). It is further highlighted that the population in the
local municipality is estimated at 76 296, which is reasonable considering that the
municipality is the smallest in the district. The local municipality is on the
Southwestern part of the Waterberg district and shares borders with Gauteng,
Mpumalanga and North-West. The main economic sectors, which contribute

20
substantially to the district’s Gross Domestic Product (GDP), are Agriculture and
Tourism (Bela-Bela-local-municipality, 2017) especially given the fact that the district
is predominantly rural. The temperature in Bela-Bela is generally a hot semi-arid
climate, with average rainfall of 600-650 mm, the highest measurements occurring in
January to December (Bela-Bela Local Municipality, IDP 2016). The climate in the
area is suitable for agricultural production such as maize, sorghum and cowpea,
which are produced between November and January where much of the rainfall is
expected.
Figure 3.7: Waterberg District map (Bela-Bela Local Municipality)
Source: Municipalities, 2017.
3.3. Data collection
Primary data was collected from farmers producing cowpea. The Information was
collected by means of face-to-face interviews, using a structured questionnaire. The
questionnaire focused on individual farmers, and the questions were based on
finding out about the socio-economic factors, cowpea production, other crops
production, quantities of cowpea sold and cowpea value chain amongst other
variables.

21
3.3.1. Sampling procedure
A sample size of 80 cowpea farmers was used in this study. A purposive sampling
technique was used to identify farmers in this study. Purposive sampling is a non-
probability sampling technique, which is a deliberate choice of an informant due to
the qualities an informant possesses. (Tongco, 2002). Bernard 2002, Lewis and
Sherpard 2006 as cited by (Tongco, 2002) further explains that with purposive
sampling, the researcher decides what needs to be known, and sets out to find
people who can and are willing to provide the information by virtue of knowledge or
experience. Therefore, the study areas were chosen on the basis that the farmers in
the area were representative of what the study was aimed at, particularly given the
fact that all the farmers were producing cowpea.
3.3.2. Data analysis
Data was captured and analysed using SPSS 24.0. Binary logistic regression
analysis was used for defining the determinants of marketing efficiency of cowpea
farmers. In determining whether the cowpea farmers were market efficient or not,
marketing efficiency measure was used for calculations. For descriptive statistics;
mean, averages and frequencies were calculated, pie charts and bar charts were
also used to describe the socioeconomic characteristics of smallholder cowpea
farmers at Ga-Molepo and Bela-Bela areas.
3.4. Analytical methods
The study applied three methods in analysis of data as per the main objectives. In
describing the socioeconomic characteristics of cowpea farmers, descriptive
statistics in the form of charts, frequencies and mean/averages were used. In
identifying and defining the role players along cowpea value chain, a value chain for
cowpea was constructed. Marketing efficiency measure was used in determining the
marketing efficiency of smallholder cowpea farmers. Lastly, binary logistic regression
model was used to examine the determinants of marketing efficiency.
3.4.1. Descriptive statistics
Descriptive statistics in the form of mean, frequencies, pie charts and bar charts was
used to describe the socioeconomic characteristics of cowpea farmers in Capricorn
and Waterberg districts.

22
3.4.2. Value chain mapping
To identify and define role players along the cowpea value chain, a value chain map
in the form of a flow chart was constructed. A flow chart is an easier tool to use in a
sense that it can demonstrate a number of stages in the value chain by which a
product goes through before it reaches the final consumer.
3.4.3. Marketing efficiency measure
According to Rit (2014), marketing efficiency is the ratio of market output
(satisfaction) to marketing input (cost of resources). An increase in this ratio
represents increased efficiency, and a decrease denotes low efficiency. Therefore, in
analysing if the farmers are efficient or not in marketing their cowpeas, the costs of
resources employed has to be less than the output produced from the limited
resources.
Therefore, marketing efficiency can be measured by using the marketing efficiency
measure. This method for measuring marketing efficiency was given by Acharya and
Agarwal (2001). The method is known for its simplicity in calculating marketing
efficiency and ease of interpretation.
The method is given by:
ME = NFP
TMC+TMM
Where ME = Marketing Efficiency, NFP =Net Price Received by Farmers, TMC =
Total Marketing Cost, TMM = Total Marketing Margin.
For a farmer to be efficient in marketing, ME = > 1 indicates efficiency and <1 shows
inefficiency (Longwe et al., no date available. Date accessed: 03-02-2016).
3.4.4. Binary logistic regression model
To examine the determinants of marketing efficiency, binary logistic regression
model was used. Logistic regression is a statistical method used to predict a
categorical (usually dichotomous) variable from a set of predictor variables
(Wuensch, 2015). With this model, there can be one or more independent variables
that determine the outcome, where there are only two possibilities for the outcome.
23
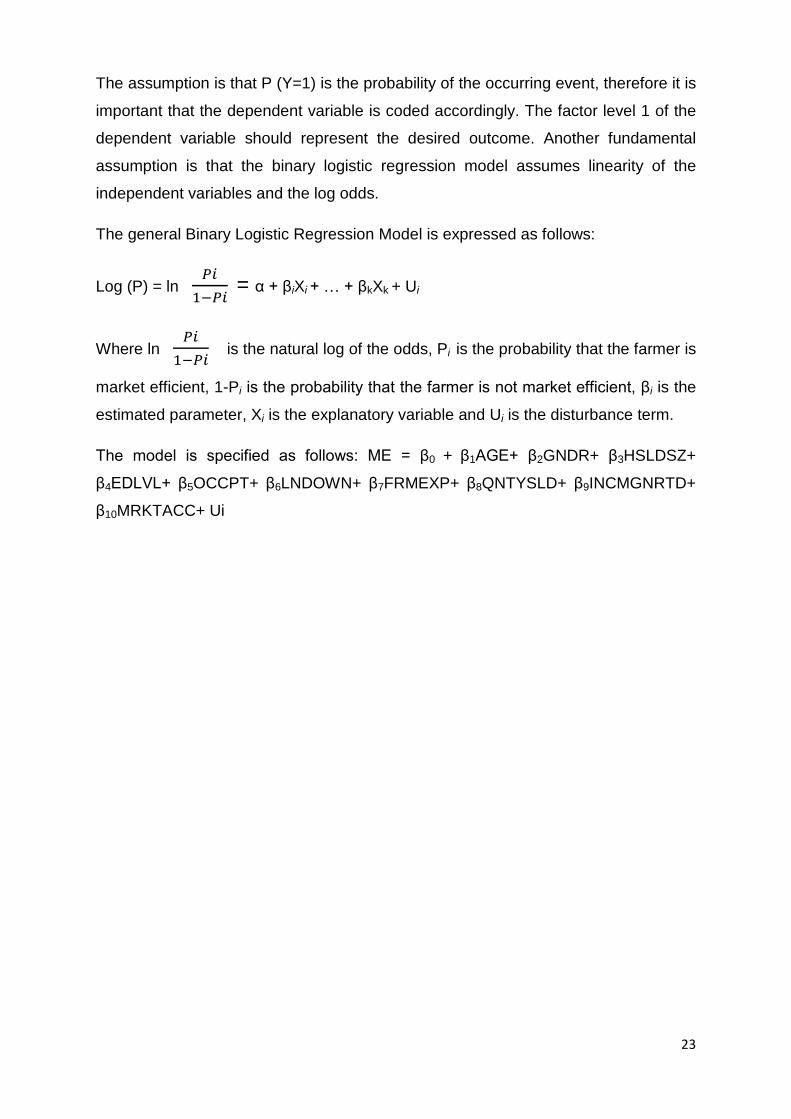
The assumption is that P (Y=1) is the probability of the occurring event, therefore it is
important that the dependent variable is coded accordingly. The factor level 1 of the
dependent variable should represent the desired outcome. Another fundamental
assumption is that the binary logistic regression model assumes linearity of the
independent variables and the log odds.
The general Binary Logistic Regression Model is expressed as follows:
Log (P) = ln ( 𝑃𝑃1−𝑃𝑃
)= α + βiXi + … + βkXk + Ui
Where ln ( 𝑃𝑃1−𝑃𝑃
) is the natural log of the odds, Pi is the probability that the farmer is
market efficient, 1-Pi is the probability that the farmer is not market efficient, βi is the
estimated parameter, Xi is the explanatory variable and Ui is the disturbance term.
The model is specified as follows: ME = β0 + β1AGE+ β2GNDR+ β3HSLDSZ+
β4EDLVL+ β5OCCPT+ β6LNDOWN+ β7FRMEXP+ β8QNTYSLD+ β9INCMGNRTD+
β10MRKTACC+ Ui

24
Table 3.1: Description of variables
Variables Description Unit of measurement
Expected sign
Dependent variable
Marketing efficiency
1 if farmer is efficient in marketing, 0 otherwise
Dummy
Independent variables
X1 = AGE Age of the farmer Years +
X2 = GNDR 1 if farmer is male, 0 otherwise
Dummy +
X3 = HSLDSZ Number of people in the household
Number +
X4 = EDLVL Years of formal education
Years +
X5 = OCCPT Occupation of the farmer
Category +/-
X6 = LNDOWN
1 if farmers owns land, 0 otherwise
Dummy +/-
X7 = FRMEXP
Years a farmer has been farming cowpea
Years +
X8 = QNTYSLD
Quantities of cowpea sold
Kg -
X9 = INCMGNRTD
Income generated from selling cowpea
Rand +/-
X10 = MRKTACC
1 if farmer has formal market access, 0 otherwise
Dummy +

25
CHAPTER FOUR RESULTS AND DISCUSSION
4.1. Introduction
The aim of this chapter was to present value chain mapping of cowpea farmers in
Ga-Molepo and Bela-Bela, how the marketing efficiency was measured and also
findings from descriptive analysis regarding the determinants of marketing efficiency
of these cowpea farmers. In this chapter, the nature of the data used is described
and also summaries of the variables that were considered and their measurements.
The results were presented using tables and charts, and then interpreted
individually. Binary logistic regression model was used to examine the determinants
of marketing efficiency; the empirical results are also discussed in this chapter.
4.2. Value chain mapping
The main aim of the study was to map the value chain of cowpea and analyse
whether particularly smallholder cowpea farmers are profitable along the chain.
Kaplinsky and Morris (2001) described value chain as a description of range of
activities which are required to bring a product or a service from conception, through
the different phases of production which involves a combination of physical
transformation of inputs of various producer services to the final consumers. A value
chain enables all the participants involved to understand the activities that take place
on each stage to add value to the product. From an agricultural perspective, Miller
and Jones (2010) as cited by Adeoye et al. (2013) defined value chain as a full range
of activities and participants involved in moving agricultural products from inputs
suppliers to farmers’ fields, and ultimately to the consumers.
Furthermore, value chain mapping on the other hand involves creating a visual
representation of the connection between actors in the value chain analysis as well
as other stakeholders as explained by McComick and Schmitz (2001). In mapping
the value chain for cowpea in Ga-Molepo and Bela-Bela, smallholder cowpea
farmers were asked questions regarding what takes place from point of cowpea
production to how they get their products to the consumers. The value chain
mapping showed different stakeholders’ participating in cowpea value chain; the
relationships and linkages are as shown in figure 4.8 below.

26
Figure 4.8: Value chain mapping of cowpea in Ga-Molepo
Source: Survey data, 2017.
Several farmers at Ga-Molepo engage in agricultural farming, particularly cowpea
amongst other crops. From figure 4.8 above, it shows that the farmers purchase
inputs from the suppliers. These include seeds, fertilizers and pesticides. Although
growing cowpea does not need application of fertilizers as it fixes nitrogen in the soil,
the fertilizers are bought so as to strengthen the soil further for planting of maize.
These farmers intercrop cowpea with maize and for this reason; too much fertilizer is
not applied. During the interviews, some of the farmers growing cowpea indicated
that they usually take their cowpeas to local processors and these processors sold
the cowpea to final consumers and other participants on the chain.
Inputs Suppliers
(NTK, Progress milling)
Smallholder cowpea farmers at Ga-Molepo
Local shops Local hawkers/ Traders
Final consumer
Local processors
(Progress milling)

27
4.2.1. Participants on the cowpea value chain and their roles at Ga-Molepo
a) Inputs suppliers
The input suppliers in the study area included NTK, General Dealers, Progress
Milling and Department of Agriculture. These participants are responsible for
supplying inputs to the farmers, such as; fertilizers and pesticides. The farmers are
able to ask for more information from these participants regarding cowpea
production and other agriculture-related matters.
b) Smallholder cowpea farmers
The role smallholder cowpea farmers played on the value chain is that they served
as a link between input suppliers and consumers. These farmers played the main
role on the chain by adding value through production of cowpea and made it
available to consumers. On the other hand, these cowpea farmers served as a
market for input suppliers like NTK, General Dealers and Progress Milling. After
production, farmers packaged cowpea in different sizes.
c) Local shops
These participants are able to buy cowpeas in surplus at a low price from the
farmers and later sell to the consumers at higher price than initially bought. The
reason behind this is that they have done value addition to the product in the form of
packaging; making it attractive for the consumers to buy and also storage.
d) Local processors
Smallholder cowpea farmers take their seeds to the processing company, where
local processing adds value to cowpea by cleaning, grading and storing the product.
Since farmers do not have the facilities to store and grade their produce, they take
their post-harvests to local processors.
e) Local traders/hawkers
The role of these participants along the value chain is that they help farmers in
generating more sales from their harvest. They sell various fruits and vegetables as
a way of earning a living. Cowpea is common in local communities for its importance
as a relish to supplement maize. Informal traders served as a link between suppliers
and consumers, also a reliable market for the farmers. The informal traders bought

28
cowpea seeds in larger quantities from farmers. Cowpea would be packaged in
different sizes ready to be sold, however the how the product was packaged did not
involve too much value addition. Generic packaging was employed to make the
product more presentable.
f) Final consumers
Final consumers as participants on the cowpea value chain included people in the
surrounding villages and towns. The role these participants played on the cowpea
value chain is that they make farmers be aware of what kind of seeds needs to be
produced. Final consumers also serve as the main market for cowpea farmers,
informal traders, local wholesalers and input suppliers in Ga-Molepo in a sense that
they have a choice to buy from different participants on the cowpea value chain.

29
Figure 4.9: Value chain mapping of cowpea at Bela-Bela of Waterberg district
Source: Survey data, 2017.
Bela-Bela is a small area in the Waterberg district, which is a few kilometres away
from Gauteng province. The farmers in this area are predominantly small-scale
producing mostly for own consumption and income generation. They grow mostly
sunflower, maize, sorghum, sugar beans, butternuts, sugarcane and cowpea. The
smallholder farming in this area also includes livestock, which mostly involves cattle
farming. Some of these farmers also produce fruits and vegetables in larger scales
as compared to cowpea, because they are able to take their produce to the
Johannesburg fresh produce. Cowpea production in Bela-Bela is still at a low level,
where smallholder farmers grow the crop mainly for consumption. A few of the
farmers interviewed, were able to produce the crop for both consumption and income
generation. In mapping the value chain, farmers indicated that they bought the seeds
from the suppliers in town, plant them and sell to the people.
Inputs suppliers
(NTK)
Smallholder cowpea farmers in Bela-Bela
Local hawkers/ Traders
Final consumers

30
4.2.2. Participants and their roles on the cowpea value chain in Bela-Bela
a) Input suppliers
Input suppliers in Bela-Bela comprised of NTK as the main supplier of agricultural
production inputs. They are responsible for supplying inputs to the farmers, such as
seeds, fertilizers and pesticides. The farmers are able to ask for more information
regarding what they are producing, and the suppliers are able to help them.
b) Smallholder cowpea farmers
The role smallholder cowpea farmers play in adding value to the cowpea production;
is to produce the crop in a suitable manner as much as they can, to have quality
yields available to consumers. The smallholder cowpea farmers in Bela-Bela also
served as a link between input suppliers and the final consumers. However, final
consumers also served a market for these cowpea farmers as major part of their
harvest was consumed by people from the neighbouring villages.
c) Informal traders/hawkers
The role of these participants along the value chain is that they help farmers in
generating more sales from their harvest, but also making profit in the process. The
local hawkers buy cowpea seeds from the farmers, and direct the sales to the final
consumer.
d) Final consumers
These participants are the most important on the value chain, because without this
linkage there would be no value chain as they serve as the main market for input
suppliers, smallholder cowpea farmers and informal traders. They add value to
cowpea in that they make farmers know what kind of seeds needs to be produced;
as these consumers are always looking to get the best value for their money.

31
4.3. Marketing efficiency
Table 4.2: Frequency and percentage of farmers’ marketing efficiency and
inefficiency
Frequency Percentage (%)
Marketing efficiency 53 66
Marketing inefficiency 27 34
Total 80 100
Source: Survey data, 2017
Table 4.2 above shows the frequencies and percentages of smallholder cowpea
farmers in being efficient and inefficient in marketing cowpea. Results from
descriptive statistics revealed that 53 (66%) of 80 farmers were efficient in marketing
cowpea while the remainder being 27 (34%) farmers were inefficient.
4.4. Descriptive statistics of cowpea farmers in Ga-Molepo of Capricorn district
and Bela-Bela of Waterberg district.
Table 4.3: Frequencies of socio-economic characteristics of the sampled farmers
Variables N Minimum Maximum Mean/Ave Std. Dev
Age of the farmer 80 26 83 63.93 10.459
Household size 80 1 12 5.36 2.414
Years in schooling 80 0 15 7.36 3.671
Years in growing
cowpea
80 1 45 9.38 12.099
Income generated from
selling cowpea
80 200 2000 680.63 542.293
Source: Survey data, 2017.
4.4.1. Age
The mean age of smallholder cowpea farmers was 63.93 years. The minimum age of
cowpea farmers in Ga-Molepo and Bela-Bela is 26, and the maximum being 83.

32
4.4.2. Household size (Number of people in the household)
The average household size was 5.36, the minimum number of people found living in
a household was 1, while maximum was 12. With the average and maximum
numbers being as stated, this is likely to imply that family labour was more used than
hired labour.
4.4.3. Years in schooling
Most farmers are considered to be illiterate and lack formal schooling experience.
The results from descriptive statistics showed that the minimum number of years a
farmer has been to school is 0, while maximum is at 15 and average years of
schooling are 7.36.
4.4.4. Years in farming
The minimum number of years a farmer has in farming cowpea was 1 year, which
includes those farmers that had just started farming cowpea and has less than one
year. The maximum number of years being 45 and the mean/average is 9.38 years.
4.4.5. Income generated from selling cowpea
The results acquired from descriptive statistics showed that the minimum amount of
money cowpea farmers got from selling their cowpea was R200. From the farmers
that were interviewed, some did not have a reliable market, because they had just
started planting cowpea. The maximum amount of money cowpea farmers got from
their sales was R2000, while the average was R680.83.
Figure 4.10: Gender of cowpea farmers
Source: Survey data, (2017)
Female 57%
Male 43%
Gender of cowpea farmers

33
4.4.6. Gender of cowpea farmers
Figure 4.10 shows gender of cowpea farmers, indicating which gender is more
involved in cowpea farming. The results showed that more women were involved in
cowpea farming with 57% and their male counterparts having just 43% . Cowpea
farming has always been considered a women’s job, that’s probably the reason why
there are more women participating in cowpea farming than men.
Figure 4.11: Occupation of cowpea farmers
Source: Survey data, 2017.
4.4.7. Occupation of cowpea farmers
Different activities that farmers are involved in (excluding farming) are among the
major factors that affect farmers’ level of production. Highlighting and discussing
these activities can pinpoint on the reasons why cowpea farmers are succeeding or
failing in producing cowpea. Activities like occupation of the farmer is relevant in
showing us whether it leads to a farmer succeeding or failing in cowpea farming.
Figure 4.11 presents results of the occupation of the farmer. The results showed that
37 out of 80 respondents were full-time cowpea farmers, followed by those who were
full-time farmers and on pension at 20. Few farmers who are farming cowpea were
either self-employed, pensioners and employed or unemployed.
37
2
3
2
7
20
1
7
1
Full-time farmer
Full-time farmer & self-employed
Employed
Part-time farmer & pensioner
Part-time farmer & employed
Full-time farmer & pensioner
Full-time farmer & unemployed
Pensioner
Self-employed
Occupation of cowpea farmers

34
Figure 4.12: Land ownership of cowpea farmers Source: Survey data, 2017.
4.4.8. Land ownership of cowpea farmers
Land is one of the most important factors in agricultural practices. A farmer who
owns land is more likely to be productive than a farmer with inherited or leased land.
Land ownership gives security in cases where a farmer needs capital to start or
continue with their farming practices. Figure 4.12 showed that 81% of the farmers
farming cowpea owned land, whereas 19% did not have land ownership. However,
with respect to this study having no land ownership did not mean the farmers had no
access to land.
Yes 81%
No 19%
Land ownership of cowpea farmers

35
Figure 4.13: Quantities of cowpea sold
Source: Survey data, 2017.
4.4.9. Quantities of cowpea sold
One of the determinants of farmers being profitable when selling their produce is the
quantities of cowpea sold. Studies have shown that farmers are more likely to make
profit if they sell their products in small kilograms, that way consumers have a choice
of coming back to buy more if they like the product. With regards to quantities of
cowpea farmers sold their produce, figure 4.13 shows that out of the 80 respondents
that were interviewed, only few farmers sold their cowpeas at 1, 5, 10 kilograms;
1,2,5 kilograms; 500 grams, 1& 2 kilograms; 500 grams, 1,2 & 5 kilograms and 5, 10,
20 kilograms. The “other” represents those cowpea farmers who were selling
cowpea in different scales other than the measurements mentioned including larger
kilograms such as 10 and 20 kilograms only.
4 4 2 3 4 3 2 2 1
55
Quantities of cowpea sold

36
Figure 4.14: Formal market access of cowpea farmers Source: Survey data, 2017.
4.4.10. Formal market access of cowpea farmers
Access to markets is a vital requirement for the poorly resourced farmers in rural
areas, if they are to enjoy the benefits of agricultural growth. In this regard, it is
important that farmers have access to formal sufficient markets, that way they will be
able to realise higher returns from selling their products. Figure 4.14 depicts that only
22% of cowpea farmers had access to a formal market, whereas a greater margin of
78% had no access to formal markets. Meaning that the 78% represented those
farmers had access to informal market. This could be because some of the cowpea
farmers had just started selling cowpea, therefore contributing to a larger percentage
of 78% of those who had access to informal market.
22%
78%
Formal market access of cowpea farmers
Yes No

37
Table 4.4: Results from binary logistic regression model for examining the determinants of marketing efficiency of cowpea farmers in Ga-Molepo and Bela-Bela
Predictor variables Coefficient (B)
SE Wald Sign Exp(B)
Constant -21.002 14.729 2.033 .154 .000 Age of the farmer .435 .195 4.977 .026* 1.545 Gender of cowpea farmers
-2.831 1.852 2.336 .126 .059
Household size 1.710 .780 4.804 .028* 5.530 Years of schooling of cowpea farmers
1.014 .536 3.583 .058** 2.756
Occupation of cowpea farmers
-1.137 .520 4.787 .029* .321
Land ownership of cowpea farmers
-2.614 6.097 .184 .668 .073
Years of growing cowpea -.259 .129 4.015 .045* .772 Quantities of cowpea sold
-.581 .301 3.724 .054** .559
Income generated from selling cowpea
-.016 .007 5.932 .015* .984
Access to formal market -.332 1.592 .044 .835 .717 Model summary Chi-square (df=8) .626 -2 Log likelihood 16.565 Cox & Snell R Square .658 Nagelkerke R Square .911 Note at * ,**, indicate significant at 0.05 and 0.10 respectively
Source: survey data, 2017.
4.5. Results and discussion from binary logistic regression model
Table 4.4 showed results from binary logistic regression model which indicated that
seven variables (age, household size, years in schooling, occupation of the farmer,
years in farming cowpea, quantities at which cowpea is sold, income generated from
selling cowpea) out ten variables that were regressed were significant in influencing
the marketing efficiency of cowpea farmers in Ga-Molepo and Bela-Bela. The model
was tested for goodness of fit using Hosmer and Lemeshow’s goodness-of-fit for
logistic regression models. Hosmer and Lemeshow test showed a Chi-square value
of 62.6 and statistically significant at 1.000, implying that the model fit the data well.
38
With regard to coefficient of determination (R2), for regression models with
categorical dependent variable such as the binary logistic regression, it is not
possible to compute the R2. Therefore, approximations such as the Nagelkerke R2 is
calculated instead. Nagelkerke R2 was used in this study as a proxy estimate to R2
that measures the variation in the response that is explained by the model. The
Nagelkerke R2 was found to be 91.1% which indicates that 91.1% of the variation in
marketing efficiency of cowpea farmers is explained by the explanatory variables.
The log likelihood value was 16.565 and the Cox and Snell R square was 65.8%.
4.5.1. Age
The results showed that age had a positive coefficient of 0.435 and was statistically
significant at 5% level. The positive coefficient suggests that there is a positive
relationship between age and marketing efficiency of smallholder cowpea farmers. A
study done by Oteh and Njoku (2014) found that age was negatively significant to
marketing efficiency of farmers. The authors highlighted that it was expected that
with an increase in age of the farmer, will bring about a decrease in marketing
efficiency since as a farmer gets older the less likely he/she is to adopt new
technologies to improve his marketing efficiency. This is however not consistent with
findings from Farayola et al. (2013), who found that an increase in age of the farmer
leads to an increase in their marketing efficiency. This also corroborated by the
results from descriptive statistics of this study that showed that the maximum age of
farmers producing cowpea is 83, the average being 63 and minimum is 26. Although,
most of the times farmers are regarded as being illiterate, and therefore can’t adopt
new methods introduced; experience is an important factor in this regard. Cowpea
farming can be tiring to plant and therefore needs people with patience and passion
for the crop. Ovwigho and Ifie (2009) as cited by Adesina and Eforuoku (2016)
mentioned that youth recently are not interested in hard labour more especially
agriculture, as they perceive it as being hard and dirty.
4.5.2. Household size
Household size was found to be statistically significant at 5% level, p-value of 0.026
with a positive coefficient of 1,710 and odds ratio of 5.530. This showed that the
number of people in the household had a positive influence on marketing efficiency
of cowpea farmers. As a household size increases, the odds that the farmer will use
family labour to increase his marketing efficiency is 5.530 more likely holding all

39
other independent variables constant. This is supported by Oteh and Njoku (2014)
indicating that household size was established to be positively significant at 5% level.
It is further stated that large household sizes are virtually seen as an advantage in
terms of contributing to labour and as such, perceived as a source of cost reduction.
In support of this statement, Etwire et al. (2013) also found that there is a positive
relationship between household size and participation in agricultural practices. It has
been indicated that a farmer with a large household can delegate other important
activities to other household members, while he participates in agricultural projects.
4.5.3. Years of schooling
Number of years of schooling of a household head was found to be significant at
10% with a p-value of 0.058. the number of years a farmer has been to school has
an impact on how a farmer responds to adopting information, or even new
technology that will help them to improve their marketing efficiency. Nnadi and
Akwikwu (2008) also mentioned that years in schooling affects the use of information
efficiently, emphasizing that the more years a farmer has been to school the less
likely he is to have difficulty with adopting modern agricultural technologies.
However, Farayola et al. (2013) found that years in schooling of a farmer were highly
significant but negatively related to marketing efficiency. The results were in contrast
with former expectations as it was expected that education should enhance the level
of market information, hence marketing efficiency.
4.5.4. Occupation of cowpea farmers
Occupation of cowpea farmers had a negative influence on the marketing efficiency
of cowpea farmers. The variable was significant at 5% level, a p-value of 0.029, a
coefficient of 1.137 and a log odds ratio of 0.321. The descriptive statistics on
occupation of the farmer indicated that a farmer did not solely had farming as an
occupation but had other work commitments besides farming, only 37 farmers out of
80 respondents were full-time farmers. The negative relationship means that the
more jobs a farmer had, while holding all other variables constant reduced the
likelihood of a farmer being market efficient. However, Adesina and Eforuoku (2016)
and Nnadi and Akwikwu (2008) indicated that parent’s engagement in farming as an
occupation was significant as a determinant of youth participating in agriculture. This
corroborates to the fact that occupation of a farmer does influence how successful a
farmer will be in their agricultural production.

40
4.5.5. Years of growing cowpea
Years in growing cowpea was found to have a negative influence on the marketing
efficiency of farmers. Years in farming cowpea had a significant level of 5% and
negatively related with a coefficient of -0.259. Years in farming cowpea was
expected to be positively related with marketing efficiency, as with experience comes
knowledge on how to be market efficient. A study done by Adenuga et al. (2013) on “
Marketing efficiency and determinants of marketable surplus in vegetable
production” found that there was significance and positive relationship between
years in farming (experience) and marketing efficiency of farmers. It was indicated
that farming experience may be due to the fact that experienced farmers are more
enlightened and thereby they are well familiar with the efficient marketing of their
marketable surplus and were able to reduce market loss. However, Farayola et al.
(2013) found that there was no significance and relationship between marketing
experience and marketing efficiency of cocoa farmers.
4.5.6. Quantities of cowpea sold
Quantities of cowpea sold was found to be statistically significant at 10% , a p-value
of 0.054 and a coefficient of -0.541 which indicates that the variable is negatively
related to marketing efficiency. This means that with an increase in every quantity
sold, there was a decrease in marketing efficiency of cowpea farmers. Since the
descriptive statistics showed that more farmers had access to informal market
(78%), this implied that consumers had freedom to buy cowpea where the quantities
sold were at a reasonable price. An increase in quantities sold means that the prices
were also increasing, and consumers are likely to get the best value for their money.
Farayola et al., (2013) found that quantities sold of cocoa was not significant with
marketing efficiency of farmers, but found that selling price was significant at 5%
level and positively related to marketing efficiency. It was mentioned that a positive
relationship between selling price and marketing efficiency could be because
consumers are motivated by favourable selling price.
4.5.7. Income generated from selling cowpea
The variable income generated from selling cowpea was found to be statistically
significant at 5% with a p-value of 0.015, coefficient of -0.016 and odds ratio of
0.984. Income generated by farmers from selling their cowpea was negatively
related to marketing efficiency. This means that the amount of money the farmers

41
got from selling their products had no effect on how efficient they were in marketing.
The results from the descriptive statistics showed that about only 22% of the farmers
responded had access to formal market, while the remainder 78% had access to
informal market. The lack of access to formal market could have had an effect on the
income generated, and hence a decrease in marketing efficiency. Farmers did not
have a stable and reliable market for source of income. However, these results are in
contrast with findings of Oteh and Njoku (2014) who found that income generated by
farmers from selling their products was highly significant and related to marketing
efficiency, stating that an increase in income contributes to an increase in marketing
efficiency.
4.6. Identifying marketing constraints among smallholder cowpea farmers.
The following table outlines some of the challenges farmers faced regarding
production, marketing and selling cowpea.
Table 4.5: Constraints encountered in producing, marketing and selling cowpea
Challenges Frequency Percent (%)
Pests and access to markets 13 16.3
Lack of access to market 2 2.5
Pests and lack of access to credit 4 5.0
Lack of access to credit and market 6 7.5
Lack of information on how to process cowpea 9 11.3
Weeds and pests problems 6 7.5
pests 23 28.8
Pests and water shortages 8 10.0
Other 9 11.3
Totals 80 100
Source: Survey data, 2017.
Table 4.5 above showed a number of constraints that hinder farmers in marketing
their cowpeas. The descriptive statistics indicated that amongst all the
challenges/constraints farmers were facing, pests were the most problematic. This is
due to the fact that cowpeas are subjected to weevils and other types of bugs,
whereby they suck on pods and leave the outer part of the cowpea. This leads to
farmers having nothing or less to sell, which is a big concern since they are losing

42
out on making bigger profits. These farmers are operating on small-scale basis and
therefore do not have adequate storage facilities. However, some farmers do
manage to send their cowpeas to progress milling facilities to store their produce.
Farayola et al. (2013) highlighted that among problems facing cocoa marketers
inadequate storage facilities, pests, diseases, price instability and high cost of
transportation were the most problematic with pests and diseases ranking number
one.
Chapter summary
This chapter presented findings of the study which was carried out in Ga-Molepo of
Polokwane municipality and Towoomba of Bela-Bela municipality. The main aim of
the study was to map the value chain of cowpea farmers in both areas, and also
determine their marketing efficiency. The socio-economic characteristics of cowpea
farmers as well as the determinants of marketing efficiency were described. Binary
logistic regression model was used to measure the determinants of marketing
efficiency of which seven variables (age, household size, years in schooling,
occupation of the household head, years in farming cowpea, quantities sold of
cowpea, and income generated from selling cowpea) were significant. However,
occupation of the household head, years in farming cowpea, quantities of cowpea
sold and income generated from selling cowpea were negatively significant. The
constraints to marketing among smallholder farmers were also described.
43
CHAPTER FIVE SUMMARY, CONCLUSION AND RECOMMENDATIONS
5.1. Introduction
This chapter highlights the summary, conclusions and recommendations for the
study. Firstly, is the summary of the findings from the study and how the research
objectives were carried out. Secondly, the conclusions from the study are
highlighted based on the findings; and lastly the recommendations are provided
based on what the study has found.
5.2. Summary
The main aim of the study was to map the value chain and determine the
marketing efficiency of smallholder cowpea farmers in Capricorn and Waterberg
districts of Limpopo province. The objectives of the study were to: firstly identify
and describe the socioeconomic characteristics of smallholder cowpea farmers.
Secondly, identify and define the participants along the cowpea value chain.
Thirdly, determine the marketing efficiency of smallholder cowpea farmers.
Fourthly, to examine the determinants of marketing efficiency and lastly to
identify marketing constraints among smallholder cowpea farmers.
Data was collected using structured questionnaire from 80 smallholder cowpea
farmers using purposive sampling technique in Ga-Molepo of Capricorn district
and Bela-Bela of Waterberg district. Data collected was analysed using
descriptive statistics, binary logistic regression model and information regarding
value chain was mapped to indicate the different stages cowpea goes through
before reaching the final consumer. In determining the marketing efficiency of
smallholder cowpea farmers, a marketing efficiency measure was used.
In addressing objective one, which was to identify and describe socioeconomic
characteristics of smallholder cowpea farmers, descriptive statistics was used.
Objective two being to identify and define the participants along the cowpea value
chain, was addressed by a value chain map showing all the stakeholders
involved before the product reaches the final consumer. Addressing objective
three, which was to determine the marketing efficiency of smallholder cowpea
farmers, a marketing efficiency measure was used to find out if a farmer was
efficient or inefficient in marketing their product. Objective four, which was to

44
examine the determinants of marketing efficiency, was addressed using binary
logistic regression model. In addressing the last objective, to identify marketing
constraints among smallholder cowpea farmers, descriptive statistics was used.
Two null research hypotheses were formulated:
First hypothesis - smallholder cowpea farmers in Capricorn and Waterberg
districts are inefficient in marketing cowpea
Second hypothesis - socioeconomic characteristics of smallholder cowpea
farmers have no effect on their marketing efficiency.
Both hypotheses were rejected. For hypothesis one, which stated that
smallholder cowpea farmers in Capricorn and Waterberg districts are inefficient in
marketing cowpea was rejected based on the marketing efficiency measure that
was used to determine each farmer’s marketing efficiency. Descriptive statistics
results indicated that 53 out of 80 farmers, which made it to be 66% of the
farmers were efficient in marketing cowpea. This is also supported by the results
from binary logistic regression model that revealed that of the variables that were
considered, 7 out 10 variables were significant in determining marketing
efficiency of cowpea farmers.
Second hypothesis which stated that socioeconomic characteristics of
smallholder cowpea farmers have no effect on their marketing efficiency; results
from binary logistic regression model revealed variables age of the farmer,
household size, years in schooling, income generated from selling cowpea and
occupation of the farmer had positive influence to marketing efficiency. Variables
such as occupation of the farmer, years in farming cowpea, quantities of cowpea
sold and income generated from selling cowpea were found to have had a
negative influence on the marketing efficiency of cowpea farmers in both Ga-
Molepo and Bela-Bela.
5.3. Conclusion
Value chain mapping in Ga-Molepo of Capricorn district indicated that the main
participants on cowpea value chain were input suppliers, smallholder cowpea
farmers, local wholesalers, local hawkers/traders, local processing companies,
contractors then the final consumer. It was indicated that each participant on the

45
value chain added value to the product to ensure profitability, while on the other
hand final consumers got value for their money.
In Bela-Bela of Waterberg district the value chain map showed that the main
participants on the value chain of cowpea were inputs suppliers, smallholder
cowpea farmers, local hawkers/traders and final consumers. Most farmers in
Bela-Bela are engaged in farming particularly sunflower, maize and other types of
beans. Cowpea is produced at a small-scale level hence; there are not many
participants on the value chain. Farmers in this area have great interest in
farming cowpea in masses. Lack of information on how to farm cowpea to be
profitable, lack access to high yielding, pests and heat resistant seeds inhibit the
farmers in succeeding.
Using the marketing efficiency measure to determine if smallholder cowpea
farmers were efficient or inefficient, it was found that 66% of the farmers were
efficient and 34% of the farmers were inefficient. Binary logistic regression model
was used to examine the determinants of marketing efficiency. Age of the
household head, household size, years in schooling were found to be positively
significant; while years in farming cowpea, income generated from selling
cowpea, quantities at which cowpea is sold and occupation of the household
head were found to be negatively significant. The implication of these negatively
significant variables is that the likelihood of smallholder cowpea farmers being
market efficient decreases with years in farming, income generated from selling
cowpea, quantities of cowpea sold and occupation of the farmer. Other variables
that were considered were gender of the household head, access to formal
market and land ownership of which they were all found to be negatively
significant. This implies that these variables had no impact whatsoever in
influencing the marketing efficiency of smallholder cowpea farmers.
Constraints which smallholder cowpea farmers encountered with regards to
production, marketing and selling cowpea were identified. Amongst the
constraints encountered which included lack of access to formal market, lack of
information on how to process cowpea, weeds, water shortages etc. pests
problems were ranked to be the main challenge farmers are faced with regarding
cowpea production.
46
5.4. Recommendations
Most smallholder farmers focus mostly on producing maize and other
subsistence crops, they do not have enough information on producing other
staple food such as cowpea. However, most literature has not provided adequate
information regarding cowpea production and marketing. Smallholder farmers do
not have the resources and capacity in terms of land. Storage facility was found
to be one of the challenges smallholder cowpea farmers were faced with. In
ensuring that their cowpea post-harvest production was not lost due to insects,
they had to make sure that they sold their harvest immediately and at a so-not
competitive price.
This study revealed that with proper funding from government and other
agricultural financial institutions, smallholder farmers have the potential to
succeed in making food value chains beneficial. It was also revealed that farmers
at Bela-Bela do not have enough information on cowpea production to make it a
profitable business, only few farmers are producing cowpea. Therefore, it is
recommended that government (value chain analysts, policy makers and
extension workers) together with other stakeholders assist in ensuring that food
value chains relationships are established so that market opportunities can be
created for smallholder cowpea farmers.
Age was found to be significant and most of smallholder cowpea farmers were
old people dominated by female household heads. Aged people are the ones
who appreciate farming more than young people, thus it is recommended that
farmer schools be introduced in rural areas. At these schools, farmers can be
taught about basic knowledge relating to agricultural production. Farmers should
also be trained on adopting technologies that will make production more efficient
and easier. Knowledge form a crucial part in the success of smallholder
agricultural production, as it has it has been observed that years of schooling was
significant factor contributing to marketing efficiency of smallholder cowpea
farmers. The farmers could also be taught about bookkeeping systems, whereby
they are able to see costs of production and marketing; and if they are making
profit in operating their operations.

47
Household size was also found to be significant factor in determining smallholder
cowpea farmers’ marketing efficiency. Therefore, if farmers can form
cooperatives wherein they produce in groups, government is most likely to be
quick to help such farmers in terms of funding and in providing the resources to
work with. When farmers come together as a collective, they display a sense of
unity and determination towards accomplishing their goals and that makes it
easier for funding organisations to approach such farmers. Cooperatives also
help in ensuring that farmers within those cooperatives are able to get a bigger
land to enable them to produce different crops.
5.5. Areas of further research
This study was aimed at mapping the value chain and to determine the marketing
efficiency of smallholder cowpea farmers in Ga- Molepo of Capricorn district and
Bela-Bela of Waterberg district only. It was found that cowpea farmers in Ga-
Molepo produce cowpea as much maize is produced and that different
participants were involved in cowpea value chain. However, there is still limited
information regarding the importance of cowpea production as a staple food in
Ga-Molepo and Bela-Bela. Due to limited time constraint, it is recommended that
related researches be conducted in other areas of the province to extend the
knowledge of cowpea production and marketing. For future studies, perceptions
on the use of improved varieties of cowpea seeds can also be assessed.

48
REFERENCES
Acharya, S.S. and Agarwal, N.L. 2001. Agricultural Marketing in India. Third Edition.
New Delhi: Oxford & IBH Publishing Company.
Adeleke, S., Abdul B.K. and Zuzana, B. 2010. Smallholder Agriculture in East Africa:
Trends, Constraints and Opportunities. African Development Group, Working Paper
Series No. 105 African Development Bank, Tunis, Tunisia, pp. 3-52.
Adenuga, A.H, Fakayode, S.B. and Adewole, R.A. 2013. Marketing Efficiency and
Determinants of Marketable Surplus in Vegetable Production in Kwara State,
Nigeria. Paper presented at the 4th International Conference of the African
Association of Agricultural Economists, September 22-25. Hammamet, Tunisia, pp.
1-15.
Adeoye, I.B., ONI, O.A., Yusuf, S.A. and Adenegan, K.O. 2013. Plantain Value
Chain mapping in South Western Nigeria. National Horticultural Research Institute.
Journal of Economic and Sustainable Development Volume 4, No.16, pp. 137-146.
Adesina, T.K. and Eforuoku, F. 2016. Determinants of Participation in Youth-in-
Agriculture Programme in Ondo State, Nigeria. Journal of Agricultural Extension.
Volume 20, No.2, pp. 104-117.
Akibode, C.S. 2011. Trends in the Production, Trade and Consumption of Food
Legume Crops in Sub-Saharan Africa, Michigan State University, Master of Science,
Agricultural Food and Resource Economics. A plan B paper, pp. 17.
Antwi, M. and Seahlodi, P. 2011. Marketing Constraints Facing Emerging Pig
Farmers in Gauteng Province, South Africa. Journal of Human Ecology, 36 (1), pp.
37-42.
Asiwe, J.A.N. 2009. Needs Assessment of Cowpea Production Practices,
Constraints and Utilization in South Africa. African Journal of Biotechnology, Volume
8, pp. 5383-388.
Baloyi, J.K. 2010. An Analysis of Constraints Facing Smallholder Farmers in
Agribusiness Value Chain: A Case Study of Farmers in Limpopo Province, MSc
dissertation, Department of Agricultural Economics, Extension and Rural
Development, Faculty of Natural and Agricultural Sciences, University of Pretoria.
49
Bela-Bela local municipality, 2017. Accessible on
https://www.localgovernment.co.za/locals/view/136/Bela-Bela-local-municipality.
Date accessed 14-07-2017.
Bela-Bela local municipality, IDP 2016. Accessible on
http://www.belabela.gov.za/docs/idp/FINAL%20DRAFT%20%202015-
%202016%20idp.PDF. Date accessed 10-08-2017.
Bernard, H.R. 2002. Research Methods in AnthropologyQualitative and quantitative
methods 3rd edition. AltaMiraPress ,Walnut Creek, California.
Black, V. 2015. GM and Seed Industry Eye Africa’s Lucrative Cowpea and Seed
markets, The Political Economy of Cowpea in Nigeria, Burkina Faso, Ghana and
Malawi. African Centre for Biodiversity, pp. 1-39.
Blade, S.F., Shetty, S.V.R., Terao, T. and Singh, B.B., 1997. Recent development in
cowpea cropping research. In: Singh, B.B., Mohan, Raj, D.R., Dashiell, K.E., and
Jackei, L.E.N. (Eds.), Advances in Cowpea Research. International Institute of
Tropical Agriculture, Ibadan, Nigeria, pp. 114–128.
Capricorn District map, accessible on
www.municiplalities.co.za/province/view/5/limpopo. Date accessed 12-07-2017.
Chadha, M.L. Oluoch, M.O, Saka, A.R, Mtukuso, A.P. and Daudi, A.T. 2008.
Vegetable Research and Development in Malawi, Review and Planning Workshop
proceedings, September 23-24; 2003, Lilongwe Malawi. AVRDC- The World
Vegetable Center, Shanhua, Taiwan. AVRDC Publication No. 08-705, pp. 116.
Chagomoka, T, Afari-sefa ,V. and Pitoro, R. 2014.Value Chain Analysis of Traditional
Vegetables from Malawi and Mozambique, International Food and Agribusiness
Management Review Volume 17 No.4. pp. 59-86.
Chaminuka, P., Anim, F., Debusho, L.K. and Nqangweni, S. 2006. Impact of
HIV&AIDS on Agriculture and Food Security: The case of Limpopo Province in South
Africa, FANRPAN working document No. NAT SAA005, pp. 8-91.
Coker, A.A, Odoemena, B., Akogun, E.O. and Mohammed, D. 2014. Cowpea
Farming in Mashegu Local Government Area of Niger State: Implications for

50
Sustainable Production and Inclusive Growth in Nigeria. Journal of Sustainable
Development in Africa, Volume 16, No. 5,pp. 33-48.
Coulibaly, O. and Lowenberg-DeBoer, J. 2014. The Economics of Cowpea in West
Africa, pp. 1-34.
Department of Agriculture, Forestry and Fisheries. 2012. A Framework for the
Development of Smallholder Farmers through Cooperative Development.
Cooperative and Enterprise Development Directorate, pp. 1-8.
Diehl, L. and Sipkins, L. 1985. The development of mixed cropping technologies in
northern Ghana. In: Ohm, H.W., and Nagy, J.G.(Eds.), Appropriate Technologies for
Farmers in Semi-arid West Africa. International Programs in Agriculture. Purdue
University, West Lafayette, Indiana, USA, pp. 260–268.
Etwire, P.M, Dogbe, W., Wirendu A.N, Martey E., Etwire E., Owusu R.K. and
Wahaga E. 2013. Factors Influencing Farmer’s Participation in Agricultural Projects:
The Case of the Agricultural Value Chain Mentorship Project in Northern Region of
Ghana. Journal of Economics and Sustainable Development. Volume 4, No.10.pp.
36-43.
Faith, D.I, Jagaba, Y.C, Ramatu, U.K. and Ingye, I.Y. 2011. Cowpea Marketing and
Consumer Preference in Magama Local Government Area of Niger State, Nigeria.
Journal of Agriculture and Social Science.7, pp. 30-34.
Faith, D.I, Job, N.N, Kpotun, M.B, Nehemiah, D. and Philip, A.I. 2014. Assessment of
Consumer Preference for Cowpea Quality Characteristics and Price Trends in Niger
State, Nigeria. 2014 2nd International Conference on Sustainable Environment and
Agriculture IPCBEE Volume 76 No.21, pp. 105-112.
Farayola, C.O, Akintaro, O.S, Yahaya, A.A. and Oni, O.O. 2013. Determinants of
Marketing Efficiency among Small-holder Cocoa Marketers in Oyo State, Nigeria.
International Journal of Management and Social Sciences Research. Volume 2,
No.11, pp. 38-43.
Faye, M., Jooste, M, Lowenberg-DeBoer J. and Fulton J. 2004. The Influence of
Cowpea Characteristics on Cowpea Prices in Senegal. Agrekon 2004, Volume 43
(4), pp. 418-429.

51
Gómez, Z.C. 2004. Cowpea Post-Harvest Operation, Food and Agriculture
Organization of the United Nations (FAO), Rome Italy, pp. 2-70.
Hallensleben, M., Polreich, S., Heller, J. and Maass, B.L. 2009. Assessment of the
Importance and Utilization of Cowpea (Vigna Unguiculata L. Walp) as Leafy
Vegetable in Small-scale Farm Households in Tanzania- East Africa. Conference on
International Research and Food Security, Natural Resource Management and Rural
Development. Tropentag, University of Hamburg, October 6-8, 2009, pp. 1-4.
Hlungwani, C. 2011. Evaluation of Cowpeas (Vigna Unguiculata L.) As a Protein
Source for Chicken Egg Production. MSc Dissertation Tshwane University of
Technology, Faculty of Science, Department of Animal Sciences, Magister
Technologiae: Agriculture.
International Institute of Tropical Agriculture. 2011. Agency Report, Cowpea Driving
Silent Economic Revolution in Nigeria, pp. 2-56.
Kaplinsky, R. and Morris M. 2001. A Handbook for Value Chain Research. A paper
prepared for IDRC. Institute of development studies, pp. 2-109.
Kganyago, M.S. 2008. The Impact of Poverty Alleviation Projects in Ga-Molepo Area
in Polokwane Municipality, Limpopo province. MSc Dissertation Turfloop Graduate
school of Leadership, University of Limpopo.
Kirsten, J.F. and Van Zyl, J. 1998. Defining Small-scale Farmers in the South African
Context. Agrekon, Volume 37, No.4, pp. 551-562.
Lewis, J.L. and Sheppard, S.R.J. 2006. Culture and communication: can landscape
visualization improve forest management consultation with indigenous communities?
Landscape and Urban Planning 77:pp 291–313.
Limpopo community survey. Accessible on www.statssa.gov.za/?p=7988 media
release: Date accessed 12-07-2017.
Limpopo Department of Roads and Transport-2015. Province of Limpopo, Vote No.
8 Annual Report, 2014/2015 Financial year.
Limpopo Environmental Outlook Report. 2016. Chapter 2: Land and Transformation
for the Limpopo Province, South Africa, Discussion document, pp. 5-30.

52
Limpopo province, an overview. Accessible on www.polokwanecity.co.za/limpopo/
date accessed: 25-05-2017.
Longwe, A., Mangisoni J.H, Mloza-Banda, H.R, Singad, D., Ferguson, A. and Snapp,
S. Market Potential and Margins of Irrigated Beans: Case of Chingale Area
Development Program in Southern Malawi, University of Malawi. Date Accessed 03-
02-2016.
Matsane, S.H. and Oyekale, A.S. 2014. Factors Affecting Marketing of Vegetables
Among Small-scale Farmers in Mahikeng Local Municipality, North-West Province,
South Africa. Mediterranean Journal of Social Sciences Volume 5 No.20. pp. 390.
Mbene, F. D. (2005). Investigation of key aspects for the successful marketing of
cowpeas in Senegal. PhD. Dissertation, Department of Agricultural Economics,
Faculty of Natural and Agricultural Sciences, University of the Free State,
Bloemfontein, South Africa, pp.151.
McCormick, D. and Schmitz H. 2001. Chapter 3 Value Chain Mapping:
Understanding Relationships, Institute of Development Studies, pp. 39-65.
Miller, C. and Jones, L. 2010. Agricultural Value Chain Finance- Tools and Lessons,
Food and Agriculture Organization (FAO). Rome, pp. 10-44.
Mortimore, M.J. Singh, B.B., Harris, F., and Blade S.F. 1997. Cowpea in Traditional
Cropping Systems. In: Singh, B.B., Mohan-Raj, D.R., Dashiell, K.E., and Jackai,
L.E.N. (Eds.), Advances in Cowpea Research. Co-publication of International
Institute of Tropical Agriculture (IITA) and Japan International Research Centre for
Agricultural Sciences (JIRCAS) IITA, Ibadan, Nigeria, pp. 99–113.
Mzeyece, A. 2010. Factors Influencing Cowpea Producer’s Choice of Marketing
Channels in Zambia. B.Sc. Thesis, Department of Agricultural Economics, University
of Zambia.
Nnadi, F.N. and Akwikwu, C.D. 2008. Determinants of Youths Participation in Rural
Agriculture in Imo State, Nigeria. Journal of Applied Sciences. Volume 8, No.4, pp.
328-333.
Oteh, O.U. and Njoku, E.M. 2014. Determinants of Marketing Efficiency for
Packaged Water in Imo State, Nigeria: Maximizing Firms Assets to Improve

53
Consumer Welfare. Scientific Papers Series Management, Economic Engineering in
Agriculture and Rural Development, Volume 14, No, pp. 221-230.
Ovwigho, B.O. and Ifie, P.A. 2009. Attitude of Youth towards Agricultural
Development Programmes in Ughelli South Local Government Area of Delta State,
Nigeria. Journal of Agricultural Extension 13(2), pp. 67-69.
Pabuayon, I.M., Cuevas, A.C., Quilloy, K.P., Delos Reyes, J.A. and Arrienda, F.Q.
2014. Marketing, Trade and Distribution Issues as They Affect Food Security:
Framework and Empirical Evidence. Paper presented during the Roundtable
Discussion on Food Security: Marketing and Postharvest 1 October 2014, Quezon
City, Philippines.
Perez, R. 2014. Value Chain Improvement of Swine in Region 02. Paper presented
during the 2014 International Conference on Public Administration and Governance
Reforms and Innovations, 9-11 October 2014, Davao City, Philippines.
Phala, R.N. 2015. Using an Inferential Model to Estimate Dry Deposition of SO2 and
NOx (AS NO2) in Lephalale in the Waterberg-Bojanala Priority Area. MSc
Dissertation, Faculty of Science, University of the Witwatersrand.
Piesse, M. 2016. South Africa: Drought Threatens food, Energy and Water Security,
Global food and water crises research programmes, Independent strategic analysis
of Australia’s Global Interest. Strategic Analysis Paper, pp. 1-9.
Polokwane city, History of Limpopo. Accessible on
www.polokwanecity.co.za/limpopo/ Date accessed 12-06-2017.
Rit, B. 2014. Studies on Marketing Efficiency of Agricultural Products in India: A
Critical Evaluation. International Journal of Multidisciplinary Research and
Development, 1(7), pp.205-210.
Sawadogo, S., Nagy, J.G. and Ohm, H.W., 1985. Cereals–cowpea association in
Burkina Faso. In: Ohm, H.W., Nagy, J.G. (Eds.), Appropriate Technologies for
Farmers in Semi-arid West Africa. International Programs in Agriculture. Purdue
University, West Lafayette, Indiana, USA, pp. 249–259.

54
Seville, D., Buxton, A. and Vorley, B. 2011. Under What Conditions are Value Chains
Effective Tools for Pro-poor development? International Institute for Environment and
Development/Sustainable food lab, pp. 7-15.
Singh, B.B, Ajeigbe, H.A, Tarawali, S.A, Fernandez-Rivera, S. and Abubakar, M.
2003. Improving the Production and Utilization of Cowpea as Food and Fodder, Field
Crops Research, Volume 84, No. 1-2, pp. 169-177.
South Africa, A water-scarce country. Environmental affairs. Accessible from
https://www.environment.gov.za/sites/default/files/docs/water.pdf. Date accessed 09-
02-2017.
Sumalde, Z.M. and Quilloy, K.P. 2015. Improving Marketing Efficiency Through
Agricultural Cooperatives: Successful Cases in the Philippines. Institute of
Cooperatives and Bio-Enterprise Development, College of Economics and
Management, University of the Philippines Los Baños, pp. 1-16.
Swiss Agency for Development and Cooperation (SDC). 2013. Evaluation Policy.
Tarawali, S.A, Singh, B.B, Gupta, S.C, Tabo, R., Harris, F., Nokoe, S., Fernandez-
Rivera, S., Bationo, A., Manyong, V.M, Makinde, K. and Odion, E.C. 2002. Cowpea
as a Key Factor for a New Approach to Integrated Crop-Livestock Systems
Research in the Dry Savannas of West Africa. International Institute of Tropical
Agriculture, Ibadan, Nigeria, pp. 233-251.
Tarawali, S.A, Singh, B.B, Peters, M. and Blade, S.F.1997. Cowpea haulms as
fodder. International Institute of Tropical Agriculture (IITA) and Japan International
Resources Center Agricultural Science (JIRCAS). Sayce, Devon, UK, pp. 313–325.
Van Rensburg, W.S.J, Van Averbeke, W., Slabbert, R., Faber, M., Van Jaarsveld, P.,
Van Heerden, I., Wenhold, F. and Oelofse, A. 2007. African Leafy Vegetables in
South Africa. Agricultural Research Council, Center for organic and Smallholder
Agriculture, University of Pretoria, Volume 33, No. 3, pp. 317-326.
Waterberg District map. Accessible on
www.municipalities.co.za/province/view/5/limpopo. Date accessed 12-07-2017.
Weinberger, K., and Lumpkin, T.A. 2007. Diversification into Horticulture and Poverty
Reduction: A Research Agenda World Development 35, pp. 1464-1480.

55
Wuensch, K.L. 2015. Binary Logistic Regression with SPSS. Date accessed 23-08-
2017.

56
APPENDIX A: QUESTIONNAIRE
TITLE: VALUE CHAIN MAPPING AND MARKETING EFFICIENCY OF SMALLHOLDER COWPEA FARMERS IN CAPRICORN AND WATERBERG DISTRICTS
The main aim of the study is to map the value chain of cowpea and determine marketing efficiency of smallholder cowpea farmers in Ga-Molepo of Polokwane municipality Capricorn district and Towoomba of Bela-Bela municipality in Waterberg district, Limpopo Province. This study is only for academic purposes and the respondents who will take part in this study will not be forced to participate, but will participate on voluntary basis and the information provided for, by the respondents will be treated with confidentiality and not be used for anything else other than for this study.
RESEARCHER: CHRISTINA MAGOSEA MASEGELA
ENUMERATOR’S NAME: …………………………………………………………
DATE OF INTERVIEW: ……………………………………………………………
NAME OF THE RESPONDENT: …………………………………………………
NAME OF MUNICIPALITY: …………………………………………………………
QUESTIONNAIRE No.: ……………………

57
SECTION A: SOCIOECONOMIC CHARACTERISTICS
1. Gender of cowpea farmer:
1.Male 2. Female
2. Age of cowpea farmer: …….. 3. Marital status of the farmer:
1. Married 2. Single 3. Divorced 4. Widowed 4. Number of people in the household: …………………………………………………………………………………………… 5. How many years of schooling do you have? ……………………………………………… 6. Level of education of the farmer
1. Never went to school
2.Completed primary school
3.Completed secondary school
4. Completed tertiary school
5. ABET
7. What is the occupation of the farmer?
1. Full-time farmer
2. Part-time farmer
3.Government employee
4.Employed 5.Unemployed
6.Self-employed
7.Pensioner
8. Source of income of the farmer
1. Salary 2. Farming 3. Social Grant 4. Pension 5. Others
9. If others, please specify …………………………………………………
10. What is the income of the farmer per month? ……………………..
11. What do you use the money for?
1. Household purposes 2. Farming 3. Others
12. If others, please specify ………………………………………………………..

58
SECTION B: FARMING DETAILS
13. Do you have own land?
Yes No
14. What is the size of your land? ……………………………
15. Land ownership description
1. Own land 2. Leased 3. Purchased 4. Inheritance 5. Others
16. If others, please specify ……………………………………………………………………
17. For how many years have you been farming cowpea? …………………………….
18. When do you start planting cowpea? ………………………………………………….
19. How many hectares of land do you use to produce cowpea? ………………………….
20. Do you apply fertilizer?
Yes No
21. If yes, how much do you spend on fertilizer? ……………………………….
22. Do you apply pesticides?
Yes No
23. If yes, how much do you spend on pesticides? ……………………………..
24. Do you use labour?
Yes No
25. If yes, what kind?
1. Hired labour 2. Family labour 3. None 4. Others
26. If others, please specify ……………………………………………………………………
27. How many people do you hire? ………………………………………………..
28. On average, how much do you pay each person per day? ……………………………..

59
29. Do you produce any other crops?
Yes No
30. If yes, which crops?
1. Maize 2. Sorghum 3. Sweet potato
4. Spinach 5. Others
31.If others, please specify …………………………………………………………………..
SECTION C: VALUE CHAIN AND MARKETING DETAILS
32. Do you sell cowpea?
Yes No
33. If yes, how much do you get from selling cowpea? ……………………………………...
34. At what quantity and price are selling cowpeas for?
Quantity Price
35. Who do you sell cowpeas to?
1. Hawkers
2. Contractors
3. Directly to final consumer
4. Factories
5. Wholesalers
6. Middlemen
7. Retailers
8.Local supermarkets
9. Others
36. If others, please specify ……………………………………….
37. Do you have access to formal market?
Yes No
38. If yes, what is the distance to the market? ………………………………………..

60
39. How do you get your produce to the market?
1. Own transport 2. Hired transport 3. Buyers come by themselves
4. Others
40.If others, please specify ……………………………………………………………………
41. What type of costs do you incur when marketing your product?
1. Transport costs
2. Packaging costs
3. Handling costs
4. Storage costs
5. Others
42. If others, please specify …………………………………………………………………
43. How much do you spend as per above? ……………………………………………..
44. How much do you spend on moving your product to the market? ……………………..
45. Do you receive extension services?
Yes No
46. If yes, for how long have been receiving the services? ………………………
47. How often do you receive the services?
1. Everyday 2. Once a week
3. More than once a week
4. Once a month
5. More than once a month
6. Others
48. If others, please specify ………………………………………………………………
49. Who provides extension services?
1. Government department
2. Non-governmental organization
3. Development agent
4. Others
50.If others, please specify ………………………………………………………………….
51. Do you have access to agricultural information?
Yes No

61
52. If yes, how do you access it?
1. Internet
2. Television
3. Radio
4. Farmers
5. Magazines
6. Farmers’ meetings
7. Farmers’ information day
8. Others
53.If others, please specify ………………………………………………………………….
54. Do you have access to formal agricultural credit?
Yes No
55. If yes, what was the main purpose of borrowing?
1. Purchase land
2. Purchase farm implements
3. Purchase farm inputs
4. Debt repayment
5. Others
56. If others, please specify …………………………………………………………………
57. Where do you access formal agricultural credit?
1. Commercial banks
2. Agricultural banks
3. Credit facilities
4. Government
5. Friends or family
6. Cooperatives
7. Others
58. If others, please specify…………………………………………………………………….
59. Do you process cowpea?
Yes No
60. If yes, how much do you pay for processing? …………………………………………
61. What other challenges do you encounter when producing, marketing and selling cowpea?
…………………………………………………………………………………………………
…………………………………………………………………………………………………
…………………………………………………………………………………………………
…………………………………………………………………………………………………
…………………………………………………………………………………………………
…………………………………………………………………………………………………