


Languages
Pages
Legal


Capstone Final Report
Inventory Management and Storage Optimization for Health Care System
IE 4800
Fall2008-Winter 2009
Team Members: Kyong Kim, Project Manager
Yusuf Ahmed, Communication Lead
Instructor: Dr. Alper Murat
Dr. Dean Pichette
ii
Executive Summary
Henry Ford Health System is one of the nation’s leading health care providers and
is Michigan’s non-profit health care enterprise governed by community leaders. Henry
Ford Health System carries about $9 million in disposable inventory (excluding implants)
items and has an ineffective inventory management system in place. This issue creates
excessive inventory cost and space for safety stock levels. Also, inventory storage room
is not centralized causing long lead time to locate inventory, longer walking distance, and
increase in time to transfer items from storage rooms to operating room suites. To
control inventory management system, proper methodology will be applied. This will
include data collection, operation research method, and supply chain inventory
management tools. The duration of this project will undertake approximately six months
and the expectation is to provide a solution that will control the level of disposable
inventory in the operating rooms as well creating a model that will provide a
centralization solution for storage locations.
iii
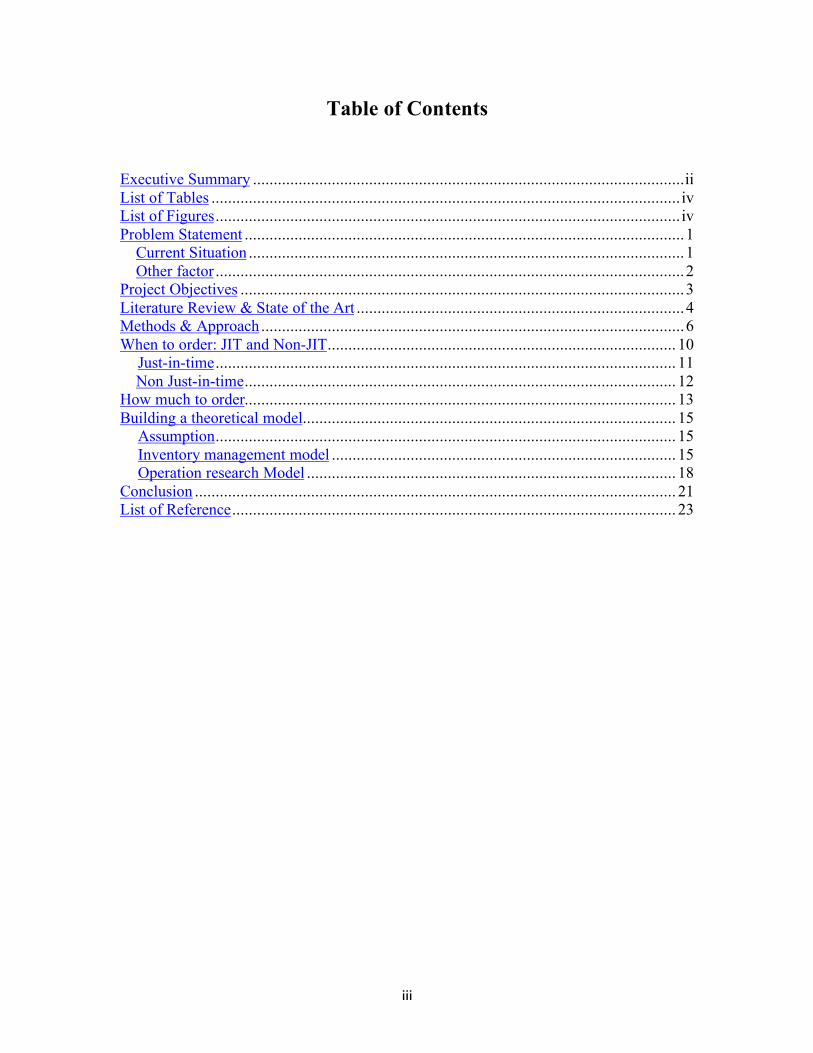
Table of Contents
Executive Summary ........................................................................................................ii List of Tables ................................................................................................................. iv List of Figures................................................................................................................ iv Problem Statement ..........................................................................................................1
Current Situation .........................................................................................................1 Other factor .................................................................................................................2
Project Objectives ...........................................................................................................3 Literature Review & State of the Art ...............................................................................4 Methods & Approach ......................................................................................................6 When to order: JIT and Non-JIT.................................................................................... 10 Just-in-time............................................................................................................... 11
Non Just-in-time........................................................................................................ 12 How much to order........................................................................................................ 13 Building a theoretical model.......................................................................................... 15 Assumption............................................................................................................... 15 Inventory management model ................................................................................... 15 Operation research Model ......................................................................................... 18 Conclusion .................................................................................................................... 21 List of Reference........................................................................................................... 23

iv
List of Tables
Table 3.1 Inventory Management Model Sumamry…………………………………….16 Table 3.2 Maximum Inventory………………………………….…..…………………..16 Table 4.1 Distance based on from to chart……………………………………………...18 Table 4.2 Usage/trips table……………………………………………………………...18 Table 4.3 Weighted Distance……………………………………………………………18 Table 5.1 Storage Capacity……………………………………………………………...19 Table 5.2 Assignment (Operation Research Model)…………………………………....19 Table 5.3 Capacity Utilization (Operation Research Model)…………………………...20 Table 5.4 Objective Function (Operation Research Solution)………………………….21
List of Figures
Figure 1.1 ROP Model ............................................................................................... 12 Figure 1.2 Cycle Service Level ................................................................................... 12 Figure 2.1 Inventory Cycle (Many Orders).…………………………………………….13 Figure 2.2 Inventory Cycle (Few Orders)……………………………………………….14 Figure 4.1 From to illustration………………….………………………………………18

1
Project Scope
The project initially was supposed to be an implementable project that would be
delivered to the client. However, in December the initial scope of the project which
involved providing HFHS with an inventory optimization and storage centralization
model was changed from being a deliverable project to more of a theoretical one. The
main lead for our project departed from HFHS and the scope of the project was revised so
that it can be completed on time. The acquisition of data became extremely difficult
mainly because there were too many people involved that needed to be in the loop to
provide the data we required. The data we needed to acquire was no longer available to
us and in order to build our model and we had to make key assumptions about the
inventory data to construct and deliver the final project. The scope has not changed and
the project still focuses on how to optimize the inventory in a service sector environment
such as a hospital and how storage room capacities can be effectively utilized to reduce
walking distance from the operatories.
Problem Statement
Hospitals and health care providers in general are being increasingly pressured by
yearly cost increases and struggle to remain profitable and competitive.
Because the fundamentals of industrial engineering were developed in
manufacturing environments, the concepts of “Just-In-Time” and lean operating
(manufacturing) have not traditionally been applied to hospitals and their implementation
can offer the industry huge savings.

2
A surplus of inventory that is not tracked or utilized properly can considerably
impact revenue due to cost overruns and poor management. With money tied up in
unutilized inventory, it affects funding for other purposes, such as capital expenditures
and staff salaries.
Without changing the status quo, Hospitals will continue to waste money, thereby
directly impacting its bottom line.
Other Factors
HFHS Anesthesia inventory is not centralized, tracked, or utilized, and is located
in one of nine storage rooms on the fourth floor. This lack of organization makes the
problem worse, as no one person on the staff of HFHS is currently aware of what
supplies are in stock, or how much might be onsite. With overstocking comes additional
issues, as many of the supplies are no longer used, as well as many of the supplies have a
specific shelf life for when it can be utilized.
Items are ordered with a “Just in Case” philosophy; JIC is an emotional factor as
opposed to a statistical approach, and can best be summarized by a “better safe than
sorry” mentality. Surgeons have personal preferences for tools and other stock items,
which vary by person. As nurses are responsible for the stock, there is also a strong
tendency to avoid any possibility of a confrontation with an irate surgeon, which leads to
additional stock order “padding.”
Additional factors that this project must consider are disposable and implants
(perishable) item shelf life and “seasonality” of procedures. Both items have certain shelf
lives that must be tracked on order to not fall short when items are needed. Hospital
3
staffs also tend to grab the most recent inventory arrivals, or FIFO (first in first out)
usage, instead of LIFO (last in first out) which exacerbates this issue. Operations also
have seasonal elements, which must be tracked as part of the inventory management in
order to remain proactive and not be caught off guard when usage of certain items
increases greatly otherwise unexpectedly.
The benefit of using an JIT supplier is that it alleviates the responsibility of
handling the ordering of items and outsourcing this logistic function to a third party
logistic provider allows a hospital to be more responsive. If a hospital handled and
managed this aspect of the SCM they would have to keep large amounts on inventory
onsite and their lead time would significantly increases by having to deal with direct
suppliers.
Project Objectives
The objectives of this project are to provide solution for the control of disposable
inventory, centralization solution for storage locations, and to decide the content of each
room. For the purpose of this project, there are two types of inventory, JIT and non-JIT.
For the JIT stock items, we must calculate the required levels of safety stock, ROP( re-
order point) and the appropriate CSL(cycle service level) level by taking into
consideration the lead time or the period between when the item is ordered and when the
item is delivered. For the JIT Item we will focus on the periodic review policy. For the
non-JIT items, we must determine not only the safety stock levels, but also using the
fixed order interval model what the order interval is going to be based on current levels

4
and usage on items on a sixty day usage by the operatories. The non-JIT items will be
analyzed on a continuous inventory review policy.
Literature Review & State of the Art
The manual method of operational research for the hospital supply service was
developed in the 1960’s. Operation research studies, stock control system and stores
centralization methods were conducted. With satisfactory outcomes, it provided positive
impact in hospital supply. Computers are now become a powerful tools for OR and
scientific research.
Stock control:
In the 1950s, no proper method of stockholdings existed, nor general formula for
guidance to reasonable stockholding. Instead, maximum level of stockholding for stores
was guided by the Minister of Health. The study began in 1969; the objective was to
develop a system which allows improving stock control throughout the health provider.
Economic order quantities and reorder level method was developed to
accommodate the balance between total number of orders with total stock held. When
calculating reorder levels, usage and the lead-time demand data was required. Also,
proper operating ordering system aid to minimize total inventory costs. In this case, bulk
items, cost ratio, discount rate (bulk items) were examined because it would affect the
annual turnover cost.
After setting up trial and implementation systems, nearly 20 stores saved 10
percent in space saving on average within six months to a year.

5
Centralization:
In 1970, operation researchers began their study to determine alternative feasible
solutions other than having store located at each health system. There were two
alternative possible solutions: Warehouse plus sub-store system and the central store.
The idea of “warehouse plus sub-store” is purchasing goods in bulk items by
warehouse which than distributes few goods to sub-stores. These items from sub-stores
can dispense to departments or individuals within the hospital. The remainders of bulk
items are stocked in the warehouse. The second idea of having the “central store” is
purchasing goods in bulk items by the central store and supply goods to departments or
individuals in the hospital. This means it can operate all functions within one location.
Next approach was to identify costs for each system than build a model to
distinguish the cost difference and the degree of centralization. The operation costs are
essential system to analyze because it relates to “stock control” models. In this analysis,
it requires large amount of data collection on unit price, demand, and volume availability
in stock/storage. With these data, economic order quantity (stock control method) can be
calculated which provides holding costs and order costs that are related to the working
stock.
Based on their research, the total costs of operating an “area warehouse plus sub-
stores” at hospital is only fractionally cheaper than general hospital stores, whereas
operating a “central-stores” cost saving is just over 50 percent.

6
Operation Research And Computers:
Computers are now used as tools for all engineers and field of operation research,
allowing engineers to build large, complex, and realistic models, than simulate those
models to generate solutions. Computer software such as Microsoft Excel (spreadsheets)
can obtain multiple sets of data base, analyze, and assist decision making in complex
problems. MS Excel solver is an ultimate tool to calculate optimization to OR problems.
Methods & Approach
The methodology and approach for this project will mainly focus on operation
research and supply chain management. Safety stock, ROP and the EOQ model will be
used to determine what the ideal level of inventory should be kept at each point.
Determining the amount of JIT and non-JIT inventory on hand for each item on a sixty
day consumption period will be calculated using the EOQ model. The items will have a
daily usage and demand for those items will dictate as to how much is needed and what
optimal levels of safety stock should be kept on hand to avoid over or under stock
scenarios during order delivery. The lead time for JIT items is assumed to be 1 day and
the CSL is taken to be about 99 percent with 1 percent risk of a stock out. The assumed
usage data for the disposable item will be evaluated and analyzed and eventually be used
towards the second phase of the project.
The non-JIT items will utilize the same assumptions but a fixed order interval
(FOI) model will be used to calculate the appropriate levels of safety stock. The second
phase will involve setting up a model using operation research methodologies and
principles that will provide a solution on how to effectively reduce lead time by
7
aggregating the SKU items of interest and how walking distance can be reduced from
operatories to storage locations. The data collected from the first phase will be used
towards the implementation of the OR model.
First Phase:
The first phase of the project will deal with supply chain inventory management
principles and our goal during this phase is to determine what the optimal order lot size is
as well as how much safety stock should be optimally stored in the storage rooms to
reduce the assumed holding and order costs. The EOQ formula will be used to determine
the optimal order lot size from the order data and usage data . Total ordering and holding
costs are relatively stable around the EOQ.
In order to determine the optimal lot size the appropriate level of cycle inventory
should be known. Cycle inventory is the average inventory that builds up in the supply
chain because a supply chain stage either produces or purchases in lots that are larger
than those demanded by the customer. Primary role of cycle inventory is to allow
different stages to purchase product in lot sizes that minimize the sum of material,
ordering, and holding costs. Higher level of cycle inventory is not always the desirable
scenario so determining when to order and how much to order is beneficial to cost
savings. The objective is to arrive at a lot size and an ordering policy that minimizes the
total cost to store and manage inventory.
The amount of safety inventory that should be kept on hand for JIT and non-JIT
items is an important issue that needs to be addressed. Safety stock is Inventory carried
for the purpose of satisfying demand that exceeds the amount forecasted in a given

8
period. If a company only kept enough inventories in stock to satisfy average demand,
half the time they would run out. Raising the level of safety inventory provides higher
levels of product availability and customer service. However, the raising the level of
safety inventory also raises the level of average inventory and therefore increases holding
costs. The goal of the project is to determine how much safety stock to keep on hand to
minimize allocation of storage space and holding cost. The usage will allow the EOQ
model to determine the appropriate re-order point and safety stock levels. The input from
this phase will be used towards the OR model which will focus on minimizing the
walking distance from the storage rooms to the operatories and what items should be
aggregated based on the objective function and its constraints to optimize storage
allocation.
Second Phase:
Aggregation of inventory into a central location will be the focus of the second
phase of the project and operation research principles will be used to determine the
required variables and constraints for the model. The model will be built using Excel
Solver and the data collected and analyzed during the first phase will allow the model to
minimize the objective functions identified for this project.
. The amount of disposable inventory in each location will determine whether or not that
particular storage should be kept open or not. The goal will be to reduce the storage space
and minimize walking distance from storage locations to operatories.

9
Scope, Charter, & Deliverables List
Key deliverables for the project:
1. Determining inventory policies (safety stock and working inventory for JIT and non-JIT
2. Centralization of inventory storage in the OR theater of HFHS Main Center.
Objective, constraint and risks:
1. Non-availability of data
2. Maximize profit
3. Minimize cost
4. Centralize inventory stocking point and minimize walking distance
Key Stakeholder:
• PROJECT TEAM
o Course Sponsor: Dr.Murat
o Project Leader: Kyong Kim
o Team Member or Role: Yusuf Ahmed (Communication Lead)
When to order: Just-in-time and Non-Just-In-Time

10
In deciding when to place an order, it depends on quantity demand and/or lead time. The
demand and lead time can be a constant value or variable, depending on the situation.
Distinguishing between constant and variable for demand, it relies on usage information. In
Henry Ford Health system, the demand is variable because the number of surgeries will always
be different for each day; which will result in fluctuation in usage data.
To identify if the lead time will be constant or variable, depends on Henry Ford Health
System’s supplier. When placing order for ‘Just-In-Time’ items, Owens & Minor distributes
medical supplies to HFHS within the next day. This leads to constant lead time as result of
promise of consistent delivery time frame. There are other medical suppliers which provide
services to HFHS. These particular items are purchased in bulk quantities for Non-JIT supplies.
Moreover, each individual supplier cannot guarantee to deliver their shipment in the same time
frame (lead time); therefore the lead time becomes variable for Non-JIT items.
After the demand and lead-time has been determined, you can identify when to place an order
based on “Reorder point” equation.
• If only demand is variable, then dLT
! = LTd
! , and the reorder point
is LTZLTdROPd
!+= * (1.1)
• If only lead time is variable, then dLT
! =dLT
! , and the reorder point is
LTZdLTdROP !+= * (1.2)
• If both demand and lead time are variable, then
LTd dLTZLTdROP222
* !! ++= (1.3)
Where:

11
d = Average daily or weekly demand
D = Daily or weekly demand
LT = Lead time in days or weeks
LT = Average lead time in days or weeks
d
! = Standard deviation of demand per day or week
LT
! = Standard deviation of lead time in days or weeks
Just-In-Time (Owens and Minors)
As previously mentioned, Henry Ford Health System will always have variable demand
for their medical supplies. When items are purchased through Owens and Minors, the supplier
will deliver the product within next day; which makes the lead time constant. According to this
information, we will use following equation (1.1) to determine reorder point.
( )
dSLLT
LT
LTzLTdSSD
DROP
!+=+=
+= stocksafety average
“When variability is present in demand or lead time, it creates the possibility that actual demand
will exceed expected demand. Consequently, it becomes necessary to carry additional inventory,
called safety stock, to reduce the risk of running out of inventory (a stock out) during lead time
(Stevenson, 564)”. It is also important for a manger to carefully weigh the cost of carrying
safety stock against the reduction in stock out risk due to the costs money to hold safety stock.
To reduce the chance of stock out, the customer service level method can be applied. The
order cycle service level can be defined as the probability that demand will not exceed supply
during lead time. As the service level increases, safety stock level increase while reduces the

12
stock out risk. For example, a customer service level is 99 percent implies a stock out risk of 1
percent.
Service Level = 100 percent – Stock out risk.
The figure 1.1 and 1.2 provides general ideal how ROP and safety stock can be effected based on
a normal distribution of lead time demand.
Figure 1.1 Figure 1.2
Non Just-In-Time (other suppliers)
As previously mentioned, inventory management consist of two different concepts: periodic
reviews and perpetual inventory system. The idea of periodic inventory review is to keep track of
removals from inventory at specific intervals (weekly, monthly). As for Non-JIT items at HFHS, this
method are used, also known as “Fixed-order-interval model (FOI)”; where orders are placed at fixed
time interval. The purpose of using this model is to produce potential savings in shipping costs when
supplies are purchased in groups.
13
How much to order: Just-in-time and Non-Just-in-time
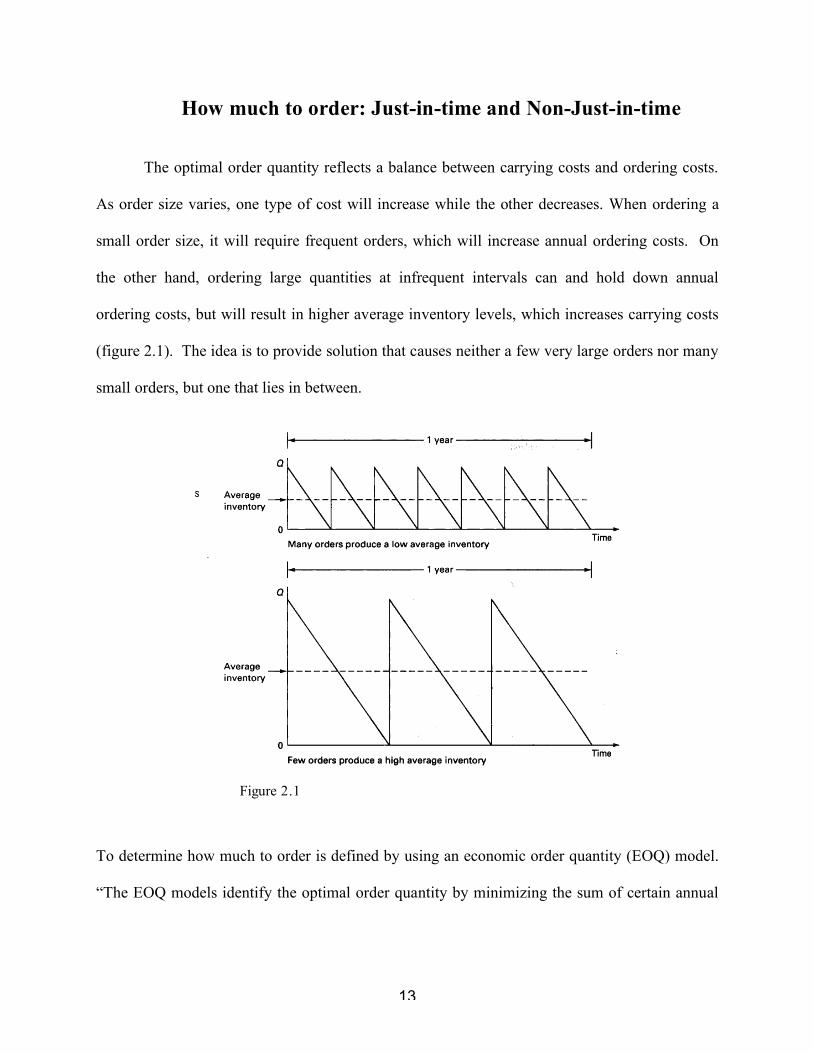
The optimal order quantity reflects a balance between carrying costs and ordering costs.
As order size varies, one type of cost will increase while the other decreases. When ordering a
small order size, it will require frequent orders, which will increase annual ordering costs. On
the other hand, ordering large quantities at infrequent intervals can and hold down annual
ordering costs, but will result in higher average inventory levels, which increases carrying costs
(figure 2.1). The idea is to provide solution that causes neither a few very large orders nor many
small orders, but one that lies in between.
Figure 2.1
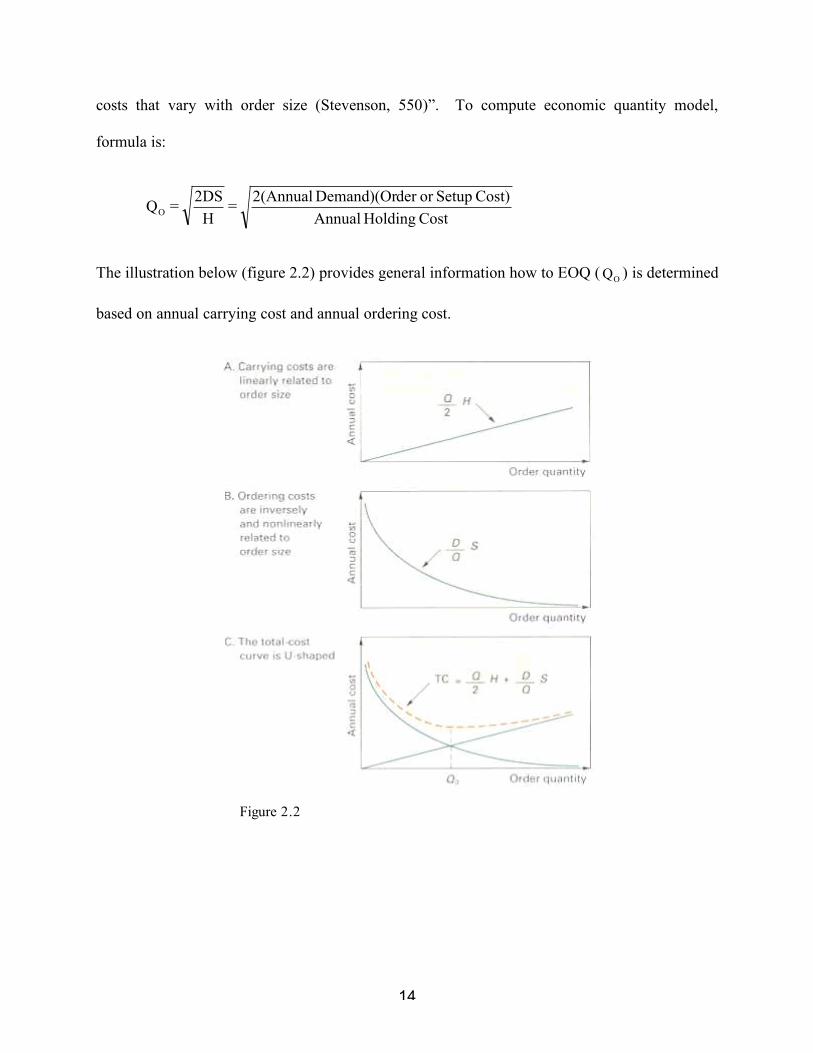
To determine how much to order is defined by using an economic order quantity (EOQ) model.
“The EOQ models identify the optimal order quantity by minimizing the sum of certain annual
14
costs that vary with order size (Stevenson, 550)”. To compute economic quantity model,
formula is:
Cost Holding Annual
Cost) Setupor der Demand)(Or 2(Annual =
H
2DS = QO
The illustration below (figure 2.2) provides general information how to EOQ (OQ ) is determined
based on annual carrying cost and annual ordering cost.
Figure 2.2
15
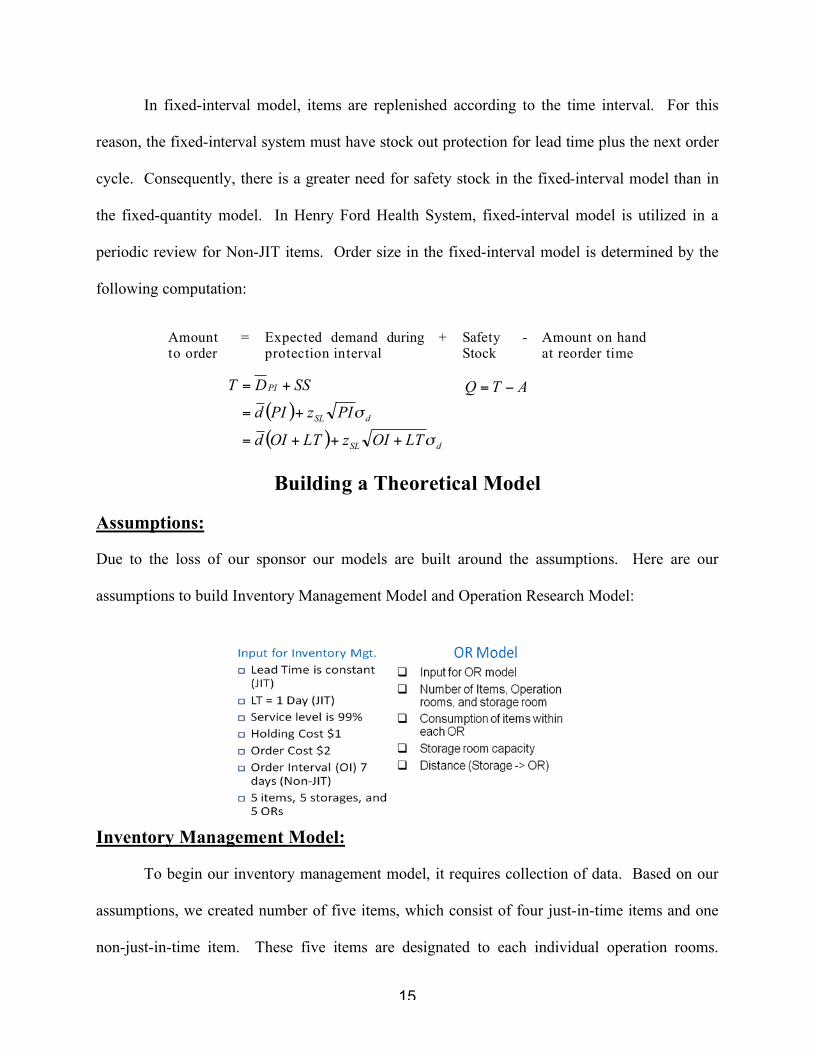
In fixed-interval model, items are replenished according to the time interval. For this
reason, the fixed-interval system must have stock out protection for lead time plus the next order
cycle. Consequently, there is a greater need for safety stock in the fixed-interval model than in
the fixed-quantity model. In Henry Ford Health System, fixed-interval model is utilized in a
periodic review for Non-JIT items. Order size in the fixed-interval model is determined by the
following computation:
Amount to order
= Expected demand during protection interval
+ Safety Stock
- Amount on hand at reorder time
Building a Theoretical Model
Assumptions:
Due to the loss of our sponsor our models are built around the assumptions. Here are our
assumptions to build Inventory Management Model and Operation Research Model:
Inventory Management Model:
To begin our inventory management model, it requires collection of data. Based on our
assumptions, we created number of five items, which consist of four just-in-time items and one
non-just-in-time item. These five items are designated to each individual operation rooms.
( )
( )dSL
dSL
PI
LTOIzLTOId
PIzPId
SSDT
!
!
+++=
+=
+= ATQ !=
16
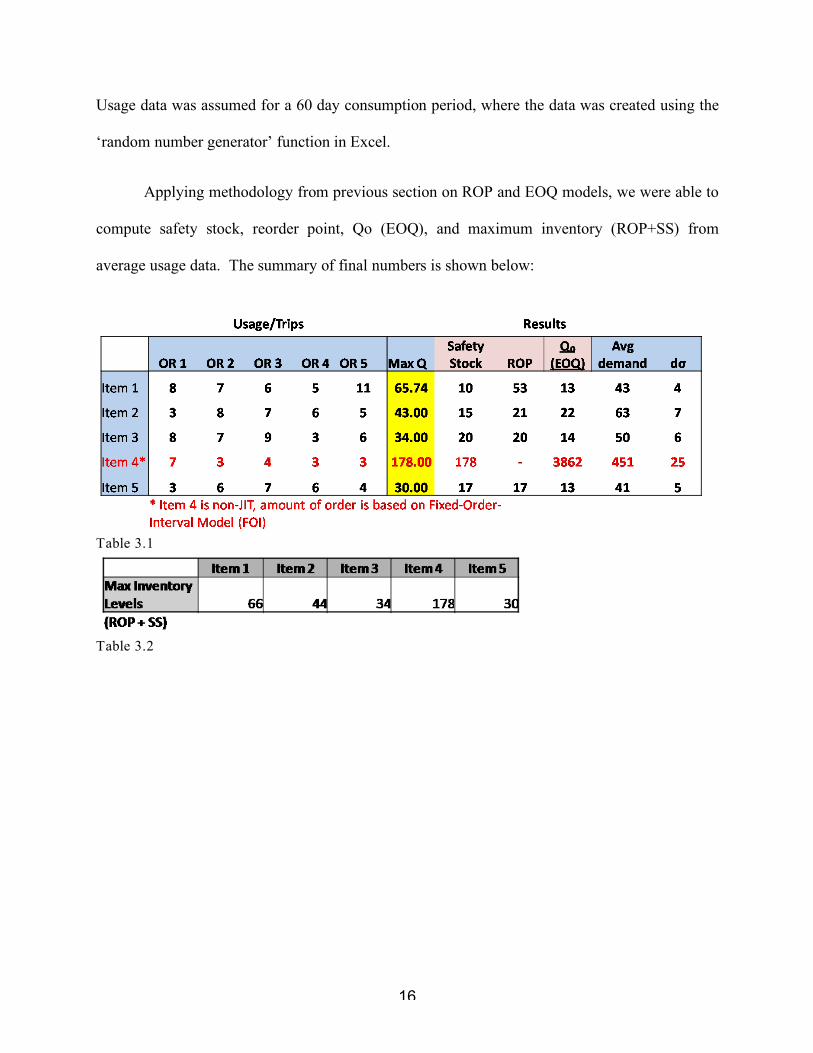
Usage data was assumed for a 60 day consumption period, where the data was created using the
‘random number generator’ function in Excel.
Applying methodology from previous section on ROP and EOQ models, we were able to
compute safety stock, reorder point, Qo (EOQ), and maximum inventory (ROP+SS) from
average usage data. The summary of final numbers is shown below:
Table 3.1
Table 3.2

17
To illustrate how this model works, consider the following example:
For example in item 1, maximum inventory is addition of reorder point and safety stock.
When this particular item is being utilized, the usage rate continuously decreases. Once the
inventory level reaches 53, HFHS places an order for quantity of 13. This allows HFHS to place
an order to achieve right amount of quantity without stock out at minimal annual cost.
18
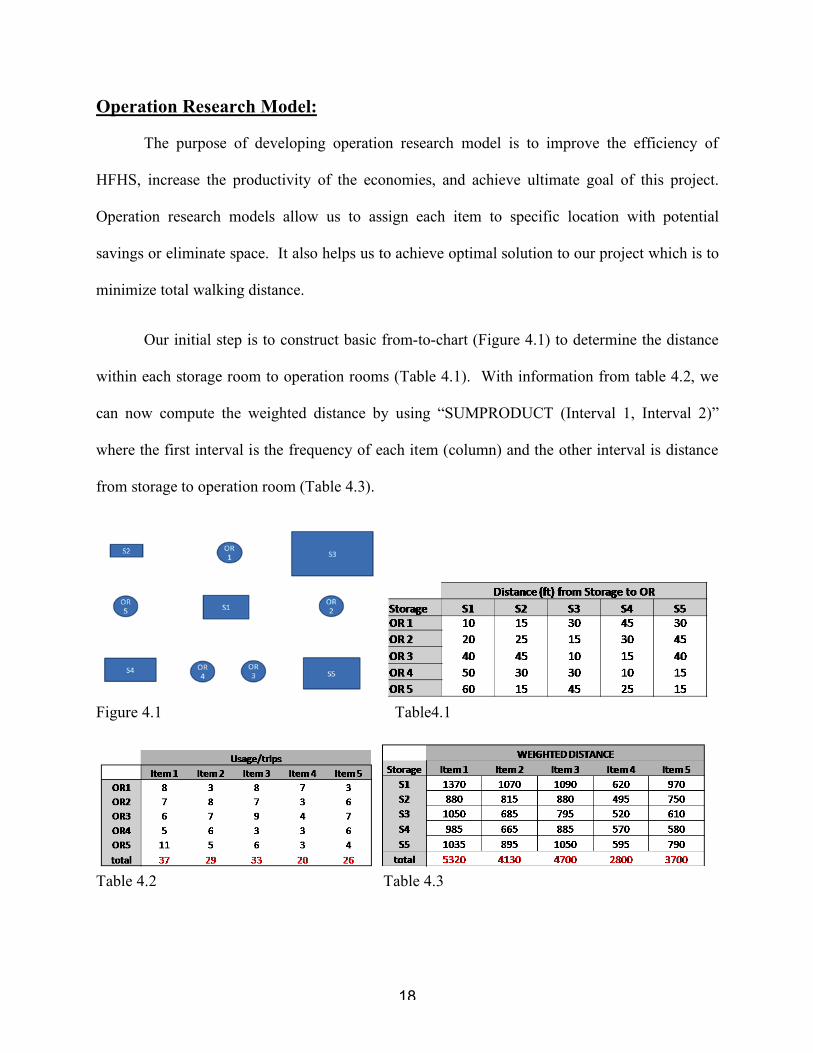
Operation Research Model:
The purpose of developing operation research model is to improve the efficiency of
HFHS, increase the productivity of the economies, and achieve ultimate goal of this project.
Operation research models allow us to assign each item to specific location with potential
savings or eliminate space. It also helps us to achieve optimal solution to our project which is to
minimize total walking distance.
Our initial step is to construct basic from-to-chart (Figure 4.1) to determine the distance
within each storage room to operation rooms (Table 4.1). With information from table 4.2, we
can now compute the weighted distance by using “SUMPRODUCT (Interval 1, Interval 2)”
where the first interval is the frequency of each item (column) and the other interval is distance
from storage to operation room (Table 4.3).
Figure 4.1 Table4.1
Table 4.2 Table 4.3

19
For example, consider first cell (1370) on table 4.3. The number is computed by
“SUMPRODUCT (Item1, S1)”. This concept is applied to every cell in the parameter to
determine the total weighted distance. Weighted distance can be defined as true distance based
on number of frequency attempted within destination points.
Our next step is to identify objective and constraints. The objective as mentioned from
previous statement is to minimize total walking distance travel. This is achieved by adding all
possibilities based on assignment, distance, and frequency. In mathematical terms, it is defined
as following:
Objection Function Minimize Z = ∑∑∑Assignment(Y, N) x Distance x Frequency
Our constraints only consist of two of the followings: capacity and assignment. Once we
have identified our objective and constraints, we can move on to the next step.
We start by developing parameters to fulfill capacity (capacity in each storage room is an
assumption) and assignment constraints. The capacity constraint parameter can be determined
by using the maximum inventory (table 3.2) multiply by the assignment.
Table (5.1) Table (5.2)

20
Table (5.3) For instance, refer to the cell on first column and second row (66) on table 5.3. First, understand
that this cell is “item 1 and storage 2”. If you refer to table 3.2, where the maximum inventory
for item 1 is 66; which is multiplied by “item 1 and storage 2” cell on assignments parameter
(table 5.2).
The parameter on the assignment constraints (table 5.2) is developed by using Microsoft
Excel Solver. Providing constraints on MS Solver (each items are equal to one and total
maximum inventory is less than or equal to capacity of each storage) can create correct answers
on the assignment parameter.
After two parameter are finalized, double check to see if the numbers make sense. As you
can see, each item in Table 5.3 does not exceed the maximum capacity nor does storage capacity.
This satisfies assignment problem.
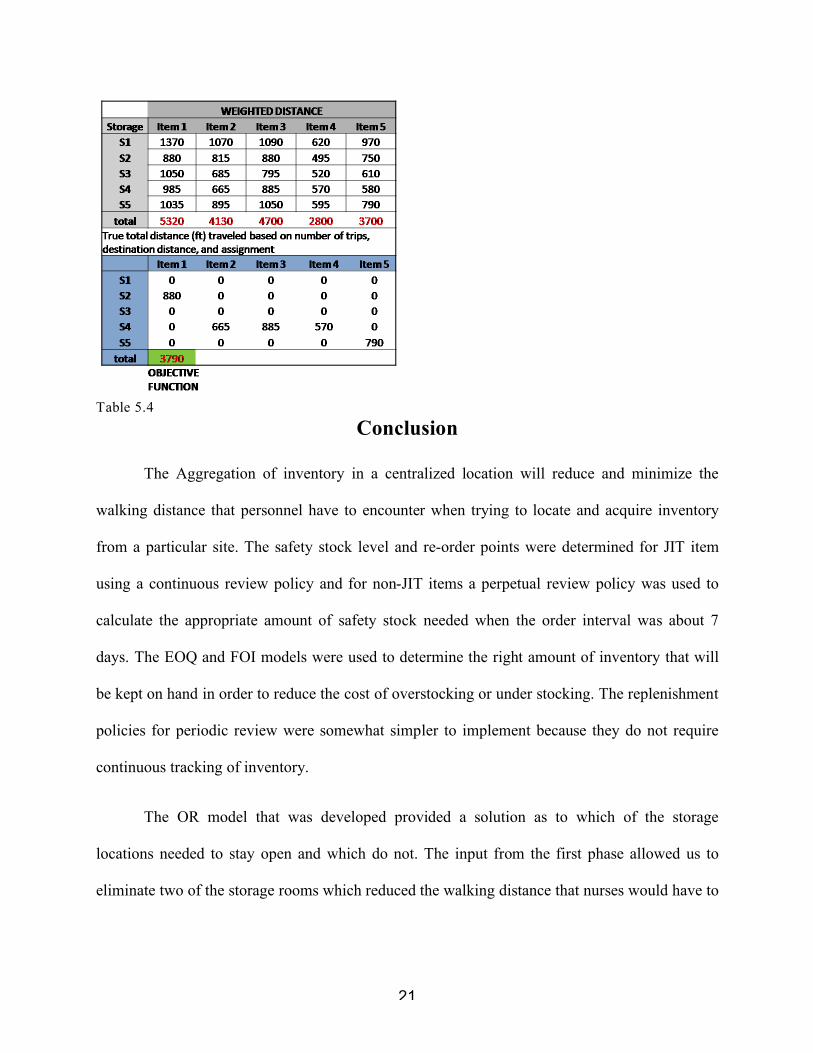
On final step, we have to answer our objective function. In order to develop minimal
travel distance, we have to refer to assignment table (5.3) and weighted distance table (4.3). This
is done similar to our previous assignment method. First, we developed another parameter to
determine true distance. True weighted distance parameter can be calculated by multiplying
assignment and weighted distance within same interval (item, storage). Table 5.4 illustrates the
final results. The total minimum walking distance is 3,790 feet.
21
Table 5.4
Conclusion
The Aggregation of inventory in a centralized location will reduce and minimize the
walking distance that personnel have to encounter when trying to locate and acquire inventory
from a particular site. The safety stock level and re-order points were determined for JIT item
using a continuous review policy and for non-JIT items a perpetual review policy was used to
calculate the appropriate amount of safety stock needed when the order interval was about 7
days. The EOQ and FOI models were used to determine the right amount of inventory that will
be kept on hand in order to reduce the cost of overstocking or under stocking. The replenishment
policies for periodic review were somewhat simpler to implement because they do not require
continuous tracking of inventory.
The OR model that was developed provided a solution as to which of the storage
locations needed to stay open and which do not. The input from the first phase allowed us to
eliminate two of the storage rooms which reduced the walking distance that nurses would have to

22
travel to obtain items. The objective function and the constraints used to define our parameters
for our OR model found the optimal solution by aggregating items in storage rooms 2, 4and 5.
The benefit of this model in an implementable manner along with accurate and real-time
data can provide a health care system an opportunity to reduce their inventory surplus and allow
them to track what the optimal safety stock level should be. Reduction in storage room and
optimization of ordered items provides more visibility in s supply chain management and it
allows a health care system to be more responsive towards their SKU ordering system. The lead
time to locate items was reduced by reduction in storage rooms and the storage rooms that were
freed up of inventory can be utilized for other purposes.
23
List of References
Chopra, Sunil. And Peter Meindl. “Managing Economies of Scale in the Supply Chain: Cycle Inventory.” Supply Chain Management. Prentice Hall, 2006. Chapter 10.
Chopra, Sunil. And Peter Meindl. “Managing Managing Uncertainty in the Supply Chain: Safety Inventory.” Supply Chain Management. Prentice Hall, 2006. Chapter 11.
"Operations Research." Encyclopædia Britannica. 2008. Encyclopædia Britannica Online. 12 Dec. 2008 <http://www.britannica.com/EBchecked/
Topic/682073/operations-research>.
Smith, Gregory, J.D. Maguire. “Operational Research for the Hospital Supply Service.” Operational Research Quarterly. Vol 26. Palgrave Macmillan Journals, 1975. 375-388.
Top Related