


Languages
Pages
Legal


Annual Report of E-learning project:Site Investigation Simulation Program
Part II: Laboratory tests
Project number: 2011.21101.01.2011 - 31.12.2011
Chien-Hsun Chen (Project Leader)Department of Infrastructure
Devision of Geotechnical and Tunnel Engineering
January 19, 2012
1

Contents
1 Introduction 3
2 Site Investigation Part II 42.1 The task . . . . . . . . . . . . . . . . . . . . . . . . . . . . . . 42.2 Database and laboratory tests . . . . . . . . . . . . . . . . . . 42.3 Formal reports: laboratory Tests and in-situ dynamic probing. 6
2.3.1 Some remarks of reproducing the lab test reports . . . 92.4 Explanation and hint for each laboratory test . . . . . . . . . 212.5 Prices of tests . . . . . . . . . . . . . . . . . . . . . . . . . . . 232.6 Graphical User Interface . . . . . . . . . . . . . . . . . . . . . 23
3 The target User 243.1 Soil mechanics and foundation engineering I
(Bodenmechanik und Grundbau I: VL und UE) . . . . . . . . 263.2 Soil mechanics and foundation engineering II
(Bodenmechanik und Grundbau II: VL und UE) . . . . . . . . 263.3 Advanced foundation engineering
AK Grundbau (VL) . . . . . . . . . . . . . . . . . . . . . . . . 273.4 Laboratory tests of soil mechanics
Bodenmechanisches Versuchswesen (SE) . . . . . . . . . . . . 27
4 P-code 27
5 Program copy right 28
6 Acknowledgment 28
2

1 Introduction
A good foundation ensures the stability of the structure standing above it.The proper design as well as the following construction of a good foundationrely on the good understanding/evaluation of in-situ underground conditions.Therefore, no good constructions/designs can flee from carrying out propersite investigations, as it is the key to the safe design of structures and thekey to personnel safety during construction as well.
The aim of this program is to simulate the site investigation being car-ried out during design phase. By carrying out a site investigation plan, theunderground conditions can be better understood and the required param-eters for design or numerical analyses can be obtained through in-situ tests(e.g. dynamic probing in Austria, SPT in American and Italian, CPT inNetherlands) and by sending specimens retrieved from in-situ boreholes tolaboratory for testing. The types of laboratory test required to be carriedout are decided by the engineers based on the type and the function of thestructure to be built (e.g., the type of foundations, the amount of loading),the geometrical conditions (e.g., on a slope, on a clip, flat land), the ge-ological conditions (e.g., old riverbed, glacial area, alluvial area), and etc.Therefore, one needs some practice before being able to carry out proper orbetter site investigations. To achieve that, the program was designed to beable to carry out the Dynamic probing heavy being often used in the Austriaand Germany (in-situ tests), as well as various laboratory tests.
This project “Site Investigation Simulation Program” consists of Part Iand Part II. Part I was finished in the year of 2010. It focused on devel-oping various 3D geological models and the graphical user interface (GUI)in Matlab. In addition, the in-situ test (SPT-N value) and in-situ sampling(engineering borings) can be carried out in the simulation. Three type offoundations combined with 4 different geological models provides 12 varioustasks are provided. By involving a special random number technique, theprogram provides 10000 cases for students with varying underground con-ditions. That random number technique also promises an arbitrary case tobe re-produced based on a case code, which could be used for the instruc-tor to re-generate cases while discussing with the users. For details of thedeveloped models and GUI in the project Part I, reader are referred to theannual report of the project Part I. As students who enrolled in the technicaluniversity at the University of Innsbruck have free assess to Matlab withinthe campus network or at home through VPN connections, they may run theprogram any time anywhere.
The features developed in project Part I made it possible to become apowerful tool to help students with learning site investigation by implement-
3

ing laboratory tests. Implementation of laboratory tests is therefore the maintask of the project Part II. The goal of project Part II has been reached in theend December 2011. In the simulation of site investigation, if the user carryout the in-site sampling (drilling boreholes), the specimen can be deliveredto a laboratory for further test. Therefore, the project Part I and Part IImake the program a great tool for student to get to know site investigationand can practice with it.
The achievement of the project part II and its usage in some of the coursesare detailed in the coming sections.
2 Site Investigation Part II
2.1 The task
The main task of the site investigation project Part II, as also detailed in theproposal of the project part II, is to
1. create a database of laboratory tests;
2. make conducting laboratory tests in the simulation program possible.
The task has been fulfilled and is detailed in the following sub-sections.
2.2 Database and laboratory tests
The created database (which will be detailed in a later section) providesthe information to produce the following laboratory tests as promised in theproposal (listed bilinqually: English — German):
1. Water content (w) — Wassergehalt (w)
2. Void ratio/Porosity (e/n) — Porenzahl/Porenanteil (e/n)
3. Degree of Saturation (S) — Sattigungsgrad (S)
4. Density of Solids — Korndichte
5. Natural density — naturlich Dichte
6. Dry density — Trockendichte
7. Max. and Min. e/n — Lockerste/dichste Lag (LD)
8. Atterberg limits (Ip) — Zustandsgrenzen (Ip)
4

9. Grain size distribution — Korngroß enverteilung
10. Permeability (k10) — Durchlassigkeit (k10)
11. Compression test (Oedometer) — Kommpressionsversuch
12. Direct shear test — Direktscherversuch
13. CD triaxial test — CD Triaxialversuch
14. Multi-stage triaxial CD test — Mehrstuf. Triaxialversuch
15. UU triaxial test — UU Triaxialversuch
16. Standard compaction test (Proctor) — Proctorversuch
The standard compaction test is provided herein as it is must-konw standardcompaction test. The testing procedure for the standard and modified com-paction test are identical, except that the later requires a heavier hammerin the test. The CU test are not provided herein as it makes more sense ifexcess pore water pressure during shear can be produced by a proper consti-tutive model. Professor Kolymbas and his colleagues have been working ondeveloping a simple constitutive equations for cohesive soils. As lacking ofCU affects the simulation program only very little, it is therefore suggestedthat CU test being included later on, using a meaningful constitutive modelfor cohesive soils if there is any.
Each laboratory test requires specific parameters to reproduce the lab-oratory test results. Those parameters and the corresponding explanationsalong with the reference sources are listed in Table 1. It is noted that thereare four main types of soils in the program, they are:
1. Soil type 1: Gravel / Kries (denoted as yellow)
2. Soil type 2: Sand / Sand (denoted as orange)
3. Soil type 3: Silt / Schluff (denoted as oliv)
4. Soil type 4: Clay / Ton (denoted as violet)
These four type is the classification based on the size of soil grains in geotech-nical engineering. The colors use herein are regulated in the germen regula-tion, DIN 4023. These colors are similar to the ones regulated in the austrianregulation, ONORM B 4400-1:2010. There are 8 typical types of soils imple-mented in this program. These 8 types of soils are somewhat combinations
5

of the above four soil grain sizes. The created database of soil parameterslisted in Table 2 are adopted based on the references listed in Table 1.
If a parameter does not apply to that soil, its value is set to be zero. Thissimulation program apply to granular geomaterials, therefore, no sample canbe retrieved from bedrock (implying that no laboratory tests can be carriedout in the bedrock in this program)
2.3 Formal reports: laboratory Tests and in-situ dy-namic probing.
In order to bring a more realistic situation, the user will get a standardlaboratory test results if they deliver specimens to laboratory for testing. Thelaboratory reports used by Division of Geotechnical and Tunnel Engineering,University of Innsbruck, are adopted herein. They are re-generated to givethe user a realistic feeling of receiving a real laboratory test results. Bydoing this, the user can learn how to read a standard laboratory reportand learn how to find out important information for a laboratory report.Besides, the graphical interface and all information are given in English,except for the laboratory test. In stead of considering it as a inconsistencyin language, we believe that will help the student to start to get in touchwith English technical terms used in geotechnical engineering. For example,Korverteilungsliene is grain size distribution, Rammsonder is called dynamicprobing, Druchlassigkeitsversuch is called permeability test, and etc.
It is worth mentioning that the reports has been successfully created usingMatlab alone, which means no extra software are required. The laboratorytests and corresponding report is detailed as follows:
• The laboratory report for water content, void raio/Porosity, degree ofSaturation, natural density, . dry density, and Max. and Min. voidratio / porosity is shown Figure 1.
• The laboratory report for Atterberg limits and soil classification resultsis shown in Figure 2.
• The laboratory report for a grain size distribution analysis is shown inFigure 3.
• The laboratory report for a permeability test is shown in Figure 4.
• The laboratory report for a compression test (Oedometer test) is shownin Figure 5.
• The laboratory report for a direct shear test is shown in Figure 6.
6
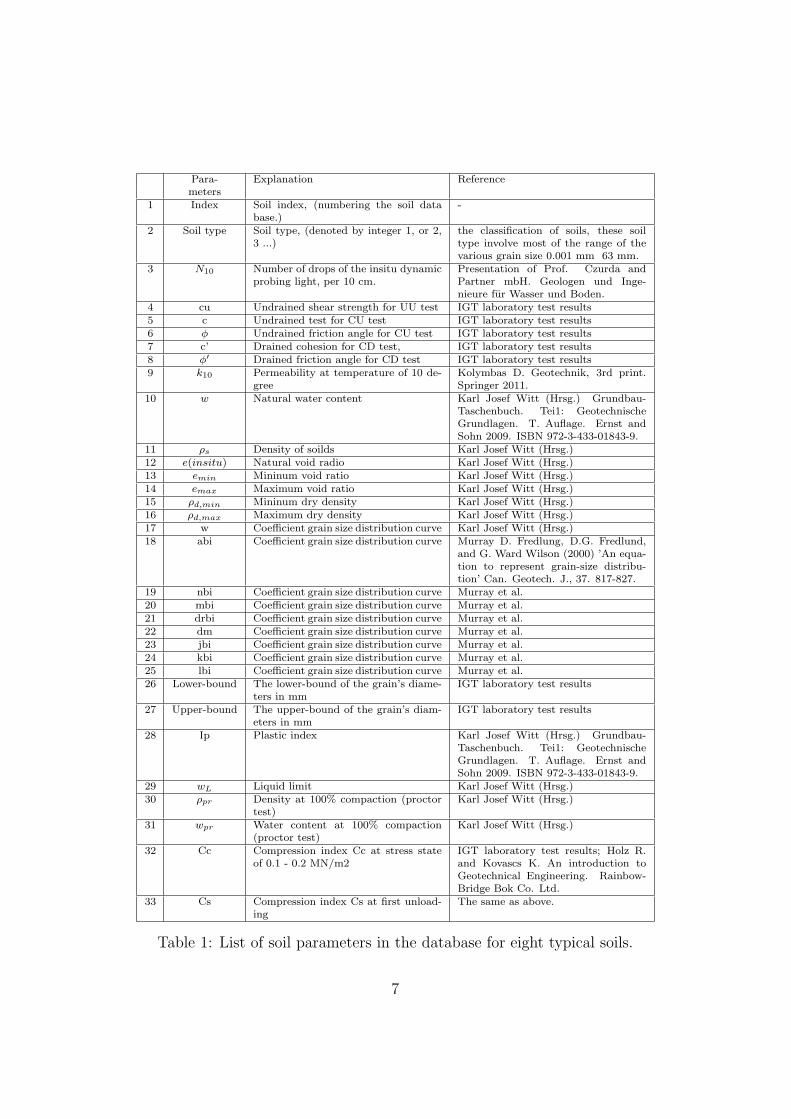
Para- Explanation Referencemeters
1 Index Soil index, (numbering the soil database.)
-
2 Soil type Soil type, (denoted by integer 1, or 2,3 ...)
the classification of soils, these soiltype involve most of the range of thevarious grain size 0.001 mm 63 mm.
3 N10 Number of drops of the insitu dynamicprobing light, per 10 cm.
Presentation of Prof. Czurda andPartner mbH. Geologen und Inge-nieure fur Wasser und Boden.
4 cu Undrained shear strength for UU test IGT laboratory test results5 c Undrained test for CU test IGT laboratory test results6 φ Undrained friction angle for CU test IGT laboratory test results7 c’ Drained cohesion for CD test, IGT laboratory test results8 φ′ Drained friction angle for CD test IGT laboratory test results9 k10 Permeability at temperature of 10 de-
greeKolymbas D. Geotechnik, 3rd print.Springer 2011.
10 w Natural water content Karl Josef Witt (Hrsg.) Grundbau-Taschenbuch. Tei1: GeotechnischeGrundlagen. T. Auflage. Ernst andSohn 2009. ISBN 972-3-433-01843-9.
11 ρs Density of soilds Karl Josef Witt (Hrsg.)12 e(insitu) Natural void radio Karl Josef Witt (Hrsg.)13 emin Mininum void ratio Karl Josef Witt (Hrsg.)14 emax Maximum void ratio Karl Josef Witt (Hrsg.)15 ρd,min Mininum dry density Karl Josef Witt (Hrsg.)16 ρd,max Maximum dry density Karl Josef Witt (Hrsg.)17 w Coefficient grain size distribution curve Karl Josef Witt (Hrsg.)18 abi Coefficient grain size distribution curve Murray D. Fredlung, D.G. Fredlund,
and G. Ward Wilson (2000) ’An equa-tion to represent grain-size distribu-tion’ Can. Geotech. J., 37. 817-827.
19 nbi Coefficient grain size distribution curve Murray et al.20 mbi Coefficient grain size distribution curve Murray et al.21 drbi Coefficient grain size distribution curve Murray et al.22 dm Coefficient grain size distribution curve Murray et al.23 jbi Coefficient grain size distribution curve Murray et al.24 kbi Coefficient grain size distribution curve Murray et al.25 lbi Coefficient grain size distribution curve Murray et al.26 Lower-bound The lower-bound of the grain’s diame-
ters in mmIGT laboratory test results
27 Upper-bound The upper-bound of the grain’s diam-eters in mm
IGT laboratory test results
28 Ip Plastic index Karl Josef Witt (Hrsg.) Grundbau-Taschenbuch. Tei1: GeotechnischeGrundlagen. T. Auflage. Ernst andSohn 2009. ISBN 972-3-433-01843-9.
29 wL Liquid limit Karl Josef Witt (Hrsg.)30 ρpr Density at 100% compaction (proctor
test)Karl Josef Witt (Hrsg.)
31 wpr Water content at 100% compaction(proctor test)
Karl Josef Witt (Hrsg.)
32 Cc Compression index Cc at stress stateof 0.1 - 0.2 MN/m2
IGT laboratory test results; Holz R.and Kovascs K. An introduction toGeotechnical Engineering. Rainbow-Bridge Bok Co. Ltd.
33 Cs Compression index Cs at first unload-ing
The same as above.
Table 1: List of soil parameters in the database for eight typical soils.
7

Para- Gravel Small Dense Loose Silt NC clay NC high OC Bed-meters gravel sand sand (Schluff) (Ton) Plastic Clay rock
(Kies) clay1 Index 1 2 3 4 5 6 7 8 92 Soil type 1 1 2 2 3 4 4 4 53 N10 45 35 25 17 10 4 3 15 150
value4 cu 250 220 200 42 45 37 37 37 10005 c 0 0 2 2 3 1 1 0 10006 φ 25 24 23 18 16 11 15 16 807 c’ 0 0 1 1 2 2 2 8 10008 φ′ 45 42 39 28 27 20 30 17 809 K10 5.2E-2 1.1E-3 1.7E-6 7.4E-4 4.8E-7 6.3E-8 1.4E-9 5.7E-9 8.6E-110 w 5.1 9.2 11.1 12.8 19.3 17.5 18.9 18.2 1.111 ρs 2.65 2.65 2.65 2.65 2.67 2.75 2.77 2.73 2.6512 e(insitu) 0.52 0.55 0.53 0.74 0.52 1.7 1.21 0.89 0.113 emin 0.3 0.33 0.5 0.56 0.39 0 0 0 014 emax 0.69 0.67 0.71 0.75 0.67 0 0 0 015 ρd,min 1.6 1.6 1.5 1.5 1.6 0 0 0 016 ρd,max 1.9 2 1.8 1.7 1.9 0 0 0 017 w 1 1 1 1 0.1 1 1 1 1
(grading)18 abi 29.06 5.25 1.68 1.68 0.03 0.42 0.89 0.05 119 nbi 3.64 3.41 3.91 3.91 5.82 3.16 3.9 0.72 120 mbi 1.01 0.93 0.71 0.71 2722.79 0.04 0.01 0.26 121 drbi 100.02 100.17 101.05 101.05 -0.82 99.88 99.64 100 122 dm 0.4 0.03 0.03 0.03 0 0 0 0 123 jbi 0.5 0.5 0.5 0.5 0.04 0.5 0.5 0.5 124 kbi 1 1 1 1 1.59 1 1 1 125 lbi 0.3 0.3 0.3 0.3 1.53 0.3 0.3 0.3 126 lower- 0.08 0.01 0 0 0 0 0 0 1
bound27 upper- 1000 110 40 40 2 7 7 7 1
bound28 Ip 0 0 0 0 6.2 23.5 33.2 18.4 029 wL 0 0 0 0 34.1 44.3 60.5 38.6 030 ρpr 1.9 2.21 1.95 2.1 1.7 1.65 1.51 1.72 031 wpr 7.9 4.2 9.9 6.2 18.2 21.2 24.7 19.5 032 Cc 0 0.01 0.02 0.04 0.05 0.1 0.14 0.04 033 Cs 0 0 0 0 0.01 0.01 0.02 0 0
Table 2: List of soil parameters in the database for eight typical soils.
8

• The laboratory report for a triaxial CD test is shown in Figure 7.
• The laboratory report for a triaxial CD multi-state test is shown inFigure 8.
• The laboratory report for a triaxial UU test is shown in Figure 9.
• The laboratory report for a compaction test (Proctor test) is shown inFigure 10.
The formal report of the dynamic probing is also implemented, as shownin Figure 11.
2.3.1 Some remarks of reproducing the lab test reports
Compression tests (Oedometer test): This test requires only and Ccand Cs. It will generate the compression test results. This resultsholds only within the stress state of 0.4 MN/m2.
Grain size distribution analyses: The curve-fitting to the grain size dis-tribution curve is carried out by using the model proposed by Murrayet al.1(see table 1). Then the index of curvature (Cc) and index ofuniformity (Cu) are calculated from the model. Cc and Cu are thenfurther used for soil naming and soil classification.
Soil naming and soil classification: A subroutine has been made to carryout the soil naming and soil classification based on ONORM B 4400-1:2010 and ONORM EN ISO 14688-1:2003. The percentage of grainsizes of fine contents, silt, sand, gravel, and stones, Cc, Cu, Ip and wL
are required. If any of the above parameters do not apply, their valueswill be set to zeros. Soil naming and soil classification are used in thereport of grain size distribution analysis and in the report of Atterberglimits, respectively.
Triaxial tests: Triaxial test are reproduced based on the prescribed iner-tial friction angle and cohesion. The Mohr-circles plotted with mostencountered stress states (with cell pressure of 100 kPa, 200 kPa and300 kPa). Random numbers are added to the Mohr-circles to bring upmore realistic uncertainty of the test results.
1Murray D. Fredlung, D.G. Fredlund, and G. Ward Wilson (2000) An equation torepresent grain-size distribution Can. Geotech. J., 37. 817-827.
9

PROJEKT:PROJEKT NR.:VERS.DATUM:BEARBEITER(IN):
LABORNUMMER:AG BEZEICHNUNG:ENTNAHMESTELLE:ENTNAHMETIEFE:
Druckdatum: 07−Dec−2011 Dateiname: General−physical−properties.pdf
PRAXIS BEISPIEL
Re, Schn
15420.25 − 0.5 m−1 m
Wassergehalt (Ofentrocknung)
w (%)
+−∆ w (%)
Korndichte (geschaetzt)
ρs (g/cm3)
Dichte (Ausstechzylinder)
ρ (g/cm3)
Trockendichte
ρd (g/cm3)
Saettigungsgrad
wmax
(%)
S (%)
Gluehverlust
w (%)
GV (%)
Porenzahl
e
Porenanteil
n
Lagerungsdichte
min ρd (g/cm3)
max ρd (g/cm3)
emax
emin
ID (I
e) (%)
nmax
nmin
D (In) (%)
Calcit CaCO3
Dolomit CaMg(CO3)2
TOC (org. Anteil)
Massen (%)
12.8
0.1
2.65
1.9
1.6
10.8
45.8
−
−
0.74
0.43
0.33
−
0.75
0.56
−
0.43
0.36
−
−
−
−
DICHTEN(OENORM B4413, 4414−1), WASSERGEHALT(OENORM B4410),LAGERUNGSDICHTE(DIN 18126)
KALKGEHALT(THERMOGRAVIMETRIE)
GLUEHVERLUST (DIN18128)
Institut fuer Infrastruktur, Abeitsbereich fuer Geotechnik und TunnelbauFakultaet fuer BauingenieurwissenschaftenUniversitaet InnsbrueckTechnikerstrasse 13A−6020 Innsbruck
Tel.: ++43/512/507−6671Fax.: ++43/512/507−2996
email: [email protected]: http://geotechnik.uibk.ac.at
Figure 1: An example of reproduced laboratory report for water content,void raio/Porosity, degree of Saturation, natural density, dry density, andMax. and Min. void ratio / porosity.
10

PROJEKT:PROJEKT NR.:VERS.DATUM:BEARBEITER(IN):
LABORNUMMER:
AUFT:GEB:BEZEICH.:
Druckdatum: 07−Dec−2011 Dateiname: Konsistenzgrenzen−Bodenklassifikation.pdf
Praxis Beispiel09/34
Ti, Fe
1434
siehe unten
KONSISTENZGRENZEN (OeN B4412)BODENKLASSIFIKATION (OeN B4400)
0 10 20 30 40 50 60 70 800
10
20
30
40
50
ST
SU UL
UM
OU
OT
UA
TL
TM
TA
A−LINIE
Fliessgrenze, wL [Massen − %]
Pla
stiz
itaet
szah
l, I p =
wL −
wp [M
asse
n −
%]
PLASTIZITAETS − DIAGRAMM
PUNKTLABORNUMMER
AUFTRAGGEBERGEZ.
ENTNAHMESTELLE
ENTNAHMETIEFEw
L [%]
wp [%]
IP [%]
w [%]Ic [%]
BODENGRUPPENACH OeN B4400
1434
Probe 1
−
− m
29.8
15.9
13.9
19.1
0.23022
Ton leichtplastish
Institut fuer Infrastruktur, Abeitsbereich fuer Geotechnik und TunnelbauFakultaet fuer BauingenieurwissenschaftenUniversitaet InnsbrueckTechnikerstrasse 13A−6020 Innsbruck
Tel.: ++43/512/507−6671Fax.: ++43/512/507−2996
email: [email protected]: http://geotechnik.uibk.ac.at
Figure 2: An example of reproduced laboratory report for Atterberg limitsand soil classification results.
11

PROJEKT:AUFTRAG NR.:VERS.DATUM:BEARBEITER(IN):
LABORNUMMER:
AUFT:GEB:BEZEICH.:
Druckdatum: 07−Dec−2011 Dateiname: Korngroessenverteilung−2.pdf
PRAXIS BEISPIEL07.12.1111.12.11−20.12.11Ti, Fe
1434
siehe unten
0.001 0.02 0.2 0.63 6.3 20 1000
10
20
30
40
50
60
70
80
90
100
Korndurchmesser d [mm]
Mas
sena
ntei
le d
er K
oern
ner
< d
[% d
er G
esam
tmas
se]
KORNGROESSENVERTEILUNG (OEN B4412)KOERNUNGSLINIE
SteineKieskornSandkornSchluffkornFeinstes
0.002 0.06 2 63
LINIELABORNUMMER
AUFTRAGGEBERGEZ.
ENTNAHMESTELLE
ENTNAHMETIEFEU = d
60 / d
10C
c = d
302 / d
10 / d
60
STEINE [%]
KIESKORN [%]
SANDKORN [%]
SCHLUFFKORN [%]
FEINSTES [%]
BODENART NACHOeN B4401−3
1434
(531.3,176.0) m
4.9846 m
14.4
2.4
−
11.2
81.4
7.4
−
gering kiesiger, gering schluffiger Sand
Institut fuer Infrastruktur, Abeitsbereich fuer Geotechnik und TunnelbauFakultaet fuer BauingenieurwissenschaftenUniversitaet InnsbrueckTechnikerstrasse 13A−6020 Innsbruck
Tel.: ++43/512/507−6671Fax.: ++43/512/507−2996
email: [email protected]: http://geotechnik.uibk.ac.at
Figure 3: An example of reproduced laboratory report for the grain sizedistribution analysis.
12

PROJEKT:AUFTRAG NR.:VERS.DATUM:BEARBEITER(IN):
LABORNUMMER:AUFT:GEB:BEZEICH.:ENTNAHMESTELLE:ENTNAHMETIEFE:
Druckdatum: 07−Dec−2011 Dateiname: Durchlaessigkeit−4.pdf
PRAXIS BEISPIEL07.12.1114.12.11−20.12.11Ti, Schn
1207−(531.3,176.0) m4.9846 m
DURCHLAESSIGKEIT mit konstanter Druckhoeche OENORM B 4422−1GERAET:PROBEN− Durchmesse/Height:
DRUCKHOEHE:HYDR. GEFAELLE i:SEITENDRUCK:
Stand 110/10.1 cm
110 cm10.91 bar
1 2 3 4 5 6 7 8 9 10
Dur
chla
essi
gkei
tsbe
iwer
t k 10
(m
/s)
Ablesung
Aufeinander folgenden Messungen
6.5E−04
7.0E−04
7.5E−04
8.0E−04
8.5E−04
EINBAUDATEN DER PROBE
DICHTE ρ :
WASSWERGEHALT w:
PROBENART:
BODENART:
BEMERKUNG:
TROCKENDICHTE ρd :
KORNDICHTE ρs :
PORENANTEIL n:
k10
:MITTLERER DURCLAESSIGKEITSBEIWERT BEI 10 oC
g/cm3
%
g/cm3
m/s
1.9
12.80
gestaert, Einbau mit Proctorenergie
gering kiesiger, gering schluffiger Sand
−
1.72
−
0.43
7.40e−04
Institut fuer Infrastruktur, Abeitsbereich fuer Geotechnik und TunnelbauFakultaet fuer BauingenieurwissenschaftenUniversitaet InnsbrueckTechnikerstrasse 13A−6020 Innsbruck
Tel.: ++43/512/507−6671Fax.: ++43/512/507−2996
email: [email protected]: http://geotechnik.uibk.ac.at
Figure 4: An example of reproduced laboratory report for the permeabilitytest.
13

PROJEKT:AUFTRAG NR.:VERS.DATUM:BEARBEITER(IN):
LABORNUMMER:BEZEICHNUNG:ENTNAHMESTELLE:ENTNAHMETIEFE:
Druckdatum: 07−Dec−2011 Dateiname: Kompressionsversuch−5.pdf
PRAXIS BEISPIEL07.12.1113.12.11−22.12.11Ti, Ch, Re
1207917(531.3,176.0) m4.9846 m
KOMPRESSIONSVERSUCH (OeN B 4420)GERAET: OEDOMETER 3PROBEN− /h
0: 7 cm / 2.0 cm
AUSWERTUNG: Es − SEKANTENMODUL
Cc − COMPRESSIONSBEIWERTE
σ Es
MN/m2 MN/m2
0.002 − 0.0250.025 − 0.0500.050 − 0.1000.100 − 0.200
0.200 − 0.1000.100 − 0.0500.050 − 0.025
0.025 − 0.0500.050 − 0.1000.100 − 0.2000.200 − 0.400
0.400 − 0.2000.200 − 0.1000.100 − 0.0500.050 − 0.025
Kompressionsbeiwert
SchwellbeiwertCC [−]
CS [−]
4.5E−02
4.1E−03
1.685.947.9012.96
140.9846.9923.50
19.1524.9044.8237.24
318.42106.1453.0735.38
0 0.1 0.2 0.3 0.40
1
2
3
4
DRUCK−ZUSAMMENDRUECKUNGσ [MN/m2]
ε i,end
=Σ∆
h i,end
/h0 [%
]
10−3
10−2
10−1
100
0.66
0.68
0.7
0.72
0.74
DRUCK−PORENZAHLσ [MN/m2]
e [−
]
EINBAUDATEN DER PROBEEINBAUART:BODENART:PORENZAHL e[−]PORENANTEIL n[−]BEMERKUNGEN:
KORNDICHTE ρs [g/cm3]
DICHTE ρ [g/cm3]TROCHEKDICHTE ρ
d [g/cm3]
WASSERGEHALT w [%]
WASSERGEHALT w [%]AUSBAUDATEN DER PROBE
ungestorrttonig0.010.00−
−1.71.512.8
12.2
Institut fuer Infrastruktur, Abeitsbereich fuer Geotechnik und TunnelbauFakultaet fuer BauingenieurwissenschaftenUniversitaet InnsbrueckTechnikerstrasse 13A−6020 Innsbruck
Tel.: ++43/512/507−6671Fax.: ++43/512/507−2996
email: [email protected]: http://geotechnik.uibk.ac.at
Figure 5: An example of reproduced laboratory report for a compression test(Oedometer test).
14

PROJEKT:AUFTRAG NR.:VERS.DATUM:BEARBEITER(IN):
LABORNUMMER:BEZEICHNUNG:ENTNAHMESTELLE:ENTNAHMETIEFE:
Druckdatum: 07−Dec−2011 Dateiname: Direktscherversuch−6.pdf
PRAXIS BEISPIEL07.12.1110.12.11−14.12.11Ti, Re
1207914(531.3,176.0) m4.9846 m
DIREKTSCHERVERSUCHSCHERGERAET: 2;1;2PROBEN− /H: 10 x 10 cm / 30mm
SCHERGESCHWINDIGKEIT: 0.0024 mm/minVORBELASTUNG: Keine
0 50 100 150 200 250 3000
50
100
150
200
250
300
σ [kN/m2]
τ [k
N/m
2 ]
SPANNUNGSDIAGRAMM
EINBAUDATEN DER PROBEN:VERSUCHDICHTE ρ [g/cm 3]TROCKENDICHTE ρ
d [g/cm 3]
WASSERGEHALT w[%]KORNDICHTE ρ
s [g/cm 3]
PORENANTEIL n[%]
PROBENARTBODENART
NORMALSPANNUNGS σ [kN/m 2]SCHUBSPANNUNG τ [kN/m 2]SCHERWEG [mm]KENNWERTE:
BEMERKUNG
c’= ϕ’=
Bestimmtheitsmass r 2=
2.001.500.3−−
945111.1
1.951.500.3−−
1447613.3
1.971.270.6−−
19410514.5
−gestoert
1 kN/cm 2 28.0 o
0.9782−
Institut fuer Infrastruktur, Abeitsbereich fuer Geotechnik und Tunnelbau
Fakultaet fuer BauingenieurwissenschaftenUniversitaet Innsbrueck
Technikerstrasse 13A−6020 Innsbruck
Tel.: ++43/512/507−6671Fax.: ++43/512/507−2996
email: [email protected]: http://geotechnik.uibk.ac.at
Figure 6: An example of reproduced laboratory report for a direct shear test.
15

PROJEKT:AUFTRAG NR.:VERS.DATUM:BEARBEITER(IN):
LABORNUMMER:AUFT.GEB.BEZEICH:ENTNAHMESTELLE:ENTNAHMETIEFE:
Druckdatum: 07−Dec−2011 Dateiname: Triaxial−CD−Versuch−7.pdf
PRAXIS BEISPIEL07.12.1110.12.11−14.12.11Ti, Re, Ba
1207917(531.3,176.0) m4.9846 m
TRIAXIAL−CD−VERSUCHSCHERGERAET: TRIAX 1;2;1PROBEN− /H: 10 cm / 31cm
AXIALVORSCHUB: 0.0024 mm/minBACKPRESSURE: 9.0 bar
0 100 200 300 400 500 600 700 800 900 10000
100
200
300
400
σ [kN/m2]
τ [k
N/m
2 ]
Schubspannung − Normalspannung
EINBAUDATEN DER PROBEN:VERSUCHDICHTE ρ [g/cm 3]TROCKENDICHTE ρ
d [g/cm 3]
WASSERGEHALT w[%]KORNDICHTE ρ
s [g/cm 3]
PORENANTEIL n[%]B−Test [%]PROBENARTBODENART
SEITENSPANNUNG σ3 [kN/m 2]
AXIALBRUCHSPANNUNG σ1’ [kN/m 2]
BRUCHDEHNUNG ε1 [%]
KENNWERTE:
BEMERKUNG
c’= ϕ’=Bestimmtheitsmass r 2=
1 2 32.001.500.3−−96
1062977.8
1.981.520.3−−98
2035669.2
1.961.270.5−−95
30685111.1
−gestoert, Einbau meit Verdictungsenergie 0.6 MJ/m 3
1 kN/cm 2 28.0 o
0.9944−
Institut fuer Infrastruktur, Abeitsbereich fuer Geotechnik und Tunnelbau
Fakultaet fuer BauingenieurwissenschaftenUniversitaet Innsbrueck
Technikerstrasse 13A−6020 Innsbruck
Tel.: ++43/512/507−6671Fax.: ++43/512/507−2996
email: [email protected]: http://geotechnik.uibk.ac.at
Figure 7: An example of reproduced laboratory report for a triaxial CD test.
16

PROJEKT:AUFTRAG NR.:VERS.DATUM:BEARBEITER(IN):
LABORNUMMER:AUFT.GEB.BEZEICH:ENTNAHMESTELLE:ENTNAHMETIEFE:
Druckdatum: 07−Dec−2011 Dateiname: Triaxial−CD−Mehrstuffenversuch−8.pdf
PRAXIS BEISPIEL07.12.1119.12.11−21.12.11Ti, Re
1207913(531.3,176.0) m4.9846 m
TRIAXIAL−CD−MEHRSTUFENVERSUCHSCHERGERAET: TRIAX 2;1;2PROBEN− /H: 10 cm / 31cm
AXIALVORSCHUB: 0.0024 mm/minBACKPRESSURE: 9.0 bar
0 100 200 300 400 500 600 700 800 900 10000
100
200
300
400
σ [kN/m2]
τ [k
N/m
2 ]
Schubspannung − Normalspannung
EINBAUDATEN DER PROBEN:VERSUCHDICHTE ρ [g/cm 3]TROCKENDICHTE ρ
d [g/cm 3]
WASSERGEHALT w[%]KORNDICHTE ρ
s [g/cm 3]
PORENANTEIL n[%]B−Test [%]PROBENARTBODENART
SEITENSPANNUNG σ3 [kN/m 2]
AXIALBRUCHSPANNUNG σ1’ [kN/m 2]
BRUCHDEHNUNG ε1 [%]
KENNWERTE:
BEMERKUNG
c’= ϕ’=Bestimmtheitsmass r 2=
1 − 3
1022869.3
20356612.1
30284014.9
2.001.500.3−−98
−gestoert, Einbau meit Verdictungsenergie 0.6 MJ/m 3
1 kN/cm 2 28.0 o
0.9845−
Institut fuer Infrastruktur, Abeitsbereich fuer Geotechnik und Tunnelbau
Fakultaet fuer BauingenieurwissenschaftenUniversitaet Innsbrueck
Technikerstrasse 13A−6020 Innsbruck
Tel.: ++43/512/507−6671Fax.: ++43/512/507−2996
email: [email protected]: http://geotechnik.uibk.ac.at
Figure 8: An example of reproduced laboratory report for a triaxial CDmulti-state test.
17

PROJEKT:AUFTRAG NR.:VERS.DATUM:BEARBEITER(IN):
LABORNUMMER:AUFT.GEB.BEZEICH:ENTNAHMESTELLE:ENTNAHMETIEFE:
Druckdatum: 07−Dec−2011 Dateiname: Triaxial−UU−Versuch−14.pdf
PRAXIS BEISPIEL07.12.1110.12.11−14.12.11Ti, Re
1207917(531.3,176.0) m4.9846 m
TRIAXIAL−UU−VERSUCHSCHERGERAET: TRIAX 1;1;3PROBEN− /H: 10 cm / 30cm
AXIALVORSCHUB: 2.0000 mm/minBACKPRESSURE: 45.0 bar
0 100 200 300 400 500 6000
50
100
150
200
σ [kN/m2]
τ [k
N/m
2 ]
Schubspannung − Normalspannung
EINBAUDATEN DER PROBEN:VERSUCHDICHTE ρ [g/cm 3]TROCKENDICHTE ρ
d [g/cm 3]
WASSERGEHALT w[%]KORNDICHTE ρ
s [g/cm 3]
PORENANTEIL n[%]B−Test [%]PROBENARTBODENART
NORMALSPANNUNGS σ [kN/m 2]AXIALBRUCHSPANUNG σ
1’ [kN/m 2]
SCHERWEG [mm]KENNWERTE:
BEMERKUNG
c’= ϕ’=Bestimmtheitsmass r 2=
1 2 32.001.500.3−−95
10320510.0
1.971.520.3−−96
20031511.6
2.051.280.6−−97
30343714.1
−gestoert
42 kN/cm 2 3.5 o
0.6997−
Institut fuer Infrastruktur, Abeitsbereich fuer Geotechnik und Tunnelbau
Fakultaet fuer BauingenieurwissenschaftenUniversitaet Innsbrueck
Technikerstrasse 13A−6020 Innsbruck
Tel.: ++43/512/507−6671Fax.: ++43/512/507−2996
email: [email protected]: http://geotechnik.uibk.ac.at
Figure 9: An example of reproduced laboratory report for a triaxial UU test.
18

PROJEKT:AUFTRAG NR.:VERS.DATUM:BEARBEITER(IN):
LABORNUMMER:AUFT:GEB:BEZEICH.:ENTNAHMESTELLE:ENTNAHMETIEFE:
Druckdatum: 07−Dec−2011 Dateiname: Proctorversuch−15.pdf
PRAXIS BEISPIEL07.12.1116.12.11−20.12.11Ti, Re, Ba
1207−(531.3,176.0) m5.0 m
PROCTORVERSUCH (OENORM B 4418)GERAET:PROBEN− Durchm./Hoehe:
PROCTORENERGIE:ZUL. GROESSTKORN:
Stand 415/12.5 cm
0.6 MJ/m3
31.5 mm
0 2 4 6 8 10 12 14 16 18 20
1.9
1.95
2
2.05
2.1
2.15
Wassergehalt [%]
Tro
cken
dich
te ρ d [g
/cm
3]
PROCTOR−DIAGRAMM
SAETTIGUNGSKURVE Sr=100%
PROCTORKURVE
KORRIGIERTE PROCTORKURVE
KORNDICHTE:
PROCTORDICTHE:OPT. WASSERGEH.:
BODENART:BEMERKUNG:
ρs
ρPr
wPr
nicht bestimmt−
(angenommen)
ρ’Pr
w’Pr
Korndichte angenommen: Saettigungskurve und korrigierte Proktorkurve geschaetzt
2.65 g/cm3
2.10 g/cm3
6.2 %2.10 g/cm3
6.2 %Korrigiert mit 0.0% Ueberkornanteil
Institut fuer Infrastruktur, Abeitsbereich fuer Geotechnik und TunnelbauFakultaet fuer BauingenieurwissenschaftenUniversitaet InnsbrueckTechnikerstrasse 13A−6020 Innsbruck
Tel.: ++43/512/507−6671Fax.: ++43/512/507−2996
email: [email protected]: http://geotechnik.uibk.ac.at
Figure 10: An example of reproduced laboratory report for a compactiontest (Proctor test).
19

PROJEKT:PROJEKT NR.:VERS.DATUM:BEARBEITER(IN):
ANSATZPUNKT:LAGE:
ANSATZHOEHE:
Druckdatum: 07−Dec−2011 Dateiname: RAMMSONDIERUNG−17.pdf
PRAXIS BEISPIEL07.12.1113.12.11−22.12.11Ti, Ch, Re
3th borehole (507.3,176.0) m
−
RAMMSONDIERUNG (OeN B 4419−1)GERAET: SRSRAMMBAER: 50 kg
SPITZENFLAECHE: 15 cm2
Institut fuer Infrastruktur, Abeitsbereich fuer Geotechnik und TunnelbauFakultaet fuer BauingenieurwissenschaftenUniversitaet InnsbrueckTechnikerstrasse 13A−6020 Innsbruck
Tel.: ++43/512/507−6671Fax.: ++43/512/507−2996
email: [email protected]: http://geotechnik.uibk.ac.at
0 10 20 30 40 500
2
4
6
8
10
12
Anzahl der Schlaege n10
Ein
drin
gung
stie
fe [m
]
0 10 20 30 40 5012
14
16
18
20
22
24
Anzahl der Schlaege n10
Ein
drin
gung
stie
fe [m
]
Figure 11: An example of reproduced formal report for the in-situ dynamicprobing light.
20

Compaction test (Proctor test): Five different curves are implementedso that the user get different curve types. That makes the simulationmore realistic. Those curves are shifted to match the report results.The correction of the over-size grains is carried out according to DIN18127: 1997-11.
Permeability tests: This report is reproduced based on k10 which is thepermeability at the temperature of 10 degree Celsius. The curve wasadded with random number to make look real. All other parameters arethe in-situ parameters, as it is assumed that the in-situ permeabilityare interested and low-disturbed soil specimens are available. It shouldbe noted that, for filter design, for example, the parameter from proctortest might be desired.
Direct shear test: Random numbers are implemented to make the testresults look real.
In-situ dynamic probing (light): The in-situ dynamic probing light pro-vides the number of drops in 10 cm. However, the test results are notquite accurate. Therefore, the random number implemented to makethe results look real. For bedrock, the n10 value is set to a very largenumber as bedrock is considered as a very hard material herein.
2.4 Explanation and hint for each laboratory test
As this program is to help the student to learn site investigation, necessaryexplanations are shown when the user conduct a an insitu test or laboratorytest, for example:
Dynamic probing light: If one or more boreholes for sampling have beendrilled, one may take specimens and send them to the a geotechnicallaboratory for further tests, such as triaxial tests, Oedometer tests,proctor tests, permeability analyses, water content, Atterberg limits,and etc. Only laboratory tests for granular geomaterial are availablein this moment, i.e. bedrock can not be sampled in this simulation.
Grain size distribution analysis: By sending specimens to a lab for test-ing, the grain size distribution will be obtained through dry sieve anal-ysis (0,06 mm ¡ d ¡ 31 mm) and wet sieve, and sedimentation analysis(0,001 mm ¡ d¡ 0,125 mm). It should be noted that the wet sieving re-moves fines from coarser grains (diameter greater then the #200 sieve),thus providing preciser estimation of grain size distribution curves. The
21
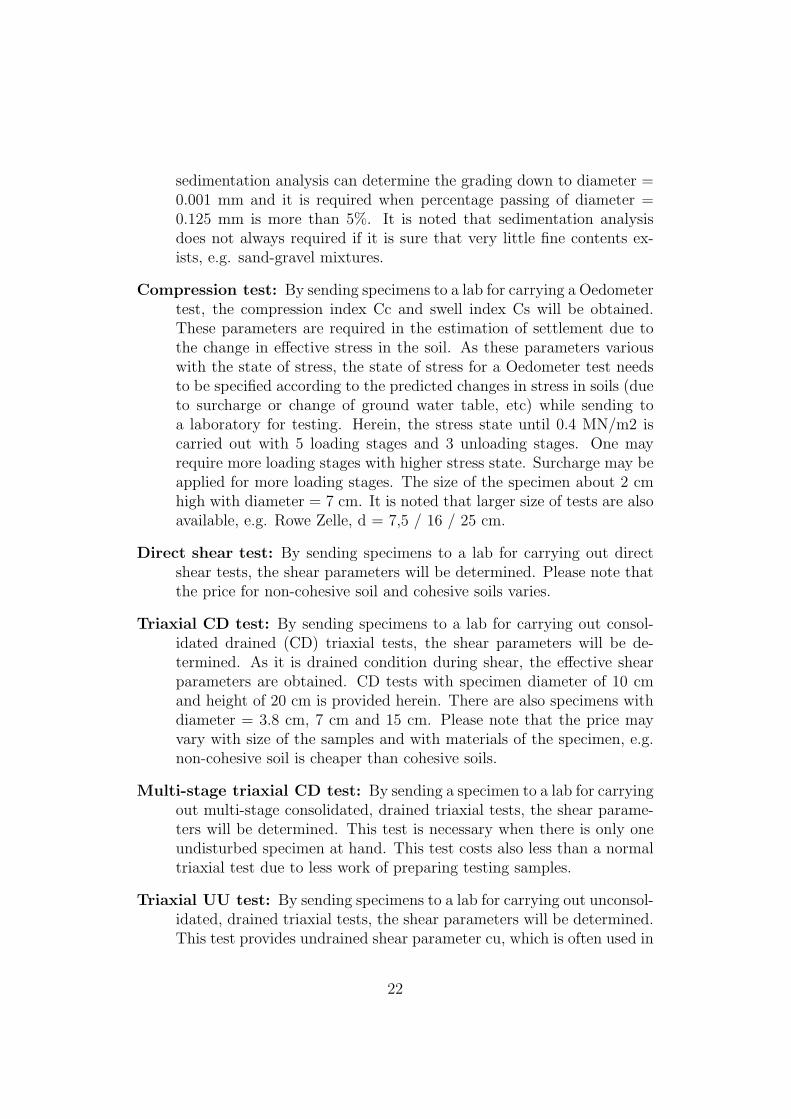
sedimentation analysis can determine the grading down to diameter =0.001 mm and it is required when percentage passing of diameter =0.125 mm is more than 5%. It is noted that sedimentation analysisdoes not always required if it is sure that very little fine contents ex-ists, e.g. sand-gravel mixtures.
Compression test: By sending specimens to a lab for carrying a Oedometertest, the compression index Cc and swell index Cs will be obtained.These parameters are required in the estimation of settlement due tothe change in effective stress in the soil. As these parameters variouswith the state of stress, the state of stress for a Oedometer test needsto be specified according to the predicted changes in stress in soils (dueto surcharge or change of ground water table, etc) while sending toa laboratory for testing. Herein, the stress state until 0.4 MN/m2 iscarried out with 5 loading stages and 3 unloading stages. One mayrequire more loading stages with higher stress state. Surcharge may beapplied for more loading stages. The size of the specimen about 2 cmhigh with diameter = 7 cm. It is noted that larger size of tests are alsoavailable, e.g. Rowe Zelle, d = 7,5 / 16 / 25 cm.
Direct shear test: By sending specimens to a lab for carrying out directshear tests, the shear parameters will be determined. Please note thatthe price for non-cohesive soil and cohesive soils varies.
Triaxial CD test: By sending specimens to a lab for carrying out consol-idated drained (CD) triaxial tests, the shear parameters will be de-termined. As it is drained condition during shear, the effective shearparameters are obtained. CD tests with specimen diameter of 10 cmand height of 20 cm is provided herein. There are also specimens withdiameter = 3.8 cm, 7 cm and 15 cm. Please note that the price mayvary with size of the samples and with materials of the specimen, e.g.non-cohesive soil is cheaper than cohesive soils.
Multi-stage triaxial CD test: By sending a specimen to a lab for carryingout multi-stage consolidated, drained triaxial tests, the shear parame-ters will be determined. This test is necessary when there is only oneundisturbed specimen at hand. This test costs also less than a normaltriaxial test due to less work of preparing testing samples.
Triaxial UU test: By sending specimens to a lab for carrying out unconsol-idated, drained triaxial tests, the shear parameters will be determined.This test provides undrained shear parameter cu, which is often used in
22

evaluating initial stability of soils when ground water exists in cohesivesoils. CD tests with specimen diameter of 10 cm and height of 20 cmis provided herein. There are also specimens with diameter = 3.8 cm,7 cm and 15 cm. Please note that the price may vary with size of thesamples.
Compaction test: By sending specimens to a lab for carrying out proctortests, the optimized water content which gives maximum (100%) rela-tive compaction is determined. The curve is corrected based on DIN18127: 1997-11 if there exists grains with diameter larger than 31.5 mm.The sample has diameter = 15 cm and height =12.5 cm. A curve ofwater content vs. dry density after compaction will be provided, whichhelps to determine the required water content of a designated relativecompaction. It should be noted that the price varies with the size ofthe sample. There are also other sample with diameter = 10 or 30 cm.If there are grain size > 31.5 mm, the curve will be corrected basedon the mass percentage of those grains. There is the other ”ModifiedProctor test” which uses heavier hammer for testing.
Permeability test: By sending specimens to a lab for testing, the perme-ability of soils at the temperature of 10 degree Celsius will be deter-mined. If you want to know the in-situ permeability, it is suggest totake low-disturbed samples, One may also use re-molded sample if thein-situ conditions (dry density for example) is known. If it is used forfilter design, an arbitrary designed grain size distribution curve withspecified dry density can be applied.
2.5 Prices of tests
The price for insitu test and laboratory test collected from reliable sourcesare listed in Table 3 and Table 4. Realistic prices make the training moremeaningful. However, these sources are not provided in this report as theprices are confidential and the sources do not want to be cited.
2.6 Graphical User Interface
The graphical user interface has been improved. For more detail of theinterface, please see the annual report of the project Part I. In Project PartII, two widgets have been added (Figure 12 ):
Ground surface profile: Most of the tasks in site investigation plans arethe identification of the underground conditions, Thus, a widget that
23

Dynamic Probing Light CostInitial setup of testing machine 58 Euron10 ≤ 50 1.06 Euro/10 cmn10 > 50 2.12 Euro/10 cm
Sampling Boreholes Cost (Initial setup cost included)0 ≤ Depth < 10 m 195 Euro/meter10 ≤ Depth < 20 m 200 Euro/meter20 ≤ Depth < 30 m 240 Euro/meterDepth > 30 m 300 Euro/meter
Table 3: Price list of laboratory tests.
Laboratory test Cost (Euro)1 Water content 102 Porosity/Void ratio 803 Saturation 804 Grain density 505 Natural density 406 Dry density 307 Max./Min. Void ratio/Porosity 808 Atterberg limits 1309 Grain size distribution 16010 Coefficient of permeability 20011 Oedometer test 17012 Direct shear (Non-cohesive material) 18013 Direct shear (cohesive material) 13014 CD triaxial tests (Non-cohesive material) 53015 CD triaxial tests (cohesive material) 85016 CD triaxial tests - multi-stage (Non-cohesive) 26517 CD triaxial tests - multi-stage (Cohesive) 42518 UU triaxial test 85019 Proctor test 180
Table 4: Price list of laboratory tests.
allows users to generate profiles at a specified coordinate on the x- andy-axis are provided.
LAB Tests: This is the core of the project Part II. All mentioned laboratorytests are able to be carried out by specifying a depth of the samplebeeing sampled and select a laboratory test.
3 The target User
As aforementioned importance of site investigation, it is more or less involvedin all courses of geotechnical engineering. With proper course design, thisprogram are expected to help student connecting what they have learnedin the class with what could be the real situation in engineering practice.The correlation of this site investigation simulation program to the followingcourses are explained in the following sections.
24

Figure 12: Graphical interface of the site simulation program.
25

3.1 Soil mechanics and foundation engineering I(Bodenmechanik und Grundbau I: VL und UE)
In this beginning course, students learn basic knowledges of soil mechanics(soil classification, soil naming, evaluation of stress in granular geomaterial,seepage force, evaluation of settlements, filter design), laboratory experi-ments (Theory of Water content analysis, grain size distribution analysis,Atterberg limits, permeability test, shear parameters and etc). What angeotechnical engineer has to know is the underground conditions. Thereforethe soil samples are retrieved and then sent to a lab for testing or insitu testsare carried out. All the parameters used in the course are determined inthe laboratory. They somehow all link to each other as they are the proper-ties of the soils. One of the questions has been also ask by students is that“Why should I learn this?” This program will be used in this bung as anextra help to explain students what it is important to learn these subjects.The students can play with the program and have an insight of what theycan do with the samples got from a construction site. They might see mayparameters they calculate in the course are listed in the report. They willexperience the importance of what they are learning because what they learnin the course are actually used in the engineering practice. They might alsohave noticed that there are in-situ tests which they have not heard beforeor other thing in the site investigation program. The designed simple tasksand 3-D geological model will help them to realize the complication of thegeotechnical problems. By playing with this program, without stress, thestudents will also have more chances to read and use the technical terms.That will help them to be familiar with the important parameters used ingeotechnical engineering.
3.2 Soil mechanics and foundation engineering II(Bodenmechanik und Grundbau II: VL und UE)
In this course, students learn to evaluate the stability of various engineeringproblems. First of all, one needs to know the parameters for evaluatingthe stability. The question starts from How can one know the undergroundconditions? The answer is that “Site Investigation” needs to be planed andcarried out. Then, How many boreholes should be carried out? Where? andHow deep? Thereafter, How to decide which sample need to be sent to lab?Which lab test needs to be carried out? What kind of parameters should I orwill I get from the lab tests? What should I do with these parameters? Thissite investigation program will be a great tool for students to practice how tosolve the above questions; and it will be a great tool for the bung instructors
26

to demonstrate and discuss with students about they questions. Student canrepeatedly practice and get the hang of it. This program will be combinedwith questions and the calculation tasks through the bung course each week.
3.3 Advanced foundation engineeringAK Grundbau (VL)
In this course, students learn the knowledge in the engineering practices. Oneof the topic is how to carry out the site investigation and how to interpretthe obtained parameters through laboratory tests and in-situ tests. Thisprogram will be introduced to students and they will be be encouraged tosolve the simple tasks provided in the program. Though these tasks, theywill understand that the limitation of underground information makes solvingthe geotechnical problems more difficult and that why geostatistics such askriging is important when limited data are available.
3.4 Laboratory tests of soil mechanicsBodenmechanisches Versuchswesen (SE)
In this course, students will learn standard procedures of laboratory experi-ments and conduct them. These experiments have been very often mentionedand used in the courses of soil mechanics I and II and Advance foundationengineering. In this course, this program can be a minor assistant to in-spire students, linking each laboratory test to corresponding parameters ofinterested.
4 P-code
Students will get the student version consisting of p-codes, which can be exe-cuted with matlab. P-code is a encrypted functions. Using P-code can ensurethat the users can use the program without access to the source code. Inthe student version, the task will be randomly assigned with limited budget.Beside, the function of looking into the ground does not work. Instructorversion has unlimited budget and can select a specific case by input a casecode, which allows instructors to repeat the randomly assigned task and dis-cuss with the students. Instructors can also look into the ground and see theunderground conditions.
Students who enrolled in the technical university at the University ofInnsbruck have free assess to Matlab in the within the campus network orat home through VPN connections (Students can freely download Matlab
27

and install in their own personal computers. While starting Matlab, Matlabwill automatically get a license from University of Innsbruck through VNPconnections). Therefore, they may run the program any time anywhere.
5 Program copy right
The copy right of the program belongs to the University of Innsbruck. Alldistributions will be encrypted as p-code files. Acquisition of the source codecan only through the University Innsbruck. Division of Geotechnical andTunnel Engineering, under Department of Civil Engineering at University ofInnsbruck, will keep developing the this program to fit into our courses ingeotechnical and tunnel engineering based on our goal of teaching.
6 Acknowledgment
The financial support of this project from the University of Innsbruck in2010 (project Part I, project code 2010.164) and in 2011 (project Part II,project code 2011.211) are very much appreciated. In addition, many thanksto the colleagues, A. Kirsch, D. Renk, A. Bilioumi, B. M. Scheider-Muntau,G. Medicus, professor W. Fellin and professor D. Kolymbas at Division ofGeotechnical and Tunnel Engineering, University of Innsbruck, for their pro-fessional suggestions, inspirations during the time of developing this program.
28
Top Related