
Annual Report of E-learning Project: Site Investigation ... · Annual Report of E-learning Project:...
15
Annual Report of E-learning Project: Site Investigation Simulation Program Part I: User Interface and Generating 3-D site models Project number: 2010.164 01.01.2010 till 31.12.2010 Chien-Hsun Chen and Daniel Renk (Project Leader) Division of Geotechnical and Tunnel Engineering 21.09.2010 1 Introduction A good understanding of in-situ underground conditions is crucial to the success of construction. Site investigation is, therefore, always conducted prior to all constructions in order to better understand the engineering un- derground conditions. The cost of construction, as well as the risk during and after the construction, can be significantly reduced if a proper site in- vestigation plan is carried out. The task of carrying out a site investigation is to understand the under- ground conditions subject to the construction goal and the budget. This is a complicated multi-objective optimization problem which needs to be solved. Hence, the site investigation is usually planed by experienced engi- neers. Due to the high costs of carrying out a real site investigation plan for learn- ing purposes, apprentices or unexperienced engineers encounter obstacles to develop such a skill. That is also the main difficulty in the university courses. Thanks to the computer technology, this situation is now possible to be improved by taking advantage of computer simulations. Just like a pilot sitting in front of a programmed simulating machine learning how to fly a jet, a geotechnical student can also sit in front of a computer and learn how to conduct a site investigation. The main task of this project is to de- sign a computer simulation program, which integrates real engineering site models and geological conditions. By using that simulation program, the user shall experience and learn how to carry out a better site investigation subject to a limit budget and a construction type. In order to get closer to a real site condition procedure, three-dimensional site models are generated and the program is designed to be interactive and visually close to the real condition. By playing with this program, the user will evolve good understanding of the site investigation and related prob- lems. In addition, a good sense of how to conduct a proper site investigation plan shall be developed. 1
Transcript of Annual Report of E-learning Project: Site Investigation ... · Annual Report of E-learning Project:...
Annual Report of E-learning Project:
Site Investigation Simulation Program
Part I: User Interface and Generating 3-D site
models
Project number: 2010.16401.01.2010 till 31.12.2010
Chien-Hsun Chen and Daniel Renk (Project Leader)Division of Geotechnical and Tunnel Engineering
21.09.2010
1 Introduction
A good understanding of in-situ underground conditions is crucial to the
success of construction. Site investigation is, therefore, always conductedprior to all constructions in order to better understand the engineering un-derground conditions. The cost of construction, as well as the risk during
and after the construction, can be significantly reduced if a proper site in-vestigation plan is carried out.
The task of carrying out a site investigation is to understand the under-
ground conditions subject to the construction goal and the budget. Thisis a complicated multi-objective optimization problem which needs to besolved. Hence, the site investigation is usually planed by experienced engi-
neers.
Due to the high costs of carrying out a real site investigation plan for learn-ing purposes, apprentices or unexperienced engineers encounter obstaclesto develop such a skill. That is also the main difficulty in the university
courses. Thanks to the computer technology, this situation is now possibleto be improved by taking advantage of computer simulations. Just like a
pilot sitting in front of a programmed simulating machine learning how tofly a jet, a geotechnical student can also sit in front of a computer and learnhow to conduct a site investigation. The main task of this project is to de-
sign a computer simulation program, which integrates real engineering sitemodels and geological conditions. By using that simulation program, the
user shall experience and learn how to carry out a better site investigationsubject to a limit budget and a construction type.
In order to get closer to a real site condition procedure, three-dimensionalsite models are generated and the program is designed to be interactive and
visually close to the real condition. By playing with this program, the userwill evolve good understanding of the site investigation and related prob-
lems. In addition, a good sense of how to conduct a proper site investigationplan shall be developed.
1
This project consists of two parts (as addressed in later sections). TheProject Part I, as described in the following sections, has be successfullycarried out. It is financially supported by the University of Innsbruck.
(E-learning Project; Project No: 2010.164; Project Period: 01-Jan-2010 ÷
31-Oct-2010.)
2 The Target User
All students who study in the field of Geotechnical and Tunnel Engineer-
ing can benefit from this program. For example, students who take partin courses of Bodenmechanik und Grundbau (VL and UE), AK Grundbau(VL) and AK Bodenmechanik (SE) can use this program to practice their
skills in conducting a site investigation. Thus, about 150 students will profitfrom this program in each semester.
Students from other scientific fields, for example engineering geology, en-
gineering construction, construction management, etc. may also use thisprogram for their own interests.
3 Project Part I
This project consists of two parts, Project Part I and II. Project Part I has
been successfully completed.
The main task of the first part is to create the interface of the simulation
program and the three-dimensional (3-D) geological models. The 3-D geo-logical models provide information of soil layers and corresponding physical
and mechanical properties, e.g. soil type and the SPT-N value, respec-tively. In the simulation program, the 3-D geological models, the buttonfunctions, the output figures are all written in separate subroutines so that
the program can be easily maintained. This also makes the integration ofnew modules (which will be developed in the Project Part II) easier. The
geological models and the program interface are explained in detail in thefollowing subsections.
3.1 User Interface
This program is designed to be very user-friendly, as shown in Fig.1. Allfunctions are implemented into button groups and edit-boxes and the same
function group is marked by the same color. All information the user needsare given before or after each click of the button.
The 3-D site is shown in the middle of the program interface. The visualdesign makes it close to the real conditions. Site investigation have to be
carried out by conducting in-situ tests on the designated site, marked withorange color.
3.1.1 For teaching and training
This program is designed for the purpose of training as well as teaching.Therefore, there is one version for the instructors/teachers, and the other
version for the learners. A random mechanism is integrated in the 3-D2

Figure 1: The user interface of the site investigation simulation program atthe beginning of the program.
3
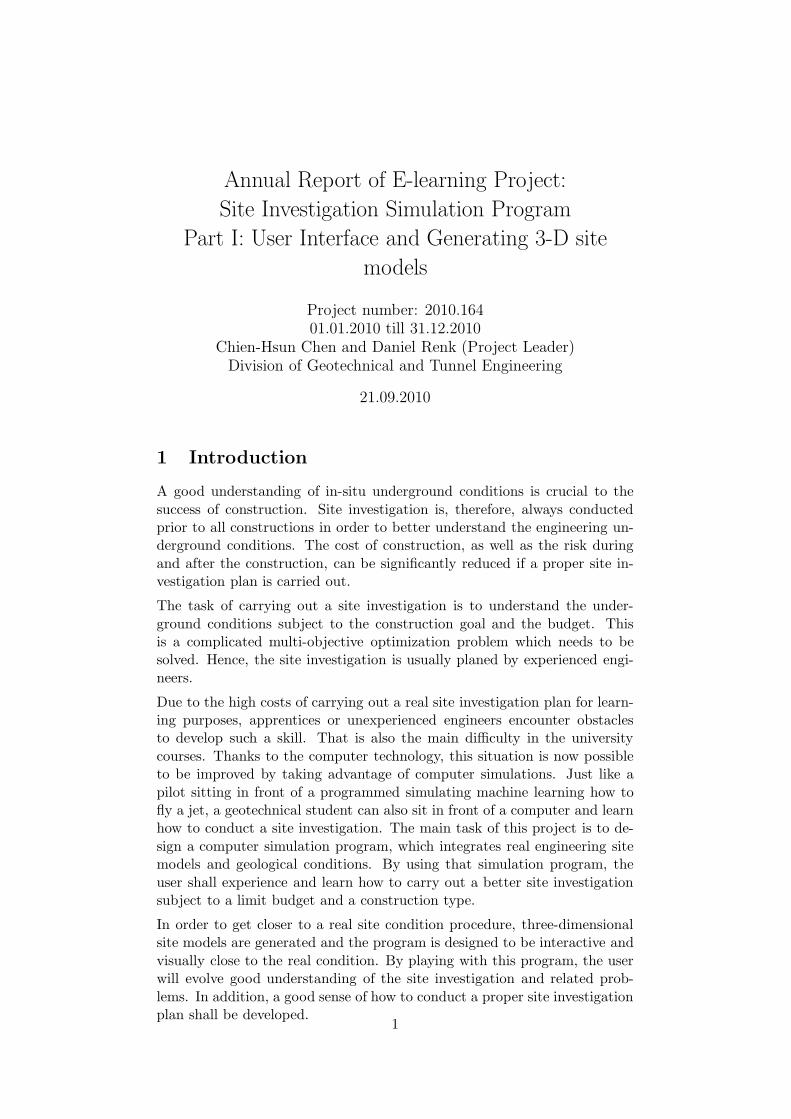
Figure 2: An example showing the intersection of the 3-D site model.
model subroutine so that the user always gets a different size and location
of the construction site along with a different geological model in each caseof site investigation. In addition all 3-D models are realized based on realcases and real soil profiles. Each task is challenging and the user is expected
to experience the simulated sophistication of underground conditions. Thisis something the students hardly experience just by reading a book or by
attaining a site investigation course. The students are encouraged to playwith this simulation program as many times as they want until they havedeveloped ‘an engineering feeling’ for carrying out site investigations.
It is worth mentioning that, for the purpose of teaching, two additional
functions are provided in the teaching version of the program:
• Case re-generation function: For each simulated site investigationcase, a case code is generate so that the instructor can re-generateeach site investigation case for teaching and discussion purpose. This
enables the interaction between the teacher and the student. At start-ing of the program, the instructor/teacher can type in the case code to
re-generate a certain case, although the cases are randomly generatedfor the user. The teacher can also get a random case with infinitebudget for demonstrating purpose.
• Intersection inspection function: In reality, it usually costs a for-
tune in order to look into the ground and know what is in there. Forlearning purpose, looking into the ground is necessary. Our 3-D model
provides the means to check the underground conditions. A intersec-tion can be generated at any location in our site models by input thex, y, or z coordinate(s), as shown in Fig.2
4

Figure 3: An example of the task, drawing the best guess of undergroundgeology.
3.1.2 Information Block
The information Block is a marked area in the program interface (Fig.1).All the information students need will pop-up at right moment or at the
click on each button. It is placed on the very top of the interface so that iteasily attracts the users attention.
3.1.3 Task and Help
At the very beginning, two buttons ‘Task’ and ‘Help’ can provide help. Theyare located on the upper-left side of the user interface (Fig.1). By clickingat each button, a new window appears to provide more information. The
user can at every stage click on the two buttons to get help.
• The Task Button: By clicking on the ‘Task’ button, the task for theuser shows up in a new dialog window. The user has to carry out a
site investigation for a given designated scenario subject to a limitedbudget. With all the information at hand, the user has to plot the‘best guess’ of a soil profile, which is given after one finishes the site
investigation, as shown in Fig.3
• The Help Button: By clicking on the ‘help’ button, the information
for the program is provided in a new dialog window.
3.1.4 Outputs of the site investigation
At the beginning of the program, a directory in the user’s name is created.
That personal directory is generated in order to save all the outputs for theuser when the program starts. In the directory, the following data are saved:
• Datalog: Datalog records the user’s identity, the case code (this isa number which can be used for re-generating the same case in a
teaching version of the program), the starting time, all the informationof conducted tests (including location, depth, test type, and time),
budget, and the task.
• Test results: Each in-situ test is automatically saved as a JPG file
in the personal directory. It’s relative location in the 3-D constructionsite is also printed in the same JPG file to make comparison easier
5
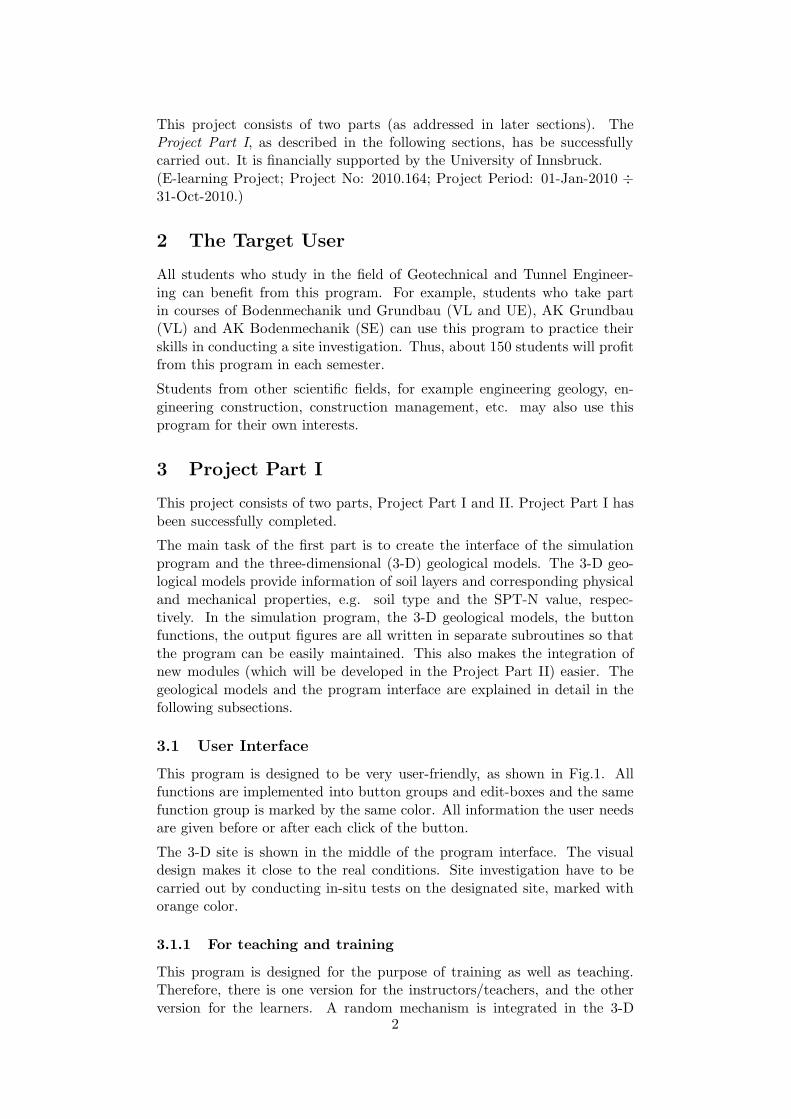
Figure 4: An example of the output file after the execution of a SPT.
• Task: At the end of the site investigation, the user receives a ran-domly generated vertical intersection, on which one has to draw the
underground soil layers in the construction site. This intersection issaved as JPG at the end of the site investigation (See Fig.3).
• Site maps: The site map is automatically printed out at the end ofthe site investigation. This provides the user a large clear map, on
which the conducted tests are marked.
3.1.5 Conducting an in-situ test
In engineering practice, in-situ tests are carried out in order to understand
the underground geological and mechanical characteristics at the construc-tion site. Among all in-situ tests, the Soil Sampling and the Standard Pen-
etration Test (SPT) are very often used. The SPT provides rough infor-mation of the strength and the stiffness of the soil, denoted by the N value(as shown in Fig.4). The Soil Sampling will provide detailed information
(e.g. soil types, color, thickness of soil layers, etc.) for underground soils(as shown in Fig.5). The retrieved samples are also needed for further lab-
oratory tests, which are necessary for characterizing the physical as well asthe mechanical properties of soils or rocks. It is noted that integrating the
6
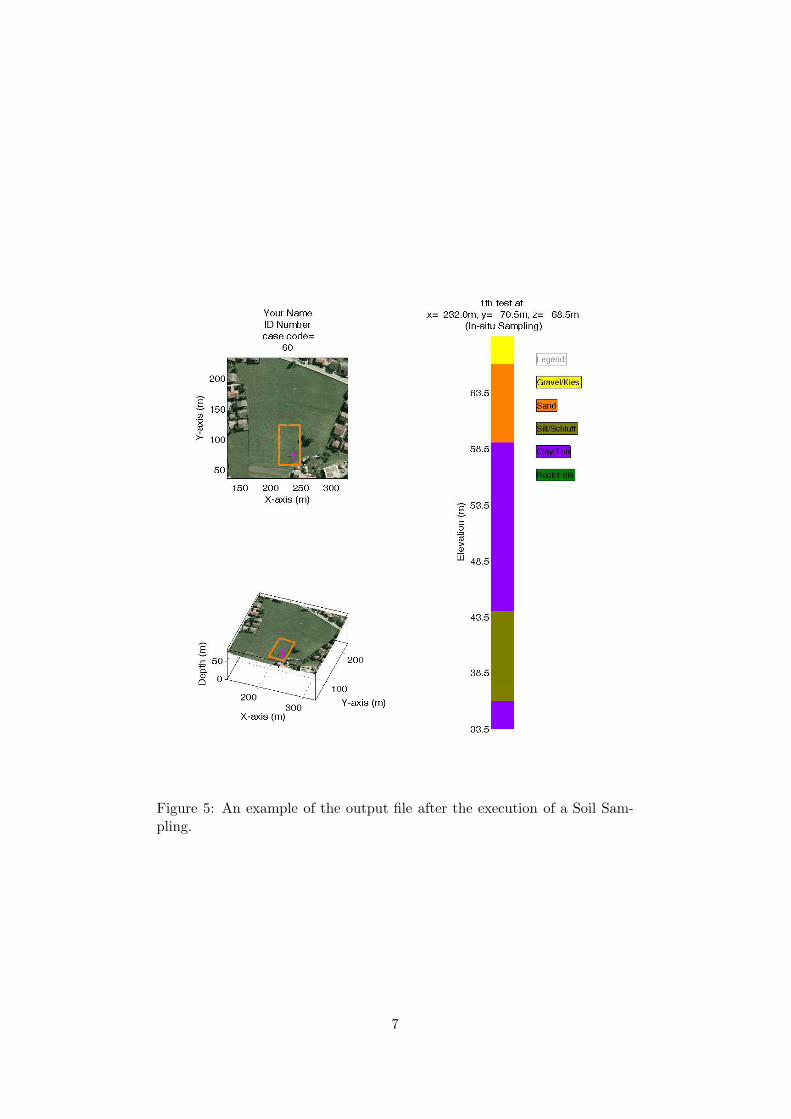
Figure 5: An example of the output file after the execution of a Soil Sam-
pling.
7

lab tests into the program is in the scope of the Project Part II.
To conduct an in-situ test, the user needs to provide the following informa-
tion:
• The location: Where to conduct an in-situ test? The x and y coordi-nates shall be updated by function buttons, ‘Get Coordinates X,Y,Z’
and ‘Update X,Y’, or can be entered manually.
• The depth: How deep shall an in-situ test be executed? A depthshall be entered.
• The in-situ test type: Which test shall be executed? An in-situtest shall be selected by clicking at it.
After providing the information above, a click on the ‘Start’ button shall
offer the confirmation before execution. The test will be carried out only ifthe confirmation is made. The test results are saved in JPG format in theusers’ directory. On the simulation interface, the user can also regenerate
the executed in-situ tests by input test number into the edit-box below thetest result.
3.1.6 Interacting with the 3-D site
In order to interact with the 3-D construction site, three button groups areprovided:
• The ‘Map Controller’ button group: Three buttons are provided in
this group to rotate, zoom and shift the 3-D map, see Fig.6.
• The ‘Views’ button group: Three buttons provide three default as-pects/views from Top, left side and right side of the map.
• The ‘Map Generator’ button group: In this button group, three but-tons provide the means to view the landscape, the elevation, and the
gradient of the slope.
3.1.7 Showing results
Each test result is shown on the right side of the program interface (Fig.1)
and is saved in the users’ directory after each execution of an in-situ test. Fora SPT, the output is a bar chart of SPT-N values plotted against elevation.
For a sampling test, the soil type is shown in different colors along theelevation. It is noted that the outputs are close to a real test report, as wellas the color and chart type agree to the up-to-date regulations (DIN).
3.1.8 How to get this program, how to start it?
This program is written using GUI in Matlab. GUI is short for graphicaluser interface, on which the site investigation simulation program is built
on. The program codes are encrypted into p-files and will be uploadedto our website. Learners can download the p-files from our website and
run it in Matlab by typing in the command line ‘Site investigation plansimulation’. All students who are enrolled can use Matlab at UIBK computer
8

Figure 6: An example of using zoom and shift function.
9
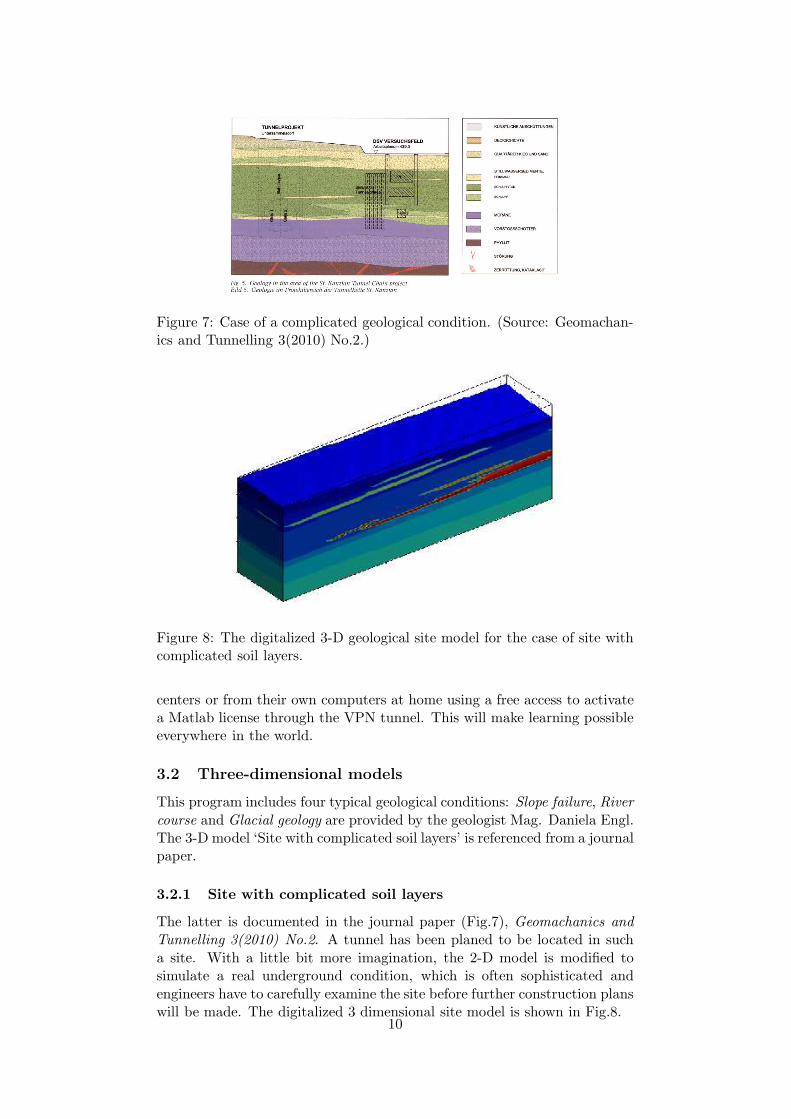
Figure 7: Case of a complicated geological condition. (Source: Geomachan-ics and Tunnelling 3(2010) No.2.)
Figure 8: The digitalized 3-D geological site model for the case of site withcomplicated soil layers.
centers or from their own computers at home using a free access to activatea Matlab license through the VPN tunnel. This will make learning possibleeverywhere in the world.
3.2 Three-dimensional models
This program includes four typical geological conditions: Slope failure, River
course and Glacial geology are provided by the geologist Mag. Daniela Engl.The 3-D model ‘Site with complicated soil layers’ is referenced from a journalpaper.
3.2.1 Site with complicated soil layers
The latter is documented in the journal paper (Fig.7), Geomachanics andTunnelling 3(2010) No.2. A tunnel has been planed to be located in such
a site. With a little bit more imagination, the 2-D model is modified tosimulate a real underground condition, which is often sophisticated and
engineers have to carefully examine the site before further construction planswill be made. The digitalized 3 dimensional site model is shown in Fig.8.
10

Figure 9: Case of a slope failure, provided by the geologist Mag. Daniela
Engl
Figure 10: The digitalized 3-D geological site model for the case of slopefailure.
3.2.2 Slope failure
A typical slope failure site, which student may be familiar with, yet, they
will still encounter the difficulties to conduct a proper site investigation.The case of slope failure and the corresponding digitalized 3-D model are
shown in Fig.9 and Fig.10.
3.2.3 River course problem
The river course changes with time (Fig.11). Old river beds can be filled with
other materials and form new land. In engineering practice, it is importantto understand this natural transition and detect this geological difference incase of construction. The generated 3 model is shown in Fig.12
3.2.4 Glacial geology
After glacial had occurred at a certain area, special geological conditions
may be formed. Many anomalies occur in the underground (Fig.13), whichcan be confusing enough, even for an experienced engineer. The generated3 model is shown in Fig.14
11
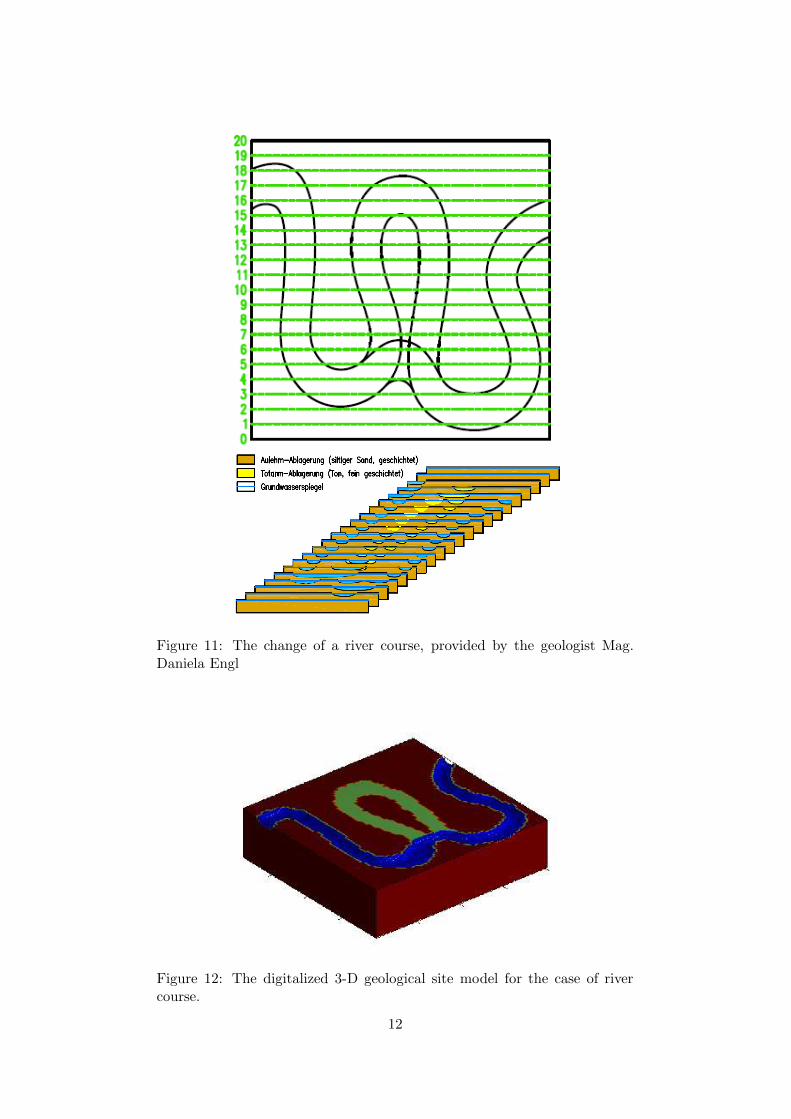
Figure 11: The change of a river course, provided by the geologist Mag.Daniela Engl
Figure 12: The digitalized 3-D geological site model for the case of rivercourse.
12
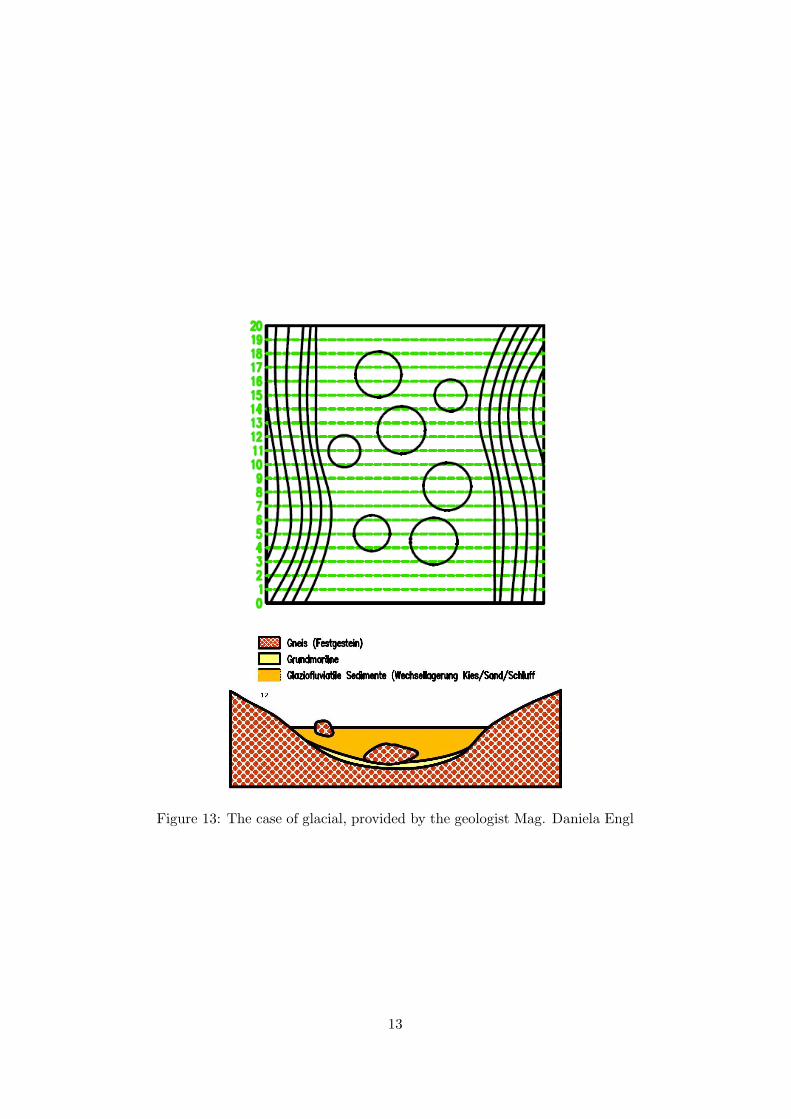
Figure 13: The case of glacial, provided by the geologist Mag. Daniela Engl
13

Figure 14: The digitalized 3-D geological site model for the case of glacial.
4 Project Part II
4.1 Introduction
As mentioned earlier, the laboratory tests are crucial in order to understand
the mechanical properties of soils. Thus, it is definitely necessary to imple-ment this function into the site investigation simulation program in order to
make the program a powerful tool for teaching and learning purpose. Themain task of Project Part II is, therefore, to create a database by digital-izing lab tests results of soil samples and make conducting a lab test with
corresponding output results possible.
In the laboratory, mechanical tests such as the direct shear test, the CU-,CD- and UU- triaxial test, the oedemeter test, etc. are often used to predictthe soil behavior during and after construction. They are used to predict
potential natural disasters (e.g. landslide, soil liquefaction). In fact, someimportant physical properties also need to be carried out in the lab (e.g. the
Plasticity Index, liquid limit, plasticity limit, grain size distribution, perme-ability and etc.). Soil samples are retrieved at field and sent to the lab.
The physical or mechanical test results are then used in the design phase,construction phase and, later, in the maintenance of the structure.
4.2 Carry-out the Project
In order to fulfill our task for Project Part II, we will need to collect labtest results of soil parameters used in design and construction. The main
sources are the literature and our own lab test results. Then, the collecteddata will be digitalized into our database. To simulate the test results, wealso need proper numerical models in order to re-produce the test results
from the digitalized database. The numerical models will be programmedinto subroutines and, later on, will be integrated into the user interface. To
create a sufficient database for lab tests, data collection will always be partof the work so that the database will be continuously extended during PartII of this project.
14
4.3 Benefits for the User
In Project Part II, the student will be expected to learn the following im-portant tasks:
• To decide which lab test should be used in which condition: In en-gineering practice, depending on construction type and the geological
conditions, different lab tests are required. This program will be goodfor training users until they become experts for site investigations.
• To manage the budget: The budget is always limited and, very often,
not much. Therefore, using the limited budget in a smart way to getvaluable information from all the tests becomes an important task.That needs practice!
4.4 Connecting Project Part I and II
In the Project Part I, the real 3-D dimensional models were created and
implemented into the user interface. The user can carry out a site investi-gation through conducting in-situ tests. The site investigation simulationprogram in Project Part I is written in modules (subroutines). That makes
the program flexible to be extended to a more powerful tool for learning.The Project Part II will be written in subroutines and be implemented into
the site investigation simulation program developed in Project Part I.
15


