
Zbigniew Mogiła , Marta Zaleska , Janusz Zaleski
22
1 Zbigniew Mogiła 1 , Marta Zaleska 2 , Janusz Zaleski 3 Are the effects of EU Cohesion Policy for the Polish regional labour markets worth their costs? - a study based on the results of counter-factual macroeconomic simulations. 4 Abstract Poland as the main beneficiary of EU Cohesion Policy is an interesting target of analyses regarding the impact of financial interventions on regional economies. Obviously, of special importance for regional communities are effects of EU funds on the labour market. Greater employment- besides counteracting social exclusion- is expected to increase disposable incomes of households and consumption expenditures. This – in turn- is likely to improve well-being of regional inhabitants. Hence, impacts of EU Cohesion Policy on regional labour markets are considered to be the most tangible contribution of the EU financial assistance to higher standards of living for ordinary citizens. The main aim of this paper is to present and confront the effects of Cohesion Policy on employment with the costs of the EU financial support in the Polish NUTS-2 regions over the period 2004-2020. Making use of available counterfactual analyses, attempt is made to evaluate the cost-effectiveness of the job creation due to the EU funds. The gathered results will be a significant contribution to the debate on the shape of the Cohesion Policy in the new EU financial perspective. JEL codes: R11 1 Wrocław Regional Development Agency. 2 Wrocław Regional Development Agency. 3 Wrocław Regional Development Agency and Institute of Meteorology and Water Management. 4 This is the preliminary paper. The final version will be presented after ERSA 2012 Congress.
Transcript of Zbigniew Mogiła , Marta Zaleska , Janusz Zaleski
1
Zbigniew Mogiła1 , Marta Zaleska
2, Janusz Zaleski
3
Are the effects of EU Cohesion Policy for the Polish regional labour markets worth their
costs? - a study based on the results of counter-factual macroeconomic simulations.4
Abstract
Poland as the main beneficiary of EU Cohesion Policy is an interesting target of analyses
regarding the impact of financial interventions on regional economies. Obviously, of special
importance for regional communities are effects of EU funds on the labour market. Greater
employment- besides counteracting social exclusion- is expected to increase disposable
incomes of households and consumption expenditures. This – in turn- is likely to improve
well-being of regional inhabitants. Hence, impacts of EU Cohesion Policy on regional labour
markets are considered to be the most tangible contribution of the EU financial assistance to
higher standards of living for ordinary citizens. The main aim of this paper is to present and
confront the effects of Cohesion Policy on employment with the costs of the EU financial
support in the Polish NUTS-2 regions over the period 2004-2020. Making use of available
counterfactual analyses, attempt is made to evaluate the cost-effectiveness of the job creation
due to the EU funds. The gathered results will be a significant contribution to the debate on
the shape of the Cohesion Policy in the new EU financial perspective.
JEL codes: R11
1 Wrocław Regional Development Agency. 2 Wrocław Regional Development Agency. 3 Wrocław Regional Development Agency and Institute of Meteorology and Water Management. 4 This is the preliminary paper. The final version will be presented after ERSA 2012 Congress.
2
I. Introduction
As a result of the crisis in the global economy, which erupted in the second half of 2008, a
large part of people not related to strictly economic professions started to demonstrate a
growing interest in information showing the real condition of the economy of their country or
region and even of the global economy. Any positive GDP data began to give hope for a
reversal of the crisis situation and a return of prosperity. However, it soon turned out that even
if there was a certain positive increase in output in the economies of many states and regions
after the perturbations of the 2008-2009 period, but this was rarely reflected in labour market
statistics. The above fact caused consternation not only among ordinary people, but also
among representatives of renowned economic institutions. The situation in the labour market
is a kind of touchstone for the degree in which the potential of a given economy is used and
for its sustainable development. Secondly, favourable trends in the labour market reduce the
risk of long-term unemployment, hysteresis, economic inactivity, thereby apathy and different
kinds of social pathology. Thirdly, positive trends in labour demand create an opportunity for
an increase in affluence, living standards, knowledge and experience of the population, a
chance to pursue aspirations and higher order needs, thereby making the social development
itself more dynamic. An increase in the number of people employed and greater economic
activity, thus the involvement in the economic life of a country/region, contribute to greater
identification with a particular area and thereby to its increased social capital and investment
attractiveness.
Given the above, we are not surprised by the fact that the EU sets high levels of employment
as one of the priorities defined in its most important strategic document - Europe 2020. On
account of the fact that the EU’s cohesion policy is one of the most important tools
stimulating development in relatively economically weaker regions, including all the NUTS-2
regions in Poland, it is worth giving some thought to the cost per job created or retained as a
result of the implementation of cohesion policy resources5 in the financial perspectives 2004-
2006 (through the National Development Plan (NDP)) and 2007-2013 (National Strategic
Reference Framework (NSRF)). One should be aware that the operational programmes
implemented over this period are not oriented directly towards an increase in the number of
5 In this article, the cost per job created/retained is understood as cohesion policy resources per job created due to the implementation of this
policy or per job retained due to this policy (e.g. a job that was not created due to cohesion policy, or was created due to it in the previous
years, but still existed in a particular year only thanks to EU funds from such year). The job in this paper means full- time job. Part-time jobs
were translated into full-time equivalents. Durability of created jobs is not the question to be analyzed in this paper.
3
jobs, but primarily towards the development of infrastructure, an increase in innovation and
human capital, thereby an increase in factor productivity and GDP. In this sense, speaking of
the cost of job creation/retention does not seem to be fully justified. However, it is worth
noting that the estimation of the above-mentioned cost allows one to compare the
effectiveness6 of EU funds between particular regions in the context of labour market.
The main aim of this paper is to present and confront the effects of cohesion policy on
employment with the costs of EU financial support in the Polish NUTS-2 regions over the
period 2004-2020. Making use of available counterfactual analyses, an attempt is made to
evaluate the cost-effectiveness of job creation due to EU funds. The gathered results will be a
contribution to the debate on the shape of cohesion policy in the new EU financial perspective
2014-2020.
The regional HERMIN models for the economies of the Polish NUTS-2 regions were the
main research tools used to obtain the results that formed the basis for this article. The
HERMIN methodology is used to determine the impacts of EU funds on the socio-economic
development of the EU member states and regions covered by cohesion policy support as well
as to make economic forecasts. It meets the requirements of the European Commission with
respect to tools that should be used for this type of research.7 Results of the HERMIN
simulations were presented, among others, in the Fifth Cohesion Report published by the
European Commission in November 2010.89
This article has the following structure: after an introduction, the results of some studies on
the effects of cohesion policy on the labour market are presented. The next sections are
devoted to a synthetic analysis of the Polish NUTS-2 regions as well as to NDP and NSRF
6 In this paper effectiveness of the EU funds with respect to the labour market is understood as the average cost per job created/retained due
to the cohesion policy. 7 The New Programming Period 2007-2013. Indicative guidelines on evaluation methods: ex ante evaluation. Working document no. 1.”, European Commission, Directorate-General Regional Policy, August 2006. 8 “Investing in Europe’s future. Fifth report on economic, social and territorial cohesion”. Brussels, European Commission, November,
2010. 9 In Poland the HERMIN methodology was implemented both at the national level (2002, a study commissioned by the Ministry of
Economy) and at the regional level (2005, a study commissioned by the Ministry of Regional Development); these were the first regional
models dedicated to analysis of economic development of all Polish regions (voivodeships) which were of a prototype and experimental
nature. Currently, the research team of the Wroclaw Regional Development Agency (WARR) led by Prof. Janusz Zaleski, in collaboration
with Dr J. Bradley (the author of the original HERMIN methodology) of the Economic and Social Research Institute in Dublin, uses the 2nd
generation regional models which are harmonised with the system of models used by DG REGIO (CSHM), among others by the
disaggregation of the fifth sector – building and construction. The constructed models – for the whole Polish economy and for 16 regional
economies of the particular regions – have been used to prepare a number of reports on the evaluation of the impacts of EU funds on key
macroeconomic indicators both at the ex ante stage and for ongoing evaluation. WARR‘s reports are available at the website www.hermin.pl.
4
payments in Poland. Then, the results of the study on the cost per job created/retained due to
cohesion policy in Poland are presented, followed by the conclusions.
II. Presentation of selected previous studies.
Analysing information concerning the cost per job created in the previous and present
financial perspective of the European Union and EU standards in this respect should be one of
the elements of estimation of the impact of the Structural Funds on employment. The
calculation of the cost per job created under programmes co-financed by EU funds forms the
basis for evaluation of the effectiveness of this type of intervention. Nevertheless, one should
take account of the fact that all, obtained results must be treated with great caution, since two
similar interventions or the circumstances under which they are carried out are not identical.
Therefore, they will produce different effects due to the conditions prevailing in the
environment in which they are carried out.
In Poland the operational programmes are now implemented under the second EU financial
perspective that includes Poland following its accession to the European Community.
The authors of this article did not have access to any studies that would deal in a
comprehensive manner with the cost of job creation for the whole National Development Plan
(NDP) and National Strategic Reference Framework (NSRF) (i.e. the instruments of cohesion
policy implementation in Poland during the periods 2004 – 2006 and 2007 – 2013), but only
to some partial studies, that is, studies devoted to analysis of the cost per job created under
individual programmes or under the priorities of the operational programmes – primarily
devoted to the Integrated Regional Operational Programme (IROP) and the Sectoral
Operational Programmes being a component of the NDP 2004 – 2006. Below, we present
some (due to the volume constraints on this article) reports relating to the cost per job created
due to financial intervention.
5
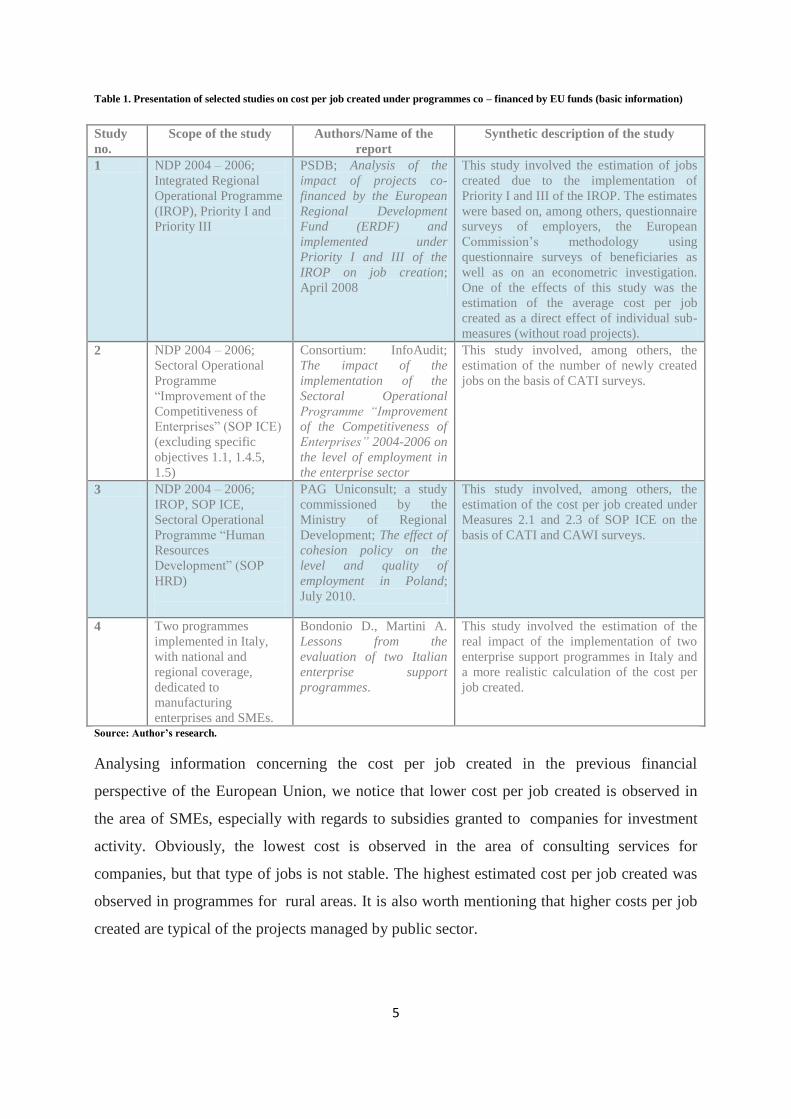
Table 1. Presentation of selected studies on cost per job created under programmes co – financed by EU funds (basic information)
Study
no.
Scope of the study Authors/Name of the
report
Synthetic description of the study
1 NDP 2004 – 2006;
Integrated Regional
Operational Programme
(IROP), Priority I and
Priority III
PSDB; Analysis of the
impact of projects co-
financed by the European
Regional Development
Fund (ERDF) and
implemented under
Priority I and III of the
IROP on job creation;
April 2008
This study involved the estimation of jobs
created due to the implementation of
Priority I and III of the IROP. The estimates
were based on, among others, questionnaire
surveys of employers, the European
Commission’s methodology using
questionnaire surveys of beneficiaries as
well as on an econometric investigation.
One of the effects of this study was the
estimation of the average cost per job
created as a direct effect of individual sub-
measures (without road projects).
2 NDP 2004 – 2006;
Sectoral Operational
Programme
“Improvement of the
Competitiveness of
Enterprises” (SOP ICE)
(excluding specific
objectives 1.1, 1.4.5,
1.5)
Consortium: InfoAudit;
The impact of the
implementation of the
Sectoral Operational
Programme “Improvement
of the Competitiveness of
Enterprises” 2004-2006 on
the level of employment in
the enterprise sector
This study involved, among others, the
estimation of the number of newly created
jobs on the basis of CATI surveys.
3 NDP 2004 – 2006;
IROP, SOP ICE,
Sectoral Operational
Programme “Human
Resources
Development” (SOP
HRD)
PAG Uniconsult; a study
commissioned by the
Ministry of Regional
Development; The effect of
cohesion policy on the
level and quality of
employment in Poland;
July 2010.
This study involved, among others, the
estimation of the cost per job created under
Measures 2.1 and 2.3 of SOP ICE on the
basis of CATI and CAWI surveys.
4 Two programmes
implemented in Italy,
with national and
regional coverage,
dedicated to
manufacturing
enterprises and SMEs.
Bondonio D., Martini A.
Lessons from the
evaluation of two Italian
enterprise support
programmes.
This study involved the estimation of the
real impact of the implementation of two
enterprise support programmes in Italy and
a more realistic calculation of the cost per
job created.
Source: Author’s research.
Analysing information concerning the cost per job created in the previous financial
perspective of the European Union, we notice that lower cost per job created is observed in
the area of SMEs, especially with regards to subsidies granted to companies for investment
activity. Obviously, the lowest cost is observed in the area of consulting services for
companies, but that type of jobs is not stable. The highest estimated cost per job created was
observed in programmes for rural areas. It is also worth mentioning that higher costs per job
created are typical of the projects managed by public sector.
6
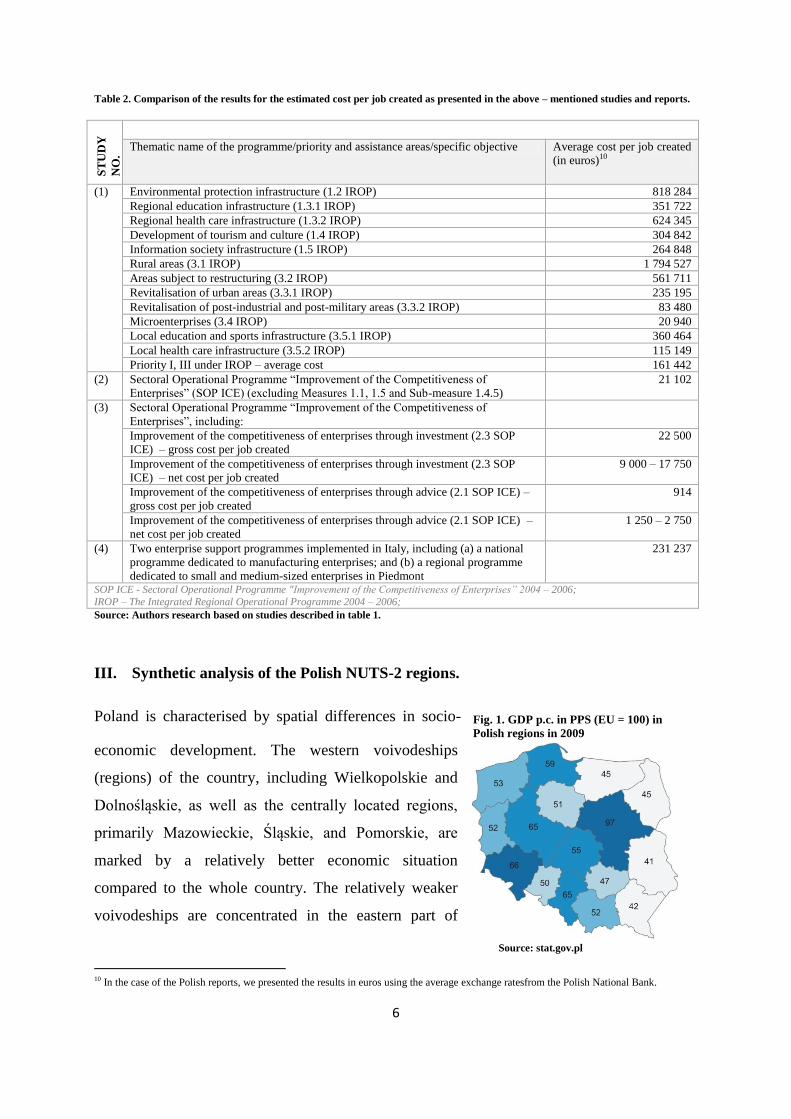
Table 2. Comparison of the results for the estimated cost per job created as presented in the above – mentioned studies and reports. S
TU
DY
NO
.
Thematic name of the programme/priority and assistance areas/specific objective Average cost per job created
(in euros)10
(1) Environmental protection infrastructure (1.2 IROP) 818 284
Regional education infrastructure (1.3.1 IROP) 351 722
Regional health care infrastructure (1.3.2 IROP) 624 345
Development of tourism and culture (1.4 IROP) 304 842
Information society infrastructure (1.5 IROP) 264 848
Rural areas (3.1 IROP) 1 794 527
Areas subject to restructuring (3.2 IROP) 561 711
Revitalisation of urban areas (3.3.1 IROP) 235 195
Revitalisation of post-industrial and post-military areas (3.3.2 IROP) 83 480
Microenterprises (3.4 IROP) 20 940
Local education and sports infrastructure (3.5.1 IROP) 360 464
Local health care infrastructure (3.5.2 IROP) 115 149
Priority I, III under IROP – average cost 161 442
(2) Sectoral Operational Programme “Improvement of the Competitiveness of
Enterprises” (SOP ICE) (excluding Measures 1.1, 1.5 and Sub-measure 1.4.5)
21 102
(3) Sectoral Operational Programme “Improvement of the Competitiveness of
Enterprises”, including:
Improvement of the competitiveness of enterprises through investment (2.3 SOP
ICE) – gross cost per job created
22 500
Improvement of the competitiveness of enterprises through investment (2.3 SOP
ICE) – net cost per job created
9 000 – 17 750
Improvement of the competitiveness of enterprises through advice (2.1 SOP ICE) –
gross cost per job created
914
Improvement of the competitiveness of enterprises through advice (2.1 SOP ICE) –
net cost per job created
1 250 – 2 750
(4) Two enterprise support programmes implemented in Italy, including (a) a national
programme dedicated to manufacturing enterprises; and (b) a regional programme
dedicated to small and medium-sized enterprises in Piedmont
231 237
SOP ICE - Sectoral Operational Programme "Improvement of the Competitiveness of Enterprises” 2004 – 2006;
IROP – The Integrated Regional Operational Programme 2004 – 2006; Source: Authors research based on studies described in table 1.
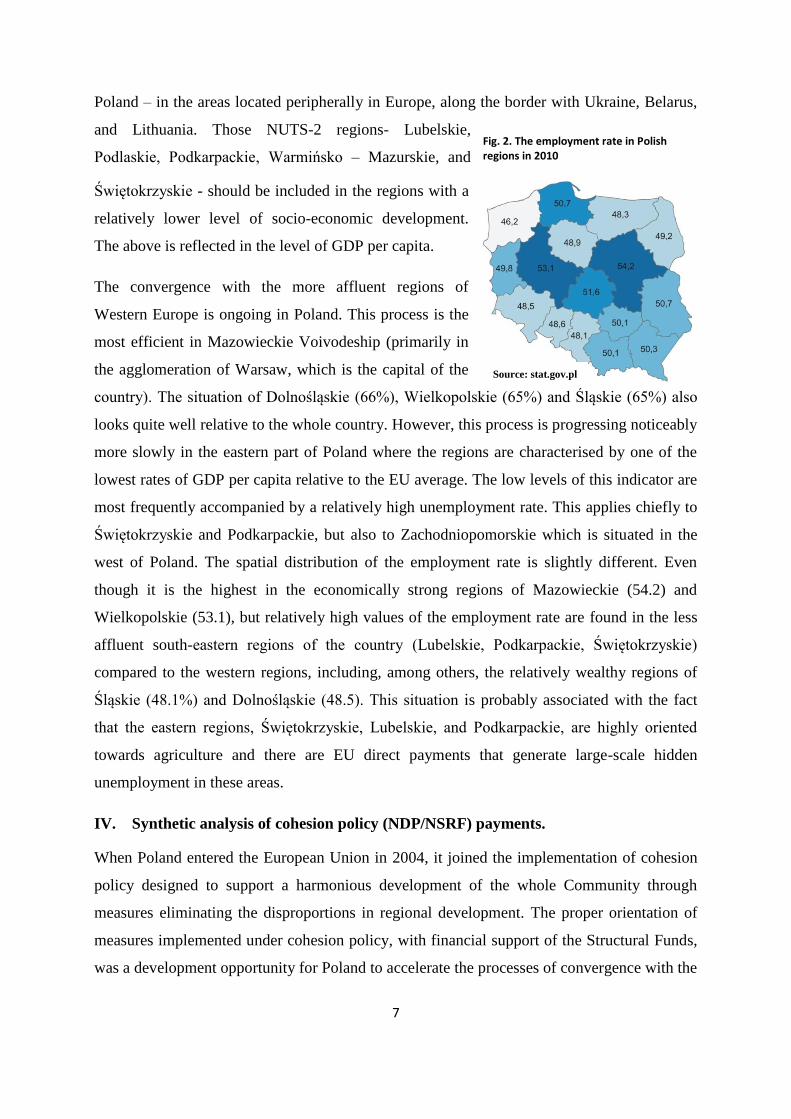
III. Synthetic analysis of the Polish NUTS-2 regions.
Poland is characterised by spatial differences in socio-
economic development. The western voivodeships
(regions) of the country, including Wielkopolskie and
Dolnośląskie, as well as the centrally located regions,
primarily Mazowieckie, Śląskie, and Pomorskie, are
marked by a relatively better economic situation
compared to the whole country. The relatively weaker
voivodeships are concentrated in the eastern part of
10 In the case of the Polish reports, we presented the results in euros using the average exchange ratesfrom the Polish National Bank.
Fig. 1. GDP p.c. in PPS (EU = 100) in
Polish regions in 2009
Source: stat.gov.pl
7
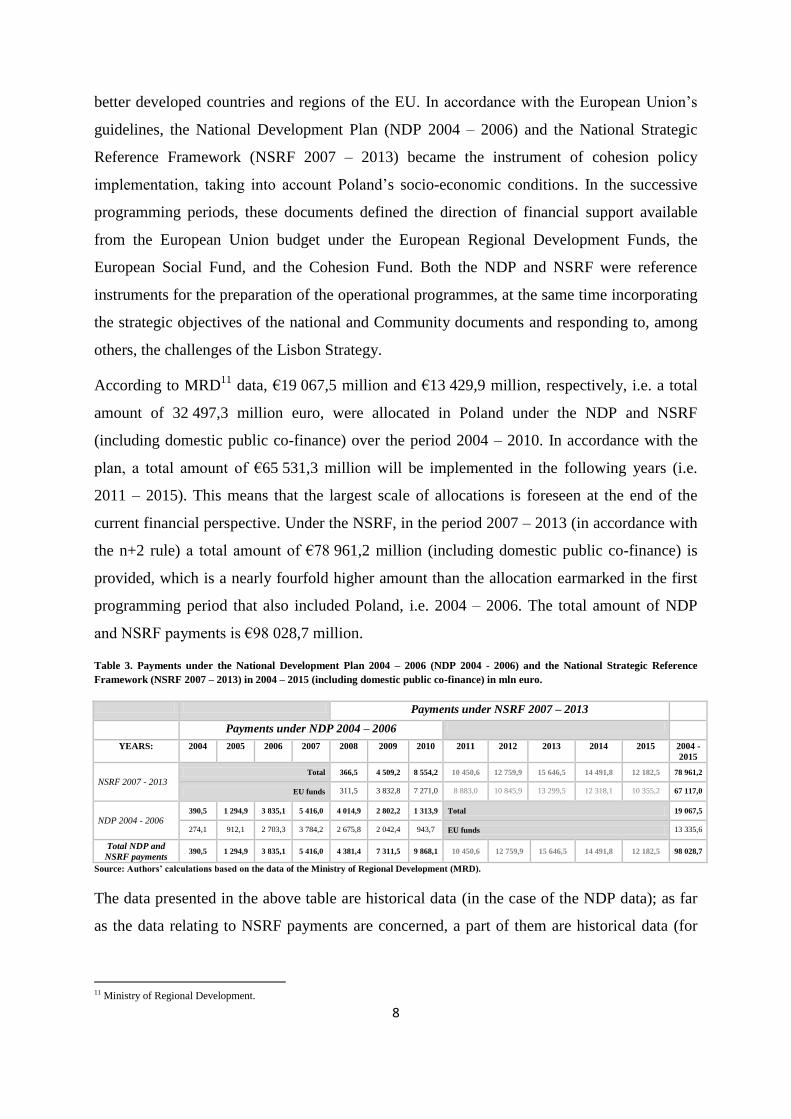
Poland – in the areas located peripherally in Europe, along the border with Ukraine, Belarus,
and Lithuania. Those NUTS-2 regions- Lubelskie,
Podlaskie, Podkarpackie, Warmińsko – Mazurskie, and
Świętokrzyskie - should be included in the regions with a
relatively lower level of socio-economic development.
The above is reflected in the level of GDP per capita.
The convergence with the more affluent regions of
Western Europe is ongoing in Poland. This process is the
most efficient in Mazowieckie Voivodeship (primarily in
the agglomeration of Warsaw, which is the capital of the
country). The situation of Dolnośląskie (66%), Wielkopolskie (65%) and Śląskie (65%) also
looks quite well relative to the whole country. However, this process is progressing noticeably
more slowly in the eastern part of Poland where the regions are characterised by one of the
lowest rates of GDP per capita relative to the EU average. The low levels of this indicator are
most frequently accompanied by a relatively high unemployment rate. This applies chiefly to
Świętokrzyskie and Podkarpackie, but also to Zachodniopomorskie which is situated in the
west of Poland. The spatial distribution of the employment rate is slightly different. Even
though it is the highest in the economically strong regions of Mazowieckie (54.2) and
Wielkopolskie (53.1), but relatively high values of the employment rate are found in the less
affluent south-eastern regions of the country (Lubelskie, Podkarpackie, Świętokrzyskie)
compared to the western regions, including, among others, the relatively wealthy regions of
Śląskie (48.1%) and Dolnośląskie (48.5). This situation is probably associated with the fact
that the eastern regions, Świętokrzyskie, Lubelskie, and Podkarpackie, are highly oriented
towards agriculture and there are EU direct payments that generate large-scale hidden
unemployment in these areas.
IV. Synthetic analysis of cohesion policy (NDP/NSRF) payments.
When Poland entered the European Union in 2004, it joined the implementation of cohesion
policy designed to support a harmonious development of the whole Community through
measures eliminating the disproportions in regional development. The proper orientation of
measures implemented under cohesion policy, with financial support of the Structural Funds,
was a development opportunity for Poland to accelerate the processes of convergence with the
Source: stat.gov.pl
Fig. 2. The employment rate in Polish regions in 2010
8
better developed countries and regions of the EU. In accordance with the European Union’s
guidelines, the National Development Plan (NDP 2004 – 2006) and the National Strategic
Reference Framework (NSRF 2007 – 2013) became the instrument of cohesion policy
implementation, taking into account Poland’s socio-economic conditions. In the successive
programming periods, these documents defined the direction of financial support available
from the European Union budget under the European Regional Development Funds, the
European Social Fund, and the Cohesion Fund. Both the NDP and NSRF were reference
instruments for the preparation of the operational programmes, at the same time incorporating
the strategic objectives of the national and Community documents and responding to, among
others, the challenges of the Lisbon Strategy.
According to MRD11
data, €19 067,5 million and €13 429,9 million, respectively, i.e. a total
amount of 32 497,3 million euro, were allocated in Poland under the NDP and NSRF
(including domestic public co-finance) over the period 2004 – 2010. In accordance with the
plan, a total amount of €65 531,3 million will be implemented in the following years (i.e.
2011 – 2015). This means that the largest scale of allocations is foreseen at the end of the
current financial perspective. Under the NSRF, in the period 2007 – 2013 (in accordance with
the n+2 rule) a total amount of €78 961,2 million (including domestic public co-finance) is
provided, which is a nearly fourfold higher amount than the allocation earmarked in the first
programming period that also included Poland, i.e. 2004 – 2006. The total amount of NDP
and NSRF payments is €98 028,7 million.
Table 3. Payments under the National Development Plan 2004 – 2006 (NDP 2004 - 2006) and the National Strategic Reference
Framework (NSRF 2007 – 2013) in 2004 – 2015 (including domestic public co-finance) in mln euro.
Payments under NSRF 2007 – 2013
Payments under NDP 2004 – 2006
YEARS: 2004 2005 2006 2007 2008 2009 2010 2011 2012 2013 2014 2015 2004 -
2015
NSRF 2007 - 2013 Total 366,5 4 509,2 8 554,2 10 450,6 12 759,9 15 646,5 14 491,8 12 182,5 78 961,2
EU funds 311,5 3 832,8 7 271,0 8 883,0 10 845,9 13 299,5 12 318,1 10 355,2 67 117,0
NDP 2004 - 2006 390,5 1 294,9 3 835,1 5 416,0 4 014,9 2 802,2 1 313,9 Total 19 067,5
274,1 912,1 2 703,3 3 784,2 2 675,8 2 042,4 943,7 EU funds 13 335,6
Total NDP and
NSRF payments 390,5 1 294,9 3 835,1 5 416,0 4 381,4 7 311,5 9 868,1 10 450,6 12 759,9 15 646,5 14 491,8 12 182,5 98 028,7
Source: Authors’ calculations based on the data of the Ministry of Regional Development (MRD).
The data presented in the above table are historical data (in the case of the NDP data); as far
as the data relating to NSRF payments are concerned, a part of them are historical data (for
11 Ministry of Regional Development.
9
the period 200812
– 2010), while a part of them are forecasts (for the period 2011 – 2015). As
regards the NSRF, an assumption is made that the domestic public co-finance contribution is
at a level of 15%.
The highest amount of payments under NDP 2004 – 2006 was in 2007 and 2008, which is
justified taking into consideration the duration of investment projects and project accounting,
For the same reason, under the NSRF the highest transfers of funds from the EU budget are
expected in the years 2013 and 2014, In both financial perspectives, the utilisation of financial
resources under cohesion policy was gradually made more dynamic and then slowed down.
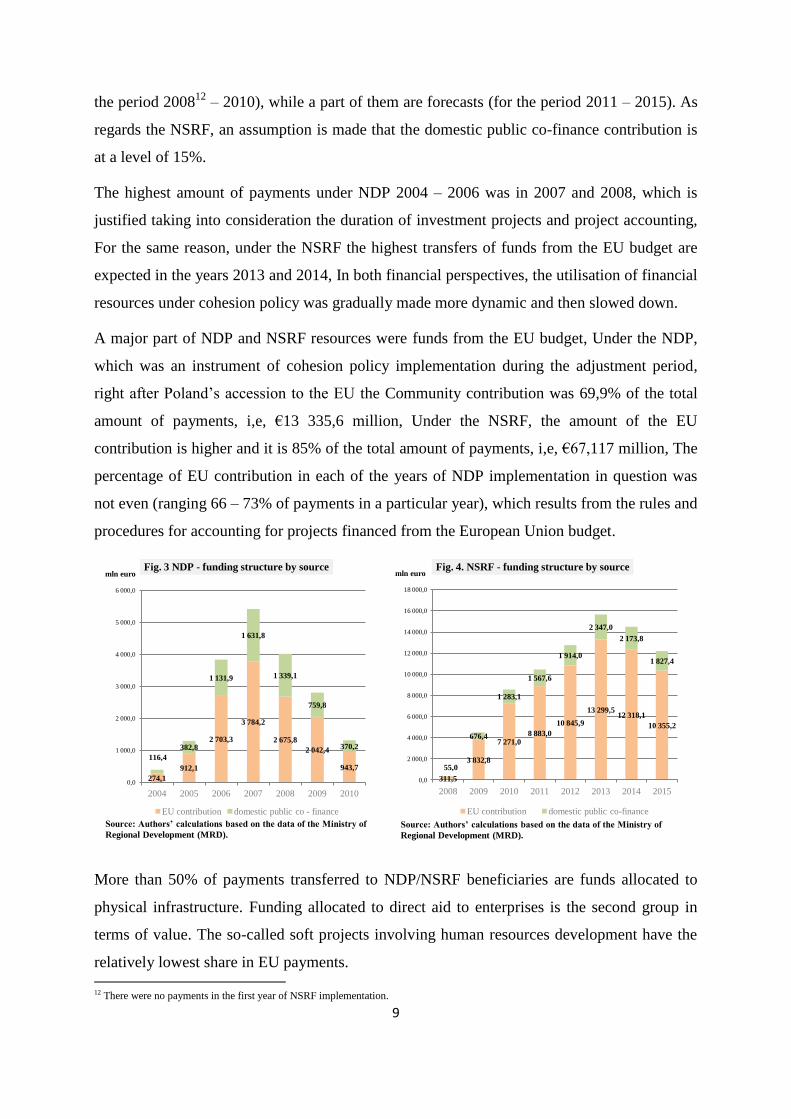
A major part of NDP and NSRF resources were funds from the EU budget, Under the NDP,
which was an instrument of cohesion policy implementation during the adjustment period,
right after Poland’s accession to the EU the Community contribution was 69,9% of the total
amount of payments, i,e, €13 335,6 million, Under the NSRF, the amount of the EU
contribution is higher and it is 85% of the total amount of payments, i,e, €67,117 million, The
percentage of EU contribution in each of the years of NDP implementation in question was
not even (ranging 66 – 73% of payments in a particular year), which results from the rules and
procedures for accounting for projects financed from the European Union budget.
More than 50% of payments transferred to NDP/NSRF beneficiaries are funds allocated to
physical infrastructure. Funding allocated to direct aid to enterprises is the second group in
terms of value. The so-called soft projects involving human resources development have the
relatively lowest share in EU payments. 12 There were no payments in the first year of NSRF implementation.
274,1
912,1
2 703,3
3 784,2
2 675,8
2 042,4
943,7
116,4
382,8
1 131,9
1 631,8
1 339,1
759,8
370,2
0,0
1 000,0
2 000,0
3 000,0
4 000,0
5 000,0
6 000,0
2004 2005 2006 2007 2008 2009 2010
mln euro Fig. 3 NDP - funding structure by source
EU contribution domestic public co - finance
Source: Authors’ calculations based on the data of the Ministry of
Regional Development (MRD).
311,5
3 832,8
7 271,0 8 883,0
10 845,9
13 299,5 12 318,1
10 355,2
55,0
676,4
1 283,1
1 567,6
1 914,0
2 347,0
2 173,8
1 827,4
0,0
2 000,0
4 000,0
6 000,0
8 000,0
10 000,0
12 000,0
14 000,0
16 000,0
18 000,0
2008 2009 2010 2011 2012 2013 2014 2015
mln euro Fig. 4. NSRF - funding structure by source
EU contribution domestic public co-finance
Source: Authors’ calculations based on the data of the Ministry of
Regional Development (MRD).
10
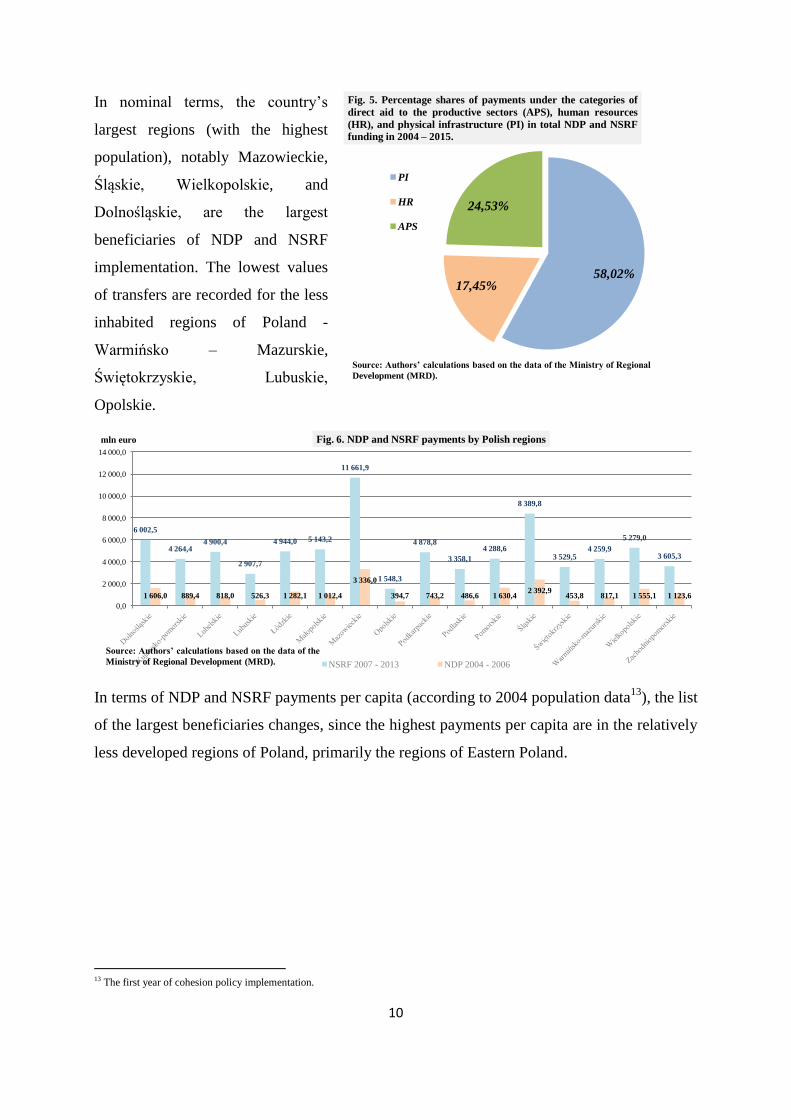
In nominal terms, the country’s
largest regions (with the highest
population), notably Mazowieckie,
Śląskie, Wielkopolskie, and
Dolnośląskie, are the largest
beneficiaries of NDP and NSRF
implementation. The lowest values
of transfers are recorded for the less
inhabited regions of Poland -
Warmińsko – Mazurskie,
Świętokrzyskie, Lubuskie,
Opolskie.
In terms of NDP and NSRF payments per capita (according to 2004 population data13
), the list
of the largest beneficiaries changes, since the highest payments per capita are in the relatively
less developed regions of Poland, primarily the regions of Eastern Poland.
13 The first year of cohesion policy implementation.
6 002,5
4 264,4 4 900,4
2 907,7
4 944,0 5 143,2
11 661,9
1 548,3
4 878,8
3 358,1
4 288,6
8 389,8
3 529,5 4 259,9
5 279,0
3 605,3
1 606,0 889,4 818,0 526,3 1 282,1 1 012,4
3 336,0
394,7 743,2 486,6 1 630,4 2 392,9
453,8 817,1 1 555,1 1 123,6
0,0
2 000,0
4 000,0
6 000,0
8 000,0
10 000,0
12 000,0
14 000,0
mln euro Fig. 6. NDP and NSRF payments by Polish regions
NSRF 2007 - 2013 NDP 2004 - 2006
Source: Authors’ calculations based on the data of the
Ministry of Regional Development (MRD).
58,02% 17,45%
24,53%
Fig. 5. Percentage shares of payments under the categories of
direct aid to the productive sectors (APS), human resources
(HR), and physical infrastructure (PI) in total NDP and NSRF
funding in 2004 – 2015.
PI
HR
APS
Source: Authors’ calculations based on the data of the Ministry of Regional
Development (MRD).
11
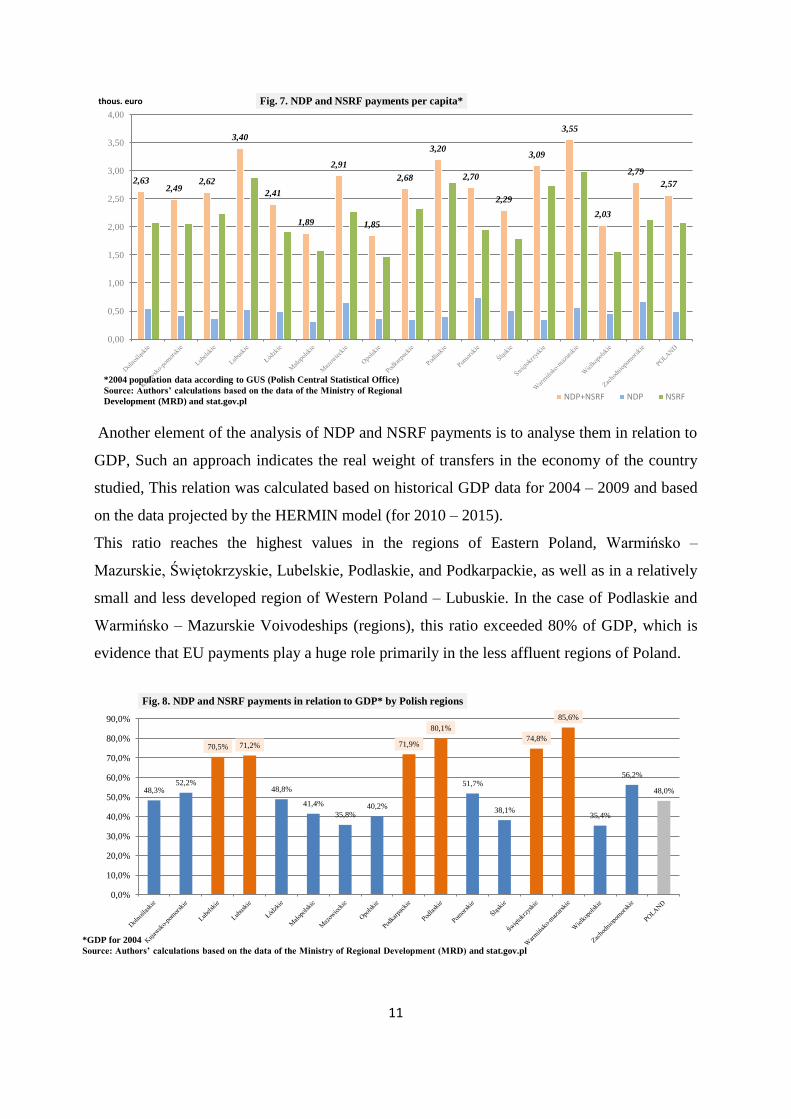
Another element of the analysis of NDP and NSRF payments is to analyse them in relation to
GDP, Such an approach indicates the real weight of transfers in the economy of the country
studied, This relation was calculated based on historical GDP data for 2004 – 2009 and based
on the data projected by the HERMIN model (for 2010 – 2015).
This ratio reaches the highest values in the regions of Eastern Poland, Warmińsko –
Mazurskie, Świętokrzyskie, Lubelskie, Podlaskie, and Podkarpackie, as well as in a relatively
small and less developed region of Western Poland – Lubuskie. In the case of Podlaskie and
Warmińsko – Mazurskie Voivodeships (regions), this ratio exceeded 80% of GDP, which is
evidence that EU payments play a huge role primarily in the less affluent regions of Poland.
2,63 2,49
2,62
3,40
2,41
1,89
2,91
1,85
2,68
3,20
2,70
2,29
3,09
3,55
2,03
2,79
2,57
0,00
0,50
1,00
1,50
2,00
2,50
3,00
3,50
4,00
thous. euro Fig. 7. NDP and NSRF payments per capita*
NDP+NSRF NDP NSRF
*2004 population data according to GUS (Polish Central Statistical Office)
Source: Authors’ calculations based on the data of the Ministry of Regional
Development (MRD) and stat.gov.pl
48,3% 52,2%
70,5% 71,2%
48,8%
41,4%
35,8% 40,2%
71,9%
80,1%
51,7%
38,1%
74,8%
85,6%
35,4%
56,2%
48,0%
0,0%
10,0%
20,0%
30,0%
40,0%
50,0%
60,0%
70,0%
80,0%
90,0%
Fig. 8. NDP and NSRF payments in relation to GDP* by Polish regions
*GDP for 2004
Source: Authors’ calculations based on the data of the Ministry of Regional Development (MRD) and stat.gov.pl
12
V. Analysis of the results based on the macroeconomic HERMIN simulations.
The analysis of the average cost per job created as a result of a specific financial intervention
(e.g. under the EU’s cohesion policy) is a task consisting of two basic parts. The first easier
part requires the determination of the value of funding that has been implemented into the
economic system of a region or country. This analysis is based on historical data and forecasts
of payments under the National Development Plan (NDP) 2004-2006 and the National
Strategic Reference Framework (NSRF) 2007-2013 which were made available by the Polish
Ministry of Regional Development – the institution responsible for collecting information on
the spending of cohesion policy funds and for making projections of such spending in the
future, e.g. with a breakdown by NUTS-2 regions. The second part of the investigation
consists in estimating the number of jobs that have been created due to EU financial support.
It should be mentioned that NDP/NSRF payments affect the economy both directly and
indirectly. By jobs which are directly associated with EU funds one means in this paper the
jobs created by a beneficiary or in the unit which implemented the project. However, these are
not the only effects generated by the EU funds. Cohesion policy also affects this part of the
economy which is not directly involved in the EU projects (in this article indirect labour
market effects are referred to as jobs generated by EU funds elsewhere than at the
beneficiary’s). This is so, among others, through demand-side effects. In other words, the
inflow of funds into an economic system contributes to an increase in income and global
demand which simulates a growth in GDP through the Keynesian multiplier mechanism, and
this in turn has a positive effect on the labour market. We also have to do with supply-side
effects of cohesion policy associated with the development and modernisation of transport
and telecommunications infrastructure, upgrade of machinery and equipment of enterprises as
well as increased human capital resources and quality. In the long-term perspective, effects
stimulating the supply side of the economy support the development of business initiative
reflected in increased entrepreneurship and investment as well as increased employment. It is
much more difficult to capture the indirect impact of resources allocated under the
NDP/NSRF than to extract the direct effects of cohesion policy on the labour market of a
region/country. One of the methods that enable the estimation of total direct and indirect
effects of EU financial support on the labour market is macroeconomic modelling which, by
using counterfactual analysis, allows one to determine what part of changes in the indicators
such as the unemployment rate or the employment rate is a result of cohesion policy
payments. The earlier mentioned regional HERMIN models of the economies of the Polish
13
NUTS-2 regions (voivodeships) were used in the study whose results formed the basis of this
article.
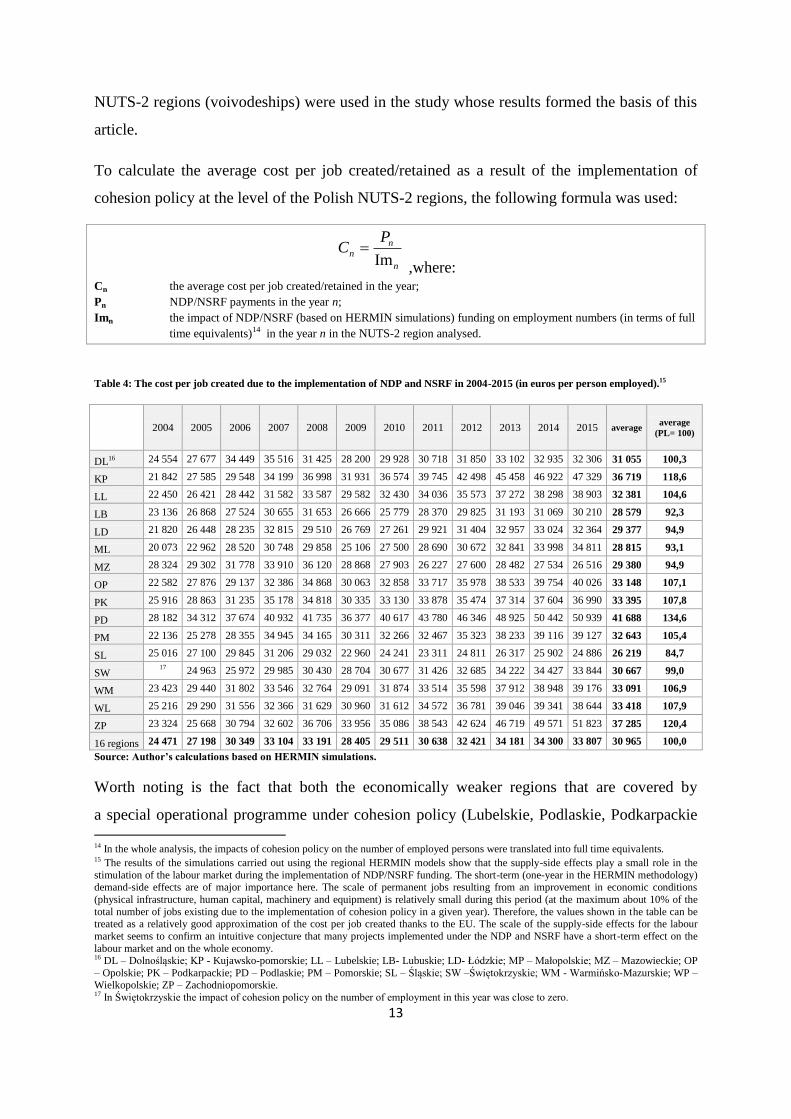
To calculate the average cost per job created/retained as a result of the implementation of
cohesion policy at the level of the Polish NUTS-2 regions, the following formula was used:
n
nn
PC
Im
,where: Cn the average cost per job created/retained in the year;
Pn NDP/NSRF payments in the year n;
Imn the impact of NDP/NSRF (based on HERMIN simulations) funding on employment numbers (in terms of full
time equivalents)14 in the year n in the NUTS-2 region analysed.
Table 4: The cost per job created due to the implementation of NDP and NSRF in 2004-2015 (in euros per person employed).15
2004 2005 2006 2007 2008 2009 2010 2011 2012 2013 2014 2015 average average
(PL= 100)
DL16 24 554 27 677 34 449 35 516 31 425 28 200 29 928 30 718 31 850 33 102 32 935 32 306 31 055 100,3
KP 21 842 27 585 29 548 34 199 36 998 31 931 36 574 39 745 42 498 45 458 46 922 47 329 36 719 118,6
LL 22 450 26 421 28 442 31 582 33 587 29 582 32 430 34 036 35 573 37 272 38 298 38 903 32 381 104,6
LB 23 136 26 868 27 524 30 655 31 653 26 666 25 779 28 370 29 825 31 193 31 069 30 210 28 579 92,3
LD 21 820 26 448 28 235 32 815 29 510 26 769 27 261 29 921 31 404 32 957 33 024 32 364 29 377 94,9
ML 20 073 22 962 28 520 30 748 29 858 25 106 27 500 28 690 30 672 32 841 33 998 34 811 28 815 93,1
MZ 28 324 29 302 31 778 33 910 36 120 28 868 27 903 26 227 27 600 28 482 27 534 26 516 29 380 94,9
OP 22 582 27 876 29 137 32 386 34 868 30 063 32 858 33 717 35 978 38 533 39 754 40 026 33 148 107,1
PK 25 916 28 863 31 235 35 178 34 818 30 335 33 130 33 878 35 474 37 314 37 604 36 990 33 395 107,8
PD 28 182 34 312 37 674 40 932 41 735 36 377 40 617 43 780 46 346 48 925 50 442 50 939 41 688 134,6
PM 22 136 25 278 28 355 34 945 34 165 30 311 32 266 32 467 35 323 38 233 39 116 39 127 32 643 105,4
SL 25 016 27 100 29 845 31 206 29 032 22 960 24 241 23 311 24 811 26 317 25 902 24 886 26 219 84,7
SW 17 24 963 25 972 29 985 30 430 28 704 30 677 31 426 32 685 34 222 34 427 33 844 30 667 99,0
WM 23 423 29 440 31 802 33 546 32 764 29 091 31 874 33 514 35 598 37 912 38 948 39 176 33 091 106,9
WL 25 216 29 290 31 556 32 366 31 629 30 960 31 612 34 572 36 781 39 046 39 341 38 644 33 418 107,9
ZP 23 324 25 668 30 794 32 602 36 706 33 956 35 086 38 543 42 624 46 719 49 571 51 823 37 285 120,4
16 regions 24 471 27 198 30 349 33 104 33 191 28 405 29 511 30 638 32 421 34 181 34 300 33 807 30 965 100,0
Source: Author’s calculations based on HERMIN simulations.
Worth noting is the fact that both the economically weaker regions that are covered by
a special operational programme under cohesion policy (Lubelskie, Podlaskie, Podkarpackie
14 In the whole analysis, the impacts of cohesion policy on the number of employed persons were translated into full time equivalents. 15 The results of the simulations carried out using the regional HERMIN models show that the supply-side effects play a small role in the
stimulation of the labour market during the implementation of NDP/NSRF funding. The short-term (one-year in the HERMIN methodology) demand-side effects are of major importance here. The scale of permanent jobs resulting from an improvement in economic conditions
(physical infrastructure, human capital, machinery and equipment) is relatively small during this period (at the maximum about 10% of the
total number of jobs existing due to the implementation of cohesion policy in a given year). Therefore, the values shown in the table can be treated as a relatively good approximation of the cost per job created thanks to the EU. The scale of the supply-side effects for the labour
market seems to confirm an intuitive conjecture that many projects implemented under the NDP and NSRF have a short-term effect on the
labour market and on the whole economy. 16 DL – Dolnośląskie; KP - Kujawsko-pomorskie; LL – Lubelskie; LB- Lubuskie; LD- Łódzkie; MP – Małopolskie; MZ – Mazowieckie; OP
– Opolskie; PK – Podkarpackie; PD – Podlaskie; PM – Pomorskie; SL – Śląskie; SW –Świętokrzyskie; WM - Warmińsko-Mazurskie; WP – Wielkopolskie; ZP – Zachodniopomorskie. 17 In Świętokrzyskie the impact of cohesion policy on the number of employment in this year was close to zero.
14
and Warmińsko-Mazurskie) and the economically stronger regions (Pomorskie,
Wielkopolskie) as well as those ranking somewhere between these two groups (Opolskie,
Kujawsko-Pomorskie, Zachodniopomorskie) are the regions characterised by the relatively
highest average cost per job created due to cohesion policy (higher than for Poland as a
whole: €30 965). Thus, it cannot be concluded that the cost of job generation is strictly
dependent on the level of economic development of a particular region. Furthermore, a
conclusion can be made that there is no significant correlation between the cost of job creation
and the real scale of EU payments measured in relation to regional GDP. It is visible when
comparing two regions: Warmińsko-Mazurskie (the largest beneficiary of EU payments
relative to its GDP and, at the same time, a region that is characterised by a relatively high
cost per job) and Lubuskie (ranking relatively high in terms of EU payments relative to its
GDP and, at the same time, a region that is characterised by a relatively low cost per job).
Taking into account the above, it should be stated that the regional differences in the cost per
job created as a result of EU financial intervention are the resultant of a number of factors
determining the effectiveness of funds implemented into the economy, such as- among others-
: the strength of the Keynesian multiplier mechanism18
(determined by the marginal
propensity to consume and to import from regional income) affecting the scale of demand-
side effects, the employment multiplier19
, the rate of technological progress impacting labour
productivity.20
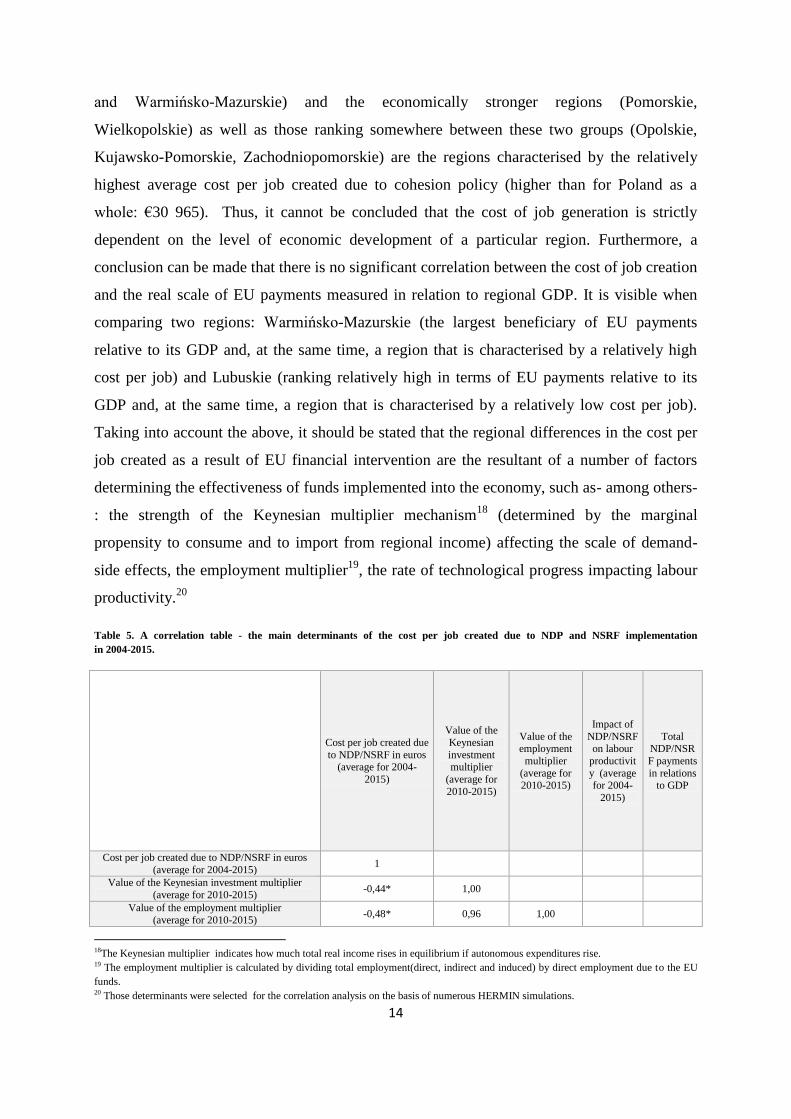
Table 5. A correlation table - the main determinants of the cost per job created due to NDP and NSRF implementation
in 2004-2015.
Cost per job created due
to NDP/NSRF in euros (average for 2004-
2015)
Value of the
Keynesian
investment multiplier
(average for
2010-2015)
Value of the employment
multiplier
(average for 2010-2015)
Impact of
NDP/NSRF on labour
productivit
y (average for 2004-
2015)
Total NDP/NSR
F payments
in relations to GDP
Cost per job created due to NDP/NSRF in euros
(average for 2004-2015) 1
Value of the Keynesian investment multiplier
(average for 2010-2015) -0,44* 1,00
Value of the employment multiplier
(average for 2010-2015) -0,48* 0,96 1,00
18The Keynesian multiplier indicates how much total real income rises in equilibrium if autonomous expenditures rise. 19 The employment multiplier is calculated by dividing total employment(direct, indirect and induced) by direct employment due to the EU
funds. 20 Those determinants were selected for the correlation analysis on the basis of numerous HERMIN simulations.
15
Impact of NDP/NSRF on labour productivity
(average for 2004-2015) 0,27* 0,11 -0,02 1,00
Total NDP/NSRF payments in relations to GDP 0,40 -0,61 -0,58 0,47 1
Source: Authors’ calculations based on HERMIN simulations.
* statistically significant at 10%.
The analysis of the data in Table 5 shows that none of the main factors which can determine
the strength of cohesion policy effects is of decisive importance for the value of the average
cost per job at the regional level in Poland. It is worth noticing that the multiplier
mechanisms, which multiply the impacts of EU resources on the labour market and thereby
reduce the average cost per job created due to the implementation of cohesion policy, play a
relatively important role here.
Another interesting convention of presentation of the average cost per job created due to EU
financial intervention can be the calculation of the cumulative cost that has been incurred up
to a given year, in accordance with the following formula:
n
n
k
k
n
P
CsIm
2004
, where:
Csn the cumulative cost per job created/retained in the year n;
Pn NDP/NSRF payments in the year n;
Imn the impact of NDP/NSRF (based on HERMIN simulations) funding on employment numbers (in terms of full time
equivalents) in the year n in the NUTS-2 region analysed.
Such a method of calculation of the cost in question allows one to determine the effectiveness of
funding implemented into the economic system from the beginning of the implementation period
(2004) until a specific year. The above convention enables us to answer the question: What is the final
cost of NDP/NSRF impact, measured in a particular year, on the labour market? - with the final cost
understood as all funding that was spent up to a given year, inclusive, to create a job existing in that
year. In other words, this method does not take into account jobs that were created/retained due to EU
interventions in the previous years, but they do not exist any more in the year examined. Given the
above, it can be stated that, on the one hand, the cost under consideration is overestimated, since even
short-term jobs generated positive effects for a particular region, e.g. in the form of additional
professional experience for a part of its population, protection from long-term unemployment as well
as reduced economic inactivity and social exclusion. On the other hand, this method of calculation of
the average cost per job allows one to present explicitly and to compare at the regional scale the final
16
long-term effectiveness of cohesion policy with respect to the labour market several years after the
termination of the inflow of funds into the economy.
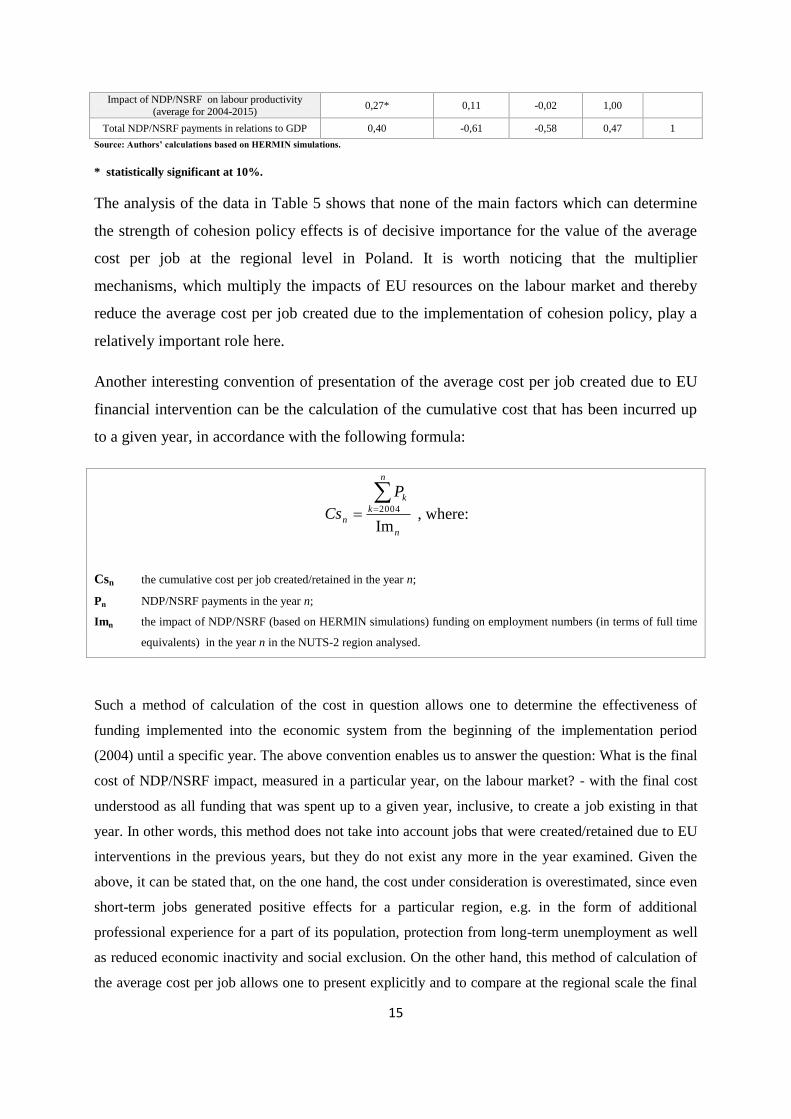
Table 6. The cumulative cost per job created due to NDP and NSRF implementation in some21 years of the analysed period 2004-
2020 (in euros per person employed, Poland=100).
2013 2013 Poland=100 2015 2015 Poland=100 2020 2020 Poland=100
DL 141 991 91 248 714 91 1 922 197 105
KP 187 061 120 353 763 130 2 329 705 127
LL 148 320 95 284 008 104 3 210 556 175
LB 137 949 88 237 733 87 1 205 010 66
LD 143 575 92 251 945 93 1 424 712 78
ML 142 755 92 270 561 99 3 373 393 184
MZ 143 147 92 229 214 84 2 037 419 111
OP 196 696 126 350 050 129 2 222 125 121
PK 157 866 101 281 979 104 1 554 418 85
PD 187 564 120 362 349 133 2 547 881 139
PM 204 231 131 354 107 130 2 150 855 117
SL 129 134 83 211 322 78 1 036 765 57
SW 138 035 89 249 428 92 1 451 147 79
WM 163 254 105 302 442 111 2 142 528 117
WL 189 621 122 325 643 120 1 697 266 92
ZP 247 831 159 466 537 171 6 110 409 333
16 regions 155 879 100 272 036 100 1 834 895 100
Source: Authors’ calculations based on HERMIN simulations.
As shown in Table 6, Zachodniopomorskie, which is a relatively economically weaker region of
Poland, though marked by high development potential, is the Polish NUTS-2 region that is
characterised by the highest cost per job created/retained due to EU cohesion policy according to the
simulations performed. In 2020, thus five years after the assumed termination of NDP/NSRF
payments, the average cost per job created/retained and still existing in this region in 2020 due to the
EU programmes is estimated at about €6,1 million, which is 333% of the national average. The
Silesian region (Śląskie) is at the opposite extreme with the average cost about 1 million (57% of the
national average in 2020), which indicates relatively high supply and demand-side effects of the EU
funds (see the year 2013) in the labour market as well as higher durability of jobs created due to
cohesion policy in this region. A decline in the cost in question was recorded in half of the regions
(primarily in Śląskie, Wielkopolskie, and Lubuskie) in relation to the national average between 2013
and 2020. This suggests relatively high supply and demand-side effects in the labour market in these
regions and/or a high level of durability of jobs created. It must be stressed that an enormous increase
in the nominal cumulative cost per job created due to EU financial intervention which is noticed
between 2015 and 2020 results from the fact that after the assumed termination of EU funds the
21 2013 – the peak year of EU payments; 2015 – the last year of EU payments in the 2007-2013 perspective (the year after which EU
transfers are assumed to terminate, which is designed to determine long-term supply-side effects of NDP/NSRF funding); 2020 – the last
year of the analysis, five years after the assumed termination of Community financial support under cohesion policy.
17
demand-side effects disappear and the only impact of cohesion policy on the labour market is through
the long-term supply-side effects that are lower than total (supply and demand- side) effects of EU
financial assistance in the implementation phase (2004-2015).
In the context of the analysis of the average cost per job created/retained due to the
implementation of cohesion policy, one should also mention a very important aspect of the
investigation of the effects of financial interventions, which is the deadweight effect.22
Due to the fact
that NDP payments terminated relatively recently, while the NSRF programme still continues, there
are no reliable research results that would present the estimated scale of this phenomenon over the
period 2004-2015. Therefore, full additionality of the effects generated by EU funds was assumed in
the HERMIN methodology – including the impacts of NDP/NSRF on the labour market. In order to
make an initial tentative estimate of the cost of job creation, taking into account the deadweight effect,
the authors used the results of a questionnaire survey conducted by the Polish Agency for Enterprise
Development (2005) relating to the scale of the above-mentioned effect during the implementation of
the Phare programme (specifically, a component of this programme oriented towards assistance to
SMEs).2324
Furthermore, the estimated displacement effect25
was also taken into account.26
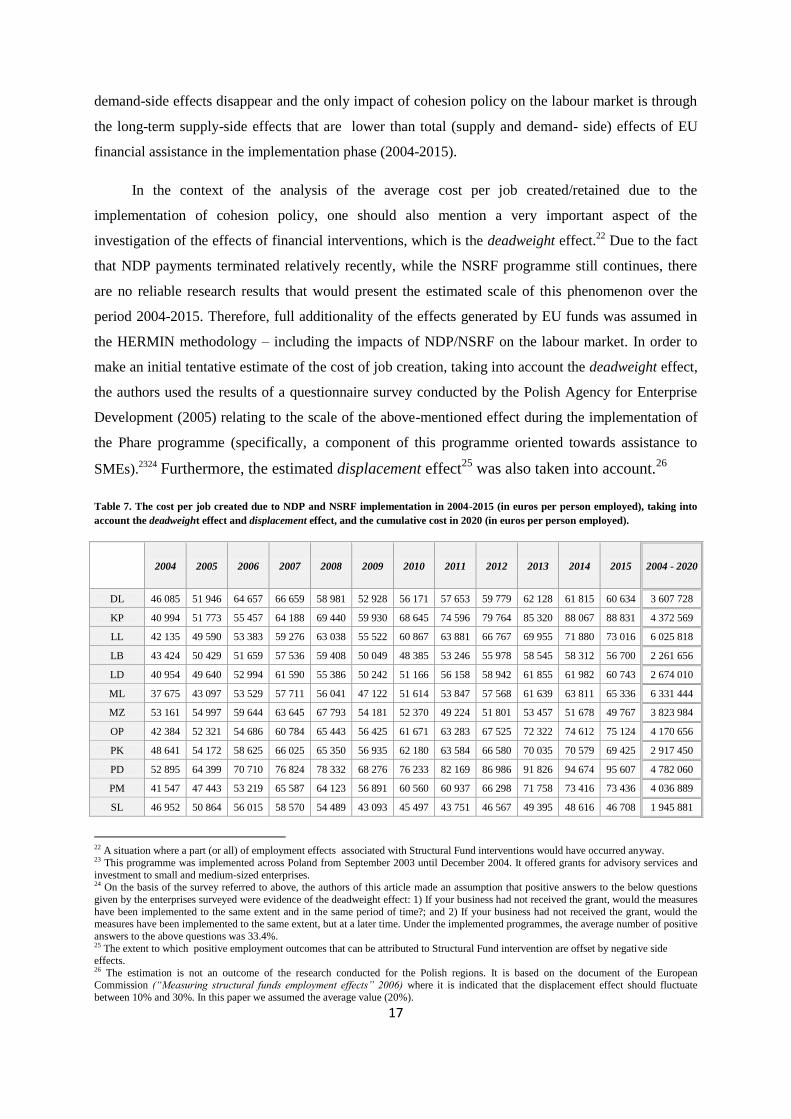
Table 7. The cost per job created due to NDP and NSRF implementation in 2004-2015 (in euros per person employed), taking into
account the deadweight effect and displacement effect, and the cumulative cost in 2020 (in euros per person employed).
2004 2005 2006 2007 2008 2009 2010 2011 2012 2013 2014 2015 2004 - 2020
DL 46 085 51 946 64 657 66 659 58 981 52 928 56 171 57 653 59 779 62 128 61 815 60 634 3 607 728
KP 40 994 51 773 55 457 64 188 69 440 59 930 68 645 74 596 79 764 85 320 88 067 88 831 4 372 569
LL 42 135 49 590 53 383 59 276 63 038 55 522 60 867 63 881 66 767 69 955 71 880 73 016 6 025 818
LB 43 424 50 429 51 659 57 536 59 408 50 049 48 385 53 246 55 978 58 545 58 312 56 700 2 261 656
LD 40 954 49 640 52 994 61 590 55 386 50 242 51 166 56 158 58 942 61 855 61 982 60 743 2 674 010
ML 37 675 43 097 53 529 57 711 56 041 47 122 51 614 53 847 57 568 61 639 63 811 65 336 6 331 444
MZ 53 161 54 997 59 644 63 645 67 793 54 181 52 370 49 224 51 801 53 457 51 678 49 767 3 823 984
OP 42 384 52 321 54 686 60 784 65 443 56 425 61 671 63 283 67 525 72 322 74 612 75 124 4 170 656
PK 48 641 54 172 58 625 66 025 65 350 56 935 62 180 63 584 66 580 70 035 70 579 69 425 2 917 450
PD 52 895 64 399 70 710 76 824 78 332 68 276 76 233 82 169 86 986 91 826 94 674 95 607 4 782 060
PM 41 547 47 443 53 219 65 587 64 123 56 891 60 560 60 937 66 298 71 758 73 416 73 436 4 036 889
SL 46 952 50 864 56 015 58 570 54 489 43 093 45 497 43 751 46 567 49 395 48 616 46 708 1 945 881
22 A situation where a part (or all) of employment effects associated with Structural Fund interventions would have occurred anyway. 23 This programme was implemented across Poland from September 2003 until December 2004. It offered grants for advisory services and
investment to small and medium-sized enterprises. 24 On the basis of the survey referred to above, the authors of this article made an assumption that positive answers to the below questions
given by the enterprises surveyed were evidence of the deadweight effect: 1) If your business had not received the grant, would the measures
have been implemented to the same extent and in the same period of time?; and 2) If your business had not received the grant, would the measures have been implemented to the same extent, but at a later time. Under the implemented programmes, the average number of positive
answers to the above questions was 33.4%. 25 The extent to which positive employment outcomes that can be attributed to Structural Fund intervention are offset by negative side effects. 26 The estimation is not an outcome of the research conducted for the Polish regions. It is based on the document of the European Commission (“Measuring structural funds employment effects” 2006) where it is indicated that the displacement effect should fluctuate
between 10% and 30%. In this paper we assumed the average value (20%).
18
SW 27 46 852 48 747 56 279 57 113 53 875 57 576 58 982 61 346 64 231 64 616 63 522 2 723 624
WM 43 961 55 256 59 689 62 962 61 493 54 600 59 824 62 901 66 813 71 155 73 101 73 528 4 021 261
WL 47 326 54 973 59 227 60 748 59 363 58 109 59 333 64 887 69 034 73 285 73 838 72 531 3 185 560
ZP 43 777 48 176 57 796 61 190 68 893 63 732 65 852 72 341 80 001 87 687 93 039 97 265 11 468 486
16 regions 45 929 51 047 56 961 62 132 62 295 53 313 55 388 57 503 60 851 64 154 64 377 63 452 3 443 872
Source: Authors’ calculations based on HERMIN simulations.
As can be easily seen, when the deadweight and displacement effects are taken into account
there is an increase in the average cost per job created/retained due to the implementation of
cohesion policy in 2004-2015. It should be stressed here once again that the above estimates
are based on the results of the investigation of the deadweight effect in the pre-accession
period and guidelines of the European Commission regarding the displacement effect.
Therefore, the values presented in Table 7 should be treated with caution.
To conclude the analysis of the cost of job creation/retention as a result of EU financial
intervention, it is worth investigating the correlation between the cumulative costs
approximating the effectiveness of cohesion policy in stimulating the labour market and the
cumulative multiplier28
(Bradley Untiedt 2010) reflecting the effectiveness of EU funds in
terms of GDP growth. This will allow us to answer the question whether the effects of EU
cohesion policy stimulate the so-called jobless growth – an economic growth with a relatively
low demand for labour.
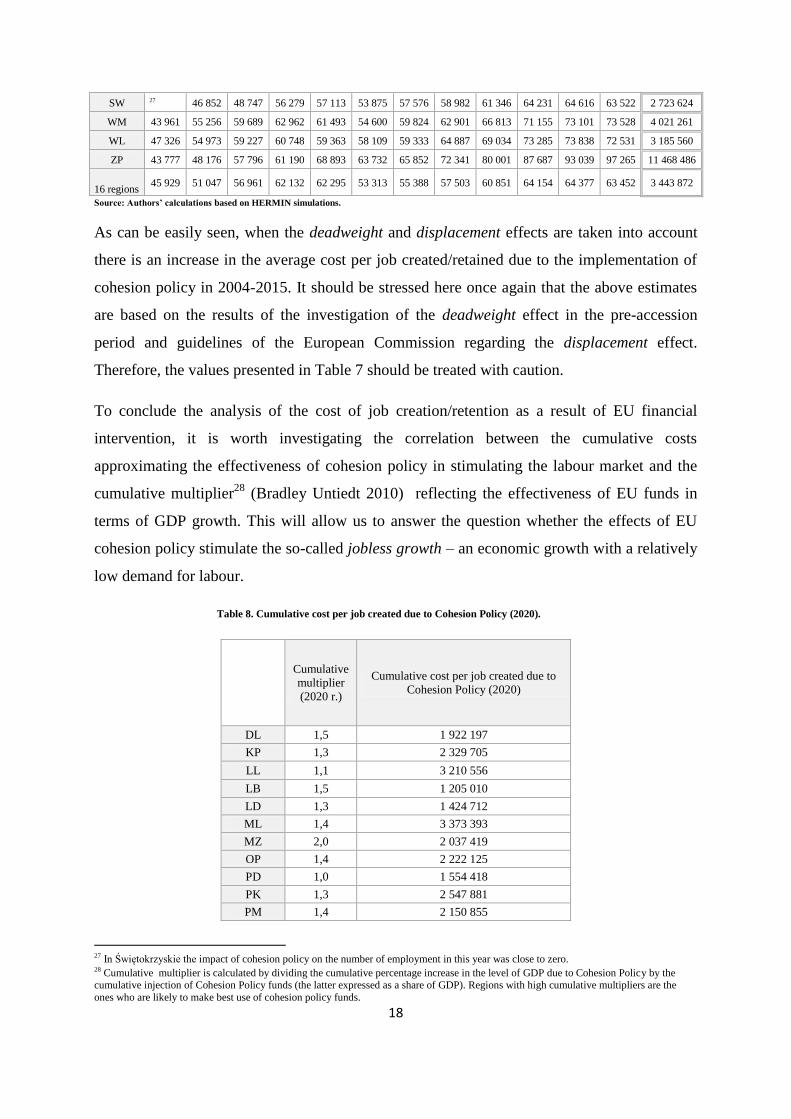
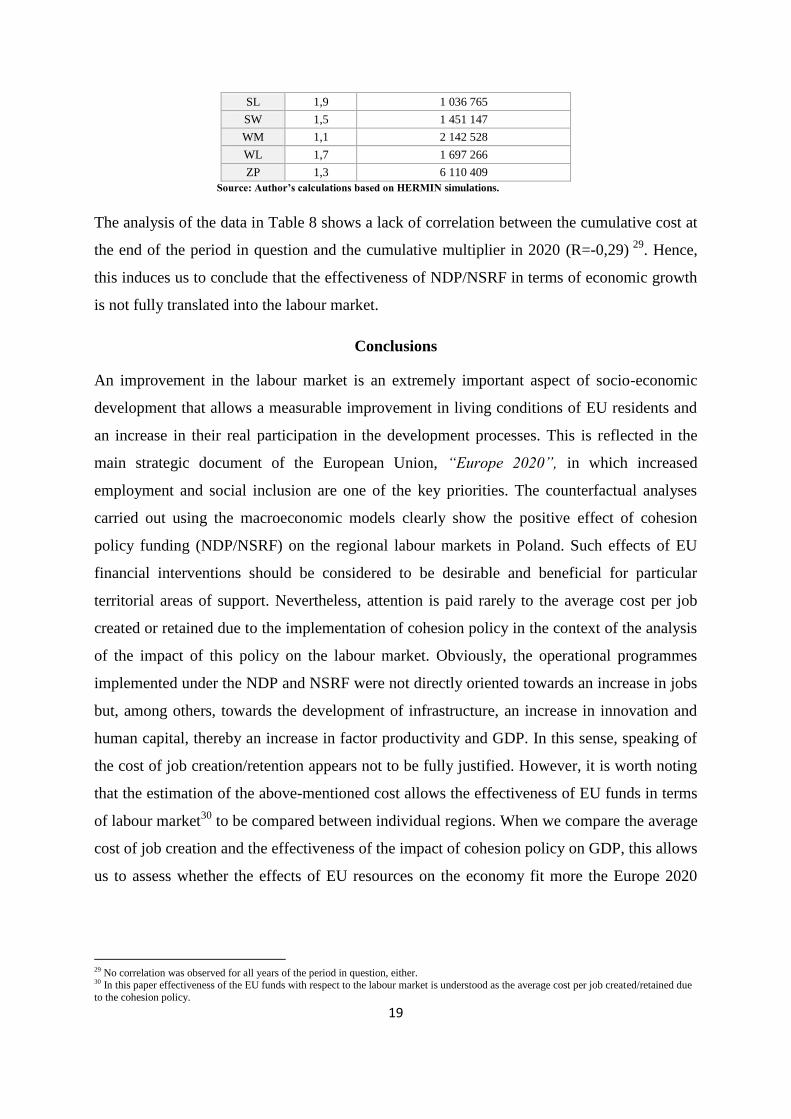
Table 8. Cumulative cost per job created due to Cohesion Policy (2020).
Cumulative
multiplier
(2020 r.)
Cumulative cost per job created due to
Cohesion Policy (2020)
DL 1,5 1 922 197
KP 1,3 2 329 705
LL 1,1 3 210 556
LB 1,5 1 205 010
LD 1,3 1 424 712
ML 1,4 3 373 393
MZ 2,0 2 037 419
OP 1,4 2 222 125
PD 1,0 1 554 418
PK 1,3 2 547 881
PM 1,4 2 150 855
27 In Świętokrzyskie the impact of cohesion policy on the number of employment in this year was close to zero. 28 Cumulative multiplier is calculated by dividing the cumulative percentage increase in the level of GDP due to Cohesion Policy by the cumulative injection of Cohesion Policy funds (the latter expressed as a share of GDP). Regions with high cumulative multipliers are the
ones who are likely to make best use of cohesion policy funds.
19
SL 1,9 1 036 765
SW 1,5 1 451 147
WM 1,1 2 142 528
WL 1,7 1 697 266
ZP 1,3 6 110 409
Source: Author’s calculations based on HERMIN simulations.
The analysis of the data in Table 8 shows a lack of correlation between the cumulative cost at
the end of the period in question and the cumulative multiplier in 2020 (R=-0,29) 29
. Hence,
this induces us to conclude that the effectiveness of NDP/NSRF in terms of economic growth
is not fully translated into the labour market.
Conclusions
An improvement in the labour market is an extremely important aspect of socio-economic
development that allows a measurable improvement in living conditions of EU residents and
an increase in their real participation in the development processes. This is reflected in the
main strategic document of the European Union, “Europe 2020”, in which increased
employment and social inclusion are one of the key priorities. The counterfactual analyses
carried out using the macroeconomic models clearly show the positive effect of cohesion
policy funding (NDP/NSRF) on the regional labour markets in Poland. Such effects of EU
financial interventions should be considered to be desirable and beneficial for particular
territorial areas of support. Nevertheless, attention is paid rarely to the average cost per job
created or retained due to the implementation of cohesion policy in the context of the analysis
of the impact of this policy on the labour market. Obviously, the operational programmes
implemented under the NDP and NSRF were not directly oriented towards an increase in jobs
but, among others, towards the development of infrastructure, an increase in innovation and
human capital, thereby an increase in factor productivity and GDP. In this sense, speaking of
the cost of job creation/retention appears not to be fully justified. However, it is worth noting
that the estimation of the above-mentioned cost allows the effectiveness of EU funds in terms
of labour market30
to be compared between individual regions. When we compare the average
cost of job creation and the effectiveness of the impact of cohesion policy on GDP, this allows
us to assess whether the effects of EU resources on the economy fit more the Europe 2020
29 No correlation was observed for all years of the period in question, either. 30 In this paper effectiveness of the EU funds with respect to the labour market is understood as the average cost per job created/retained due
to the cohesion policy.
20
priority, which is increased employment, or they stimulate more the so-called jobless
growth31
.
The analysis of the average cost of job created/retained due to NDP (2004-2010) and NSRF
(2007-2015) funding made in this paper allows us to make the following conclusions:
The average cost of job creation/retention is not dependent on the level of economic
development of a region. Both the economically weaker regions which are covered by a
special operational programme under cohesion policy (Lubelskie, Podlaskie, Podkarpackie,
and Warmińsko-Mazurskie) and the economically stronger regions (Pomorskie,
Wielkopolskie) as well as those ranking somewhere between the above two groups (Opolskie,
Kujawsko-Pomorskie, Zachodniopomorskie) are the regions characterised by the relatively
highest average cost per job created due to cohesion policy (higher than for Poland as a
whole: €30 965 );
The regional differences in the average cost per job created as a result of EU financial
intervention are the resultant of a number of factors determining the effectiveness of funds
implemented into the economy such as: the strength of the Keynesian multiplier mechanism
(determined by the marginal propensity to consume and to import from regional income)
affecting the scale of demand-side effects, the employment multiplier, the rate of
technological progress impacting labour productivity, labour force participation affecting
labour costs;
Zachodniopomorskie, a relatively economically weaker region of Poland, though
marked by high development potential, is characterised by the highest cumulative cost per job
created/retained due to EU cohesion policy. In 2020, thus five years after the assumed
termination of NDP/NSRF payments, the average cost per job created/retained in this region
and still existing in that year due to the EU programmes is estimated at about €6,1 million,
which is 333% of the national average. The Silesian region (Śląskie) is at the opposite
extreme with the average cumulative cost amounting to approximately € 1million (57% of the
national average in 2020);
31 More information about jobless growth can be found- among others- in:
Khemraj T., Madrick J., Semmler W., Okun’s Law and jobless growth, Schwarc Center for Economic Analysis, 2006; Caballero R.J.,
Hammour M.L., Jobless growth: appropriability, factor substitution, and unemployment, National Bureau of Economic Research, 1997.
21
In the optimistic scenario, resources implemented into a regional economy should
stimulate economic activities (e.g. investment) which would not be undertaken in the absence
of EU funds (in keeping with the principle of full additionality). Nevertheless, we should
expect with high probability the occurrence of the deadweight and displacement effect, the
consequence of which will be an increase in the average cost per job analysed;
Due to the lack of studies on the supply-side effects of EU resources in Poland and its
NUTS-2 regions, the authors of the present article used in their simulations the same
parameters of spillover elasticities determining the scale of supply-side effects (adopted on
the basis of available empirical analyses carried out for other countries with the economic
characteristics similar to that of Poland (Bradley Untiedt 2010));
In the Polish NUTS-2 regions, the effectiveness of cohesion policy in terms of its
impact on regional GDP is not necessary related to the effectiveness of EU funds with respect
to the labour market. In connection with the above, it is conceivable that cohesion policy in
Poland is closer to a jobless growth model rather than employment-oriented one. The above
conclusion relates to the medium-term period in question (until 2020). In the long-term, the
stimulation of labour productivity must result in increased employment. Nevertheless, the
drawn conclusion and calculated costs can form an important contribution to the discussion on
the priorities of projects to be implemented in the new EU financial perspective (2014-2020)
and on their expected effectiveness for the labour market.
Bibliography:
1. Barca F. (2009). An Agenda for a Reformed Cohesion Policy. A place-based approach to meeting European
Union challenges and expectations. Independent Report prepared at the request of Danuta Hübner,
Commissioner for Regional Policy.
2. Bondonio D., Martini A., Counterfactual impact evaluation of enterprise support: lessons for policy and
evaluation design from investment subsidies in Italy. Report to the DG-REGIO of the European Commission
“Counterfactual Impact Evaluation of Cohesion Policy. Work Package 1: Examples from Enterprise
Support”, Associazione per lo Sviluppo della Valutazione e l’Analisi delle Politiche Pubbliche, 2012.
3. Bradley J., Untiedt G. (2010). The COHESION system of HERMIN country and regional models:
Description and operating manual, Version 4, GEFRA, EMDS, Muenster.
4. Bradley J., Untiedt G., Zaleski J. (2008). The Economic Return of Cohesion Expenditure for Member States -
Final Report Directorate General For Internal Policies Policy Department B: Structural And Cohesion
Policies, the European Parliament's Committee on Regional Development, Brussels.
5. Bradley J., Zaleski J. (2003). „Modelling EU Accession and Structural Fund Impacts Using the New Polish
HERMIN Model”, w: W. Welfe (red.), Modelling Economies in Transition, Proceedings of the 7th
Conference of the International Association, AMFET, Łódź.
6. Caballero R.J., Hammour M.L., Jobless growth: appropriability, factor substitution, and unemployment,
National Bureau of Economic Research, 1997.
22
7. Capello R. (2008). Modelling Regional Scenarios for the Enlarged Europe: European Competitiveness and
Global Strategies (Advances in Spatial Science), Springer, Berlin.
8. Dokument roboczy nr 6, Mierzenie wpływu funduszy strukturalnych na zatrudnienie, MRR, 2006;
9. Gáková Z., Grigonytė D., Monfort P. (2009). „A Cross-Country Impact Assessment of EU Cohesion Policy.
Applying the Cohesion System of HERMIN Models”, A series of short papers on regional research and
indicators produced by the Directorate-General for Regional Policy, N° 01/2009.
10. Red. Haber A., Trzciński R., Ocena wpływu i prognozowanie efektów w badaniach ewaluacyjnych, PARP,
2011.
11. Investing in Europe’s future, Fifth report on economic, social and territorial cohesion. (2010). European
Commission, Brussel.
12. Kaczor T., Socha R., Badanie wpływu Narodowego Planu Rozwoju 2004 – 2006 oraz Narodowych
Strategicznych Ram Odniesienia 2007 – 2013 na wybrane wskaźniki dokumentów strategicznych, Warszawa,
2008.
13. Khemraj T., Madrick J., Semmler W., Okun’s Law and jobless growth, Schwarc Center for Economic
Analysis, 2006.
14. Komornicki T. (2009). Określenie i ocena charakteru, struktury i intensywności polskiego eksportu w
kontekście celów polityki regionalnej, na poziomie województw i powiatów w ujęciu dynamicznym,
Ekspertyza wykonana na zlecenie Ministerstwa Rozwoju Regionalnego IGiPZ PAN
15. Konsorcjum: Info Audit Sp. Z o.o., Europejskie Centrum Konsultingu sp. z o.o., Tryc G., Wpływ realizacji
Sektorowego Programu Operacyjnego Wzrost Konkurencyjności Przedsiębiorstw, lata 2004 – 2006, na
poziom zatrudnienia w sektorze przedsiębiorstw, warszawa, 2008.
16. Kudełko J., Mogiła Z., Tomaszewski P., Zaleski J., Zembaty M. (2011). Wpływ realizacji Narodowego Planu
Rozwoju 2004-2006 (NPR) i Narodowych Strategicznych Ram Odniesienia/ Narodowej Strategii Spójności
2007-2013 (NSRO/NSS) na wybrane wskaźniki makroekonomiczne na poziomie regionalnym do roku 2020
przy użyciu modeli regionalnych HERMIN, WARR, Wrocław.
17. Mogiła Z., Zaleski J. (2011). Jakość informacji przekazywanych przez administrację publiczną i ich
znaczenie dla procesu ewaluacji wpływu polityki spójności na rozwój społeczno-gospodarczy kraju.
Zarządzanie publiczne 2/2010, MSzAP, Kraków.
18. PAG Uniconsult, Wpływ polityki spójności na poziom i jakość zatrudnienia w Polsce, MRR, Warszawa 2010.
19. PSDB sp. z o.o., Analiza wpływu projektów współfinansowanych z EFRR realizowanych w ramach
priorytetu I i III ZPORR na tworzenie miejsc pracy, Warszawa, 2008.
20. Raport końcowy z badania „Wpływ z interwencji funduszy strukturalnych na zatrudnienie”, MRR,
Warszawa, 2007 r.
21. The New Programming Period, 2007-2013: Methodological Working Papers. Working Paper on Ex Ante
Evaluation. (2005). European Commission, Directorate-General Regional Policy.
22. Zaleski J. (2011). Modelowanie makroekonomiczne gospodarek regionalnych- użyteczne narzędzie czy
nieprzydatna zabawa intelektualna. Zarządzanie publiczne (w druku), MSzAP, Kraków.


![MARIA ZAŁ ĘSKA - Katedra Italianistykiitalianistyka.uw.edu.pl/wp-content/uploads/2017/02/Maria-Zaleska-publications-ENG.pdf5 dell’insegnamento e dell’apprendimento”]. In: L’italiano](https://static.fdocuments.net/doc/165x107/5e726ae64627b147f723cb6b/maria-za-ska-katedra-italia-5-dellainsegnamento-e-dellaapprendimentoa.jpg)

