
Yum Cha 飲 茶 - 中國銀河國際金融控股有限公司 › ewebeditor › uploadfile ›...
27
Yum Cha 飲 茶 April 6, 2017 INDICES Closing DoD% Hang Seng Index 24400.8 0.6 HSCEI 10365.3 0.5 Shanghai COMP 3270.3 1.5 Shenzhen COMP 2023.2 1.8 Gold 1255.7 (0.0) BDIY 1223.0 (2.5) Crude Oil, WTI(US$/BBL) 51.2 0.2 Crude Oil, BRENT(US$/BBL) 54.4 0.4 HIBOR, 3-M 0.9 (2.2) SHIBOR, 3-M 4.3 (0.7) RMB/USD 6.9 0.1 DATA RELEASES DUE THIS WEEK Apr 6 Foreign Reserves Apr 7 Foreign Direct Investment Source: Bloomberg TALKING POINT - XI-TRUMP SUMMIT: STOCK IMPLICATIONS President Xi of China and President Trump of the US will have their first meeting on April 6-7. They will discuss a wide range of topics, but for stock implications, investors may want to focus on the following three areas: (a) Trade relationship: President Trump is clearly not a wholehearted supporter of free trade. If investors believe the risk of a trade war is reduced after the meeting, trade-related stocks are likely to benefit. In particular, textile stocks like Texhong (2678.HK) and Shen- zhou (2313.HK) were largely range-bound in Q1. A lower risk of a trade war should boost their share price performance, in our view. (b) Infrastructure investment: President Trump has talked about his US$1trn plan to boost infrastructure investment in the US. If the US and China can secure closer cooperation in this area, stocks like CCC (1800.HK), CRG (0390.HK), CRCC (1186.HK) and CMEC (1829.HK) may benefit. (c) North Korea: If the US and China fail to reach a consensus for tacking the situation in North Korea, resulting in geopolitical uncertainty in the region, the share prices of military stocks such as AviChina (2357.HK) and CSSC Offshore and Marine Engineering (0317.HK) may react positively, in our view. Analyst: Wong Chi-man, CFA RESEARCH NOTES BBMG [2009.HK; HK$4.81; DOWNGRADE TO SELL] - BBMG’s share price surged 48.9% in the last two trading days because of huge expectations regarding the development of the Xiongan New Area. We believe the share price rally is an overreaction. Based on its project pipeline, we can’t see a meaningful earnings contribution from Hebei for its property develop- ment projects in the next two to three years. As for the cement business, the initial coverage area of the Xiongan New Area is just 100km 2 or about 10% the size of Hong Kong. Unless we see more detailed urban planning for the region nearby, it is also unrealistic to see a huge jump in cement demand in the near term. After the rally, the valuation of BBMG looks unappealing as a cement stock and a property stock compared with its peers. We maintain our sum-of-the-parts target price of HK$3.77 (14.3x 2017E PER and 0.77x PBR), but downgrade our rating from BUY to SELL on the back of 21.6% downside. CHINA HEALTHCARE 2016 RESULTS ROUND-UP - Looking at new policies announced in Q1 2017 (in January, the “two-invoice-system”, in February the 2017 version of the National Reim- bursement Drug List (NRDL), and in March, the accelerating imported drug registration manage- ment policy and Fujian’s medical insurance payment policy), our stock-pick strategy in the sector report dated Jan 6, 2017 was proved to be right, with large-cap drug manufacturers and distribu- tors outperforming year to date (YTD) (Figure 2) vs. the market (Hang Sang Index, +10.9% YTD). With share prices outperforming after the 2016 annual results releases and the expected national medical insurance payment policy around the corner, we review our stock recommen- dations for the rest of 2017. Our view of big cap manufacturers and distributors outperforming remains unchanged, as they should continue to benefit from 1) the new NRDL, and 2) the two- invoice-system, respectively. SNIPPETS CHINA UNICOM [0762.HK; HK$10.86; NOT RATED] - China United Network Communications (600050.CH), the parent company of China Unicom announced that it is contemplating, devel- oping and making progress on significant matters relating to mixed-ownership reform. The final outcome may lead to a change in the shareholding structure of China United Network Commu- nications. According to press reports, the strategic shareholders may include Baidu, Alibaba and Tencent (0700.HK). The concern is whether the future cooperation will remain only at the parent company level. If so, the benefit to China Unicom, the Hong Kong platform, may be small.
Transcript of Yum Cha 飲 茶 - 中國銀河國際金融控股有限公司 › ewebeditor › uploadfile ›...
1
Yum Cha 飲 茶 April 6, 2017
INDICES Closing DoD%
Hang Seng Index 24400.8 0.6
HSCEI 10365.3 0.5
Shanghai COMP 3270.3 1.5
Shenzhen COMP 2023.2 1.8
Gold 1255.7 (0.0)
BDIY 1223.0 (2.5)
Crude Oil, WTI(US$/BBL) 51.2 0.2
Crude Oil, BRENT(US$/BBL) 54.4 0.4
HIBOR, 3-M 0.9 (2.2)
SHIBOR, 3-M 4.3 (0.7)
RMB/USD 6.9 0.1
DATA RELEASES DUE THIS WEEK
Apr 6 Foreign Reserves
Apr 7 Foreign Direct Investment
Source: Bloomberg
TALKING POINT - XI-TRUMP SUMMIT: STOCK IMPLICATIONS
President Xi of China and President Trump of the US will have their first meeting on April 6-7.
They will discuss a wide range of topics, but for stock implications, investors may want to focus
on the following three areas:
(a) Trade relationship: President Trump is clearly not a wholehearted supporter of free trade.
If investors believe the risk of a trade war is reduced after the meeting, trade-related
stocks are likely to benefit. In particular, textile stocks like Texhong (2678.HK) and Shen-
zhou (2313.HK) were largely range-bound in Q1. A lower risk of a trade war should boost
their share price performance, in our view.
(b) Infrastructure investment: President Trump has talked about his US$1trn plan to boost
infrastructure investment in the US. If the US and China can secure closer cooperation in
this area, stocks like CCC (1800.HK), CRG (0390.HK), CRCC (1186.HK) and CMEC
(1829.HK) may benefit.
(c) North Korea: If the US and China fail to reach a consensus for tacking the situation in
North Korea, resulting in geopolitical uncertainty in the region, the share prices of military
stocks such as AviChina (2357.HK) and CSSC Offshore and Marine Engineering
(0317.HK) may react positively, in our view.
Analyst: Wong Chi-man, CFA
RESEARCH NOTES
BBMG [2009.HK; HK$4.81; DOWNGRADE TO SELL] - BBMG’s share price surged 48.9% in
the last two trading days because of huge expectations regarding the development of the
Xiongan New Area. We believe the share price rally is an overreaction. Based on its project
pipeline, we can’t see a meaningful earnings contribution from Hebei for its property develop-
ment projects in the next two to three years. As for the cement business, the initial coverage
area of the Xiongan New Area is just 100km2 or about 10% the size of Hong Kong. Unless we
see more detailed urban planning for the region nearby, it is also unrealistic to see a huge jump
in cement demand in the near term. After the rally, the valuation of BBMG looks unappealing as
a cement stock and a property stock compared with its peers. We maintain our sum-of-the-parts
target price of HK$3.77 (14.3x 2017E PER and 0.77x PBR), but downgrade our rating from BUY
to SELL on the back of 21.6% downside.
CHINA HEALTHCARE 2016 RESULTS ROUND-UP - Looking at new policies announced in Q1
2017 (in January, the “two-invoice-system”, in February the 2017 version of the National Reim-
bursement Drug List (NRDL), and in March, the accelerating imported drug registration manage-
ment policy and Fujian’s medical insurance payment policy), our stock-pick strategy in the sector
report dated Jan 6, 2017 was proved to be right, with large-cap drug manufacturers and distribu-
tors outperforming year to date (YTD) (Figure 2) vs. the market (Hang Sang Index, +10.9%
YTD). With share prices outperforming after the 2016 annual results releases and the expected
national medical insurance payment policy around the corner, we review our stock recommen-
dations for the rest of 2017. Our view of big cap manufacturers and distributors outperforming
remains unchanged, as they should continue to benefit from 1) the new NRDL, and 2) the two-
invoice-system, respectively.
SNIPPETS
CHINA UNICOM [0762.HK; HK$10.86; NOT RATED] - China United Network Communications
(600050.CH), the parent company of China Unicom announced that it is contemplating, devel-
oping and making progress on significant matters relating to mixed-ownership reform. The final
outcome may lead to a change in the shareholding structure of China United Network Commu-
nications. According to press reports, the strategic shareholders may include Baidu, Alibaba and
Tencent (0700.HK). The concern is whether the future cooperation will remain only at the parent
company level. If so, the benefit to China Unicom, the Hong Kong platform, may be small.

2
BBMG Corporation [2009.HK]
BBMG’s share price surged 48.9% in the last two trading days because of huge expecta-
tions regarding the development of the Xiongan New Area. We believe the share price
rally is an overreaction. Based on its project pipeline, we can’t see a meaningful earnings
contribution from Hebei for its property development projects in the next two to three
years. As for the cement business, the initial coverage area of the Xiongan New Area is
just 100km2 or about 10% the size of Hong Kong. Unless we see more detailed urban
planning for the region nearby, it is also unrealistic to see a huge jump in cement de-
mand in the near term. After the rally, the valuation of BBMG looks unappealing as a
cement stock and a property stock compared with its peers. We maintain our sum-of-the-
parts target price of HK$3.77 (14.3x 2017E PER and 0.77x PBR), but downgrade our
rating from BUY to SELL on the back of 21.6% downside.
Investment Highlights
Only one property development project in Hebei in the project pipeline.
BBMG’s short-term commercial paper prospectus issued in March 2017 provided the Company’s property development project pipeline as of end-September 2016 (Figure 1). For projects under construction and projects under planning, we only see one project in Tangshan, Hebei, with a planned investment of RMB2.4bn, or 5% of total planned investment for all projects under construction. We understand that some investors expect the development of the Xiongan New Area to benefit its in-dustrial land bank reserve in Hebei, which may be converted to residential and com-mercial development in the future. However, it may be a bit remote and it is unlikely to contribute to the earnings in the next two to three years if those “imagined” pro-jects are not in the pipeline at the moment. In addition, it is uncertain whether the authorities will ask for a much higher land premium for conversion.
Too optimistic to expect a huge jump in cement demand. In the next 6-12
months, we believe the authorities will focus on the relocation of residents before starting any construction work in the Xiongan New Area. Therefore, a sudden jump in cement demand is unlikely this year. In fact, Jidong Cement (000401.CH) issued a statement that it does not expect the Xiongan New Area development to have a sig-nificant impact on its results in the near term. Meanwhile, total fixed asset invest-ment in the Beijing-Tianjin-Hebei region was RMB5.2trn in 2016. Unless the invest-ment in the Xiongan New Area (about 10% the size of Hong Kong) is exceptionally big, expecting a large increase in cement demand is too optimistic, in our view.
No valuation advantage compared with other cement and property stocks. We
compare BBMG with other China property plays, as about 70%-80% of its net profit is contributed from property development and property investment (Figure 2). We can’t see any valuation advantage based on PER, PBR and dividend yield. As a cement stock, it also doesn’t look cheap compared with its major peers (Figure 3).
SELL (downgrade from BUY)
Close: HK$4.81 (Apr 5, 2017)
Target Price: HK$3.77 (-21.6%)
Price Performance
Market Cap US$7,651m
Shares Outstanding 10,677.7m
Auditor Ernst & Young
Free Float 48.26%
52W range HK$2.18-5.25
3M average daily T/O US$16.9m
Major Shareholder BBMG Group (44.93%)
Sources: Company, Bloomberg
Wong Chi Man—Head of Research
(852) 3698-6317
Livy Lyu—Research Assistant
(852) 3698 6393
Sources: Company, CGIS Research
China Cement Sector
Excessive Valuation as a Cement and Property Stock; Downgrade to SELL
April 6, 2017
Y/E Dec 31 2014 2015 2016 2017E 2018E
Turnover (RMB m) 39,452 38,747 46,168 57,564 62,679
Recurring net profit (RMB m) 1,942 1,873 2,319 2,577 3,341
Net margin (%) 4.9 4.8 5.0 4.5 5.3
Recurring EPS (RMB) 0.20 0.18 0.22 0.24 0.31
% Change (41) (14) 24 11 30
PER (x) 18.7 22.7 19.3 18.2 14.5
PBR (x) 1.30 1.11 1.01 0.99 0.98
Source: Bloomberg
0
1000
2000
3000
4000
0
1
2
3
4
5
6
Apr-16 Jun-16 Aug-16 Oct-16 Dec-16 Jan-17 Mar-17
(HK$ million)(HK$)
Turnover (RHS) Price (LHS)

3
Figure 1: BBMG’s property project pipeline
Sources: Company, CGIS Research
District Project Chinese name Planned total investment (RMB bn)
Projects under construction (commodity housing)
1 Beijing Xijiao Gravel Plant (west land site) 西郊砂石厂西地块 2.80
2 Beijing Changyang commodity housing 长阳商品房 1.54
3 Beijing Jinyu Feili (Phase 3) 金隅翡丽(三期) 0.91
4 Beijing Jinyu Lanwan 金隅澜湾 1.15
5 Chengdu, Sichuan Chengdu Longxijun 武侯珑熙郡 0.97
6 Hangzhou, Jiangsu Hangzhou Guanlan Times 观澜时代(2-D) 0.74
7 Hangzhou, Jiangsu Qianjiang New City 钱江学府 2.31
8 Hefei, Anhui Hefei Forklift Factory 蜀山原叉车厂地块 10.09
9 Maanshan, Anhui Ma’anshan Huashan Jiashan 佳山墅 0.99
10 Nanjing, Jiangsu Nanjing Jinyu Zijingfu 金隅紫京府 4.36
11 Huhhot, Inner Mongolia World Financial Centre 环球金融中心 1.54
12 Qingdao, Shandong Qingdao Zhenjiang Road 镇江路地块 3.40
13 Shanghai Shanghai Juyuan 嘉定菊园 5.19
14 Tangshan, Hebei Jinyu Lefu 金隅乐府 2.42
15 Tianjin Tianjin Yuecheng 金隅悦城 5.49
16 Tianjin Tianjin Mantang 金隅满堂 2.28
Projects under construction (affordable housing)
17 Beijing Changxindian housing with a price cap 张郭庄保障房 1.49
18 Beijing Nankou housing with a price cap 南口采石场地块 0.68
Projects under planning (commodity housing)
19 Hangzhou, Jiangsu Sanbao 三堡 10.97
20 Nanjing, Jiangsu Jinyu Nainiuchang 金隅奶牛场 6.17
21 Ningbo, Zhejiang Ningbo Yao River 姚江船闸 0.79
22 Chongqing Chongqing Xinduhui 新都会 17.81
Projects under planning (affordable housing)
23 Beijing Kanghuiyuan 康惠园 0.77
24 Beijing Houshayu 后沙峪 2.83
25 Beijing Xisanqi Technology Park 西三旗科技园公租房及小学幼儿园 1.38

4
Figure 2: Valuation of China property stocks
Sources: Bloomberg, CGIS Research
Company namePrice
(HK$)
Market cap
(HK$m)PER (x)
2017E PER
(x)
2018E PER
(x)PBR (x)
2016
Dividend
yield (%)
2017E ROE
(%)
754 HK Equity Hopson Development Holdings Ltd 7.54 16,781 4.34 21.54 19.84 0.31 1.33 n.a.
123 HK Equity Yuexiu Property Co Ltd 1.33 16,494 9.51 9.30 7.98 0.48 4.89 5.78
119 HK Equity Poly Property Group Co Ltd 3.26 11,937 147.87 32.93 18.95 0.48 n.a. 2.34
1238 HK Equity Powerlong Real Estate Holdings Ltd 3.05 12,192 4.10 4.51 3.91 0.51 5.25 12.30
410 HK Equity SOHO China Ltd 4.19 21,786 21.26 47.69 38.74 0.56 14.56 1.63
3377 HK Equity Sino-Ocean Group Holding Ltd 3.75 28,177 6.55 6.86 6.00 0.57 5.31 9.06
3900 HK Equity Greentown China Holdings Ltd 7.54 16,311 7.55 7.70 6.62 0.59 1.80 6.75
2868 HK Equity Beijing Capital Land Ltd 3.7 11,203 4.91 5.87 4.21 0.60 6.10 22.84
1777 HK Equity Fantasia Holdings Group Co Ltd 1.28 7,375 8.12 7.33 5.83 0.60 3.91 9.55
1813 HK Equity KWG Property Holding Ltd 5.68 17,346 4.40 4.45 4.04 0.62 7.94 13.70
1528 HK Equity Red Star Macalline Group Corp Ltd 8.76 31,746 6.97 8.56 8.84 0.65 6.33 7.40
3383 HK Equity Agile Group Holdings Ltd 6.8 26,636 10.27 6.72 5.91 0.67 2.94 9.64
813 HK Equity Shimao Property Holdings Ltd 12.54 42,473 7.40 5.66 4.95 0.74 5.58 12.53
337 HK Equity Greenland Hong Kong Holdings Ltd 2.31 6,453 7.55 3.83 3.80 0.81 4.33 n.a.
2777 HK Equity Guangzhou R&F Properties Co Ltd 12.44 40,086 5.25 4.90 4.37 0.81 9.15 16.41
604 HK Equity Shenzhen Investment Ltd 3.5 26,772 8.26 8.03 6.93 0.82 4.86 10.85
817 HK Equity China Jinmao Holdings Group Ltd 2.52 26,893 9.42 7.77 6.58 0.82 3.57 11.34
81 HK Equity China Overseas Grand Oceans Group Ltd 4.2 9,585 10.65 6.12 5.07 0.92 0.48 14.01
2009 HK Equity BBMG Corp 4.81 59,441 19.26 18.24 14.50 1.01 1.26 5.70
960 HK Equity Longfor Properties Co Ltd 12.84 75,042 7.24 7.13 6.23 1.08 4.09 15.05
688 HK Equity China Overseas Land & Investment Ltd 22.45 245,967 6.15 6.96 6.18 1.11 3.43 14.93
1628 HK Equity Yuzhou Properties Co Ltd 3.26 12,441 6.22 4.60 3.82 1.14 6.75 18.79
884 HK Equity CIFI Holdings Group Co Ltd 2.93 19,763 6.21 4.90 4.15 1.17 5.79 21.22
1109 HK Equity China Resources Land Ltd 21.6 149,708 7.68 7.79 6.75 1.29 3.26 15.94
1918 HK Equity Sunac China Holdings Ltd 10.68 41,397 13.53 13.64 7.86 1.35 2.71 15.27
2202 HK Equity China Vanke Co Ltd 21.5 253,716 10.04 8.37 7.26 1.86 4.15 21.26
2007 HK Equity Country Garden Holdings Co Ltd 7.07 150,972 12.02 9.64 7.93 1.93 2.77 20.31
3333 HK Equity China Evergrande Group 7.65 104,835 18.24 9.62 6.75 2.10 n.a. 18.39
Average 13.96 10.38 8.36 0.91 4.71 12.81
Figure 3: Valuation of China cement stocks
Net debt/equity (%)
Company Ticker Rating Price (HK$) Market cap (US$m) 2016 2017E 2018E 2016 2017E 2018E 2016 2017E 2018E 2017E
Anhui Conch 914 HK Equity HOLD 28.10 16,997 15.4 11.2 11.5 1.70 1.59 1.49 8.3 6.3 6.2 (5)
CNBM 3323 HK Equity HOLD 5.48 3,793 27.7 8.5 8.7 0.61 0.60 0.59 10.7 8.4 8.3 212
BBMG 2009 HK Equity SELL 4.81 7,621 19.3 18.2 14.5 1.01 0.99 0.98 16.7 12.0 10.5 72
CR Cement 1313 HK Equity BUY 4.52 3,786 15.7 8.6 8.9 1.14 1.04 0.97 9.1 6.4 6.6 48
Simple average 19.5 11.6 10.9 1.11 1.06 1.01 11.2 8.3 7.9 82
Weighted average 17.8 12.2 11.6 1.34 1.27 1.20 10.7 7.9 7.5 45
PER (x) PBR (x) EV/EBITDA(x)
2015 -2017E PEG(x)
Company Ticker 2017E 2018E CAGR (%) 2017E 2016 2017E 2018E 2016 2017E 2018E
Anhui Conch 914 HK Equity 45.0 0.2 20.5 0.5 11.48 15.04 13.56 2.0 2.7 2.6
CNBM 3323 HK Equity 242.3 1.0 86.0 0.1 2.22 7.35 6.98 0.9 2.4 2.3
CR Cement 1313 HK Equity 82.6 (2.8) 33.2 0.5 7.14 12.64 11.33 2.0 3.3 3.2
BBMG 2009 HK Equity 11.1 29.7 20.0 0.4 5.64 5.69 6.98 1.3 0.9 1.1
Simple average 95.3 7.0 39.9 0.4 6.62 10.18 9.71 1.6 2.3 2.3
Weighted average 64.7 6.9 29.6 0.5 8.50 11.64 10.96 1.7 2.3 2.3
EPS Growth (%) ROE (%) Dividend yield (%)
Sources: Bloomberg, CGIS Research

5
Key financials
Figure 5: Sum-of-the-parts valuation
Sources: CGIS Research
Figure 4: Market cement prices in north China (RMB/tonne)
Sources: Digital Cement, CGIS Research
BBMG (02009.HK)
Income Statement
(RMB'000, except for per share amount)
Year ended 31 Dec 2013 2014 2015 2016 2017E 2018E
Revenue 43,203,573 39,452,065 38,746,899 46,167,928 57,563,813 62,679,135
COGS (34,799,884) (31,272,820) (30,526,041) (36,542,047) (45,124,210) (48,357,112)
Gross profit 8,403,690 8,179,244 8,220,858 9,625,881 12,439,603 14,322,022
Operating expenses (4,377,555) (4,408,173) (4,519,969) (5,662,098) (7,287,794) (7,976,052)
Operating profit 4,026,135 3,771,071 3,700,889 3,963,783 5,151,809 6,345,970
Other income and expenses 662,209 711,639 668,260 716,618 632,779 576,867
EBIT 4,688,344 4,482,710 4,369,150 4,680,401 5,784,588 6,922,837
Net f inance costs (1,017,497) (1,209,437) (1,335,546) (1,603,501) (2,194,266) (2,278,566)
Profits from JCEs and associates (34,334) (28,450) (17,694) 108,900 200,000 240,000
Non-recurrent items 357,240 558,522 166,745 490,732 - -
Income before tax 3,993,753 3,803,345 3,182,654 3,676,532 3,790,322 4,884,271
Income tax expense (750,566) (1,094,373) (1,231,587) (986,183) (1,092,185) (1,374,757)
Minority interests (27,974) (286,250) 66,386 (3,693) (121,416) (168,457)
Net income 3,215,213 2,422,722 2,017,453 2,686,656 2,576,721 3,341,058
Recurring net income 2,953,706 1,941,667 1,873,061 2,318,607 2,576,721 3,341,058
EPS (RMB) 0.375 0.253 0.189 0.252 0.241 0.313
Recurring EPS (RMB) 0.345 0.203 0.175 0.217 0.241 0.313
DPS (HK$) 0.049 0.032 0.018 0.053 0.040 0.050
Depreciation and amortization 1,100,637 1,213,646 1,346,751 1,883,873 3,370,869 3,545,703
EBITDA 5,788,981 5,696,356 5,715,901 6,564,274 9,155,457 10,468,540
Cement and clinker ASP (RMB/tonne) 234 214 178 193 220 218
Cement and clinker vol. ('000 tonnes) 38,900 40,550 39,260 55,214 107,525 109,480
Cement and clinker gross profit (RMB/tonne) 42 33 18 43 61 60
Booked GFA ('000 sq.m) 1,177 1,497 1,263 1,156 900 1,150
Revenue Breakdown:#
Cement 13,122,000 12,722,000 10,828,700 15,365,000 28,848,582 29,267,445
Modern building materials 14,644,500 10,523,000 10,371,700 11,121,400 11,581,143 12,088,953
Property investment 1,945,000 2,192,400 2,692,400 3,260,300 3,602,157 3,921,638
Property development 14,953,000 15,536,600 16,921,400 18,448,500 15,312,255 20,700,000
Growth Rates:
Revenue 33% -9% -2% 19% 25% 9%
EBIT 21% -4% -3% 7% 24% 20%
EBITDA 19% -2% 0% 15% 39% 14%
Core net income 38% -34% -4% 24% 11% 30%
Recurring EPS 38% -41% -14% 24% 11% 30%
Margins and Ratios:
Gross margin 19.5% 20.7% 21.2% 20.8% 21.6% 22.8%
Net margin 6.9% 5.6% 4.7% 5.0% 4.7% 5.6%
EBIT margin 9.3% 9.6% 9.6% 8.6% 8.9% 10.1%
EBITDA margin 13.4% 14.4% 14.8% 14.2% 15.9% 16.7%
Effective tax rate 19% 29% 39% 27% 29% 28%
# Business tax included for f igures since 2012 due to change in disclosure format.
Sources: Company data, CGIS Research estimates
RMB m Note
Cement and other building materials 30,472 0.9x PBR
Investment properties 18,617 35% valuation discount; 7% cap rate
Property development 34,889 35% valuation discount
JV and associates 2,434
Net debt (32,000)
Minority interests (18,761)
Equity value 35,651
Price Target (HK$) 3.77 200
250
300
350
Jan Feb Mar Apr May Jun Jul Aug Sep Oct Nov Dec
North China
2013 2014 2015 2016 2017

6
Key financials
Figure 6: PER band of BBMG
Source: CGIS Research Source: CGIS Research
Figure 7: PBR range of BBMG
BBMG (02009.HK)
Balance Sheet Statement of Cash Flow
(RMB'000 , except for per share amount)
As at 31 Dec 2013 2014 2015 2016 2017E 2018E Year ended 31 Dec 2013 2014 2015 2016E 2017E 2018E
Inventories 37,602,014 48,853,159 54,007,187 64,111,235 70,000,000 77,000,000 Profit before tax 3,993,753 3,803,345 3,182,654 3,676,532 3,790,322 4,884,271
Trade receivables 5,337,443 5,785,423 7,387,536 11,140,789 12,000,000 13,000,000 Depreciation & Amortization 1,169,655 1,278,819 1,346,751 1,883,873 3,370,869 3,545,703
Bills receivable 1,373,660 2,651,028 2,197,924 3,857,029 4,000,000 4,100,000 Change in w orking capital (3,791,176) (7,521,294) (8,477,792) (7,036,273) (6,151,696) (7,200,000)
Others 7,248,598 6,749,024 7,373,104 12,359,459 12,366,302 12,401,302 Others / adjustments (1,932,069) (1,188,687) (797,317) 4,979,617 1,978,043 694,935
Bank balances and cash 8,595,510 10,980,172 18,369,881 28,010,211 26,995,821 26,919,571 Net operating cash f low (559,837) (3,627,817) (4,745,703) 3,503,749 2,987,539 1,924,909
Total current assets 60,157,225 75,018,806 89,335,633 119,478,723 125,362,123 133,420,873
Capex (3,437,698) (3,473,151) (680,623) (2,410,059) (3,500,000) (3,500,000)
PPE, net 18,633,539 18,856,086 19,390,359 49,736,905 48,970,674 48,724,971 Others (280,583) (127,391) 1,169,447 (1,614,942) - -
Prepaid lease payments - - - - - - Net investing cash f low (3,718,281) (3,600,542) 488,824 (4,025,001) (3,500,000) (3,500,000)
Others 20,048,785 21,810,079 22,020,713 39,181,481 39,863,452 40,473,411
Total non-current assets 38,682,323 40,666,165 41,411,072 88,918,386 88,834,126 89,198,382 Change in debt 4,253,226 (1,970,954) 5,279,212 26,568,130 (115,420) 2,000,000
Dividends (334,131) (239,232) (160,167) (491,177) (386,508) (501,159)
Total assets 98,839,549 115,684,971 130,746,704 208,397,109 214,196,249 222,619,255 Others 2,668,521 26,534,848 3,431,827 (18,703,926) - -
Net f inancing cash f low 6,587,616 24,324,662 8,550,872 7,373,027 (501,928) 1,498,841
Trade payables 9,022,805 9,534,764 9,062,191 14,624,964 15,500,000 16,500,000
Other payables 3,154,941 3,696,216 3,626,299 7,179,818 7,200,000 7,300,000 Increase / Decrease in cash 2,689,412 2,384,661 7,389,709 9,640,330 (1,014,390) (76,250)
Bank and other borrow ings 13,516,500 11,635,636 16,805,996 32,027,734 35,000,000 38,000,000 Net cash/(debt) (21,106,510) (23,104,876) (23,324,716) (46,384,605) (47,283,575) (49,359,825)
Others 26,365,726 34,647,039 35,692,087 41,131,670 43,839,383 46,039,383
Total current liabilities 52,059,971 59,513,656 65,186,574 94,964,186 101,539,383 107,839,383 Finance Ratios
Bank and other borrow ings 6,879,920 6,779,500 6,888,600 18,087,686 15,000,000 14,000,000 2013 2014 2015 2016 2017E 2018E
Others 9,874,344 13,144,427 16,489,656 32,435,727 32,435,727 32,435,727 Valuation
Total non-current liabilities 16,754,264 19,923,927 23,378,256 50,523,413 47,435,727 46,435,727 PE(x) 11.1 18.7 22.7 19.3 18.2 14.5
EPS grow th (%) 38 41- 14- 24 11 30
Total liabilities 68,814,236 79,437,583 88,564,830 145,487,599 148,975,110 154,275,110 Yield (%) 1.3 0.8 0.5 1.3 0.9 1.1
PEG (x) 0.29 -0.45 -1.67 0.81 1.64 0.49
Shareholders' equity 26,280,140 31,107,268 38,082,973 44,200,488 46,390,701 49,345,250 EV/EBITDA (x) 19.0 19.3 19.2 16.7 12.0 10.5
Minority interests 3,745,173 5,140,120 4,098,901 18,709,022 18,830,438 18,998,895 PB(x) 1.55 1.30 1.11 1.01 0.99 0.98
Operational
Revenue grow th (%) 33 9- 2- 19 25 9
Gross margin (%) 19.5 20.7 21.2 20.8 21.6 22.8
Net profit margin (%) 6.9 5.6 4.7 5.0 4.7 5.6
Days receivables 41 51 62 73 73 73
Days payables 84 108 111 118 122 121
Days inventories 367 505 615 590 542 555
Current ratio (x) 1.2 1.3 1.4 1.3 1.2 1.2
Quick ratio (x) 0.3 0.3 0.4 0.5 0.4 0.4
Asset/Equity (x) 3.3 3.2 3.1 3.3 3.3 3.3
Net debt/equity (%) 70 64 55 74 72 72
EBITDA interest coverage (x) 5.7 4.7 4.3 4.1 4.2 4.6
Core ROE (%) 12.0 6.8 5.4 5.6 5.7 7.0
Sources: Company data, CGIS Research estimates
0
2
4
6
8
10
12
14
Sep
-09
Jan-1
0
May
-10
Sep
-10
Jan-1
1
May
-11
Sep
-11
Jan-1
2
May
-12
Sep
-12
Jan-1
3
May
-13
Sep
-13
Jan-1
4
May
-14
Sep
-14
Jan-1
5
May
-15
Sep
-15
Jan-1
6
May
-16
Sep
-16
Jan-1
7
HKD3-Year Average Rolling Forward PER =12.5X
21x
17x
13x
9x
5x0.4
0.6
0.8
1.0
1.2
1.4
1.6
09/2
009
01/2
010
05/2
010
09/2
010
01/2
011
05/2
011
09/2
011
01/2
012
05/2
012
09/2
012
01/2
013
05/2
013
09/2
013
01/2
014
05/2
014
09/2
014
01/2
015
05/2
015
09/2
015
01/2
016
05/2
016
09/2
016
01/2
017
P/B trend (x) 1 Standard deviation
-1 Standard deviation Average

7
China Healthcare 2016 Results Round-up April 6, 2017
Looking at new policies announced in Q1 2017 (in January, the “two-invoice-system”, in February the 2017 version of the National Reimbursement Drug List (NRDL), and in March, the accelerating imported drug registration management policy and Fujian’s medical insurance payment policy), our stock-pick strategy in the sector report dated Jan 6, 2017 was proved to be right, with large-cap drug manufacturers and distributors outperforming year to date (YTD) (Figure 2) vs. the market (Hang Sang Index, +10.9% YTD). With share prices outperforming, the 2016 annual results releases and the expected national medical insurance payment policy around the corner, we review our stock recommendations for the rest of 2017. Our view of big cap manufacturers and distributors outperforming remains unchanged, as they should continue to benefit from 1) the new NRDL, and 2) the two-invoice-system, respectively.
1. Healthcare sector 2016 results review
Top-down review:
Big manufacturers outperform: Among drug manufacturers, big caps significantly
outperformed small-to-medium caps, which is consistent with our stock pick logic in our sector report dated Jan 6, 2017. We think the outperformance of this sub-sector was mainly due to 1) its relatively attractive valuation, as last year this sub-sector underperformed; 2) NRDL news released in February; 3) solid 2016 annual results (see Figure 1 for a summary of our coverage except for TUL [3933.hk], with exposure to 6-APA), as the industry gradually bottomed out from 2H15; and 4)
stringent regulatory polices (e.g. generics consistency (仿製藥一致性評價) and
medical insurance payment reform) should benefit the leading drug manufacturers with a strong product portfolio and strong R&D pipeline.
Leading distributors stand out: This is mainly due to the implementation of the two-
invoice-system (兩票制). Our stock pick logic in the sector report that big distributors
would outperform as the two-invoice-system would trigger consolidation remains unchanged for 2017.
Gloomy performance of hospitals: Again, we reiterate that this sub-sector was hit by
three overhangs from public hospital reform: 1) the drug percentage will be reduced to 30% of revenue; 2) the zero price mark-up for drugs (except for traditional Chinese medicine) will change hospitals’ revenue structure and change drug sales from a profit centre to a cost centre for hospitals; and 3) limiting hospital drugs sales growth to 10% YoY and medical insurance payment reform will put pressure on hospitals to control drug sales carefully. Going forward, we think it will still take ~two more years for hospitals to complete the reforms (revenue structure change, hierarchical medical system, increasing the price of medical services and compensation for doctors and hospital heads, etc.) and deliver sustainable healthy growth.
China Healthcare Sector
Harry He—Healthcare analyst
(852) 3698-6320
Wong Chi Man, CFA—Head of Research
(852) 3698-6317
Figure 1: Our coverage summary (data as of April 05, 2017)
Source: CGIS research estimate
Company Ticker 2016 2017E 2018E 2016 2017E 2018E 2016 2017E 2018E 2016 2017E 2018E
Luye Pharm 2186 BUY - 4.80 5.78 20.4% 16.5 13.5 11.9 1.6 1.5 1.4 14.4 15.3 14.9 13.7 8.5 6.9
CTCM 570 BUY - 4.42 4.82 9.0% 17.3 14.4 12.0 1.5 1.4 1.3 8.6 9.8 10.9 10.2 9.6 7.5
SSY 2005 BUY 3.14 3.41 8.6% 18.2 14.7 12.7 3.3 2.8 2.4 19.3 20.8 20.8 11.2 9.5 8.1
CSPC 1093 HOLD* - 10.22 11.10 8.6% 29.0 23.2 18.9 6.0 5.0 4.2 20.8 21.9 22.6 18.1 14.4 11.6
TUL 3933 HOLD* - 5.15 4.93 -4.3% n.a 20.4 16.3 1.4 1.3 1.2 -0.9 6.6 7.7 11.5 6.3 5.4
3SBio 1530 HOLD - 9.73 9.80 0.7% 30.5 22.4 17.6 3.2 2.8 2.4 11.6 13.9 15.3 22.2 15.2 12.0
CMS 867 HOLD - 14.46 13.62 -5.8% 22.7 19.1 16.2 5.1 4.4 3.7 22.3 22.6 22.8 19.7 16.1 13.6
* We are positive on fundamentals, HOLD on valuation
PER(x) PBR(x) ROE(%) EV/EBITDA(x)CGIS
research
rating
Rating change
since sector
report
CGIS target
price (HK$)
Close
(HK$)
TP vs.
close
(%)

8
Source: Bloomberg
Healthcare sub-sector performance
Figure 2: Healthcare sub-sector performance (data as of April 05, 2017)
Company name Ticker 2016 2017E 2018E 2016 2017E 2018E 2016 2017E 2018E 2016 2017E 2018E WTD MTD QTD YTD
China Tradition Medicine
TRAD CHI MED 570 4.42 19,587 18.2 15.0 12.7 1.4 1.4 1.3 8.0 9.7 10.6 12.0 9.8 8.4 10.5% 12.5% 23.1% 23.1%
TONG REN TANG-H 1666 14.14 18,110 25.4 22.7 20.0 3.1 2.7 2.4 15.2 13.1 13.3 n.a n.a n.a -0.7% -0.7% -1.7% -1.7%
TONGRENTANGCM 8138 10.66 8,923 20.4 18.0 15.8 4.1 3.5 3.0 21.7 21.4 19.9 13.7 12.1 10.2 -0.6% 1.7% 1.7% 1.7%
Simple average 21.3 18.6 16.2 2.9 2.5 2.2 14.9 14.7 14.6 12.9 10.9 9.3 3.1% 4.5% 7.7% 7.7%
Median 20.4 18.0 15.8 3.1 2.7 2.4 15.2 13.1 13.3 12.9 10.9 9.3 -0.6% 1.7% 1.7% 1.7%
Drugs manufacturer
CSPC PHARMACEUTI 1093 10.22 61,872 29.0 22.9 18.6 6.0 5.1 4.3 21.8 24.0 24.9 18.3 14.7 11.8 0.6% 7.6% 23.4% 23.4%
BAIYUNSHAN PH-H 874 22.95 49,744 20.9 20.4 19.0 2.2 1.7 1.6 12.3 8.9 8.9 24.0 19.1 18.3 -0.6% 11.7% 14.5% 14.5%
SINO BIOPHARM 1177 6.46 47,883 23.7 22.2 19.3 4.7 4.0 3.4 22.8 21.1 20.0 13.9 12.6 10.9 -2.6% -3.6% 18.3% 18.3%
LIVZON PHARM-H 1513 45.95 25,024 21.6 18.5 15.4 2.9 2.6 2.2 14.2 14.1 14.3 16.0 12.8 10.9 3.3% -2.3% 1.2% 1.2%
3SBIO INC 1530 9.73 24,639 29.0 23.7 18.5 3.5 3.0 2.6 11.9 13.2 15.0 21.5 17.0 13.4 -0.7% 3.0% 28.9% 28.9%
SIHUAN PHARM 460 3.18 30,147 17.6 14.3 13.3 2.4 2.3 2.1 13.6 15.3 14.9 11.9 9.3 8.1 15.2% 20.0% 47.2% 47.2%
LUYE PHARMA GROU 2186 4.80 15,941 16.0 13.4 11.7 2.2 1.9 1.7 14.0 15.0 15.0 12.6 10.2 8.5 -0.2% -5.5% 4.3% 4.3%
SSY GROUP LTD 2005 3.14 8,917 18.5 15.1 13.1 3.4 2.9 2.5 18.3 19.6 19.9 n.a n.a n.a 9.0% 28.7% 27.1% 27.1%
THE UNITED LABOR 3933 5.15 8,378 103.0 20.3 16.6 1.3 1.3 1.2 1.4 6.0 6.8 8.8 5.7 4.8 1.6% 3.0% -2.5% -2.5%
CK LIFE SCIENCES 775 0.65 6,247 n.a n.a n.a n.a n.a n.a n.a n.a n.a n.a n.a n.a -9.7% -8.5% -5.8% -5.8%
SHANGHAI FUDAN-H 1349 6.39 5,898 33.4 27.7 21.0 6.2 5.2 4.2 19.4 22.5 26.3 23.0 18.5 12.6 6.9% 6.9% -1.4% -1.4%
SHANDONG XINHU-H 719 7.01 5,926 22.2 20.1 n.a 1.4 1.2 n.a 6.3 6.5 n.a n.a n.a n.a 8.9% 17.8% 33.8% 33.8%
LEE'S PHARM 950 7.48 4,414 17.8 16.4 14.8 2.6 2.3 2.0 16.7 17.6 19.5 n.a n.a n.a 9.7% 16.0% 19.1% 19.1%
CONSUN PHARMACEU 1681 4.95 4,823 14.6 10.2 8.2 n.a 2.0 1.6 18.3 22.9 24.3 n.a 6.2 4.8 13.3% 14.6% 28.2% 28.2%
DAWNRAYS PHARMAC 2348 4.68 3,749 10.5 8.8 7.5 2.0 1.8 1.5 n.a n.a n.a 5.9 4.4 3.5 -0.4% 5.4% 0.4% 0.4%
Simple average 27.0 18.1 15.1 3.1 2.7 2.4 14.7 15.9 17.5 15.6 11.9 9.8 3.6% 7.6% 15.8% 15.8%
Median 21.3 19.3 15.4 2.6 2.3 2.1 14.2 15.3 17.2 14.9 12.6 10.9 1.6% 6.9% 18.3% 18.3%
Distributor
SINOPHARM-H 1099 36.25 100,307 19.1 16.9 14.7 2.6 2.4 2.1 14.1 14.5 14.0 9.7 8.6 7.5 -3.1% 1.0% 13.5% 13.5%
SHANGHAI PHARM-H 2607 20.95 66,069 15.4 14.1 12.6 1.6 1.5 1.4 10.2 10.5 10.9 11.8 11.1 10.3 1.2% 4.7% 17.8% 17.8%
CHINA MEDICAL SY 867 14.46 35,966 24.1 19.2 16.4 4.9 4.0 3.5 22.4 23.9 23.6 21.0 15.8 13.3 9.9% 14.4% 17.8% 17.8%
FOSUN PHARMA-H 2196 28.95 75,095 21.6 19.1 16.6 2.8 2.5 2.3 13.9 13.8 14.8 29.7 25.9 21.5 3.4% 8.4% 21.9% 21.9%
CHINA RESOURCES 3320 9.18 57,692 19.1 16.9 14.6 1.3 1.3 1.2 8.9 8.1 8.5 7.8 7.5 6.5 6.1% 9.2% 4.9% 4.9%
YESTAR HEALTHCAR 2393 4.10 8,918 29.6 24.3 19.2 8.0 6.7 5.5 26.4 26.6 27.9 13.7 11.1 10.1 1.2% 7.0% 9.0% 9.0%
PIONEER PHARM 1345 3.19 4,253 18.9 13.5 11.3 n.a n.a n.a n.a 25.4 26.8 n.a n.a n.a 10.4% 19.0% 13.9% 13.9%
Simple average 19.9 17.2 15.0 2.6 2.3 2.1 13.9 14.2 14.4 16.0 13.8 11.8 3.5% 7.5% 15.2% 15.2%
Median 19.1 16.9 14.7 2.7 2.4 2.2 14.0 14.5 14.8 12.7 11.1 10.2 3.4% 8.4% 13.9% 13.9%
Device manufacturers
SHANDONG WEIG-H 1066 5.74 25,694 18.0 16.2 14.4 1.9 1.8 1.6 9.8 12.5 11.7 13.7 9.8 8.4 19.8% 22.9% 10.8% 10.8%
SHANGHAI HAOHA-H 6826 36.55 5,850 17.2 14.0 11.8 1.8 1.7 1.5 10.7 12.3 13.0 9.3 7.2 5.7 0.0% -1.3% -3.6% -3.6%
BLOOMAGE BIOTE 963 11.32 4,111 16.9 13.0 10.7 2.6 2.1 1.7 17.7 17.4 17.4 8.9 7.4 5.4 -0.2% 0.4% -3.1% -3.1%
MICROPORT SCIENT 853 5.45 7,848 54.0 24.2 17.1 3.1 3.3 3.0 5.3 12.1 13.4 14.1 10.4 8.4 -5.7% -6.0% -6.7% -6.7%
LIFETECH SCI 1302 2.06 8,902 79.5 65.3 35.2 16.6 7.0 5.7 36.0 16.3 19.1 67.7 31.6 22.0 -1.0% 4.0% 10.8% 10.8%
Simple average 37.1 26.5 17.8 5.2 3.2 2.7 15.9 14.1 14.9 22.7 13.3 10.0 2.6% 4.0% 1.6% 1.6%
Median 18.0 16.2 14.4 2.6 2.1 1.7 10.7 12.5 13.4 13.7 9.8 8.4 -0.2% 0.4% -3.1% -3.1%
Hospitals
CHINA RESOURCES 1515 9.83 12,746 32.0 29.4 22.9 2.9 2.4 2.2 13.9 10.6 10.5 27.8 18.2 13.7 -5.1% 2.3% -0.9% -0.9%
HARMONICARE MEDI 1509 4.01 3,041 24.5 20.2 18.1 1.7 1.7 1.6 7.7 8.8 9.4 9.6 8.6 7.5 -8.7% -10.7% -22.0% -22.0%
WENZHOU KANGNI-H 2120 36.30 2,651 32.0 28.6 22.0 2.3 2.2 2.0 7.1 8.1 9.0 19.3 14.9 11.9 -0.7% -2.7% 6.8% 6.8%
GUANGDONG KANG-H 3689 11.90 3,979 22.0 18.9 16.2 2.9 2.7 2.4 17.5 14.8 15.2 n.a n.a n.a 8.2% 6.3% 5.3% 5.3%
Simple average 27.6 24.3 19.8 2.5 2.2 2.0 11.6 10.6 11.0 18.9 13.9 11.0 -1.6% -1.2% -2.7% -2.7%
Median 28.3 24.4 20.0 2.6 2.3 2.1 10.8 9.7 9.9 19.3 14.9 11.9 -2.9% -0.2% 2.2% 2.2%
Leasing
UNIVERSAL MEDICA 2666 7.13 12,237 11.9 9.5 7.6 1.7 1.5 1.3 13.9 16.3 18.2 21.6 19.4 18.1 -1.5% 3.3% 11.2% 11.2%
Share price performancePrice
(HK$)
Market cap
(HK$m)
PE PB ROE EV/EBITDA

9
2. Major policy uncertainty for 2017 ahead the National Medical Insurance Payment Policy (國家醫保支付改革)
The Medical payment method policy in Fujian (announced in mid-March) may later serve as a leading reference for national medical
payment reform. Key points of the Fujian policy include the following:
1) Fujian’s tendering divides drugs into therapeutic, supplementary and nutritional categories, with drugs in the therapeutic catego-
ry having a relatively higher medical settlement price (醫保支付結算價,the basis for calculating medical insurance reimburse-
ment);
2) Fujian’s policy encourages hospitals to negotiate the price after tendering(二次議價);
3) Fujian’s policy forces hospitals to negotiate drug prices with manufacturers because the difference between the drugs sales
price and the purchase cost can be retained by the hospitals as profit, whereas the lower drug price will primarily benefit medical
insurance funds (醫保基金)and patients; and
4) There is a relatively lower reimbursement ratio for non-competitive (非競價組)drugs, which mainly include original drugs, FDA-
approved drugs, and generics which have passed the consistency assessment (一致性評價), as they have a significantly higher
medical maximum selling price (醫保最高銷售限價), but their medical insurance settlement price has been limited to the lower of
70% of its medical maximum selling price and 150% of the price of a similar category drug in a competitive group (競價組同類
產品). Thus, their usage may be restrained for cost reasons.
In our opinion, points (1) to (3) involve essentially shifting benefits from upstream in the healthcare supply chain (manufacturers) to
downstream (medical insurers and patients). However, we do not think the low medical insurance payment percentage in point (4)
will be retained in the nationwide medical insurance fund policy, as this may reduce the use of innovative drugs and violate the spirit
of medical reform. Basically, we think the government will take a supportive attitude towards innovative drugs, as can be seen in
recent released policy intended to accelerate the introduction of innovative foreign drugs in China. Moreover, Fujian’s policy may
force hospitals to selectively choose patients due to cost control. Thus, we need to wait and see how the national payment policy
differs from Fujian’s. We believe this may be the major policy uncertainty in 2017 for the healthcare sector.
3. Definite beneficiaries of the two-invoice system
On 26 December 2016, the State Council Healthcare Reform Committee, National Health and Family Planning Commission, Nation-
al Development and Reform Commission, Ministry of Industry and Information Technology, Ministry of Commerce, State Administra-
tion of Taxation, and State Administration of Traditional Chinese Medicine jointly released a document titled “Opinion on the Imple-
mentation of the ‘Two Invoices’ System in the Procurement of Pharmaceutical Products by Public Medical Institutions (trial)
(Guoyigaibanfa [2016] No. 4). The official release date was 9 January 2017, right after our sector report’s recommendation for lead-
ing distributors on January 6. The policy requires the two-invoice-system to be implemented nation-wide in 2018. All public hospitals
will gradually use the two invoice system for drug purchases by 2018.
The key is to call for fewer distribution layers and more distribution consolidation. We expect to see continuing consolidation in the
distribution sub-sector, as the pharmaceutical distribution market structure is still quite fragmented compared with that of the U.S.
(only ~70 distributors in U.S., with the top three accounting for >90% market share vs. >10,000 distributors in China, with the top
three accounting for only about a 30% market share).
We reiterate our view that 1) we expect to see fewer small companies with no upstream or downstream sales network survive; 2) the
most promising way out for small-to-medium size companies with certain resources is to seek coordination with the leading distribu-
tors or be acquired by big players (as invoices from subsidiaries of one group are not considered to be an additional invoice). This
basically offers plenty of M&A opportunities for the leading players with the acquisition cost as low as 5-8x PER; and 3) we expect
leading distributors to benefit from the expected industry consolidation: SINOPHARM [1099.HK; NOT RATED], SH PHARMA
[2607.HK; NOT RATED], and CR Pharm [3320.HK; NOT RATED].

10
4. Investment thesis
We reviewed our stock pick logic in our previous sector report. As our stock-pick logic was proved by the market to be right in Q1
2017, we largely maintain our stock-pick strategy. However, we note a new angle for Vitamin C, as there has been a Vitamin C price
rebound.
1) Stringent environmental regulations perspective
We reiterate that stringent environmental regulations will benefit leading drug manufacturers with a strong product portfolio (first-line
treatment drugs or drugs in clinical standard treatment course guidance which are indispensable for treatment) and a strong R&D
pipeline and expect big caps to continue to outperform. Related stocks: Luye Pharm [2186.HK; BUY], CSPC [1093.HK; HOLD]
and 3SBio [1530.HK; HOLD].
2) Drug zero-price mark-up perspective
The zero-price mark-up policy turns hospital drug sales from a major profit centre to a cost centre. However, a 25% markup is al-
lowed for traditional Chinese medicine (TCM), which should encourage hospitals to sell more TCM. From this angle, CTCM [570.HK;
BUY] is our top pick.
3) Upbeat vitamin C price perspective
Vitamin C contributed only HK$26m to CSPC’s operating profit in 2016 (1% of total operating profit) due to weak vitamin C prices in
2016. With CSPC’s average ex-factory price for vitamin C increasing from ~US$3/kg in 2016 to the recent ~US$4.5/kg, we expect
the vitamin C business to contribute profit of ~HK$180m in 2017E, representing ~6.7% of 2017E estimated total net profit. Related
stock: CSPC [1093.HK; HOLD].
4) Stable 6-APA price perspective
More stringent environmental regulations are expected in 2017. Currently the 6-APA capacity of Huabei Pharmaceutical and Harbin
Pharmaceutical has faded out, and they are unlikely to resume production again. If 6-APA remains at RMB160-170/kg (including
17% VAT), we project that TUL’s intermediates and bulk medicines will achieve a segment margin of ~5%, contributing 9/14% of
total operating profit in 2017/2018, respectively. In the medium term, we do not expect a significant increase in the 6-APA price, as a
higher ASP may induce more capacity. We expect the 6-APA price to remain stable at this level (right above TUL’s breakeven level
of ~RMB150/kg). In summary, we expect the worst is over for 6-APA. Related stock: TUL [3933.hk; HOLD]

11
China Traditional Chinese Medicine Co. [570.HK]
BUY (Unchanged)
Close: HK$4.42 (April 05, 2017)
Target Price: HK$4.82 (+9.0%)
Price Performance
Market Cap US2,521.2m
Shares Outstanding 4,431.5m
Auditor KPMG
Free Float 46.6%
52W range HK$2.94-4.50
3M average daily T/O US$4.8m
Major Shareholding China National Phar-
maceutical Group
Corporation (36%)
Sources: Company, Bloomberg
Harry He—Analyst
(852) 3698-6320
Wong Chi Man, CFA—Head of Research
(852) 3698-6317
Sources: Company, CGIS Research
China Healthcare Sector
The strong performance of CCMG in 2H16 confirms our positive view of this business
segment. Its CCMG business was growing much faster than that of its peers due to its
wide national sales network and strong sales team. We believe the Company deserves to
trade at a higher multiple, as the visibility of its CCMG business to deliver >20% sales
CAGR is becoming clearer. The overhang of TCM finished drugs has been removed, and
they are expected to deliver single-digit growth in 2017. Its share price has moved strongly
>10% since our last report on March 23. We maintained our positive view of the Company.
Reiterate BUY.
Investment thesis
Faster growth than peers’: Pura Pharm’s [1498.hk] CCMG sales (focusing mainly on
Guangdong, Guangxi and Yunnan) grew 7% YoY in 2016, reaching HK$270m. Even ex-
cluding the RMB transition impact, it is expecting only ~13% YoY growth vs. CTCM’s 21%.
Tianjin Chase Sun’s [300026.CH] CCMG (mainly focusing on the northern market, espe-
cially Beijing-Tianjin-Hebei) delivered RMB1.88bn, up 18% YoY vs. CTCM’s 21%. Chase
Sun management is guiding a slower growth rate going forward for CCMG mainly due to
adjustments to its sales team. We think the maturity of their northern market and the diffi-
culty of breaking into the southern market are also key reasons. Overall, Chase Sun man-
agement is still relative positive on the opening-up of the CCMG market, primarily due to
1) high entry barriers, and 2) a 3-year transition period for the five main players, as dis-
cussed in our previous report, which will benefit the five main players.
Promising outlook for CCMG becoming more visible in 2017: The strong performance
of concentrated Chinese medicine granules (CCMG) in 2H16 (+22% YoY growth in reve-
nue) confirms our positive view of this business. We expect CCMG to continue to deliver
>20% CAGR in 2017/18 for the following reasons: 1) We expect fast growth from non-
TCM hospitals, since CCMG are not included in the calculation of drugs sales revenue
percentage(藥佔比) for public hospitals, and CCMG can be marked up by up to 25%
under the zero-price mark-up policy. 2) We expect hospital coverage expansion and an
increase in average sales per hospital. Currently, each Class III/II hospital has average
sales of RMB3.5/1m. Management aims to stimulate average sales of RMB10m/5m for
Class III/II hospitals through more doctor-education efforts (we assume it will take about 5
years to achieve this target). 3) We expect fast growth in sales through medicine dispens-
ing machines(配藥機),which currently account for 30% of total CCMG sales and can
reduce hospitals’ TCM decoction management costs and greatly facilitate CCMG prescrip-
tions. 4) Eastern China, which accounts for 36% of total CCMG sales, is expected to con-
tinue to contribute solid growth, as Jiangsu, Zhejiang, Anhui, and Fujian have a decent
medical insurance coverage policy for CCMG. 5) To fulfill >20% sales CAGR, the Compa-
ny has targeted production capacity expansion for extraction and concentrated TCM gran-
ules of 3 times and 2.5 times existing production capacity, respectively, within 3 years.
Therefore, we maintain our CCMG assumption and expect them to deliver >20% sales
CAGR in 2016-2018E. Moreover, as CCMG are currently not subject to tendering ASP
cuts, we are also positive on their gross margin maintaining ~60%.
Visible 20%+ growth for CCMG; Worst is over for TCM finished drugs; Reiterate BUY
April 06, 2017
Y/E Dec 31 2014A 2015A 2016A 2017E 2018E
Turnover (RMBm) 2,650 3,709 6,533 7,600 8,768
Net profit (RMBm) 417 546 967 1,173 1,411
Core net profit (RMBm)* 420 536 974 1,173 1,411
Core net margin (%) 15.9 14.4 14.9 15.4 16.1
Core EPS (RMB) 0.166 0.145 0.220 0.265 0.318
YoY(%) 86.3 -12.4 51.3 20.5 20.3
PER (x) 23.0 26.2 17.3 14.4 12.0
PBR (x) 5.4 1.5 1.5 1.4 1.3
ROE(%) 14.1 7.5 8.6 9.8 10.9
EV/EBITDA (x) 26.6 18.9 10.2 9.6 7.5
* Adjusted by CGIS research
1
0
20
40
60
80
100
120
140
160
180
200
2
3
4
5
(HK$ million)(HK$)
Turnover (RHS) Price (LHS)

12
CCMG opening-up expected in 2017, a big positive for CTCM: The CCMG market is expected to open up this year, with market vol-
ume expected to surge sharply. There are concerns about corresponding fierce competition when the market opens up, but we reiterate
our positive view that the Company will be a primary beneficiary as 1) there is a three-year transition period for the five main players,
during which they will be allowed to sell all ~700 types of CCMG products, while new manufacturers can sell only CCMG products with
established standards; i.e., the five main players have sufficient time to cement their leading position; and 2) the entry barrier is quite
high because of the technical know-how, quality management, and R&D capex investment required and because the authorities require
complete TCM source tracking (溯源) and unified standards.
Reiterate that the worst is over for TCM finished drugs: As at end-2016, TCM finished drugs channel inventory had fallen to 2.5
months from 4 months (the normal level is 2 months). That said, 2016 TCM finished drug revenue corresponded to approximately 10.5
months shipments to channels. If we assume further destocking of the remaining half month of channel inventory, this implies 2017
TCM finished drugs shipments will be ~11.5 months. On this basis alone, 2017 TCM finished drugs are expected to deliver close to 10%
YoY revenue growth (11.5 months shipments in 2017 vs. 10.5 months shipments in 2016). Although procurement tendering and sec-
ondary price negotiation will suppress growth somewhat, overall, we reiterate our view that TCM finished drugs should bottom out and
deliver mid-to-high single-digit growth in 2017.
CTCM deserves to trade at a higher valuation multiple: We largely maintain our projections. However, since CCMG account for
~67% of total revenue, the outlook is much better, and the Company’s growth in 2017/18 is becoming more visible, so we think it de-
serves a re-rating.

13
Key financials
Source: CGIS Research estimates
Balance Sheet Profit and Loss
As at Dec 31 Year ended Dec 31
(RMBm) (RMBm)
Cash & cash equivalents 440 2,138 3,423 2,704 3,757 TCM finished drugs 2,650 2,731 2,174 2,348 2,466
Inventories 418 1,236 1,894 1,416 1,444 CCMG - 979 4,359 5,252 6,302
Accounts receivable 1,236 3,398 2,716 2,986 3,309 Revenue 2,650 3,709 6,533 7,600 8,768
Others 1 106 37 37 37 Cost of goods sold (1,007) (1,509) (2,745) (3,146) (3,611)
Current assets 2,094 6,878 8,070 7,142 8,547 Gross profit 1,643 2,201 3,788 4,455 5,157
Property, plant and equipment 1,036 1,974 2,356 2,527 2,570 Other gains / (losses) 37 128 82 32 36
Intangible assets 948 6,680 6,764 6,836 6,876 Marketing expenses (903) (1,196) (1,968) (2,275) (2,598)
Goodw ill 1,191 3,341 3,456 3,456 3,456 Admin & other expenses (222) (385) (517) (597) (682)
Others 62 335 390 391 392 Operating profit 552 761 1,377 1,613 1,913
Non-current assets 3,237 12,331 12,966 13,210 13,294 Net interest income / (expense) (63) (70) (73) (74) (63)
Non-operating items 0 (2) 0 1 1
Total assets 5,332 19,209 21,037 20,352 21,840 Pretax income 489 689 1,304 1,540 1,851
Income taxes (70) (119) (217) (243) (292)
Accounts payable 540 2,677 2,304 2,045 2,708 Non-controlling interests (2) (24) (120) (123) (148)
ST borrow ings 502 1,600 1,001 2,477 2,096 Net profit 417 546 967 1,173 1,411
Others 92 208 202 202 202
Current liabilities 1,134 4,485 3,507 4,724 5,006 Core net profit* 420 536 974 1,173 1,411
Long-term debts 671 850 423 0 0 EBIT 553 725 1,264 1,490 1,766
Others 270 1,733 4,351 1,866 1,866 EBITDA 671 921 1,714 1,870 2,200
Long-term liabilities 941 2,583 4,774 1,866 1,866
EPS (RMB) 0.164 0.148 0.218 0.265 0.318
Total liabilities 2,075 7,068 8,281 6,589 6,871 Core EPS (RMB) 0.166 0.145 0.220 0.265 0.318
DPS (HK$) 0.000 0.000 0.100 0.106 0.096
Shareholders' equity 3,184 11,133 11,588 12,471 13,530 Payout ratio 0.000 0.000 40.2% 40.0% 30.0%
Minority interests 73 1,007 1,168 1,291 1,439
Total equity 3,257 12,140 12,756 13,762 14,969
Cash Flow Key Ratios
Year ended Dec 31 Year ended Dec 31 2014A 2015A 2016A 2017E 2018E
(RMBm) Growth (% YoY)
Profit before tax 489 689 1,304 1,540 1,851 Sales 90.0 40.0 76.1 16.3 15.4
Depr & amortization 119 160 337 257 287 Operating profit 108.2 37.9 80.9 17.2 18.6
Change in w orking cap. (252) (195) (349) (50) 311 EBITDA 101.3 37.3 86.0 9.2 17.6
Income tax paid (93) (149) (217) (243) (292) Core net profit 130.2 27.4 81.8 20.5 20.3
Others 63 14 389 74 62 Core EPS 86.3 (12.4) 51.3 20.5 20.3
Operating cash flow 327 519 1,463 1,578 2,219 Profitability (%)
Gross margin 62.0 59.3 58.0 58.6 58.8
Capex (106) (238) (760) (500) (370) Operating margin 20.8 20.5 21.1 21.2 21.8
Cash for acquisition of subsidiaries 0 (7,452) (742) 0 0 EBITDA margin 25.3 24.8 26.2 24.6 25.1
Change in other assets 24 531 (1,065) 0 0 Core net profit margin 15.9 14.4 14.9 15.4 16.1
Investment cash flow (83) (7,158) (2,567) (500) (370) ROA 8.1 4.4 4.8 5.7 6.7
ROE 14.1 7.5 8.6 9.8 10.9
Net change in debt (72) 1,202 1,460 (1,433) (382) Balance sheet ratios
Proceeds from new shares 0 7,200 0 0 0 Current ratio (X) 1.8 1.5 2.3 1.5 1.7
Others (77) (72) (84) (364) (415) Quick ratio (X) 0.4 0.5 1.0 0.6 0.8
Financing cash flow (150) 8,330 1,375 (1,797) (796) Cash ratio (X) 0.4 0.5 0.7 0.4 0.6
Trade & bill receivables days 68 87 69 65 64
Net change in cash 94 1,691 272 (720) 1,053 Trade & bill payable days 51 50 53 63 52
Cash at beginning of the year 345 439 2,102 2,373 1,654 Inventory turnover days 149 200 208 192 145
Effect from foreign exchange (0) (28) 0 0 0 Total debt to equity ratio (%) 36.8 22.0 24.2 19.9 15.5
Cash at the end of the year 439 2,102 2,373 1,654 2,707
2014A 2015A 2016A 2017E
2014A 2015A 2016E 2017E
2018E2014A 2015A 2016A 2017E
2018E
2018E

14
Luye Pharm [2186.HK]
BUY (Unchanged)
Close: HK$4.80 (April 05, 2017)
Target Price: HK$5.78 (+20.4%)
Price Performance
Market Cap US2,051.9m
Shares Outstanding 3,321.1m
Auditor E&Y
Free Float 54.3%
52W range HK$4.41-5.81
3M average daily T/O US$7.0m
Major Shareholding Chairman Liu Dian
Bo (45.68%)
Sources: Company, Bloomberg
Harry He—Analyst
(852) 3698-6320
Wong Chi Man, CFA—Head of Research
(852) 3698-6317
Sources: Company, CGIS Research estimates
China Healthcare Sector
We believe the Company’s growth story remains unchanged. In the next
few years, earnings wil l be driven mainly by existing key products, espe-
cial ly Lipusu, Beixi, Xuezhikang and Rivastigmine (which are expected to
account for ~70% of 2017E revenue) before the launch of new FDA drugs.
We maintain our target pr ice at HK$5.78 (17x 2017 PER). Maintain BUY.
Investment Highlights
Lipusu to continue low-teen growth: Management holds a positive view on Lipusu’s
next few years’ growth, as they believe it will take time for Lipusu’s direct competitor
Paclitaxel-albumin (白蛋白紫杉醇) to catch up, as Lipusu has advantages in its exist-
ing sales channel and doctor base. We share this view, as currently there is no clinical
data showing any major difference in the curative effect between the two drugs. Lipusu
may be included in the negotiated NRDL (醫保談判目錄).However, a potential ASP cut
is a major risk. Overall, we continue to expect Lipusu to deliver low-teen growth in 2017
-2018 vs. expected high-single-digit growth of Paclitaxel (紫杉醇) (according to IMS,
the market size is ~RMB3.3bn and Lipusu has a ~54% market share). That is, we basi-
cally expect Lipusu to keep gaining market share as liposome Paclitaxel replaces tradi-
tional Paclitaxel.
Positive guidance on Beixi and Xuezhikang: Beixi/Xuezhikang accounted for
~8/4.6% of 2016 total revenue (estimated by CGIS research). Management guided
>30%/double-digit growth for Beixi/Xuezhikang in 2017, respectively, as a result of a
greater sales focus on low-tier hospitals, which we think should be positive to the mar-
ket.
Impact of Acino: The Company started consolidating Acino in its results in Dec 2016.
We still expect it to grow ~10% YoY, driven by Rivastigmine, the first generic drug for
Norvatis’ Exelon in the U.S. to treat Alzheimer's Disease (AD). Acino generates
~RMB92m of D&A each year; we expect its net margin to be ~20% (still lower than that
of Luye’s orginal business), up from ~17% in 2016. On this basis, we expect overseas
sales to contribute ~RMB115m to the bottom-line in 2017E (11% of our 2017E net profit
estimate). With two more generics of Exelon expected to come out in 2018E, we expect
growth to slow down gradually.
Risperidone: This is used to treat schizophrenia (精神分裂症) and is under U.S. FDA
application. Management expects to submit a New Drug Application in 2018 and to
launch it in 2019.
Catalysts: Several factors will provide further upside to our forecast: 1) a lower-than-
expected ASP cut for Lipusu if it is included in the negotiated NRDL; 2) fast-than-
expected growth of existing products; 3) more M&A, given net cash of >RMB1.6bn and
expected >RMB1bn EBITDA each year going forward; and 4) the launch of new FDA-
approved drugs.
Growth story remains intact. Maintain BUY
Y/E Dec 31 2014A 2015A 2016A 2017E 2018E
Turnover (RMB m) 2,544 2,563 2,918 3,830 4,263
Core net profit (RMB m) 634 755 869 1,064 1,207
Core net margin 24.9% 29.4% 29.8% 27.8% 28.3%
Core EPS (RMB) 0.212 0.227 0.262 0.320 0.364
YoY 7.4% 15.2% 22.4% 13.5%
PER (x) 20.4 19.0 16.5 13.5 11.9
PBR (x) 2.1 2.0 1.6 1.5 1.4
Adjusted ROE 14.3% 14.4% 15.3% 14.9%
EV/EBITDA (x) 16.0 13.2 13.7 8.5 6.9
April 06, 2017
0
200
400
600
800
1000
1200
4
4.5
5
5.5
6
(HK$ million)(HK$)
Turnover (RHS) Price (LHS)

15
Key financials
Source: Company, CGIS Research estimates
P&L (RMBm) 2014A 2015A 2016A 2017E 2018E Cash flow (RMBm) 2014A 2015A 2016E 2017E 2018E
Revenue 2,544 2,563 2,918 3,830 4,263 Pretax profit 726 898 975 1,247 1,415
Oncology 1,319 1,395 1,570 1,758 1,969 D&A 105 110 135 274 301
Cardiovascular System 661 621 652 704 760 Change in working capital (341) (417) (453) (6) (321)
Alimentary Tract and Metabolism 444 468 554 638 733 Income tax paid (103) (111) (81) (181) (205)
Other Products 120 78 141 163 187 Others 109 (86) (49) (20) (24)
Overseas Business n.a n.a 0 568 613 Operating cash flow 495 395 527 1,314 1,165
COGS (483) (476) (535) (744) (800)
Gross profit 2,061 2,087 2,383 3,086 3,463 Capex (269) (204) (611) (300) (300)
Selling and distribution expenses (1,006) (964) (1,122) (1,436) (1,599) Purchase of intangible assets (8) (4) (759) (50) (50)
Administrative expenses (195) (185) (267) (291) (324) Acquisition of subsidiaries 0 0 0 0 0
Other expenses (194) (190) (199) (260) (290) Others (2,882) 448 (509) 139 143
EBIT 666 748 795 1,098 1,250 Investing cash flow (3,159) 240 (1,879) (211) (207)
D&A 105 110 135 274 301
EBITDA 772 858 930 1,372 1,551 Proceed from/(repayment of) borrowings (440) 197 1,122 (800) (500)
Finance costs (40) (16) (30) (21) (10) Proceed from equity 3,139 0 0 0 0
Share of profit of an associate 0 0 1 1 2 Dividend paid 0 0 0 0 0
Other income and gains 99 165 209 169 173 Others (217) (146) (216) 0 0
Pretax profit 726 898 975 1,247 1,415 Financing cash flow 2,482 51 906 (800) (500)
Tax (111) (133) (81) (181) (205)
After tax profit 615 765 894 1,066 1,210 Net change in cash (182) 686 (446) 303 458
MI 9 10 2 2 2
Reported net profit 606 755 892 1,064 1,207
Adjusted net profit 634 755 869 1,064 1,207
Reported EPS (RMB) 0.202 0.227 0.268 0.320 0.364
Adjusted EPS (RMB) 0.212 0.227 0.262 0.320 0.364
DPS(RMB) 0.000 0.000 0.067 0.096 0.109
Payout 0.0% 0.0% 25.6% 30.0% 30.0%
Balance sheet (RMBm) 2014A 2015A 2016A 2017E 2018E 2014A 2015A 2016A 2017E 2018E
Balance Sheet (as of end-Dec) Valuation
Property, plant and equipment 1,092 1,196 1,702 1,829 1,933 PER (recurring earnings) (x) 20.1 18.7 16.2 13.3 11.7
Goodwill 347 347 996 996 996 Dividend yield 0.0% 0.0% 1.6% 2.3% 2.6%
Other intangible assets 146 126 856 804 749 PBR (x) 2.1 2.0 1.5 1.5 1.4
Available-for-sale investments 1,019 312 370 371 373 EV/EBITDA (x) 15.7 13.0 13.4 8.3 6.7
Total non current assets 2,605 1,981 3,923 4,000 4,051 Growth rate
Revenue 0.8% 13.8% 31.3% 11.3%
Inventories 251 286 453 281 508 EBIT 12.3% 6.2% 38.1% 13.9%
Trade and notes receivables 914 1,193 1,415 1,733 1,771 EBITDA 11.2% 8.4% 47.5% 13.0%
Pledged short-term deposits 127 267 482 482 482 Recurring net profit 19.1% 15.2% 22.4% 13.5%
Cash and cash equivalents 2,177 3,206 2,747 3,050 3,508 Recurring EPS 7.4% 15.2% 22.4% 13.5%
Due from related parties 56 120 185 63 70 Operating ratios
Total current assets 3,526 5,071 5,282 5,610 6,339 Gross margin 81.0% 81.4% 81.7% 80.6% 81.2%
Total assets 6,131 7,053 9,206 9,611 10,390 EBIT margin 26.2% 29.2% 27.2% 28.7% 29.3%
EBITDA margin 30.3% 33.5% 31.9% 35.8% 36.4%
LT borrowings 1 0 0 0 0 Recurring net margin 24.9% 29.4% 29.8% 27.8% 28.3%
Deferred revenue 204 207 269 269 269 Adjusted ROE 14.3% 14.4% 15.3% 14.9%
Total non-current liabilities 205 208 269 269 269 Adjusted ROA 11.5% 10.7% 11.3% 12.1%
Interest coverage (EBITDA) 19 55 31 64 154
Trade and notes payables 59 83 116 108 133 Net debt/equity Net cash Net cash Net cash Net cash Net cash
ST borrowings 305 502 1,624 824 324 Current ratio 4.0 4.9 2.2 3.3 4.9
Due to related parties 524 460 635 781 826 Quick ratio 3.7 4.6 2.0 3.1 4.5
Total current liabilities 888 1,045 2,375 1,713 1,283 Days inventories 206 586 180 180
Days receivables 150 320 150 150
Issued capital 427 427 427 427 427 Days payables 55 158 55 55
Reserves 4,480 5,237 6,001 7,066 8,273
MI 130 136 133 135 138
Total equity 5,038 5,800 6,562 7,628 8,838
Total equity and liabilities 6,131 7,053 9,206 9,611 10,390

16
SSY Group [2005.HK]
BUY
(Unchanged)
Close: HK$3.14 (April 05, 2017)
Target Price: HK$3.41 (+8.6%)
Price Performance
Market Cap US$1,147.8m
Shares Outstanding 2,840.0m
Auditor PWC
Free Float 52.62%
52W range HK$2.39-3.14
3M average daily T/O US$1.0m
Major Shareholding Mr. Qu Jiguang
(35.56%)
Sources: Company, Bloomberg
Harry He—Analyst
(852) 3698-6320
Wong Chi Man, CFA—Head of Research
(852) 3698-6317
Sources: Company, CGIS Research
China Healthcare Sector
SSY delivered solid 2016 results, mainly due to improved operating lever-
age and a recovery in the Intravenous Infusion (IV) industry in 2H16. Going
forward, with stabil ization of IV product ASPs and expected execution of
new tenders won in 2H16, management set a promising volume growth tar-
get this year. Together with expected continuing operating leverage im-
provement, we see ~20% EPS CAGR potential in 2016 -2018E.
Investment Highlights
Upbeat 2017 guidance: The Company guided sales volume of 440m non -PVC
soft bags, up 6% YoY, and 226m upright bags in 2017, up 61.6%. Total
sales volume is expected to reach 1.3bn bags, implying 13.5% YoY growth.
We believe the upbeat target is driven mainly by new tenders won in 2H16
to be executed in 2017 and the IV industry picking up post -consolidation.
Kelun: Kelun increased its stake from 11.05% to 16.17% in the past year
at a cost ranging from HK$2.402 to HK$2.697. We believe a further in-
crease in Kelun’s stake is possible and could offer support to the share
price.
Positive outlook: After IV industry consolidation in the past few years, we
expect the IV industry to grow at a ~5 -6% CAGR in 2016-2020, as there is
essential ly rigid demand for IV. Given the existing fundamentals, the Com-
pany’s future growth wil l come mainly from improving operating leverage
and higher sales of high -margin soft bags. We note stabil ization in the ASP
after industry consolidation and expect the price to be stable going for-
ward. Therefore, we have become positive on the Company’s outlook.
Solid 2016 results, strong growth expected in 2017, reiterate BUY
Y/E Dec 31 2014A 2015A 2016A 2017E 2018E
Turnover (HK$ m) 2,091 2,222 2,361 2,626 2,791
Core net profit (HK$ m) 492 403 490 605 704
Core net margin (%) 23.5 18.2 20.7 23.0 25.2
Core EPS (HK$) 0.167 0.138 0.173 0.213 0.248
% Change 32.4 -17.1 25.0 23.1 16.4
PER (x) 18.8 22.7 18.2 14.7 12.7
PBR (x) 2.7 3.7 3.3 2.8 2.4
ROE(%) 16.1 14.3 19.3 20.8 20.8
EV/EBITDA (x) 12.0 13.6 11.2 9.5 8.1
April 06, 2017
0
10
20
30
40
50
60
2
2.5
3
3.5
4
(HK$ million)(HK$)
Turnover (RHS) Price (LHS)

17
Key financials
Source: Company, CGIS Research estimates
B alance Sheet P ro f it and Lo ss
A s at D ec 31 Year ended D ec 31
(H K$ m) (H K$ m)
Cash & cash equivalents 325 339 447 633 684 Glass bottles 246 226 225 261 287
Inventories 280 283 278 297 303 PP bottles 556 502 501 535 559
Accounts receivable 703 935 857 1,103 1,061 Non-PVC soft bags 1,139 1,128 1,131 1,188 1,287
Others 373 76 97 97 97 Upright soft bags 0 151 207 348 370
C urrent assets 1,681 1,633 1,680 2,129 2,144 Others 151 215 298 293 289
Property, plant and equipment 2,552 2,694 2,393 2,455 2,500 R evenue 2,091 2,222 2,361 2,626 2,791
Intangible assets 339 381 419 451 483 Cost o f goods so ld (1,026) (1,172) (1,144) (1,219) (1,244)
Others 226 300 253 247 242 Gro ss pro f it 1,065 1,050 1,217 1,407 1,547
N o n-current assets 3,117 3,375 3,065 3,154 3,224 M arketing expenses (263) (281) (373) (392) (411)
Admin & other expenses (222) (278) (268) (270) (283)
T o tal assets 4,798 5,008 4,744 5,283 5,368 Operat ing pro f it 581 491 576 746 854
Other gains / (losses) 40 50 65 12 12
Accounts payable 288 270 174 293 187 Gain/(losses) from JV 0 (2) (2) - -
ST borrowings 508 688 633 362 515 Gain on disposal o f investment in JV - - 1 - -
Others 353 477 289 404 409 Net interest income / (expense) (41) (62) (52) (46) (37)
C urrent liabilit ies 1,148 1,434 1,096 1,058 1,110 Pretax income 580 478 588 712 829
Long-term debts 364 1,125 935 1,068 587 Income taxes (89) (75) (98) (107) (124)
Others 32 29 29 29 29 Discontinued business 111 0 0 0 0
Lo ng-term liabilit ies 397 1,179 964 1,097 616 Non-contro lling interests 0 0 1 1 1
N et pro f it 603 403 490 605 704
T o tal liabilit ies 1,544 2,613 2,060 2,156 1,726
C o re net pro f it 492 403 490 605 704
Shareholders' equity 3,253 2,395 2,676 3,118 3,632
M inority interests 1 1 8 8 9 EBIT 621 540 638 757 865
T o tal equity 3,253 2,395 2,684 3,127 3,641 EBITDA 782 756 885 1,008 1,135
EPS (HK$) 0.205 0.138 0.173 0.213 0.248
C o re EP S (H K$ ) 0.167 0.138 0.173 0.213 0.248
DPS (HK$) 0.060 0.025 0.055 0.064 0.074
C ash F lo w Key R at io s
Year ended D ec 31 2014A 2015A 2016E 2017E 2018E Year ended D ec 31 2014A 2015A 2016A 2017E 2018E
(H K$ m) Gro wth (% Yo Y)
Profit before tax 729 478 588 712 829 Sales 21.4 6.2 6.3 11.2 6.3
Depr & amortization 185 216 247 251 270 Operating profit 31.1 (12.9) 18.3 18.3 14.3
Change in working cap. (358) 170 (216) (30) (65) EBITDA 32.6 (3.3) 17.1 13.8 12.6
Income tax paid (128) (75) (98) (107) (124) Core net profit 33.1 (17.9) 21.3 23.6 16.4
Others (121) (227) (183) (3) (3) Core EPS 32.4 (17.1) 25.0 23.1 16.4
Operat ing cash f lo w 308 563 338 823 906 P ro f itability (%)
Gross margin 50.9 47.2 51.6 53.6 55.4
Capex (853) (396) (347) (340) (340) Operating margin 29.7 24.4 27.1 28.9 31.0
Change in other assets 457 131 444 3 3 EBITDA margin 37.4 34.0 37.5 38.4 40.7
Investment cash f lo w (396) (265) 97 (337) (337) Core net profit margin 23.5 18.2 20.7 23.0 25.2
ROA 9.9 8.2 10.0 12.1 13.2
Net change in debt 274 940 (253) (138) (329) ROE 16.1 14.3 19.3 20.8 20.8
Others (195) (1,216) (74) (163) (190) B alance sheet rat io s
F inancing cash f lo w 78 (276) (327) (301) (518) Current ratio (X) 1.5 1.1 1.5 2.0 1.9
Quick ratio (X) 0.3 0.2 0.4 0.6 0.6
N et change in cash (11) 22 108 186 51 Cash ratio (X) 0.3 0.2 0.4 0.6 0.6
Cash at beginning of the year 337 325 339 447 633 Trade & bill receivables days 101.8 99.3 101.3 98.5 102.1
Effect from foreign exchange (1) (8) 0 0 0 Trade & bill payable days 130.0 86.5 71.0 68.8 70.0
C ash at the end o f the year 325 339 447 633 684 Inventory turnover days 121.7 87.5 89.5 86.0 87.9
Total debt to equity ratio (%) 26.8 75.7 58.4 45.7 30.3
2018E2018E 2014A 2015A 2016A 2017E2014A 2015A 2016A 2017E

18
CSPC Pharmaceutical Group [1093.HK]
HOLD
(Unchanged)
Close: HK$10.22 (April 05, 2017)
Target Price: HK$11.10 (+8.6%)
Price Performance
Market Cap US$7,964.0m
Shares Outstanding 6,052.5m
Auditor Deloitte
Free Float 69.4%
52W range HK$6.49-10.30
3M average daily T/O US$19.4m
Major Shareholding Mr. Cai Dongchen and
management (30.61%)
Sources: Company, Bloomberg
Harry He—Analyst
(852) 3698-6320
Wong Chi Man, CFA—Head of Research
(852) 3698-6317
China Healthcare Sector
We reiterate our positive view on its innovative drugs, which are the key growth driver. Its
vitamin C business is expected to rebound in 2017E and to start to make a meaningful
profit contribution. Oncology drugs are guided to deliver much faster growth than before,
which illustrates management’s strong confidence. We maintain our positive view on the
Company’s fundamentals. Our HOLD rating is on the valuation, as the upside is only
~10%, but we will be a buyer of the stock if we see >15% upside after any correction.
Investment Highlights
NBP: Although revenue growth of NBP injection form decelerated to 38% YoY in Q4
2016, partly because of a higher base, from 65% YoY growth in 9M2016, our positive
view is unchanged, as 1) NBP injection form is included in the 2017 version of the NRDL,
which will boost growth from 2018; and 2) management has a decent plan for expanding
hospital and geographic coverage. Management is confident about delivering faster
growth than that in Q4 2016 (i.e. >38%). We project ~40% revenue CAGR for NBP in
2016-2018E.
Oncology: Although revenue from oncology drugs increased 22% YoY to HK$597m in
2016, it missed the Company’s target of a 50% YoY increase. However, management
illustrated its strong confidence in ramping up the oncology portfolio’s total revenue to
HK$2bn by 2018, implying a CAGR of ~83%. We think this target looks aggressive, but
given 1) Jinyouli and Nuolining are included in the 2017 NRDL version, and 2) Duomeisu
is expected to continue gaining market share from other anthracycline drugs, we are
expecting 38% oncology revenue CAGR in 2016-2018. This would increase oncology’s
revenue/gross profit percentage from 4.8/8% in 2016 to 7/10% in 2018.
Vitamin C upbeat: This segment contributed only HK$26m in operating profit in 2016
(1% of total operating profit) due to weak vitamin C prices in 2016. With CSPC’s average
ex-factory price for vitamin C increasing from ~US$3/kg in 2016 to the recent ~US$4.5/
kg, we expect the vitamin C business to contribute profit of ~HK$180m in 2017E, repre-
senting ~6.7% of 2017E estimated total net profit.
Investment thesis remains intact. Maintain HOLD on Valuation.
Source: CGIS Research estimate
Y/E Dec 31 2014 2015 2016E 2017E 2018E
Turnover (HK$ m) 10,955 11,394 12,369 14,481 16,684
Core net profit (HK$ m) 1,265 1,678 2,101 2,640 3,250
Core net margin (%) 11.6 14.7 17.0 18.2 19.5
Core EPS (HK$) 0.21 0.28 0.35 0.44 0.54
% Change 38.8 32.6 24.1 23.8 23.1
PER (x) 47.7 36.0 29.0 23.2 18.9
PBR (x) 7.5 6.9 6.0 5.0 4.2
ROE(%) 15.7 19.2 20.8 21.9 22.6
EV/EBITDA (x) 26.4 21.6 18.1 14.4 11.6
0
100
200
300
400
500
600
700
0
2
4
6
8
10
12
(HK$ million)(HK$)
Turnover (RHS) Price (LHS)
April 06, 2017

19
Key financials
Source: Company data, CGIS Research estimates
B alance Sheet P ro f it and Lo ss
A s at D ec 31 Year ended D ec 31
(H K$ m) (H K$ m)
Cash & cash equivalents 1,527 2,306 3,238 3,535 4,952 Innovative drugs 2,783 3,774 4,774 6,279 8,273
Inventories 1,806 1,819 1,933 1,931 2,163 Generics 3,933 4,019 4,193 4,319 4,448
Accounts receivable 2,007 1,878 1,835 2,747 3,155 Bulk medicines 4,239 3,600 3,402 3,990 4,202
Others 1,267 1,645 1,422 1,900 2,122 R evenue 10,955 11,394 12,369 14,587 16,923
C urrent assets 6,606 7,648 8,428 10,114 12,391 Cost o f goods so ld (6,768) (6,173) (6,060) (6,879) (7,702)
Property, plant and equipment 5,049 5,143 5,415 5,742 6,203 Gro ss pro f it 4,187 5,221 6,309 7,708 9,221
Intangible assets 111 96 79 154 238 Other gains / (losses) 135 87 107 0 0
Others 735 653 838 872 882 M arketing expenses (1,788) (2,267) (2,788) (2,917) (3,385)
N o n-current assets 5,895 5,892 6,333 6,768 7,323 Admin expenses (552) (535) (554) (656) (762)
R&D and other expenses (308) (339) (424) (729) (846)
T o tal assets 12,501 13,540 14,760 16,882 19,715 Operat ing pro f it 1,674 2,166 2,649 3,405 4,229
Net interest income / (expense) (54) (56) (42) (46) (44)
Accounts payable 2,330 2,489 2,938 2,758 3,157 Share of results o f JV & associates 1 11 28 23 25
ST borrowings 624 452 898 810 770 Non-operating items 1 (9) 0 0 0
Others 649 544 249 534 552 Pretax income 1,621 2,112 2,635 3,381 4,210
C urrent liabilit ies 3,602 3,484 4,085 4,103 4,478 Income taxes (337) (432) (522) (676) (842)
Non-contro lling interests 16 14 12 19 19
Long-term debts 602 1,011 240 347 330 N et pro f it 1,300 1,694 2,126 2,724 3,387
Others 145 232 244 244 244 C o re net pro f it 1,265 1,678 2,101 2,686 3,348
Lo ng-term liabilit ies 747 1,243 484 591 574
EBITDA 2,285 2,772 3,233 4,068 4,988
T o tal liabilit ies 4,350 4,727 4,569 4,694 5,052
EPS (HK$) 0.215 0.282 0.352 0.444 0.553
Shareholders' equity 8,079 8,738 10,108 12,085 14,541 C o re EP S (H K$ ) 0.214 0.284 0.352 0.444 0.553
M inority interests 72 75 84 102 122 DPS (HK$) 0.100 0.110 0.120 0.151 0.188
T o tal equity 8,152 8,813 10,191 12,187 14,662
C ash F lo w Key R at io s
Year ended D ec 31 Year ended D ec 31 2014A 2015A 2016A 2017E 2018E
(H K$ m) Gro wth (% Yo Y)
Profit before tax 1,621 2,112 2,635 3,381 4,210 Sales 10.1 4.0 8.6 17.9 16.0
Depr & amortization 610 605 510 663 759 Operating profit 41.9 29.4 22.3 28.5 24.2
Change in working cap. (85) 106 335 (1,282) (445) EBITDA 92.3 24.4 21.3 16.6 25.8
Income tax paid (293) (476) (522) (676) (842) Core net profit 47.4 32.6 25.2 27.9 24.6
Others (47) (10) (44) (47) (57) Core EPS 38.8 32.6 24.1 25.9 24.6
Operat ing cash f lo w 1,806 2,337 2,913 2,039 3,626 P ro f itability (%)
Gross margin 38.2 45.8 51.0 52.8 54.5
Capex (814) (669) (824) (1,050) (1,289) Operating margin 15.3 19.0 21.4 23.3 25.0
Change in other assets 68 60 20 (1) 32 EBITDA margin 20.9 24.3 26.1 27.9 29.5
Investment cash f lo w (745) (608) (804) (1,051) (1,258) Core net profit margin 11.6 14.7 17.0 18.4 19.8
ROA 10.1 12.4 14.2 15.9 17.0
Net change in debt (63) 237 (325) 20 (58) ROE 15.7 19.2 20.8 22.2 23.0
Others (684) (591) (650) (709) (893) B alance sheet rat io s
F inancing cash f lo w (747) (354) (975) (689) (951) Current ratio (X) 1.8 2.2 2.1 2.5 2.8
Quick ratio (X) 0.5 0.8 0.8 1.0 1.3
N et change in cash 314 1,375 1,135 298 1,417 Cash ratio (X) 0.5 0.8 0.8 1.0 1.3
Cash at beginning of the year 1,188 1,468 2,299 3,235 3,533 Trade & bill receivables days 57.0 52.2 52.2 54.9 56.1
Effect from foreign exchange (34) 0 (154) 0 0 Trade & bill payable days 51.4 50.4 47.5 48.5 47.4
C ash at the end o f the year 1,468 2,299 3,235 3,533 4,950 Inventory turnover days 98.7 107.2 113.0 102.5 97.0
Total debt to equity ratio (%) 15.0 16.6 11.2 9.5 7.5
2018E
2018E
2014A 2015A 2016A 2017E2018E
2014A 2015A 2016E 2017E
2014A 2015A 2016A 2017E
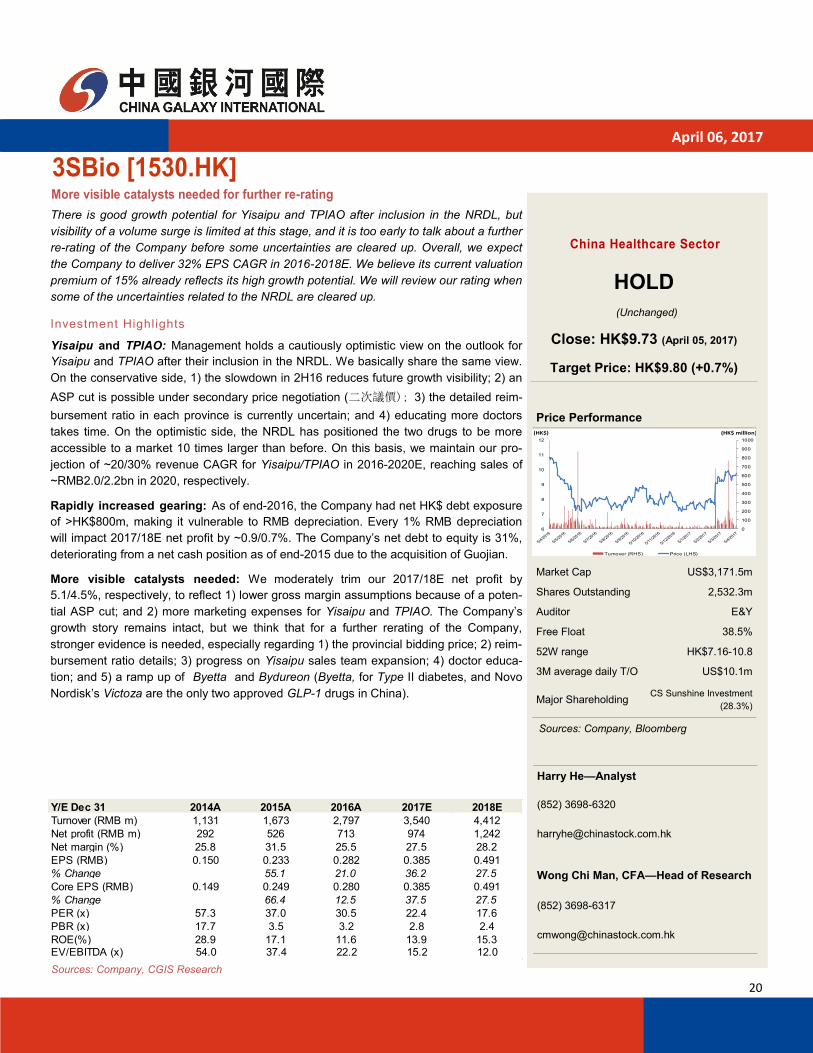
20
3SBio [1530.HK]
HOLD
(Unchanged)
Close: HK$9.73 (April 05, 2017)
Target Price: HK$9.80 (+0.7%)
Price Performance
Market Cap US$3,171.5m
Shares Outstanding 2,532.3m
Auditor E&Y
Free Float 38.5%
52W range HK$7.16-10.8
3M average daily T/O US$10.1m
Major Shareholding CS Sunshine Investment
(28.3%)
Sources: Company, Bloomberg
Harry He—Analyst
(852) 3698-6320
Wong Chi Man, CFA—Head of Research
(852) 3698-6317
Sources: Company, CGIS Research
China Healthcare Sector
There is good growth potential for Yisaipu and TPIAO after inclusion in the NRDL, but
visibility of a volume surge is limited at this stage, and it is too early to talk about a further
re-rating of the Company before some uncertainties are cleared up. Overall, we expect
the Company to deliver 32% EPS CAGR in 2016-2018E. We believe its current valuation
premium of 15% already reflects its high growth potential. We will review our rating when
some of the uncertainties related to the NRDL are cleared up.
Investment Highlights
Yisaipu and TPIAO: Management holds a cautiously optimistic view on the outlook for
Yisaipu and TPIAO after their inclusion in the NRDL. We basically share the same view.
On the conservative side, 1) the slowdown in 2H16 reduces future growth visibility; 2) an
ASP cut is possible under secondary price negotiation (二次議價); 3) the detailed reim-
bursement ratio in each province is currently uncertain; and 4) educating more doctors
takes time. On the optimistic side, the NRDL has positioned the two drugs to be more
accessible to a market 10 times larger than before. On this basis, we maintain our pro-
jection of ~20/30% revenue CAGR for Yisaipu/TPIAO in 2016-2020E, reaching sales of
~RMB2.0/2.2bn in 2020, respectively.
Rapidly increased gearing: As of end-2016, the Company had net HK$ debt exposure
of >HK$800m, making it vulnerable to RMB depreciation. Every 1% RMB depreciation
will impact 2017/18E net profit by ~0.9/0.7%. The Company’s net debt to equity is 31%,
deteriorating from a net cash position as of end-2015 due to the acquisition of Guojian.
More visible catalysts needed: We moderately trim our 2017/18E net profit by
5.1/4.5%, respectively, to reflect 1) lower gross margin assumptions because of a poten-
tial ASP cut; and 2) more marketing expenses for Yisaipu and TPIAO. The Company’s
growth story remains intact, but we think that for a further rerating of the Company,
stronger evidence is needed, especially regarding 1) the provincial bidding price; 2) reim-
bursement ratio details; 3) progress on Yisaipu sales team expansion; 4) doctor educa-
tion; and 5) a ramp up of Byetta and Bydureon (Byetta, for Type II diabetes, and Novo
Nordisk’s Victoza are the only two approved GLP-1 drugs in China).
More visible catalysts needed for further re-rating
Y/E Dec 31 2014A 2015A 2016A 2017E 2018E
Turnover (RMB m) 1,131 1,673 2,797 3,540 4,412
Net profit (RMB m) 292 526 713 974 1,242
Net margin (%) 25.8 31.5 25.5 27.5 28.2
EPS (RMB) 0.150 0.233 0.282 0.385 0.491
% Change 55.1 21.0 36.2 27.5
Core EPS (RMB) 0.149 0.249 0.280 0.385 0.491
% Change 66.4 12.5 37.5 27.5
PER (x) 57.3 37.0 30.5 22.4 17.6
PBR (x) 17.7 3.5 3.2 2.8 2.4
ROE(%) 28.9 17.1 11.6 13.9 15.3EV/EBITDA (x) 54.0 37.4 22.2 15.2 12.0
0
100
200
300
400
500
600
700
800
900
1000
6
7
8
9
10
11
12
(HK$ million)(HK$)
Turnover (RHS) Price (LHS)
April 06, 2017

21
Source: Company data, CGIS Research estimates
Important notes:
(1):Yisaipu started being consolidated in 4/2016.
(2): Zhejiang Wansheng started being consolidated in 8/2015.
(3): Core net profit is adjusted for one-off items each year. Adjustments for 2016 include i) an RMB21m of gain on the disposal of available-for-sale
investments; ii) an RMB6m fair value gain on the revaluation of an investment in an associate; iii) an RMB67m of gain on the deemed disposal of an
investment in an associate; and iv) advisory fees of RMB85.7m incurred for the acquisition of Guojian and the exclusive license agreement with Astra-
Zeneca. All one-off items are added back net of tax using a 15% tax rate.
(4) EBITDA is calculated as operating profit + D&A
Key financials
B alance Sheet P ro f it and Lo ss
Year ended D ec 31 Year ended D ec 31
(R M B m) (R M B m)
Cash & cash equivalents 164 1,900 1,040 747 1,567 Yisaipu (1) - - 786 1,064 1,330
Inventories 100 134 262 330 409 TPIAO 445 605 765 979 1,371
Trade & note receivables 348 550 786 991 1,235 EPIAO 594 684 677 711 747
Others 331 179 153 153 153 SEPO - 44 96 172 275
C urrent assets 943 2,763 2,241 2,221 3,365 Byetta - - - 117 152
PP&E 374 450 1,763 1,798 1,814 Bydureon - - - - 15
Intangible assets 406 498 2,289 2,594 2,559 Zhejiang Wansheng (2) - 103 223 234 246
Goodwill 231 561 4,126 4,126 4,126 Others 92 238 250 263 276
Others 354 2,359 621 612 604 R evenue 1,131 1,673 2,797 3,540 4,412
N o n-current assets 1,364 3,867 8,798 9,130 9,103 Cost o f goods so ld (87) (242) (402) (522) (667)
Gro ss pro f it 1,043 1,431 2,395 3,018 3,745
T o tal assets 2,306 6,630 11,039 11,351 12,468 Other gains / (losses) 12 8 59 69 82
Selling expense (431) (586) (1,017) (1,274) (1,588)
Trade and bills payables 26 34 59 78 100 Admin & other expenses (171) (301) (301) (255) (318)
Other payables 526 310 502 567 604 R&D expenses (96) (111) (243) (301) (375)
ST borrowings 617 405 518 500 500 Operat ing pro f it 357 441 893 1,256 1,546
Others 83 23 64 64 64 Net interest income / (expense) (5) 7 (124) (87) (58)
C urrent liabilit ies 1,252 773 1,144 1,210 1,269 Share of results o f JV & associates (1) 4 (12) (9) (8)
Non-operating items 10 136 93 0 0
LT borrowings 0 0 2,541 1,800 1,600 Pretax income 360 588 850 1,161 1,480
Others 111 222 588 588 588 Income taxes (68) (62) (136) (174) (222)
Lo ng-term liabilit ies 111 222 3,129 2,388 2,188 Non-contro lling interests 0 (0) 2 13 16
Net profit 292 526 713 974 1,242
T o tal liabilit ies 1,363 995 4,272 3,598 3,457 C o re net pro f it ( 3 )290 561 706 974 1,242
Shareholders' equity 932 5,624 6,522 7,496 8,739 EBITDA (4)391 519 1,054 1,516 1,824
M inority interests 11 11 244 256 272 Basic EPS (RM B) 0.150 0.233 0.282 0.385 0.491
T o tal equity 944 5,635 6,766 7,753 9,011 Fully diluted EPS (RM B) 0.150 0.229 0.278 0.379 0.483
Basic core EPS (RM B) 0.149 0.249 0.280 0.385 0.491
Fully diluted core EPS (RM B) 0.149 0.244 0.275 0.379 0.483
Dividend (RM B) 0.004 0.000 0.000 0.000 0.000
2018E2014A 2015A 2016A 2017E 2018E2014A 2015A 2016A 2017E

22
Source: Company data, CGIS Research estimates
Key financials (Cont.)
C ash F lo w Key R atio s
Year ended D ec 31 2014A 2015A 2016E 2017E 2018E Year ended D ec 31 2014A 2015A 2016A 2017E 2018E
(R M B m) Gro wth (% Yo Y)
Profit before tax 360 588 850 1,161 1,480 Sales 48.0 67.2 26.6 24.6
Depreciation & amortization 33 77 161 260 279 Operating profit 23.6 102.3 40.7 23.0
Change in working cap. 26 (59) 492 (189) (264) EBITDA 32.8 103.2 43.9 20.3
Income tax paid (133) (66) 55 (174) (222) Core net profit 93.4 25.9 37.9 27.5
Others 101 (85) (554) 96 66 Basic EPS 55.1 21.0 36.2 27.5
Operat ing cash f lo w 387 455 1,004 1,153 1,338 Core basic EPS 66.4 12.5 37.5 27.5
P ro fitability (%)
CAPEX (398) (896) (5,186) (600) (260) Gross margin 92.3 85.5 85.6 85.3 84.9
Change in other assets 109 (2,352) 1,053 10 30 Operating margin 31.6 26.4 31.9 35.5 35.0
Investment cash f lo w (289) (3,248) (4,133) (590) (230) EBITDA margin 34.5 31.0 37.7 42.8 41.3
Core net profit margin 25.6 33.5 25.2 27.5 28.2
Issuance of shares 0 3,954 0 0 0 ROA 16.2 12.5 8.0 8.7 10.4
Net change in debt 589 (282) 2,654 (759) (200) ROE 28.9 17.1 11.6 13.9 15.3
Others (840) 197 (148) (97) (88) B alance sheet rat io s
F inancing cash f lo w (250) 3,868 2,506 (856) (288) Current ratio (X) 0.8 3.6 2.0 1.8 2.7
Quick ratio (X) 0.3 2.5 0.6 0.3 1.0
N et change in cash (153) 1,075 (622) (293) 820 Cash ratio (X) 0.1 1.7 0.6 0.3 1.0
Cash at beginning of the year 268 108 1,299 678 384 Trade & bill receivables days 94 100 89 102 107
Effect from foreign exchange (8) 116 0 0 0 Trade & bill payable days 43 40 32 42 44
C ash at the end o f the year 108 1,299 678 384 1,205 Inventory turnover days 315 177 180 207 202
Total debt to equity ratio (%) 66 7 47 31 24

23
China Medical System [867.HK]
HOLD
(Unchanged)
Close: HK$14.46 (April 05, 2017)
Target Price: HK$13.62 (-5.8%)
Price Performance
Market Cap US$4,629.4m
Shares Outstanding 2,487.2m
Auditor Deloitte
Free Float 49.7%
52W range HK$10.1-14.46
3M average daily T/O US$8.0m
Major Shareholding Lam Kong (46.04%)
Sources: Company, Bloomberg
Harry He—Analyst
(852) 3698-6320
Wong Chi Man, CFA—Head of Research
(852) 3698-6317
Sources: Company, CGIS Research
China Healthcare Sector
CMS gave some positive surprises to investors by stopping Plendil’s revenue downtrend at
the terminal level and delivering solid 2H16 performance for some key products. With existing
products beginning to slow down due to industry-wide ASP cuts, maturity and a high base,
new products are the key to CMS’s sustainable growth. A more significant re-rating will de-
pend on 1) the introduction of visible compelling new products; and 2) a clearer picture on
Plendil after its inclusion in CMS’s portfolio.
Investment thesis
Plendil: Although 2016 shipments (CMS’s reported revenue) recorded a YoY decline, partly
affected by AstraZeneca's extra channel inventory before the handover to CMS, Plendil actu-
ally delivered flat revenue YoY at the terminal level (on an apple to apple basis), which
stopped the declining trend under AstraZeneca and illustrated CMS’ good execution. Going
forward, we hold a cautiously optimistic view. On the cautious side, 1) we have seen CCB’s
(鈣拮抗劑)market share in hypertension drugs continue to decline from ~40% in 2009 to the
current ~33%, and the market is leaning more to new drugs, such as ACEI (血管紧张素转化
酶抑制剂) and ARB (血管紧张素II受体拮抗剂);2) compared with its direct competitor am-
lodipine (氨氯地平), whose half-life is 35-50 hours, Plendil’s is ~12 hours, which means
Plendil may not be able to stably control a patient’s blood pressure for a 24-hour period, as it
is taken only once a day; and 3) its maturity and high base, with revenue >RMB1bn. On the
positive side, we note 1) CMS’s expertise with good execution of managing drugs with sales
of over RMB1bn; 2) Plendil has been available in China since 1995 and is widely accepted by
doctors and patients; 3) Plendil is in classified as Class II (醫保乙類), while its direct competi-
tor Amlodipine sustained-release is not; and 4) Plendil produces relatively fewer sympathetic
excitation (交感神經興奮) side effects compared with its direct competitor nifedipine (硝苯地
平). In summary, in the medium term, we continue to expect Plendil to deliver mid-to-high
single-digit growth. We expect faster low-teen growth in 2017, as 2016 shipments were im-
pacted by channel inventory and miscellaneous first-year handover work. With channel inven-
tory normalized, 2017 shipments should reflect normal terminal sales.
Existing products: Deanxit was affected by Guangdong tendering in 2016 and reported slow
growth of +1.5% YoY. With Guangdong starting to differentiate quality levels in tendering, we
expect Deanxit to resume high single-digit growth in 2017. Strong performance by Ursofalk,
XinHuoSu and Salofalk of >20% YoY growth in 2H16 once again proved CMS’s strong aca-
demic promotion capability given a tough industry environment. Overall, we maintain our posi-
tive view on its existing products, but with the influence of industry-wide tender ASP cuts,
maturity and the large revenue base of the products, we expect to see a gradually slower
growth pace. Growth drivers for CMS would be a ramp-up of 2015 newly acquired products
(DanShenTong Capsules, NuoDiKang Capsules, Hirudoid, Combizym , Lamisil® Tablet, Par-
lodel® Tablets and MOVICOL®) and the introduction of more new products.
Good execution, more new products needed for further upside
Y/E Dec 31 2014A 2015A 2016A 2017E 2018E
Turnover (RMB m) 2,945 3,553 4,901 6,004 7,079
Net profit (RMBm) 1,046 996 1,376 1,673 1,970
Core net profit (RMB m)* 833 997 1,396 1,673 1,970
Core net margin (%) 28.9 28.1 28.5 27.6 27.5
Core EPS (RMB) 0.352 0.404 0.561 0.666 0.784
% Change 31.5 14.8 38.7 18.7 17.7
PER (x) 36.1 31.5 22.7 19.1 16.2
PBR (x) 7.9 6.0 5.1 4.4 3.7
ROE (%) 21.3 18.6 22.3 22.6 22.8
EV/EBITDA (x) 33.0 27.7 19.7 16.1 13.6
* adjusted by CGIS research
0
50
100
150
200
250
300
8
9
10
11
12
13
14
15
(HK$ million)(HK$)
Turnover (RHS) Price (LHS)
April 06, 2017

24
Key financials
Source: CGIS Research estimates
B alance Sheet P ro f it and Lo ss
A s at D ec 31 Year as o f D ec 31
(R M B m) (R M B m)
Cash & cash equivalents 453 509 482 408 989 Direct model 2,230 2,854 4,264 5,256 6,218
Inventories 189 385 509 625 740 Agency model 255 293 359 443 525
Accounts receivable 876 1,164 1,682 1,759 2,053 Others 459 406 278 306 336
Others 27 57 877 877 877 R evenue 2,945 3,553 4,901 6,004 7,079
C urrent assets 1,546 2,115 3,551 3,669 4,659 Cost o f goods so ld (1,291) (1,507) (1,989) (2,498) (2,958)
Property, plant and equipment 254 326 362 415 465 Gro ss pro f it 1,655 2,046 2,912 3,506 4,121
Intangible assets 441 1,026 2,886 2,870 2,842 Other gains / (losses) 240 22 (42) 58 67
Others 2,665 2,931 2,993 3,038 3,092 M arketing expenses (631) (814) (1,174) (1,441) (1,720)
N o n-current assets 3,360 4,283 6,241 6,323 6,398 Admin expenses (152) (193) (222) (300) (354)
Operat ing pro f it 1,112 1,061 1,474 1,823 2,113
T o tal assets 4,905 6,398 9,792 9,992 11,057 Net interest income / (expense) 18 (14) (23) (60) (39)
JV, associate and others (1) 17 49 46 56
Accounts payable 253 393 579 602 712 Pretax income 1,130 1,064 1,500 1,809 2,130
ST borrowings 484 464 1,612 1,828 1,539 Income taxes (87) (68) (123) (145) (170)
Others 52 47 1,205 122 122 Non-contro lling interests (3) 1 2 (9) (10)
C urrent liabilit ies 789 903 3,396 2,551 2,373 N et pro f it 1,046 996 1,376 1,673 1,970
Non-recurring items 213 (1) (20) 0 0
Long-term debts 0 0 0 0 1 C o re net pro f it 833 997 1,396 1,673 1,970
Others 126 142 128 129 134 EBIT 905 1,061 1,491 1,840 2,134
Lo ng-term liabilit ies 126 142 128 129 134 EBITDA 947 1,138 1,667 2,082 2,393
T o tal liabilit ies 914 1,045 3,524 2,680 2,507 EPS (RM B) 0.433 0.404 0.553 0.666 0.784
C o re EP S (R M B ) 0.352 0.404 0.561 0.666 0.784
Shareholders' equity 3,991 5,296 6,209 7,244 8,473 DPS (RM B) 0.1371 0.1603 0.2216 0.2663 0.3135
M inority interests 0 56 58 67 77 Payout 31.7% 39.7% 40.1% 40.0% 40.0%
T o tal equity 3,991 5,352 6,268 7,311 8,550
C ash F lo w Key R at io s
Year ended D ec 31 Year to D ec 31 2014A 2015A 2016A 2017E 2018E
(R M B m) Gro wth (% Yo Y)
Profit before tax 1,130 1,064 1,500 1,809 2,130 Sales 31.0 20.7 37.9 22.5 17.9
Depr & amortization 42 78 176 242 259 EBIT 36.5 15.5 40.5 21.7 15.9
Change in working cap. (34) (424) (456) (170) (298) EBITDA 35.5 18.5 46.4 23.3 14.9
Income tax paid (67) (107) (124) (143) (165) Core net profit 31.5 17.3 39.9 18.7 17.7
Others (227) 4 (28) 15 (15) Core EPS 31.5 14.8 38.7 18.7 17.7
Operat ing cash f lo w 843 615 1,068 1,753 1,910
P ro f itability (%)
Capex (288) (529) (1,228) (280) (280) Gross margin 56.2 57.6 59.4 58.4 58.2
Change in other assets (648) (323) (233) (1,068) 24 EBIT margin 31.2 29.9 30.4 30.2 29.7
Investment cash f lo w (936) (853) (1,461) (1,348) (256) EBITDA margin 32.6 32.1 34.0 34.2 33.4
Core net profit margin 28.9 28.1 28.5 27.6 27.5
Net change in debt 170 (58) 1,148 215 (289) ROA 17.3 15.6 14.2 16.6 17.6
Others (320) 278 (504) (695) (784) ROE 21.3 18.6 22.3 22.6 22.8
F inancing cash f lo w (150) 220 644 (480) (1,073) B alance sheet rat io s
Current ratio (X) 2.0 2.3 1.0 1.4 2.0
N et change in cash (243) (18) 251 (75) 581 Quick ratio (X) 1.7 1.9 0.9 1.2 1.7
Cash Beg. 488 244 229 482 408 Cash ratio (X) 0.6 0.6 0.1 0.2 0.4
Effect o f foreign exchange rate changes (1) 4 2 0 0 Trade & bill receivables days 108 105 106 105 98
Cash End. 244 229 482 408 989 Trade & bill payable days 70 78 89 86 81
Inventory turnover days 50 70 82 83 84
Total debt to equity ratio (%) 12.1 8.8 26.0 25.2 18.2
Net debt / (cash) to equity (%) 0.8 (0.8) 18.2 19.6 6.5
2018E2018E
2018E
2014A 2015A 2016A 2017E
2014A 2015A 2016A 2017E
2014A 2015A 2016A 2017E

25
The United Laboratories [3933.HK]
HOLD
(Unchanged)
Close: HK$5.15 (April 05, 2017)
Target Price: HK$4.93 (-4.3%)
Price Performance
Market Cap US$1078.4m
Shares Outstanding 1,626.9m
Auditor Deloitte
Free Float 32.1%
52W range HK$2.94-5.51
3M average daily T/O US$3.15m
Major Shareholding Ms Ning Kwai Chun
(61.85%)
Sources: Company, Bloomberg
Harry He—Analyst
(852) 3698-6320
Wong Chi Man, CFA—Head of Research
(852) 3698-6317
Sources: Company, CGIS Research estimate
China Healthcare Sector We believe management’s upbeat 2017 2nd generation insulin sales guidance, optimistic
attitude on the newly approved 3rd generation insulin, memantine hydrochloride (鹽酸美金
剛,for Alzheimer’s (阿茲海默癥)), and the 6-APA price trend in 2017 show TUL is on track
to stage a strong recovery this year. Our views on the intermediates turnaround and positives
on the insulin ramp-up remain intact. We are positive on its fundamentals but maintain HOLD
on valuation.
Investment thesis
Strong growth of 2nd generation insulin to continue in 2017: Second-generation insulin
reported sales of HK$535m, missing the Company’s target of HK$600m, primarily due to
RMB depreciation. However, volume growth was solid, up 56% YoY to 11.1m vials. Manage-
ment targeted 50% YoY growth (volume >15m vials) for 2nd generation insulin in 2017. Given
1) 2nd generation insulin was upgraded from catalogue II (乙類) to catalogue I (甲類) in the
2017 version of the NRDL; and 2) expected new tenders from Heilongjiang, Jiangsu, etc., we
believe the 50% YoY growth target looks achievable at this stage. The insulin business had a
net margin of 16% in 2016, and management expects continued margin improvement from
economies of scale. In 2017, we expect insulin to contribute ~10% of total revenue and 14%
of total operating profit.
Intermediates and bulk medicines: Management expects the 6-APA price to be stable in
2017 because more stringent environmental regulations are expected. We basically share
the same view, since 6-APA capacity of Huabei Pharmaceutical and Harbin Pharmaceutical
has faded out, and they are unlikely to resume production again. If 6-APA remains at
RMB160-170/kg (including 17% VAT), we project that TUL’s intermediates and bulk medi-
cines will achieve a segment margin of ~5%, contributing 9/14% of total operating profit in
2017/2018, respectively.
Strong insulin growth potential; 2017/18 recovery remains intact
Y/E Dec 31 2014A 2015A 2016A 2017E 2018E
Turnover (HK$ m) 8,030 7,694 7,063 7,351 7,822
Net profit (HK$ m) 681 110 (311) 410 513
Core net profit (HK$ m) 554 314 (59) 410 513
Core net margin (%) 6.9 4.1 (0.8) 5.6 6.6
Core EPS (HK$) 0.341 0.193 (0.036) 0.252 0.315
% Change 37 (43) (119) n.a 25
PER (x) 15.1 26.6 n.a 20.4 16.3
PBR (x) 1.20 1.24 1.40 1.31 1.21
Core ROE(%) 8.2 4.6 -0.9 6.6 7.7
EV/EBITDA (x) 7.1 8.4 11.5 6.3 5.4
April 06, 2017
0
20
40
60
80
100
120
140
160
2
3
4
5
6
(HK$ million)(HK$)
Turnover (RHS) Price (LHS)

26
Key financials
Source: Company, CGIS Research estimates
B alance Sheet P ro f it and Lo ss
A s at D ec 31 Year ended D ec 31
(H K$ m) (H K$ m)
Cash & cash equivalents 1,003 1,115 1,983 2,712 3,210 Intermediates 1,357 1,680 1,435 1,654 1,657
Inventories 1,418 1,415 1,072 1,307 1,334 Bulk medicines 3,940 3,272 2,871 2,643 2,677
Accounts receivable 2,982 2,195 2,180 2,400 2,538 Finished products 2,732 2,742 2,757 3,054 3,488
Others 1,221 1,036 1,167 1,098 1,055 R evenue 8,030 7,694 7,063 7,351 7,822
C urrent assets 6,624 5,761 6,402 7,517 8,138 Cost o f goods so ld (4,801) (4,733) (4,546) (4,392) (4,634)
Property, plant and equipment 9,617 9,264 8,201 7,854 7,381 Gro ss pro f it 3,228 2,961 2,517 2,959 3,187
Investment properties 1,634 1,483 1,262 1,262 1,262 M arketing expenses (1,252) (1,290) (1,236) (1,254) (1,321)
Intangible assets 55 96 160 196 230 R&D expenses (148) (73) (86) (104) (107)
Others 989 805 644 636 629 Admin & other expenses (858) (864) (808) (837) (878)
N o n-current assets 12,294 11,647 10,267 9,948 9,502 Operat ing pro f it 970 734 387 765 882
Other gains / (losses) 86 55 (39) 31 31
T o tal assets 18,918 17,408 16,669 17,465 17,640 Net interest income / (expense) (340) (306) (249) (270) (255)
Non-operating items (52) (248) (253) 0 0
Accounts payable 3,570 3,295 3,320 3,382 3,259 Pretax income 664 235 (155) 525 658
ST borrowings 4,558 4,110 3,614 4,034 3,862 Income taxes 18 (125) (157) (116) (145)
Others 786 1,053 546 546 546 N et pro f it 681 110 (311) 410 513
C urrent liabilit ies 8,914 8,458 7,479 7,962 7,667
Long-term debts 1,335 913 1,105 1,009 965 C o re net pro f it 554 314 (59) 410 513
Others 1,700 1,319 2,112 2,112 2,112
Lo ng-term liabilit ies 3,035 2,231 3,217 3,120 3,077 EBIT 1,004 541 95 795 912
EBITDA 1,717 1,363 926 1,655 1,798
T o tal liabilit ies 11,949 10,689 10,696 11,082 10,744
EPS (HK$) 0.419 0.068 -0.191 0.252 0.315
Shareholders' equity 6,969 6,719 5,973 6,383 6,896 C o re EP S (H K$ ) 0.341 0.193 -0.036 0.252 0.315
T o tal equity 6,969 6,719 5,973 6,383 6,896 DPS (HK$) 0.000 0.000 0.000 0.000 0.000
B VP S(H K$ ) 4.28 4.13 3.67 3.92 4.24
C ash F lo w Key R at io s
Year ended D ec 31 2014A 2015A 2016E 2017E 2018E Year ended D ec 31 2014A 2015A 2016A 2017E 2018E
(H K$ m) Gro wth (% Yo Y)
Profit before tax 664 235 (155) 525 658 Sales 5.0 (4.2) (8.2) 4.1 6.4
Depr & amortization 713 821 832 859 886 Operating profit 46.8 (25.3) (56.0) 97.7 15.3
Change in working cap. 168 431 383 (392) (288) EBITDA 3.8 (20.6) (32.0) 78.7 8.6
Income tax paid (170) (166) (157) (116) (145) Core net profit 37.3 (43.4) (118.7) n.a 25.2
Others 376 488 249 270 255 Core EPS 37.3 (43.4) (118.7) n.a 25.2
Operat ing cash f lo w 1,750 1,810 1,153 1,147 1,365 P ro f itability (%)
Gross margin 40.2 38.5 35.6 40.3 40.8
Capex (692) (723) (449) (500) (400) Operating margin 13.2 10.3 4.9 10.4 11.3
Others (374) 348 (177) 61 40 EBITDA margin 21.4 17.7 13.1 22.5 23.0
Investment cash f lo w (1,066) (375) (625) (439) (360) Core net profit margin 6.9 4.1 (0.8) 5.6 6.6
ROA 2.9 1.7 (0.3) 2.4 2.9
Net change in debt (409) (733) (421) 324 (215) ROE (core) 8.2 4.6 (0.9) 6.6 7.7
Others (336) (545) 761 (302) (292) B alance sheet rat io s
F inancing cash f lo w (745) (1,278) 341 22 (507) Current ratio (X) 0.7 0.7 0.9 0.9 1.1
Quick ratio (X) 0.3 0.3 0.4 0.5 0.6
N et change in cash (61) 156 868 730 498 Cash ratio (X) 0.1 0.2 0.3 0.4 0.5
Cash at beginning of the year 1,081 1,003 1,115 1,983 2,712 Trade & bill receivables days 121.6 108.7 102.4 103.2 106.4
Effect from foreign exchange (17) (45) 0 0 0 Trade & bill payable days 85.9 90.6 89.5 86.8 92.1
C ash at the end o f the year 1,003 1,115 1,983 2,712 3,210 Inventory turnover days 102.2 109.2 99.8 103.0 115.6
Total debt to equity ratio (%) 0.86 0.76 0.90 0.89 0.80
2014A 2015A 2016A 2017E 2018E2018E 2014A 2015A 2016A 2017E

27
Disclaimer
This research report is not directed at, or intended for distribution to or used by, any person or entity who is a citizen or resident of or located in any jurisdiction where such distribution, publication, availability or use would be contrary to applicable law or regulation or which would subject China Galaxy International Securities (Hong Kong) Co., Limited (“Galaxy International Securities”) and/or its group companies to any registration or licensing requirement within such jurisdiction.
This report (including any information attached) is issued by Galaxy International Securities, one of the subsidiaries of the China Galaxy International Financial Holdings Limited, to the institutional clients from the information sources believed to be reliable, but no representation or warranty (expressly or implied) is made as to their accuracy, correctness and/or completeness.
This report shall not be construed as an offer, invitation or solicitation to buy or sell any securities of the company(ies) referred to herein. Past perfor-mance should not be taken as an indication or guarantee of future performance, and no representation or warranty, express or implied, is made regard-ing future performance. The recipient of this report should understand and comprehend the investment objectives and its related risks, and where necessary consult their own independent financial advisers prior to any investment decision.
Where any part of the information, opinions or estimates contained herein reflects the personal views and opinions of the analyst who prepared this report, such views and opinions may not correspond to the published views or investment decisions of China Galaxy International Financial Holdings Limited and any of its subsidiaries (“China Galaxy International”), directors, officers, agents and employees (“the Relevant Parties”).
All opinions and estimates reflect the judgment of the analyst on the date of this report and are subject to change without notice. China Galaxy Interna-tional and/or the Relevant Parties hereby disclaim any of their liabilities arising from the inaccuracy, incorrectness and incompleteness of this report and its attachment/s and/or any action or omission made in reliance thereof. Accordingly, this report must be read in conjunction with this disclaimer.
Disclosure of Interests
China Galaxy Securities (6881.hk) is the direct and/or indirect holding company of the group of companies under China Galaxy International.
China Galaxy International may have financial interests in relation to the subjected company(ies) the securities in respect of which are reviewed in this report, and such interests aggregate to an amount may equal to or more than 1 % of the subjected company(ies)’ market capitalization.
One or more directors, officers and/or employees of China Galaxy International may be a director or officer of the securities of the company(ies) men-tioned in this report.
China Galaxy International and the Relevant Parties may, to the extent permitted by law, from time to time participate or invest in financing transac-tions with the securities of the company(ies) mentioned in this report, perform services for or solicit business from such company(ies), and/or have a position or holding, or other material interest, or effect transactions, in such securities or options thereon, or other investments related thereto.
China Galaxy International may have served as manager or co-manager of a public offering of securities for, or currently may make a primary market in issues of, any or all of the entities mentioned in this report or may be providing, or have provided within the last 12 months, significant advice or invest-ment services in relation to the investment concerned or a related investment or investment banking services to the company(ies) mentioned in this report.
Furthermore, China Galaxy International may have received compensation for investment banking services from the company(ies) mentioned in this report within the preceding 12 months and may currently seeking investment banking mandate from the subject company(ies).
Analyst Certification
The analyst who is primarily responsible for the content of this report, in whole or in part, certifies that with respect to the securities or issuer covered in this report: (1) all of the views expressed accurately reflect his or her personal views about the subject, securities or issuer; and (2) no part of his or her compensation was, is, or will be, directly or indirectly, related to the specific views expressed by the analyst in this report.
Besides, the analyst confirms that neither the analyst nor his/her associates (as defined in the code of conduct issued by The Hong Kong Securities and Futures Commission) (1) have dealt in or traded in the securities covered in this research report within 30 calendar days prior to the date of issue of this report; (2) will deal in or trade in the securities covered in this research report three business days after the date of issue of this report; (3) serve as an officer of any of the Hong Kong-listed companies covered in this report; and (4) have any financial interests in the Hong Kong-listed companies cov-ered in this report.
Explanation on Equity Ratings
Copyright Reserved
No part of this material may be reproduced or redistributed without the prior written consent of China Galaxy International Securities (Hong Kong) Co., Limited.
China Galaxy International Securities (Hong Kong) Co. Limited, CE No.AXM459
Room 3501-3507, 35/F, Cosco Tower, Grand Millennium Plaza, 183 Queen’s Road Central, Sheung Wan, Hong Kong. General line: 3698-6888.
BUY share price will increase by >20% within 12 months in absolute terms :
SELL share price will decrease by >20% within 12 months in absolute terms :
HOLD no clear catalyst, and downgraded from BUY pending clearer signal to reinstate BUY or further downgrade to outright SELL :


![Yum Cha 飲 茶 - chinastock.com.hk · 2 Kingdee International [0268.HK] Kingdee International (Kingdee) reported a satisfactory set of 1H 2016 results. Its 20.5% top-line growth](https://static.fdocuments.net/doc/165x107/5f0850d57e708231d4216792/yum-cha-e-eoe-2-kingdee-international-0268hk-kingdee-international-kingdee.jpg)
![Yum Cha 飲 茶€¦ · valued at US$10bn. Ping An Insurance [2318.HK; BUY], as the major shareholder of Lufax, will definitely be the key beneficiary. As of end-2014, Ping An owned](https://static.fdocuments.net/doc/165x107/5fc780a2f623e4271a58ef35/yum-cha-e-eoe-valued-at-us10bn-ping-an-insurance-2318hk-buy-as-the-major.jpg)


