YUE YUEN INDUSTRIAL (HOLDINGS) LIMITED 裕元...
30
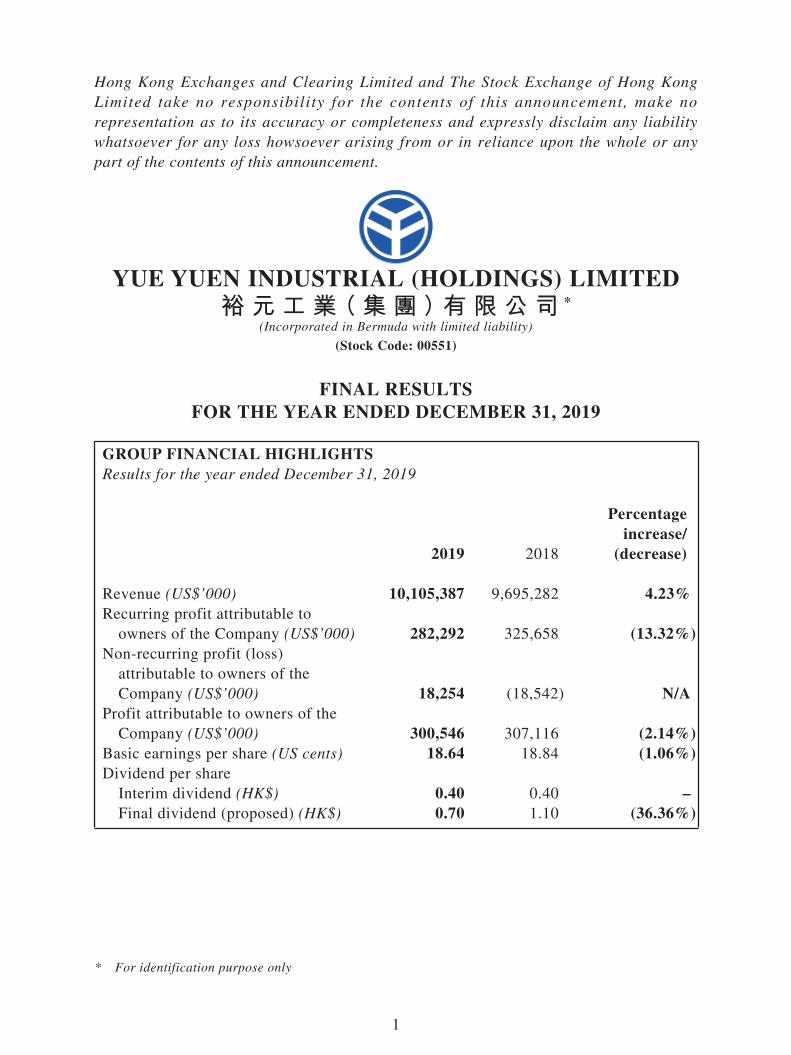
1 Hong Kong Exchanges and Clearing Limited and The Stock Exchange of Hong Kong Limited take no responsibility for the contents of this announcement, make no representation as to its accuracy or completeness and expressly disclaim any liability whatsoever for any loss howsoever arising from or in reliance upon the whole or any part of the contents of this announcement. YUE YUEN INDUSTRIAL (HOLDINGS) LIMITED 裕 元 工 業(集 團)有 限 公 司 * (Incorporated in Bermuda with limited liability) (Stock Code: 00551) FINAL RESULTS FOR THE YEAR ENDED DECEMBER 31, 2019 GROUP FINANCIAL HIGHLIGHTS Results for the year ended December 31, 2019 2019 2018 Percentage increase/ (decrease) Revenue (US$’000) 10,105,387 9,695,282 4.23% Recurring profit attributable to owners of the Company (US$’000) 282,292 325,658 (13.32%) Non-recurring profit (loss) attributable to owners of the Company (US$’000) 18,254 (18,542) N/A Profit attributable to owners of the Company (US$’000) 300,546 307,116 (2.14%) Basic earnings per share (US cents) 18.64 18.84 (1.06%) Dividend per share Interim dividend (HK$) 0.40 0.40 – Final dividend (proposed) (HK$) 0.70 1.10 (36.36%) * For identification purpose only
Transcript of YUE YUEN INDUSTRIAL (HOLDINGS) LIMITED 裕元...
1
Hong Kong Exchanges and Clearing Limited and The Stock Exchange of Hong Kong Limited take no responsibility for the contents of this announcement, make no representation as to its accuracy or completeness and expressly disclaim any liability whatsoever for any loss howsoever arising from or in reliance upon the whole or any part of the contents of this announcement.
YUE YUEN INDUSTRIAL (HOLDINGS) LIMITED裕元工業(集團)有限公司 *
(Incorporated in Bermuda with limited liability)
(Stock Code: 00551)
FINAL RESULTSFOR THE YEAR ENDED DECEMBER 31, 2019
GROUP FINANCIAL HIGHLIGHTSResults for the year ended December 31, 2019
2019 2018
Percentage increase/
(decrease)
Revenue (US$’000) 10,105,387 9,695,282 4.23%Recurring profit attributable to
owners of the Company (US$’000) 282,292 325,658 (13.32%)Non-recurring profit (loss)
attributable to owners of the Company (US$’000) 18,254 (18,542) N/A
Profit attributable to owners of the Company (US$’000) 300,546 307,116 (2.14%)
Basic earnings per share (US cents) 18.64 18.84 (1.06%)Dividend per share
Interim dividend (HK$) 0.40 0.40 –Final dividend (proposed) (HK$) 0.70 1.10 (36.36%)
* For identification purpose only

2
RESULTS
The directors (the “Directors”) of Yue Yuen Industrial (Holdings) Limited (the “Company”) are pleased to announce the audited consolidated financial results of the Company and its subsidiaries (collectively referred to as the “Group”) for the year ended December 31, 2019 as follows:
CONSOLIDATED INCOME STATEMENT
For the year ended December 31, 2019
2019 2018Notes US$’000 US$’000
Revenue 3 10,105,387 9,695,282Cost of sales (7,592,334) (7,249,224)
Gross profit 2,513,053 2,446,058Other income 127,313 120,856Selling and distribution expenses (1,222,129) (1,160,057)Administrative expenses (682,665) (658,291)Other expenses (264,902) (249,975)Finance costs (92,122) (80,551)Share of results of associates 26,999 12,489Share of results of joint ventures 24,996 26,991Other gains and losses 4 17,895 (17,956)
Profit before taxation 448,438 439,564Income tax expense 5 (95,438) (98,448)
Profit for the year 6 353,000 341,116
Attributable to:Owners of the Company 300,546 307,116Non-controlling interests 52,454 34,000
353,000 341,116
US cents US centsEarnings per share 8
– Basic 18.64 18.84
– Diluted 18.60 18.70
3
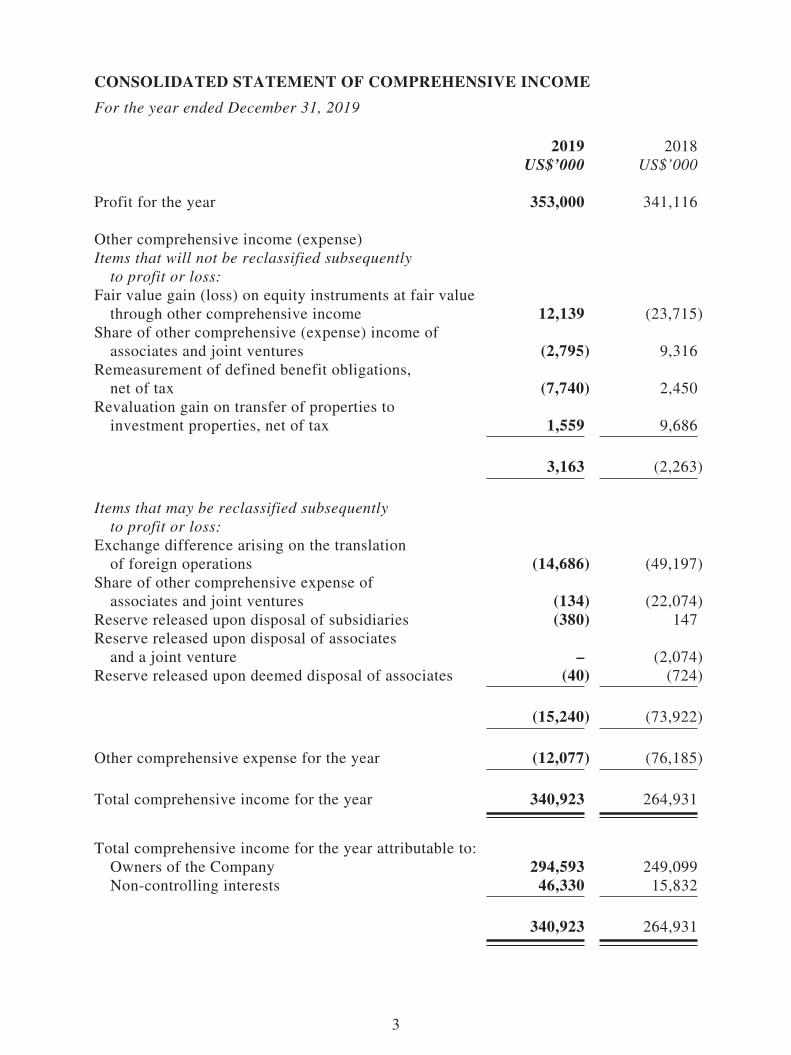
CONSOLIDATED STATEMENT OF COMPREHENSIVE INCOME
For the year ended December 31, 2019
2019 2018US$’000 US$’000
Profit for the year 353,000 341,116
Other comprehensive income (expense)Items that will not be reclassified subsequently
to profit or loss:Fair value gain (loss) on equity instruments at fair value
through other comprehensive income 12,139 (23,715)Share of other comprehensive (expense) income of
associates and joint ventures (2,795) 9,316Remeasurement of defined benefit obligations,
net of tax (7,740) 2,450Revaluation gain on transfer of properties to
investment properties, net of tax 1,559 9,686
3,163 (2,263)
Items that may be reclassified subsequently to profit or loss:
Exchange difference arising on the translation of foreign operations (14,686) (49,197)
Share of other comprehensive expense of associates and joint ventures (134) (22,074)
Reserve released upon disposal of subsidiaries (380) 147Reserve released upon disposal of associates
and a joint venture – (2,074)Reserve released upon deemed disposal of associates (40) (724)
(15,240) (73,922)
Other comprehensive expense for the year (12,077) (76,185)
Total comprehensive income for the year 340,923 264,931
Total comprehensive income for the year attributable to:Owners of the Company 294,593 249,099Non-controlling interests 46,330 15,832
340,923 264,931

4
CONSOLIDATED STATEMENT OF FINANCIAL POSITION
At December 31, 2019
2019 2018Note US$’000 US$’000
Non-current assetsInvestment properties 113,222 109,725Property, plant and equipment 2,362,234 2,351,690Right-of-use assets 580,161 –Deposits paid for acquisition of property,
plant and equipment 105,235 111,636Prepaid lease payments – 160,651Intangible assets 40,683 103,775Goodwill 261,558 273,834Interests in associates 413,966 416,525Interests in joint ventures 248,886 248,565Amount due from a joint venture – 437Equity instruments at fair value through
other comprehensive income 31,889 15,685Other financial assets at amortized cost – 6,740Financial assets at fair value through profit
or loss 36,811 19,988Rental deposits and prepayments 25,622 24,562Deferred tax assets 67,969 61,920Deferred consideration receivable 8,500 –
4,296,736 3,905,733
Current assetsInventories 1,822,845 1,774,855Trade and other receivables 9 1,603,843 1,741,464Prepaid lease payments – 4,830Equity instruments at fair value through other
comprehensive income – 4,056Other financial assets at amortized cost 6,036 1,806Financial assets at fair value through profit
or loss 19,141 20,195Taxation recoverable 12,771 11,633Restricted bank deposits 1,150 –Bank balances and cash 982,079 851,420
4,447,865 4,410,259Assets classified as held for sale 44,790 –
4,492,655 4,410,259
5
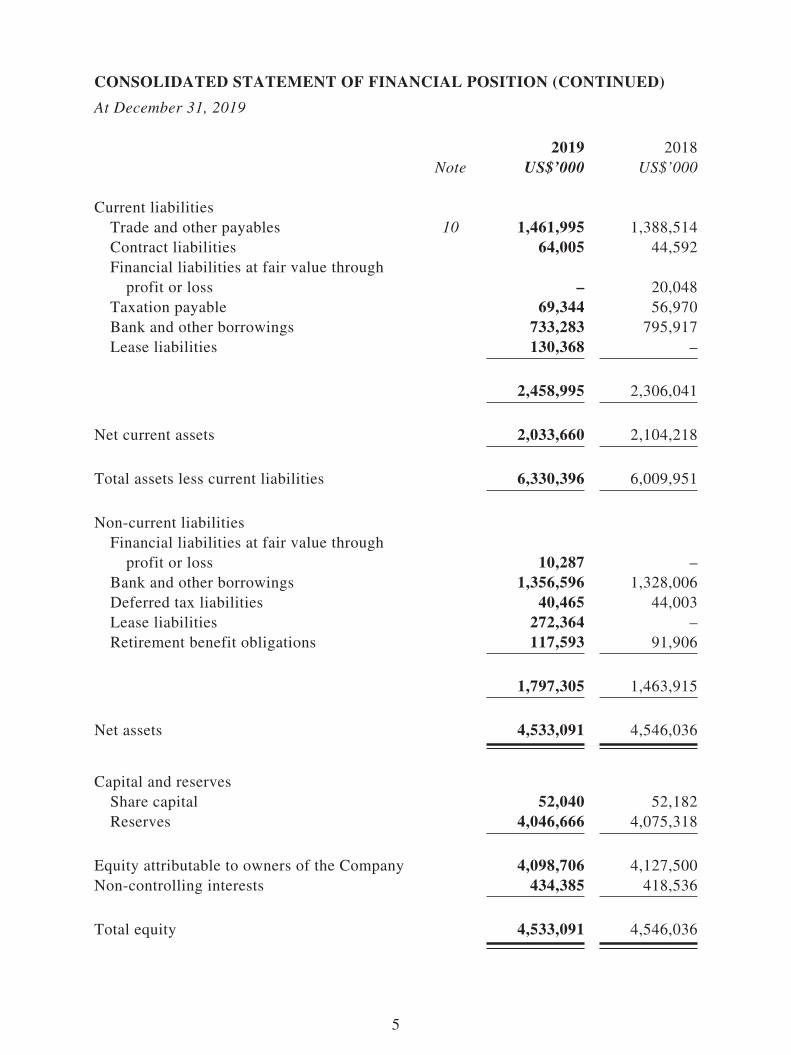
CONSOLIDATED STATEMENT OF FINANCIAL POSITION (CONTINUED)
At December 31, 2019
2019 2018Note US$’000 US$’000
Current liabilitiesTrade and other payables 10 1,461,995 1,388,514Contract liabilities 64,005 44,592Financial liabilities at fair value through
profit or loss – 20,048Taxation payable 69,344 56,970Bank and other borrowings 733,283 795,917Lease liabilities 130,368 –
2,458,995 2,306,041
Net current assets 2,033,660 2,104,218
Total assets less current liabilities 6,330,396 6,009,951
Non-current liabilitiesFinancial liabilities at fair value through
profit or loss 10,287 –Bank and other borrowings 1,356,596 1,328,006Deferred tax liabilities 40,465 44,003Lease liabilities 272,364 –Retirement benefit obligations 117,593 91,906
1,797,305 1,463,915
Net assets 4,533,091 4,546,036
Capital and reservesShare capital 52,040 52,182Reserves 4,046,666 4,075,318
Equity attributable to owners of the Company 4,098,706 4,127,500Non-controlling interests 434,385 418,536
Total equity 4,533,091 4,546,036

6
NOTES TO THE CONSOLIDATED FINANCIAL STATEMENTS:1. GENERAL
The consolidated financial statements have been prepared in accordance with Hong Kong Financial Reporting Standards issued by the Hong Kong Institute of Certified Public Accountants (“HKICPA”). In addition, the consolidated financial statements include applicable disclosures required by the Rules Governing the Listing of Securities on The Stock Exchange of Hong Kong Limited (the “Listing Rules”) and by the Hong Kong Companies Ordinance.
2. APPLICATION OF NEW AND AMENDMENTS TO HONG KONG FINANCIAL REPORTING STANDARDS (“HKFRSs”)
New and Amendments to HKFRSs that are mandatorily effective for the current year
The Group has applied the following new and amendments to HKFRSs issued by the HKICPA for the first time in the current year:
HKFRS 16 Leases
HK(IFRIC) - Int 23 Uncertainty over Income Tax Treatments
Amendments to HKFRS 9 Prepayment Features with Negative Compensation
Amendments to HKAS 19 Plan Amendment, Curtailment or Settlement
Amendments to HKAS 28 Long-term Interests in Associates and Joint Ventures
Amendments to HKFRSs Annual Improvements to HKFRSs 2015 - 2017 Cycle
Except as described below, the application of the new and amendments to HKFRSs in the current year has had no material impact on the Group’s financial position and performance for the current and prior years and/or on the disclosures set out in these consolidated financial statements.
HKFRS 16 Leases
The Group has applied HKFRS 16 for the first time in the current year. HKFRS 16 superseded HKAS 17 Leases, and the related interpretations.
The Group applied HKFRS 16 from January 1, 2019. The Group applied the modified retrospective approach and has not restated comparative amounts with the cumulative effect recognized at the date of initial application. Right-of-use assets relating to the Group’s operating leases are measured at the amount of lease liabilities on initial application by applying HKFRS 16.C8(b)(ii) transition, adjusted by the amount of any prepaid or accrued lease payments.
At January 1, 2019, leases are recognized as a right-of-use asset and a corresponding liability at the date at which the leased asset is available for use by the Group. Except for short-term leases and leases of low-value assets, the Group recognizes right-of-use assets at the commencement date of the lease (i.e. the date the underlying asset is available for use). The right-of-use assets are initially measured at cost and subsequently measured at cost less any accumulated depreciation and impairment losses, and adjusted for any remeasurement of lease liabilities; whereas the lease liability is initially measured at the present value of the lease payments that are unpaid at that date, and subsequently adjusted for the interest and lease payments, as well as the impact of lease modification, amongst others.
On transition, other than the reclassification of prepaid lease payments of US$165,481,000 and prepaid rentals of US$19,100,000, the Group recognized lease liabilities of US$309,875,000 and related right-of-use assets of US$309,875,000, at January 1, 2019.
At December 31, 2019, the lease liabilities and right-of-use assets amounted to US$402,732,000 and US$580,161,000, respectively, while depreciation associated with the right-of-use assets and finance costs associated with lease liabilities amounting US$139,369,000 and US$15,508,000, respectively, were recognized during the current year.

7
3. REVENUE AND SEGMENTAL INFORMATION
Information reported to the board of directors of the Company (the “Board”), being the chief
operating decision maker, for the purposes of resources allocation and assessment of performance,
focuses specifically on the revenue analysis by principal categories of the Group’s business. The
principal categories of the Group’s business are manufacturing and sales of footwear products
(“Manufacturing Business”) and retail and distribution of sportswear and apparel products
(“Retailing Business”). Accordingly, no segment information is presented.
The information regarding revenue derived from the principal businesses described above is
reported below:
2019 2018
US$’000 US$’000
RevenueManufacturing Business 6,000,574 5,881,493
Retailing Business 4,104,813 3,813,789
10,105,387 9,695,282
Revenue from major products
The following is an analysis of the Group’s revenue from its major products recognized in a point
in time:
2019 2018
US$’000 US$’000
Athletic shoes 4,541,560 4,267,717
Casual/outdoor shoes 906,176 1,031,020
Sports sandals 110,147 91,830
Soles, components and others 442,691 490,926
Retail sales - shoes, apparel and commissions from
concessionaire sales 3,932,965 3,421,657
Apparel wholesale 171,848 392,132
10,105,387 9,695,282
8
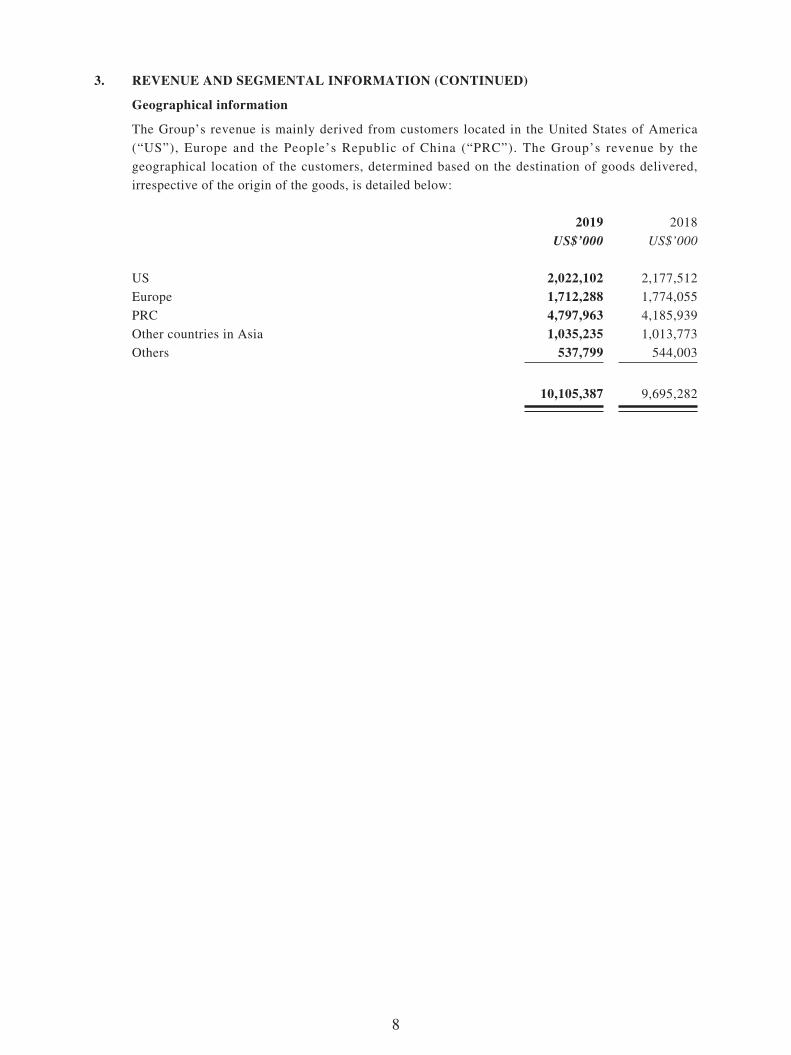
3. REVENUE AND SEGMENTAL INFORMATION (CONTINUED)
Geographical information
The Group’s revenue is mainly derived from customers located in the United States of America
(“US”), Europe and the People’s Republic of China (“PRC”). The Group’s revenue by the
geographical location of the customers, determined based on the destination of goods delivered,
irrespective of the origin of the goods, is detailed below:
2019 2018
US$’000 US$’000
US 2,022,102 2,177,512
Europe 1,712,288 1,774,055
PRC 4,797,963 4,185,939
Other countries in Asia 1,035,235 1,013,773
Others 537,799 544,003
10,105,387 9,695,282

9
3. REVENUE AND SEGMENTAL INFORMATION (CONTINUED)
Geographical information (Continued)
The Group’s business activities are conducted predominantly in the PRC, Vietnam, Indonesia,
Myanmar, Cambodia, US and Republic of China (“Taiwan”). Information about the Group’s
non-current assets by the geographical location of the assets is detailed below:
2019 2018
US$’000 US$’000
PRC 1,372,309 979,757
Vietnam 902,062 873,437
Indonesia 649,869 646,233
Myanmar 111,289 110,311
Cambodia 57,237 59,614
US 26,914 88,496
Taiwan 79,729 76,147
Others 27,748 28,044
3,227,157 2,862,039
note: Non-current assets excluded goodwill, interests in associates, interests in joint ventures,
amount due from a joint venture, deferred tax assets, deferred consideration receivable and
financial instruments.
Information about major customers
Revenue from customers contributing over 10% of the total annual revenue of the Group are as
follows:
2019 2018
US$’000 US$’000
Customer A 1,929,398 1,776,863
Customer B 1,719,523 1,602,086

10
4. OTHER GAINS AND LOSSES
2019 2018
US$’000 US$’000
Fair value changes on financial assets at fair value
through profit or loss 8,435 (23,449)
Fair value changes on investment properties 925 501
Gain on disposal of subsidiaries 18,644 4,780
Gain on disposal of a joint venture – 1,053
Gain on disposal of associates – 8,436
Write-off of goodwill (97) –
Impairment loss on interests in associates (8,605) (4,799)
Impairment loss on interests in a joint venture (1,470) –
Reversal of impairment loss on amount due from a joint venture 92 –
Loss on deemed disposal of associates (20) (4,478)
Loss on deregistration of subsidiaries (9) –
17,895 (17,956)
5. INCOME TAX EXPENSE
2019 2018
US$’000 US$’000
Taxation attributable to the Company and its subsidiaries:
PRC Enterprise Income Tax (“EIT”) (note ii)
– current year 54,072 59,189
– under(over)provision in prior years 516 (206)
– dividend withholding tax in the PRC (note ii) – 336
Overseas taxation (notes iii & iv)
– current year 50,446 49,645
– underprovision in prior years 363 4,406
105,397 113,370
Deferred tax credit (9,959) (14,922)
95,438 98,448

11
5. INCOME TAX EXPENSE (CONTINUED)
notes:
(i) Hong Kong
No provision for Hong Kong Profits Tax has been made as the Group had no assessable profit for both years.
(ii) PRC
The PRC EIT is calculated based on the statutory rate of 25% of the assessable profit for those subsidiaries established in the PRC, as determined in accordance with the relevant enterprise income tax law, implementation rules and notices in the PRC (the “EIT Law of PRC”), except as follows:
Pursuant to 《財政部、海關總署、國家稅務總局關於深入實施西部大開發戰略有關稅收政策問題的通知》 (Caishui [2011] No. 58) and the Bulletin of the State Administration of Taxation [2012] No. 12 issued in 2011 and 2012, during the period from January 1, 2011 to December 31, 2020, any enterprise that is located in the Western Regions of the PRC and engaged in the business activities as listed in the “Catalogue of Encouraged Industries in Western Regions” (the “New Catalogue”) as its major business from which the annual revenue accounts for more than 70% of its total revenue for the financial year, is entitled to pay EIT at the rate of 15% after its application is approved by the in-charge taxation authorities. Certain subsidiaries of the Company which are located in the specified provinces of Western Regions of the PRC and engaged in the business activities under the New Catalogue. The Directors consider that the relevant subsidiaries are eligible for the preferential tax rate of 15% in both years.
Pursuant to EIT Law of PRC and the Detailed Implementation Rules, distribution of the profits earned by the subsidiaries in the PRC since January 1, 2008 to holding companies is subject to the PRC withholding tax at the applicable tax rates of 10%.
(iii) Vietnam
As approved by the relevant tax authorities in Vietnam, certain subsidiaries of the Company are entitled to two to four years’ exemption from income taxes followed by four to nine years of a 50% tax reduction based on preferential income tax rates, commencing from the first profitable year.
The applicable tax rates for the subsidiaries in Vietnam range from nil to 20% for both years.
(iv) Overseas
As stated in the Decree Law No. 58/99/M, Chapter 2, Article 12, dated October 18, 1999, certain subsidiaries of the Company established in Macau are exempted from Macao Complementary Tax.
Taxation arising in other jurisdictions including Indonesia, Taiwan and US is calculated at the rates prevailing in the respective jurisdictions, which were 25%, 20% and 21%
respectively for both years.

12
6. PROFIT FOR THE YEAR
2019 2018
US$’000 US$’000
Profit for the year has been arrived at after charging (crediting):
Employee benefit expense, including directors’ emoluments
(note iii)
– basic salaries, bonus, allowances and staff welfare 2,138,722 2,073,976
– retirement benefit scheme contributions 262,880 231,018
– share-based payments 5,006 4,302
2,406,608 2,309,296
Release of prepaid lease payments – 4,062
Auditor’s remuneration 1,423 1,727
Amortization of intangible assets (included in selling and
distribution expenses) 15,320 19,062
Depreciation of property, plant and equipment (note iii) 340,414 314,496
Depreciation of right-of-use assets 139,369 –
Loss on disposal of property, plant and equipment
(included in other expenses) 17,904 21,827
Gain on disposal of assets classified as held for sale – (5,582)
Research and development expenditure (included in other expenses) 208,604 205,890
Net changes in allowance for inventories
(included in cost of sales) (note ii) (11,073) (5,275)
Loss on disposal of prepaid lease payments – 57
Impairment loss on trade and other receivables 2,252 6,191
Interest income (8,805) (10,273)
Dividend income from equity instruments at fair value
through other comprehensive income (869) (1,018)
Net exchange loss (gain) 15,091 (5,739)
Total operating lease income (17,749) (15,681)
notes:
(i) For the years ended December 31, 2019 and 2018, cost of inventories recognized as expenses
represents cost of sales as shown in the consolidated income statement.
(ii) Changes in allowance for inventories of US$8,827,000 credited to the consolidated income
statement (2018: allowance for inventories of US$9,444,000) for the year ended December
31, 2019 arose from the finished goods for the retail and distribution of sportswear and
footwear products.
(iii) The staff costs and depreciation of property, plant and equipment disclosed above included
amounts capitalized in inventories.

13
7. DIVIDENDS
2019 2018
US$’000 US$’000
Dividends recognized as distribution during the year:
2019 Interim dividend of HK$0.40 per share (2018: 2018 Interim
dividend of HK$0.40 per share) 82,092 82,375
2018 Final dividend of HK$1.10 per share (2018: 2017 Final
dividend of HK$1.10 per share) 227,003 229,704
309,095 312,079
The Directors recommend the payment of a final dividend of HK$0.70 per share for the year ended
December 31, 2019. The proposed dividend of approximately HK$1,127,117,000 will be paid on or
before June 24, 2020 to those shareholders whose names appear on the Company’s register of
members on June 8, 2020.
This proposed final dividend is subject to approval by the shareholders of the Company at the
forthcoming annual general meeting.

14
8. EARNINGS PER SHARE
The calculation of the basic and diluted earnings per share attributable to owners of the Company is
based on the following data:
2019 2018
US$’000 US$’000
Earnings:
Earnings for the purpose of basic earnings per share,
being profit for the year attributable to owners of the Company 300,546 307,116
Effect of dilutive potential ordinary shares
Adjustment to the share of profit of subsidiaries based
on dilution of their earnings per share (525) (2,089)
Earnings for the purpose of diluted earnings per share 300,021 305,027
2019 2018
Number of shares:
Weighted average number of ordinary shares
for the purpose of basic earnings per share 1,611,983,383 1,630,441,582
Effect of dilutive potential ordinary shares:
– Unvested awarded shares 1,344,404 1,123,514
Weighted average number of ordinary shares
for the purpose of diluted earnings per share 1,613,327,787 1,631,565,096
The weighted average number of ordinary shares shown above has been arrived at after deducting
the shares held by the trustee of the share award scheme of the Company.

15
9. TRADE AND OTHER RECEIVABLES
The Group allows credit period ranging from 30 days to 90 days which are agreed with each of its
trade customers.
Included in trade and other receivables are trade receivables, net of allowance for credit losses, of
US$1,141,786,000 (2018: US$1,268,526,000) and an aged analysis based on invoice date at the end
of the reporting period, which approximated to the respective revenue recognition dates, is as
follows:
2019 2018
US$’000 US$’000
0 to 30 days 702,705 761,237
31 to 90 days 434,629 492,301
Over 90 days 4,452 14,988
1,141,786 1,268,526
10. TRADE AND OTHER PAYABLES
Included in trade and other payables are trade and bills payables of US$499,501,000 (2018:
US$486,891,000) and an aged analysis based on the invoice date at the end of the reporting period
is as follows:
2019 2018
US$’000 US$’000
0 to 30 days 373,736 372,591
31 to 90 days 119,883 110,468
Over 90 days 5,882 3,832
499,501 486,891
16
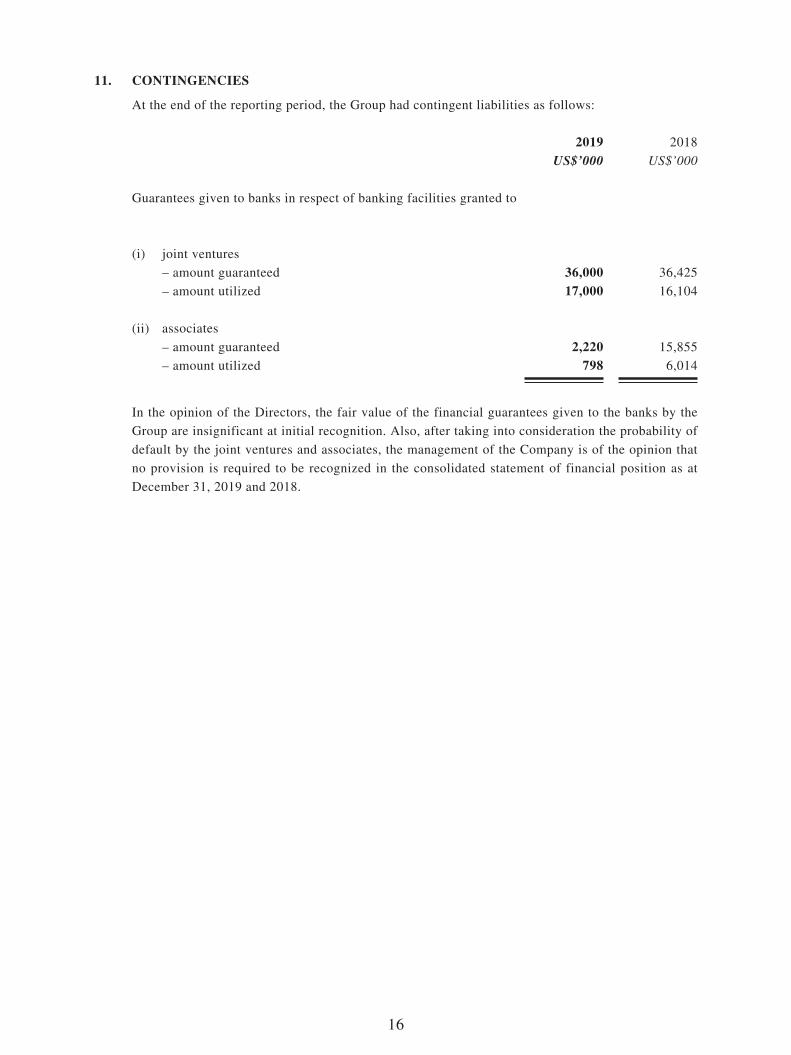
11. CONTINGENCIES
At the end of the reporting period, the Group had contingent liabilities as follows:
2019 2018
US$’000 US$’000
Guarantees given to banks in respect of banking facilities granted to
(i) joint ventures
– amount guaranteed 36,000 36,425
– amount utilized 17,000 16,104
(ii) associates
– amount guaranteed 2,220 15,855
– amount utilized 798 6,014
In the opinion of the Directors, the fair value of the financial guarantees given to the banks by the
Group are insignificant at initial recognition. Also, after taking into consideration the probability of
default by the joint ventures and associates, the management of the Company is of the opinion that
no provision is required to be recognized in the consolidated statement of financial position as at
December 31, 2019 and 2018.

17
MANAGEMENT DISCUSSION AND ANALYSIS FOR 2019
Business Review
Results
For the year ended December 31, 2019, the Group recorded revenue of US$10,105.4 million, representing an increase of 4.2%, compared with the previous year. The Group’s gross profit rose by 2.7%, while the profit attributable to owners of the Company decreased by 2.1% to US$300.5 million, as compared to US$307.1 million recorded for the previous year. Basic earnings per share dropped by 1.1% to 18.64 US cents, compared with 18.84 US cents for the previous year.
Recurring Profit Attributable to Owners of the Company
Excluding all items of non-recurring nature, the recurring profit for the year ended December 31, 2019 declined by 13.3% to US$282.3 million, compared to a recurring profit of US$325.7 million for the previous year. For the year ended December 31, 2019, the Group recognized a non-recurring profit of US$18.3 million, which included a net gain of US$18.6 million from the disposal of Texas Clothing Holding Corp. and together with its subsidiaries (the “TCHC Group”) and a net gain of US$8.4 million due to fair value changes on financial assets at fair value through profit or loss (“FVTPL”). By contrast, for the year ended December 31, 2018, the Group recognized a non-recurring loss of US$18.5 million, which included a net loss of US$23.4 million due to fair value changes on financial assets at FVTPL that were partly offset by one-off gains arising from the disposal of associates and subsidiaries.
Operations
General Overview
Yue Yuen is the world’s largest manufacturer of athletic, athleisure, casual and outdoor footwear with a diversified portfolio of brand customers and production sites. The Group’s production capacity is widely recognized for its responsiveness, flexibility, innovation, design and development capabilities, and superior quality. In 2019, the Group faced several unexpected headwinds, particularly the imposition of trade tariffs by the United States on footwear manufactured in China, coupled with the changing sourcing strategies of various customers on the back of the uncertainties associated with the aforementioned global trade frictions, as well as changing consumer trends. This accelerated the Group’s adjustments of product country-of-origin throughout the year. The Group also continued to face increased demand from brand customers for more flexible procurement approaches in reaction to changing consumer preferences and the volatile market dynamics. This together with the increased complexity and versatility of the Group’s customers’ product portfolios had a temporary adverse impact on the Group’s production efficiency during 2019.

18
To address these challenges, respond to the changing environment and sustain its long-term position, the Group made further progress in adapting its manufacturing business to cater to the faster-moving market environment, particularly in response to increasing demand for greater versatility, flexibility and faster turnaround time. It also continued to enhance its digital transformation and lean manufacturing, adapting its operations to allow flexible set-up and frequent line change-overs through process re-engineering, increased automation levels, and SAP ERP system implementation to optimize its ongoing smart manufacturing strategy. This will ensure that the Group can continue to provide differentiated value-added and one-stop OEM/ODM services to customers with whom it has maintained long-term relationships. The Group also furthered its efforts to foster environmental sustainability, eyeing at the long-term growth viability of its business.
The Group also operates one of the largest and most integrated sportswear retail networks in the Greater China region through its listed subsidiary, Pou Sheng International (Holdings) Limited (“Pou Sheng”). To best achieve its omni-channel strategy of integrating synergies between brick-and-mortar stores and e-commerce channels, Pou Sheng is currently in the process of strengthening its market presence and optimizing operating efficiency by implementing customer experience-focused initiatives, integrating inventories and resources between its omni-channels and retail networks. Pou Sheng is also investing in digitization in the face of ever-changing consumer dynamics. For a more detailed explanation and strategy of the Group’s retail business, please refer to the 2019 annual report of Pou Sheng.
The Group remains committed to sustainability, ethical conduct and corporate values. When making important business decisions, the Group considers the interests of all stakeholders, including employees and the surrounding community. The Group monitors and manages its business using comprehensive guidelines on employee relations, workplace safety and the efficient use of raw materials, energy, and other environmental metrics, promoting a culture of ethical conduct and integrity. Yue Yuen’s parent company, Pou Chen Group, is also accredited by the Fair Labor Association (FLA) as a result of the Group’s efforts in the areas of labor rights and sustainability.
As a people-oriented business, the Group is dedicated to fostering a caring culture and to developing talent internally as part of its long-term sustainable development. For more details on the Group’s sustainable development strategy and reporting of its practices on environmental, social and governance, please refer to the 2019 Environmental, Social and Governance Report of the Company.

19
Total Revenue by Product Category
In the year ended December 31, 2019, revenue attributed to footwear manufacturing activity (including athletic shoes, casual/outdoor shoes and sports sandals) increased by 3.1% to US$5,557.9 million, compared with the previous year, whereas the volume of shoes shipped slightly decreased by 1.1% to 322.4 million pairs and the average selling price per pair increased by 4.3% to US$17.24 per pair, as compared with the previous year primarily due to the Group’s efforts to optimize customer and product portfolios.
The Group’s athletic footwear category outperformed all other categories as a result of the global athleisure trend, accounting for 81.7% of footwear manufacturing revenue in 2019. Casual/outdoor shoes accounted for 16.3% of footwear manufacturing revenue. When considering the Group’s consolidated revenue, athletic shoes represented the Group’s principal category, accounting for 44.9% of total revenue in 2019, followed by casual/outdoor shoes, which accounted for 9.0% of total revenue.
The Group’s total revenue with respect to the manufacturing business (including footwear, as well as soles, components and others) was US$6,000.6 million in 2019, representing an increase of 2.0% as compared to the previous year.
The Group’s distribution sales (“Distribution Business”) are derived primarily from Pou Sheng, which operates retail operations for international sporting goods brands in the Greater China region. It also includes sales from TCHC Group, the Group’s apparel wholesale subsidiary in North America, which was disposed of on May 31, 2019. Revenue attributable to the Group’s Distribution Business was US$4,104.8 million in the year ended December 31 2019, an increase of 7.6% as compared with the previous year.
In the year ended December 31, 2019, the revenue attributable to Pou Sheng, the Group’s retail subsidiary, increased by 14.9% to US$3,933.0 million, compared to US$3,421.7 million in the previous year. In RMB terms (Pou Sheng’s reporting currency), revenue increased by 19.9% to RMB27,189.8 million, compared to RMB22,677.4 million in the previous year. As of December 31, 2019, Pou Sheng had 5,883 directly operated retail outlets and 3,950 stores operated by sub-distributors in China.

20
Total Revenue by Product Category
For the year ended December 31,2019 2018
US$ million %
US$ million %
change%
Athletic Shoes 4,541.6 44.9 4,267.7 44.0 6.4Casual/Outdoor Shoes 906.2 9.0 1,031.0 10.6 (12.1)Sports Sandals 110.1 1.1 91.8 1.0 19.9Soles, Components & Others 442.7 4.4 491.0 5.1 (9.8)Apparel Wholesale (TCHC
Group) 171.8 1.7 392.1 4.0 (56.2)Retail Sales – Shoes, Apparel
and Commissions from Concessionaire Sales 3,933.0 38.9 3,421.7 35.3 14.9
Total Revenue 10,105.4 100.0 9,695.3 100.0 4.2
Orders from international brands are received by business units that manage each customer and normally take about ten to twelve weeks to fill. More and more customer orders request a shorter lead-time between 30-45 days, in line with the fast fashion trend.
Sales from the Group’s retail business across the Greater China region are recorded on a daily basis, or at periodic intervals if from sub-distributors.
Production Review
In 2019, the Group’s manufacturing business shipped a total of 322.4 million pairs of shoes, a slight decline of 1.1% compared to the 326.0 million pairs shipped in the previous year primarily due to its efforts to optimize customer and product portfolios. The average selling price per pair was US$17.24, an increase of 4.3% compared to US$16.53 in the previous year.
In terms of production allocation, Vietnam, Indonesia and China continued to be the Group’s main locations by shoe volume in 2019, representing 44%, 39% and 13% of total shipments, respectively, during the year under review.
Cost Review
With respect to the cost of goods sold by the Group’s manufacturing business in 2019, total main material costs were US$2,215.0 million (2018: US$2,163.7 million). The direct labor costs and production overheads amounted to US$2,678.5 million (2018: US$2,568.8 million). The total cost of goods sold by the Group’s manufacturing business was US$4,893.5 million during the year under review (2018: US$4,732.5 million). For the Group’s Distribution Business, cost of sales were US$2,698.8 million (2018: US$2,516.7 million).

21
In the year ended December 31, 2019, the Group’s gross profit increased by 2.7% to US$2,513.1 million. This increase was mostly attributed to Pou Sheng, contributing to the higher revenue growth thanks to improved sell-through and the robust sporting goods market in China.
The gross profit margin of the Group’s manufacturing business contracted by 1.0 percentage points to 18.5% as compared to that in the previous year. The decrease in the gross profit margin for the manufacturing business was primarily due to a combination of increased product complexity resulting from the current ‘retro fashion’ trend, growing demand for flexible production set-up such as dual-sourcing from different countries, as well as shifting production facilities among countries. It also related to the Group’s investments in manufacturing optimization for its sustainable growth (including higher levels of automation and SAP ERP system implementation), which resulted in temporary low efficiencies at some of its production facilities.
Given the uncertainties in the global trade environment, including the on-going trade tariff measures between the United States and China, as well as brand customers’ demands for more flexible procurement strategies, the Group has and will continue to further adjust production allocation by country in response to the changing sourcing strategies of some brand customers. These measures will require some time and resources to reach optimal operational efficiency.
The gross profit margin for the Group excluding Pou Sheng (i.e. the manufacturing business and TCHC Group) during the year under review was 19.0%.
Pou Sheng’s gross profit margin during the year under review expanded to 34.1%, compared to 33.5% in the previous year, which was attributed to the improvement in product and channel mix, sell-through and discounts.
The Group’s total selling and distribution expenses for 2019 amounted to US$1,222.1 million (2018: US$1,160.1 million), equivalent to approximately 12.1% (2018: 12.0%) of revenue.
Administrative expenses for 2019 amounted to US$682.7 million (2018: US$658.3 million), equivalent to approximately 6.8% (2018: 6.8%) of revenue, remaining stable.
With cost pressures remaining significant for the manufacturing business, the management will continuously look for ways to improve its efficiency and productivity.
22
Product Development
In 2019, the Group spent US$208.6 million (2018: US$205.9 million) on product development, including investments in sampling, technological and digitalized development and creation, as well as in production efficiency enhancements. For each of the major branded customers that has an R&D team, a parallel independent product development center exists within the Group to support the said R&D team. In addition to product development work, the Group also cooperates with its customers to seek efficiency improvements in production processes, lead time and to formulate new techniques to produce high-quality footwear, as well as to incorporate innovative and environmental-friendly materials into the design, development and manufacture of its products.
Financial Review
Liquidity, Financial Resources and Capital Structure
The Group’s financial position remained solid. As at December 31, 2019, the Group had cash and cash equivalents of US$982.1 million (December 31, 2018: US$851.4 million) and total bank and other borrowings of US$2,089.9 million (December 31, 2018: US$2,123.9 million). The Group’s gearing ratio (total bank and other borrowings to total equity) was 46.1% as at December 31, 2019 (December 31, 2018: 46.7%). As of December 31, 2019, the Group had net borrowing of US$1,107.8 million (December 31, 2018: US$1,272.5 million). As at December 31, 2019, the Group had current assets of US$4,492.7 million (December 31, 2018: US$4,410.3 million) and current liabilities of US$2,459.0 million (December 31, 2018: US$2,306.0 million). The current ratio was 1.8 as at December 31, 2019 (December 31, 2018: 1.9).
The Group has relied to a certain extent on debt financing for its funding requirements. With regard to the choice of debt versus equity financing, which would thus affect its capital structure, the Group will consider the impact on its weighted average cost of capital and its leverage ratio etc., with an aim of lowering the weighted average cost of capital while maintaining its gearing ratio at a comfortable level. The Group used debt financing mostly by means of bank loans. In terms of the maturity profile of loans, most of the bank loans for the Group’s manufacturing business were long-term committed facilities that partly meet the funding needs of its capital expenditures and long-term investments. Short-term revolving loans facilities were also utilized regularly for daily working capital purposes, especially for the Group’s retail business. As of December 31, 2019, around 64.9% of the Group’s total bank and other borrowings were with remaining tenor of over 1 year.
Almost all of the bank borrowings of the Group relating to its manufacturing business are denominated in USD. The majority of the Group’s cash surplus in relation to its manufacturing business is held in USD, while some cash are held in local currencies (e.g. VND, IDR, RMB) in various countries where its production facilities are located for daily operation purposes. For the Group’s retail business, Pou Sheng’s bank and other borrowings and cash balances are mostly in RMB, which is its functional currency.

23
The vast majority of the Group’s bank and other borrowings were on floating rate basis. A portion of the Group’s floating interest rate risk exposure was hedged by interest rate swaps.
Capital Expenditure
In 2019, the capital expenditure for the Group’s manufacturing and Distribution Business segments were US$279.3 million (2018: US$405.2 million) and US$118.8 million (2018: US$89.2 million) respectively. Capital expenditure for the manufacturing business in 2019 included automation investments, capacity migration, as well as upgrades and the maintenance of production facilities in Vietnam, Indonesia and other regions, which was funded primarily by both internal and external resources of the Group. For the Distribution Business, in particular Pou Sheng, resources were invested in the expansion, upgrade and maintenance of retail stores.
Apart from investments for operation purposes which may be made in the Group’s ordinary and usual course of business, the Group presently does not have any plan for material investments or acquisition of capital assets.
Contingent Liabilities
The Group had provided guarantees to banks in respect of banking facilities granted to joint ventures and associates, the details of which can be seen in note 44 to the consolidated financial statements in the 2019 annual report of the Company.
Significant Investments and Material Acquisitions/Disposals
In 2019, the share of results from associates and joint ventures was a combined profit of US$52.0 million, compared to a combined profit of US$39.5 million in the corresponding period of last year.
During the year under review, the Group disposed of its entire interest in TCHC Group. The disposal is part of the Company’s efforts to focus on its core business. The Group recognized a gain, net of transaction expenses, of approximately US$18.6 million from the disposal in the year ended December 31, 2019.
Details of the material disposals of subsidiaries during the year under review are set out in note 40 to the consolidated financial statements in the 2019 annual report of the Company.
24
Dividends
A final dividend of HK$0.70 per share (2018: HK$1.10 per share) for the year ended December 31, 2019 has been recommended, amounting to a total dividend per share of HK$1.10 for the year (2018: HK$1.50 per share), inclusive of an interim dividend of HK$0.40 per share (2018: interim dividend of HK$0.40 per share). The recommended final dividend is subject to the approval by shareholders of the Company at the forthcoming annual general meeting.
The Group maintains a stable operating cash flow and a suitable level of cash holdings. The Group’s commitment to upholding relatively steady level in dividend payment over time remains intact.
Foreign Exchange Exposure
All revenues from the manufacturing business are denominated in US dollars. The majority of material and component costs are paid in US dollars, while expenses incurred locally are paid for in the local currency i.e. wages, utilities and local regulatory fees. A certain portion of IDR exposure is partly hedged with forward contracts.
For the Group’s retail business in China, all revenues are denominated in RMB. Correspondingly, all expenses are also denominated in RMB. For the retail business outside China, both revenues and expenses are denominated in local currencies.
Employees
As at December 31, 2019, the Group had approximately 347,100 employees across all regions in which the Group operates, largely stable as compared to the previous year. The Group adopts a remuneration system based on an employees’ performance throughout the year under review and prevailing salary levels in the market.
The Group believes that employees are important assets, and has planned a holistic approach to the recruitment, employment, training and retention of employees.
The Group employs a competitive remuneration scheme and provides comprehensive employee benefits, in line with the relevant laws and regulations applicable to each of its operating locations. It sets aside a certain percentage of profits, according to the annual performance of the Group, as year-end bonuses to reward employees’ contributions and work enthusiasm, allowing them to share in its operating results. It also provides insurance plans that are tailor-made to each operating location to reduce the medical expense burden of employees, as well as pension fund contributions in compliance with the laws and regulations of the local jurisdictions in which the Group operates.
The Group regularly undertakes internal and external training courses at all levels, including new employees training, professional training, management training, environmental safety training and corporate core values training, with the objective of upgrading the quality and expertise of the Group’s employees and management, as well as boosting their morale.

25
The social compliance program of the Group’s parent, Pou Chen Group has been accredited by the Fair Labor Association (FLA), a non-profit organization dedicated to protecting workers’ rights around the world, making the Group the first and only FLA-accredited footwear supplier globally. The accreditation recognized the Group’s commitment to globally implement workplace standards; implement a comprehensive system to evaluate and incentivize manufacturing facilities and material suppliers to improve working conditions; invest in a social compliance program, training, and remediation; and improving its transparency in remediating labor violations at its production sites and establishing multiple grievance channels.
Prospects
Heading into 2020, the Group’s manufacturing and retail businesses are facing a more diverse range of challenges. In addition to existing uncertainties already impacting the manufacturing business, particularly shifting international trade policies and rapidly changing consumer trends, the recent novel coronavirus (COVID-19) pandemic around the globe has significantly impacted the Group’s operations and will negatively impact its revenue and results in the first half of 2020.
In China, the Government’s response to the pandemic resulted in the temporary shutdown of the Group’s production facilities for several weeks following the Lunar New Year holiday. As of the reporting date, most of the Group’s facilities have resumed production. In other countries, the Group’s operations ranging from its production sites to its supply chain in China and other countries have also been adversely affected. It will take a period of time for the Group’s production bases to return to normal levels.
For the retail business, the COVID-19 pandemic caused Pou Sheng to temporarily close most of its retail stores in China during the key Lunar New Year shopping season and throughout most of February. Given that the revenue of Pou Sheng is mainly derived from the sales of sportswear in brick-and-mortar retail stores, it is expected that the temporary store closures will have a significant impact on its revenue and results for the first half of 2020.
Other than this, the Group will continue to adjust its production according to market seasonality as well as diversified capacity allocation among different countries, which will in the short term affect its operating efficiency. It is critical that the Group continues to demonstrate flexibility as one of its core competencies as changing consumer trends result in shorter lead times, increased seasonality, and higher product complexity.

26
The Group will continue to accelerate the pace of capacity migration to cost competitive regions as it responds to the addition of a 7.5% tariff (recently lowered from the original level of 15%) by the US on footwear exported from China, the uncertain global environment and increasing demand for flexibility. This includes shifting capacity from China to Southeast Asia, as well as shifting production facilities between Southeast Asian countries, while being mindful of the labor supply situation in the countries where the Group operates, especially in Vietnam. The Group is actively monitoring the macroeconomic and geopolitical situation.
The Group will continue to leverage on its core strengths and competitive edges to overcome these short-term challenges and safeguard its sustainable and steady growth. This includes investing in and implementing ERP data management systems such as SAP to improve the efficiency of the Group’s business processes. The Group will continue to enhance its product development and innovation capabilities and explore other value-added and margin-accretive opportunities for vertical integration to tap new markets, creating long-term synergies for its businesses.
Aside from the current short-term challenges, the Group remains optimistic about the long-term growth prospects of its retail business, given increasing health awareness, higher sports participation rates and the growth of ‘athleisure’ trend in the Greater China region. Pou Sheng’s omni-channel strategy, which has been extended to include sports services content, will also continue to benefit from the Chinese government’s supportive policies. It will continue to invest in upgrading its store formats, opening new concept mega stores and integrating digital and physical channels and inventories to reinforce the consumer experience and stimulate higher-margin sales, while also addressing dynamic consumer shopping habits.
Going forward, the Group remains confident that these strategies will enable it to continue providing its brand customers with end-to-end solutions, while safeguarding its solid long-term profitability and ability to deliver sustainable returns to shareholders.

27
PURCHASE, SALE OR REDEMPTION OF THE COMPANY’S LISTED SECURITIES
During the year ended December 31, 2019, the Company repurchased a total of 4,459,000 shares of the Company on The Stock Exchange of Hong Kong Limited (the “Stock Exchange”) at a total consideration of HK$95,131,050.00 (equivalent to approximately US$12,173,000.00).
Details of the repurchases of shares of the Company during the year ended December 31, 2019 are set out as follows:
Date of repurchaseNo. of sharesrepurchased
Highest price paid
Lowest price paid Total paid
HK$ HK$ HK$
May 15, 2019 180,000 21.80 21.65 3,907,450.00May 16, 2019 180,000 21.80 21.80 3,924,000.00May 17, 2019 263,000 21.35 21.15 5,584,950.00May 27, 2019 360,000 21.75 21.50 7,782,975.00May 29, 2019 360,000 22.00 21.70 7,843,725.00May 30, 2019 400,000 22.00 21.65 8,713,950.00May 31, 2019 400,000 21.90 21.70 8,714,850.00June 3, 2019 216,000 22.00 21.70 4,715,475.00June 5, 2019 400,000 20.80 20.40 8,260,875.00June 11, 2019 650,000 21.15 20.85 13,639,400.00June 12, 2019 400,000 21.05 20.75 8,378,500.00June 17, 2019 650,000 21.30 20.90 13,664,900.00
Total: 4,459,000 95,131,050.00
All of the aforesaid repurchased shares were cancelled on June 28, 2019. The Directors believe that the repurchases of shares would lead to an enhancement of the net asset value per share of the Company and its earnings per share. Save as disclosed above, neither the Company nor any of its subsidiaries purchased, sold or redeemed any of the Company’s listed securities during the year ended December 31, 2019.
CORPORATE GOVERNANCE
During the year ended December 31, 2019, the Company has applied the principles of and has complied with all the applicable code provisions of the Corporate Governance Code as set out in Appendix 14 to the Listing Rules.

28
RE-ELECTION OF DIRECTORS
In accordance with Bye-law 87 of the Bye-laws of the Company (the “Bye-laws”), Mr. Lu Chin Chu, Ms. Tsai Pei Chun, Patty, Mr. Hu Dien Chien and Ms. Yen Mun-Gie (also known as Teresa Yen) will retire by rotation and, being eligible, will offer themselves for re-election at the forthcoming annual general meeting of the Company (“2020 AGM”).
In accordance with Bye-law 86(2) of the Bye-laws, Mr. Chen Chia-Shen who was appointed as an independent non-executive director of the Company in respect of the retirement of Mr. Hsieh Yung Hsiang (also known as Alfred Hsieh) shall hold office until 2020 AGM when he will retire and, being eligible, proposed to offer himself for re-election.
Further details of the retiring directors proposed to be re-elected at the 2020 AGM will be disclosed in the circular of the Company to be dispatched, together with the 2019 annual report of the Company, to the shareholders of the Company in due course.
MODEL CODE FOR SECURITIES TRANSACTIONS BY DIRECTORS
The Company has adopted the Model Code for Securities Transactions by Directors of Listed Issuers (the “Model Code”) as set out in Appendix 10 to the Listing Rules as its own code of conduct regarding securities transactions by Directors. Having made specific enquiries with all Directors, all Directors confirmed that they have complied with the required standard as set out in the Model Code for the year ended December 31, 2019.
AUDIT COMMITTEE
The audit committee of the Company has reviewed with management and the external auditor, Messrs. Deloitte Touche Tohmatsu, the Group’s consolidated financial statements for the year ended December 31, 2019 and the accounting principles and practices adopted and discussed auditing, risk management and internal controls, and financial reporting matters.
SCOPE OF WORK OF THE EXTERNAL AUDITOR
The figures in respect of the Group’s consolidated statement of financial position as at December 31, 2019, consolidated income statement, consolidated statement of comprehensive income and the related notes thereto for the year ended December 31, 2019 as set out in this announcement are in agreement with the amounts as set out in the audited consolidated financial statements of the Group for the year as approved by the Board on March 30, 2020. Since the work performed by the external auditor in this regard did not constitute an assurance engagement performed in accordance with Hong Kong Standards on Auditing, Hong Kong Standards on Review Engagements or Hong Kong Standards on Assurance Engagements issued by the HKICPA, the external auditor does not express any assurance on this announcement.

29
PUBLICATION OF RESULTS ANNOUNCEMENT AND ANNUAL REPORT
This announcement is published on the website of the Company (www.yueyuen.com) and the Stock Exchange (www.hkexnews.hk). The annual report of the Company will be dispatched to the shareholders of the Company and available on the above websites in due course.
PUBLIC FLOAT
As far as the Company is aware, as at the date of this announcement, the Company has maintained a sufficient public float with more than 25% of the issued shares of the Company being held by the public.
ANNUAL GENERAL MEETING
The 2020 AGM will be held at 22nd Floor, C-Bons International Center, 108 Wai Yip Street, Kwun Tong, Kowloon, Hong Kong on May 29, 2020 and the notice will be published and issued to shareholders of the Company in due course.
CLOSURE OF REGISTER OF MEMBERS
Entitlement to attend and vote at 2020 AGM
For determining the entitlement of the shareholders of the Company to attend and vote at the 2020 AGM, the register of members of the Company will be closed from Monday, May 25, 2020 to Friday, May 29, 2020, both days inclusive, during which period no transfer of shares will be effected. All transfers, accompanied by the relevant share certificates, must be lodged with the Company’s branch share registrar in Hong Kong, Tricor Secretaries Limited at Level 54, Hopewell Centre, 183 Queen’s Road East, Hong Kong, no later than 4:30 p.m. on Friday, May 22, 2020 in order to be eligible to attend and vote at the 2020 AGM.
Entitlement to the proposed final dividend
For determining the entitlement of the shareholders of the Company to the proposed final dividend, the register of members of the Company will be closed from Monday, June 8, 2020 to Wednesday, June 10, 2020, both days inclusive, during which period no transfer of shares will be effected. All transfers, accompanied by the relevant share certificates, must be lodged with the Company’s branch share registrar in Hong Kong, Tricor Secretaries Limited at Level 54, Hopewell Centre, 183 Queen’s Road East, Hong Kong, no later than 4:30 p.m. on Friday, June 5, 2020 in order to be qualified for the proposed final dividend.
30
ACKNOWLEDGMENT
I would like to take this opportunity to express our sincere appreciation of the support from our customers, suppliers and shareholders. I would also like to thank my fellow directors for their valuable contribution and the staff members of the Group for their commitment and dedicated services throughout last year.
By Order of the BoardYue Yuen Industrial (Holdings) Limited
Lu Chin ChuChairman
Hong Kong, March 30, 2020
As at the date of this announcement, the Board comprises the following members:
Executive Directors:
Mr. Lu Chin Chu (Chairman), Ms. Tsai Pei Chun, Patty (Managing Director), Mr. Chan Lu Min, Mr. Lin Cheng-Tien, Mr. Tsai Ming-Lun, Ming, Mr. Hu Chia-Ho, Mr. Liu George Hong-Chih and Mr. Hu Dien Chien.
Independent Non-executive Directors:
Mr. Wong Hak Kun, Mr. Ho Lai Hong, Ms. Yen Mun-Gie (also known as Teresa Yen) and Mr. Chen Chia-Shen.
Website: www.yueyuen.com