Yue Yuen Industrial 2019 Annual Resultsinvestor.yueyuen.com/202003301832151728532209_en.pdf ·...
57
30 March 2020 Yue Yuen Industrial 2019 Annual Results
Transcript of Yue Yuen Industrial 2019 Annual Resultsinvestor.yueyuen.com/202003301832151728532209_en.pdf ·...
30 March 2020
Yue Yuen Industrial 2019 Annual Results

Disclaimer
Yue Yuen and Pou Sheng have taken every reasonable care in preparing this presentation. However, please be reminded that the
information, materials, opinions and statements contained or referred to in this presentation are all provided on an "as is" basis.
None of the aforesaid information, materials, opinions and statements constitutes or will be viewed as investment advice or an
offer, or a solicitation, recommendation or suggestion by Yue Yuen or Pou Sheng to deal in any investment products including
securities, or other financial products and instruments.
If there is any forward-looking statements contained or referred to in this presentation, these forward-looking statements are
based on current expectations and assumptions, of which many are beyond our control. In addition, these statements are subject
to a number of risks, uncertainties and factors and if any of these risks or uncertainties materialize, or if underlying expectations
not occur or assumptions prove incorrect, actual results, performance or achievements of Yue Yuen and/or Pou Sheng may vary
materially from those described explicitly or implicitly in the relevant forward-looking statement. Neither Yue Yuen nor Pou Sheng
intends or assumes any obligation, to update or revise these forward-looking statements in light of any difference from those
anticipated.
Yue Yuen and Pou Sheng including their respective subsidiaries, associated or affiliated companies, or any of their respective
directors, employees, agents, representatives or associates accepts no liability for and shall not be responsible or liable for any
loss or damage of whatever kind or nature, directly or indirectly, arising from action taken, or not taken, in reliance on, or
resulting from access to or use of the aforesaid information, materials, opinions and statements (including forward-looking
statements, if any) contained or referred to in the presentation.
2

Retail Sales – Shoes, Apparel & Leasing
38.9% (FY18: 35.3%)
Company Profile
Founded in 1988, and listed on the HKEX in 1992 (551.HK)
Core Businesses:
Footwear manufacturing – Predominately athletic and casual / outdoor shoes
Pou Sheng (3813.HK) – Sportswear retail & sports services in the Greater China Region
A yield play with solid performance – committed to driving return and value for shareholders
FY19 Revenue by Business Segments
FY19 Total Revenue reached US$ 10,105.4 million
*Revenue from Texas Clothing Holding Corp. (“TCHC”) Group, which became subsidiary of the Group on April 7, 2017 and was then disposed on May 31, 2019 3
Soles, Components & Others
4.4% (FY18: 5.1%)
Athletic Shoes
44.9% (FY18: 44.0%)
Casual / Outdoor Shoes
9.0% (FY18: 10.6%)
Sports Sandals
1.1% (FY18: 1.0%)
Apparel Wholesale*
1.7% (FY18: 4.0%)
HK$ per share*VolumeRevenue
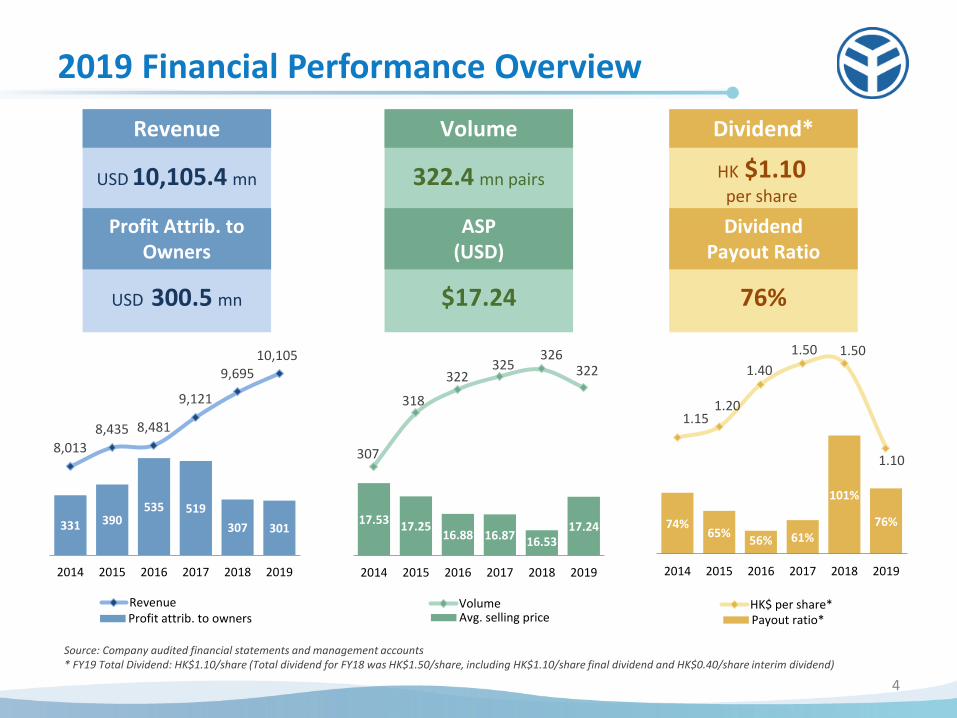
2019 Financial Performance Overview
Source: Company audited financial statements and management accounts * FY19 Total Dividend: HK$1.10/share (Total dividend for FY18 was HK$1.50/share, including HK$1.10/share final dividend and HK$0.40/share interim dividend)
74% 65%
56% 61%
101%
76%
1.15 1.20
1.40
1.50 1.50
1.10
2014 2015 2016 2017 2018 2019
Payout ratio*
17.53 17.25 16.88 16.87 16.53
17.24
307
318
322 325
326 322
2014 2015 2016 2017 2018 2019
Avg. selling price
331 390 535 519
307 301
8,013
8,435 8,481
9,121
9,695 10,105
2014 2015 2016 2017 2018 2019
Profit attrib. to owners
4
USD 10,105.4 mn
Profit Attrib. to Owners
Revenue
USD 300.5 mn
322.4 mn pairs
ASP (USD)
Volume
$17.24
HK $1.10 per share
Dividend Payout Ratio
Dividend*
76%
18.64*7.7532/100=1.445 1.1/1.46=76.1%
Current rate on 30 Mar 2020

Our Growth Strategy
5
Speed
Sustainability
Flexibility
Innovation
Quality
Design
OEM / ODM
Material
Process
Equipment
Apparel
Accessories
Footwear
Retail
Values
5
Directions
4
Segments
3
End to End Platform
2
World’s Leading Sporting Goods
MFG Platform
1

Corporate Social Responsibility
6
The social compliance program of Pou Chen Group (comprising Pou Chen Corporation and Yue Yuen) obtained accreditation from Fair Labor Association (FLA) in June, 2018, as a result of our efforts and commitments in promoting workplace standards, responsible production as well as factory condition improvement.
The Only FLA Accredited Footwear OEM/ODM Globally
A Top-ranking Responsible Investment Target
Pou Chen and Yue Yuen are constituents of world-famous Environmental, Social and Governance (ESG) indexes, including the FTSE4Good Emerging Index and the MSCI World ESG Leaders Index.
Our Focus on Sustainability
Employee Relations
Compliance
Education Implementation Communication Risk Control
ESH & ESG

FY 2019
Group and Operation Highlights

Key Financial Highlights for FY 2019
8
Group
* Excludes TCHC Group
Revenue
US$ 10,105.4 mn + 4.2%
Operating Profit
US$ 470.7 mn
- 5.6%
MFG* GP Margin
18.5% -1.0pp
Shoe Volume
322.4 mn pairs
-1.1%
ASP
US$ 17.24 per pair
+4.3%
Retail Revenue
RMB 27,190 mn +19.9%
OP Margin
5.4%
+1.1pp
Same Store Sales Growth
5.0% -2.4pp
Earnings Per Share
18.64 US cents
-1.1%

Financial Implications of Disposal of TCHC
9
TCHC Group
(US$ million, audited) Jan – May 2019 Jan – Jun 2018 FY 2018
Revenue 171.85 191.50 395.02
Net profit after taxation 10.01 7.61 17.08
Net Asset Value 127.25 85.65 93.28
Disposal
Rationale
Consideration
TCHC Group Financials
* Purchase Price listed above has not yet taking into account the working capital adjustment, the indebtedness and other adjustments
Texas Clothing Holding Corp. (“TCHC”) was disposed on 31 May 2019, upon which it ceased to be a subsidiary of the Company.
The Group’s benefits from the disposal:
- Realizing investment in the TCHC
- Remaining focused on core business
- Releasing working capital and lowering debt levels
Consideration = Purchase Price* (US$230.0 mn) + Earnout Amount (max. US$24.15 mn)
Net proceeds at Closing after debt repayment: approx. US$97.2 mn per cash flow,
which was used to pay down outstanding debt held by the Group
Net gain on disposal is approx. US$18.6 mn, TCHC Group accounts for 1.7% of revenue
and 2.8% of profit of the Group in 2019
Financial Impact
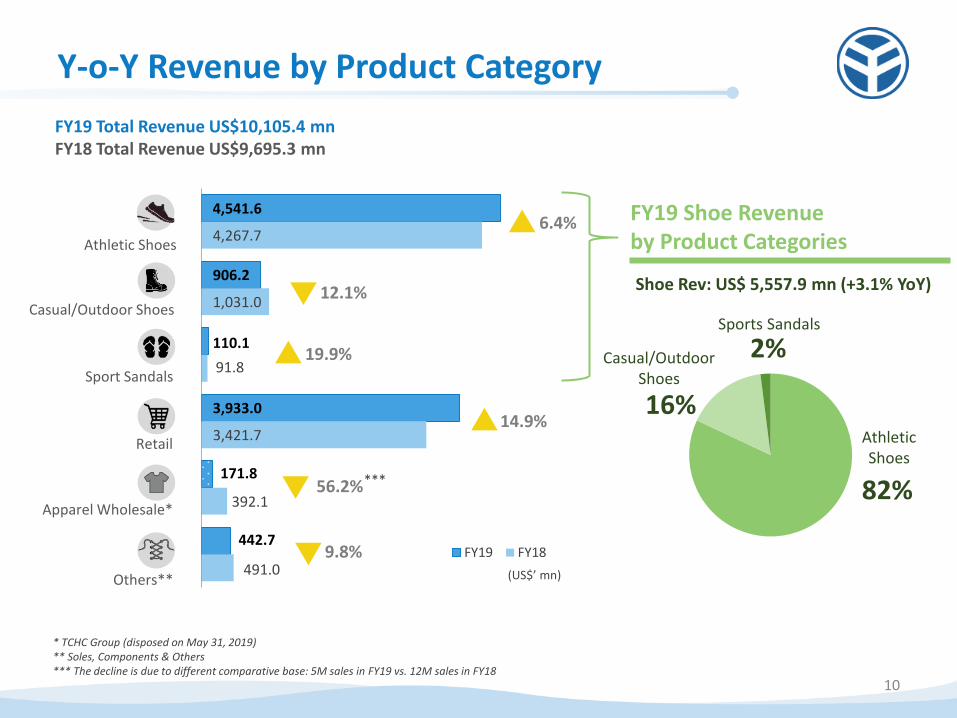
4,541.6
906.2
110.1
3,933.0
171.8
442.7
4,267.7
1,031.0
91.8
3,421.7
392.1
491.0 FY19 FY18
Y-o-Y Revenue by Product Category
10
(US$’ mn)
FY19 Shoe Revenue by Product Categories
Casual/Outdoor Shoes
Sports Sandals
Athletic Shoes
82%
16%
2%
Shoe Rev: US$ 5,557.9 mn (+3.1% YoY)
* TCHC Group (disposed on May 31, 2019) ** Soles, Components & Others *** The decline is due to different comparative base: 5M sales in FY19 vs. 12M sales in FY18
FY19 Total Revenue US$10,105.4 mn FY18 Total Revenue US$9,695.3 mn
***
Athletic Shoes
Casual/Outdoor Shoes
Sport Sandals
Retail
Apparel Wholesale*
Others**
6.4%
12.1%
19.9%
14.9%
56.2%
9.8%

FY19 Manufacturing Revenue by Destination
11
US 31.3% FY18: 31.3% YoY: +1.8%#
Europe 28.5% FY18: 30.2% YoY: -3.5%#
Mainland China 14.7%
FY18: 13.3% YoY: +13.0%#
Others* 25.5%
FY18: 25.3% YoY: +3.1%#
FY19 MFG Revenue: US$ 6,000.6 mn FY18 MFG Revenue: US$ 5,881.5 mn
# YoY changes in revenue amount * Others include Rest of Asia, South America, Canada, Australia and Other Area
China 881.3/6,000.6=14.68%
Europe 1,712.3/6,000.6=28.53%
US 1,875.2/6,000.6=31.25%
Others 1,531.8/6,000.6=25.53%
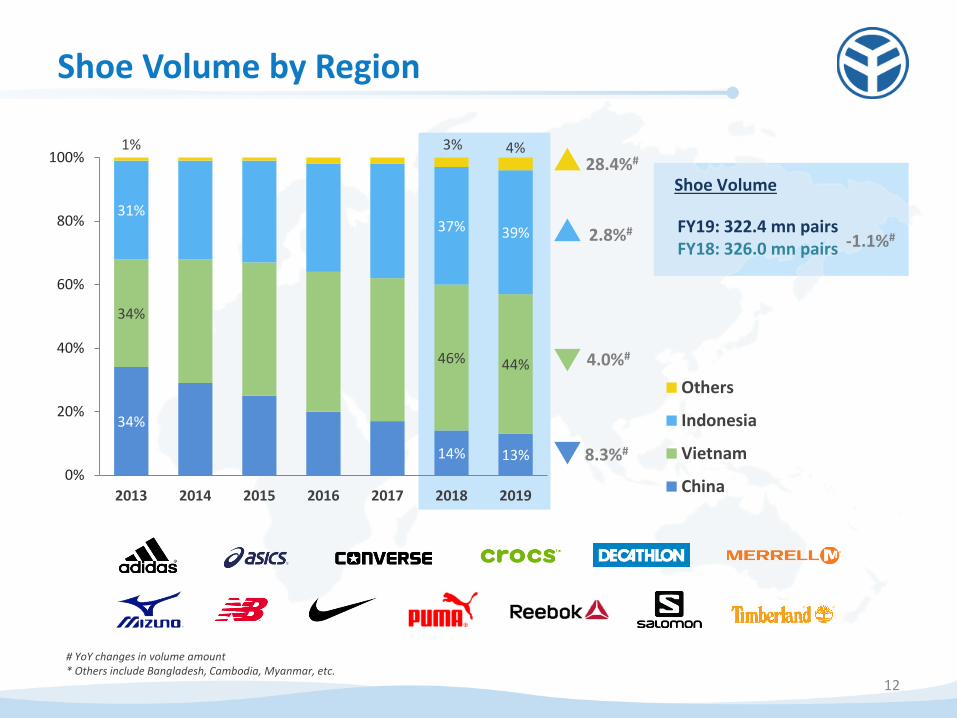
Shoe Volume by Region
12
34%
14% 13%
34%
46% 44%
31% 37% 39%
1% 3% 4%
0%
20%
40%
60%
80%
100%
2013 2014 2015 2016 2017 2018 2019
Others
Indonesia
Vietnam
China
# YoY changes in volume amount * Others include Bangladesh, Cambodia, Myanmar, etc.
Shoe Volume
FY19: 322.4 mn pairs FY18: 326.0 mn pairs -1.1%#
28.4%#
2.8%#
4.0%#
8.3%#

Manufacturing Productivity via ME
13
795.3
822.5
986.5
982.1
1,031.6 1,036.7
2014 2015 2016 2017 2018 2019
Pairs per person during the year
Pairs per Person during the year
PPH Index – Pairs per person per hour from 2014 (index from 100) to 2019
100.0
104.4
115.6
122.2
133.3
128.9
2014
2015
2016
2017
2018
2019
Base Year
0.5%

307.1
317.5
322.0 324.6
326.0
322.4
386.1K 386.0K
326.4K 330.5K
316.0K 311.0K
2014 2015 2016 2017 2018 2019
Volume 'mn MFG Employees
Manufacturing Productivity via ME
14
Pairs of shoes vs MFG employees from 2014 to 2019
1.1%
1.6%

YY Group Financial Highlights
15
(US$’000)
FY 2019 FY 2018 Y-o-Y
Revenue 10,105,387 9,695,282 +4.23%
Gross Profit 2,513,053 2,446,058 +2.74%
Gross Profit Margin 24.87% 25.23% -0.36pp
Operating Profit 470,670 498,591 -5.60%
Operating Profit Margin 4.66% 5.14% -0.48pp
Profit attrib. to Owners 300,546 307,116 -2.14%
Profit attrib. to Owners Margin 2.97% 3.17% -0.20pp
Non-recurring Profit (Loss) attrib. to Owners 18,254 (18,542) N/A
Recurring Profit attrib. to Owners 282,292 325,658 -13.32%
Source: Company accounts Please refer to the announcement on the HKEX website for the audited consolidated income statements of FY2019 & FY2018 For more details, please refer to Appendix

YY Group Financial Ratios
16
Source: Company accounts (figures rounded) Please refer to the announcement on the HKEX website for the audited consolidated income statements of FY2019 & FY2018 *Total borrowings and net borrowings exclude lease liabilities. Lease liabilities was US$ 402.7mn as at 31 Dec, 2019 # Total Debt to Equity and Net Debt to Equity (including lease liabilities) would be 55.0% and 33.3% as at 31 Dec, 2019 respectively
(US$’mn) FY 2019 FY 2018
Depreciation & Amortization 495.1 337.6
EBITDA 957.0 825.9
Capital Expenditure 398.1 494.4
Product Development 208.6 205.9
31 December 2019 31 December 2018
Total Borrowings* 2,089.9 2,123.9
Net Borrowings* 1,107.8 1,272.5
Total Borrowings to Equity # 46.1% 46.7%
Net Borrowings to Equity # 24.4% 28.0%
Quick Ratio (X) 1.1 X 1.1 X
Current Ratio (X) 1.8 X 1.9 X
FY 2019 FY 2018
Total Borrowings to EBITDA (X) 2.2 X 2.6 X
Net Borrowings to EBITDA (X) 1.2 X 1.5 X
Depreciation & Amortization 340,414+139,369+15,320
=495,103 EBITDA=956,968=957.0mn
Capital Expenditure=398,129 TB=2,492,611-130,368-272,364
=2,089,879 NB=1,510,532-130,368-
272,364=1,107,800
暫使用total equity (應使用board paper數據)
TB/Equity=2,089.9/4,533.1 =46.10%
NB/Equity=1,107.8/4,533.1 =24.43%
QR=(4,492,655-1,822,845) /2,458,995=1.08
CR=4,492,655/2,458,995=1.82
Total Debt to Equity 2,492,611/4,533,091=54.98%
Net Debt to Equity 1,510,532/4,533,091=33.32%
Equity使用board paper資產淨值(without IFRS 16)
TB/Equity=2,089.9/4,537.3 =46.06%=46.1%
NB/Equity=1,107.8/4,537.3 =24.41%=24.4%
Total Debt to Equity 2,492.6/4,537.3=54.93%
Net Debt to Equity 1,510.5/4,537.3=33.29%

YY Group’s Cash Position Increased 15.4% in FY19
17
851.4 982.1
Beginning Cash 1 Jan 19
Ending Cash 31 Dec 19
(US$’mn)
+874.9 -398.1
CAPEX
Cash from Operations
Interest Borrowing
Others
US$321.3mn Return to Shareholders
Disposal of TCHC
Net Borrowings Raised
+97.2
Lease Liabilities
Repayment and Interest
Share Buyback
Cash Dividend
-144.8
-12.2 -309.1
-72.3 +76.3 +18.8

4.8
6.4
5.8
6.5
7.6
7.4
6.6
5.3
4.1
4.4
4.0
7.5
9.9
8.7
9.4
11.3 11.3
12.1
10.0
7.4
8.0
7.3
FY14 1H15 FY15 1H16 FY16 1H17 FY17 1H18 FY18 1H19 FY19
ROA ROE
YY Group ROE & ROA Trend
18
Remark: ROE = Profit attributable to owners of the company/ (Total Equity - Minority Interests); half year data is on LTM basis ROA = Net Profit / Total Asset; half year data is on LTM basis
(%)
ROE 300,546/4,098,706
=7.33%=7.3% ROA
353,000/8,789,391 =4.01%=4.0%
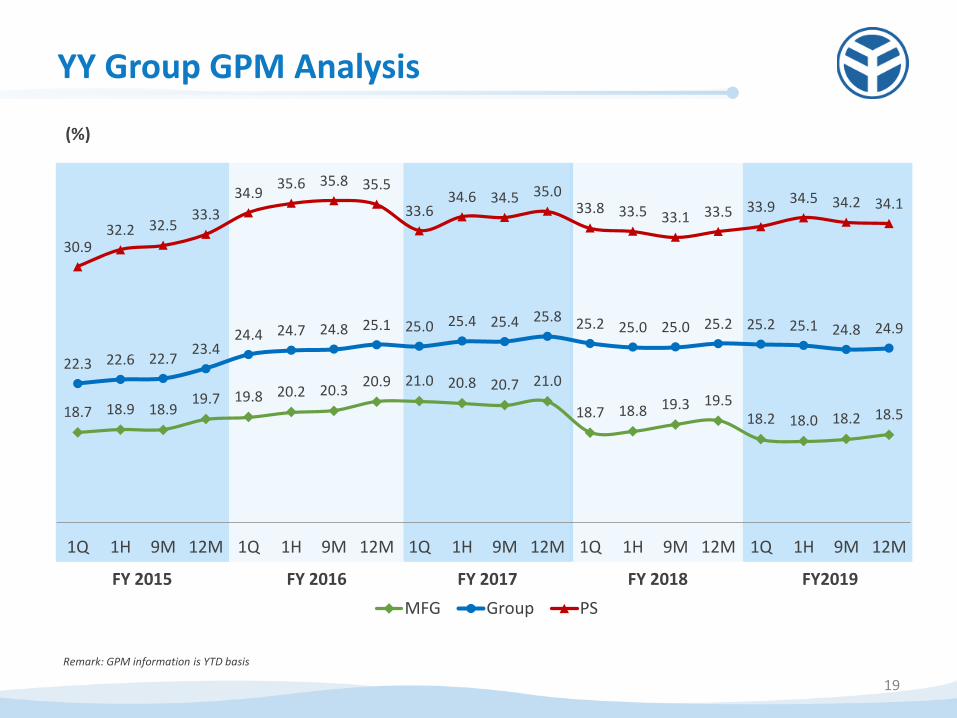
18.7 18.9 18.9 19.7 19.8 20.2 20.3
20.9 21.0 20.8 20.7 21.0
18.7 18.8 19.3 19.5 18.2 18.0 18.2 18.5
22.3 22.6 22.7 23.4
24.4 24.7 24.8 25.1 25.0 25.4 25.4 25.8 25.2 25.0 25.0 25.2 25.2 25.1 24.8 24.9
30.9 32.2 32.5
33.3
34.9 35.6 35.8 35.5
33.6 34.6 34.5 35.0
33.8 33.5 33.1 33.5 33.9 34.5 34.2 34.1
1Q 1H 9M 12M 1Q 1H 9M 12M 1Q 1H 9M 12M 1Q 1H 9M 12M 1Q 1H 9M 12M
MFG Group PS
YY Group GPM Analysis
19
Remark: GPM information is YTD basis
(%)
FY 2015 FY 2016 FY 2017 FY 2018 FY2019

Group excl. PS Note:
The figures in the following slides cover the core manufacturing and other operations of the consolidated entity of Yue Yuen Group, and are for analytical purposes only (prepared using the management accounts).

Group excl. PS Financial Highlights
21
(US$’000) MFG only
FY 2019 FY 2018 Y-o-Y FY 2019 FY 2018 Y-o-Y
Revenue 6,172,422 6,273,625
-1.61% 6,000,573 5,881,494
+2.02%
Gross Profit 1,171,368 1,299,557 -9.86% 1,107,034 1,149,027 -3.65%
Gross Profit Margin 18.98% 20.71% -1.73pp 18.45% 19.54% -1.09pp
Operating Profit 256,528 351,760 -27.07% 244,560 323,361 -24.37%
Operating Profit Margin 4.16% 5.61% -1.45pp 4.08% 5.50% -1.42pp
Profit attrib. to Owners 225,574 256,035 -11.90% 215,562 240,038 -10.20%
Profit attrib. to Owners Margin 3.65% 4.08% -0.43pp 3.59% 4.08% -0.49pp
Source: Company management accounts For more details, please refer to Appendix
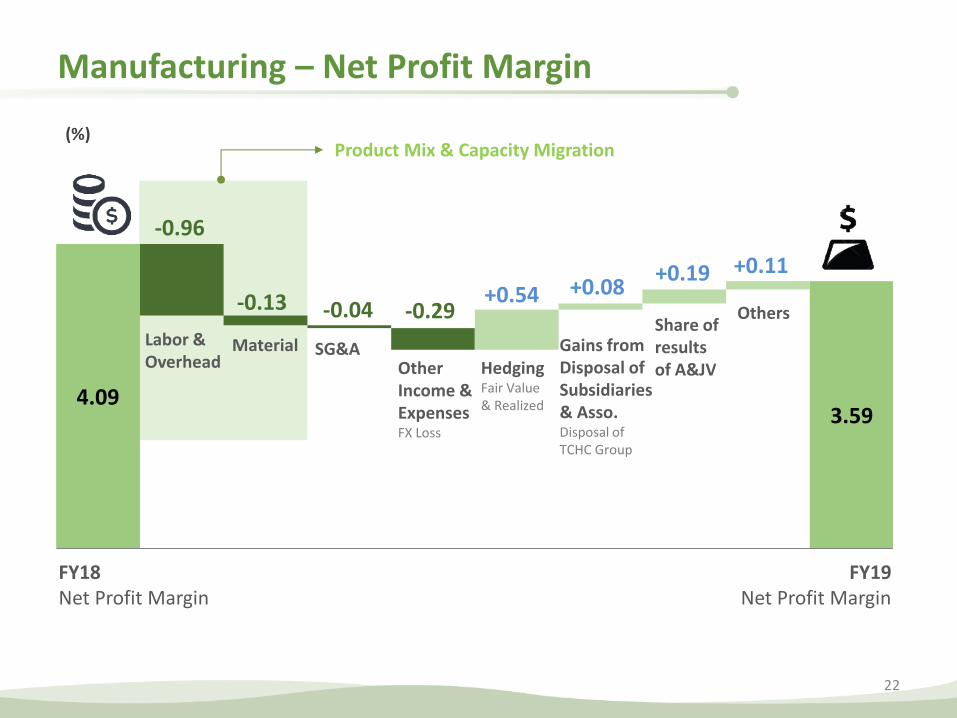
4.09 3.59
Product Mix & Capacity Migration
Manufacturing – Net Profit Margin
22
Material
-0.96
-0.13
FY18 Net Profit Margin
-0.04 +0.54 +0.08
+0.11
-0.29
+0.19
FY19 Net Profit Margin
Hedging Fair Value & Realized
Other Income & Expenses FX Loss
Others
(%)
Labor & Overhead
SG&A Gains from Disposal of Subsidiaries & Asso. Disposal of TCHC Group
Share of results of A&JV

Gross Profit
14.5% 14.2%
29.2% 30.4%
36.8% 36.9%
Manufacturing – COGS Decomposition and Y-o-Y
Amount (Y-o-Y)
Labor *
6.3%
2.4%
Overhead
FY19 FY18
% of Revenue % of Revenue
3.7%
FY19 GPM 18.5%
0.3%
Material
23 * Cost of labor includes cost of direct labor and indirect labor
46%
36%
18%
45%
37%
18%
FY19 vs. FY18 COGS Composition
Material Labor Overhead*
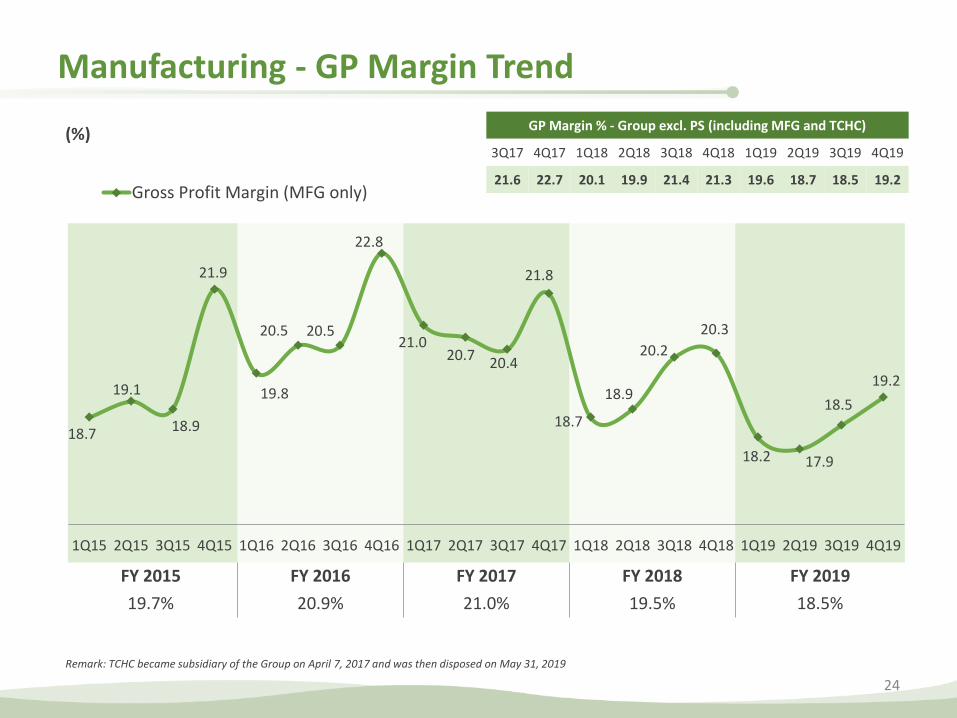
18.7
19.1
18.9
21.9
19.8
20.5 20.5
22.8
21.0 20.7
20.4
21.8
18.7
18.9
20.2
20.3
18.2 17.9
18.5
19.2
1Q15 2Q15 3Q15 4Q15 1Q16 2Q16 3Q16 4Q16 1Q17 2Q17 3Q17 4Q17 1Q18 2Q18 3Q18 4Q18 1Q19 2Q19 3Q19 4Q19
Gross Profit Margin (MFG only)
Manufacturing - GP Margin Trend
24
GP Margin % - Group excl. PS (including MFG and TCHC)
3Q17 4Q17 1Q18 2Q18 3Q18 4Q18 1Q19 2Q19 3Q19 4Q19
21.6 22.7 20.1 19.9 21.4 21.3 19.6 18.7 18.5 19.2
(%)
FY 2015 FY 2016 FY 2017 FY 2018 FY 2019
19.7% 20.9% 21.0% 19.5% 18.5%
Remark: TCHC became subsidiary of the Group on April 7, 2017 and was then disposed on May 31, 2019

5.3
6.1
3.7
6.8
5.9
7.5
6.7
9.8
6.9
7.2 7.8
8.6
5.7
4.8
4.8
6.7
4.5
3.6 3.6
4.6
1Q15 2Q15 3Q15 4Q15 1Q16 2Q16 3Q16 4Q16 1Q17 2Q17 3Q17 4Q17 1Q18 2Q18 3Q18 4Q18 1Q19 2Q19 3Q19 4Q19
Operating Profit Margin (MFG Only)
Manufacturing - OP Margin Trend
25
OP Margin % - Group excl. PS (including MFG and TCHC)
3Q17 4Q17 1Q18 2Q18 3Q18 4Q18 1Q19 2Q19 3Q19 4Q19
8.0 8.4 6.0 4.7 5.2 6.5 4.7 3.7 3.6 4.6
(%)
FY 2015 FY 2016 FY 2017 FY 2018 FY 2019
5.5% 7.6% 7.7% 5.5% 4.1%
Remark: TCHC became subsidiary of the Group on April 7, 2017 and was then disposed on May 31, 2019

Group excl. PS Financial Ratios
26
MFG only
(US$’mn) FY 2019 FY 2018 FY 2019 FY 2018
Depreciation & Amortization 282.8 260.6 276.1 253.7
EBITDA 531.7 603.0 513.1 567.8
Capital Expenditure 280.8 411.1 279.3 405.2
31 Dec 2019 31 Dec 2018 31 Dec 2019 31 Dec 2018
Total Borrowings* 1,580.7 1,619.5 1,580.7 1,525.6
Net Borrowings* 686.7 874.5 686.7 787.7
Total Borrowings to Equity # 42.6% 42.6% 42.6% 41.1%
Net Borrowings to Equity # 18.5% 23.0% 18.5% 21.2%
FY 2019 FY 2018 FY 2019 FY 2018
Total Borrowings to EBITDA (X) 3.0 X 2.7 X 3.1 X 2.7 X
Net Borrowings to EBITDA (X) 1.3 X 1.5 X 1.3 X 1.4 X
Return on Owner’s Equity 6.1% 6.8% 5.8% 6.5%
Return on Asset 3.4% 3.8% 3.3% 3.7%
Source: Company management accounts (figures rounded) *Total borrowings and net borrowings exclude lease liabilities. Lease liabilities was US$ 12.9 mn as at 31 Dec, 2019 # Total Debt to Equity and Net Debt to Equity (including lease liabilities) would be 42.9% and 18.9% as at 31 Dec, 2019 respectively
Depreciation & Amortization 271,889+10,782+148=282,819
269,456+6,630=276,086 EBITDA
531,748=531.7 mn 513,057=513.1 mn Capital Expenditure 280,785=280.8 mn 279,250=279.3 mn
TB/EBITDA=1,580.7/531.7=2.97 TB/EBITDA=1,580.7/513.1=3.08 NB/EBITDA=686.7/531.7=1.29 NB/EBITDA=686.7/513.1=1.33
ROE=225,574/3,695,251=6.10% ROE=215,562/3,695,251=5.83% ROA=225,574/6,575,946=3.43% ROA=215,562/6,575,946=3.27%
Total Debt to Equity =1,593.5/3,710.4=42.94%
Net Debt to Equity 699.6/3,710.4=18.85%
TB=1,593,535-2,629-10,231 =1,580,675
NB=699,567-2,629-10,231=686,707
TB/Equity=1,580.7/3,710.4 =42.6%
NB/Equity=686.7/3,710.4 =18.50%
FY 2018 MFG only 250,128+3,577=253,705
FY 2018 MFG only
TB/EBITDA=1526.6/567.8=2.68 NB/EBITDA=787.7/567.8=1.38
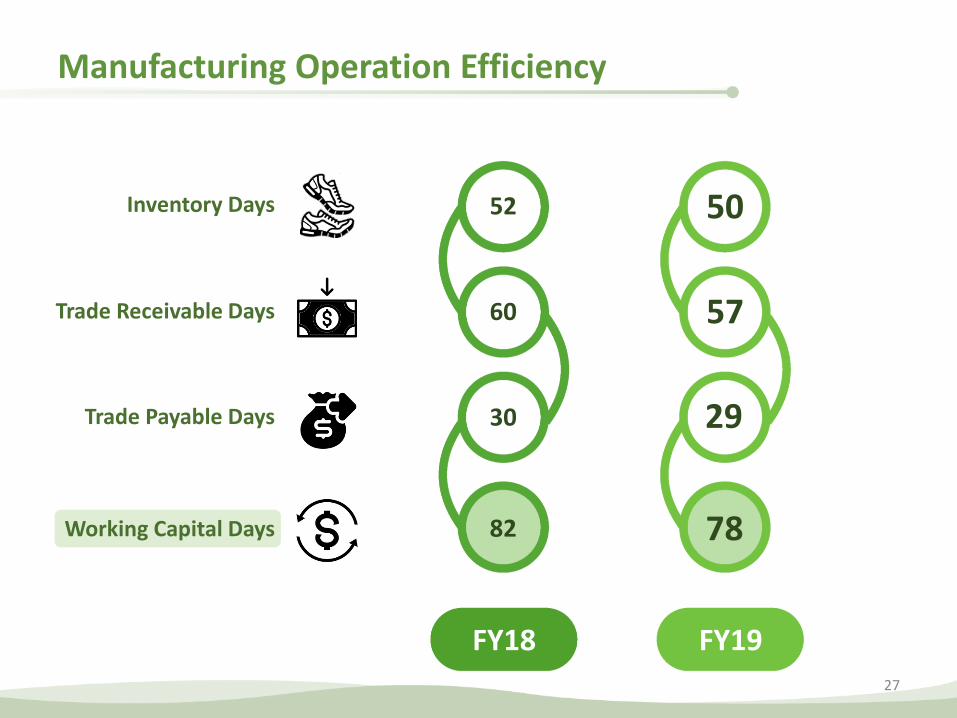
Working Capital Days
Manufacturing Operation Efficiency
Trade Receivable Days
Inventory Days
Trade Payable Days
52
60
30
82
FY18
27
FY19
50
57
29
78
Pou Sheng International
Note:
The figures in the following slides are based on Pou Sheng’s management accounts and announcements, and Pou Sheng adopts RMB as its
reporting currency
Agenda
01 Financial Highlights p31-35
02 Business Update p37-40
03 Omni-channel Strategy p42-44
04 Summary and Outlook p46-47

Distinguished Partners and Sports Services
30
VISION MAKE SPORTS YOUR LIFE!
Products Sports Events Sports Services

Pou Sheng Financial Highlights
31
RMB'mn US$'000
FY 2019 FY 2018 Y-o-Y FY 2019 FY 2018 Y-o-Y
Revenue 27,190 22,677 +19.90% 3,932,965 3,421,657
+14.94%
Gross Profit 9,275 7,599 +22.06% 1,341,685 1,146,501 +17.02%
Gross Profit Margin 34.11% 33.51% +0.60pp 34.11% 33.51% +0.60pp
Operating Profit 1,472 967 +52.22% 212,936 145,887 +45.96%
Operating Profit Margin 5.41% 4.26% +1.15pp 5.41% 4.26% +1.15pp
Profit attrib. to Owners of PS 833 543 +53.41% 120,533 81,913 +47.15%
Profit attrib. to Owners Margin 3.06% 2.39% +0.67pp 3.06% 2.39% +0.67pp
Source: Based on Pou Sheng’s announcement on the HKEX website for the audited consolidated income statements of FY2019 & FY2018 For more details, please refer to Appendix
For FY 2019, the profit for the period decreased by RMB27.9 million due to the application of HKFRS16.

30.9
33.4
33.2
35.8
34.9
36.3
36.2
34.8
33.6
35.6
34.5
36.3
33.8 33.3
32.2
34.6
33.9
35.2
33.5
33.9
1Q15 2Q15 3Q15 4Q15 1Q16 2Q16 3Q16 4Q16 1Q17 2Q17 3Q17 4Q17 1Q18 2Q18 3Q18 4Q18 1Q19 2Q19 3Q19 4Q19
Gross Profit Margin
Pou Sheng GP Margin Trend
32
(%)
FY 2015 FY 2016 FY 2017 FY 2018 FY 2019
33.3% 35.5% 35.0% 33.5% 34.1%

3.5
5.8
4.3
2.9
6.6 7.2
5.5
3.5
4.5
6.1
2.9 2.8
4.6 4.9
3.0
4.5 5.4
6.2
4.9
5.2
1Q15*2Q15*3Q15*4Q15* 1Q16 2Q16 3Q16 4Q16 1Q17 2Q17 3Q17 4Q17 1Q18 2Q18 3Q18 4Q18 1Q19 2Q19 3Q19 4Q19
Operating Profit Margin
Pou Sheng OP Margin Trend
33
* The figures have been restated due to the application of merger accounting
(%)
FY 2015 FY 2016 FY 2017 FY 2018 FY 2019
4.1% 5.7% 4.1% 4.3% 5.4%
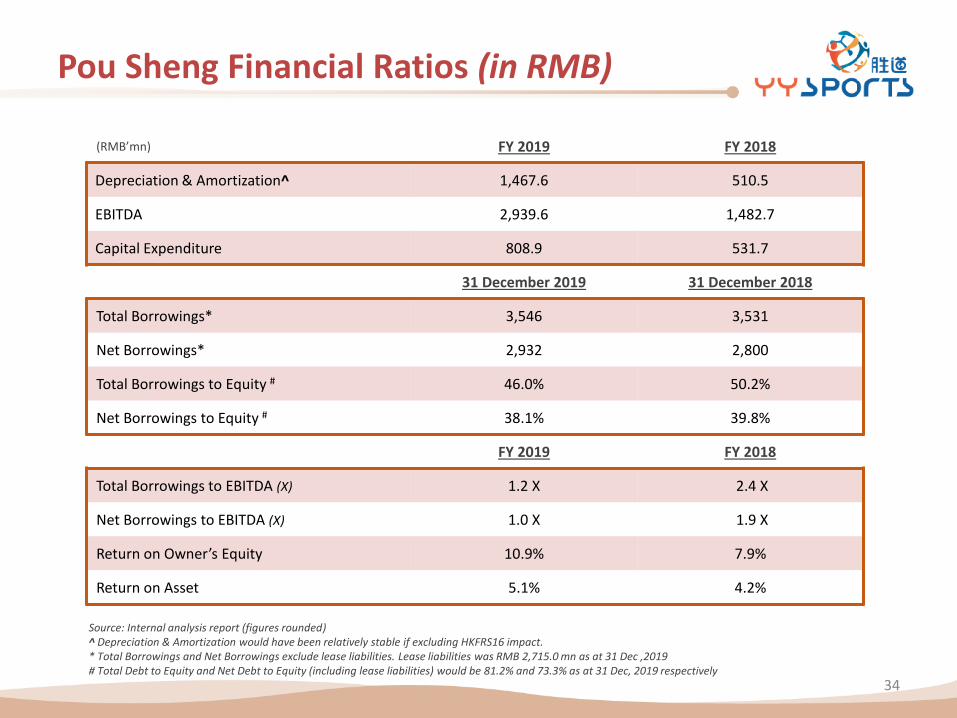
Pou Sheng Financial Ratios (in RMB)
34
(RMB’mn) FY 2019 FY 2018
Depreciation & Amortization^ 1,467.6 510.5
EBITDA 2,939.6 1,482.7
Capital Expenditure 808.9 531.7
31 December 2019 31 December 2018
Total Borrowings* 3,546 3,531
Net Borrowings* 2,932 2,800
Total Borrowings to Equity # 46.0% 50.2%
Net Borrowings to Equity # 38.1% 39.8%
FY 2019 FY 2018
Total Borrowings to EBITDA (X) 1.2 X 2.4 X
Net Borrowings to EBITDA (X) 1.0 X 1.9 X
Return on Owner’s Equity 10.9% 7.9%
Return on Asset 5.1% 4.2%
Source: Internal analysis report (figures rounded) ^ Depreciation & Amortization would have been relatively stable if excluding HKFRS16 impact. * Total Borrowings and Net Borrowings exclude lease liabilities. Lease liabilities was RMB 2,715.0 mn as at 31 Dec ,2019 # Total Debt to Equity and Net Debt to Equity (including lease liabilities) would be 81.2% and 73.3% as at 31 Dec, 2019 respectively
Total Borrowings 3,545,995
Net Borrowings 3,545,995-613,591
=2,932,404
3,545,995/7,706,078=46.0% 2,932,404/7,706,078=38.1%
ROE 833,275/7,612,574=10.94%
ROA 879,910/17,390,782=5.1%
Lease Liability
889,552+1,825,445 =2,714,997=2715.0 mn
Total Debt=3546+2715=6,261
Total Debt to Equity 6,261/7,706 =81.24%
Net Debt=2,932+2715=5,647 Net Debt to Equity
5,647/7,706=73.28%
Total Borrowings to EBITDA (X) 3,546/2,939.6=1.2
Net Borrowings to EBITDA (X) 2,932/2,939.6=0.997=1.0

Working Capital Days
Operation Efficiency
35
Trade Receivable Days
Inventory Days
Trade Payable Days
FY19
150
21
15
156
149
27
15
161
FY18
Based on RMB

Agenda
01 Financial Highlights p31-35
02 Business Update p37-40
03 Omni-channel Strategy p42-44
04 Summary and Outlook p46-47
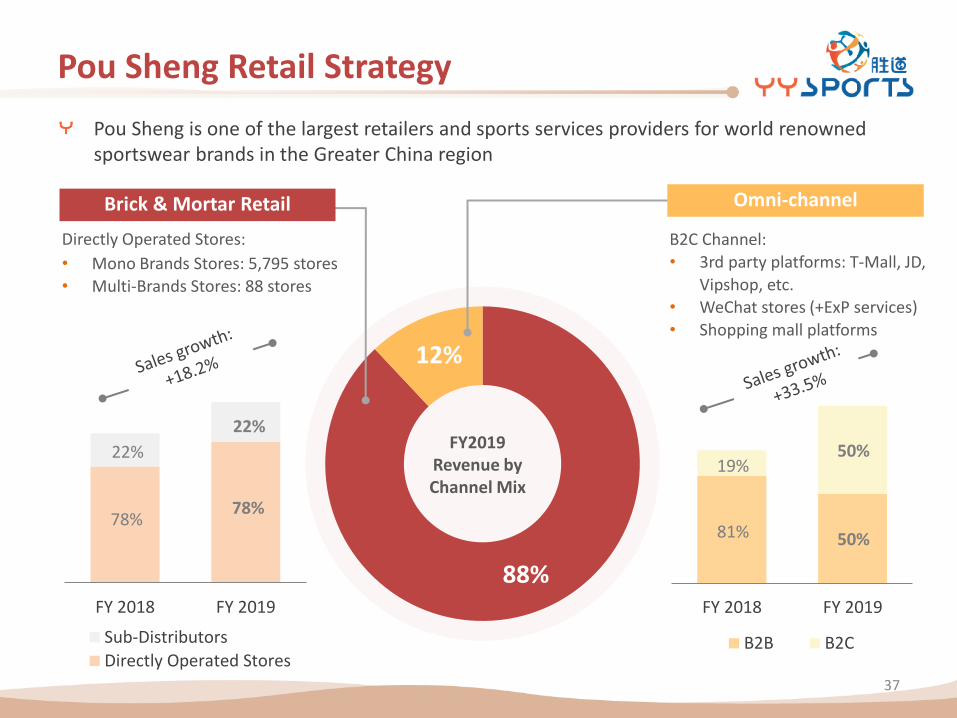
Pou Sheng Retail Strategy
7
88%
12%
FY2019 Revenue by Channel Mix
FY 2018 FY 2019
Sub-Distributors
Directly Operated Stores
78% 78%
22%
22%
Pou Sheng is one of the largest retailers and sports services providers for world renowned sportswear brands in the Greater China region
Brick & Mortar Retail Omni-channel
• Mono Brands Stores: 5,795 stores
• Multi-Brands Stores: 88 stores
FY 2018 FY 2019
B2B B2C
19%
50% 81%
50%
B2C Channel:
• 3rd party platforms: T-Mall, JD,
Vipshop, etc. • WeChat stores (+ExP services)
• Shopping mall platforms
37
Directly Operated Stores:

Pou Sheng Store Performance
38
Sub-Distributor (Franchisee)
As at December 31, 2018
5,648 235
Directly Operated (Own-Store)
Total Store Net
New Store +/(-)
5,883
3,551 3,551 399 3,950
9,833
Number of Stores
634 9,199
As at December 31, 2019

Pou Sheng Retail Coverage
PS retail channel covers more than 300 cities in the Greater China
> 300 stores 100- 300 stores <100 stores
39

1.9%
5.6%
1.5%
12.0%
10.1%
2.2%
8.9%
8.7% 8.4%
4.2%
6.0%
1.9%
1Q17 2Q17 3Q17 4Q17 1Q18 2Q18 3Q18 4Q18 1Q19 2Q19 3Q19 4Q19
Same Store Sales Growth
Pou Sheng Same Store Sales Growth (SSSg)
40
(%)
FY 2017 FY 2018 FY 2019
5.3% 7.4% 5.0%

Agenda
01 Financial Highlights p31-35
02 Business Update p37-40
03 Omni-channel Strategy p42-44
04 Summary and Outlook p46-47
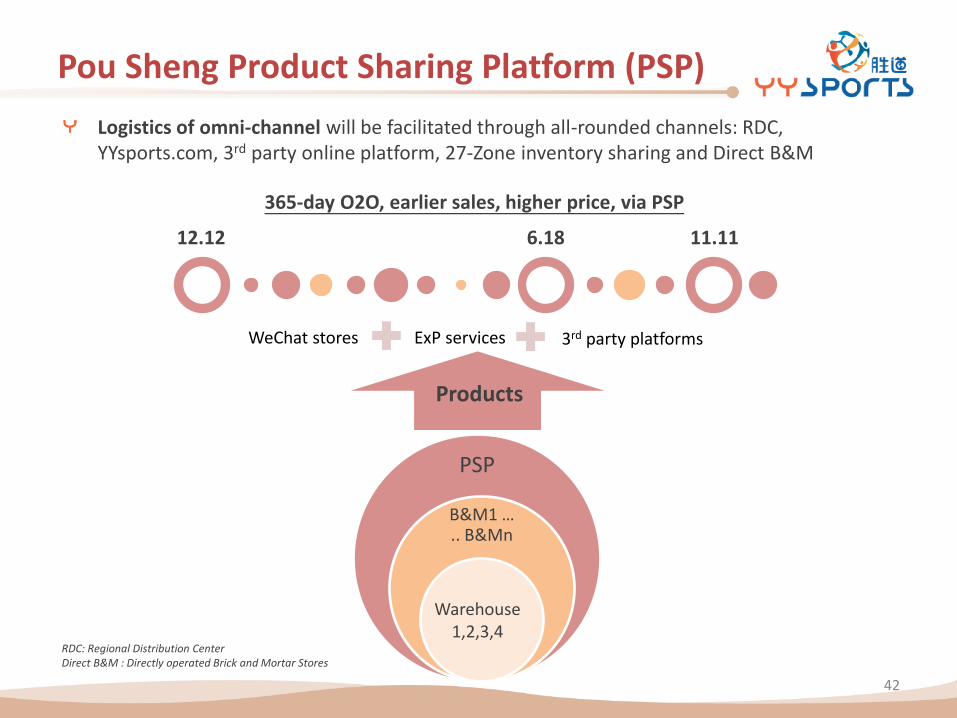
Pou Sheng Product Sharing Platform (PSP)
Logistics of omni-channel will be facilitated through all-rounded channels: RDC, YYsports.com, 3rd party online platform, 27-Zone inventory sharing and Direct B&M
PSP
B&M1 ….. B&Mn
12.12
YY Sports app
YY Sports app
6.18 11.11
365-day O2O, earlier sales, higher price, via PSP
Warehouse 1,2,3,4
Products
RDC: Regional Distribution Center Direct B&M : Directly operated Brick and Mortar Stores
42
3rd party platforms ExP services WeChat stores

Pou Sheng Product Sharing Platform (PSP)
Participation rate: more than 60% Direct B&M stores participate PSP at the end of 2019
43
Kunshan
Taicang
Dongguan
Regional Warehouse
PSP Contribution - Top 6 Regions
Participating PSP Regions

New Service Hub to Enhance Omni-channel Capability
44
“Low Conversion Offline Network” +
“Discount Online Network”
Service Hub (Next Store) Series of 1-day event & 364 days fun services Products with stories & outfit consultations
M Mono Brand Stores Convert shoppers into loyal members
(Less stores more sales) Membership w/ privilege to Service Hub
(Higher sales conversion rate) Modularized services in mono brand stores (Uniqueness)
M
M
M M
M
M
M
M
M
M
Online 24/7 Communication Platform Magazine-like contents to
“Make sports your life” APP, mini-program & other strategic resources to enact inactive target audiences
“Normal price + premium services” by omni- platform connecting to efficient retail network
Sports Services & ExP Program Expand and engage active membership

Agenda
01 Financial Highlights p31-35
02 Business Update p37-40
03 Omni-channel Strategy p42-44
04 Summary and Outlook p46-47

Pou Sheng COVID-19 Reaction Plan
46
• Accelerate B2C sales & PSP contribution
• Roll out WeChat mini stores to drive sales growth
• Brand collaboration & inventory management e.g return inventory, reduce in-season purchase, support promotion discount
• Rent reduction negotiation
• Government support
• Closely monitor and maintain cash flow & gearing ratio at a healthy level
• Real-time monitor daily sales & store re-open progress
• Monitor wholesaler & provide appropriate support
1
Operation
2
Brick & Mortar Stores 3
Omni- Channel

Future Target: Profitable Growth
Future Target
• Total revenue growth in mid-teens, with omni-channel contributing 20% of total revenue • More in-season sales and more effective off-season products sales through various 3rd party channels • Integrating the Service Hub model into our strong brick and mortar stores foundation • Turnaround of emerging brands and licensee brands • Operating margin improving by 2 percentage points
Retail Network
Omni-Channel
Next
Store
“Creating Value-added Services and Quality Experiences to Customers”
47

Appendix

Shareholding Structure
49
Pou Chen (9904.TT)
Yue Yuen Industrial (Holdings) Ltd. (551.HK)
62.19%
51.11%
* As at December 31, 2019
100%
Manufacturing and Others Pou Sheng (3813.HK)
From Queenie: As at Dec 31, 2019, PCC holds 51.1197% of YY while YY holds 62.1967% of PS.

Company Milestones
50
Started first overseas production in south China
Established production bases in Vietnam
Established production bases in Mexico
Established production bases in eastern and inland China
Began operations at the new headquarters in Taichung, Taiwan
Established production bases in Bangladesh & Cambodia
Established production bases in Myanmar
1988
1992
1994
1998
2001
2002
2006
2008
2009
2014
2015
Expanded into retail business in China
Became sole licensee for Hush Puppies in Taiwan
Pou Sheng International listed on HKEX (3813.HK)
Became sole licensee for Pony in Taiwan & China
Yue Yuen
Pou Sheng
2012 Ms. Tsai Pei Chun, Patty appointed as CEO of Pou Chen Group
Yue Yuen Industrial listed on HKEX (551.HK) Established production bases in Indonesia
Yue Yuen Industrial founded
2019
Parent Pou Chen Group is accredited by FLA 2018
Parent Pou Chen Group’s 50th Anniversary
Recorded RMB 22 bn revenue. Sales channels over 9,000
Omni-channel contributed ~12% of total sales in 2019
Became sole licensee for Rockport footwear and GEOX in China
2016
Revenue crossed the US$10 bn mark
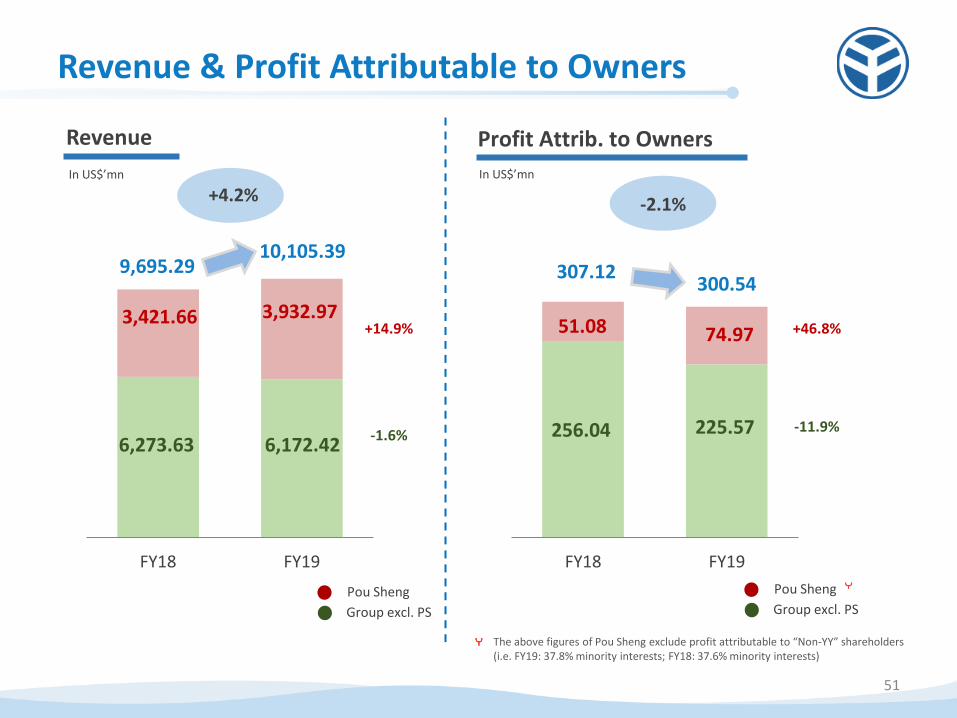
FY18 FY19
3,421.66
6,273.63
3,932.97
6,172.42
9,695.29 10,105.39
FY18 FY19
Revenue & Profit Attributable to Owners
51
Revenue
In US$’mn
Profit Attrib. to Owners
In US$’mn
Pou Sheng
Group excl. PS
The above figures of Pou Sheng exclude profit attributable to “Non-YY” shareholders (i.e. FY19: 37.8% minority interests; FY18: 37.6% minority interests)
Pou Sheng
Group excl. PS
-2.1% +4.2%
+14.9%
-1.6%
+46.8%
-11.9%
51.08
256.04
74.97
225.57
307.12 300.54

YY Group Financial Highlights
52
Source: Company accounts Please refer to the announcement on the HKEX website for the audited consolidated income statements of FY2019 & FY2018 *Finance Cost in FY19 grew by 14.4% due largely to the US$15.5 mn effects of the application of HKFRS16
FY 2019 FY 2018 Y-o-Y
US$'000 % US$'000 % + / -
Revenue 10,105,387 100.00 9,695,282 100.00 +4.23%
Cost of Sales (7,592,334) -75.13 (7,249,224) -74.77 +4.73%
Gross Profit 2,513,053 24.87 2,446,058 25.23 +2.74%
SG&A (1,904,794) -18.85 (1,818,348) -18.76 +4.75%
Other Income & Expenses, net (137,589) -1.36 (129,119) -1.33 +6.56%
Operating Profit 470,670 4.66 498,591 5.14 -5.60%
Finance Cost* (92,122) -0.91 (80,551) -0.83 +14.36%
Share of Results of A&JV 51,995 0.51 39,480 0.41 +31.70%
Other Gains and Losses 17,895 0.17 (17,956) -0.19 N/A
Income Tax (95,438) -0.94 (98,448) -1.01 -3.06%
Profit for the Period 353,000 3.49 341,116 3.52 +3.48%
Profit attrib. to Owners 300,546 2.97 307,116 3.17 -2.14%
Other Gain and Loses (%) =17,895/10,105,387
=0.177%=0.17%

Group excl. PS Financial Highlights – MFG and TCHC
53
Source: Company management accounts
FY 2019 FY 2018 Y-o-Y
US$'000 % US$'000 % + / -
Revenue 6,172,422 100.00 6,273,625 100.00 -1.61%
Cost of Sales (5,001,054) -81.02 (4,974,068) -79.29 +0.54%
Gross Profit 1,171,368 18.98 1,299,557 20.71 -9.86%
SG&A (726,648) -11.66 (779,464) -12.42 -6.78%
Other Income & Expenses, net (188,192) -3.05 (168,333) -2.68 +11.80%
Operating Profit 256,528 4.16 351,760 5.61 -27.07%
Finance Cost (56,318) -0.91 (57,942) -0.92 -2.80%
Share of Results of A&JV 51,837 0.84 39,620 0.63 +30.84%
Other Gains and Losses 19,273 0.31 (17,956) -0.29 N/A
Income Tax (45,598) -0.74 (58,996) -0.94 -22.71%
Profit for the Period 225,722 3.66 256,486 4.09 -11.99%
Profit attrib. to Owners 225,574 3.65 256,035 4.08 -9.16%

Group excl. PS Financial Highlights – MFG only
54
Source: Company management accounts
FY 2019 FY 2018 Y-o-Y
US$'000 % US$'000 % + / -
Revenue 6,000,573 100.00 5,881,494 100.00 +2.02%
Cost of Sales (4,893,539) -81.55 (4,732,467) -80.46 +3.40%
Gross Profit 1,107,034 18.45 1,149,027 19.54 -3.65%
SG&A (674,076) -11.23 (658,261) -11.19 2.40%
Other Income & Expenses, net (188,398) -3.14 (167,405) -2.85 +12.54%
Operating Profit 244,560 4.08 323,361 5.50 -24.37%
Finance Cost (53,894) -0.90 (52,670) -0.89 +2.32%
Share of Results of A&JV 51,837 0.86 39,620 0.67 +30.84%
Other Gains and Losses 19,273 0.32 (17,956) -0.31 N/A
Income Tax (46,066) -0.77 (51,866) -0.88 -11.18%
Profit for the Period 215,710 3.59 240,489 4.09 -10.30%
Profit attrib. to Owners 215,562 3.59 240,038 4.08 -10.20%
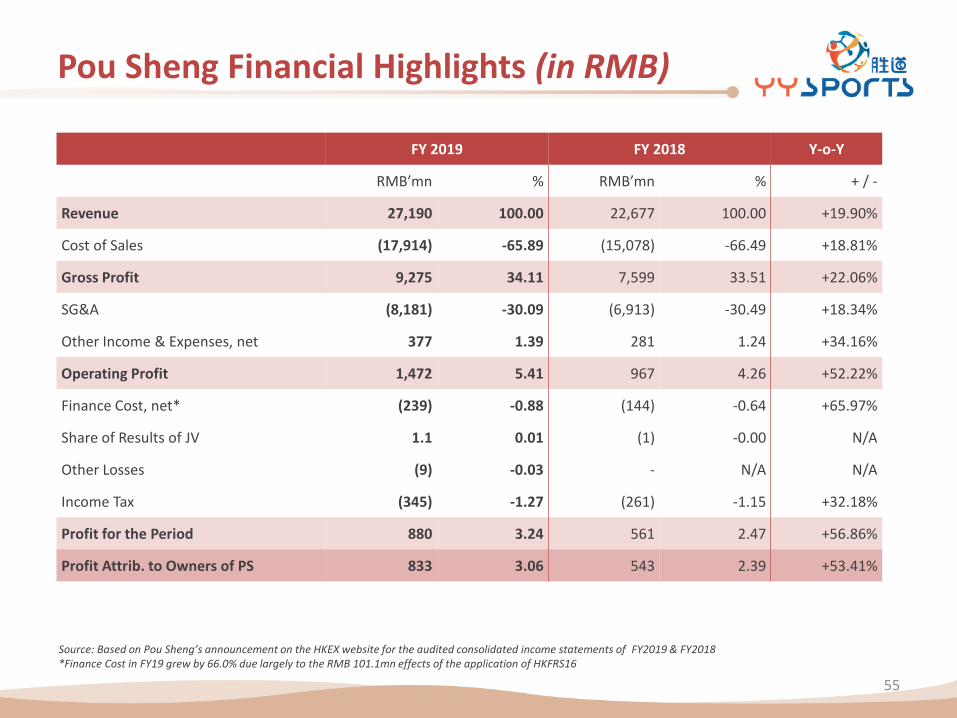
Pou Sheng Financial Highlights (in RMB)
55
FY 2019 FY 2018 Y-o-Y
RMB’mn % RMB’mn % + / -
Revenue 27,190 100.00 22,677 100.00 +19.90%
Cost of Sales (17,914) -65.89 (15,078) -66.49 +18.81%
Gross Profit 9,275 34.11 7,599 33.51 +22.06%
SG&A (8,181) -30.09 (6,913) -30.49 +18.34%
Other Income & Expenses, net 377 1.39 281 1.24 +34.16%
Operating Profit 1,472 5.41 967 4.26 +52.22%
Finance Cost, net* (239) -0.88 (144) -0.64 +65.97%
Share of Results of JV 1.1 0.01 (1) -0.00 N/A
Other Losses (9) -0.03 - N/A N/A
Income Tax (345) -1.27 (261) -1.15 +32.18%
Profit for the Period 880 3.24 561 2.47 +56.86%
Profit Attrib. to Owners of PS 833 3.06 543 2.39 +53.41%
Source: Based on Pou Sheng’s announcement on the HKEX website for the audited consolidated income statements of FY2019 & FY2018 *Finance Cost in FY19 grew by 66.0% due largely to the RMB 101.1mn effects of the application of HKFRS16
Cost of sales (%) =17,914,296/27,189,765
=65.89%
Profit for the Period(%) =880/27,190 =3.236=3.24
Share of Results of JV(%) =1.1/27,190 =0.004=0.01

Pou Sheng Financial Highlights (in USD)
56
FY 2019 FY 2018 Y-o-Y
US$’000 % US$’000 % + / -
Revenue 3,932,965 100.00 3,421,657 100.00 +14.94%
Cost of Sales (2,591,280) -65.89 (2,275,156) -66.49 +13.89%
Gross Profit 1,341,685 34.11 1,146,501 33.51 +17.02%
SG&A (1,178,146) -29.96 (1,038,884) -30.37 +13.40%
Other Income & Expenses, net 49,397 1.26 38,270 1.12 +29.07%
Operating Profit 212,936 5.41 145,887 4.26 +45.96%
Finance Cost, net* (34,598) -0.88 (21,665) -0.64 +59.70%
Share of Results of JV 158 0.01 (140) -0.00 N/A
Other Losses (1,378) -0.03 - N/A N/A
Income Tax (49,840) -1.27 (39,452) -1.15 +26.33%
Profit for the Year 127,278 3.24 84,630 2.47 +50.39%
Profit Attrib. to Owners of PS 120,533 3.06 81,913 2.39 +47.15%
Source: Internal analysis report (figures rounded); various accounting reclassification and adjustments are made to some of the figures when consolidating Pou Sheng numbers into the Yue Yuen Group in order to comply with the requirements of accounting standards *Finance Cost in FY19 grew by 59.7% due largely to the US$14.6mn effects of the application of HKFRS16
Share of Results of JV(%) =158/3,932,965
=0.004=0.01
Other Losses(%) =1,378/3,932,965
=0.035=0.03(配合P.53)

Thank you
Q&A