Youth employment and unemployment: an Indian · PDF fileYouth employment and unemployment: an...
30
Arup Mitra and Sher Verick March 2013 DWT for South Asia and Country Office for India ILO Asia-Pacific Working Paper Series Youth employment and unemployment: an Indian perspective
Transcript of Youth employment and unemployment: an Indian · PDF fileYouth employment and unemployment: an...
Arup Mitra and Sher VerickMarch 2013
DWT for South As ia and Country Off ice for India
I LO As ia - Pa c i f i c Wor k i n g Pa per Se r i es
Youth employment and unemployment: anIndian perspective


DWT for South Asia and Country Office for India
ILO Asia-Pacific Working Paper Series
Youth employment and unemployment:An Indian perspective
Arup Mitra and Sher VerickMarch 2013
ILO DWT for South Asia and Country Office for India ii
Copyright © International Labour 2013First published 2013
Publications of the International Labour Office enjoy copyright under Protocol 2 of the Universal CopyrightConvention. Nevertheless, short excerpts from them may be reproduced without authorization, on condition thatthe source is indicated. For rights of reproduction or translation, application should be made to ILO Publications(Rights and Permissions), International Labour Office, CH-1211 Geneva 22, Switzerland, or by email:[email protected]. The International Labour Office welcomes such applications.
Libraries, institutions and other users registered with reproduction rights organizations may make copies inaccordance with the licences issued to them for this purpose. Visit www.ifrro.org to find the reproduction rightsorganization in your country.
Mitra, Arup; Verick, Sher
Youth employment and unemployment: an Indian perspective / Arup Mitra and Sher Verick; InternationalLabour Organization, DWT for South Asia and Country Office for India. - New Delhi: ILO, 2013
ILO Asia-Pacific working paper series, ISSN 2227-4491; 2227-4405 (web pdf)
International Labour Organization; ILO DWT for South Asia and ILO Country Office for India
youth employment / youth unemployment / young worker / labour force participation / India
13.01.3
ILO Cataloguing in Publication Data
The designations employed in ILO publications, which are in conformity with United Nations practice, and thepresentation of material therein do not imply the expression of any opinion whatsoever on the part of theInternational Labour Office concerning the legal status of any country, area or territory or of its authorities, orconcerning the delimitation of its frontiers.
The responsibility for opinions expressed in signed articles, studies and other contributions rests solely withtheir authors, and publication does not constitute an endorsement by the International Labour Office of theopinions expressed in them.
Reference to names of firms and commercial products and processes does not imply their endorsement by theInternational Labour Office, and any failure to mention a particular firm, commercial product or process is not asign of disapproval.
ILO publications and electronic products can be obtained through major booksellers or ILO local offices inmany countries, or direct from ILO Publications, International Labour Office, CH-1211 Geneva 22,Switzerland, or ILO DWT for South Asia and Country Office for India, Core 4B, 3rd Floor, India Habitat Centre,Lodhi Road, New Delhi 110003, India, or by email: [email protected]. Catalogues or lists of new publications areavailable free of charge from the above address, or by email: [email protected].
Visit our website: www.ilo.org/publns or www.ilo.org/india.
Printed in India

ILO DWT for South Asia and Country Office for India iii
Preface
The International Labour Organization (ILO) is devoted to advancing opportunities for women andmen to obtain decent and productive work. It aims to promote rights at work, encourage decentemployment opportunities, enhance social protection and strengthen dialogue in handling work-related issues.
However, decent work remains elusive in many countries, particularly as a consequence of the globalfinancial crisis, which has hit labour markets hard. As witnessed around the world, young people havesuffered disproportionately since the onset of the crisis, which comes on top of the persistent barriersthey experience in gaining a foothold in the labour market. This situation represents one of thegreatest urgencies facing all countries.
This paper by Arup Mitra and Sher Verick provides important insights into the challenges facingyoung people in India in terms of underemployment, unemployment and the lack of job opportunitiesin the formal economy. The study highlights the diversity in outcomes for young people depending ontheir educational attainment, social status and where they live. Overall, the findings underscore theneed for comprehensive approaches to promote more and better jobs for young people in India andbeyond.
This paper is part of the ILO Asia-Pacific Working Paper Series, which aims to enhance the body ofknowledge, stimulate discussion and encourage knowledge-sharing and further research for thepromotion of decent work in Asia and the Pacific.
Tine StaermoseDirector, ILO DWT for South Asia and
Country Office for India

ILO DWT for South Asia and Country Office for India iv

ILO DWT for South Asia and Country Office for India v
Table of contents
PagePreface ……………………………………………………………………………………………… iiiAcknowledgements............................................................................................................................. viiAbstract ................................................................................................................................................ ixAbbreviations....................................................................................................................................... xi1. Introduction ..................................................................................................................................... 12. How are youth participating in the labour market in India?............................................................ 2
2.1 Labour force participation of youth in India ............................................................................. 22.2 Youth worker population ratio (WPR) ..................................................................................... 4
3. Characterizing youth employment in India ..................................................................................... 73.1 The nature of youth employment .............................................................................................. 73.2 Employment profile across sectors............................................................................................ 8
4. Youth unemployment in India......................................................................................................... 95. Econometric analysis of determinants of youth labour force participation................................... 126. Conclusion..................................................................................................................................... 13References........................................................................................................................................... 15
List of figures1. Labour force participation rate (%) by age and location, 2009-10 ................................................... 32. Education and worker population ratio (WPR) (%), 2009-10 .......................................................... 63. Youth unemployment rate (%) (usual status), 2009-10 .................................................................... 94. Unemployment rates (%) (usual status) by educational attainment, 2009-10................................. 11
List of tables1. Labour force participation rate (%) of youth and adults, 2009-10.................................................... 22. Labour force participation rate (%) among youth (15-29) by social categories, 2009-10 ................ 33. Age-specific worker population ratio (%) in rural areas, 1993-94, 1999-00, 2004-05,
and 2009-10..................................................................................................................................... 44. Age-specific worker population ratio (%) in urban areas, 1993-94, 1999-00, 2004-05, 2009-10 .... 55. Youth worker population ratio (%) in rural and urban areas by educational attainment, 2009-10.. 66. Nature of employment (usual status), 2009-10................................................................................ 87. Sectoral employment shares (%), 2009-10 ...................................................................................... 88. Youth unemployment rate (%) (usual and current daily status), 2009-10 ....................................... 99. Unemployment rates (%) (usual status) in rural and urban areas by educational attainment,
2009-10 ......................................................................................................................................... 1010. Unemployment rates (%) (usual status) among youth by social categories, 2009-10 .................. 1111. Logistic regression: determinants of labour force participation of youth, 2009-10..................... 12

ILO DWT for South Asia and Country Office for India vi

ILO DWT for South Asia and Country Office for India vii
Acknowledgements
This paper benefited from very helpful comments and inputs provided by Ruchika Chaudhary,Matthieu Cognac, Steffi Jochim, and Makiko Matsumoto, and participants in the ILO-Ministry ofLabour and Employment forum, ‘Decent Work for Youth in India’, held on 20 April 2012 in NewDelhi. We would also like to thank Chanitda Wiwatchanon and Neelam Agnihotri for assistance withformatting and editing. Any errors are the sole responsibility of the authors.

ILO DWT for South Asia and Country Office for India viii
ILO DWT for South Asia and Country Office for India ix
Abstract
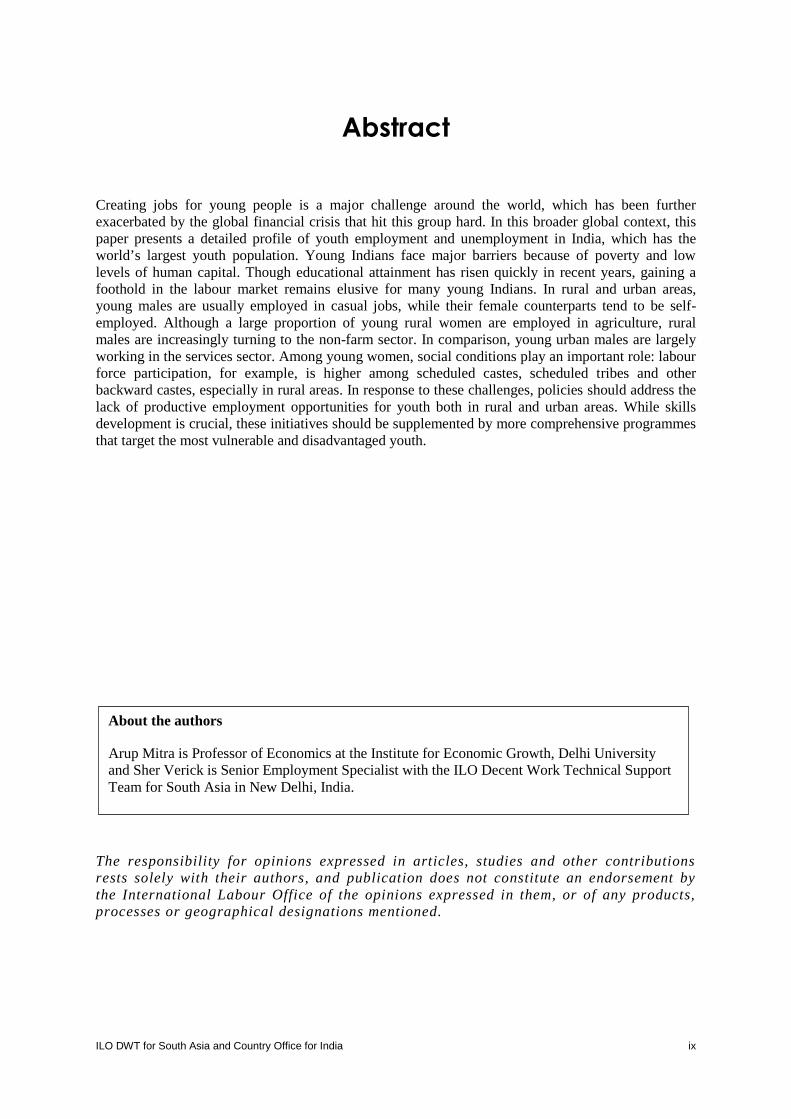
Creating jobs for young people is a major challenge around the world, which has been furtherexacerbated by the global financial crisis that hit this group hard. In this broader global context, thispaper presents a detailed profile of youth employment and unemployment in India, which has theworld’s largest youth population. Young Indians face major barriers because of poverty and lowlevels of human capital. Though educational attainment has risen quickly in recent years, gaining afoothold in the labour market remains elusive for many young Indians. In rural and urban areas,young males are usually employed in casual jobs, while their female counterparts tend to be self-employed. Although a large proportion of young rural women are employed in agriculture, ruralmales are increasingly turning to the non-farm sector. In comparison, young urban males are largelyworking in the services sector. Among young women, social conditions play an important role: labourforce participation, for example, is higher among scheduled castes, scheduled tribes and otherbackward castes, especially in rural areas. In response to these challenges, policies should address thelack of productive employment opportunities for youth both in rural and urban areas. While skillsdevelopment is crucial, these initiatives should be supplemented by more comprehensive programmesthat target the most vulnerable and disadvantaged youth.
The responsibility for opinions expressed in articles, studies and other contributionsrests solely with their authors, and publication does not constitute an endorsement bythe International Labour Office of the opinions expressed in them, or of any products,processes or geographical designations mentioned.
About the authors
Arup Mitra is Professor of Economics at the Institute for Economic Growth, Delhi Universityand Sher Verick is Senior Employment Specialist with the ILO Decent Work Technical SupportTeam for South Asia in New Delhi, India.

ILO DWT for South Asia and Country Office for India x

ILO DWT for South Asia and Country Office for India xi
Abbreviations
ILO International Labour OrganizationITI Industrial Training InstitutionLFPR Labour force participation rateMGNREGS Mahatma Gandhi National Rural Employment Guarantee SchemeWPR Worker population ratio

ILO DWT for South Asia and Country Office for India xii

ILO DWT for South Asia and Country Office for India 1
1.Introduction
Youth unemployment and underemployment is prevalent around the world because young people lackskills, work experience, job search abilities and the financial resources to find employment (UnitedNations, 2003; ILO, 2006; Matsumoto et al., 2012). In developing countries, this situation isexacerbated by poverty and the competitive pressures that result from a rapidly growing labour force.Moreover, the inadequacy of social protection schemes and active labour market policies means thatyoung people in such economies have little support outside their family and friends. Globally, youngpeople are, therefore, more likely to be unemployed or employed on more precarious contracts or inthe informal sector.
This is the case even during good economic times. In the midst of a severe recession, youth find itincreasingly difficult to both acquire a job as a new entrant in the labour market, particularly as aconsequence of hiring freezes, and remain employed, since they are more likely to be laid off thanworkers with more seniority (‘last in-first out’) (Verick, 2009). According to ILO’s Global TrendsReport 2012 on Youth, nearly 75 million young people are unemployed across the world, whichrepresents an increase of more than 4 million since 2007 (ILO, 2012).
These challenges are evident in India, which has the largest youth population in the world with around66 per cent of the total population under the age of 35. According to 2010 population figures, one infive young people in the world is an Indian.1 In this context, much is often said about a ‘demographicdividend’; that is, the share of the working-age population increases resulting in a fall in thedependency ratio (the number of children and elderly being supported by workers). This has been afeature of the development success stories of countries such as those in East Asia that grew rapidly inthe latter half of the 20th century. However, failing to provide opportunities for this bulge of youngpeople as they enter the labour market risks a ‘demographic disaster’.
In this regard, governments are rightly concerned about rising levels of youth unemployment andunderemployment because of not only the direct economic costs, but also due to the social impact ofjoblessness as manifested by increased crime, mental health problems, violence, drug taking andsocial exclusion.2 The uprisings of 2011, such as the ‘Arab spring’, are reflections of a disillusionedand disenfranchised youth, many of whom were unemployed or in jobs that did not fully utilize theirskills and abilities. Spells of unemployment, particularly long spells, can lead to scarring effects and ahigher likelihood of being unemployed later in life and a wage penalty (Bell and Blanchflower, 2009).
In recognition of the importance of the youth employment challenge in India, the Prime Minister,Manmohan Singh, stated at the 44th Indian Labour Conference in February 2012, ‘Youth employmentis a high-priority agenda item for our government. This can happen only if we equip our young peoplewith skills that are required to meet the demands of our rapidly growing economy.’
1Based on census figures provided by the Population Division of the Department of Economic and SocialAffairs of the United Nations Secretariat, World Population Prospects: The 2010 Revision,http://esa.un.org/unpd/wpp/index.htm.2 These direct economic costs include financing unemployment benefits, retraining schemes and other activelabour market policies, and the loss in potential output resulting from lower employment rates. For a discussionon the costs of unemployment, see United Nations (2003) and Bell and Blanchflower (2009).

ILO DWT for South Asia and Country Office for India 2
Against this background, this paper looks at the situation of youth in India in terms of differentindicators of labour market outcomes. Section 2 addresses the labour force participation of youngpeople in India. Section 3 delves further into the nature of employment and the employment profile,before section 4 moves to the challenge of youth unemployment in India. Section 5 presents aneconometric analysis of the determinants of labour force participation of youth, while section 6concludes.
2.How are youth participating in the labourmarket in India?
2.1 Labour force participation of youth in India
Different labour market indicators provide various insights into the overall situation facing youngpeople in a country like India that, despite the strong economic growth rate, continues to bedominated by the unorganized sector. In defining youth for this analysis, this paper considers thefollowing three age groups to highlight heterogeneity in labour market outcomes among youngpeople: 15-19, 20-24 and 25-29.
As a first step, this section reviews labour force participation rates (LFPRs), which captures thenumber of young people who are either employed or unemployed (and searching for a job) as apercentage of the youth population. It should be stressed that the youth labour force participation ratetypically falls as a country develops because young people increasingly enrol in secondary and highereducation (ILO, 2012).
Table 1: Labour force participation rate (%) of youth and adults, 2009-10
Agecategory
Rural Urban
Male Female Person Male Female Person
Youth 15-19 39.0 19.5 30.4 26.3 8.5 18.3
20-24 81.3 31.4 55.7 68.2 19.7 45.0
25-29 97.5 40.4 67.5 94.7 22.2 59.1
15-29 68.0 30.2 49.6 61.0 16.8 40.1
Non-youth 30-59 98.2 47.2 72.8 96.9 24.4 62.0
Total 15-59 84.8 39.9 62.6 80.9 21.0 52.3
Source: NSS 66th Round (2009-10), Schedule 10 - Employment and Unemployment
As highlighted in Table 1 and Figure 1, a sizeable percentage of male population in these age bracketsare in the labour market. Even in the lowest age group among young men (aged 15-19), nearly 40 and26 per cent are participating in the labour market in rural and urban areas, respectively. Though thelabour force participation rate among the females is considerably lower than their male counterpartsacross all age groups, the differences across age-groups in the case of females is much smaller inmagnitude than for males (17 and 7.6 percentage points for women in rural and urban areas versus

ILO DWT for South Asia and Country Office for India 3
30.2 and 35.9 points for men in rural and urban areas). This suggests that social attitudes and normstend to suppress the female labour force participation rate across all age groups, in addition to theeffect of education enrolment on the participation rate of younger age categories.
Figure 1: Labour force participation rate (%) by age and location, 2009-10
Source: see Table 1.
We may further note from Table 2 that the labour force participation rate among the rural youth ishighest in the scheduled tribe category. This is followed by the scheduled castes, which in turnexceeds the other backward caste category, while the general caste corresponds to the lowestparticipation rate. By and large, the same pattern is evident in urban areas with the exception of malescheduled tribes (Table 2). This pattern may be explained in terms of opportunities that differentsections of the population are able to access, particularly in the context of livelihoods. How mucheffort an individual may have to put in to sustain consumption is a pertinent question. The scheduledtribe population, more so in rural areas, strives hard to access sources of livelihood and meet theirconsumption requirements, which is reflected in a higher work participation rate. In urban areas,possibly because of the practice of reservation in the formal sector and also because of the availabilityof manual jobs in the informal sector, the struggle is relatively less. Again, the decreasing patternobserved among different social categories, as we move from scheduled caste population to generalcategory, can be explained as variations in human capital and quality of jobs. In the social categoriesare embedded a huge spectrum of attributes, which result in economic disadvantages/advantages.
Table 2: Labour force participation rate(%) among youth (15-29) by social categories, 2009-10
Social category
Rural Urban
Male Female Person Male Female PersonScheduled tribe 74.2 47.5 60.6 53.8 20.6 38.0
Scheduled caste 72.1 31.1 52.1 66.4 20.1 45.0
Other backwardclass (OBC)
66.8 29.1 48.4 62.6 17.2 41.2
General 63.8 23.1 44.3 57.9 15.0 37.5
Total 68.0 30.2 49.6 61.0 16.8 40.1
Source: NSS 66th Round, Schedule 10 – Employment and Unemployment, 2009-10.

ILO DWT for South Asia and Country Office for India 4
2.2 Youth worker population ratio (WPR)
A narrower view on attachment to the labour market is provided by the worker population ratio(WPR), which is defined as the ratio of workers to the population of that age group (typically referredto as the employment-to-population ratio in the global context). In India, the worker population ratioamong rural females in all the three age groups dropped in 2009-10 compared to the long-term trendperceived since 1993-94 (for both principal and subsidiary status) (Table 3).
Among rural males, the same pattern is observed except in the age group 25-29, where the principalstatus worker population ratio declined just marginally. Given the patriarchal system, the male workerpopulation ratio is unlikely to perceive any major decline in the prime age group of 25-29. Even whenproductive employment opportunities are not available, males cannot afford to withdraw from thelabour market. Instead, they get residually absorbed in a wide range of low productivity activities. Onthe other hand, the non-availability of productive employment opportunities over the long term maymotivate women respondents to indicate that they are not in the labour market (a phenomenon alsoknown as discouragement).
Table 3: Age-specific worker population ratio (%) in rural areas, 1993-94, 1999-2000, 2004-05, and 2009-10
Age group Year Rural maleprincipal
status
Rural malesubsidiary
status
Rural femaleprincipal
status
Rural femalesubsidiary
status15-19 4
321
32.345.347.552.3
3.54.42.85.4
13.722.223.426.4
4.99.76.0
10.420-24 4
321
74.782.082.382.4
2.12.92.13.5
22.528.431.031.8
7.012.69.9
13.825-29 4
321
95.295.694.294.7
0.51.00.81.0
29.936.737.335.4
9.214.611.817.1
15-59 4321
53.753.552.253.8
1.01.10.91.5
20.224.223.123.4
5.98.56.89.4
Note: 1 stands for 1993-94; 2 for 1999-00; 3 for 2004-05; and 4 for 2009-10.
Source: NSS rounds, 1993-94, 1999-00, 2004-05, 2009-10.
It may be argued that increased participation in education could be a major reason of decline in theworker population ratio in the age groups of 15-19 and 19-24 for both males and females. In thisregard, the gross secondary school enrolment rate increased in India from 34.8 per cent for femalesand 55.5 per cent for males in 1993 to 60.4 per cent for females and 65.8 per cent for males in 2010,reflecting a rapid narrowing of the gender gap at this level of education. The gross tertiary enrolmentrates increased considerably over recent decades from 4.1 per cent for females and 7.8 per cent formales in 1990 to 14.9 and 20.6 per cent in 2010, respectively.3
In the rural context, it is quite unbelievable that tertiary-level education was pursued so widely that itled to a major decline in the worker population ratio of older youth. Given conservative social
3Source: World Development Indicators online database; accessed 30 August 2012.

ILO DWT for South Asia and Country Office for India 5
practices, this explanation of participation in higher levels of education, particularly in the case ofrural females, does not seem tenable, and is indeed a topic of further research.
In urban areas, the worker population ratio also declined both among the males and the females in theage groups of 15-19 and 20-24, particularly in comparison to 2004-05 (Table 4). While the fallcontinues in the next age bracket (25-29) for females, a marginal increase is noted among urbanmales. It is rather difficult to use the explanation relating to education to justify this drop amongfemales in this age bracket. On the contrary, the employment scenario is possibly becoming lessfavourable towards women workers. Notwithstanding the success stories of many women executives,economic growth is becoming more skill intensive and is possibly responsible for a drop in the workerpopulation ratio of women. Even in the less skilled jobs, when opportunities shrink, it is the womenworkers who are fired first (Mitra and Mukhapadhyay, 1989). Since there is no evidence of a declinein the age at marriage between 2004-05 and 2009-10, the fall in the worker population ratio of womenis, nevertheless, a surprise.
Several micro studies are of the view that single women migration is on the rise (Rajan, 2011), whichmight have led to an increase in the worker population ratio in urban areas given a drop in its ruralcounterpart. Since that has not happened, demand-side factors seem to have played a crucial role,indicating sluggish employment generation in the process of growth. It is needless to add that, even inthe age group 30-34, the female worker population ratio has declined both in the rural and urbanareas. This suggests that the argument of joining the labour market after completing the socialresponsibility of marriage and reproductive role is also not plausible.
Table 4: Age-specific worker population ratio (%) in urban areas, 1993-94, 1999-2000, 2004-05, and 2009-10
Age group Year Urban male(principal
status)
Urban male(subsidiary
status)
Urban female(principal
status)
Urban female(subsidiary
status)15-19 4
321
22.331.430.333.7
0.82.11.11.9
6.19.28.79.4
1.53.61.82.9
20-24 4321
60.466.264.465.4
1.32.21.42.0
14.215.513.013.6
1.84.62.54.4
25-29 4321
90.390.087.889.2
0.30.90.51.2
17.018.616.117.5
2.64.33.34.9
15-59 4321
53.954.151.351.3
0.40.80.50.8
11.913.511.712.1
1.93.12.23.4
Note: 1 stands for 1993-94; 2 for 1999-00; 3 for 2004-05; and 4 for 2009-10.
Source: NSS Rounds, 1993-94, 1999-00, 2004-05, 2009-10.
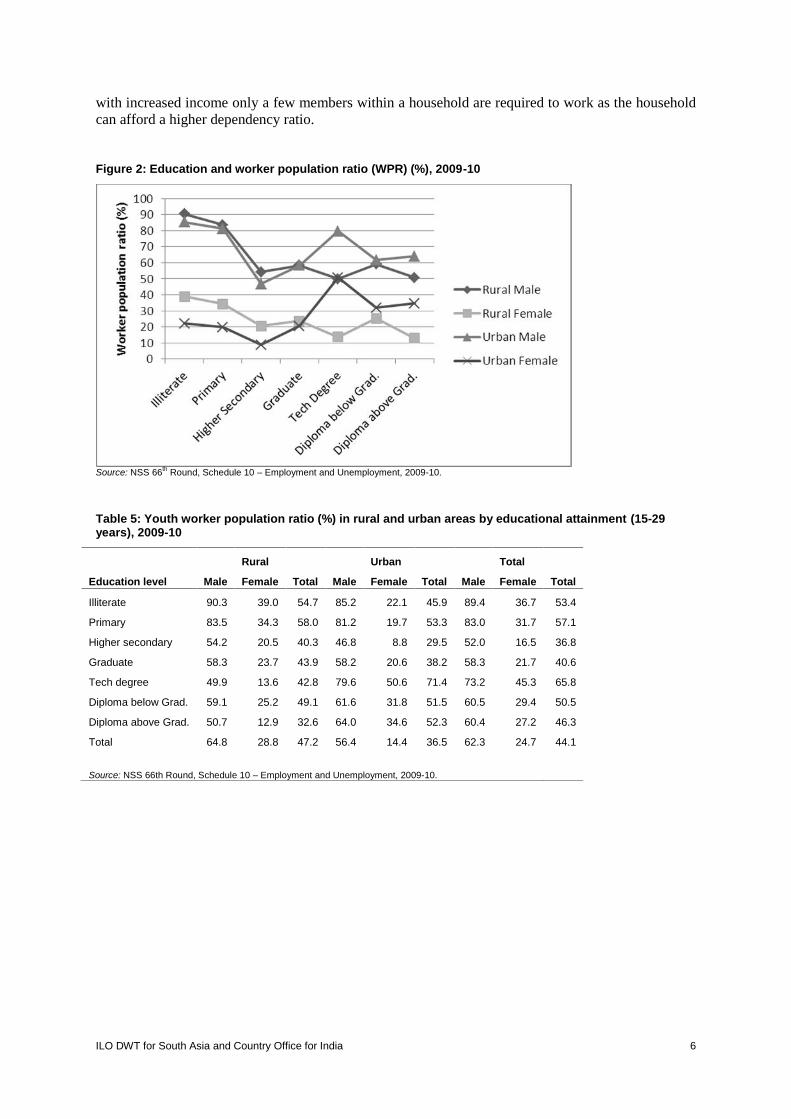
With the level of education, the worker population ratio tends to decline, though at higher levels itagain shows a rising tendency (Table 5 and Figure 2). The declining part can be explained by the factthat once a youth pursues education he/she does not participate in the labour market until the desirablelevel is completed. Also, the worker population ratio among the males in the rural and urban areas arealmost similar across educational categories, though among females there are substantial differences,indicating lower ratios in the urban areas compared to the rural areas. Among the illiterate or thosewith lesser levels of education, the worker population ratio is high because of low incomes, implyinga greater number of persons have to work to meet their consumption requirements. On the other hand,
ILO DWT for South Asia and Country Office for India 6
with increased income only a few members within a household are required to work as the householdcan afford a higher dependency ratio.
Figure 2: Education and worker population ratio (WPR) (%), 2009-10
Source: NSS 66th Round, Schedule 10 – Employment and Unemployment, 2009-10.
Table 5: Youth worker population ratio (%) in rural and urban areas by educational attainment (15-29years), 2009-10
Rural Urban Total
Education level Male Female Total Male Female Total Male Female Total
Illiterate 90.3 39.0 54.7 85.2 22.1 45.9 89.4 36.7 53.4
Primary 83.5 34.3 58.0 81.2 19.7 53.3 83.0 31.7 57.1
Higher secondary 54.2 20.5 40.3 46.8 8.8 29.5 52.0 16.5 36.8
Graduate 58.3 23.7 43.9 58.2 20.6 38.2 58.3 21.7 40.6
Tech degree 49.9 13.6 42.8 79.6 50.6 71.4 73.2 45.3 65.8
Diploma below Grad. 59.1 25.2 49.1 61.6 31.8 51.5 60.5 29.4 50.5
Diploma above Grad. 50.7 12.9 32.6 64.0 34.6 52.3 60.4 27.2 46.3
Total 64.8 28.8 47.2 56.4 14.4 36.5 62.3 24.7 44.1
Source: NSS 66th Round, Schedule 10 – Employment and Unemployment, 2009-10.

ILO DWT for South Asia and Country Office for India 7
3.Characterizing youth employment in India
3.1 The nature of youth employment
Given that one of the greatest challenges in India is the lack of decent work in the organized sector, itis crucial to look in further detail at the characteristics of youth employment. Looking at the nature ofemployment, almost half of the rural youth are self-employed (Table 6).4 However, among ruralmales, the relative size of regular wage and casual wage employment in the age group 25-29 is higherthan the corresponding figure for all-age groups. A similar pattern is also distinct in the age group 20-24, implying that wage employment is relatively more prevalent among rural youth (male) comparedwith the rest of the rural male population. In the age bracket 15-19, only the share of casual wageemployment is higher than the corresponding figure for the all-age average (individuals aged 15-59).Those who drop out from school early join as casual workers since many of these youth (especiallymales) may not meet the skills and experience requirements of regular wage jobs.
Among rural females, self-employment in the age group 20-24 is higher than the all-age averagefigure. On the other hand, the proportion of workers in casual wage in the same age group is lowercompared to the all-age average. Since around these ages rural women are mostly engaged inreproductive activities, casual wage jobs are less preferred in comparison to self-employment, whichcan be conveniently combined with household duties. In the age brackets 15-19 and 25-29, however,more than 40 per cent of the women workers are in casual employment while more than 53 per centhave been engaged in self-employment.
Among urban males, an early drop-out from education means pursuing casual wage employment, asin this age bracket almost 35 per cent are engaged in such employment. With an increase in age, theregular wage share rises from 32 per cent in 15-19 age group to 44 and 49 per cent in the other twoage groups, respectively. On the other hand, among urban females, an early drop out from educationmeans a higher rate of self-employment, while those who complete higher levels of education tend toget regular wage employment. This category comprises almost half of the workers in the age brackets20-24 and 25-29.
3.2 Employment profile across sectors
Young women are engaged more in the agriculture sector compared to males in rural areas (Table 7).However, it is interesting to note that, among young men and women, the share of the secondarysector exceeds that of the tertiary sector in rural locations. The Mahatma Gandhi National RuralEmployment Guarantee Scheme (MGNREGS), which involves construction activities, may be anexplanation for the dominance of the secondary sector over the tertiary in rural areas. In other words,rural industrialisation does not seem to be the force behind this phenomenon (Goldar, Mitra and
4Self-employed = individuals working: in household enterprises (self-employed) as own-account worker; inhousehold enterprises (self-employed) as an employer; and in household enterprises (self-employed) as helper.
Casual labour = individuals working as: casual wage labour in public works other than Mahatma GandhiNREGS public works; casual wage labour in Mahatma Gandhi NREGS public works; and casual wage labour inother types of works.
ILO DWT for South Asia and Country Office for India 8
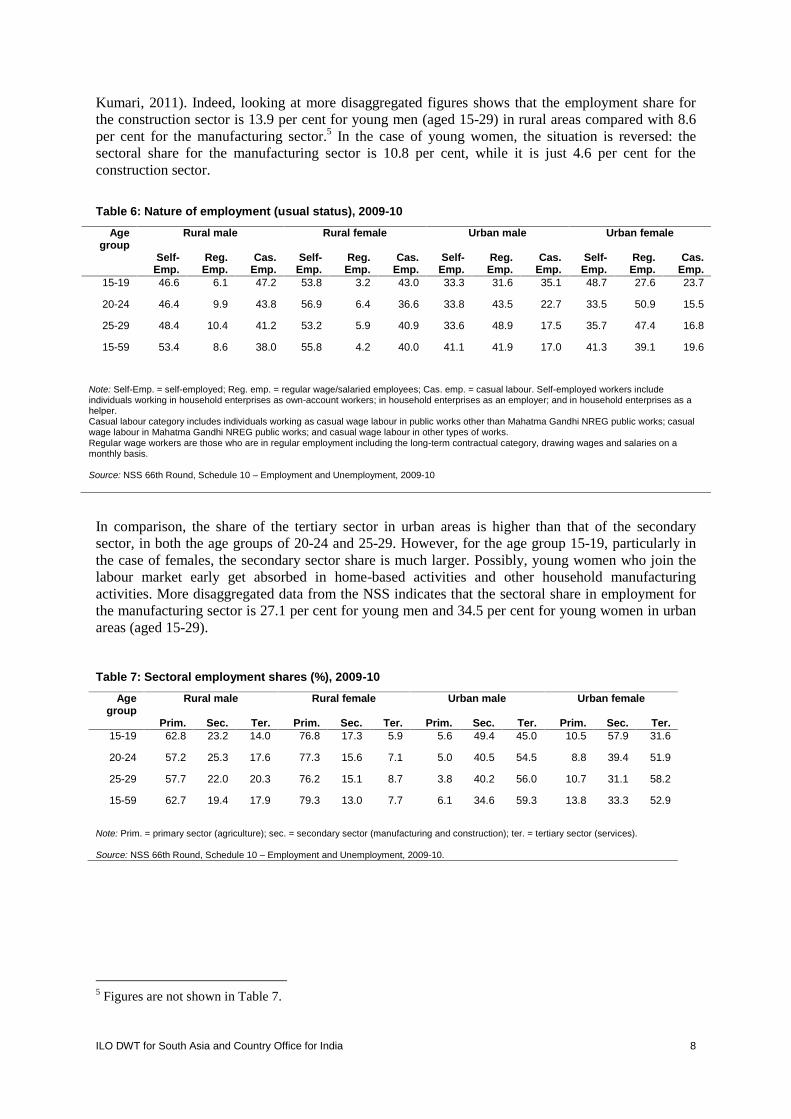
Kumari, 2011). Indeed, looking at more disaggregated figures shows that the employment share forthe construction sector is 13.9 per cent for young men (aged 15-29) in rural areas compared with 8.6per cent for the manufacturing sector.5 In the case of young women, the situation is reversed: thesectoral share for the manufacturing sector is 10.8 per cent, while it is just 4.6 per cent for theconstruction sector.
Table 6: Nature of employment (usual status), 2009-10
Agegroup
Rural male Rural female Urban male Urban female
Self-Emp.
Reg.Emp.
Cas.Emp.
Self-Emp.
Reg.Emp.
Cas.Emp.
Self-Emp.
Reg.Emp.
Cas.Emp.
Self-Emp.
Reg.Emp.
Cas.Emp.
15-19 46.6 6.1 47.2 53.8 3.2 43.0 33.3 31.6 35.1 48.7 27.6 23.7
20-24 46.4 9.9 43.8 56.9 6.4 36.6 33.8 43.5 22.7 33.5 50.9 15.5
25-29 48.4 10.4 41.2 53.2 5.9 40.9 33.6 48.9 17.5 35.7 47.4 16.8
15-59 53.4 8.6 38.0 55.8 4.2 40.0 41.1 41.9 17.0 41.3 39.1 19.6
Note: Self-Emp. = self-employed; Reg. emp. = regular wage/salaried employees; Cas. emp. = casual labour. Self-employed workers includeindividuals working in household enterprises as own-account workers; in household enterprises as an employer; and in household enterprises as ahelper.Casual labour category includes individuals working as casual wage labour in public works other than Mahatma Gandhi NREG public works; casualwage labour in Mahatma Gandhi NREG public works; and casual wage labour in other types of works.Regular wage workers are those who are in regular employment including the long-term contractual category, drawing wages and salaries on amonthly basis.
Source: NSS 66th Round, Schedule 10 – Employment and Unemployment, 2009-10
In comparison, the share of the tertiary sector in urban areas is higher than that of the secondarysector, in both the age groups of 20-24 and 25-29. However, for the age group 15-19, particularly inthe case of females, the secondary sector share is much larger. Possibly, young women who join thelabour market early get absorbed in home-based activities and other household manufacturingactivities. More disaggregated data from the NSS indicates that the sectoral share in employment forthe manufacturing sector is 27.1 per cent for young men and 34.5 per cent for young women in urbanareas (aged 15-29).
Table 7: Sectoral employment shares (%), 2009-10
Agegroup
Rural male Rural female Urban male Urban female
Prim. Sec. Ter. Prim. Sec. Ter. Prim. Sec. Ter. Prim. Sec. Ter.15-19 62.8 23.2 14.0 76.8 17.3 5.9 5.6 49.4 45.0 10.5 57.9 31.6
20-24 57.2 25.3 17.6 77.3 15.6 7.1 5.0 40.5 54.5 8.8 39.4 51.9
25-29 57.7 22.0 20.3 76.2 15.1 8.7 3.8 40.2 56.0 10.7 31.1 58.2
15-59 62.7 19.4 17.9 79.3 13.0 7.7 6.1 34.6 59.3 13.8 33.3 52.9
Note: Prim. = primary sector (agriculture); sec. = secondary sector (manufacturing and construction); ter. = tertiary sector (services).
Source: NSS 66th Round, Schedule 10 – Employment and Unemployment, 2009-10.
5 Figures are not shown in Table 7.
ILO DWT for South Asia and Country Office for India 9
4.Youth unemployment in India
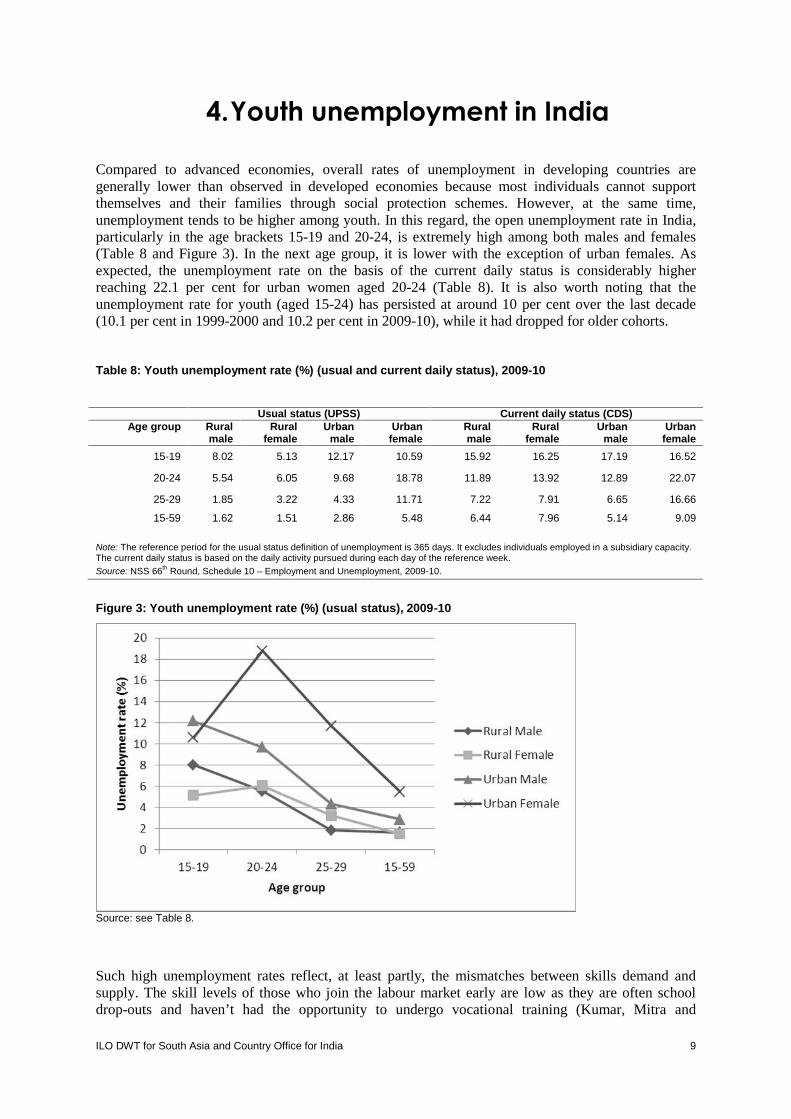
Compared to advanced economies, overall rates of unemployment in developing countries aregenerally lower than observed in developed economies because most individuals cannot supportthemselves and their families through social protection schemes. However, at the same time,unemployment tends to be higher among youth. In this regard, the open unemployment rate in India,particularly in the age brackets 15-19 and 20-24, is extremely high among both males and females(Table 8 and Figure 3). In the next age group, it is lower with the exception of urban females. Asexpected, the unemployment rate on the basis of the current daily status is considerably higherreaching 22.1 per cent for urban women aged 20-24 (Table 8). It is also worth noting that theunemployment rate for youth (aged 15-24) has persisted at around 10 per cent over the last decade(10.1 per cent in 1999-2000 and 10.2 per cent in 2009-10), while it had dropped for older cohorts.
Table 8: Youth unemployment rate (%) (usual and current daily status), 2009-10
Usual status (UPSS) Current daily status (CDS)Age group Rural
maleRural
femaleUrban
maleUrban
femaleRuralmale
Ruralfemale
Urbanmale
Urbanfemale
15-19 8.02 5.13 12.17 10.59 15.92 16.25 17.19 16.52
20-24 5.54 6.05 9.68 18.78 11.89 13.92 12.89 22.07
25-29 1.85 3.22 4.33 11.71 7.22 7.91 6.65 16.66
15-59 1.62 1.51 2.86 5.48 6.44 7.96 5.14 9.09
Note: The reference period for the usual status definition of unemployment is 365 days. It excludes individuals employed in a subsidiary capacity.The current daily status is based on the daily activity pursued during each day of the reference week.Source: NSS 66th Round, Schedule 10 – Employment and Unemployment, 2009-10.
Figure 3: Youth unemployment rate (%) (usual status), 2009-10
Source: see Table 8.
Such high unemployment rates reflect, at least partly, the mismatches between skills demand andsupply. The skill levels of those who join the labour market early are low as they are often schooldrop-outs and haven’t had the opportunity to undergo vocational training (Kumar, Mitra and
ILO DWT for South Asia and Country Office for India 10
Murayama, 2012). Thus, it becomes difficult for them to find suitable employment, particularly in theearly stages of their career when they lack adequate experience as well. However, with thedependency ratio expected to rise from 2040, India faces a pressing challenge to increase educationand skill levels amongst its population to take advantage of this unique moment in its history.6 Thescale of this challenge to improve the skills of its burgeoning labour force is significant. Employmentstrategies in India, therefore, need to prioritize youth employment issues.
Further, Ghose, Goldar and Mitra (2010) noted that, due to the rise in life expectancy, many elderlypersons from low-income households have been compelled to participate in the labour market insearch of a livelihood. This has resulted in stiff competition between the new entrants to the labourmarket and the elderly workers. In a desperate attempt to acquire experience, the younger workershave reduced their reservation wage which, in turn, has forced the incomes of the elderly workers alsoto decline. The insurgency issue is very much in the limelight, which is indeed related to thechallenges of youth unemployment and underemployment (Magioncalda, 2010). Regions withinadequate employment opportunities have witnessed serious problems. Skills formation and jobcreation both have to be addressed simultaneously to contribute to the reduction in the intensity of theproblem.
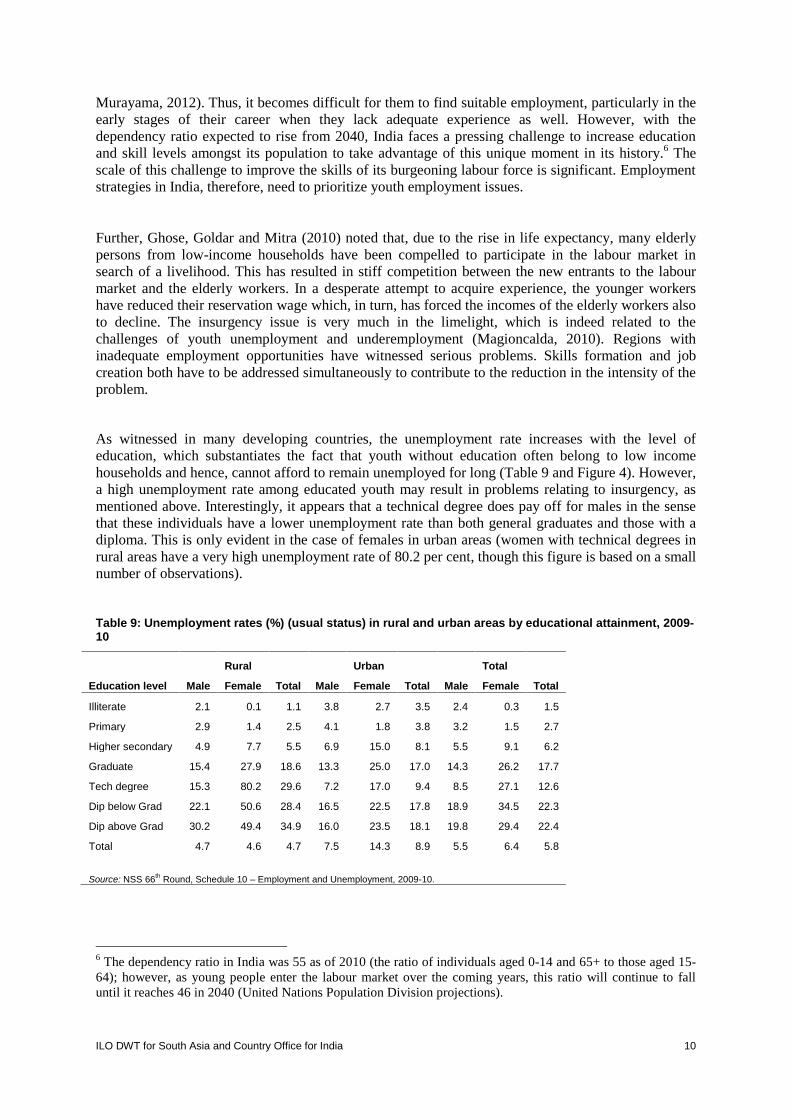
As witnessed in many developing countries, the unemployment rate increases with the level ofeducation, which substantiates the fact that youth without education often belong to low incomehouseholds and hence, cannot afford to remain unemployed for long (Table 9 and Figure 4). However,a high unemployment rate among educated youth may result in problems relating to insurgency, asmentioned above. Interestingly, it appears that a technical degree does pay off for males in the sensethat these individuals have a lower unemployment rate than both general graduates and those with adiploma. This is only evident in the case of females in urban areas (women with technical degrees inrural areas have a very high unemployment rate of 80.2 per cent, though this figure is based on a smallnumber of observations).
Table 9: Unemployment rates (%) (usual status) in rural and urban areas by educational attainment, 2009-10
Rural Urban Total
Education level Male Female Total Male Female Total Male Female Total
Illiterate 2.1 0.1 1.1 3.8 2.7 3.5 2.4 0.3 1.5
Primary 2.9 1.4 2.5 4.1 1.8 3.8 3.2 1.5 2.7
Higher secondary 4.9 7.7 5.5 6.9 15.0 8.1 5.5 9.1 6.2
Graduate 15.4 27.9 18.6 13.3 25.0 17.0 14.3 26.2 17.7
Tech degree 15.3 80.2 29.6 7.2 17.0 9.4 8.5 27.1 12.6
Dip below Grad 22.1 50.6 28.4 16.5 22.5 17.8 18.9 34.5 22.3
Dip above Grad 30.2 49.4 34.9 16.0 23.5 18.1 19.8 29.4 22.4
Total 4.7 4.6 4.7 7.5 14.3 8.9 5.5 6.4 5.8
Source: NSS 66th Round, Schedule 10 – Employment and Unemployment, 2009-10.
6 The dependency ratio in India was 55 as of 2010 (the ratio of individuals aged 0-14 and 65+ to those aged 15-64); however, as young people enter the labour market over the coming years, this ratio will continue to falluntil it reaches 46 in 2040 (United Nations Population Division projections).

ILO DWT for South Asia and Country Office for India 11
The general category recorded the highest unemployment rate in rural areas but not so in the urbancontext (Table 10). Possibly, rural youth in the general category are better educated and belong tohigher economic background and, hence, can afford to remain unemployed for longer in order tosearch for better jobs. On the other hand, in the urban areas, the scheduled tribes (among males) andthe other backward classes (among females) reported the highest unemployment rate. Otherwise, theurban unemployment rates in general have been higher than their rural counterparts.
Figure 4: Unemployment rates (%) (usual status)by educational attainment, 2009-10
Source: NSS 66th Round, Schedule 10 – Employment and Unemployment, 2009-10.
Table 10: Unemployment rates (%) (usual status) among youth (15-29) by social categories, 2009-10
Social Category Rural UrbanMale Female Total Male Female Total
Scheduled tribe 4.8 2.2 3.8 12.3 12.9 12.5
Scheduled caste 4.6 4.4 4.5 7.1 11.0 7.9
Other backward class(OBC)
4.0 4.4 4.1 7.3 16.8 9.2
General 6.2 7.6 6.5 7.6 13.4 8.7
Total 4.7 4.6 4.7 7.5 14.3 8.9
Source: NSS 66th Round, Schedule 10 – Employment and Unemployment, 2009-10
It is also interesting to note that, in the rural areas, the differences in male-female youthunemployment rates are nominal among the schedule castes, other backward classes and the generalcategories. However, among scheduled tribes, the female rate is only half the male rate. Among ruralyouth, women, therefore, seem to be working at least as intensively as the males once they participatein the labour market. On other hand, in urban areas, women can afford greater spells ofunemployment. Social factors are important determinants of women employment, which is reflectedin the high unemployment rates of young women in urban areas. Among the scheduled castes, theunemployment rate is the lowest, possibly because they belong to economically weaker sections. Onthe other hand, though economic conditions may not be varied between the general and the otherbackward classes, the youth unemployment rate among the females is sizably different, possiblybecause of differences in attitude towards women’s work.

ILO DWT for South Asia and Country Office for India 12
5.Econometric analysis of determinants ofyouth labour force participation
Given the broad patterns that we have observed in relation to youth labour market participation, alogistic regression is attempted below to highlight the impact of the following variables: age, gender,caste, sector and education. The dependent variable is discrete, taking a value of 1 for those whoparticipate and 0 for those who do not participate in the labour market. While age is a continuousvariable, gender dummy takes a value of 0 for males and 1 for females and sector dummy represents 0for rural areas and 1 for urban areas. Besides, three caste dummies, SCDUM, STDUM andOBCDUM, representing scheduled castes, scheduled tribes and other backward castes respectivelywith general caste as the comparison category and six education dummies (EDUi=1,…,6),representing primary, higher secondary, graduate, technical degree, diploma below graduate anddiploma above graduate levels, with illiterates as the comparison category, have been included. Inaddition to the gender dummy and the sector dummy, an interaction of gender and sector dummies hasalso been included so that the same equation delineates the changes in the probability moving fromrural males to urban males, rural females to urban females, rural males to rural females and urbanmales to urban females.
Table 11: Logistic regression: determinants of labour force participation of youth (aged 15-29), 2009-10
Coefficient Z Dy/dx Z
AGE 0.25 127.92 0.06 129.39
GENDERDUM -2.16 -109.65 -0.45 -128.17
SECTORDUM -0.32 -17.20 -0.07 -17.41
SECTOR*GENDER DUM -0.41 -13.35 -0.09 -14.08
SCDUM 0.29 13.44 0.07 13.15
STDUM 0.39 17.03 0.09 16.58
OBCDUM 0.19 11.11 0.04 11.05
EDU1 0.09 3.28 0.02 3.26
EDU2 -0.93 -39.77 -0.22 -40.04
EDU3 -1.25 -37.69 -0.23 -51.26
EDU4 -0.93 -8.48 -0.18 -11.01
EDU5 -0.86 -15.17 -0.17 -19.02
EDU6 -1.10 -12.98 -0.20 -18.01
Constant -4.16 -85.31
Note: Log likelihood = -61412.812; Pseudo R2 = 0.2718; LR chi2(13)=45,849.59;Number of observations =125,378; all the Z-scores are highly significant. Dy/dxrefers to the marginal effect of the explanatory variables.
The gender dummy takes a value of 0 for males and 1 for females and sectordummy represents 0 for rural areas and 1 for urban areas. Three caste dummies,SCDUM, STDUM and OBCDUM, represent scheduled castes, scheduled tribesand other backward classes respectively with general caste as the comparisoncategory. Six education dummies (EDUi=1,…,6), represent primary, highersecondary, graduate, technical degree, diploma below graduate and diploma abovegraduate levels respectively with illiterates as the comparison category.
Source: NSS 66th Round, Schedule 10 – Employment and Unemployment, 2009-10, authors’ calculations.
ILO DWT for South Asia and Country Office for India 13
As shown in Table 11, the results tend to indicate that, except those with primary level of education,youth with higher levels of education have a lower participation rate compared to the illiterates. Interms of the latter, youth with at least a secondary education have around a 20 per cent lowerprobability of participation. Females show a lower participation rate compared to males with thelowest participation probability for urban females. Urban areas correspond to lower participation ratesin general. All the three caste groups indicate a higher participation rate compared to the generalcastes. As expected, participation in the labour market tends to increase with age.
6.Conclusion
The aim of this paper is to provide a profile of youth employment and unemployment in India. Amajor long-term challenge in India is that many youth, because of poverty and poor human capitalendowment, participate in the labour market at an early stage. They cannot afford to remainunemployed for long and, hence, pick up activities characterized by low labour productivity. In ruraland urban areas, among the early labour market entrants, males are usually in casual wageemployment, while their female counterparts tend to be self-employed.
Self-employment and casual wage employment comprise a large majority of youth employment.Agriculture employment is more prevalent for women in the rural areas, though rural males areincreasingly turning to the non-farm sector as the possibility of gainful employment in the farm sectorhas been shrinking. However, how many non-farm jobs in rural areas are demand-induced is animportant issue that needs further research. Given the macro evidence on the rural non-farm sector,expanding largely due to supply-side factors, it is difficult to suggest that rural youth are able toaccess sustainable livelihoods. On the other hand, in urban areas they are largely in the services sectorin comparison to the secondary sector. Among young women, social conditions and norms play animportant role in determining their labour market status. Labour market participation, for example,tends to vary across social groups. Among educated youth, the problem of unemployment can haveserious repercussions in terms of social instability which, in turn, may affect governance and growthadversely. Thus, the challenge is to ensure that more opportunities are created in the formal economy,allowing for a smooth transition from school to work for India’s youth.
In order to tackle the challenges of participation and job quality for the youth of India, policyinterventions should promote a better quality education, on-the-job training, skill formation on the onehand and productive job creation on the other. For those who are in self-employment, credit assistanceand marketing assistance can be of enormous help. Overall, however, experiences around the worldhave shown that comprehensive policies tend to work the best. For example, the Jovenes (‘youth’ inSpanish) programmes of Latin America are a well-known and much researched example of such acomprehensive approach. Starting in Chile in 1992, Jovenes programmes have since been establishedin Argentina, Colombia, the Dominican Republic, Panama, Paraguay, Peru and Venezuela (WorldBank 2006).These schemes target unemployed and disadvantaged youth, who face considerabledifficulties integrating into the formal labour market.
In the Indian context, significant emphasis has been placed on skills development. In this regard, theNational Skills Development Policy (2009) sets a target of training 500 million skilled individuals by2022, which will be reached by expanding public institutions in rural areas; using innovative deliverymodels; using skill development centres in rural areas to provide training information, guidance anddelivery; involving panchayats and local government in skill delivery; improving access toapprenticeships and raising female participation in training (Ministry of Labour and Employment

ILO DWT for South Asia and Country Office for India 14
2009). Moreover, the role of the Industrial Training Institutions (ITIs) is important in impartingtechnical skills to the youth and helping them access better sources of livelihood. Also, a qualityeducation can counteract the social factors that hinder women’s labour market participation.
At its 101st International Labour Conference in June 2012, the International Labour Organizationadopted a Resolution calling for immediate, targeted and renewed action to tackle the youthemployment crisis.7 On the whole, policies need to address the issue of low productivity employmentamong the youth both in the rural and urban areas. While broad-based skills development is crucial,these initiatives should be supplemented by specific programmes that provide comprehensivepackages that target the most vulnerable and disadvantaged youth. This requires developing the rightinstitutions and ability to deliver such programmes at the local level. Overall, the challenge is both interms of job creation and the preparation of young people for the labour market to ensure that India’sdemographic dividend does not become the oft quoted ‘demographic disaster’.
7 See http://www.ilo.org/ilc/ILCSessions/101stSession/texts-adopted/WCMS_185950/lang--en/index.htm

ILO DWT for South Asia and Country Office for India 15
References
Bell, D.N.F.; Blanchflower, D.G. 2009. What should be done about rising unemployment in the UK?,IZA Discussion Paper, No. 4040 (Bonn, IZA).
Ghosh, N.; Goldar, B.; Mitra, A. 2010. “Population ageing and its implications on the labour market:The South Asian experience”, in M. Alam, A. Barrientos (eds): Demographic employment and oldage security: Emerging trends and challenges in South Asia (New Delhi, Macmillan PublishersIndia).
Goldar, B.; Mitra, A.; Kumari, A. 2011. “Performance of unorganised manufacturing in the post–reforms period”, in K. Das (ed.): Micro and small enterprises in India: The era of reforms (NewDelhi, Routledge India), pp.67-97.
International Labour Organization (ILO). 2006. Global Employment Trends for Youth 2006 (Geneva).
__. 2012. Global Employment Trends for Youth 2012 (Geneva).
Kumar, R.; Mitra, A.; Murayama, M. 2011. Toiling children in India: The gender dimension, Instituteof Developing Economies Working Paper, No. 352 (Tokyo, IDE).
Magioncalda, W. 2010. A modern insurgency: India’s evolving naxalite problem, Centre for Strategicand International Studies, Southern Asia Monitor, No. 140, April. Available at:http://csis.org/files/publication/SAM_140_0.pdf [Accessed: 14 Jan 2013].
Matsumoto, M.; Hengge, M.; Islam, I. 2012. Tackling the youth employment crisis: A macroeconomicperspective, ILO Employment Working Paper, No. 124 (Geneva, ILO).
Ministry of Labour and Employment. 2009. National Skill Development Policy (New Delhi,Government of India).
Mitra, A.; Mukhopadhyay, S. 1989. “Female labour absorption in the construction sector”, in Economicand Political Weekly, March 11, 1989.
Rajan, S. I. 2011. Migration, identity and conflict: India migration report (New Delhi, RoutledgeIndia).
United Nations. 2003. World Youth Report 2003: The global situation of young people (New York).
Verick, S. 2009. Who is hit hardest during a financial crisis? The vulnerability of young men andwomen to unemployment in an economic downturn, IZA Discussion Paper, No. 4359 (Bonn, IZA).
World Bank. 2006. World Development Report 2007: Development and the next generation(Washington, D.C.).
Regional Office for Asia and the Pacific 1
ILO DWT for South Asia and Country Office for India
India Habitat Centre, Core 4B, 3rd FloorLodhi road, New Delhi-110 003IndiaTel.: +91 11 4750 9200, Fax: +91 11 2460 2111Email: [email protected]
www.ilo.org/india
ISSN: 2227-4391 (print)2227-4405 (web pdf)
Youth employment and unemployment:An Indian perspective
Creating jobs for young people is a major challenge around the world,which has been further exacerbated by the global financial crisis. In thisbroader context, this paper presents a profile of youth employment andunemployment in India, which has the world’s largest youth population.Young Indians face major barriers because of poverty and low levels ofhuman capital. Though educational attainment has risen in recent years,gaining a foothold in the labour market remains elusive for many youngIndians. In rural and urban areas, young males are usually employed incasual jobs, while their female counterparts tend to be self-employed.Although a large proportion of young rural women are employed inagriculture, rural males are increasingly turning to the non-farm sector.Among young women, social conditions play an important role indetermining labour force participation. In response to these challenges,policies should address the lack of productive employment opportunities foryouth. While skills development is crucial, these initiatives should besupplemented by more comprehensive programmes that target the mostvulnerable and disadvantaged youth.