
Youth Employment and Unemployment - My · Analysis of Youth Employment and Unemployment i Namibia...
94
Namibia Stascs Agency Namibia Stascs Agency, P. O. Box 2133, Windhoek, FGI House, Post Street Mall Tel: +264 61 431 3200 Fax: +264 61 431 3253 | +264 61 431 3240 www.nsa.org.na Analysis of Youth Employment and Unemployment in Namibia 2012 - 2013
Transcript of Youth Employment and Unemployment - My · Analysis of Youth Employment and Unemployment i Namibia...
1Analysis of Youth Employment and Unemployment in Namibia 2012 - 2013
Namibia Statistics Agency
Namibia Statistics Agency, P. O. Box 2133, Windhoek, FGI House, Post Street MallTel: +264 61 431 3200Fax: +264 61 431 3253 | +264 61 431 3240www.nsa.org.na
Analysis of Youth Employment and Unemployment
in Namibia 2012 - 2013
Analysis of Youth Employment and Unemployment in Namibia 2012 - 20132
Our MissionIn a coordinated manner produce and
disseminate relevant, quality and timely statistics that are fit-for-purpose in
accordance with international standards and best practice.
Our VisionTo be a high performance institution in
statistics delivery
Our Shared ValuesExcellent Performance
IntegrityService focusTransparency
AccuracyPartnership
Analysis of Youth Employment and Unemployment in Namibia 2012 - 2013
Namibia Statistics Agency
2015
Namibia Statistics Agency (2015): Analysis of Youth Employment and Unemployment in Namibia 2012-2013. Namibia
Statistics Agency, Windhoek, Namibia.
Published in December 2015

3Analysis of Youth Employment and Unemployment in Namibia 2012 - 2013
Our MissionIn a coordinated manner produce and
disseminate relevant, quality and timely statistics that are fit-for-purpose in
accordance with international standards and best practice.
Our VisionTo be a high performance institution in
statistics delivery
Our Shared ValuesExcellent Performance
IntegrityService focusTransparency
AccuracyPartnership

FOREWORD
Young people entering the labour market are generally
considered a population at risk, with high turnover
rate between jobs, and increased risk of entering
unemployment. In Namibia, there are persistent and
frustrating youth unemployment rates, yet little is known,
on the youth unemployment and any disparities that
explain such. Based on this, the Namibia Statistics Agency
has generated this report on youth employment and
unemployment to fully examine the current situation of
youth employment and unemployment. This report has
come at an opportune time to inform policy that may aim
at investigating the prevailing youth-adult employment
gap, which had not been explored in Namibia.
I would therefore like to thank the consultancy team who
worked hard to ensure the production of this report.
Finally, I wish to acknowledge the Namibia Statistics
Agency Household, Welfare, Labour and other Social
Statistics division for their efforts in analysing the data and
producing the report. I hope that the findings in this report
will be translated into practice in order to ensure that the
national developmental issues are addressed fruitfully.
Mr. Sikongo Haihambo
Acting Statistician GeneralNamibia Statistics Agency
4 Analysis of Youth Employment and Unemployment in Namibia 2012 - 2013
EXECUTIVE SUMMARY
High rates of youth unemployment have been a prominent
economic and social issue in the Namibian landscape.
Current survey estimates from the Labour Force Survey
(LFS), reported by the Namibia Statistics Agency (NSA),
show youth unemployment rate range from 37.8% to 41.7%
for the youth (individuals aged 15-34 years), between 2012
and 2013 (see Table C1 in the Appendix). Understanding
the patterns, structure and causes of youth employment
is essential for designing policy interventions. Moreover,
evidence-based planning needs well-synthesized data to
diametrically direct the interest of decision-makers. Little
is known, nor has there been an attempt to explicitly
analyze various aspects of youth unemployment including
duration analysis, skills mismatch and determinants of
youth unemployment to inform better policy formulation
and decision-making in Namibia.
The main aim of this report was to conduct a detailed
analysis of results of the Labour Force Survey of 2012 and
2013. More specifically, the objectives of the study were:
a. To conduct a desktop literature review on youth employment and unemployment in Namibia and to contrast it with youth unemployment globally and regionally.
b. To analyze youth employment and unemployment in Namibia using the labour force survey data.
c. To determine causes of youth unemployment in Namibia
d. To make policy suggestions for reducing youth unemployment in Namibia.
In carrying out this study, the analysis and reporting
addressed the following issues:
a. An evaluation of demographic and structural characteristics, sectorial and spatial distribution of employment opportunities for the youth aged 15-34 years in Namibia.
b. An assessment of unemployment among young people aged 15-34 years in Namibia.
c. An investigation of the causes of youth unemployment in Namibia.
d. Policy proposals on how to reduce youth unemployment in Namibia.
The analysis covered three main components: the analysis
of key indicators of labour market (KILM) pertaining to the
youth; the unemployment occurrence and labour market
mismatch. The KILM variables were analyzed by key groups.
These groups are sex; age (15-24 years for teenagers; 20-
24 for young adults; 25-34 for mature youth); educational
level; marital status; rural/urban; region; and occupation.
The analysis also focused on youth Not in Education,
Employment or Training (NEET) classified by the same bio-
demographic variables.
With regard to unemployment occurrence, the report
focused on seven indicators to study unemployment: (i)
unemployment occurrence; (ii) unemployment duration;
(iii) long-term unemployment; (iv) re-unemployment (first
or repeat); (v) unemployment index, (vi) time-related
under-employment; and (vii) NEET.
Measures of the labour market skills mismatch studied
included the coefficient of variation, proportion of
the unemployed to the employed, variance of relative
unemployment rate, and mismatch by occupation-by
calculating incidence of over-education and under-
education, and relative wage returns.
The findings of this study can be summarized in three
domains:
(i) Patterns of Youth Employment:
• Having high school education or higher; being married; or being of aged 30-34 years; and living in urban areas promoted youth employment.
• The incidence of employment in the vulnerable sectors of the economy is growing (32% in 2012 and 54.7% in 2013).
• About half of the youth were employed in the informal sectors for both years (2012 and 2013).
• Transitions from spells of unemployment are uneven, with more youth absorbed into employment within a year, after leaving school or in between jobs.
5Analysis of Youth Employment and Unemployment in Namibia 2012 - 2013
ExEcutivE summary
(ii) Causes of youth unemployment:
Youth unemployment is systemic, and is highly correlated
with education level, and gender. It shows location (rural
versus urban and regional) disparities and manifests
elements of skills mismatch.
• Unemployment and inactivity are more likely to occur among youths in rural areas; younger youths 15 – 19 years of age, and among the youth with no education or of primary education.
• Persistent high levels of unemployment among female youth, with high occurrence on almost all indicators: unemployment duration, long-term unemployment, first and repeat unemployment, NEET and unemployment index.
(iii) Skills Mismatch
• Incidence of over-education and under-education is evident in Namibia, with 14% in 2013 and 20.5% in 2012, while under-education was slightly higher in both years.
• The likelihood of mismatch by occupation was higher in males, but under-education was relatively high in females.
• Educational mismatch has negative consequences/impacts on wages. There was a wage penalty for those over-educated as opposed to those under-educated.
• With regards to permanent jobs, it is evident that companies are correctly matching jobs with education level.
• Considering the coefficient of variation and proportion of the unemployed to that employed, there was an over-supply of youth possessing certain skills – between 2012 and 2013, with unemployed male youth having an education profile different from that of employed population, while the mismatch among female may be
attributed to job searching behavior.
In summary, it has been observed that, in all indicators of
skills mismatch, there is strong evidence of labour market
mismatch in Namibia. Therefore:
• The empirical analysis suggests that over-education is a sign of market failure or structural macroeconomic bottlenecks in the economy.
• If over-education is an investment in future earning power, mismatch can be considered as temporary and may not require policy interventions, else,
• Policy makers should focus on reducing the incidence of over-education which reduces workers’ welfare and in the long run harms the employers’ interests.
Policy Recommendations
• The existing policies on redistribution of resources need to be closely re-examined. High levels of youth unemployment also contribute to poverty and social exclusion.
• Gender policies that address issues affecting male and female youth when it comes to employment and unemployment should be strongly revised. As the findings of this study show, females have a higher rate of unemployment than men. With the strong link between education and employment promoting the inclusion of the girl child into the education system from grass root level.
• There should be a policy where every girl child must go to school, because some households cannot afford to send all their children to school, therefore opting to educate the boy child only. Namibian organizations, churches, unions, employers and government need to promote free education for every single child.
• Although education credentials are important in securing jobs, education alone is not sufficient to meet the skills required.
• Entrepreneurship in Namibia – Incentives should be provided to private sectors or Small and Medium-sized Enterprises (SMEs) to encourage employers to introduce and expand quality internship programs that promote student internship that offer experience and translate into skills for job search methods.
• Insertion of orientation programme /work placement schemes – poorly integrated new entrants in job markets often have qualifications but not necessary skills, thus the need for programmes to address transition from education to work place.
• Vocational training in school curricula – strengthen the role and effectiveness of vocational training education. Private sector should own/shape the Vocational training curricula.
6 Analysis of Youth Employment and Unemployment in Namibia 2012 - 2013
Foreword ...................................................................................................................................................................... 4
Executive Summary ....................................................................................................................................................... 5
Table of Contents ......................................................................................................................................................... 7
List of Tables ................................................................................................................................................................. 9
List of Figures .............................................................................................................................................................. 11
Definitions and Terms ................................................................................................................................................. 12
Abbreviations and Acronyms ...................................................................................................................................... 13
Acknowledgements .................................................................................................................................................... 14
CHAPTER 1: Introduction.......................................................................................................................................... 15
1.1. Background ........................................................................................................................................................15
1.2. Objectives of the Analysis .................................................................................................................................. 16
1.3. Defining Key Indicators of Labour Market ......................................................................................................... 16
1.4. Methodology .....................................................................................................................................................17
1.4.1. Data ............................................................................................................................................................................17
1.4.2. Validation of LFS 2012 and 2013 results ...................................................................................................................18
1.4.3. Analysis of Key Indicators of Labour Market .............................................................................................................18
1.4.4. Unemployment occurrence ......................................................................................................................................18
1.4.5. Skills Mismatch Analysis ............................................................................................................................................18
CHAPTER 2: Literature Review.................................................................................................................................. 19
2.1. Local Youth Employment and Unemployment as contrasted to regional and global contexts. ...................... 19
2.1.1. Introduction ...............................................................................................................................................................19
2.1.2. Regional and Global unemployment rates in context ..............................................................................................19
2.1.3. Namibian Context .....................................................................................................................................................20
2.2. Main causes of youth unemployment .............................................................................................................. 21
2.2.1. Education ...................................................................................................................................................................21
2.2.2. Inefficient labour markets ........................................................................................................................................22
2.2.3. Growing skills mismatch ...........................................................................................................................................22
2.2.4. “Population Bulge” ....................................................................................................................................................23
2.2.5. Economic and financial crisis ....................................................................................................................................23
CHAPTER 3: Youth Employment: Job Characteristics and Barriers to Employment ................................................... 24
3.1. General characteristics of youth employment in 2012 and 2013 .................................................................... 24
3.1.1. Labour Force .............................................................................................................................................................24
3.1.2. Labour force participation rate (LFPR) ......................................................................................................................26
3.1.3. Employment in Informal and Vulnerable Sectors .....................................................................................................30
3.2. Youth Employment Characteristics and Barriers ............................................................................................... 33
3.2.1. Job characteristics among employed youth .............................................................................................................33
3.2.2. Determinants of Youth Employment ........................................................................................................................35
3.2.3. Determinants of spell of length of employment ......................................................................................................37
3.3. Inactive youth ....................................................................................................................................................39
TABLE OF CONTENTS
7Analysis of Youth Employment and Unemployment in Namibia 2012 - 2013
tablE of contEnts
CHAPTER 4: Youth Unemployment: Determinants and Disparities ........................................................................... 42
4.1. Introduction .......................................................................................................................................................42
4.2. Unemployment indicators ................................................................................................................................. 42
4.3. Unemployment Occurrence .............................................................................................................................. 43
4.4. Unemployment duration .................................................................................................................................. 45
4.5. Long-term unemployment among youth .......................................................................................................... 48
4.6. First and repeat unemployment among the youth ........................................................................................... 50
4.7. NEET individuals’ labour market ....................................................................................................................... 52
4.8. Time-related under-employment (TRUE) .......................................................................................................... 57
4.9. Unemployment Index ........................................................................................................................................ 59
CHAPTER 5: Measuring Skills Mismatch in Namibia between 2012 and 2013 .......................................................... 62
5.1. Introduction .......................................................................................................................................................62
5.2. Coefficient of variation ...................................................................................................................................... 62
5.3. Proportion of unemployed versus employed (PUE) ......................................................................................... 65
5.4. Variance of relative unemployment rate........................................................................................................... 67
5.5. Mismatch by Occupation .................................................................................................................................. 69
5.6. Relative wages by education level ..................................................................................................................... 75
CHAPTER 6: Summary and Policy Recommendations ............................................................................................... 77
6.1. Summaries .........................................................................................................................................................77
6.1.1. Patterns of Youth Employment: ................................................................................................................................77
6.1.2. Causes of youth unemployment: ..............................................................................................................................77
6.1.3. Skills Mismatch ..........................................................................................................................................................77
6.2. Policy Recommendations for Tackling Youth Employment and Unemployment ............................................ 78
6.2.1. Recommended Policies .............................................................................................................................................78
Appendix .................................................................................................................................................................... 80
A. Regression Models Used .................................................................................................................................... 80
B. Summary Tables for Various Indicators of Youth Employment ........................................................................... 81
C. Summary Tables for Various Indicators of Youth Unemployment ...................................................................... 84
References .................................................................................................................................................................. 90
8 Analysis of Youth Employment and Unemployment in Namibia 2012 - 2013
LIST OF TABLES
Table 1: Youth population in labour force, by sex, age group, and area (broad definition), 2012 ................................. 24
Table 2: Youth population in labour force, by sex, age group, and area (broad definition), 2013 ................................. 24
Table 3: Comparison of labour force by sex, area among youth and adults, 2012 and 2013 ........................................ 25
Table 4: Youth labour force participation rate, by age group and area, 2012 ............................................................... 26
Table 5: Youth labour force participation rate, by age group and area, 2013 ............................................................... 26
Table 6: Youth labour force participation rate by region and sex (2012) ...................................................................... 27
Table 7: Youth labour force participation rate by region and sex (2013) ...................................................................... 27
Table 8: Number and percentage of employed youth by level of education and year ................................................. 30
Table 9: Number and percentage of employed youth by occupation, sex and year ..................................................... 30
Table 10: Informal employment by area, sex and year ................................................................................................ 31
Table 11: Youth in vulnerable employment by sex and year ........................................................................................ 32
Table 12: Youth in vulnerable employment by area and year ...................................................................................... 32
Table 13: Characteristics of Job by Education level and Sex, 2013 ............................................................................... 34
Table 14: Characteristics of Job by Marital status and Sex, 2013 ................................................................................. 34
Table 15: Determinants of youth employment: Logistic regression on 2013 data ........................................................ 35
Table 16: Determinants of youth employment: Logistic regression on 2012 data ........................................................ 36
Table 17: Spell of employment among the youth in Namibia in 2013, and its determinants ....................................... 38
Table 18: Inactive Youth population by region, sex and area, 2012 ............................................................................. 39
Table 19: Inactive Youth Population by Region, Sex and Area, 2013 ............................................................................ 40
Table 20: Number and percentage of inactive youth population by age-group, sex and area, 2012 ............................ 40
Table 21: Number and percentage of inactive youth population by age-group, sex and area, 2013 ............................ 41
Table 22: Inactive youth population by sex, area and reason for inactivity, 2012 ........................................................ 41
Table 23: Inactive youth population by sex, area and reason for inactivity, 2013 ........................................................ 41
Table 24: Regression estimates for unemployed and not economically active among male and female in 2012. ........ 43
Table 25: Regression estimates for unemployed and not economically active among male and female in 2013. ....... 45
Table 26: Unemployment duration in female and males in 2012 and 2013 ................................................................. 46
Table 27: Probability of being in long-term unemployment among youth for 2012 and 2013, and between female and male .............................................................................................................................................................................49
Table 28: Probability of first unemployment among youth for 2012 and 2013, and between female and male .......... 50
Table 29: Probability of repeat unemployment among youth for 2012 and 2013, and between female and male ...... 51
Table 30: NEET by age and sex, 2012 ........................................................................................................................... 54
Table 31: NEET by age and sex, 2013 ........................................................................................................................... 54
Table 32: NEET by area and sex, 2012 .......................................................................................................................... 55
Table 33: NEET by area and sex, 2013 .......................................................................................................................... 55
Table 34: Factors associated with NEET individuals’ labour market in 2012 and 2013, for female and male ................ 57
Table 35: Time related unemployment in 2012 and 2013. ........................................................................................... 58
9Analysis of Youth Employment and Unemployment in Namibia 2012 - 2013
list of tablEs
Table 36: Outcome of the logistic regression for predicting overall youth unemployment in 2012 and 2013. ............ 61
Table 37: Schematic presentation of skills mismatch by occupation (Green colour= Undereducation; Blue colour= Over-education; Gray colour= Correct matching) .................................................................................................................69
Table 38: Incidence of over and under-education (%) by area and sex in 2012 ............................................................ 70
Table 39: Incidence of over and under-education (%) by area and sex in 2013 ............................................................ 71
Table 40: Probability of being over- and under-educated estimated with multinomial logit model, relative risk ratios (RRR), with base outcome of correctly matched, for 2012 LFS data. ............................................................................72
Table 41: Probability of being over- and under-educated estimated with multinomial logit model, relative risk ratios (RRR), with base outcome of correctly matched, for 2013 LFS data. ............................................................................74
Table 42: Parameter estimates of average wages in an OLS equation with education level as explanatory variable adjusting for different control variables for 2012 and 2013 LFS data. ..........................................................................76
Table A1: Summary of models used ............................................................................................................................ 80
Table B1: Youth employment to population ratio (YEPR), by sex, area and level of completed education, 2012 ......... 81
Table B2: Youth employed by industry, by sex and year .............................................................................................. 81
Table B3: Youth employed by employment type, sex and year.................................................................................... 82
Table B4: Youth employed by employment sector, sex and year ................................................................................. 82
Table B5: Type of contract, by employment sector, 2012 ............................................................................................ 82
Table B6: Type of contract, by employment sector, 2013 ............................................................................................ 83
Table B7: Time Related Under-employment, 2012 ...................................................................................................... 83
Table B8: Time Related Under-employment, 2013 ...................................................................................................... 83
Table B9: Average wages of employees by age group, type of employee and year ...................................................... 84
Table B10: Average Wages by Industry, Sex and Year .................................................................................................. 84
Table C1: Youth unemployment by Area, Sex and Year ................................................................................................ 84
Table C2: Youth unemployed population and unemployment rate by sex and area, 2012 ........................................... 85
Table C3: Youth unemployed population and unemployment rate by sex and area, 2013 ........................................... 85
Table C4: Unemployed youth by sex and educational level by year, 2012 ................................................................... 86
Table C5: Unemployed youth population and youth unemployment rate by sex and education level, 2013 ............... 86
Table C6: Youth unemployment by age groups and sex ............................................................................................... 86
Table C7: Unemployed youth, by sex and length of time without work ...................................................................... 87
Table C8: Unemployed youth, by area and length of time without work, 2012 ........................................................... 87
Table C9: Unemployed youth, by area and length of time without work, 2013 ........................................................... 88
Table C10: Unemployed youth, by education level and length of time without work, 2012 ........................................ 88
Table C11: Unemployed youth, by education level and length of time without work, 2013 ........................................ 89
Table C12: Proportion of unemployed to employed, across region, for 2012 and 2013. .............................................. 89
10 Analysis of Youth Employment and Unemployment in Namibia 2012 - 2013
LIST OF FIGURES
Figure 1: Change in labour force participation, between youth and adults, by area ....................................................25
Figure 2: Labour force participation rate by age groups, sex, year, and area ...............................................................28
Figure 3: Youth employment (number), by year, area and sex .....................................................................................29
Figure 4: Percentage distribution of NEETs in 2012 and 2013 across the 13 regions. ...................................................53
Figure 5: Percentage distribution of NEETS by education level by year ........................................................................53
Figure 6: Percentage distribution of severe unemployment among the youth in 2012 and 2013. ..............................60
Figure 7: Coefficient of variation by gender and year ..................................................................................................63
Figure 8: Coefficient of variation by age and year ........................................................................................................64
Figure 9: Coefficient of variation by region and year. ..................................................................................................64
Figure 10: The proportion of unemployed to employed by sex, 2012. ........................................................................65
Figure 11: The proportion of unemployed to employed by sex, 2013. ........................................................................66
Figure 12: Proportion of unemployed to the employed across region by level of education and year .........................67
Figure 13: Variance of relative unemployment rates, by sex and year .........................................................................68
Figure 14: Variance of relative unemployment rates, by region and year ....................................................................68
Figure 15: Average wages (N$) and education levels for 2012 and 2013 ......................................................................75
11Analysis of Youth Employment and Unemployment in Namibia 2012 - 2013
DEFINITIONS AND TERMS
Broad unemployment: applies when a person was
available for work in the preceding seven days, but does
not require the person actively sought work. This definition
of unemployment is appropriate for developing countries
where there are limited formal avenues through which
people can look for work.
Broad Occupation Groups: A categorization of occupation
into skills levels of high skilled non-manual, low-skilled
non-manual, skilled manual and unskilled.
Coefficient of variation: an index of dissimilarity and
captures the mismatches between skills demand and skills
supply.
First unemployment: the incidence of being unemployed
for the first time. The first unemployment applies mainly
to those in transition between school and work.
Labour Market Mismatch: a condition where employee
qualifications do not match job requirements or are not
used on the job.
Long-term unemployment: this describes unemployment
spell of more than 6 months. Long-term unemployment
may bring discouragement to job-seekers, resulting in
unemployment scarring.
Mismatch by occupation: compares people with a given
education level working at an inappropriate skills level,
measured by the broad occupation skills.
Over-education: a situation where an individual has
completed more years of education than the current job
requires. It is a term often used than over-qualification.
Repeat unemployment: a situation of being unemployed
after the initial unemployment occurrence.
Strict unemployment: applies in situations where a
person was available for work and also took active steps
to find work. Repeat unemployment may inflict setbacks,
and may reduce the likelihood of being hired in the future.
Time-related unemployment: is measured as the number
of actual hours of work. In Namibia, this is defined as
actual hours worked which is less than 35 hours per week.
Under-education: occurs where an individual has
completed few years of education than the job they are
holding.
Unemployment scarring: refers to effect of early
unemployment, which has been found to be detriment to
the worker’s future employment opportunities [because
it reduces the future likelihood of being hired, and inflicts
re-employment wages].
Variance of relative unemployment rate: is another
measure of dissimilarity like the coefficient of variation,
and uses the total unemployment rate as the scaling factor
to unemployment rate.
12 Analysis of Youth Employment and Unemployment in Namibia 2012 - 2013
ABBREVIATIONS AND ACRONYMS
CI Confidence interval
ETF European Training Foundation
GLM Generalized Linear Model
ILO International Labour Organization
KILM Key Indicators of Labour Market
LFS Labour Force Survey
NEET Not in Education, Employment or Training
NSA Namibia Statistics Agency
OECD Organization for Economic Development
OLS Ordinary Least Squares
OR Odds ratio
PUE Proportion of the unemployed to the employed
RRR Relative risk ratio
SACU Southern African Customs Union
SADC Southern Africa Development Community
TIIPEG Targeted and Integrated Intervention Programme for Employment Generation
TRUE Time Related Unemployment
VARUR Variance of Relative Unemployment Rate
13Analysis of Youth Employment and Unemployment in Namibia 2012 - 2013
ACKNOWLEDGEMENTS
This report was prepared by a team headed by Dr. Michael
Akuupa (Director of the Labour Relations Research Institute
[LaRRI], Windhoek, Namibia). Other core members of
the team included Prof. Lawrence Kazembe, Dr. Ndeyapo
Nickanor (both lecturers in the Department of Statistics
and Population Studies at the University of Namibia), and
Kudzai Chireka, a researcher at LaRRI.
The report was prepared under the close and direct
supervision of Mr. Daniel Oherein (Deputy Director,
Household, Welfare, Labour and other Social Statistics
Division of the Namibia Statistics Agency). The preparation
process benefitted from inputs of various members of the
Labour Statistics unit of the Division, including, but not
limited, to Mrs. Linda Idhogela and Mr. Onesmus Shalonda.
14 Analysis of Youth Employment and Unemployment in Namibia 2012 - 2013
CHAPTER 1: INTRODUCTION
1.1. BackgroundHigh rates of youth unemployment have been a prominent economic and social issue in the Namibian landscape.
Current model estimates from the International Labour Organization (ILO) show that youth unemployment rates is
approximately 30% as of 2012 dropping from 47.7% in 2009, restricted in the age range of 15-24 years (ILO, 2013a,b).
However, based on a broader age range, results from the Namibia Labour Force Survey (LFS), reported by the Namibia
Statistics Agency (NSA), show youth unemployment rate of 37.8% and 41.7% for 2012 and 2013 respectively (Namibia
Statistics Agency [NSA], 2012, 2013).
Youth unemployment is not just a Namibian phenomenon. It is among the major challenges facing both developed and
developing countries in the world. The problem of youth unemployment is more critical to developing countries due to
the high poverty levels requiring all people to work in order to ensure survival (ILO, 2011). According to international
labor organization’s statistics, global youth unemployment, estimated at 74.5 million in 2013, has increased by 3.4
million from 2007 to 2012 and is expected to continue increasing in the future. Statistics also show that the number
of employed youth has declined by 22.9 million in 2012 as compared to 2008 statistics despite the growth of the
youth population by 12 million for the same period (ILO, 2013a, b). The striking fact is that youth unemployment is
considerably higher than unemployment among adults, reaching 13.1% in 2013, which is 3 times higher than that of
adult population.
The consequences of youth unemployment are many. Youth unemployment has become a threat to the social, economic
and political stability in most developing countries. The youth unemployment often puts the youth in a disadvantaged
position where they are likely to earn lower future earnings or at an increased probability of being unemployed again
due to limited experience, or worse still being completely excluded from the labour market. Economically, in sum, youth
unemployment has led to the labor market instability, increased welfare costs, erosion of the tax base and unused
investments in education and trainings (ILO, 2011). In the long-run, this often leads to marginalized sections of the
population.
Understanding the patterns, structure and causes of youth employment is essential for designing policy interventions.
However, evidence-based planning needs well-synthesized data to diametrically direct the interest of decision-makers.
Results in this regard are mixed. While the NSA, through yearly labour force surveys, has demonstrated that the patterns
of youth unemployment in Namibia remain stubbornly high with little change, detailed analysis is missing. On the
other hand, the ILO modelled estimates show a decline in youth employment since 2008, nevertheless their results
are restricted to UN-defined youth in the age range of 15-24. In both accounts, data inputs are from the national
LFS, however, our understanding of the determinants of the youth employment in Namibia is surprisingly limited
(Pazvakawambwa andand Tjikune, 2013). Little is known on the demographic and structural characteristics, sectorial
and spatial distribution of employment opportunities for the youth in the age range 15-34 years in Namibia. Neither
have we explicitly analyzed various aspects of unemployment including duration analysis, skills mismatch, determinants
of unemployment to inform better policy formulation and decision-making in Namibia.
In what follows, the study of trends and patterns of youth unemployment and employment in Namibia is presented and
discussed. Critical in this analysis was to capture the causes of youth unemployment for those neither in employment,
nor in education or training (NEET).
15Analysis of Youth Employment and Unemployment in Namibia 2012 - 2013
introduction
1.2. Objectives of the AnalysisThe main aim was to conduct a detailed analysis of the Labour Force Survey of 2012 and 2013 to generate a report on
“Youth Employment and Unemployment in Namibia”.
More specifically, the objectives of the study were:
• To conduct a desktop literature review on youth employment and unemployment in Namibia and to contrast it with youth unemployment globally and regionally.
• To analyze youth employment and unemployment in Namibia using the labour force survey data.
• To determine causes of youth unemployment in Namibia
• To make policy suggestions for reducing youth unemployment in Namibia.
In carrying out this study, the analysis and reporting addressed the following issues:
• An evaluation of demographic and structural characteristics, sectorial and spatial distribution of employment opportunities for the youth aged 15-34 years in Namibia.
• An assessment of unemployment among young people aged 15-34 years in Namibia.
• An investigation of the causes of youth unemployment in Namibia.
• Policy proposals on how to reduce youth unemployment in Namibia.
1.3. Defining Key Indicators of Labour MarketAccordingly, the analysis was carried out in line with international standards, particularly those propagated by ILO. In line
with the objectives, the analysis covered key indicators of the labour market (KILM), particularly covered the following:
a. Distribution of youth population by primary activity: The indicator aims to capture the full extent of activity options of the youth population, delineating between “active” economic activities (employment and unemployment) and “inactive” activities (studying and discouragement). The distribution of the youth population by primary activity includes the following categories: (i) Employed, (ii) Unemployed, (iii) Discouraged, and (iv) In School.
b. Youth unemployment rate: The unemployment rate is defined as the number of unemployed youth (typically 15-34 years for SADC) divided by the youth labour force (employment + unemployment). The unemployment rate is probably the best-known and most used labour market indicator. Together with the employment-to-population ratio, it provides the broadest indicator of labour market performance. A relaxed measure of youth unemployment also applies. The relaxed youth unemployment rate is defined as the number of unemployed youth (typically 15-34 years) plus the number of discouraged youth divided by the youth labour force (employment + unemployment). Such a broad definition is appropriate to capture those without work but available, since in many developing countries, there are limited formal avenues where one can look for work (NSA, 2013, 2014).
c. Youth employment-to-population ratio: This is the proportion of a country’s working-age and young population that is employed. The indicator typically falls between 50 and 75 percent with a higher share indicating that a greater proportion of the youth population that could be working does work. A low ratio indicates that a large share of the population is neither working nor looking for work. In many countries, the ratio is lower for females than for males.
d. Status of youth workers in employment: The indicators refer to the proportion of the employed population classified as: (a) wage and salaried workers (employees); (b) employers and own-account workers; and (c) contributing family workers (unpaid family workers). These three groups of workers are presented as percentages of the total employed for both sexes and for males and females.
Analysis of Youth Employment and Unemployment in Namibia 2012 - 201316
introduction
e. Youth employment by sector: The Youth Employment by Sector indicator is also known as 1-Digit Sector Level Indicator (ILO, 2015). The indicator aims to show where youth are working, i.e. in what specific sector. Aggregate sectors include agriculture, industry, and services, with employment in each category implying differences in terms of pay, job attachment, conditions of work, etc. Looking at youth employment by the 1-digit level over time provides information on which sectors youth are attracted to. Changes over time provide information on possible areas of economic growth or deterioration. The indicator on employment by sector can be used in conjunction with other indicators, in particular employment by status, to identify vulnerable groups in the labour market. In addition, the breakdown of the indicator by sex allows for analysis of gender segregation of employment by specific sector.
f. Youth employment in public sector: The public sector plays a significant social and economic role. Past estimates suggest the world share of public employment in total world employment is about 30 percent and varies by level of economic development and the role of the state in the production of goods and services. In this context, this indicator aims at providing information on the share of youth in public employment in order to improve diagnostics of the labor market challenges faced by youth. The indicator can support governments to identify bottlenecks for employment creation and have grounds for further promotion of youth employment in the private sector.
g. Educational attainment of youth labour force: Educational attainment reflects the levels and distribution of the knowledge and skills base of the youth labour force. Statistics on levels and trends in educational attainment of the labour force can: (a) provide an indication of the capacity of the country to achieve important social and economic goals; (b) give insights into the broad skill structure of the labour force; (c) highlight the need to promote investments in education for different population groups; (d) support analysis of the influence of skill levels on economic outcomes and the success of different policies in raising the educational level of the workforce; (e) give an indication of the degree of inequality in the distribution of education resources between groups of the population, particularly between men and women, and permits within and between areas (e.g. regions); and (f) provide an indication of the skills of the existing labour force, with a view to discovering untapped potential.
1.4. MethodologyA number of methodological approaches to address the objectives were used. In brief, these are summarized below,
with an extensive presentation of the techniques given in respective chapters [3, 4 and 5].
1.4.1. Data
This study was based on data drawn from the LFS of 2012 and 2013. Both surveys were based on a two-stage cluster
design targeted at private households. At first stage, primary sampling units (PSU), usually enumeration areas were
selected proportional to size. The PSU were drawn from the master sample frame design for the 2011 Population and
Housing Census. At the second stage, a fixed number of households in the chosen PSUs were systematically selected.
Subsequently all adult of working age (15 years and above) were asked to participate in the study. A key question which
was asked was “Have you worked for pay, or profit or family gain for one hour or more in the last week” (NSA, 2013).
The LFS recorded data on variables such as: demographic characteristics, labour force and inactive population, and
employment status, which were critical for the analysis of patterns and causes of unemployment.
17Analysis of Youth Employment and Unemployment in Namibia 2012 - 2013
introduction
1.4.2. Validation of LFS 2012 and 2013 results
Data checks by way of validation of the results of the LFS of 2012 and 2013 were carried out. At this stage, identification
of possible determinants of labour market outcomes, in consultation with the Labour Statistic unit of the NSA, was
completed.
1.4.3. Analysis of Key Indicators of Labour Market
A summary of youth market experience by re-analyzing and extending the analysis of key indicators of labour market
to unravel main causes of youth employment was done. About ten (10) KILM as defined in section 1.3 were analyzed
by key groups. These groups are sex; age (15-24 years for teenage; 20-24 for young adults; 25-34 for mature youth];
educational level; marital status; rural/urban; region; and occupation. The analysis also focused on youth NEET classified
by the same bio-demographic variables. The results of this analysis are presented in Chapter 3.
1.4.4. Unemployment occurrence
We used seven indicators to study for unemployment: unemployment occurrence; unemployment duration; long-term
unemployment; re- unemployment (first or repeat), unemployment index, time-related under-employment and NEET.
The analysis is covered in Chapter 4.
1.4.5. Skills Mismatch Analysis
Various measures of the labour market skills mismatch were studied. These included the coefficient of variation,
proportion of the unemployed to the employed, variance of relative unemployment rate, mismatch by occupation-by
calculating incidence of over-education and under-education, and relative wage returns. The skills mismatch analysis is
given in Chapter 5.
Analysis of Youth Employment and Unemployment in Namibia 2012 - 201318
CHAPTER 2: LITERATURE REVIEW
2.1. Local Youth Employment and Unemployment as contrasted to regional and global contexts.
2.1.1. Introduction
The chapter explores three main areas namely, definition of youth employment and unemployment in Namibian context,
identify currents trends of youth unemployment and the main patterns, structures of unemployment among the youth
including perspectives. Accordingly, the chapter relates Namibia’s employment and unemployment of the youth context
to regional, continental and global perspectives respectively.
The ILO (2004) defined unemployment people as those “that have not worked for more than one hour during the short
reference period (generally, the last 7 days) but who are available for and actively seeking work.” While this definition has
become widely accepted to contextualise unemployment the world over, we have to be wary of the different variables
that informs contexts when we define unemployment from one country to another. Singell andand Lillydahl (1989)
argued that general definitions of unemployment are inadequate for analysing and understanding the problem of youth
unemployment, particularly in developing countries such as Namibia. They have called for development, analysis and
application of “alternative concepts of satisfactory or unsatisfactory status of young people” respectively (Ibid: 457).
The Namibian government has prioritized unemployment as a socio-economic problem and has since been trying to
deal with the matter. While government was commended for creating initiatives to deal with unemployment, especially
with recent Targeted Intervention Program for Employment and Economic Growth (TIPEEG) initiative high levels of
unemployment persists among the youth. In this context the Labour Resource and Research Institute did an empirical
study with recommendations among the unemployed youth in Namibia. The findings of the study highlighted “Namibia’s
crisis of mass unemployment is affecting the youth severely and can be attributed to a mixture of poor quality output
of the education system, a skills mismatch in the labour market and economic structures that prevent the creation of a
sufficient number of jobs” (LaRRI, 2011: 52). The issue of youth employment and unemployment is experienced globally
yet dynamically, thus it is important to study the Namibia case uniquely in relation to the continent and the global world.
The above inference is justified by socio-economic cultural circumstances that direct the economy.
2.1.2. Regional and Global unemployment rates in context
While it is advisable to view Namibia situation uniquely, the employment and unemployment set up among the
youth cannot be understood in isolation. According to the ILO report of 2004 the world continues to face a worsening
youth employment crisis. In fact the labour market outlook for young people worsened in nearly every region of the
world Namibia included. The current patterns are clear indicators that there is indeed a crisis of unemployed and
underemployed youth (ILO, 2004).
For instance young people are three times more likely to be unemployed than adults and almost 73 million youth
worldwide are looking for work (ILO, 2014). The ratio and numbers mentioned here are reason for serious concern,
thus governments and stakeholders requires urgent innovations and actions in order to deal with the issue of youth
employment and unemployment.
While signs of rising economy are reported on the African continent, unemployment and underemployment rates
remain high in Africa. It seems the continent lacks common approval to tackle the job crisis (Chuma, 2014). On the other
hand Higgins posits that figures about employment and unemployment of youth less widely available for developing
countries. However, data suggests that the gap between youth and adult unemployment rates is wider on the continent
than in industrialized nations. Youth unemployment occurs at a rate more than twice that for adults (ILO, 2014c).
19Analysis of Youth Employment and Unemployment in Namibia 2012 - 2013

litEraturE rEviEw
Global employment trends report suggest that should current trends continue, global unemployment is set to worsen
further, albeit gradually, reaching more than 215 million jobseekers by 2018. Youth unemployment has since reached
13 .1 % which is almost 3 times as high as adult unemployment rate (ILO, 2014b).
Youth unemployment is considered a barrier to the Southern African region's development (Devlin, 2013). On the
continent some of the highest rates of unemployment are in Southern Africa, where 51 percent of young women and
43 percent of young men are unemployed (Delvin, 2013). In sub-Saharan Africa it is reported that “young people under
the age of 25 represent 3/5 of sub-Saharan Africa’s unemployed population and 70% of the youth population lives on
less than $2 a day (ILO, 2014). Difficulties finding and sustaining employment detract from a young person’s lifetime
productivity and earnings, making it more challenging to escape poverty (Delvin, 2013).
As of 2014 the youth accounted for 60% of all unemployed Africans (World Bank, 2014). Only a quarter (1/4) of the total
labour force has stable wage paying jobs. However youth unemployment in North African countries remains the highest
in the world reaching more than 29% in 2013 (ILO, 2014c). Youth unemployment is expected to continue increasing
in the future, because currently unemployment was estimated at 74 million in 2013, which showed there was a huge
increase by 3.4 million from 2007 to 2012 (ILO, 2013b).
However, it is important to note that youth on the continent are getting better educated, and the age proportion
of 20-24years who complete secondary education will increase from 42% to 59% over the next two years (African
Economic Outlook, 2013).
2.1.3. Namibian Context
Literature about youth unemployment and employment is limited in Namibia. In 2014 the World Bank did an overview
study of Namibia. In terms of development the review suggest that although Namibia enjoyed economic growth and
prudent macroeconomic policies, these have not generated the jobs needed to overcome the inequitable distributions
of income, assets (notably land), and raise living standards in rural areas and among the urban poor. The report notes
that at the top of the government’s agenda is bringing down the very high unemployment rate. Growth industries
generate few new jobs. With this in mind Namibia, is also experiencing the dire straits of youth unemployment.
In Namibia, the unemployment rate measures the number of people actively looking for a job as a percentage of the
labour force (NSA, 2011). The unemployment rate continue to decrease with latest recording said to be just about 28.1%
(NSA, 2014) compared to 2013 which was 29.6% (NSA, 2013). With such decreases being recorded, unemployment
of youth is still rife in Namibia. Ortiz andand Cummins (2012) argue that the decrease in unemployment rates can be
attributed to prevalent vulnerable employment. This picture also remains true in the sub-Saharan Africa. According to
Ortiz and Cummins (2012), in 2011, vulnerable employment accounted for 70% of all jobs growth in sub-Saharan Africa.
According to the SADC publication “South Africa and Namibia both have a relatively low percentage of working-age
population, male and female, working or looking for work. Unemployment among young women is especially high in
South Africa, Namibia and Lesotho” (SADC, 2015). The Namibian Labour Force Survey of 2004 recorded that the youth
unemployment rate in Namibia has the number of women higher than men. Yet 10 years later the findings are still
following the same pattern, with unemployment being currently highest among female compared to male.
Various stakeholders have identified unemployment as one of the major issues to be tackled in the years to come (Suonpaa
and Matswetu, 2012). According to Eita and Ashipala (2010) and Suonpaa and Matswetu (2012), unemployment has
had a huge impact on Namibia. Unemployment has drastic impacts on those that are not working.
Analysis of Youth Employment and Unemployment in Namibia 2012 - 201320
litEraturE rEviEw
For instance lack of employment could cause ‘homelessness, lack of family cohesion, poverty and could possibly affect
one’s human dignity (Suonpaa and Matswetu, 2012). Therefore the employment and unemployment rates stated
in previous paragraphs show that Namibian youth employment is vulnerable to these problems and needs as much
attention as the rest of the other African countries.
2.2. Main causes of youth unemploymentUnemployment is a worldwide phenomenon and is not just experienced in Namibia. There are numerous challenges that
the young people are facing when entering the labour market, particularly in developing economies (ILO, 2011). “Not
only do they need to find a job, and preferably one that corresponds to their level of qualifications, they also want to
develop a foundation for a lasting, stable employment relationship that helps them to progress in life (ILO, 2011). There
are several factors, such as their relative lack of skills, unstable labour market experience and discrimination, which
contribute to the difficulty usually faced by young people entering the labour market. According to Higgins (2011) “In
developing countries, youth unemployment is compounded by substantial levels of underemployment and poor-quality
jobs in the informal sector.” Both these phenomena are widespread, which suggests that the problem of integrating
young people into the labour market in developing countries is even more serious than would first appear. Africa’s youth
employment challenges are as diverse as the continent itself” (African Economic Outlook, 2012). Policy factors play an
important role in determining unemployment rates (Scarpetta, 1996), and further address labour market issues with the
aim of facilitating entry into the labour market.
2.2.1. Education
Garcia (2011) states that education and labour market are linked; moreover the malfunctions between education and
the labour market complicate the efficient transition from education environment to work environment which lead to
high unemployment (Pazvakawambwa and Tjikune, 2012).
According to a study done by the Labour Resource and Research Institute (LaRRI) on youth and unemployment in Namibia;
“In Sub-Saharan Africa there is a link between high unemployment and education...the low level of education of young
people is a significant factor in the longer unemployment spells they face” (LaRRI, 2011). According to the findings of
the LaRRI research, ‘The crisis of youth unemployment in Namibia’ in 2011 youth education in Africa remains below
average, in Sub-Saharan Africa youth literacy is 76.8% which is lower than Latin America (94.8%) and the Caribbean,
in East Asia and the Pacific it is 98%. In many African countries education is a major and important determinant for
securing a formal job. Thus youth unemployment in Africa remains significantly higher among the less educated than
among the more educated (LaRRI, 2011).
Suonpaa and Matswetu (2012) have identified several reasons for unemployment in Namibia. They stated that one
of the key reasons why youth unemployment is being experienced at the high rates “is the lack of skills amongst job
seekers and especially those with no formal training.” Suonpaa and Matswetu (2012) also state that the Namibian
economy base is narrow and of which this could hamper the development pace of the country. Suonpaa & Matswetu
(2012) identified that; the “problematic nature of Namibian education (access, equity, quality and efficiency), lack of
ambition or will to work, corruption in the recruitment policies such as nepotism and favouritism, lack of experience
and globalization and technological advances, over qualification and lack of experience” are some of the major factors
contributing to high unemployment rates in Namibia.
21Analysis of Youth Employment and Unemployment in Namibia 2012 - 2013
litEraturE rEviEw
2.2.2. Inefficient labour markets
According to the Economist (2013), South Asia, the Middle East and Africa are regions where almost half of the world’s
young population is, they are also the regions with the fastest growing populations. Therefore it is crucial that the labour
market be efficient enough to accommodate the upcoming youth labour force. However, reports have shown that the
labour markets are inefficient and hence have caused a major fall in accommodating the youth (Economist, 2013).
Looking at the economic set up of most countries in Africa “The poorest African countries have very low unemployment
rates alongside a large informal sector that employs up to 90% of the working age population” (African Economic
Outlook, 2012), yet in middle income countries, the informal sectors are relatively smaller and hence do not absorb
young workers as they do in poor countries.
It seems integration into the labour market is not a guided transition, therefore creating an inefficient labour market.
General Labour market reforms according to Lindbeck (2014) have affected current policies and have seen employment
opportunities for the young people affected by structural changes in the labour market. “Entries to the labour market
for young people have disappeared without being replaced with other entries” (Lindbeck, 2014). There is a lack of
adequate and proper guidance for the youth from the time they leave schools to the time they find work. According
to Barbagelata (2012) “Inadequate training—or the lack of training more generally—is one of the reasons why young
people struggle in their search for employment.” The gap between the two calls for policies of strategic frameworks that
aim to bridge that gap between school and the world of work.
The State of the African Youth report (2011) revealed that “African youth also have inadequate participation in decision
making and social dialogue at local, national and regional levels.”, and that this has had a huge impact on integration of
the youth as part of the working force and therefore failure to address the issues that affect the youth and employment.
Namibia needs to actively engage its youth in social dialogue at all levels and create an atmosphere where the youth
and government dialogue on what’s needed and what can be done to address the issue of inefficient labour market.
2.2.3. Growing skills mismatch
Young people should be able to make an easy transition from school to work with the skills and knowledge they would
have acquired (UNECA, 2005; UNFP African Youth Report, 2011). However, inability to do so has seen the youth giving
up on searching for jobs, incompetence in the job market and having employers not consider school leavers for jobs as
they lack experience and can be seen as an expense or liability (Flanagan, 1994). According to a study commissioned
by Namibia Employers Federation in 2010, done by Institute of Public Policy Research (IPPR), there is a skill gap that
has seen many companies (which were part of the study) stating that “critical vacancies that require specialist skills
they cannot fill” (Links, 2010). This study predicted that five years later there would still be this skill gap of degreed
professionals and special skills jobs in Namibia.
According to the report by Amare (2014), “Youth remain almost twice as likely to be unemployed than their elders.
This is partly because of a mismatch between their skills and what is required for available employment opportunities”
(Amare, 2014). A lot of countries in the region have reported that there is growing mismatch of skills but more research
within the Namibian context needs to be done to further substantiate this claim. Therefore more research needs to be
on this claim as there is not enough literature with detailed country by country analysis of the skills mismatch though it
is normally referred to as one of the major causes of unemployment.
Analysis of Youth Employment and Unemployment in Namibia 2012 - 201322
litEraturE rEviEw
2.2.4. “Population Bulge”
The increasing population in Sub-Saharan Africa is seen as one of the reasons for the rising rate of youth unemployment
(UNFPA Report, 2011; Amare, 2014). “Sub-Saharan Africa has the fastest population growth projected between now and
2050 and the highest youth population in the world. It is crucial that governments factor this 'youth bulge' into national
and social development planning” (Amare, 2014). However the correlation of population growth and employment is not
always direct and simple but does give indication to possible policy needs, estimates on number of jobs to be created
and strategic frameworks that address the needs that come with population increase. According to the 2011 Namibia
Population and Housing census, Namibia is a nation of young people, with 37% of the total population being 15 years of
age and below a median age of 21.
“Persistently high unemployment suggests a lack of effective policy interventions. To date, policies that have been
implemented have largely been supply-side initiatives aimed at the structural causes of youth unemployment (Oosthuizen
and Cassim, 2014: 1). Therefore, there is a need to identify and propose policies that can help do away with the lack of
effective policy interventions.
2.2.5. Economic and financial crisis
According to Atwoli (2014) the global economic and financial crisis adversely affected Africa because the continent
invested very heavily in its informal economy. Atwoli further suggests that what has to happen is to make sure that the
informal economy is formalized. This process will help to create sustained employment on the continent especially for
youth and women.
Namibia in 2012 was one of the countries with the largest youth share in their respective populations which was affected
by the prolonged effects of the 2008 global economic crisis (Ortiz and Cummins, 2012). When the economic crisis hit,
there was high numbers of youth being unemployed, because there were limited job opportunities. Economically, in
sum, youth unemployment has led to the labour market instability, increased welfare costs, erosion of the tax base and
unused investments in education and trainings (ILO, 2011).
23Analysis of Youth Employment and Unemployment in Namibia 2012 - 2013
CHAPTER 3: YOUTH EMPLOYMENT: JOB CHARACTERISTICS AND BARRIERS TO EMPLOYMENT
3.1. General characteristics of youth employment in 2012 and 2013
3.1.1. Labour Force
While the foregoing chapter presented the structural challenges relating to youth unemployment, this chapter will dwell
on the characteristics of Namibia youth employment between 2012 and 2013. Labour force is derived from a person’s
activity status, i.e. employed, unemployed and inactive. The first two categories constitute the labour force.
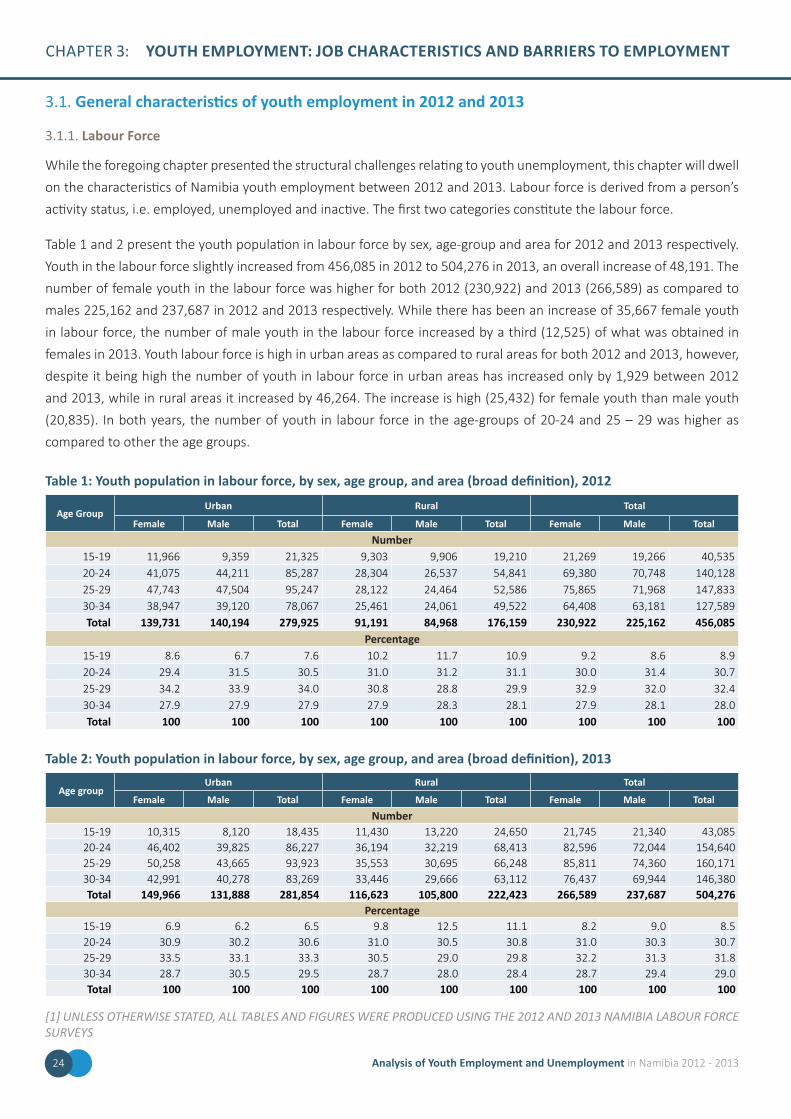
Table 1 and 2 present the youth population in labour force by sex, age-group and area for 2012 and 2013 respectively.
Youth in the labour force slightly increased from 456,085 in 2012 to 504,276 in 2013, an overall increase of 48,191. The
number of female youth in the labour force was higher for both 2012 (230,922) and 2013 (266,589) as compared to
males 225,162 and 237,687 in 2012 and 2013 respectively. While there has been an increase of 35,667 female youth
in labour force, the number of male youth in the labour force increased by a third (12,525) of what was obtained in
females in 2013. Youth labour force is high in urban areas as compared to rural areas for both 2012 and 2013, however,
despite it being high the number of youth in labour force in urban areas has increased only by 1,929 between 2012
and 2013, while in rural areas it increased by 46,264. The increase is high (25,432) for female youth than male youth
(20,835). In both years, the number of youth in labour force in the age-groups of 20-24 and 25 – 29 was higher as
compared to other the age groups.
Table 1: Youth population in labour force, by sex, age group, and area (broad definition), 2012
Age Group Urban Rural Total
Female Male Total Female Male Total Female Male TotalNumber
15-19 11,966 9,359 21,325 9,303 9,906 19,210 21,269 19,266 40,53520-24 41,075 44,211 85,287 28,304 26,537 54,841 69,380 70,748 140,12825-29 47,743 47,504 95,247 28,122 24,464 52,586 75,865 71,968 147,83330-34 38,947 39,120 78,067 25,461 24,061 49,522 64,408 63,181 127,589Total 139,731 140,194 279,925 91,191 84,968 176,159 230,922 225,162 456,085
Percentage15-19 8.6 6.7 7.6 10.2 11.7 10.9 9.2 8.6 8.920-24 29.4 31.5 30.5 31.0 31.2 31.1 30.0 31.4 30.725-29 34.2 33.9 34.0 30.8 28.8 29.9 32.9 32.0 32.430-34 27.9 27.9 27.9 27.9 28.3 28.1 27.9 28.1 28.0Total 100 100 100 100 100 100 100 100 100
Table 2: Youth population in labour force, by sex, age group, and area (broad definition), 2013
Age groupUrban Rural Total
Female Male Total Female Male Total Female Male TotalNumber
15-19 10,315 8,120 18,435 11,430 13,220 24,650 21,745 21,340 43,08520-24 46,402 39,825 86,227 36,194 32,219 68,413 82,596 72,044 154,64025-29 50,258 43,665 93,923 35,553 30,695 66,248 85,811 74,360 160,17130-34 42,991 40,278 83,269 33,446 29,666 63,112 76,437 69,944 146,380Total 149,966 131,888 281,854 116,623 105,800 222,423 266,589 237,687 504,276
Percentage15-19 6.9 6.2 6.5 9.8 12.5 11.1 8.2 9.0 8.520-24 30.9 30.2 30.6 31.0 30.5 30.8 31.0 30.3 30.725-29 33.5 33.1 33.3 30.5 29.0 29.8 32.2 31.3 31.830-34 28.7 30.5 29.5 28.7 28.0 28.4 28.7 29.4 29.0Total 100 100 100 100 100 100 100 100 100
[1] unlEss otHErwisE statEd, all tablEs and fiGurEs wErE ProducEd usinG tHE 2012 and 2013 namibia labour forcE survEys
24 Analysis of Youth Employment and Unemployment in Namibia 2012 - 2013
youtH EmPloymEnt: job cHaractEristics and barriErs to EmPloymEnt
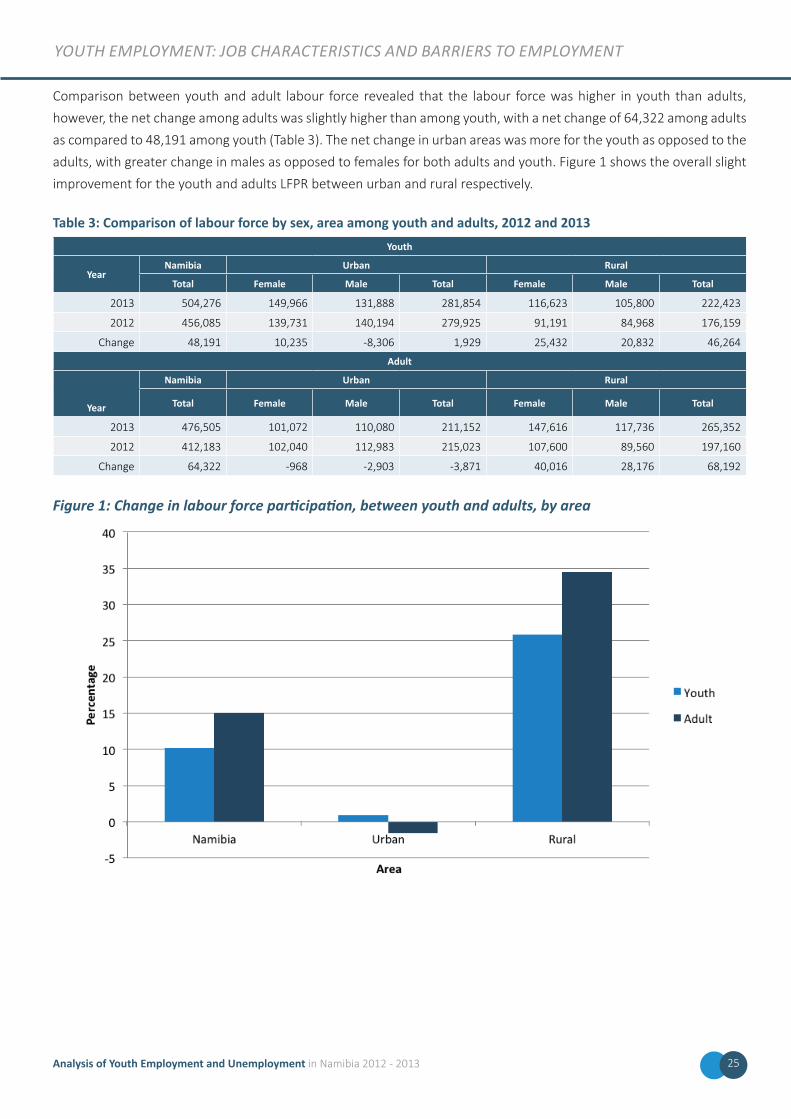
Comparison between youth and adult labour force revealed that the labour force was higher in youth than adults,
however, the net change among adults was slightly higher than among youth, with a net change of 64,322 among adults
as compared to 48,191 among youth (Table 3). The net change in urban areas was more for the youth as opposed to the
adults, with greater change in males as opposed to females for both adults and youth. Figure 1 shows the overall slight
improvement for the youth and adults LFPR between urban and rural respectively.
Table 3: Comparison of labour force by sex, area among youth and adults, 2012 and 2013Youth
YearNamibia Urban Rural
Total Female Male Total Female Male Total
2013 504,276 149,966 131,888 281,854 116,623 105,800 222,423
2012 456,085 139,731 140,194 279,925 91,191 84,968 176,159
Change 48,191 10,235 -8,306 1,929 25,432 20,832 46,264
Adult
Year
Namibia Urban Rural
Total Female Male Total Female Male Total
2013 476,505 101,072 110,080 211,152 147,616 117,736 265,352
2012 412,183 102,040 112,983 215,023 107,600 89,560 197,160
Change 64,322 -968 -2,903 -3,871 40,016 28,176 68,192
Figure 1: Change in labour force participation, between youth and adults, by area
25Analysis of Youth Employment and Unemployment in Namibia 2012 - 2013
youtH EmPloymEnt: job cHaractEristics and barriErs to EmPloymEnt
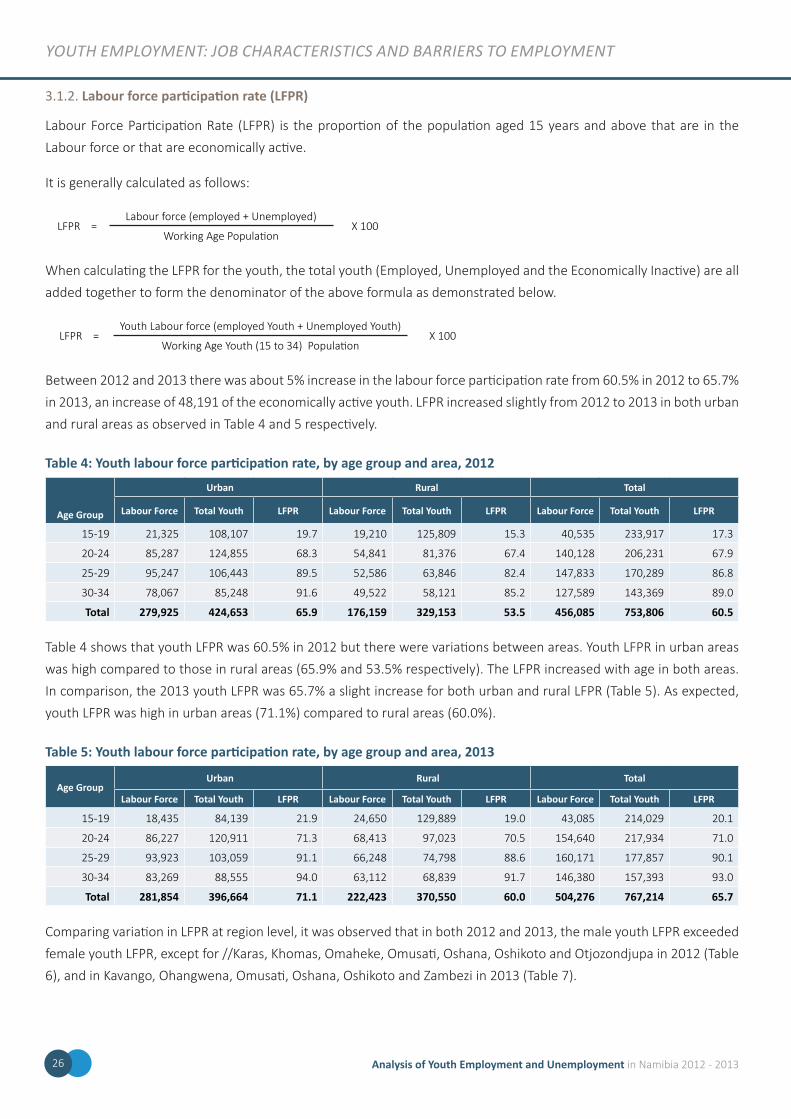
3.1.2. Labour force participation rate (LFPR)
Labour Force Participation Rate (LFPR) is the proportion of the population aged 15 years and above that are in the
Labour force or that are economically active.
It is generally calculated as follows:
LFPR =Labour force (employed + Unemployed)
X 100Working Age Population
When calculating the LFPR for the youth, the total youth (Employed, Unemployed and the Economically Inactive) are all
added together to form the denominator of the above formula as demonstrated below.
LFPR =Youth Labour force (employed Youth + Unemployed Youth)
X 100Working Age Youth (15 to 34) Population
Between 2012 and 2013 there was about 5% increase in the labour force participation rate from 60.5% in 2012 to 65.7%
in 2013, an increase of 48,191 of the economically active youth. LFPR increased slightly from 2012 to 2013 in both urban
and rural areas as observed in Table 4 and 5 respectively.
Table 4: Youth labour force participation rate, by age group and area, 2012
Age Group
Urban Rural Total
Labour Force Total Youth LFPR Labour Force Total Youth LFPR Labour Force Total Youth LFPR
15-19 21,325 108,107 19.7 19,210 125,809 15.3 40,535 233,917 17.3
20-24 85,287 124,855 68.3 54,841 81,376 67.4 140,128 206,231 67.9
25-29 95,247 106,443 89.5 52,586 63,846 82.4 147,833 170,289 86.8
30-34 78,067 85,248 91.6 49,522 58,121 85.2 127,589 143,369 89.0
Total 279,925 424,653 65.9 176,159 329,153 53.5 456,085 753,806 60.5
Table 4 shows that youth LFPR was 60.5% in 2012 but there were variations between areas. Youth LFPR in urban areas
was high compared to those in rural areas (65.9% and 53.5% respectively). The LFPR increased with age in both areas.
In comparison, the 2013 youth LFPR was 65.7% a slight increase for both urban and rural LFPR (Table 5). As expected,
youth LFPR was high in urban areas (71.1%) compared to rural areas (60.0%).
Table 5: Youth labour force participation rate, by age group and area, 2013
Age Group Urban Rural Total
Labour Force Total Youth LFPR Labour Force Total Youth LFPR Labour Force Total Youth LFPR
15-19 18,435 84,139 21.9 24,650 129,889 19.0 43,085 214,029 20.1
20-24 86,227 120,911 71.3 68,413 97,023 70.5 154,640 217,934 71.0
25-29 93,923 103,059 91.1 66,248 74,798 88.6 160,171 177,857 90.1
30-34 83,269 88,555 94.0 63,112 68,839 91.7 146,380 157,393 93.0
Total 281,854 396,664 71.1 222,423 370,550 60.0 504,276 767,214 65.7
Comparing variation in LFPR at region level, it was observed that in both 2012 and 2013, the male youth LFPR exceeded
female youth LFPR, except for //Karas, Khomas, Omaheke, Omusati, Oshana, Oshikoto and Otjozondjupa in 2012 (Table
6), and in Kavango, Ohangwena, Omusati, Oshana, Oshikoto and Zambezi in 2013 (Table 7).
Analysis of Youth Employment and Unemployment in Namibia 2012 - 201326
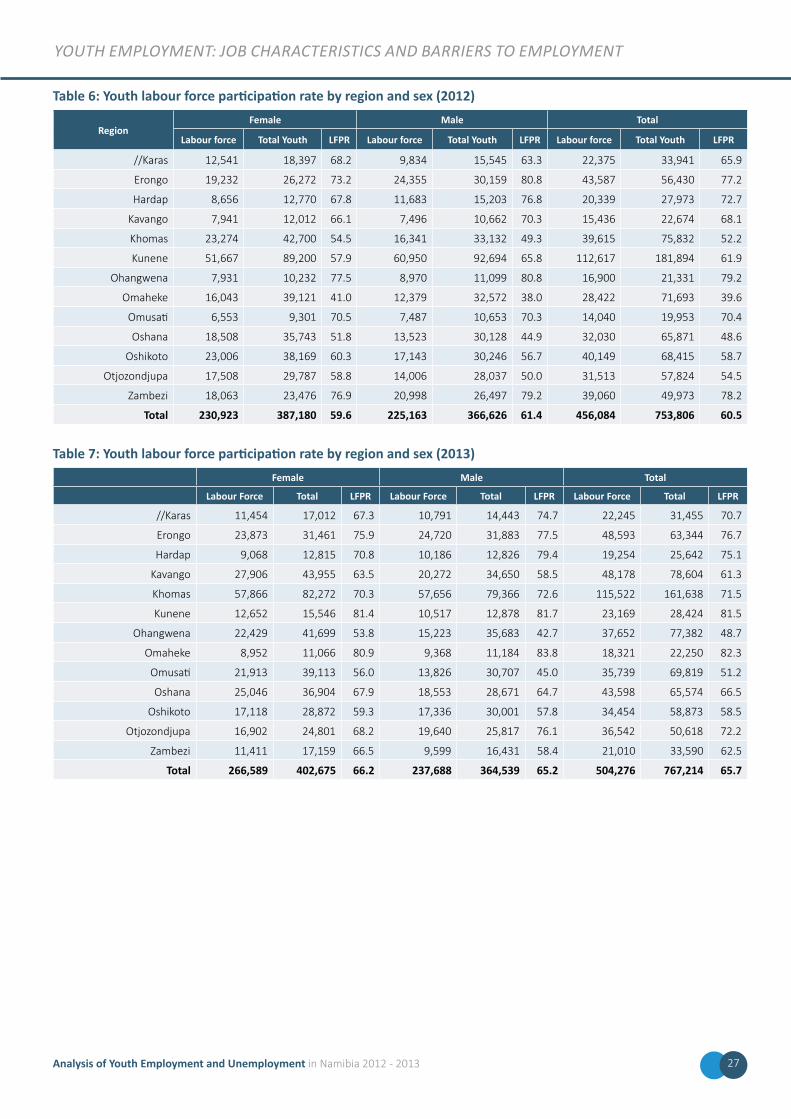
youtH EmPloymEnt: job cHaractEristics and barriErs to EmPloymEnt
Table 6: Youth labour force participation rate by region and sex (2012)
RegionFemale Male Total
Labour force Total Youth LFPR Labour force Total Youth LFPR Labour force Total Youth LFPR
//Karas 12,541 18,397 68.2 9,834 15,545 63.3 22,375 33,941 65.9
Erongo 19,232 26,272 73.2 24,355 30,159 80.8 43,587 56,430 77.2
Hardap 8,656 12,770 67.8 11,683 15,203 76.8 20,339 27,973 72.7
Kavango 7,941 12,012 66.1 7,496 10,662 70.3 15,436 22,674 68.1
Khomas 23,274 42,700 54.5 16,341 33,132 49.3 39,615 75,832 52.2
Kunene 51,667 89,200 57.9 60,950 92,694 65.8 112,617 181,894 61.9
Ohangwena 7,931 10,232 77.5 8,970 11,099 80.8 16,900 21,331 79.2
Omaheke 16,043 39,121 41.0 12,379 32,572 38.0 28,422 71,693 39.6
Omusati 6,553 9,301 70.5 7,487 10,653 70.3 14,040 19,953 70.4
Oshana 18,508 35,743 51.8 13,523 30,128 44.9 32,030 65,871 48.6
Oshikoto 23,006 38,169 60.3 17,143 30,246 56.7 40,149 68,415 58.7
Otjozondjupa 17,508 29,787 58.8 14,006 28,037 50.0 31,513 57,824 54.5
Zambezi 18,063 23,476 76.9 20,998 26,497 79.2 39,060 49,973 78.2
Total 230,923 387,180 59.6 225,163 366,626 61.4 456,084 753,806 60.5
Table 7: Youth labour force participation rate by region and sex (2013)Female Male Total
Labour Force Total LFPR Labour Force Total LFPR Labour Force Total LFPR
//Karas 11,454 17,012 67.3 10,791 14,443 74.7 22,245 31,455 70.7
Erongo 23,873 31,461 75.9 24,720 31,883 77.5 48,593 63,344 76.7
Hardap 9,068 12,815 70.8 10,186 12,826 79.4 19,254 25,642 75.1
Kavango 27,906 43,955 63.5 20,272 34,650 58.5 48,178 78,604 61.3
Khomas 57,866 82,272 70.3 57,656 79,366 72.6 115,522 161,638 71.5
Kunene 12,652 15,546 81.4 10,517 12,878 81.7 23,169 28,424 81.5
Ohangwena 22,429 41,699 53.8 15,223 35,683 42.7 37,652 77,382 48.7
Omaheke 8,952 11,066 80.9 9,368 11,184 83.8 18,321 22,250 82.3
Omusati 21,913 39,113 56.0 13,826 30,707 45.0 35,739 69,819 51.2
Oshana 25,046 36,904 67.9 18,553 28,671 64.7 43,598 65,574 66.5
Oshikoto 17,118 28,872 59.3 17,336 30,001 57.8 34,454 58,873 58.5
Otjozondjupa 16,902 24,801 68.2 19,640 25,817 76.1 36,542 50,618 72.2
Zambezi 11,411 17,159 66.5 9,599 16,431 58.4 21,010 33,590 62.5
Total 266,589 402,675 66.2 237,688 364,539 65.2 504,276 767,214 65.7
27Analysis of Youth Employment and Unemployment in Namibia 2012 - 2013
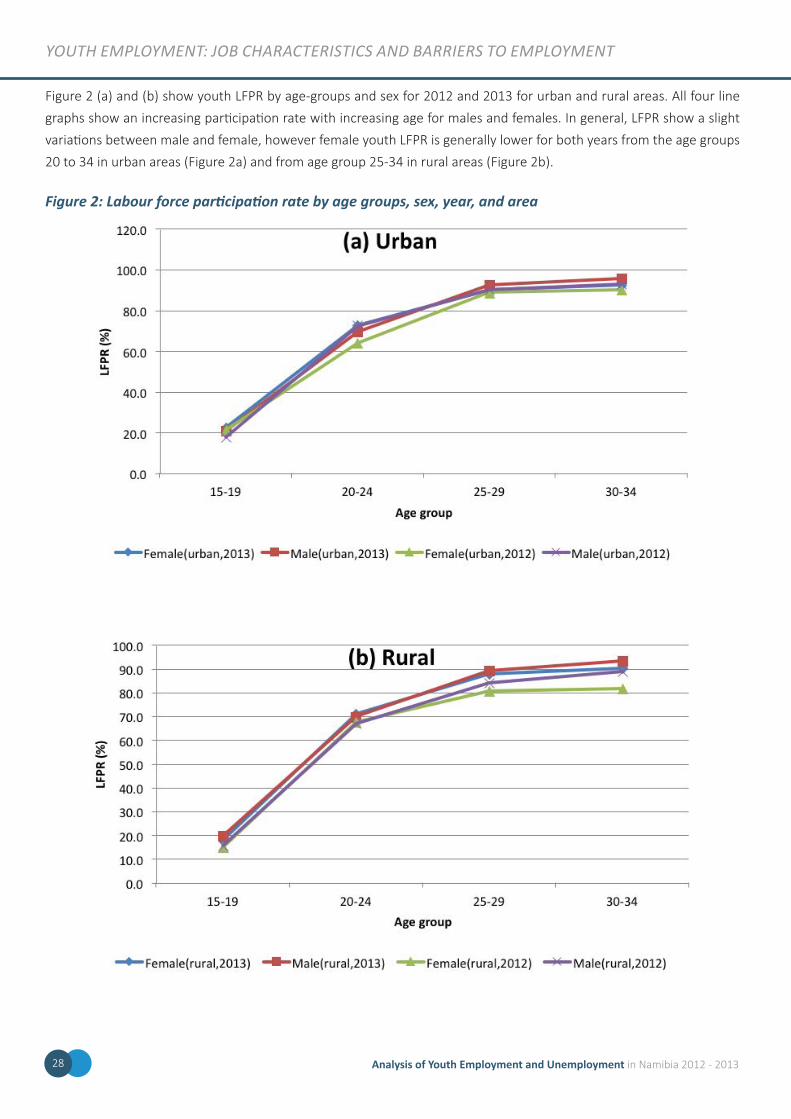
youtH EmPloymEnt: job cHaractEristics and barriErs to EmPloymEnt
Figure 2 (a) and (b) show youth LFPR by age-groups and sex for 2012 and 2013 for urban and rural areas. All four line
graphs show an increasing participation rate with increasing age for males and females. In general, LFPR show a slight
variations between male and female, however female youth LFPR is generally lower for both years from the age groups
20 to 34 in urban areas (Figure 2a) and from age group 25-34 in rural areas (Figure 2b).
Figure 2: Labour force participation rate by age groups, sex, year, and area
Analysis of Youth Employment and Unemployment in Namibia 2012 - 201328

youtH EmPloymEnt: job cHaractEristics and barriErs to EmPloymEnt
Figure 3 (a) and (b) shows the number of employed youth by year, area and sex. The number of employed youth was
high for male in both urban and rural areas. However the number of employed male youth in urban areas declined from
97,022 in 2012 to 89,046 in 2013. The overall increase in the employed youth in 2013 was due to the increase in the
number of employed female youth.
Figure 3: Youth employment (number), by year, area and sex
29Analysis of Youth Employment and Unemployment in Namibia 2012 - 2013
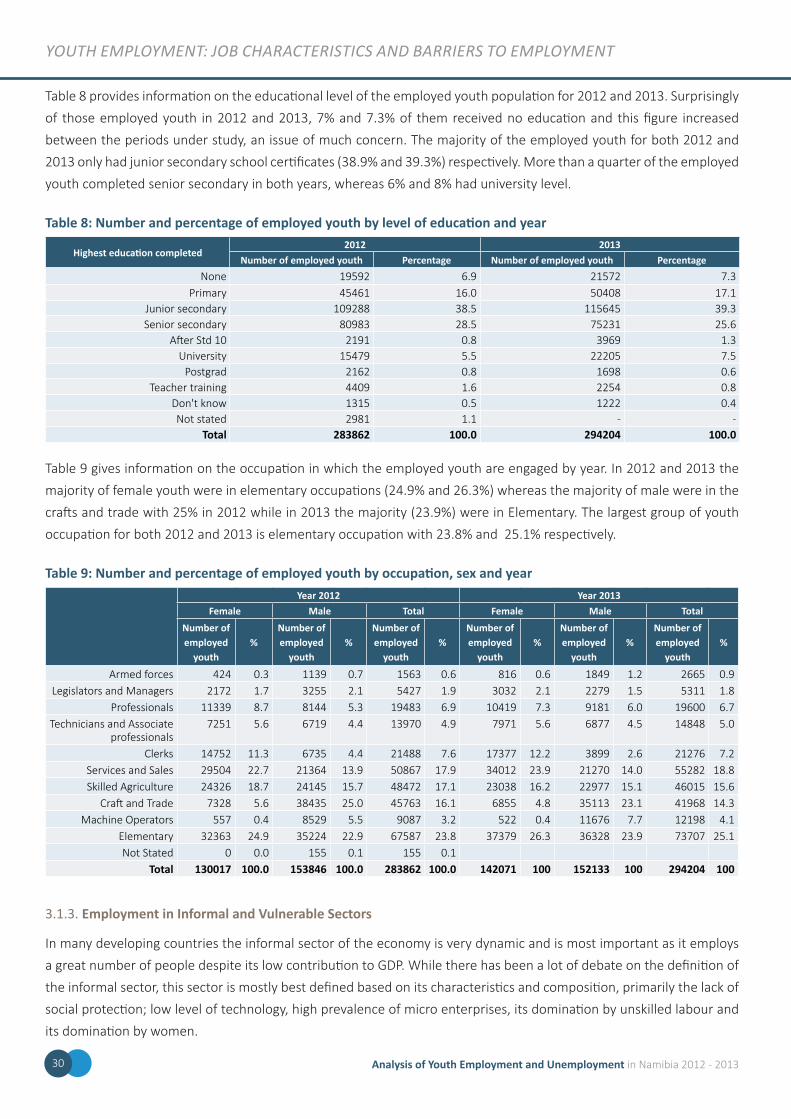
youtH EmPloymEnt: job cHaractEristics and barriErs to EmPloymEnt
Table 8 provides information on the educational level of the employed youth population for 2012 and 2013. Surprisingly
of those employed youth in 2012 and 2013, 7% and 7.3% of them received no education and this figure increased
between the periods under study, an issue of much concern. The majority of the employed youth for both 2012 and
2013 only had junior secondary school certificates (38.9% and 39.3%) respectively. More than a quarter of the employed
youth completed senior secondary in both years, whereas 6% and 8% had university level.
Table 8: Number and percentage of employed youth by level of education and year
Highest education completed2012 2013
Number of employed youth Percentage Number of employed youth PercentageNone 19592 6.9 21572 7.3
Primary 45461 16.0 50408 17.1Junior secondary 109288 38.5 115645 39.3Senior secondary 80983 28.5 75231 25.6
After Std 10 2191 0.8 3969 1.3University 15479 5.5 22205 7.5
Postgrad 2162 0.8 1698 0.6Teacher training 4409 1.6 2254 0.8
Don't know 1315 0.5 1222 0.4Not stated 2981 1.1 - -
Total 283862 100.0 294204 100.0
Table 9 gives information on the occupation in which the employed youth are engaged by year. In 2012 and 2013 the
majority of female youth were in elementary occupations (24.9% and 26.3%) whereas the majority of male were in the
crafts and trade with 25% in 2012 while in 2013 the majority (23.9%) were in Elementary. The largest group of youth
occupation for both 2012 and 2013 is elementary occupation with 23.8% and 25.1% respectively.
Table 9: Number and percentage of employed youth by occupation, sex and yearYear 2012 Year 2013
Female Male Total Female Male Total
Number of employed
youth %
Number of employed
youth%
Number of employed
youth%
Number of employed
youth%
Number of employed
youth%
Number of employed
youth%
Armed forces 424 0.3 1139 0.7 1563 0.6 816 0.6 1849 1.2 2665 0.9Legislators and Managers 2172 1.7 3255 2.1 5427 1.9 3032 2.1 2279 1.5 5311 1.8
Professionals 11339 8.7 8144 5.3 19483 6.9 10419 7.3 9181 6.0 19600 6.7Technicians and Associate
professionals7251 5.6 6719 4.4 13970 4.9 7971 5.6 6877 4.5 14848 5.0
Clerks 14752 11.3 6735 4.4 21488 7.6 17377 12.2 3899 2.6 21276 7.2Services and Sales 29504 22.7 21364 13.9 50867 17.9 34012 23.9 21270 14.0 55282 18.8Skilled Agriculture 24326 18.7 24145 15.7 48472 17.1 23038 16.2 22977 15.1 46015 15.6
Craft and Trade 7328 5.6 38435 25.0 45763 16.1 6855 4.8 35113 23.1 41968 14.3Machine Operators 557 0.4 8529 5.5 9087 3.2 522 0.4 11676 7.7 12198 4.1
Elementary 32363 24.9 35224 22.9 67587 23.8 37379 26.3 36328 23.9 73707 25.1Not Stated 0 0.0 155 0.1 155 0.1
Total 130017 100.0 153846 100.0 283862 100.0 142071 100 152133 100 294204 100
3.1.3. Employment in Informal and Vulnerable Sectors
In many developing countries the informal sector of the economy is very dynamic and is most important as it employs
a great number of people despite its low contribution to GDP. While there has been a lot of debate on the definition of
the informal sector, this sector is mostly best defined based on its characteristics and composition, primarily the lack of
social protection; low level of technology, high prevalence of micro enterprises, its domination by unskilled labour and
its domination by women.
Analysis of Youth Employment and Unemployment in Namibia 2012 - 201330
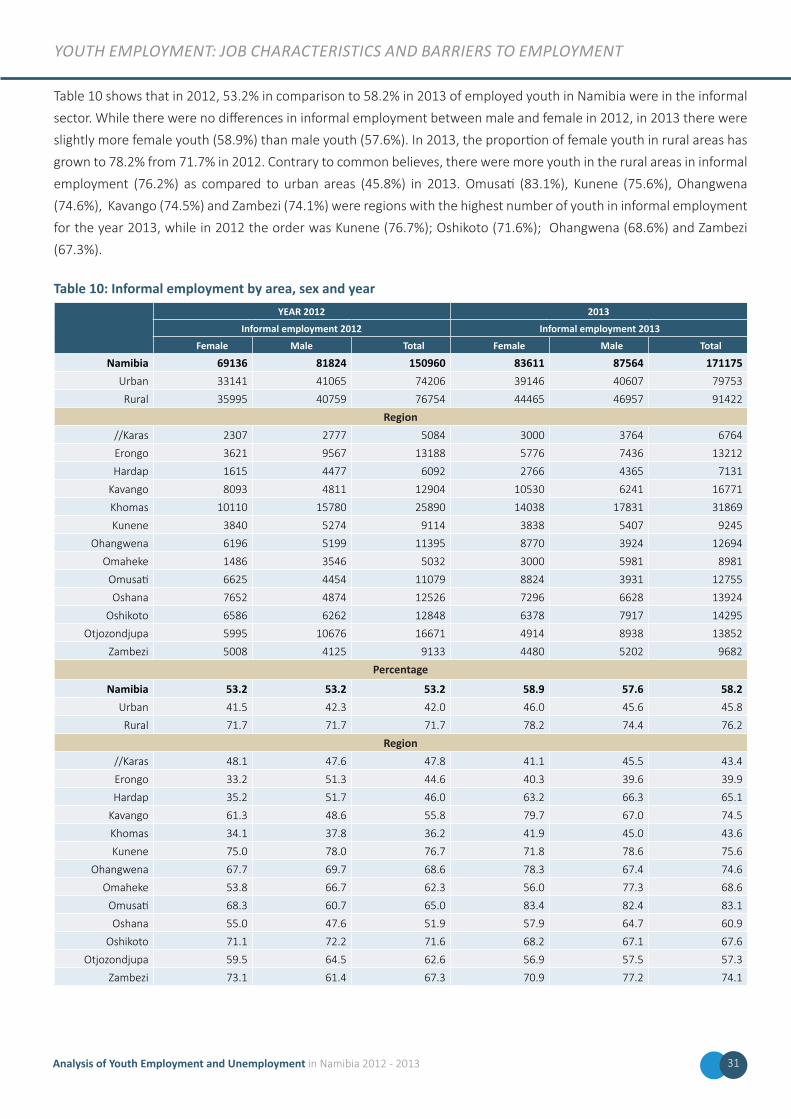
youtH EmPloymEnt: job cHaractEristics and barriErs to EmPloymEnt
Table 10 shows that in 2012, 53.2% in comparison to 58.2% in 2013 of employed youth in Namibia were in the informal
sector. While there were no differences in informal employment between male and female in 2012, in 2013 there were
slightly more female youth (58.9%) than male youth (57.6%). In 2013, the proportion of female youth in rural areas has
grown to 78.2% from 71.7% in 2012. Contrary to common believes, there were more youth in the rural areas in informal
employment (76.2%) as compared to urban areas (45.8%) in 2013. Omusati (83.1%), Kunene (75.6%), Ohangwena
(74.6%), Kavango (74.5%) and Zambezi (74.1%) were regions with the highest number of youth in informal employment
for the year 2013, while in 2012 the order was Kunene (76.7%); Oshikoto (71.6%); Ohangwena (68.6%) and Zambezi
(67.3%).
Table 10: Informal employment by area, sex and yearYEAR 2012 2013
Informal employment 2012 Informal employment 2013
Female Male Total Female Male Total
Namibia 69136 81824 150960 83611 87564 171175Urban 33141 41065 74206 39146 40607 79753
Rural 35995 40759 76754 44465 46957 91422
Region//Karas 2307 2777 5084 3000 3764 6764
Erongo 3621 9567 13188 5776 7436 13212
Hardap 1615 4477 6092 2766 4365 7131
Kavango 8093 4811 12904 10530 6241 16771
Khomas 10110 15780 25890 14038 17831 31869
Kunene 3840 5274 9114 3838 5407 9245
Ohangwena 6196 5199 11395 8770 3924 12694
Omaheke 1486 3546 5032 3000 5981 8981
Omusati 6625 4454 11079 8824 3931 12755
Oshana 7652 4874 12526 7296 6628 13924
Oshikoto 6586 6262 12848 6378 7917 14295
Otjozondjupa 5995 10676 16671 4914 8938 13852
Zambezi 5008 4125 9133 4480 5202 9682
Percentage
Namibia 53.2 53.2 53.2 58.9 57.6 58.2Urban 41.5 42.3 42.0 46.0 45.6 45.8
Rural 71.7 71.7 71.7 78.2 74.4 76.2
Region//Karas 48.1 47.6 47.8 41.1 45.5 43.4
Erongo 33.2 51.3 44.6 40.3 39.6 39.9
Hardap 35.2 51.7 46.0 63.2 66.3 65.1
Kavango 61.3 48.6 55.8 79.7 67.0 74.5
Khomas 34.1 37.8 36.2 41.9 45.0 43.6
Kunene 75.0 78.0 76.7 71.8 78.6 75.6
Ohangwena 67.7 69.7 68.6 78.3 67.4 74.6
Omaheke 53.8 66.7 62.3 56.0 77.3 68.6
Omusati 68.3 60.7 65.0 83.4 82.4 83.1
Oshana 55.0 47.6 51.9 57.9 64.7 60.9
Oshikoto 71.1 72.2 71.6 68.2 67.1 67.6
Otjozondjupa 59.5 64.5 62.6 56.9 57.5 57.3
Zambezi 73.1 61.4 67.3 70.9 77.2 74.1
31Analysis of Youth Employment and Unemployment in Namibia 2012 - 2013
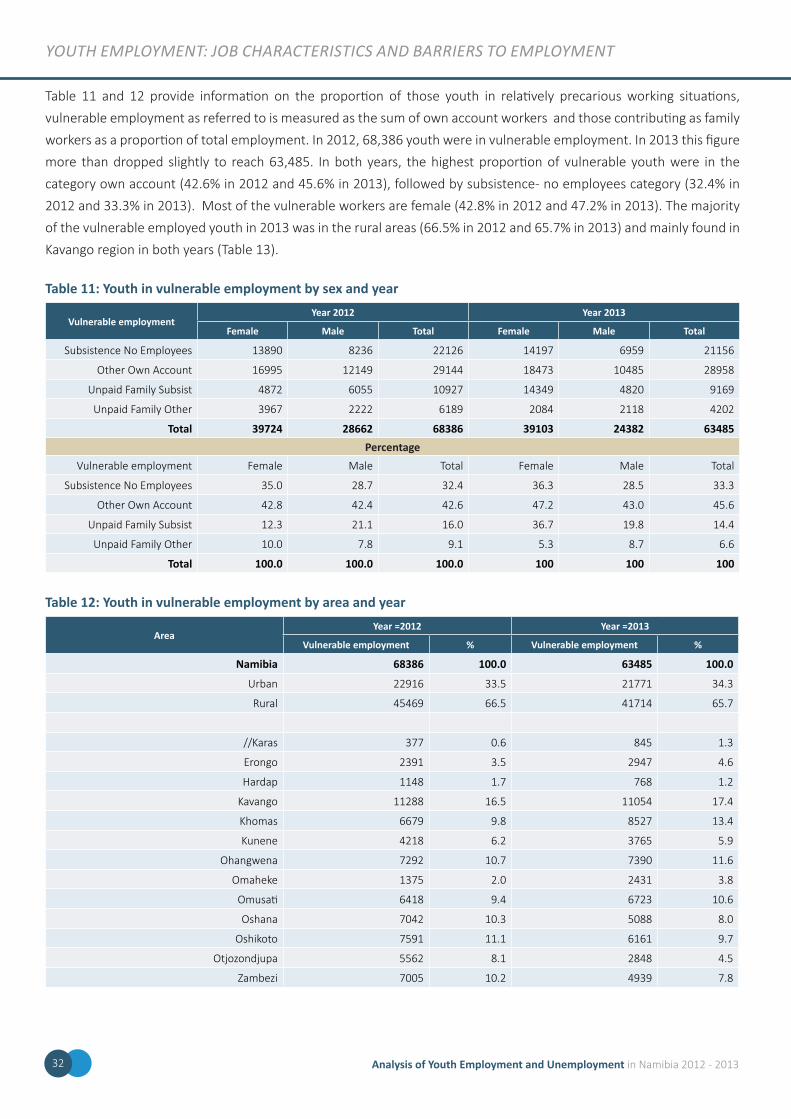
youtH EmPloymEnt: job cHaractEristics and barriErs to EmPloymEnt
Table 11 and 12 provide information on the proportion of those youth in relatively precarious working situations,
vulnerable employment as referred to is measured as the sum of own account workers and those contributing as family
workers as a proportion of total employment. In 2012, 68,386 youth were in vulnerable employment. In 2013 this figure
more than dropped slightly to reach 63,485. In both years, the highest proportion of vulnerable youth were in the
category own account (42.6% in 2012 and 45.6% in 2013), followed by subsistence- no employees category (32.4% in
2012 and 33.3% in 2013). Most of the vulnerable workers are female (42.8% in 2012 and 47.2% in 2013). The majority
of the vulnerable employed youth in 2013 was in the rural areas (66.5% in 2012 and 65.7% in 2013) and mainly found in
Kavango region in both years (Table 13).
Table 11: Youth in vulnerable employment by sex and year
Vulnerable employmentYear 2012 Year 2013
Female Male Total Female Male Total
Subsistence No Employees 13890 8236 22126 14197 6959 21156
Other Own Account 16995 12149 29144 18473 10485 28958
Unpaid Family Subsist 4872 6055 10927 14349 4820 9169
Unpaid Family Other 3967 2222 6189 2084 2118 4202
Total 39724 28662 68386 39103 24382 63485Percentage
Vulnerable employment Female Male Total Female Male Total
Subsistence No Employees 35.0 28.7 32.4 36.3 28.5 33.3
Other Own Account 42.8 42.4 42.6 47.2 43.0 45.6
Unpaid Family Subsist 12.3 21.1 16.0 36.7 19.8 14.4
Unpaid Family Other 10.0 7.8 9.1 5.3 8.7 6.6
Total 100.0 100.0 100.0 100 100 100
Table 12: Youth in vulnerable employment by area and year
AreaYear =2012 Year =2013
Vulnerable employment % Vulnerable employment %
Namibia 68386 100.0 63485 100.0
Urban 22916 33.5 21771 34.3
Rural 45469 66.5 41714 65.7
//Karas 377 0.6 845 1.3
Erongo 2391 3.5 2947 4.6
Hardap 1148 1.7 768 1.2
Kavango 11288 16.5 11054 17.4
Khomas 6679 9.8 8527 13.4
Kunene 4218 6.2 3765 5.9
Ohangwena 7292 10.7 7390 11.6
Omaheke 1375 2.0 2431 3.8
Omusati 6418 9.4 6723 10.6
Oshana 7042 10.3 5088 8.0
Oshikoto 7591 11.1 6161 9.7
Otjozondjupa 5562 8.1 2848 4.5
Zambezi 7005 10.2 4939 7.8
Analysis of Youth Employment and Unemployment in Namibia 2012 - 201332
youtH EmPloymEnt: job cHaractEristics and barriErs to EmPloymEnt
3.2. Youth Employment Characteristics and BarriersStudies of labour force have identified main correlates of employment, hence barriers to employment in the general
population and marginalized groups, particularly the youth. Studies that focus on the youth show that personal
characteristics and location play an important aspect to being in employed. Personal characteristics include education
attainment and marital status, and job location attributes include industry and occupation.
Adequate education has consistently been found to be one of the most important factors (ILO, 2013a,b). Those who have
high school graduates have higher employment rates than those who dropped out of school, nevertheless education
alone does not protect female youth from employment hardships to the same extent as male youth and vice versa. In
light of these recent studies, we expect to find different levels of association between labour market outcomes and sex
among the youth.
Earnings attainment is the widely studied labour market outcome that takes into account gender-disparities. Studies
have shown that disparities may also exist with regards to length of the job spell (Singell and Lillydahl, 1989; Oosthuizen
and Cassim, 2014). In addition to education and gender, marital status in another personal characteristic associated with
labour market outcomes. For instance, labour behavior of married women is often constrained by family responsibilities,
e.g. caring for children. In such cases women are likely to stay at home, thus keeping the levels of employment low.
Furthermore labour market experience plays an important part in securing jobs, more generally, those who have
accumulated labour market have an improved employment position.
3.2.1. Job characteristics among employed youth
Table 13 examines job characteristics by education and sex of the youth in 2013. Male youth with high school education
or more earned the highest wages as compared to female.
The Labour Act of 2007, Public Service Act of 1995, Affirmative Action Act of 1995, Social Security Act of 1994, Marriage
Persons Equality Act of 1996 and the National Gender Policy are some of the mechanisms instituted by government
to promote equitable employment. While many of the above instruments are partly aimed to redress inequalities in
employment and especially gender balance in decision making, foster fairness in recruitment, selection, appointment,
training, promotion and equitable remuneration. The Social Security Act provides some safeguards against loss of
income, due to sickness, pregnancy, injury and old age. Female youth with high school education or more are likely to
have social security. It is worth mentioning that contributions by employers and employees to the Social Security are
much low compared to health insurance and pensions. Similarly female are more likely to participate due to maternity
benefits, however this has its own limitations as women with good jobs tend to lose out.
There are few differences in the youth’s industry and occupation category. Male youth with high school education or less
are likely to be employed as skilled manual. As shown elsewhere, the informal industry is dominated by low educated
participants with females being the majority (89%). Youth with high school education or more are more likely to be on
permanent contracts.
33Analysis of Youth Employment and Unemployment in Namibia 2012 - 2013
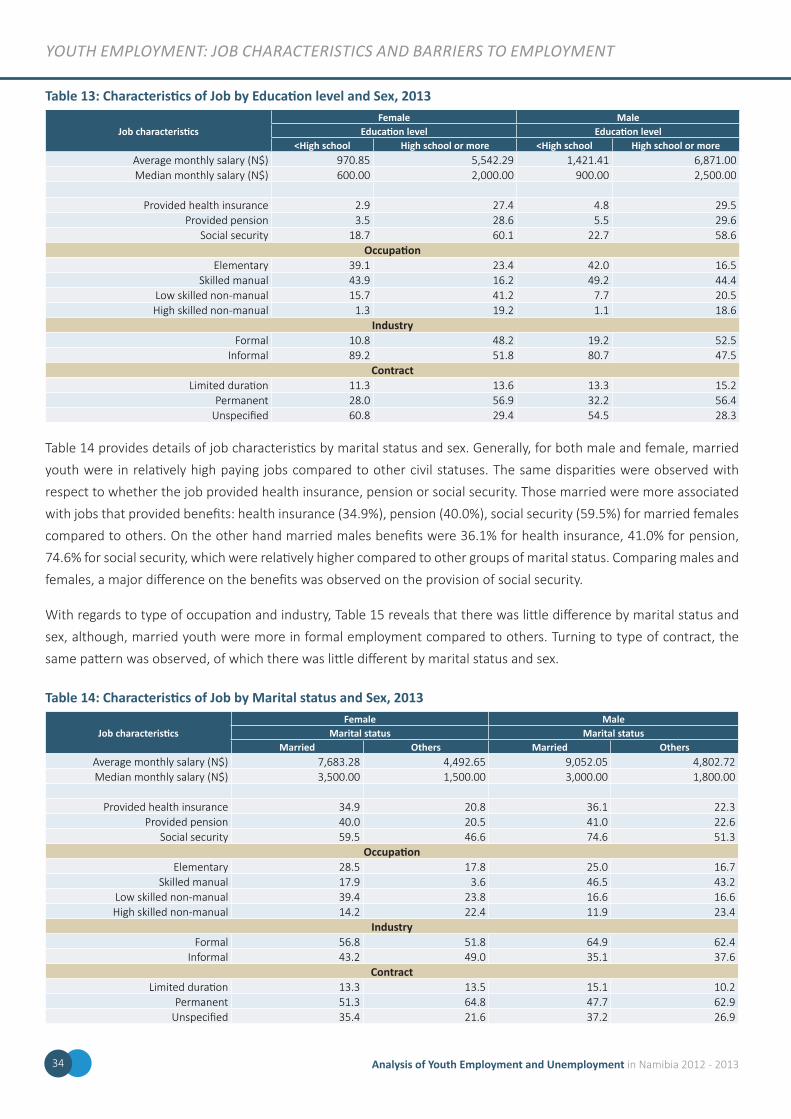
youtH EmPloymEnt: job cHaractEristics and barriErs to EmPloymEnt
Table 13: Characteristics of Job by Education level and Sex, 2013
Job characteristicsFemale Male
Education level Education level<High school High school or more <High school High school or more
Average monthly salary (N$) 970.85 5,542.29 1,421.41 6,871.00Median monthly salary (N$) 600.00 2,000.00 900.00 2,500.00
Provided health insurance 2.9 27.4 4.8 29.5Provided pension 3.5 28.6 5.5 29.6
Social security 18.7 60.1 22.7 58.6Occupation
Elementary 39.1 23.4 42.0 16.5Skilled manual 43.9 16.2 49.2 44.4
Low skilled non-manual 15.7 41.2 7.7 20.5High skilled non-manual 1.3 19.2 1.1 18.6
IndustryFormal 10.8 48.2 19.2 52.5
Informal 89.2 51.8 80.7 47.5Contract
Limited duration 11.3 13.6 13.3 15.2Permanent 28.0 56.9 32.2 56.4
Unspecified 60.8 29.4 54.5 28.3
Table 14 provides details of job characteristics by marital status and sex. Generally, for both male and female, married
youth were in relatively high paying jobs compared to other civil statuses. The same disparities were observed with
respect to whether the job provided health insurance, pension or social security. Those married were more associated
with jobs that provided benefits: health insurance (34.9%), pension (40.0%), social security (59.5%) for married females
compared to others. On the other hand married males benefits were 36.1% for health insurance, 41.0% for pension,
74.6% for social security, which were relatively higher compared to other groups of marital status. Comparing males and
females, a major difference on the benefits was observed on the provision of social security.
With regards to type of occupation and industry, Table 15 reveals that there was little difference by marital status and
sex, although, married youth were more in formal employment compared to others. Turning to type of contract, the
same pattern was observed, of which there was little different by marital status and sex.
Table 14: Characteristics of Job by Marital status and Sex, 2013
Job characteristicsFemale Male
Marital status Marital statusMarried Others Married Others
Average monthly salary (N$) 7,683.28 4,492.65 9,052.05 4,802.72Median monthly salary (N$) 3,500.00 1,500.00 3,000.00 1,800.00
Provided health insurance 34.9 20.8 36.1 22.3Provided pension 40.0 20.5 41.0 22.6
Social security 59.5 46.6 74.6 51.3Occupation
Elementary 28.5 17.8 25.0 16.7Skilled manual 17.9 3.6 46.5 43.2
Low skilled non-manual 39.4 23.8 16.6 16.6High skilled non-manual 14.2 22.4 11.9 23.4
IndustryFormal 56.8 51.8 64.9 62.4
Informal 43.2 49.0 35.1 37.6Contract
Limited duration 13.3 13.5 15.1 10.2Permanent 51.3 64.8 47.7 62.9
Unspecified 35.4 21.6 37.2 26.9
Analysis of Youth Employment and Unemployment in Namibia 2012 - 201334
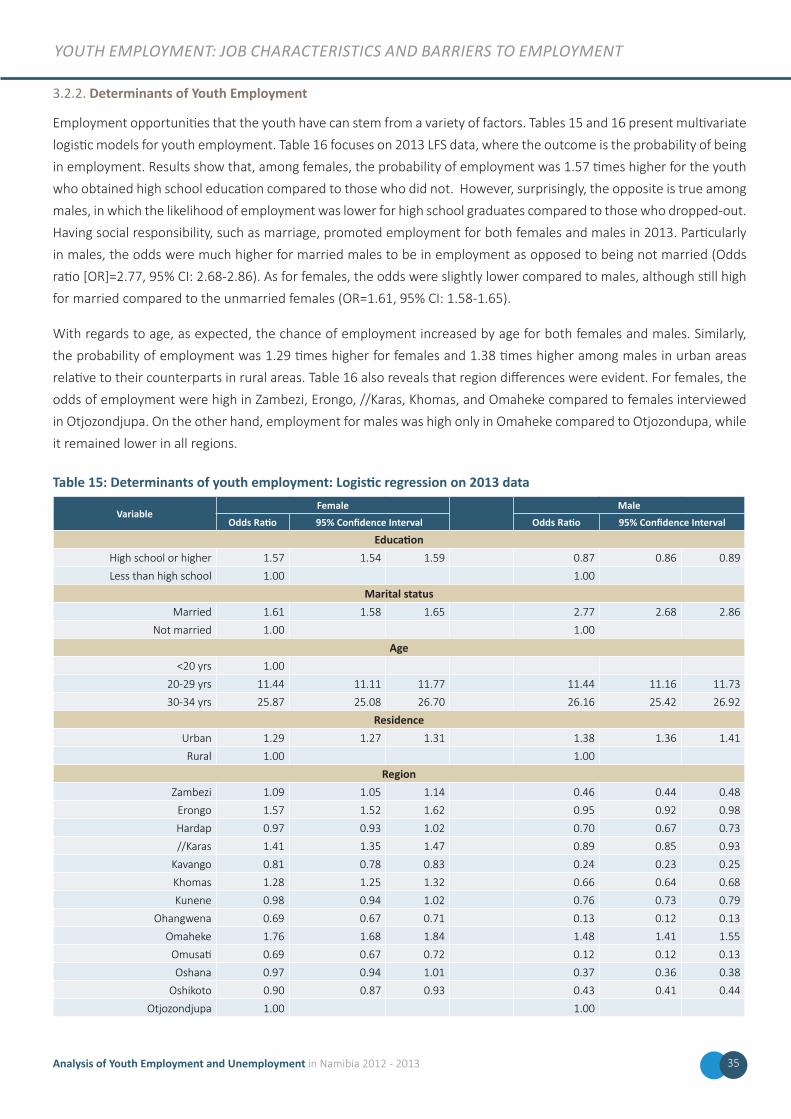
youtH EmPloymEnt: job cHaractEristics and barriErs to EmPloymEnt
3.2.2. Determinants of Youth Employment
Employment opportunities that the youth have can stem from a variety of factors. Tables 15 and 16 present multivariate
logistic models for youth employment. Table 16 focuses on 2013 LFS data, where the outcome is the probability of being
in employment. Results show that, among females, the probability of employment was 1.57 times higher for the youth
who obtained high school education compared to those who did not. However, surprisingly, the opposite is true among
males, in which the likelihood of employment was lower for high school graduates compared to those who dropped-out.
Having social responsibility, such as marriage, promoted employment for both females and males in 2013. Particularly
in males, the odds were much higher for married males to be in employment as opposed to being not married (Odds
ratio [OR]=2.77, 95% CI: 2.68-2.86). As for females, the odds were slightly lower compared to males, although still high
for married compared to the unmarried females (OR=1.61, 95% CI: 1.58-1.65).
With regards to age, as expected, the chance of employment increased by age for both females and males. Similarly,
the probability of employment was 1.29 times higher for females and 1.38 times higher among males in urban areas
relative to their counterparts in rural areas. Table 16 also reveals that region differences were evident. For females, the
odds of employment were high in Zambezi, Erongo, //Karas, Khomas, and Omaheke compared to females interviewed
in Otjozondjupa. On the other hand, employment for males was high only in Omaheke compared to Otjozondupa, while
it remained lower in all regions.
Table 15: Determinants of youth employment: Logistic regression on 2013 data
VariableFemale Male
Odds Ratio 95% Confidence Interval Odds Ratio 95% Confidence Interval
EducationHigh school or higher 1.57 1.54 1.59 0.87 0.86 0.89
Less than high school 1.00 1.00
Marital statusMarried 1.61 1.58 1.65 2.77 2.68 2.86
Not married 1.00 1.00
Age<20 yrs 1.00
20-29 yrs 11.44 11.11 11.77 11.44 11.16 11.73
30-34 yrs 25.87 25.08 26.70 26.16 25.42 26.92
ResidenceUrban 1.29 1.27 1.31 1.38 1.36 1.41
Rural 1.00 1.00
RegionZambezi 1.09 1.05 1.14 0.46 0.44 0.48
Erongo 1.57 1.52 1.62 0.95 0.92 0.98
Hardap 0.97 0.93 1.02 0.70 0.67 0.73
//Karas 1.41 1.35 1.47 0.89 0.85 0.93
Kavango 0.81 0.78 0.83 0.24 0.23 0.25
Khomas 1.28 1.25 1.32 0.66 0.64 0.68
Kunene 0.98 0.94 1.02 0.76 0.73 0.79
Ohangwena 0.69 0.67 0.71 0.13 0.12 0.13
Omaheke 1.76 1.68 1.84 1.48 1.41 1.55
Omusati 0.69 0.67 0.72 0.12 0.12 0.13
Oshana 0.97 0.94 1.01 0.37 0.36 0.38
Oshikoto 0.90 0.87 0.93 0.43 0.41 0.44
Otjozondjupa 1.00 1.00
35Analysis of Youth Employment and Unemployment in Namibia 2012 - 2013
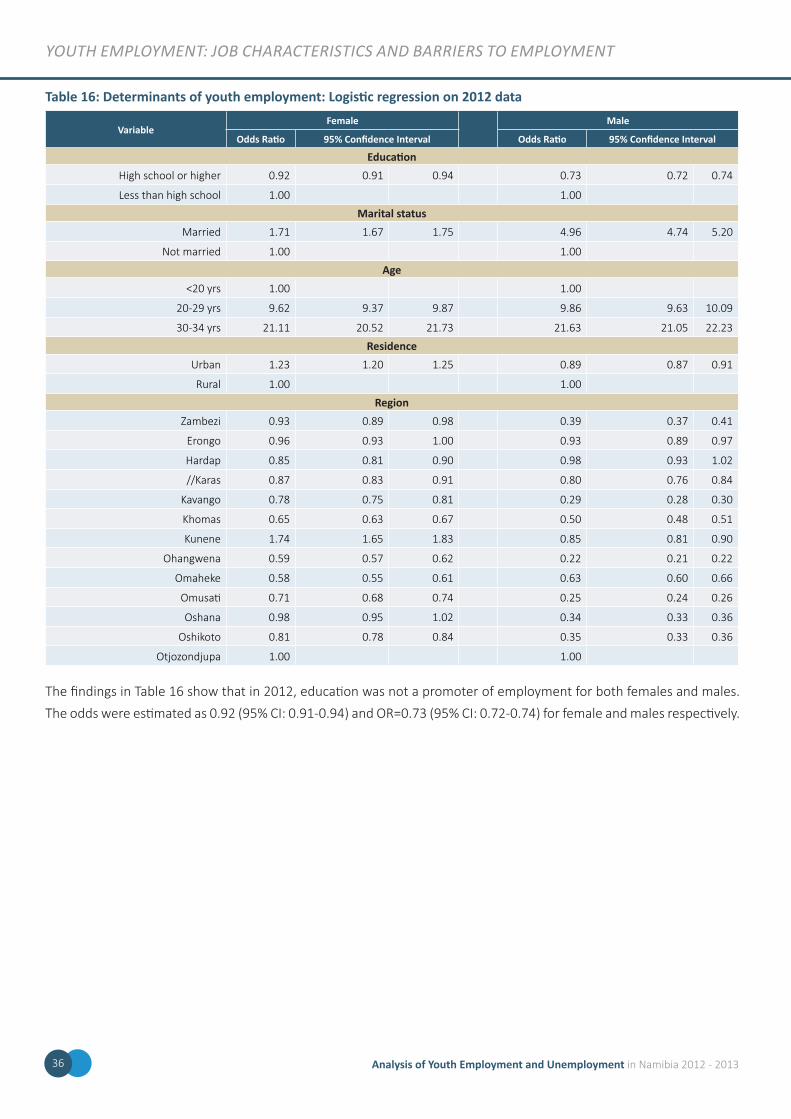
youtH EmPloymEnt: job cHaractEristics and barriErs to EmPloymEnt
Table 16: Determinants of youth employment: Logistic regression on 2012 data
VariableFemale Male
Odds Ratio 95% Confidence Interval Odds Ratio 95% Confidence Interval
EducationHigh school or higher 0.92 0.91 0.94 0.73 0.72 0.74
Less than high school 1.00 1.00
Marital statusMarried 1.71 1.67 1.75 4.96 4.74 5.20
Not married 1.00 1.00
Age<20 yrs 1.00 1.00
20-29 yrs 9.62 9.37 9.87 9.86 9.63 10.09
30-34 yrs 21.11 20.52 21.73 21.63 21.05 22.23
ResidenceUrban 1.23 1.20 1.25 0.89 0.87 0.91
Rural 1.00 1.00
RegionZambezi 0.93 0.89 0.98 0.39 0.37 0.41
Erongo 0.96 0.93 1.00 0.93 0.89 0.97
Hardap 0.85 0.81 0.90 0.98 0.93 1.02
//Karas 0.87 0.83 0.91 0.80 0.76 0.84
Kavango 0.78 0.75 0.81 0.29 0.28 0.30
Khomas 0.65 0.63 0.67 0.50 0.48 0.51
Kunene 1.74 1.65 1.83 0.85 0.81 0.90
Ohangwena 0.59 0.57 0.62 0.22 0.21 0.22
Omaheke 0.58 0.55 0.61 0.63 0.60 0.66
Omusati 0.71 0.68 0.74 0.25 0.24 0.26
Oshana 0.98 0.95 1.02 0.34 0.33 0.36
Oshikoto 0.81 0.78 0.84 0.35 0.33 0.36
Otjozondjupa 1.00 1.00
The findings in Table 16 show that in 2012, education was not a promoter of employment for both females and males.
The odds were estimated as 0.92 (95% CI: 0.91-0.94) and OR=0.73 (95% CI: 0.72-0.74) for female and males respectively.
Analysis of Youth Employment and Unemployment in Namibia 2012 - 201336
youtH EmPloymEnt: job cHaractEristics and barriErs to EmPloymEnt
3.2.3. Determinants of spell of length of employment
The spell of youth employment was analysed using ordinal regression model. Table 17 shows how different variables
affect the probability of being employed within a specific time period for 2013 for males and females. The odds of
employment increased with time. Most visible is the significant change in the gradient as the duration of employment
move from less than one year to being employed for 1 – 2 years and further being employed for 3 – 5 years and 6 – 10
years. The change is remarkably greater for females than males.
The spell of employment for youth with contracts of limited duration was much shorter, whereas those with permanent
contracts as expected was much longer. Similarly, employed married youth were more likely to stay in employment
much longer than those in other marital categories. The results for education are somewhat contradictory to what is
generally known of the effects of education. Youth with no education were more likely to remain in employment for
longer as compared to those with tertiary education. The odds for female with no education were three times than
those with higher education. A possible explanation could be that of job hopping with improvement in education. In
terms of industry, the spell of employment was longer for employed youth in the informal sector. This was similar to
residence, were the spell of employment was much longer if they stayed in urban areas.
Further, Table 17 shows that overall, for both males and females, earning do little to influence longer stay on the job,
particularly for those earning less than N$1000, or more generally below N$10,000 as opposed to those earning more
than N$10,000. Nevertheless, as earnings increase the chance of staying on the job increases, towards stability.
In most regions, except for Hardap and Oshikoto, male youth were likely to stay longer in employment. Female youth in
//Karas region were significantly more likely to stay longer in employment (Odds ratio [OR]=1.47; (95% CI: 1.37, 1.57).
Table 17 further shows that the spell of employment varied by age. The odds were lower in lower ages as compared to
those aged 30-34 years. However there were increasing changes in the magnitude of the OR with increasing age.
37Analysis of Youth Employment and Unemployment in Namibia 2012 - 2013
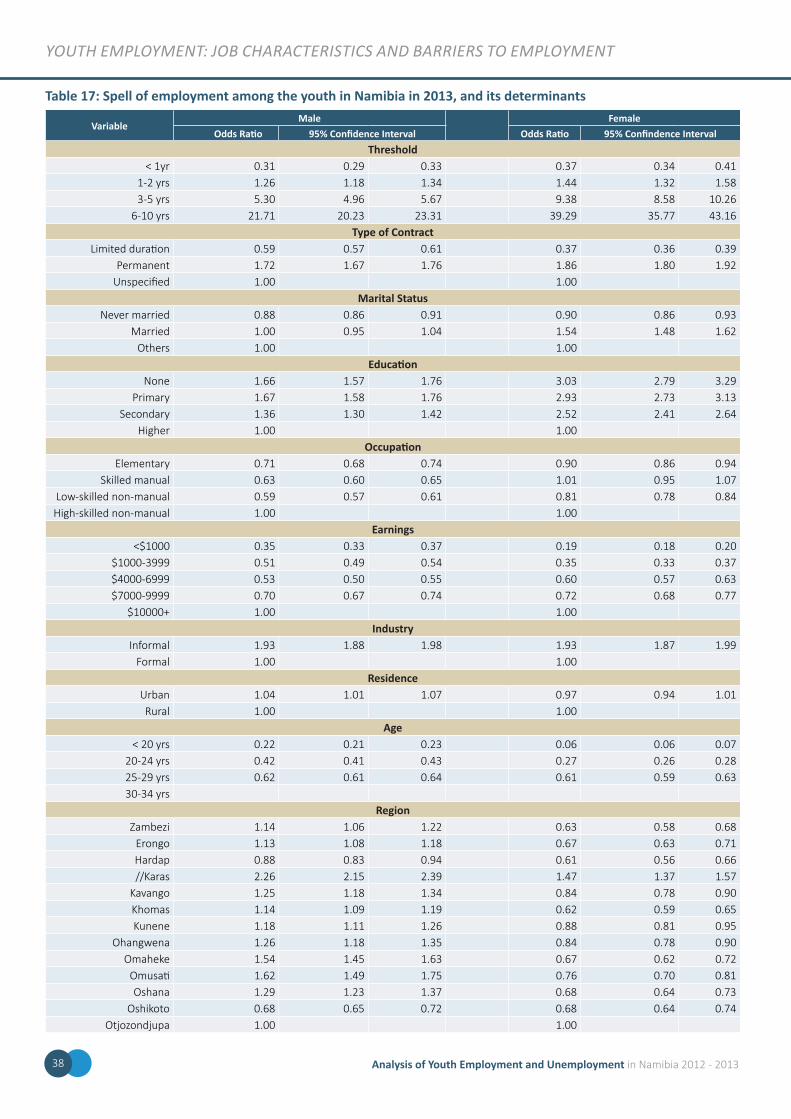
youtH EmPloymEnt: job cHaractEristics and barriErs to EmPloymEnt
Table 17: Spell of employment among the youth in Namibia in 2013, and its determinants
VariableMale Female
Odds Ratio 95% Confidence Interval Odds Ratio 95% Confindence IntervalThreshold
< 1yr 0.31 0.29 0.33 0.37 0.34 0.411-2 yrs 1.26 1.18 1.34 1.44 1.32 1.583-5 yrs 5.30 4.96 5.67 9.38 8.58 10.26
6-10 yrs 21.71 20.23 23.31 39.29 35.77 43.16Type of Contract
Limited duration 0.59 0.57 0.61 0.37 0.36 0.39Permanent 1.72 1.67 1.76 1.86 1.80 1.92
Unspecified 1.00 1.00Marital Status
Never married 0.88 0.86 0.91 0.90 0.86 0.93Married 1.00 0.95 1.04 1.54 1.48 1.62
Others 1.00 1.00Education
None 1.66 1.57 1.76 3.03 2.79 3.29Primary 1.67 1.58 1.76 2.93 2.73 3.13
Secondary 1.36 1.30 1.42 2.52 2.41 2.64Higher 1.00 1.00
OccupationElementary 0.71 0.68 0.74 0.90 0.86 0.94
Skilled manual 0.63 0.60 0.65 1.01 0.95 1.07Low-skilled non-manual 0.59 0.57 0.61 0.81 0.78 0.84High-skilled non-manual 1.00 1.00
Earnings<$1000 0.35 0.33 0.37 0.19 0.18 0.20
$1000-3999 0.51 0.49 0.54 0.35 0.33 0.37$4000-6999 0.53 0.50 0.55 0.60 0.57 0.63$7000-9999 0.70 0.67 0.74 0.72 0.68 0.77
$10000+ 1.00 1.00Industry
Informal 1.93 1.88 1.98 1.93 1.87 1.99Formal 1.00 1.00
ResidenceUrban 1.04 1.01 1.07 0.97 0.94 1.01Rural 1.00 1.00
Age< 20 yrs 0.22 0.21 0.23 0.06 0.06 0.07
20-24 yrs 0.42 0.41 0.43 0.27 0.26 0.2825-29 yrs 0.62 0.61 0.64 0.61 0.59 0.6330-34 yrs
RegionZambezi 1.14 1.06 1.22 0.63 0.58 0.68
Erongo 1.13 1.08 1.18 0.67 0.63 0.71Hardap 0.88 0.83 0.94 0.61 0.56 0.66//Karas 2.26 2.15 2.39 1.47 1.37 1.57
Kavango 1.25 1.18 1.34 0.84 0.78 0.90Khomas 1.14 1.09 1.19 0.62 0.59 0.65Kunene 1.18 1.11 1.26 0.88 0.81 0.95
Ohangwena 1.26 1.18 1.35 0.84 0.78 0.90Omaheke 1.54 1.45 1.63 0.67 0.62 0.72
Omusati 1.62 1.49 1.75 0.76 0.70 0.81Oshana 1.29 1.23 1.37 0.68 0.64 0.73
Oshikoto 0.68 0.65 0.72 0.68 0.64 0.74Otjozondjupa 1.00 1.00
Analysis of Youth Employment and Unemployment in Namibia 2012 - 201338
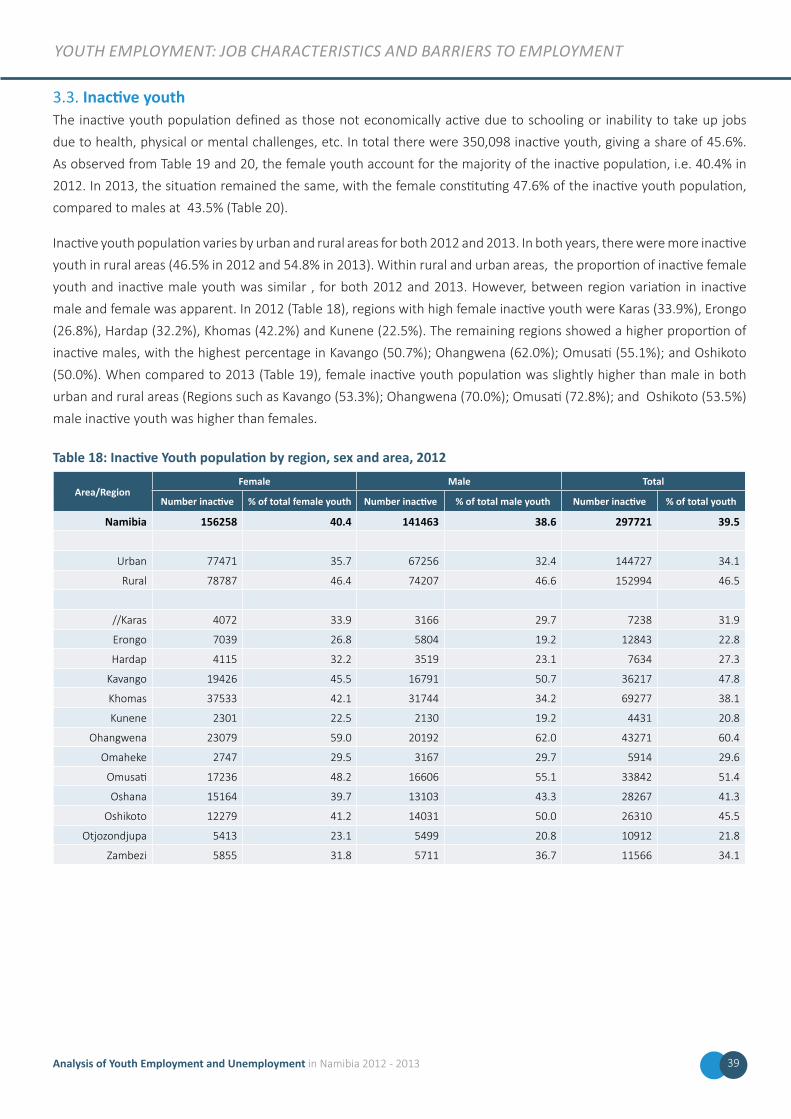
youtH EmPloymEnt: job cHaractEristics and barriErs to EmPloymEnt
3.3. Inactive youthThe inactive youth population defined as those not economically active due to schooling or inability to take up jobs
due to health, physical or mental challenges, etc. In total there were 350,098 inactive youth, giving a share of 45.6%.
As observed from Table 19 and 20, the female youth account for the majority of the inactive population, i.e. 40.4% in
2012. In 2013, the situation remained the same, with the female constituting 47.6% of the inactive youth population,
compared to males at 43.5% (Table 20).
Inactive youth population varies by urban and rural areas for both 2012 and 2013. In both years, there were more inactive
youth in rural areas (46.5% in 2012 and 54.8% in 2013). Within rural and urban areas, the proportion of inactive female
youth and inactive male youth was similar , for both 2012 and 2013. However, between region variation in inactive
male and female was apparent. In 2012 (Table 18), regions with high female inactive youth were Karas (33.9%), Erongo
(26.8%), Hardap (32.2%), Khomas (42.2%) and Kunene (22.5%). The remaining regions showed a higher proportion of
inactive males, with the highest percentage in Kavango (50.7%); Ohangwena (62.0%); Omusati (55.1%); and Oshikoto
(50.0%). When compared to 2013 (Table 19), female inactive youth population was slightly higher than male in both
urban and rural areas (Regions such as Kavango (53.3%); Ohangwena (70.0%); Omusati (72.8%); and Oshikoto (53.5%)
male inactive youth was higher than females.
Table 18: Inactive Youth population by region, sex and area, 2012
Area/RegionFemale Male Total
Number inactive % of total female youth Number inactive % of total male youth Number inactive % of total youth
Namibia 156258 40.4 141463 38.6 297721 39.5
Urban 77471 35.7 67256 32.4 144727 34.1
Rural 78787 46.4 74207 46.6 152994 46.5
//Karas 4072 33.9 3166 29.7 7238 31.9
Erongo 7039 26.8 5804 19.2 12843 22.8
Hardap 4115 32.2 3519 23.1 7634 27.3
Kavango 19426 45.5 16791 50.7 36217 47.8
Khomas 37533 42.1 31744 34.2 69277 38.1
Kunene 2301 22.5 2130 19.2 4431 20.8
Ohangwena 23079 59.0 20192 62.0 43271 60.4
Omaheke 2747 29.5 3167 29.7 5914 29.6
Omusati 17236 48.2 16606 55.1 33842 51.4
Oshana 15164 39.7 13103 43.3 28267 41.3
Oshikoto 12279 41.2 14031 50.0 26310 45.5
Otjozondjupa 5413 23.1 5499 20.8 10912 21.8
Zambezi 5855 31.8 5711 36.7 11566 34.1
39Analysis of Youth Employment and Unemployment in Namibia 2012 - 2013
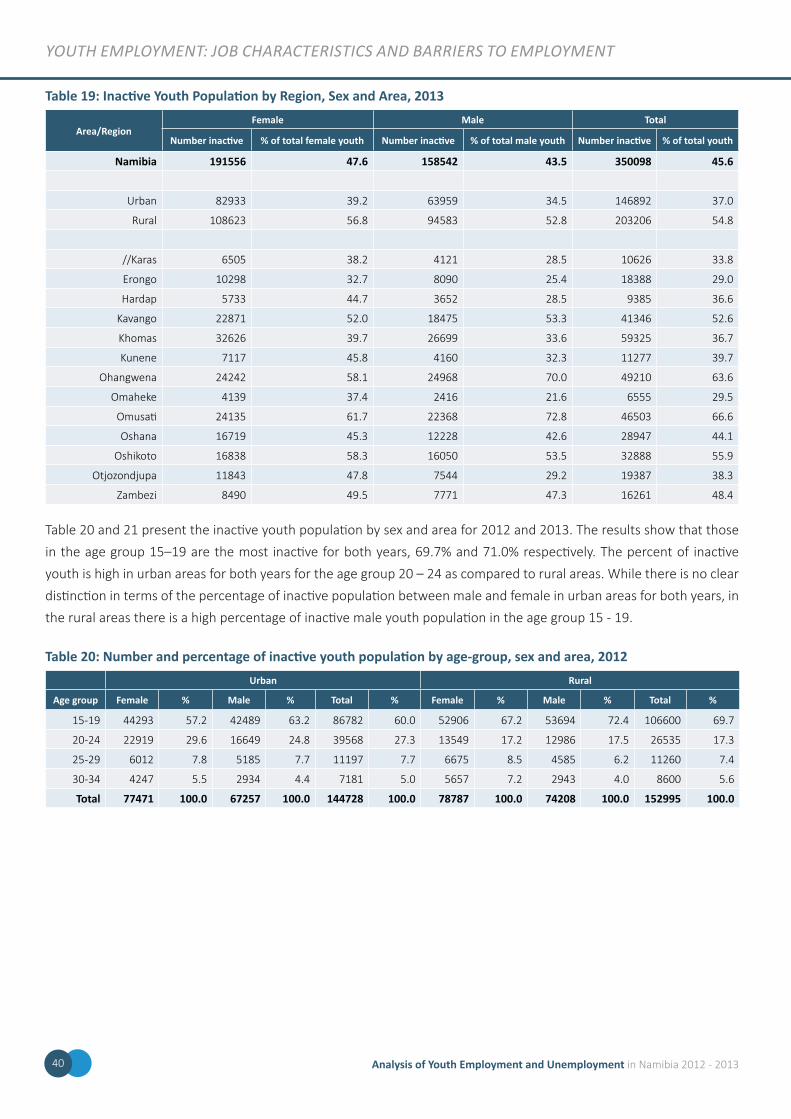
youtH EmPloymEnt: job cHaractEristics and barriErs to EmPloymEnt
Table 19: Inactive Youth Population by Region, Sex and Area, 2013
Area/RegionFemale Male Total
Number inactive % of total female youth Number inactive % of total male youth Number inactive % of total youth
Namibia 191556 47.6 158542 43.5 350098 45.6
Urban 82933 39.2 63959 34.5 146892 37.0
Rural 108623 56.8 94583 52.8 203206 54.8
//Karas 6505 38.2 4121 28.5 10626 33.8
Erongo 10298 32.7 8090 25.4 18388 29.0
Hardap 5733 44.7 3652 28.5 9385 36.6
Kavango 22871 52.0 18475 53.3 41346 52.6
Khomas 32626 39.7 26699 33.6 59325 36.7
Kunene 7117 45.8 4160 32.3 11277 39.7
Ohangwena 24242 58.1 24968 70.0 49210 63.6
Omaheke 4139 37.4 2416 21.6 6555 29.5
Omusati 24135 61.7 22368 72.8 46503 66.6
Oshana 16719 45.3 12228 42.6 28947 44.1
Oshikoto 16838 58.3 16050 53.5 32888 55.9
Otjozondjupa 11843 47.8 7544 29.2 19387 38.3
Zambezi 8490 49.5 7771 47.3 16261 48.4
Table 20 and 21 present the inactive youth population by sex and area for 2012 and 2013. The results show that those
in the age group 15–19 are the most inactive for both years, 69.7% and 71.0% respectively. The percent of inactive
youth is high in urban areas for both years for the age group 20 – 24 as compared to rural areas. While there is no clear
distinction in terms of the percentage of inactive population between male and female in urban areas for both years, in
the rural areas there is a high percentage of inactive male youth population in the age group 15 - 19.
Table 20: Number and percentage of inactive youth population by age-group, sex and area, 2012Urban Rural
Age group Female % Male % Total % Female % Male % Total %
15-19 44293 57.2 42489 63.2 86782 60.0 52906 67.2 53694 72.4 106600 69.7
20-24 22919 29.6 16649 24.8 39568 27.3 13549 17.2 12986 17.5 26535 17.3
25-29 6012 7.8 5185 7.7 11197 7.7 6675 8.5 4585 6.2 11260 7.4
30-34 4247 5.5 2934 4.4 7181 5.0 5657 7.2 2943 4.0 8600 5.6
Total 77471 100.0 67257 100.0 144728 100.0 78787 100.0 74208 100.0 152995 100.0
Analysis of Youth Employment and Unemployment in Namibia 2012 - 201340
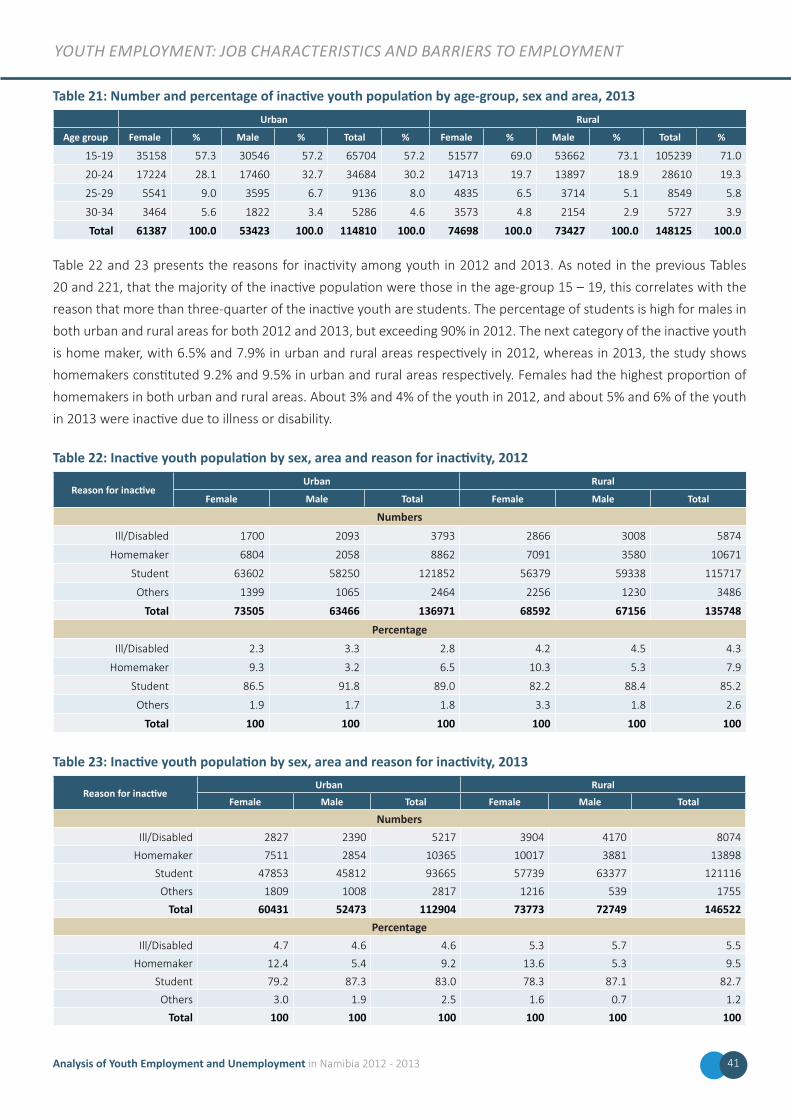
youtH EmPloymEnt: job cHaractEristics and barriErs to EmPloymEnt
Table 21: Number and percentage of inactive youth population by age-group, sex and area, 2013Urban Rural
Age group Female % Male % Total % Female % Male % Total %
15-19 35158 57.3 30546 57.2 65704 57.2 51577 69.0 53662 73.1 105239 71.0
20-24 17224 28.1 17460 32.7 34684 30.2 14713 19.7 13897 18.9 28610 19.3
25-29 5541 9.0 3595 6.7 9136 8.0 4835 6.5 3714 5.1 8549 5.8
30-34 3464 5.6 1822 3.4 5286 4.6 3573 4.8 2154 2.9 5727 3.9
Total 61387 100.0 53423 100.0 114810 100.0 74698 100.0 73427 100.0 148125 100.0
Table 22 and 23 presents the reasons for inactivity among youth in 2012 and 2013. As noted in the previous Tables
20 and 221, that the majority of the inactive population were those in the age-group 15 – 19, this correlates with the
reason that more than three-quarter of the inactive youth are students. The percentage of students is high for males in
both urban and rural areas for both 2012 and 2013, but exceeding 90% in 2012. The next category of the inactive youth
is home maker, with 6.5% and 7.9% in urban and rural areas respectively in 2012, whereas in 2013, the study shows
homemakers constituted 9.2% and 9.5% in urban and rural areas respectively. Females had the highest proportion of
homemakers in both urban and rural areas. About 3% and 4% of the youth in 2012, and about 5% and 6% of the youth
in 2013 were inactive due to illness or disability.
Table 22: Inactive youth population by sex, area and reason for inactivity, 2012
Reason for inactiveUrban Rural
Female Male Total Female Male Total
NumbersIll/Disabled 1700 2093 3793 2866 3008 5874
Homemaker 6804 2058 8862 7091 3580 10671
Student 63602 58250 121852 56379 59338 115717
Others 1399 1065 2464 2256 1230 3486
Total 73505 63466 136971 68592 67156 135748Percentage
Ill/Disabled 2.3 3.3 2.8 4.2 4.5 4.3
Homemaker 9.3 3.2 6.5 10.3 5.3 7.9
Student 86.5 91.8 89.0 82.2 88.4 85.2
Others 1.9 1.7 1.8 3.3 1.8 2.6
Total 100 100 100 100 100 100
Table 23: Inactive youth population by sex, area and reason for inactivity, 2013
Reason for inactiveUrban Rural
Female Male Total Female Male Total
NumbersIll/Disabled 2827 2390 5217 3904 4170 8074
Homemaker 7511 2854 10365 10017 3881 13898
Student 47853 45812 93665 57739 63377 121116
Others 1809 1008 2817 1216 539 1755
Total 60431 52473 112904 73773 72749 146522Percentage
Ill/Disabled 4.7 4.6 4.6 5.3 5.7 5.5
Homemaker 12.4 5.4 9.2 13.6 5.3 9.5
Student 79.2 87.3 83.0 78.3 87.1 82.7
Others 3.0 1.9 2.5 1.6 0.7 1.2
Total 100 100 100 100 100 100
41Analysis of Youth Employment and Unemployment in Namibia 2012 - 2013
CHAPTER 4: YOUTH UNEMPLOYMENT: DETERMINANTS AND DISPARITIES
4.1. IntroductionUnemployment rate is the percentage of labor force that is currently unemployed but was available for job in the last
four weeks. It is the ratio of the number of unemployed people to the sum of the number of employed and unemployed
people.
Youth Unemployment rate use in this report as per the broad definition is calculated as follows:
Unemployment Rate =Unemployed Youth
X 100Labour Force (Employed Youth + Unemployed Youth)
Young people entering the labour market are generally considered a population at risk, with high turnover rate between
jobs and increased risk of entry unemployment. In Namibia, there is a stubborn and frustratingly persistent youth
unemployment of about 37.8% and 41.7% in 2012 and in 2013 respectively. The prevailing youth-adult unemployment/
employment gap has not been investigated. In some areas, this has been attributed to low search skills and low
experience (ILO, 2015). Surprisingly little is known on the youth, its gender and geographical disparities remain to be
explored. This chapter examines determinants and disparities in youth unemployment in Namibia for the years 2012
and 2013, and for female and male separately.
4.2. Unemployment indicatorsWe used seven indicators for unemployment were analyzed based on various literature (Oosthuizen and Cassim, 2014;
Ortiz and Cummins, 2012; ILO, 2012; ILO, 2011; ILO, 2015; Higgins, 2001; Garcia, 2011). First, the unemployment occurrence, which is measured as a three categorical variable which takes the value of 1 if employed, 2 if unemployed
(using the broad definition), and 3 if inactive. Second, unemployment duration which is a six-level ordinal outcome
that captures the length of unemployment spell: <1 month, 1-3 months, 3-6 months, 6-12 months, 12-24 months, and
24 months or more. Third, related to the unemployment duration, is long-term unemployment, which is described as
unemployment spell of more than 6 months (coded as 1 and 0 otherwise). Fourth, re- unemployment (first or repeat), which takes the value of 1 if a worker was unemployed and has been unemployed in the last 12 months (first) or
employed in the last 12 months (repeat), and 0 otherwise. The first unemployment applies mainly for those in transition
between school and work.
To capture the combined effects of these unemployment indicators, we constructed an unemployment index, as a fifth
indicator. To do so we first standardized the individual unemployment indicators to have a mean of zero and variance
of 1. We then used principal component analysis to generate a factor score, which was then categorized into two
groups. The index indicates the extent to which a worker is unemployed, and a value of 1 can be interpreted as severe
or frequent spells of unemployment, while a value of 0 suggest shorter spells or first spell of unemployment. Long-term
unemployment and repeat unemployment are describe to have a scarring effect on the worker and may discourage the
worker from actively searching for work.
Next, as a sixth indicator, we consider time-related under-employment measured as the number of actual hours of work.
In the Namibia context, this is defined as 1 if actual hours worked is less than 35, or zero otherwise. Lastly, we evaluate
factors and disparities associated with being NEET (as a seventh response variable that capture youth unemployment).
42 Analysis of Youth Employment and Unemployment in Namibia 2012 - 2013
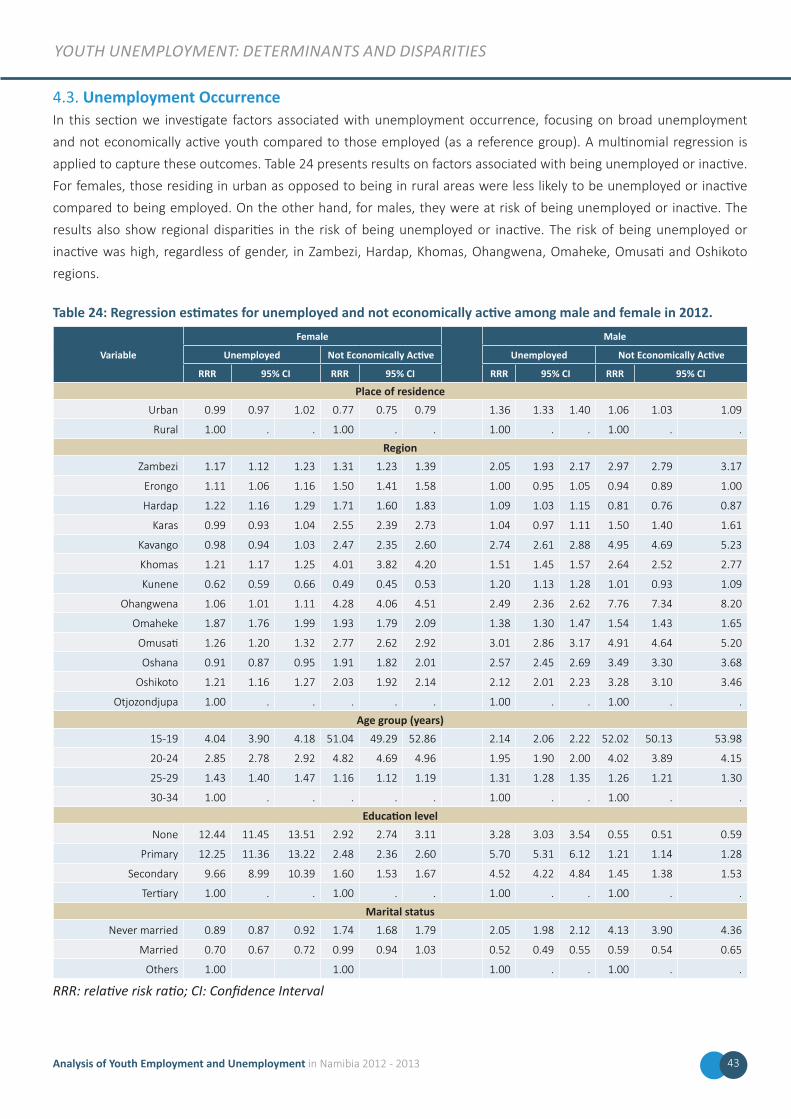
youtH unEmPloymEnt: dEtErminants and disParitiEs
4.3. Unemployment OccurrenceIn this section we investigate factors associated with unemployment occurrence, focusing on broad unemployment
and not economically active youth compared to those employed (as a reference group). A multinomial regression is
applied to capture these outcomes. Table 24 presents results on factors associated with being unemployed or inactive.
For females, those residing in urban as opposed to being in rural areas were less likely to be unemployed or inactive
compared to being employed. On the other hand, for males, they were at risk of being unemployed or inactive. The
results also show regional disparities in the risk of being unemployed or inactive. The risk of being unemployed or
inactive was high, regardless of gender, in Zambezi, Hardap, Khomas, Ohangwena, Omaheke, Omusati and Oshikoto
regions.
Table 24: Regression estimates for unemployed and not economically active among male and female in 2012.
Variable
Female Male
Unemployed Not Economically Active Unemployed Not Economically Active
RRR 95% CI RRR 95% CI RRR 95% CI RRR 95% CI
Place of residenceUrban 0.99 0.97 1.02 0.77 0.75 0.79 1.36 1.33 1.40 1.06 1.03 1.09
Rural 1.00 . . 1.00 . . 1.00 . . 1.00 . .
RegionZambezi 1.17 1.12 1.23 1.31 1.23 1.39 2.05 1.93 2.17 2.97 2.79 3.17
Erongo 1.11 1.06 1.16 1.50 1.41 1.58 1.00 0.95 1.05 0.94 0.89 1.00
Hardap 1.22 1.16 1.29 1.71 1.60 1.83 1.09 1.03 1.15 0.81 0.76 0.87
Karas 0.99 0.93 1.04 2.55 2.39 2.73 1.04 0.97 1.11 1.50 1.40 1.61
Kavango 0.98 0.94 1.03 2.47 2.35 2.60 2.74 2.61 2.88 4.95 4.69 5.23
Khomas 1.21 1.17 1.25 4.01 3.82 4.20 1.51 1.45 1.57 2.64 2.52 2.77
Kunene 0.62 0.59 0.66 0.49 0.45 0.53 1.20 1.13 1.28 1.01 0.93 1.09
Ohangwena 1.06 1.01 1.11 4.28 4.06 4.51 2.49 2.36 2.62 7.76 7.34 8.20
Omaheke 1.87 1.76 1.99 1.93 1.79 2.09 1.38 1.30 1.47 1.54 1.43 1.65
Omusati 1.26 1.20 1.32 2.77 2.62 2.92 3.01 2.86 3.17 4.91 4.64 5.20
Oshana 0.91 0.87 0.95 1.91 1.82 2.01 2.57 2.45 2.69 3.49 3.30 3.68
Oshikoto 1.21 1.16 1.27 2.03 1.92 2.14 2.12 2.01 2.23 3.28 3.10 3.46
Otjozondjupa 1.00 . . . . . 1.00 . . 1.00 . .
Age group (years)15-19 4.04 3.90 4.18 51.04 49.29 52.86 2.14 2.06 2.22 52.02 50.13 53.98
20-24 2.85 2.78 2.92 4.82 4.69 4.96 1.95 1.90 2.00 4.02 3.89 4.15
25-29 1.43 1.40 1.47 1.16 1.12 1.19 1.31 1.28 1.35 1.26 1.21 1.30
30-34 1.00 . . . . . 1.00 . . 1.00 . .
Education levelNone 12.44 11.45 13.51 2.92 2.74 3.11 3.28 3.03 3.54 0.55 0.51 0.59
Primary 12.25 11.36 13.22 2.48 2.36 2.60 5.70 5.31 6.12 1.21 1.14 1.28
Secondary 9.66 8.99 10.39 1.60 1.53 1.67 4.52 4.22 4.84 1.45 1.38 1.53
Tertiary 1.00 . . 1.00 . . 1.00 . . 1.00 . .
Marital statusNever married 0.89 0.87 0.92 1.74 1.68 1.79 2.05 1.98 2.12 4.13 3.90 4.36
Married 0.70 0.67 0.72 0.99 0.94 1.03 0.52 0.49 0.55 0.59 0.54 0.65
Others 1.00 1.00 1.00 . . 1.00 . .
RRR: relative risk ratio; CI: Confidence Interval
43Analysis of Youth Employment and Unemployment in Namibia 2012 - 2013
youtH unEmPloymEnt: dEtErminants and disParitiEs
In other regions such as Erongo, the risk of being unemployed was high for females compared to those in Otjozondjupa,
but lower risk of inactivity was observed among males in the same region. On the other hand, for Oshana the probability
of being unemployed was much lower for females and higher for males, but for inactivity, we find that the probability
was higher for both sexes, when compared with individuals from Otjozondjupa region. Furthermore, //Karas region only
showed significant association with inactivity for both male and female, while in Kunene females were at a lower risk for
both unemployment and inactivity.
The risk of unemployment and inactivity was relatively high in the younger years for both females and males and reduced
with increasing age. For inactivity in particular, be it female or male, the risk was at least 50 times higher in the 15-19
years age group compared to those aged 30 to 34 years. A similar pattern was observed when one compares across
education level, such that the risk was more elevated for those without or with primary education compared to those
with tertiary education. And this was particularly true for females as opposed to males. In fact for males, in Table 24
we observe that the chance of inactivity was lower for those with no formal education relative to those with tertiary
education. With regards to marital status, findings indicate that being in married reduced the risk of unemployment or
inactivity for both females and males, although this effect is marginal for females reporting inactivity. For never married
women, the risk is lower for unemployment, but increased for inactivity, whereas for males, the risk was higher in both
unemployed and inactive among the never married.
Table 25 presents summaries of regression estimates for the unemployed or inactive youth in 2013 using the LFS in
Namibia. With regards to place of residence, the results are similar to those for the 2012 survey, in which females were
at a reduced risk of unemployment or economic inactivity in urban areas compared to those females in rural areas, but
were elevated for males, in urban areas than those in rural areas, for both unemployment and inactivity. These findings,
however, differed by region. Females were less likely to be unemployed or inactive in Zambezi, Erongo, //Karas (for
unemployment only), Omaheke as well as Omusati and Oshikoto (both for unemployment only) than their counterparts
in Otjozondjupa. On the other hand, males were predominantly at a higher risk of unemployment or economic inactivity
in most regions. The exceptions are Hardap (for inactivity only), and Omaheke regions.
Similar to the 2012 results, young age was associated with high risk of unemployment or inactivity, and this risk reduced
with increased age. For females, for instance the risk of unemployment was about 6 times, while inactivity was 97
times higher for the 15-19 years compared to those in age group 30-34 years. As for males, the risk of unemployment
and inactivity was 4 times and 107 times higher in the 15-19 years group as opposed to the 30-34 years. Being less
educated also increased the chance of unemployment and economic inactivity for females (with exception of those
with secondary education under economic inactivity), but for males, this pattern was manifested in the unemployment
group. The probability of being inactivity was much lower at all levels of education against being in the tertiary among
males. Turning to marital status, the relationship between unemployment and being married was that those married
were less likely to be unemployed or inactive for both females and males. Unmarried males were at an increased risk of
being unemployed or inactive, nevertheless, this was reversed for the never married females, whose risk of unemployed
was lower.
Analysis of Youth Employment and Unemployment in Namibia 2012 - 201344
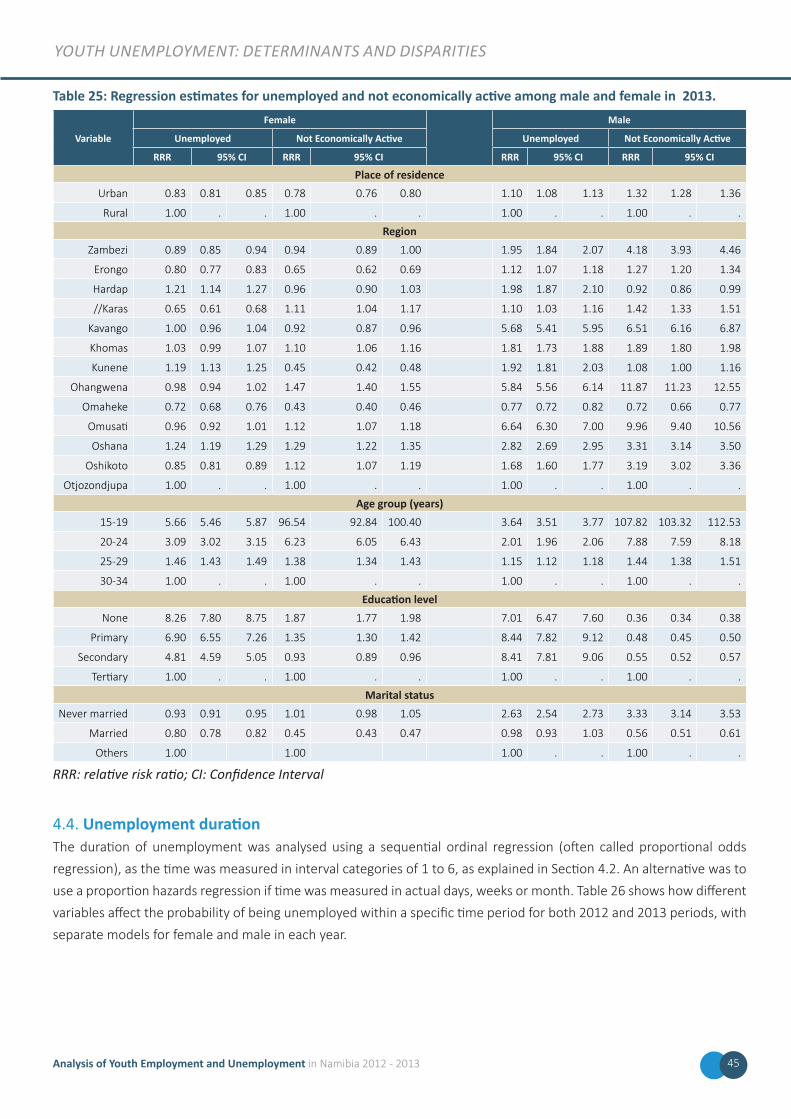
youtH unEmPloymEnt: dEtErminants and disParitiEs
Table 25: Regression estimates for unemployed and not economically active among male and female in 2013.
Variable
Female Male
Unemployed Not Economically Active Unemployed Not Economically Active
RRR 95% CI RRR 95% CI RRR 95% CI RRR 95% CI
Place of residenceUrban 0.83 0.81 0.85 0.78 0.76 0.80 1.10 1.08 1.13 1.32 1.28 1.36
Rural 1.00 . . 1.00 . . 1.00 . . 1.00 . .
RegionZambezi 0.89 0.85 0.94 0.94 0.89 1.00 1.95 1.84 2.07 4.18 3.93 4.46
Erongo 0.80 0.77 0.83 0.65 0.62 0.69 1.12 1.07 1.18 1.27 1.20 1.34
Hardap 1.21 1.14 1.27 0.96 0.90 1.03 1.98 1.87 2.10 0.92 0.86 0.99
//Karas 0.65 0.61 0.68 1.11 1.04 1.17 1.10 1.03 1.16 1.42 1.33 1.51
Kavango 1.00 0.96 1.04 0.92 0.87 0.96 5.68 5.41 5.95 6.51 6.16 6.87
Khomas 1.03 0.99 1.07 1.10 1.06 1.16 1.81 1.73 1.88 1.89 1.80 1.98
Kunene 1.19 1.13 1.25 0.45 0.42 0.48 1.92 1.81 2.03 1.08 1.00 1.16
Ohangwena 0.98 0.94 1.02 1.47 1.40 1.55 5.84 5.56 6.14 11.87 11.23 12.55
Omaheke 0.72 0.68 0.76 0.43 0.40 0.46 0.77 0.72 0.82 0.72 0.66 0.77
Omusati 0.96 0.92 1.01 1.12 1.07 1.18 6.64 6.30 7.00 9.96 9.40 10.56
Oshana 1.24 1.19 1.29 1.29 1.22 1.35 2.82 2.69 2.95 3.31 3.14 3.50
Oshikoto 0.85 0.81 0.89 1.12 1.07 1.19 1.68 1.60 1.77 3.19 3.02 3.36
Otjozondjupa 1.00 . . 1.00 . . 1.00 . . 1.00 . .
Age group (years)15-19 5.66 5.46 5.87 96.54 92.84 100.40 3.64 3.51 3.77 107.82 103.32 112.53
20-24 3.09 3.02 3.15 6.23 6.05 6.43 2.01 1.96 2.06 7.88 7.59 8.18
25-29 1.46 1.43 1.49 1.38 1.34 1.43 1.15 1.12 1.18 1.44 1.38 1.51
30-34 1.00 . . 1.00 . . 1.00 . . 1.00 . .
Education levelNone 8.26 7.80 8.75 1.87 1.77 1.98 7.01 6.47 7.60 0.36 0.34 0.38
Primary 6.90 6.55 7.26 1.35 1.30 1.42 8.44 7.82 9.12 0.48 0.45 0.50
Secondary 4.81 4.59 5.05 0.93 0.89 0.96 8.41 7.81 9.06 0.55 0.52 0.57
Tertiary 1.00 . . 1.00 . . 1.00 . . 1.00 . .
Marital statusNever married 0.93 0.91 0.95 1.01 0.98 1.05 2.63 2.54 2.73 3.33 3.14 3.53
Married 0.80 0.78 0.82 0.45 0.43 0.47 0.98 0.93 1.03 0.56 0.51 0.61
Others 1.00 1.00 1.00 . . 1.00 . .
RRR: relative risk ratio; CI: Confidence Interval
4.4. Unemployment duration The duration of unemployment was analysed using a sequential ordinal regression (often called proportional odds
regression), as the time was measured in interval categories of 1 to 6, as explained in Section 4.2. An alternative was to
use a proportion hazards regression if time was measured in actual days, weeks or month. Table 26 shows how different
variables affect the probability of being unemployed within a specific time period for both 2012 and 2013 periods, with
separate models for female and male in each year.
45Analysis of Youth Employment and Unemployment in Namibia 2012 - 2013
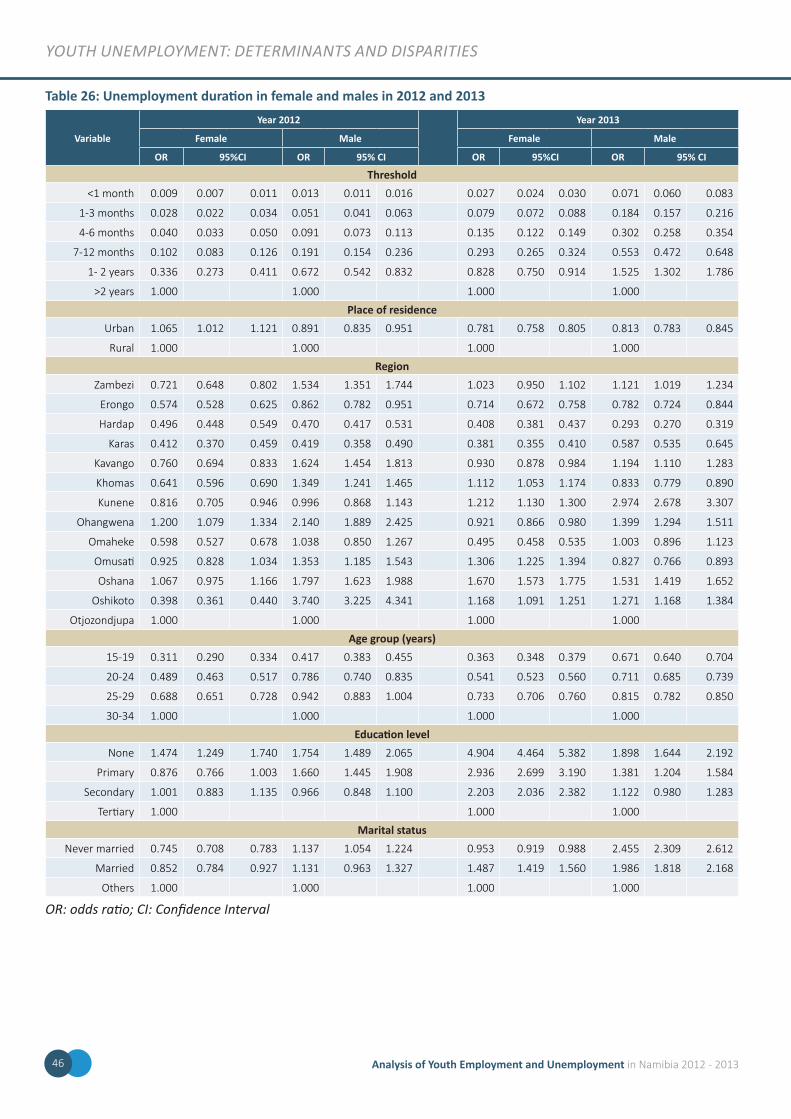
youtH unEmPloymEnt: dEtErminants and disParitiEs
Table 26: Unemployment duration in female and males in 2012 and 2013
Variable
Year 2012 Year 2013
Female Male Female Male
OR 95%CI OR 95% CI OR 95%CI OR 95% CI
Threshold<1 month 0.009 0.007 0.011 0.013 0.011 0.016 0.027 0.024 0.030 0.071 0.060 0.083
1-3 months 0.028 0.022 0.034 0.051 0.041 0.063 0.079 0.072 0.088 0.184 0.157 0.216
4-6 months 0.040 0.033 0.050 0.091 0.073 0.113 0.135 0.122 0.149 0.302 0.258 0.354
7-12 months 0.102 0.083 0.126 0.191 0.154 0.236 0.293 0.265 0.324 0.553 0.472 0.648
1- 2 years 0.336 0.273 0.411 0.672 0.542 0.832 0.828 0.750 0.914 1.525 1.302 1.786
>2 years 1.000 1.000 1.000 1.000
Place of residenceUrban 1.065 1.012 1.121 0.891 0.835 0.951 0.781 0.758 0.805 0.813 0.783 0.845
Rural 1.000 1.000 1.000 1.000
RegionZambezi 0.721 0.648 0.802 1.534 1.351 1.744 1.023 0.950 1.102 1.121 1.019 1.234
Erongo 0.574 0.528 0.625 0.862 0.782 0.951 0.714 0.672 0.758 0.782 0.724 0.844
Hardap 0.496 0.448 0.549 0.470 0.417 0.531 0.408 0.381 0.437 0.293 0.270 0.319
Karas 0.412 0.370 0.459 0.419 0.358 0.490 0.381 0.355 0.410 0.587 0.535 0.645
Kavango 0.760 0.694 0.833 1.624 1.454 1.813 0.930 0.878 0.984 1.194 1.110 1.283
Khomas 0.641 0.596 0.690 1.349 1.241 1.465 1.112 1.053 1.174 0.833 0.779 0.890
Kunene 0.816 0.705 0.946 0.996 0.868 1.143 1.212 1.130 1.300 2.974 2.678 3.307
Ohangwena 1.200 1.079 1.334 2.140 1.889 2.425 0.921 0.866 0.980 1.399 1.294 1.511
Omaheke 0.598 0.527 0.678 1.038 0.850 1.267 0.495 0.458 0.535 1.003 0.896 1.123
Omusati 0.925 0.828 1.034 1.353 1.185 1.543 1.306 1.225 1.394 0.827 0.766 0.893
Oshana 1.067 0.975 1.166 1.797 1.623 1.988 1.670 1.573 1.775 1.531 1.419 1.652
Oshikoto 0.398 0.361 0.440 3.740 3.225 4.341 1.168 1.091 1.251 1.271 1.168 1.384
Otjozondjupa 1.000 1.000 1.000 1.000
Age group (years)15-19 0.311 0.290 0.334 0.417 0.383 0.455 0.363 0.348 0.379 0.671 0.640 0.704
20-24 0.489 0.463 0.517 0.786 0.740 0.835 0.541 0.523 0.560 0.711 0.685 0.739
25-29 0.688 0.651 0.728 0.942 0.883 1.004 0.733 0.706 0.760 0.815 0.782 0.850
30-34 1.000 1.000 1.000 1.000
Education levelNone 1.474 1.249 1.740 1.754 1.489 2.065 4.904 4.464 5.382 1.898 1.644 2.192
Primary 0.876 0.766 1.003 1.660 1.445 1.908 2.936 2.699 3.190 1.381 1.204 1.584
Secondary 1.001 0.883 1.135 0.966 0.848 1.100 2.203 2.036 2.382 1.122 0.980 1.283
Tertiary 1.000 1.000 1.000
Marital statusNever married 0.745 0.708 0.783 1.137 1.054 1.224 0.953 0.919 0.988 2.455 2.309 2.612
Married 0.852 0.784 0.927 1.131 0.963 1.327 1.487 1.419 1.560 1.986 1.818 2.168
Others 1.000 1.000 1.000 1.000
OR: odds ratio; CI: Confidence Interval
Analysis of Youth Employment and Unemployment in Namibia 2012 - 201346
youtH unEmPloymEnt: dEtErminants and disParitiEs
In the Table 26, the odds of unemployment increased, as expected, with duration (based on the threshold values), but
overall remained below OR=1.00 in 2012, but rise above OR=1.00 in 2013 for males only. What is particularly notable is
the increase in the odds as duration of unemployment moves from less than 1 month to the second level (1-3 moths)
and further to the third step (4-6 months). For both female and male in 2012 and 2013, the odds changed by at least
160%, as one moves from period 1 to 2, but this was receded to below 80% for all groups as they move from period 2 to
three. The likelihood of staying unemployed for all groups for a period of 1 year to 2 years increased by 230% and 250%
in 2012 for female and males respectively, while in 2013, the change was estimated at 183% and 176% for females and
males respectively.
Most variables affect the duration of unemployment in a similar way. Females that reside in urban areas compared to
those in rural areas, for the year 2012, were more likely to stay longer. The spell of unemployment, however, was shorter
for males in 2012 and for both females and males in 2013, if they stay in urban areas as opposed to rural areas. In most
regions, females sampled in 2012 were more likely to have a shorter duration of unemployment of 24 months or less.
The only region where they were more likely to stay longer than 24 months was in Ohangwena (OR=1.20, 95% CI: 1.08,
1.33) and Oshana (though not significant at 5%). For males in the same survey year, 2012, tends to have longer spells
of unemployment in 8 regions (Zambezi, Kavango, Khomas, Ohangwena, Omaheke, Omusati, Oshana, and Oshikoto)
compared to their counterparts in Otjozondjupa. Shorter spells of unemployment among males was estimated in
Erongo, Hardap, //Karas, and Kunene (but was not significant). In 2013, females were more likely to have shorter spells
in Erongo, Hadarp, Karas, Kavango, Ohangwena and Omaheke (Table 27), but longer in other regions. For males, shorter
spells were obtained in the following regions: Erongo, Hardap, //Karas, Khomas and Omusati.
Table 26 further shows that the duration of unemployment also varied by age of the respondent, but the odds was lower
in all age groups of less than 30 years compared to those aged 30-34 years, for both 2012 and 2013. In other words,
age was not much of a risk factor to duration of unemployment. With regards to education, the risk of longer spells of
unemployment was more established for those with no education or lower levels of education for both females and
males. In 2013, the odds for females were much higher, with those with no education, estimated to have odds of about
5 times of staying unemployed longer than those with tertiary education, while men in the same year and category were
about 2 times more likely to have longer spells of unemployment. Being married or never married compared to other
forms of marital status produced varied results. For females in 2012, for instance, they were associated with shorter
spells of unemployment for both never married and married, but for males, the probability was higher for both groups
but slightly higher for the never married. For 2013, the pattern is the same for males. However among females, the
never married showed a strong likelihood of being unemployed for a shorter period, on the other hand the married
were more likely to stay longer. A possible explanation among females is that the married might be supported by their
spouses.
47Analysis of Youth Employment and Unemployment in Namibia 2012 - 2013
youtH unEmPloymEnt: dEtErminants and disParitiEs
4.5. Long-term unemployment among youthLong-term unemployment may bring discouragement to the job-seekers. Long term unemployment refers to being
without a job for 6 months or more. Table 27 examines variables that jointly affect long-term unemployment. Regressions
are estimated separately for female and male, for each year and odds ratios are presented. In 2012, the probability of
long term unemployment was high in urban areas (though not significant), but was lower in 2013 for both female and
male. Results also indicate that females were more likely to stay unemployed for more than 6 months in all regions except
in Khomas (OR=0.75, 95% CI: 0.67-0.84) for the 2012 period. When compared to results in Table 26, one can interpret
these finding to mean that females are staying unemployed for periods of more than 6 months but less than 24 months.
Considering the thresholds in Table 26, it can be argued further that the chance of being employed increases within
the first 1 year of being unemployed. Turning to males in the same year, the likelihood of longer unemployment was
much lower in most regions, except for those in Erongo (OR=1.21), Ohangwena (OR=1.53), Omusati (OR=2.29), Oshana
(OR=1.78), and Oshikoto (OR=1.80). For the year 2013, the pattern is reversed. The odds of longer unemployment is
reduced for females in all regions except in Khomas (though not statistically significant), Kunene and Oshana. For males,
most regions were associated with increased odds of long-term unemployment, with exception of Karas and Omaheke.
Long-term unemployment increased with age in a non-linear way, with females in 2012 across all age groups at lower
probability of long-term unemployment. Education level was strongly associated with long-term unemployment, with
the odds of long-term unemployment, diminishing as education level increases, regardless of sex in 2012. This result
is not surprising since high education may lead to more opportunities. In 2013, on the other hand, across all education
levels and for both female and male, the chance of long term-unemployment was quite high relative to those obtained
in 2012. For females, for instance this was 7 times higher for those without any formal education compared to those with
tertiary education and 11 times higher for men without formal education as opposed to those with tertiary education. In
general the pattern remains as in 2012, in that the odds of long-term unemployment diminished with increase education
levels. With regards to marital status, the results confirm what was obtained in Table 27, married men were more likely
to stay longer than 6 months in unemployment.
Analysis of Youth Employment and Unemployment in Namibia 2012 - 201348
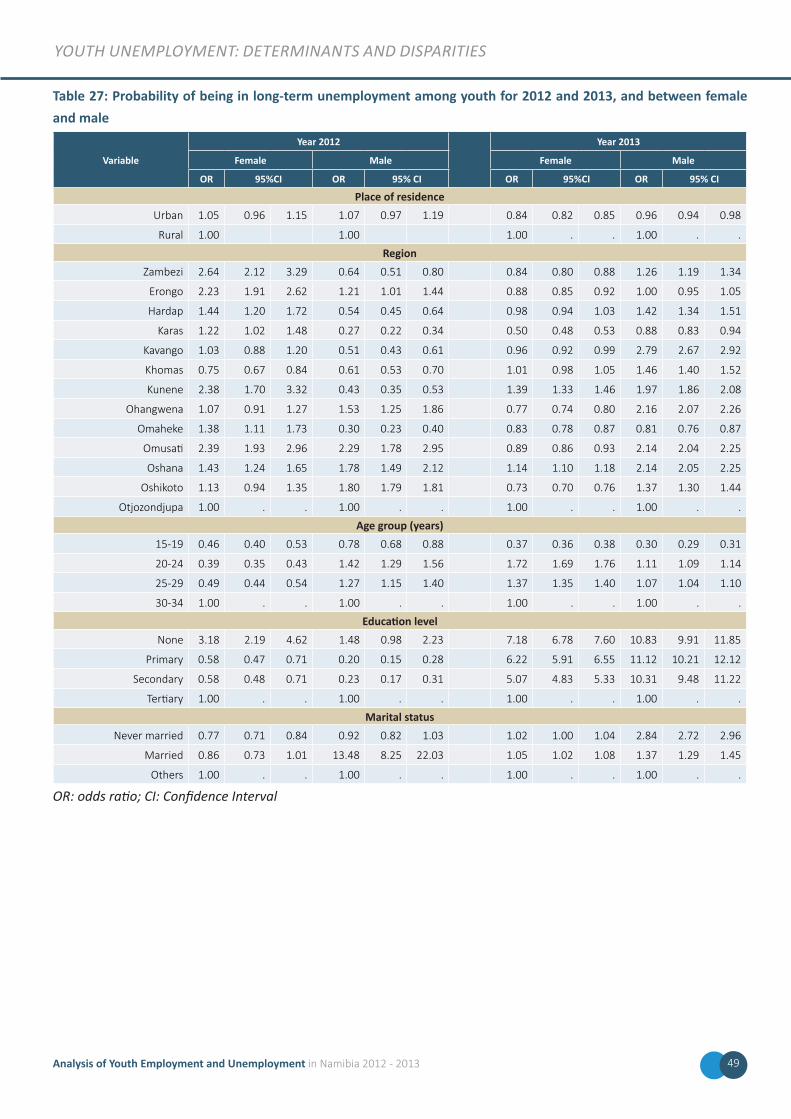
youtH unEmPloymEnt: dEtErminants and disParitiEs
Table 27: Probability of being in long-term unemployment among youth for 2012 and 2013, and between female and male
Variable
Year 2012 Year 2013
Female Male Female Male
OR 95%CI OR 95% CI OR 95%CI OR 95% CI
Place of residenceUrban 1.05 0.96 1.15 1.07 0.97 1.19 0.84 0.82 0.85 0.96 0.94 0.98
Rural 1.00 1.00 1.00 . . 1.00 . .
RegionZambezi 2.64 2.12 3.29 0.64 0.51 0.80 0.84 0.80 0.88 1.26 1.19 1.34
Erongo 2.23 1.91 2.62 1.21 1.01 1.44 0.88 0.85 0.92 1.00 0.95 1.05
Hardap 1.44 1.20 1.72 0.54 0.45 0.64 0.98 0.94 1.03 1.42 1.34 1.51
Karas 1.22 1.02 1.48 0.27 0.22 0.34 0.50 0.48 0.53 0.88 0.83 0.94
Kavango 1.03 0.88 1.20 0.51 0.43 0.61 0.96 0.92 0.99 2.79 2.67 2.92
Khomas 0.75 0.67 0.84 0.61 0.53 0.70 1.01 0.98 1.05 1.46 1.40 1.52
Kunene 2.38 1.70 3.32 0.43 0.35 0.53 1.39 1.33 1.46 1.97 1.86 2.08
Ohangwena 1.07 0.91 1.27 1.53 1.25 1.86 0.77 0.74 0.80 2.16 2.07 2.26
Omaheke 1.38 1.11 1.73 0.30 0.23 0.40 0.83 0.78 0.87 0.81 0.76 0.87
Omusati 2.39 1.93 2.96 2.29 1.78 2.95 0.89 0.86 0.93 2.14 2.04 2.25
Oshana 1.43 1.24 1.65 1.78 1.49 2.12 1.14 1.10 1.18 2.14 2.05 2.25
Oshikoto 1.13 0.94 1.35 1.80 1.79 1.81 0.73 0.70 0.76 1.37 1.30 1.44
Otjozondjupa 1.00 . . 1.00 . . 1.00 . . 1.00 . .
Age group (years)15-19 0.46 0.40 0.53 0.78 0.68 0.88 0.37 0.36 0.38 0.30 0.29 0.31
20-24 0.39 0.35 0.43 1.42 1.29 1.56 1.72 1.69 1.76 1.11 1.09 1.14
25-29 0.49 0.44 0.54 1.27 1.15 1.40 1.37 1.35 1.40 1.07 1.04 1.10
30-34 1.00 . . 1.00 . . 1.00 . . 1.00 . .
Education levelNone 3.18 2.19 4.62 1.48 0.98 2.23 7.18 6.78 7.60 10.83 9.91 11.85
Primary 0.58 0.47 0.71 0.20 0.15 0.28 6.22 5.91 6.55 11.12 10.21 12.12
Secondary 0.58 0.48 0.71 0.23 0.17 0.31 5.07 4.83 5.33 10.31 9.48 11.22
Tertiary 1.00 . . 1.00 . . 1.00 . . 1.00 . .
Marital statusNever married 0.77 0.71 0.84 0.92 0.82 1.03 1.02 1.00 1.04 2.84 2.72 2.96
Married 0.86 0.73 1.01 13.48 8.25 22.03 1.05 1.02 1.08 1.37 1.29 1.45
Others 1.00 . . 1.00 . . 1.00 . . 1.00 . .
OR: odds ratio; CI: Confidence Interval
49Analysis of Youth Employment and Unemployment in Namibia 2012 - 2013
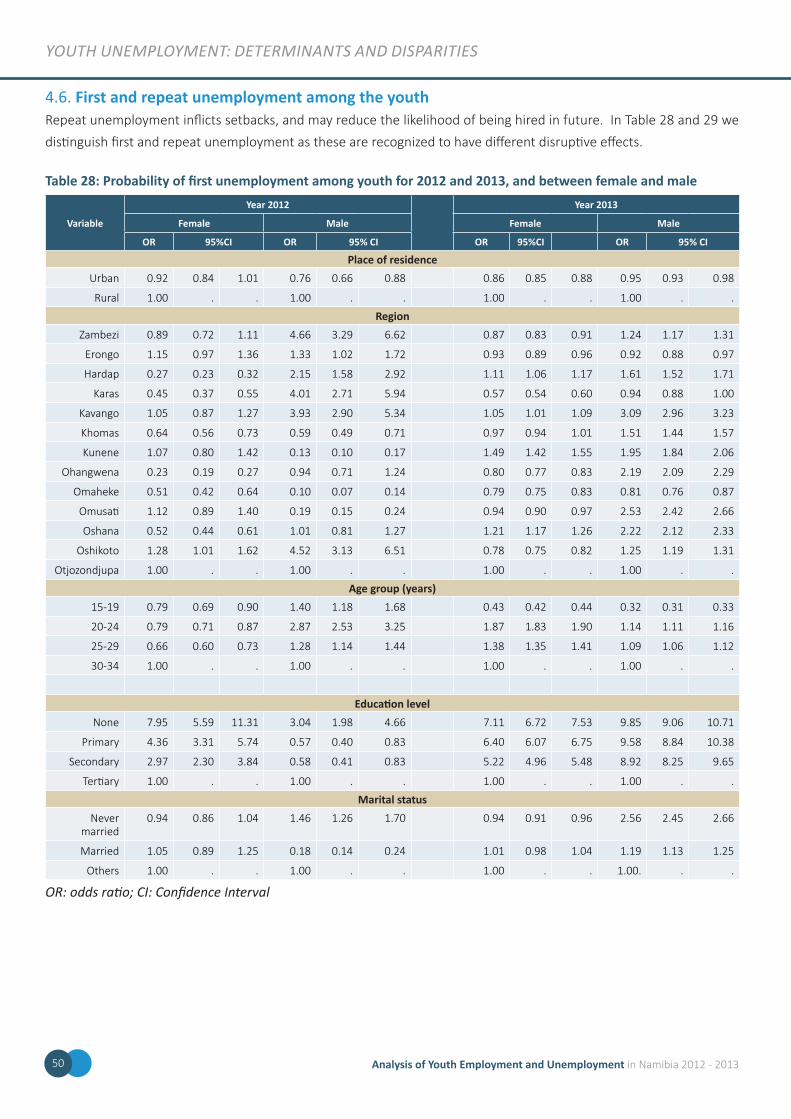
youtH unEmPloymEnt: dEtErminants and disParitiEs
4.6. First and repeat unemployment among the youthRepeat unemployment inflicts setbacks, and may reduce the likelihood of being hired in future. In Table 28 and 29 we
distinguish first and repeat unemployment as these are recognized to have different disruptive effects.
Table 28: Probability of first unemployment among youth for 2012 and 2013, and between female and male
Variable
Year 2012 Year 2013
Female Male Female Male
OR 95%CI OR 95% CI OR 95%CI OR 95% CI
Place of residenceUrban 0.92 0.84 1.01 0.76 0.66 0.88 0.86 0.85 0.88 0.95 0.93 0.98
Rural 1.00 . . 1.00 . . 1.00 . . 1.00 . .
RegionZambezi 0.89 0.72 1.11 4.66 3.29 6.62 0.87 0.83 0.91 1.24 1.17 1.31
Erongo 1.15 0.97 1.36 1.33 1.02 1.72 0.93 0.89 0.96 0.92 0.88 0.97
Hardap 0.27 0.23 0.32 2.15 1.58 2.92 1.11 1.06 1.17 1.61 1.52 1.71
Karas 0.45 0.37 0.55 4.01 2.71 5.94 0.57 0.54 0.60 0.94 0.88 1.00
Kavango 1.05 0.87 1.27 3.93 2.90 5.34 1.05 1.01 1.09 3.09 2.96 3.23
Khomas 0.64 0.56 0.73 0.59 0.49 0.71 0.97 0.94 1.01 1.51 1.44 1.57
Kunene 1.07 0.80 1.42 0.13 0.10 0.17 1.49 1.42 1.55 1.95 1.84 2.06
Ohangwena 0.23 0.19 0.27 0.94 0.71 1.24 0.80 0.77 0.83 2.19 2.09 2.29
Omaheke 0.51 0.42 0.64 0.10 0.07 0.14 0.79 0.75 0.83 0.81 0.76 0.87
Omusati 1.12 0.89 1.40 0.19 0.15 0.24 0.94 0.90 0.97 2.53 2.42 2.66
Oshana 0.52 0.44 0.61 1.01 0.81 1.27 1.21 1.17 1.26 2.22 2.12 2.33
Oshikoto 1.28 1.01 1.62 4.52 3.13 6.51 0.78 0.75 0.82 1.25 1.19 1.31
Otjozondjupa 1.00 . . 1.00 . . 1.00 . . 1.00 . .
Age group (years)15-19 0.79 0.69 0.90 1.40 1.18 1.68 0.43 0.42 0.44 0.32 0.31 0.33
20-24 0.79 0.71 0.87 2.87 2.53 3.25 1.87 1.83 1.90 1.14 1.11 1.16
25-29 0.66 0.60 0.73 1.28 1.14 1.44 1.38 1.35 1.41 1.09 1.06 1.12
30-34 1.00 . . 1.00 . . 1.00 . . 1.00 . .
Education levelNone 7.95 5.59 11.31 3.04 1.98 4.66 7.11 6.72 7.53 9.85 9.06 10.71
Primary 4.36 3.31 5.74 0.57 0.40 0.83 6.40 6.07 6.75 9.58 8.84 10.38
Secondary 2.97 2.30 3.84 0.58 0.41 0.83 5.22 4.96 5.48 8.92 8.25 9.65
Tertiary 1.00 . . 1.00 . . 1.00 . . 1.00 . .
Marital statusNever
married0.94 0.86 1.04 1.46 1.26 1.70 0.94 0.91 0.96 2.56 2.45 2.66
Married 1.05 0.89 1.25 0.18 0.14 0.24 1.01 0.98 1.04 1.19 1.13 1.25
Others 1.00 . . 1.00 . . 1.00 . . 1.00. . .
OR: odds ratio; CI: Confidence Interval
Analysis of Youth Employment and Unemployment in Namibia 2012 - 201350
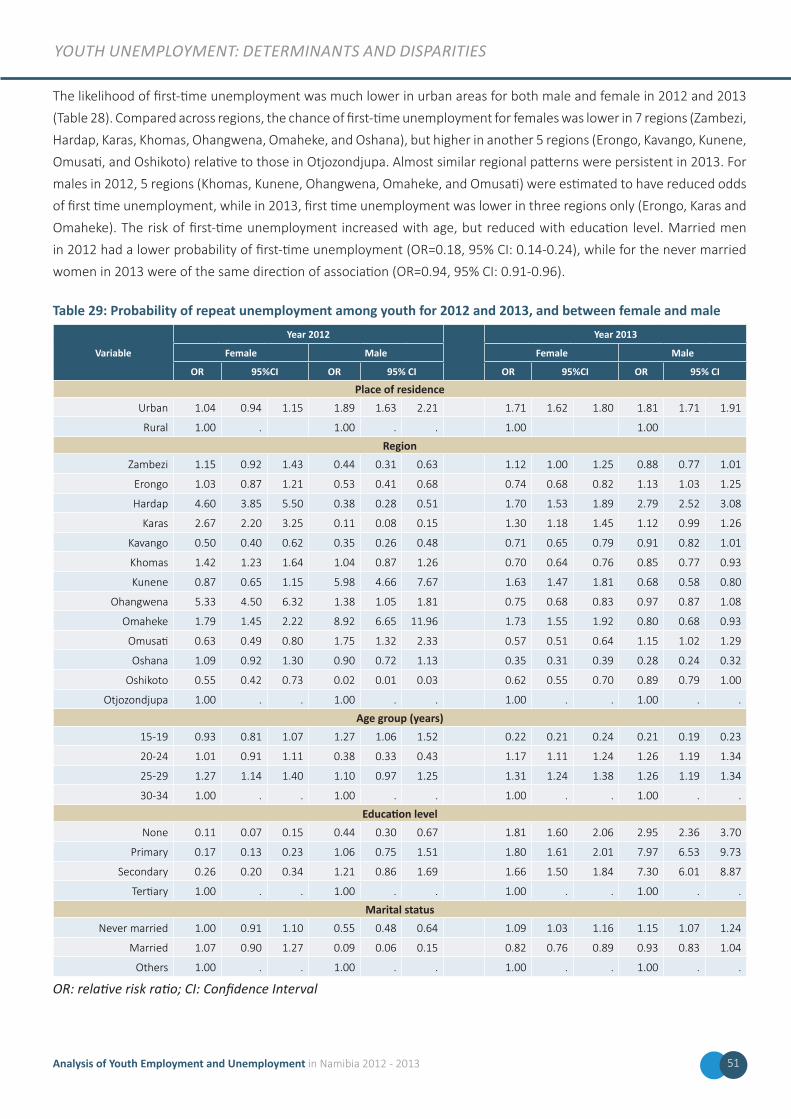
youtH unEmPloymEnt: dEtErminants and disParitiEs
The likelihood of first-time unemployment was much lower in urban areas for both male and female in 2012 and 2013
(Table 28). Compared across regions, the chance of first-time unemployment for females was lower in 7 regions (Zambezi,
Hardap, Karas, Khomas, Ohangwena, Omaheke, and Oshana), but higher in another 5 regions (Erongo, Kavango, Kunene,
Omusati, and Oshikoto) relative to those in Otjozondjupa. Almost similar regional patterns were persistent in 2013. For
males in 2012, 5 regions (Khomas, Kunene, Ohangwena, Omaheke, and Omusati) were estimated to have reduced odds
of first time unemployment, while in 2013, first time unemployment was lower in three regions only (Erongo, Karas and
Omaheke). The risk of first-time unemployment increased with age, but reduced with education level. Married men
in 2012 had a lower probability of first-time unemployment (OR=0.18, 95% CI: 0.14-0.24), while for the never married
women in 2013 were of the same direction of association (OR=0.94, 95% CI: 0.91-0.96).
Table 29: Probability of repeat unemployment among youth for 2012 and 2013, and between female and male
Variable
Year 2012 Year 2013
Female Male Female Male
OR 95%CI OR 95% CI OR 95%CI OR 95% CI
Place of residenceUrban 1.04 0.94 1.15 1.89 1.63 2.21 1.71 1.62 1.80 1.81 1.71 1.91
Rural 1.00 . 1.00 . . 1.00 1.00
RegionZambezi 1.15 0.92 1.43 0.44 0.31 0.63 1.12 1.00 1.25 0.88 0.77 1.01
Erongo 1.03 0.87 1.21 0.53 0.41 0.68 0.74 0.68 0.82 1.13 1.03 1.25
Hardap 4.60 3.85 5.50 0.38 0.28 0.51 1.70 1.53 1.89 2.79 2.52 3.08
Karas 2.67 2.20 3.25 0.11 0.08 0.15 1.30 1.18 1.45 1.12 0.99 1.26
Kavango 0.50 0.40 0.62 0.35 0.26 0.48 0.71 0.65 0.79 0.91 0.82 1.01
Khomas 1.42 1.23 1.64 1.04 0.87 1.26 0.70 0.64 0.76 0.85 0.77 0.93
Kunene 0.87 0.65 1.15 5.98 4.66 7.67 1.63 1.47 1.81 0.68 0.58 0.80
Ohangwena 5.33 4.50 6.32 1.38 1.05 1.81 0.75 0.68 0.83 0.97 0.87 1.08
Omaheke 1.79 1.45 2.22 8.92 6.65 11.96 1.73 1.55 1.92 0.80 0.68 0.93
Omusati 0.63 0.49 0.80 1.75 1.32 2.33 0.57 0.51 0.64 1.15 1.02 1.29
Oshana 1.09 0.92 1.30 0.90 0.72 1.13 0.35 0.31 0.39 0.28 0.24 0.32
Oshikoto 0.55 0.42 0.73 0.02 0.01 0.03 0.62 0.55 0.70 0.89 0.79 1.00
Otjozondjupa 1.00 . . 1.00 . . 1.00 . . 1.00 . .
Age group (years)15-19 0.93 0.81 1.07 1.27 1.06 1.52 0.22 0.21 0.24 0.21 0.19 0.23
20-24 1.01 0.91 1.11 0.38 0.33 0.43 1.17 1.11 1.24 1.26 1.19 1.34
25-29 1.27 1.14 1.40 1.10 0.97 1.25 1.31 1.24 1.38 1.26 1.19 1.34
30-34 1.00 . . 1.00 . . 1.00 . . 1.00 . .
Education levelNone 0.11 0.07 0.15 0.44 0.30 0.67 1.81 1.60 2.06 2.95 2.36 3.70
Primary 0.17 0.13 0.23 1.06 0.75 1.51 1.80 1.61 2.01 7.97 6.53 9.73
Secondary 0.26 0.20 0.34 1.21 0.86 1.69 1.66 1.50 1.84 7.30 6.01 8.87
Tertiary 1.00 . . 1.00 . . 1.00 . . 1.00 . .
Marital statusNever married 1.00 0.91 1.10 0.55 0.48 0.64 1.09 1.03 1.16 1.15 1.07 1.24
Married 1.07 0.90 1.27 0.09 0.06 0.15 0.82 0.76 0.89 0.93 0.83 1.04
Others 1.00 . . 1.00 . . 1.00 . . 1.00 . .
OR: relative risk ratio; CI: Confidence Interval
51Analysis of Youth Employment and Unemployment in Namibia 2012 - 2013
youtH unEmPloymEnt: dEtErminants and disParitiEs
Table 29 now presents results on variables associated with repeat unemployment. For both years, and regardless of sex,
the chance of repeated unemployment was high in urban areas than for those in rural areas. Females in 2012 were more
likely to experience repeated unemployment if they were from Zambezi, Erongo, Hardap, Karas, Khomas, Ohangwena,
Omaheke and Oshana. Repeat unemployment was more prevalent among males in 2012 in the regions of Khomas,
Kunene, Ohangwena, Omaheke and Omusati. On the other hand, in 2013, female experienced repeated unemployment
in Zambezi, Hardap, Karas, Kunene, and Omaheke, while for males this was more common in Erongo, Hardap, Karas, and
Omusati. For both years and sexes, repeat unemployment was more prevalent in older young individuals than young
workers. Table 29 further shows that those with as education level increases, the odds of repeated unemployment
increases, and it is more pronounced in males than females, and much higher in 2013 as opposed to 2013. Turning to
marital status, we observe that prevalence of repeated unemployment was much lower for the married in 2013 (for
both male and female), but lower for both married and never married males in 2012.
4.7. NEET individuals’ labour marketThe youth not in education, employment and training (NEET) rate is intended to reflect those youth who are not part of
the labour force for reasons other than education and training (NSA, 2015). The NEET is defined as a percentage given
by the formula:
Number of UE youth + Number of EIA youth - Number of UE and EIA youth who are in Education or Training
Total Number of YouthnEEt(%) =
where
UE: Number of Unemployed youth
EIA: Number of youths economically inactive
In this section we consider factors associated with NEET labour market. Between 2012 and 2013, NEET ranged from 33
% to 34% (Table 31 and 32). Figure 4 clearly show region variation in NEETs, with 2012 estimated to have relatively lower
proportion of NEET than in 2013. Figure 5 shows the NEET by education level. NEETS decline with increasing education.
However NEET was higher for those with senior secondary education; Std. 10 and university education in 2012 than in
2013. About a fifth of the youth with Std. 10 (Grade 12) in 2012 were not in education, employment or training, and the
NEET was about 10% for those with postgraduate training in 2013.
Analysis of Youth Employment and Unemployment in Namibia 2012 - 201352
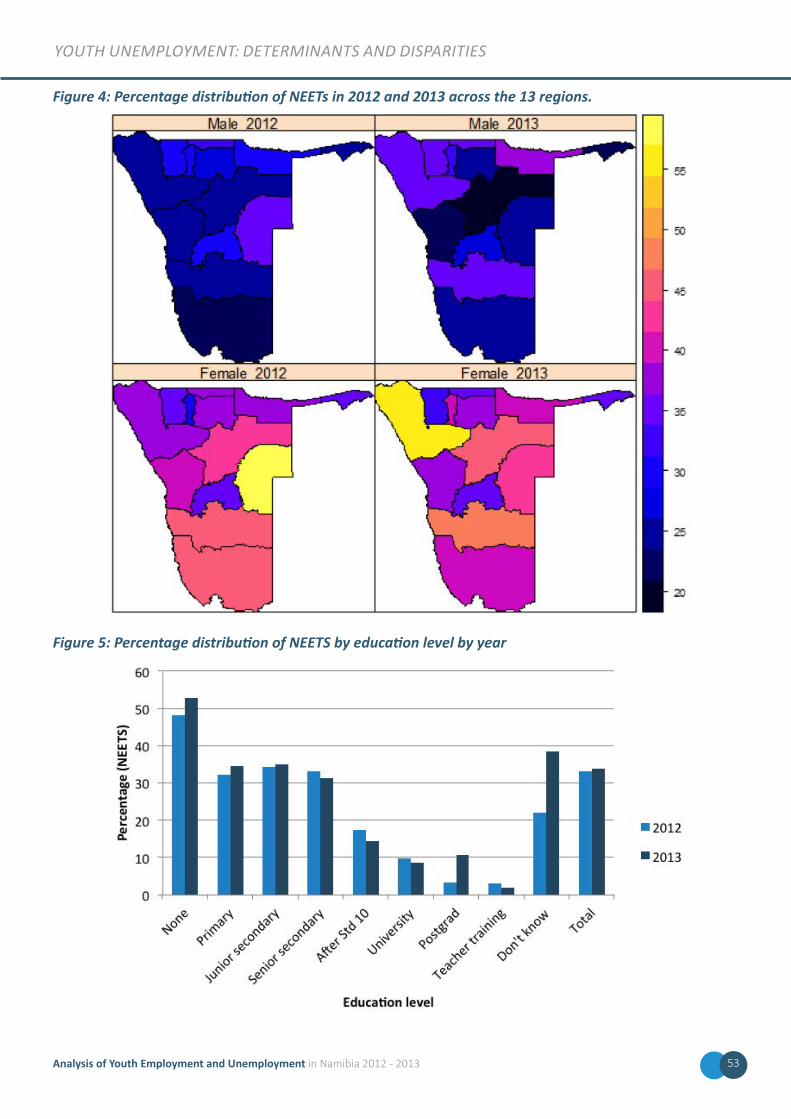
youtH unEmPloymEnt: dEtErminants and disParitiEs
Figure 4: Percentage distribution of NEETs in 2012 and 2013 across the 13 regions.
Figure 5: Percentage distribution of NEETS by education level by year
53Analysis of Youth Employment and Unemployment in Namibia 2012 - 2013
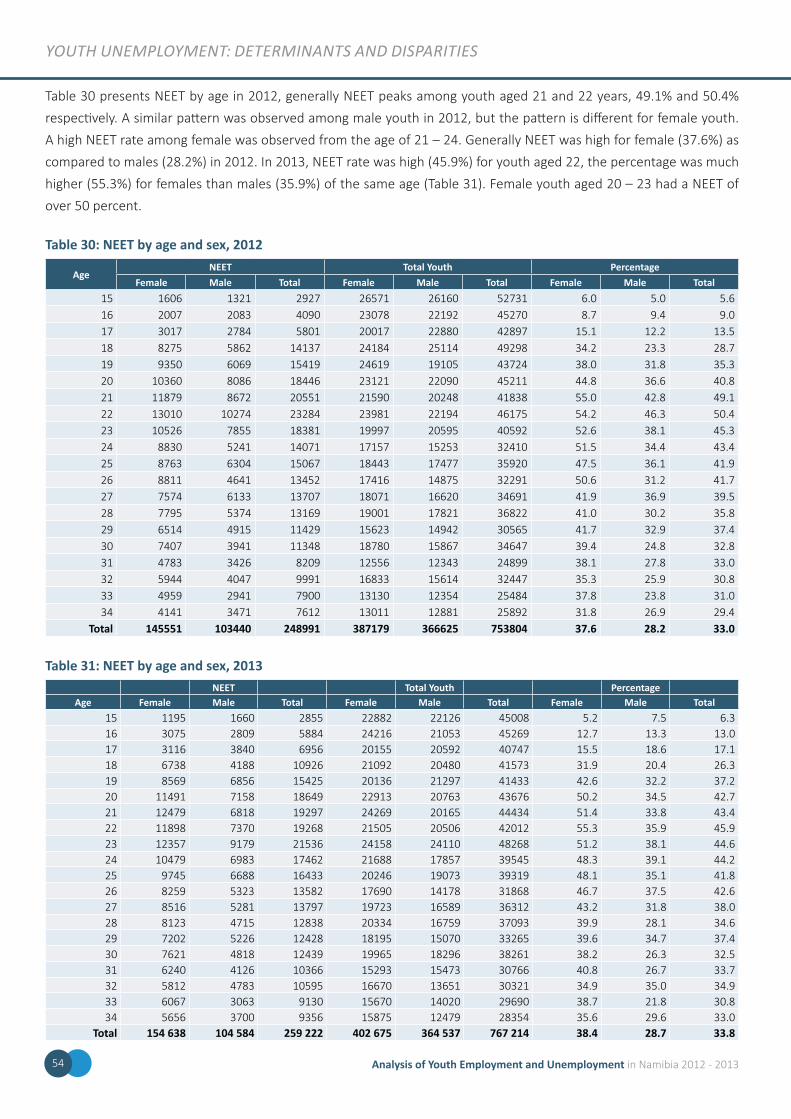
youtH unEmPloymEnt: dEtErminants and disParitiEs
Table 30 presents NEET by age in 2012, generally NEET peaks among youth aged 21 and 22 years, 49.1% and 50.4%
respectively. A similar pattern was observed among male youth in 2012, but the pattern is different for female youth.
A high NEET rate among female was observed from the age of 21 – 24. Generally NEET was high for female (37.6%) as
compared to males (28.2%) in 2012. In 2013, NEET rate was high (45.9%) for youth aged 22, the percentage was much
higher (55.3%) for females than males (35.9%) of the same age (Table 31). Female youth aged 20 – 23 had a NEET of
over 50 percent.
Table 30: NEET by age and sex, 2012
AgeNEET Total Youth Percentage
Female Male Total Female Male Total Female Male Total15 1606 1321 2927 26571 26160 52731 6.0 5.0 5.616 2007 2083 4090 23078 22192 45270 8.7 9.4 9.017 3017 2784 5801 20017 22880 42897 15.1 12.2 13.518 8275 5862 14137 24184 25114 49298 34.2 23.3 28.719 9350 6069 15419 24619 19105 43724 38.0 31.8 35.320 10360 8086 18446 23121 22090 45211 44.8 36.6 40.821 11879 8672 20551 21590 20248 41838 55.0 42.8 49.122 13010 10274 23284 23981 22194 46175 54.2 46.3 50.423 10526 7855 18381 19997 20595 40592 52.6 38.1 45.324 8830 5241 14071 17157 15253 32410 51.5 34.4 43.425 8763 6304 15067 18443 17477 35920 47.5 36.1 41.926 8811 4641 13452 17416 14875 32291 50.6 31.2 41.727 7574 6133 13707 18071 16620 34691 41.9 36.9 39.528 7795 5374 13169 19001 17821 36822 41.0 30.2 35.829 6514 4915 11429 15623 14942 30565 41.7 32.9 37.430 7407 3941 11348 18780 15867 34647 39.4 24.8 32.831 4783 3426 8209 12556 12343 24899 38.1 27.8 33.032 5944 4047 9991 16833 15614 32447 35.3 25.9 30.833 4959 2941 7900 13130 12354 25484 37.8 23.8 31.034 4141 3471 7612 13011 12881 25892 31.8 26.9 29.4
Total 145551 103440 248991 387179 366625 753804 37.6 28.2 33.0
Table 31: NEET by age and sex, 2013NEET Total Youth Percentage
Age Female Male Total Female Male Total Female Male Total15 1195 1660 2855 22882 22126 45008 5.2 7.5 6.316 3075 2809 5884 24216 21053 45269 12.7 13.3 13.017 3116 3840 6956 20155 20592 40747 15.5 18.6 17.118 6738 4188 10926 21092 20480 41573 31.9 20.4 26.319 8569 6856 15425 20136 21297 41433 42.6 32.2 37.220 11491 7158 18649 22913 20763 43676 50.2 34.5 42.721 12479 6818 19297 24269 20165 44434 51.4 33.8 43.422 11898 7370 19268 21505 20506 42012 55.3 35.9 45.923 12357 9179 21536 24158 24110 48268 51.2 38.1 44.624 10479 6983 17462 21688 17857 39545 48.3 39.1 44.225 9745 6688 16433 20246 19073 39319 48.1 35.1 41.826 8259 5323 13582 17690 14178 31868 46.7 37.5 42.627 8516 5281 13797 19723 16589 36312 43.2 31.8 38.028 8123 4715 12838 20334 16759 37093 39.9 28.1 34.629 7202 5226 12428 18195 15070 33265 39.6 34.7 37.430 7621 4818 12439 19965 18296 38261 38.2 26.3 32.531 6240 4126 10366 15293 15473 30766 40.8 26.7 33.732 5812 4783 10595 16670 13651 30321 34.9 35.0 34.933 6067 3063 9130 15670 14020 29690 38.7 21.8 30.834 5656 3700 9356 15875 12479 28354 35.6 29.6 33.0
Total 154 638 104 584 259 222 402 675 364 537 767 214 38.4 28.7 33.8
Analysis of Youth Employment and Unemployment in Namibia 2012 - 201354
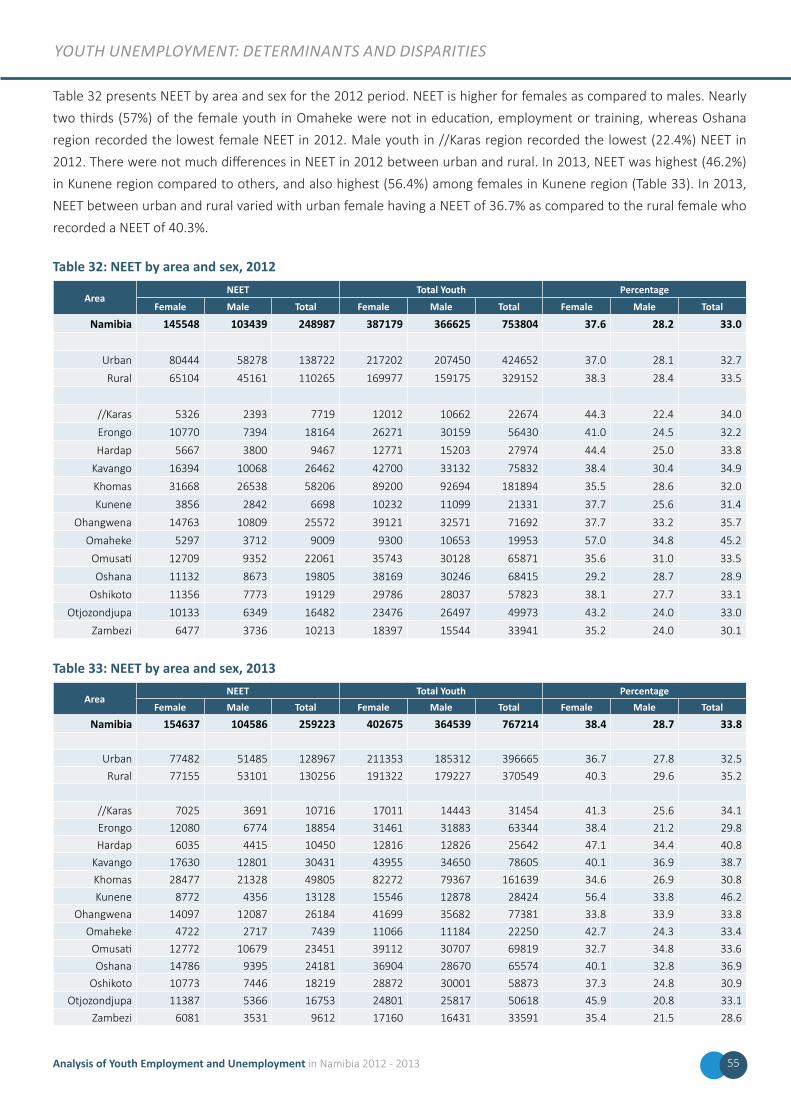
youtH unEmPloymEnt: dEtErminants and disParitiEs
Table 32 presents NEET by area and sex for the 2012 period. NEET is higher for females as compared to males. Nearly
two thirds (57%) of the female youth in Omaheke were not in education, employment or training, whereas Oshana
region recorded the lowest female NEET in 2012. Male youth in //Karas region recorded the lowest (22.4%) NEET in
2012. There were not much differences in NEET in 2012 between urban and rural. In 2013, NEET was highest (46.2%)
in Kunene region compared to others, and also highest (56.4%) among females in Kunene region (Table 33). In 2013,
NEET between urban and rural varied with urban female having a NEET of 36.7% as compared to the rural female who
recorded a NEET of 40.3%.
Table 32: NEET by area and sex, 2012
AreaNEET Total Youth Percentage
Female Male Total Female Male Total Female Male Total
Namibia 145548 103439 248987 387179 366625 753804 37.6 28.2 33.0
Urban 80444 58278 138722 217202 207450 424652 37.0 28.1 32.7
Rural 65104 45161 110265 169977 159175 329152 38.3 28.4 33.5
//Karas 5326 2393 7719 12012 10662 22674 44.3 22.4 34.0
Erongo 10770 7394 18164 26271 30159 56430 41.0 24.5 32.2
Hardap 5667 3800 9467 12771 15203 27974 44.4 25.0 33.8
Kavango 16394 10068 26462 42700 33132 75832 38.4 30.4 34.9
Khomas 31668 26538 58206 89200 92694 181894 35.5 28.6 32.0
Kunene 3856 2842 6698 10232 11099 21331 37.7 25.6 31.4
Ohangwena 14763 10809 25572 39121 32571 71692 37.7 33.2 35.7
Omaheke 5297 3712 9009 9300 10653 19953 57.0 34.8 45.2
Omusati 12709 9352 22061 35743 30128 65871 35.6 31.0 33.5
Oshana 11132 8673 19805 38169 30246 68415 29.2 28.7 28.9
Oshikoto 11356 7773 19129 29786 28037 57823 38.1 27.7 33.1
Otjozondjupa 10133 6349 16482 23476 26497 49973 43.2 24.0 33.0
Zambezi 6477 3736 10213 18397 15544 33941 35.2 24.0 30.1
Table 33: NEET by area and sex, 2013
AreaNEET Total Youth Percentage
Female Male Total Female Male Total Female Male Total
Namibia 154637 104586 259223 402675 364539 767214 38.4 28.7 33.8
Urban 77482 51485 128967 211353 185312 396665 36.7 27.8 32.5
Rural 77155 53101 130256 191322 179227 370549 40.3 29.6 35.2
//Karas 7025 3691 10716 17011 14443 31454 41.3 25.6 34.1
Erongo 12080 6774 18854 31461 31883 63344 38.4 21.2 29.8
Hardap 6035 4415 10450 12816 12826 25642 47.1 34.4 40.8
Kavango 17630 12801 30431 43955 34650 78605 40.1 36.9 38.7
Khomas 28477 21328 49805 82272 79367 161639 34.6 26.9 30.8
Kunene 8772 4356 13128 15546 12878 28424 56.4 33.8 46.2
Ohangwena 14097 12087 26184 41699 35682 77381 33.8 33.9 33.8
Omaheke 4722 2717 7439 11066 11184 22250 42.7 24.3 33.4
Omusati 12772 10679 23451 39112 30707 69819 32.7 34.8 33.6
Oshana 14786 9395 24181 36904 28670 65574 40.1 32.8 36.9
Oshikoto 10773 7446 18219 28872 30001 58873 37.3 24.8 30.9
Otjozondjupa 11387 5366 16753 24801 25817 50618 45.9 20.8 33.1
Zambezi 6081 3531 9612 17160 16431 33591 35.4 21.5 28.6
55Analysis of Youth Employment and Unemployment in Namibia 2012 - 2013
youtH unEmPloymEnt: dEtErminants and disParitiEs
Table 34 presents result on the logit model for determinants of being NEET or otherwise, for 2012 and 2013. As before
separate estimates are given for females and males. In 2012, the characteristics that raised the probability of being
NEET relative to not NEET among females were residence in Erongo, Hardap, //Karas, Ohangwena and Omaheke regions
(compared to Otjozondjupa region), as well as having age within the range of 20-24, and 25-29 years (relative to being
of age between 30 and 34 years), having no education or having primary education or secondary education as opposed
to having tertiary education. Among males in 2012, the probability of being a NEET was higher if the individual worker
was in urban area (OR=1.26) as opposed to being in rural areas, as well as residing in any of these regions: Zambezi,
Hardap, //Karas, Kavango, Khomas, Ohangwena, Omaheke, Omusati, Oshana and Oshikoto (relative to being located in
Otjozondjupa region). At the same time the odds increased for those aged 20-24 and 25-29 years as opposed to those in
the age band 30 to 34 years. Similar pattern, as of females, was observed when compared across education level, with
the no education, primary education and secondary education being an increased risk compared to those with tertiary
education. Males who were never married were more likely to be NEET than those in other forms of marital status, while
being married was associated with a lower risk of being a NEET.
With respect to the factors impacting the probability of being NEET, in 2013, it was estimated that females were more
likely to be NEETs in Hardap and Kunene regions. Again being of age 20-24 and 25-29 years increased the probability
of being a NEET, relative to being in aged 30-34 years. With regards to education level, the probability was 22 times
higher for those without education compared to those with tertiary education, whereas for the primary and secondary
education the odds were about 12 times and 8 times higher when compared with those females who attained tertiary
education. In 2013, marital status of females was not associated with an elevated probability of being a NEET. For males
in 2013, the chance of being a NEET was increased if one was residing in urban areas as opposed to being in rural areas.
In relation to region, the patterns were similar to those observed in 2012, such that the odds of being a NEET increased
in all regions with the exception of Erongo (relative to Otjozondjupa region). The NEET male youth in 2013 shared similar
traits to the NEET in 2012, when it comes to age and education level. The probability of being a NEET increased with
age, while decreased with education attainment, although these remained high in all categories of education, when
compared to those males with tertiary education. In contrast to those in other forms of marital status, male NEETs who
were never married or married were at an increased risk of being a NEET (Table 35).
Analysis of Youth Employment and Unemployment in Namibia 2012 - 201356
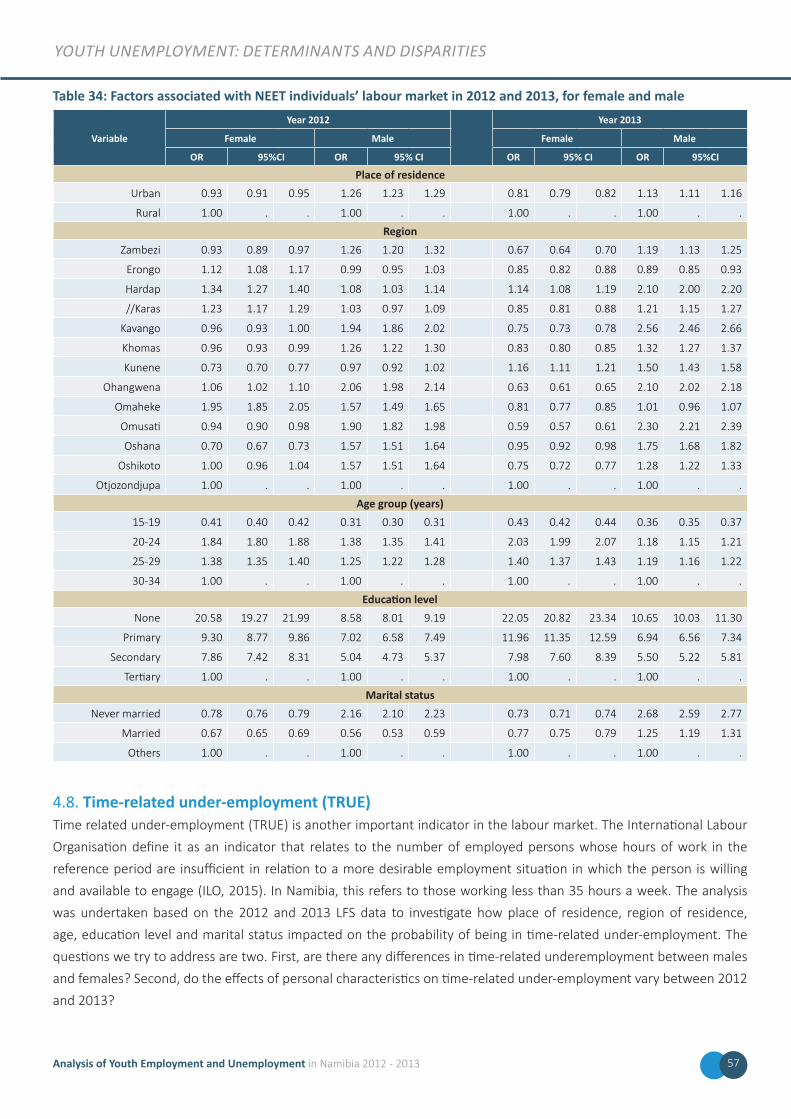
youtH unEmPloymEnt: dEtErminants and disParitiEs
Table 34: Factors associated with NEET individuals’ labour market in 2012 and 2013, for female and male
Variable
Year 2012 Year 2013
Female Male Female Male
OR 95%CI OR 95% CI OR 95% CI OR 95%CI
Place of residenceUrban 0.93 0.91 0.95 1.26 1.23 1.29 0.81 0.79 0.82 1.13 1.11 1.16
Rural 1.00 . . 1.00 . . 1.00 . . 1.00 . .
RegionZambezi 0.93 0.89 0.97 1.26 1.20 1.32 0.67 0.64 0.70 1.19 1.13 1.25
Erongo 1.12 1.08 1.17 0.99 0.95 1.03 0.85 0.82 0.88 0.89 0.85 0.93
Hardap 1.34 1.27 1.40 1.08 1.03 1.14 1.14 1.08 1.19 2.10 2.00 2.20
//Karas 1.23 1.17 1.29 1.03 0.97 1.09 0.85 0.81 0.88 1.21 1.15 1.27
Kavango 0.96 0.93 1.00 1.94 1.86 2.02 0.75 0.73 0.78 2.56 2.46 2.66
Khomas 0.96 0.93 0.99 1.26 1.22 1.30 0.83 0.80 0.85 1.32 1.27 1.37
Kunene 0.73 0.70 0.77 0.97 0.92 1.02 1.16 1.11 1.21 1.50 1.43 1.58
Ohangwena 1.06 1.02 1.10 2.06 1.98 2.14 0.63 0.61 0.65 2.10 2.02 2.18
Omaheke 1.95 1.85 2.05 1.57 1.49 1.65 0.81 0.77 0.85 1.01 0.96 1.07
Omusati 0.94 0.90 0.98 1.90 1.82 1.98 0.59 0.57 0.61 2.30 2.21 2.39
Oshana 0.70 0.67 0.73 1.57 1.51 1.64 0.95 0.92 0.98 1.75 1.68 1.82
Oshikoto 1.00 0.96 1.04 1.57 1.51 1.64 0.75 0.72 0.77 1.28 1.22 1.33
Otjozondjupa 1.00 . . 1.00 . . 1.00 . . 1.00 . .
Age group (years)15-19 0.41 0.40 0.42 0.31 0.30 0.31 0.43 0.42 0.44 0.36 0.35 0.37
20-24 1.84 1.80 1.88 1.38 1.35 1.41 2.03 1.99 2.07 1.18 1.15 1.21
25-29 1.38 1.35 1.40 1.25 1.22 1.28 1.40 1.37 1.43 1.19 1.16 1.22
30-34 1.00 . . 1.00 . . 1.00 . . 1.00 . .
Education levelNone 20.58 19.27 21.99 8.58 8.01 9.19 22.05 20.82 23.34 10.65 10.03 11.30
Primary 9.30 8.77 9.86 7.02 6.58 7.49 11.96 11.35 12.59 6.94 6.56 7.34
Secondary 7.86 7.42 8.31 5.04 4.73 5.37 7.98 7.60 8.39 5.50 5.22 5.81
Tertiary 1.00 . . 1.00 . . 1.00 . . 1.00 . .
Marital statusNever married 0.78 0.76 0.79 2.16 2.10 2.23 0.73 0.71 0.74 2.68 2.59 2.77
Married 0.67 0.65 0.69 0.56 0.53 0.59 0.77 0.75 0.79 1.25 1.19 1.31
Others 1.00 . . 1.00 . . 1.00 . . 1.00 . .
4.8. Time-related under-employment (TRUE)Time related under-employment (TRUE) is another important indicator in the labour market. The International Labour
Organisation define it as an indicator that relates to the number of employed persons whose hours of work in the
reference period are insufficient in relation to a more desirable employment situation in which the person is willing
and available to engage (ILO, 2015). In Namibia, this refers to those working less than 35 hours a week. The analysis
was undertaken based on the 2012 and 2013 LFS data to investigate how place of residence, region of residence,
age, education level and marital status impacted on the probability of being in time-related under-employment. The
questions we try to address are two. First, are there any differences in time-related underemployment between males
and females? Second, do the effects of personal characteristics on time-related under-employment vary between 2012
and 2013?
57Analysis of Youth Employment and Unemployment in Namibia 2012 - 2013
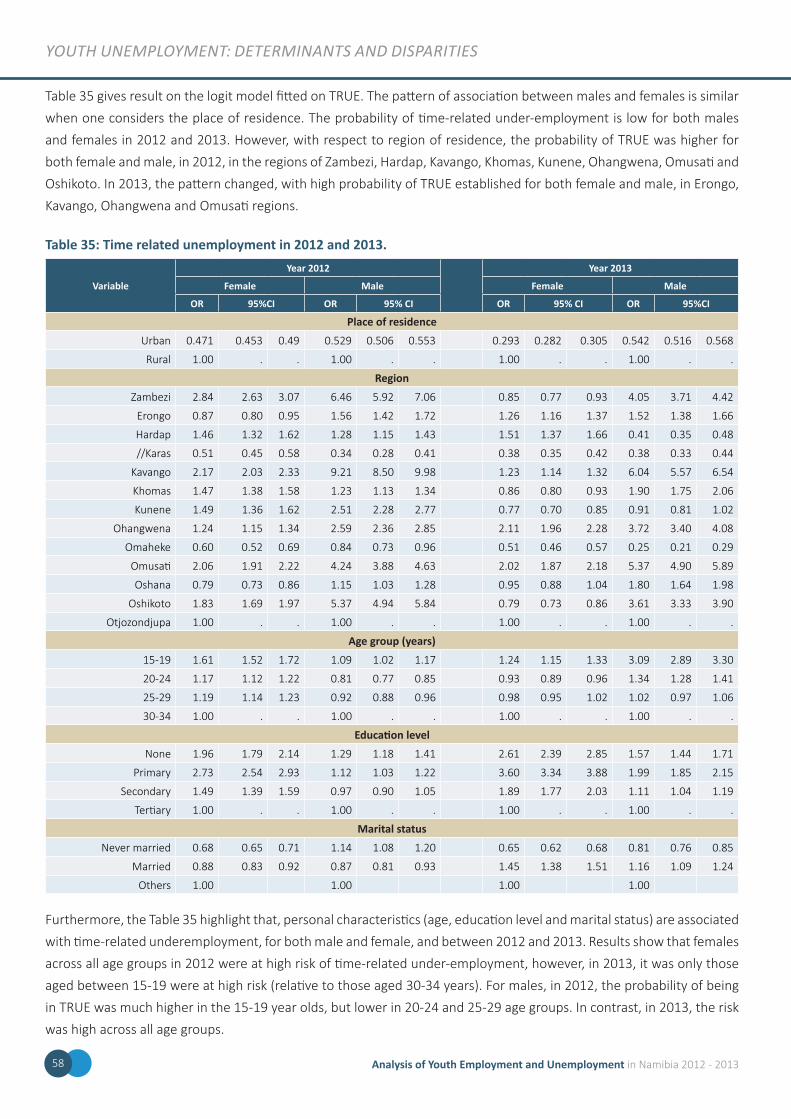
youtH unEmPloymEnt: dEtErminants and disParitiEs
Table 35 gives result on the logit model fitted on TRUE. The pattern of association between males and females is similar
when one considers the place of residence. The probability of time-related under-employment is low for both males
and females in 2012 and 2013. However, with respect to region of residence, the probability of TRUE was higher for
both female and male, in 2012, in the regions of Zambezi, Hardap, Kavango, Khomas, Kunene, Ohangwena, Omusati and
Oshikoto. In 2013, the pattern changed, with high probability of TRUE established for both female and male, in Erongo,
Kavango, Ohangwena and Omusati regions.
Table 35: Time related unemployment in 2012 and 2013.
Variable
Year 2012 Year 2013
Female Male Female Male
OR 95%CI OR 95% CI OR 95% CI OR 95%CI
Place of residenceUrban 0.471 0.453 0.49 0.529 0.506 0.553 0.293 0.282 0.305 0.542 0.516 0.568
Rural 1.00 . . 1.00 . . 1.00 . . 1.00 . .
RegionZambezi 2.84 2.63 3.07 6.46 5.92 7.06 0.85 0.77 0.93 4.05 3.71 4.42
Erongo 0.87 0.80 0.95 1.56 1.42 1.72 1.26 1.16 1.37 1.52 1.38 1.66
Hardap 1.46 1.32 1.62 1.28 1.15 1.43 1.51 1.37 1.66 0.41 0.35 0.48
//Karas 0.51 0.45 0.58 0.34 0.28 0.41 0.38 0.35 0.42 0.38 0.33 0.44
Kavango 2.17 2.03 2.33 9.21 8.50 9.98 1.23 1.14 1.32 6.04 5.57 6.54
Khomas 1.47 1.38 1.58 1.23 1.13 1.34 0.86 0.80 0.93 1.90 1.75 2.06
Kunene 1.49 1.36 1.62 2.51 2.28 2.77 0.77 0.70 0.85 0.91 0.81 1.02
Ohangwena 1.24 1.15 1.34 2.59 2.36 2.85 2.11 1.96 2.28 3.72 3.40 4.08
Omaheke 0.60 0.52 0.69 0.84 0.73 0.96 0.51 0.46 0.57 0.25 0.21 0.29
Omusati 2.06 1.91 2.22 4.24 3.88 4.63 2.02 1.87 2.18 5.37 4.90 5.89
Oshana 0.79 0.73 0.86 1.15 1.03 1.28 0.95 0.88 1.04 1.80 1.64 1.98
Oshikoto 1.83 1.69 1.97 5.37 4.94 5.84 0.79 0.73 0.86 3.61 3.33 3.90
Otjozondjupa 1.00 . . 1.00 . . 1.00 . . 1.00 . .
Age group (years)15-19 1.61 1.52 1.72 1.09 1.02 1.17 1.24 1.15 1.33 3.09 2.89 3.30
20-24 1.17 1.12 1.22 0.81 0.77 0.85 0.93 0.89 0.96 1.34 1.28 1.41
25-29 1.19 1.14 1.23 0.92 0.88 0.96 0.98 0.95 1.02 1.02 0.97 1.06
30-34 1.00 . . 1.00 . . 1.00 . . 1.00 . .
Education levelNone 1.96 1.79 2.14 1.29 1.18 1.41 2.61 2.39 2.85 1.57 1.44 1.71
Primary 2.73 2.54 2.93 1.12 1.03 1.22 3.60 3.34 3.88 1.99 1.85 2.15
Secondary 1.49 1.39 1.59 0.97 0.90 1.05 1.89 1.77 2.03 1.11 1.04 1.19
Tertiary 1.00 . . 1.00 . . 1.00 . . 1.00 . .
Marital statusNever married 0.68 0.65 0.71 1.14 1.08 1.20 0.65 0.62 0.68 0.81 0.76 0.85
Married 0.88 0.83 0.92 0.87 0.81 0.93 1.45 1.38 1.51 1.16 1.09 1.24
Others 1.00 1.00 1.00 1.00
Furthermore, the Table 35 highlight that, personal characteristics (age, education level and marital status) are associated
with time-related underemployment, for both male and female, and between 2012 and 2013. Results show that females
across all age groups in 2012 were at high risk of time-related under-employment, however, in 2013, it was only those
aged between 15-19 were at high risk (relative to those aged 30-34 years). For males, in 2012, the probability of being
in TRUE was much higher in the 15-19 year olds, but lower in 20-24 and 25-29 age groups. In contrast, in 2013, the risk
was high across all age groups.
Analysis of Youth Employment and Unemployment in Namibia 2012 - 201358
youtH unEmPloymEnt: dEtErminants and disParitiEs
With regards to education level, both females and males, in 2012 and 2013, were more prone to be engaged in visible
under-employment, but the odds were much higher in 2013 as compared to 2012 (Table 35). This pattern was persistent
across all education levels, except for males in 2012, where it was estimated that those with secondary education were
at a relatively lower probability (not statistically significant) of TRUE relative to those with tertiary education. The effect
of marital status was mixed. Females, whether married or never married in 2012 were less likely to be associated with
TRUE, while for males in the same year, we observed a higher probability for those never married, but lower probability
for those married. Come 2013, a higher impact of TRUE was manifested in the married women and men, while the
never married women and men were at a lower risk of TRUE.
4.9. Unemployment IndexIn this section we consider an overall index of youth unemployment in 2012 and 2013. The index considers three items:
(i) current unemployment status based on the broad definition; (ii) length of time being unemployed; and (iii) whether
the worker worked the past 12 months. The index was derived as =1 to define persistent and severe unemployment and
0=intermittent unemployment or none.
In 2012, severe unemployment was registered at 53.9% (52.7% in females and 55.5% in males), while in 2013, this was
at 59.6% (62.7% in females and 56.1% in males). Figure 6 shows the percentage distribution of severe/persistent youth
unemployment by region. The severity of unemployment was relatively lower among males in 2013 compared to 2012.
For 2013, the least proportion of males was observed in Omaheke region. Regions such as Omusati and Ohangwena
had a relatively low proportion of unemployed youth in 2012, but thus changes to be among the highest in 2013 among
males. With respect to females, again, a relatively high proportion was observed in Ohangwena and Omusati during the
2013 period.
Table 36 displays the result of a logistic regression estimating the effects of place of residence, region of residence,
age, education level and marital status on severity of unemployment. In 2012, among female, the characteristics that
raised the probability of severe unemployment were being young age, being not educated, and being unmarried. Those
aged 15-19, 20-24 and 25-29 compared to those aged 30-34 years were 4.7, 2.1 and 1.2 times at higher odds of severe
unemployment. Females who were not educated were relatively high risk (though not statistically significant) compared
to those who attained tertiary education. Similarly the never married females compared to others were at an elevated
risk of severe unemployment. All regions, expect for Kunene and Oshana, were associated with increased risk of severe
unemployment. For males, in the same year, factors impacting on severe unemployment were being in urban areas (as
opposed to residing in rural areas), being in Erongo, Hardap, Karas, Kavango, Khomas, Kunene and Omaheke regions
relative to residing in Otjozondjupa region. Equally, males who were young (be in in the age range 15-19 or 20-24 or
25-29 years) were more prone to severe unemployment that those who achieved tertiary education. However, the
study did not find any increasing effect of education level. Being never married, on the other hand, impacted on the
probability of severe unemployment for both males and females in 2012.
59Analysis of Youth Employment and Unemployment in Namibia 2012 - 2013
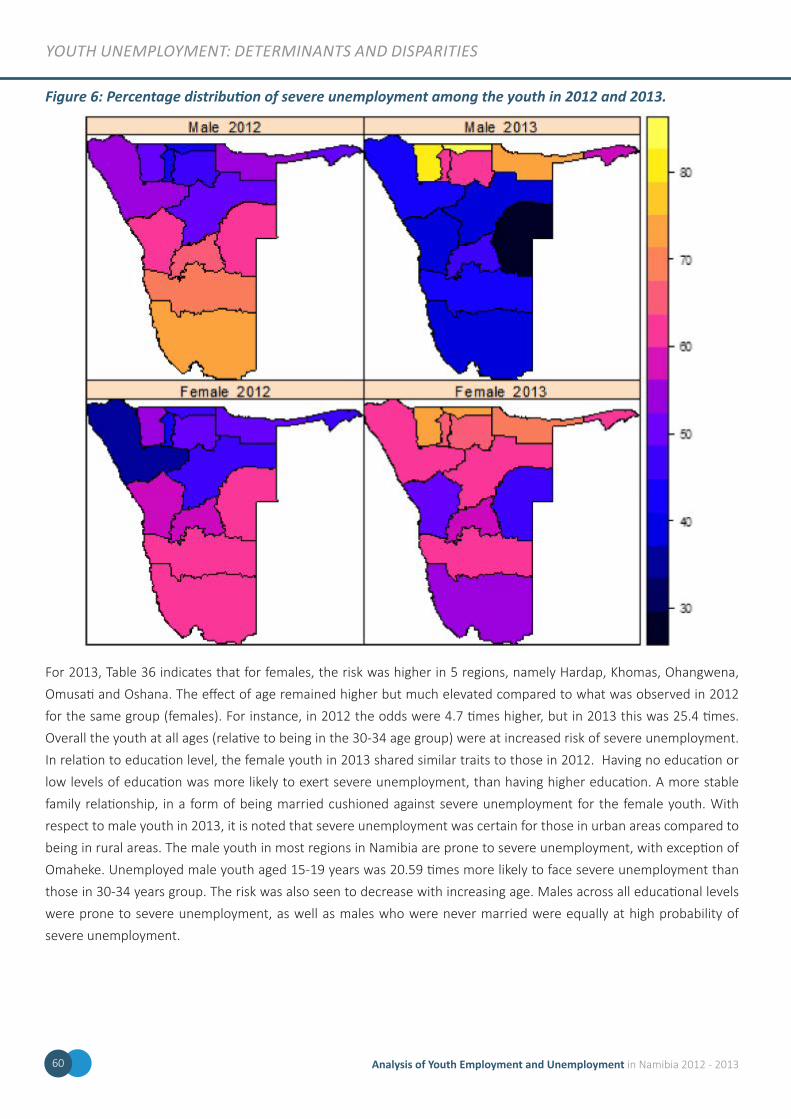
youtH unEmPloymEnt: dEtErminants and disParitiEs
Figure 6: Percentage distribution of severe unemployment among the youth in 2012 and 2013.
For 2013, Table 36 indicates that for females, the risk was higher in 5 regions, namely Hardap, Khomas, Ohangwena,
Omusati and Oshana. The effect of age remained higher but much elevated compared to what was observed in 2012
for the same group (females). For instance, in 2012 the odds were 4.7 times higher, but in 2013 this was 25.4 times.
Overall the youth at all ages (relative to being in the 30-34 age group) were at increased risk of severe unemployment.
In relation to education level, the female youth in 2013 shared similar traits to those in 2012. Having no education or
low levels of education was more likely to exert severe unemployment, than having higher education. A more stable
family relationship, in a form of being married cushioned against severe unemployment for the female youth. With
respect to male youth in 2013, it is noted that severe unemployment was certain for those in urban areas compared to
being in rural areas. The male youth in most regions in Namibia are prone to severe unemployment, with exception of
Omaheke. Unemployed male youth aged 15-19 years was 20.59 times more likely to face severe unemployment than
those in 30-34 years group. The risk was also seen to decrease with increasing age. Males across all educational levels
were prone to severe unemployment, as well as males who were never married were equally at high probability of
severe unemployment.
Analysis of Youth Employment and Unemployment in Namibia 2012 - 201360
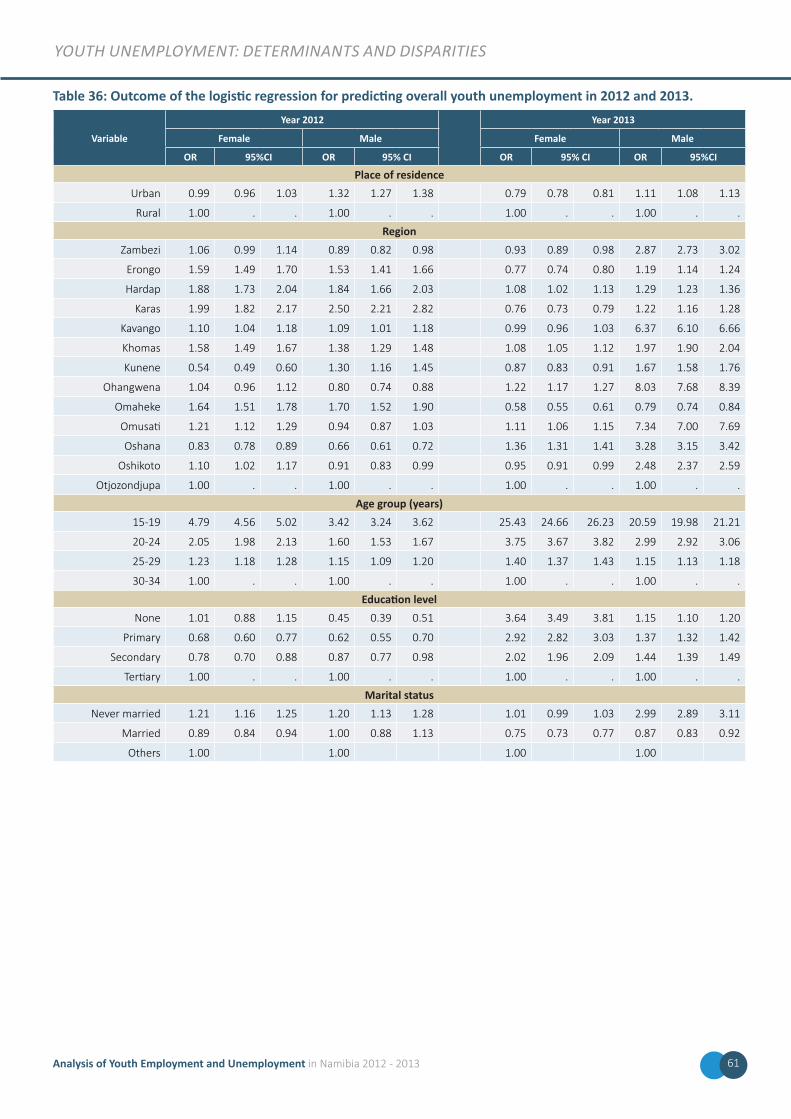
youtH unEmPloymEnt: dEtErminants and disParitiEs
Table 36: Outcome of the logistic regression for predicting overall youth unemployment in 2012 and 2013.
Variable
Year 2012 Year 2013
Female Male Female Male
OR 95%CI OR 95% CI OR 95% CI OR 95%CI
Place of residenceUrban 0.99 0.96 1.03 1.32 1.27 1.38 0.79 0.78 0.81 1.11 1.08 1.13
Rural 1.00 . . 1.00 . . 1.00 . . 1.00 . .
RegionZambezi 1.06 0.99 1.14 0.89 0.82 0.98 0.93 0.89 0.98 2.87 2.73 3.02
Erongo 1.59 1.49 1.70 1.53 1.41 1.66 0.77 0.74 0.80 1.19 1.14 1.24
Hardap 1.88 1.73 2.04 1.84 1.66 2.03 1.08 1.02 1.13 1.29 1.23 1.36
Karas 1.99 1.82 2.17 2.50 2.21 2.82 0.76 0.73 0.79 1.22 1.16 1.28
Kavango 1.10 1.04 1.18 1.09 1.01 1.18 0.99 0.96 1.03 6.37 6.10 6.66
Khomas 1.58 1.49 1.67 1.38 1.29 1.48 1.08 1.05 1.12 1.97 1.90 2.04
Kunene 0.54 0.49 0.60 1.30 1.16 1.45 0.87 0.83 0.91 1.67 1.58 1.76
Ohangwena 1.04 0.96 1.12 0.80 0.74 0.88 1.22 1.17 1.27 8.03 7.68 8.39
Omaheke 1.64 1.51 1.78 1.70 1.52 1.90 0.58 0.55 0.61 0.79 0.74 0.84
Omusati 1.21 1.12 1.29 0.94 0.87 1.03 1.11 1.06 1.15 7.34 7.00 7.69
Oshana 0.83 0.78 0.89 0.66 0.61 0.72 1.36 1.31 1.41 3.28 3.15 3.42
Oshikoto 1.10 1.02 1.17 0.91 0.83 0.99 0.95 0.91 0.99 2.48 2.37 2.59
Otjozondjupa 1.00 . . 1.00 . . 1.00 . . 1.00 . .
Age group (years)15-19 4.79 4.56 5.02 3.42 3.24 3.62 25.43 24.66 26.23 20.59 19.98 21.21
20-24 2.05 1.98 2.13 1.60 1.53 1.67 3.75 3.67 3.82 2.99 2.92 3.06
25-29 1.23 1.18 1.28 1.15 1.09 1.20 1.40 1.37 1.43 1.15 1.13 1.18
30-34 1.00 . . 1.00 . . 1.00 . . 1.00 . .
Education levelNone 1.01 0.88 1.15 0.45 0.39 0.51 3.64 3.49 3.81 1.15 1.10 1.20
Primary 0.68 0.60 0.77 0.62 0.55 0.70 2.92 2.82 3.03 1.37 1.32 1.42
Secondary 0.78 0.70 0.88 0.87 0.77 0.98 2.02 1.96 2.09 1.44 1.39 1.49
Tertiary 1.00 . . 1.00 . . 1.00 . . 1.00 . .
Marital statusNever married 1.21 1.16 1.25 1.20 1.13 1.28 1.01 0.99 1.03 2.99 2.89 3.11
Married 0.89 0.84 0.94 1.00 0.88 1.13 0.75 0.73 0.77 0.87 0.83 0.92
Others 1.00 1.00 1.00 1.00
61Analysis of Youth Employment and Unemployment in Namibia 2012 - 2013
CHAPTER 5: MEASURING SKILLS MISMATCH IN NAMIBIA BETWEEN 2012 AND 2013
5.1. IntroductionThe skills mismatch refers to the poor incongruence or incompatibility between skills needs of the labour market and
the supply of skills coming from educational institutions (ETF, 2012; ILO, 2015). The mismatch is often given as an
explanation for high youth unemployment rates in the world. The issue of skills mismatch has come to the fore following
the global economic crisis of 2008-2009 (ILO, 2015), nevertheless skills mismatch are always present due to the rigidities
in the labour market (ETF, 2012). Measuring skills mismatch has been an on-going area of research. Presently, there
are no internationally agreed methods to measure skills mismatch, but all measures encompass imbalances between
skills demanded and supplied. Mismatch can be measured along several axes, using proxies such as qualifications, years
of schooling and occupations. Qualification is a formal recognition of someone possessing a given set of skills. It is
therefore construed that one spending more years at school should have obtained more skills, and similarly someone in
a high-skilled non-manual occupation group can be interpreted to possess a given skills set.
The most fundamental distinction of mismatch are, first, under-education and over-education, in which an under-
educated person does not possess skills required for a given job, while an over-educated person is someone who has
skills beyond what is required for the position at hand. Second, mismatch can be distinguished between horizontal and
vertical mismatch. According to the European Training Foundation (2012), a vertical mismatch occurs when there is a
discrepancy between the levels of education which a person has, and the requirements of the job held by the person.
A horizontal mismatch, in contrast, refers to disparities between types of skills which the person has attained and the
requirements of the job. Put differently, vertical skills mismatch can be defined as “does the person have right skills for
the job?”, and horizontal mismatch can be put as “is the job right for the skills the person has?”
The extent of skills mismatch in the Namibian labour market is unknown. This chapter aims to describe the skills
mismatch among the youth in Namibia using five measures: (a) coefficient of variation, (b) proportions of unemployed
versus employed, (c) variance of relative unemployment rates, (d) mismatch by occupation, and (e) relative wages by
education levels.
5.2. Coefficient of variationThis is an index of dissimilarity and captures mismatch between skills demand (defined by the skills of the employed)
and skills supply (defined by the skills of the unemployed). The skills in each group is proxied by education attainment,
and is defined as (ILO, 2015):
1
2cvar = ∑ k E
E
u
ui = 1
i i
where i is an indicator of education level (none, primary, secondary or tertiary); Ei/E is the proportion employed and
Ui /U is the proportion unemployed with education level i. The index measures the relative position of different labour
market groups. Put differently, the index looks at the difference in the distribution of those employed and unemployed
within respective education groups. The higher the number, the greater the difference between the skills possessed by
the employed people and the skills of those unemployed. Accordingly, the extent to which the distributions are different
can be interpreted as a measure of ineffectiveness caused by the mismatch of supply and demand of skills in the labour
market.
62 Analysis of Youth Employment and Unemployment in Namibia 2012 - 2013
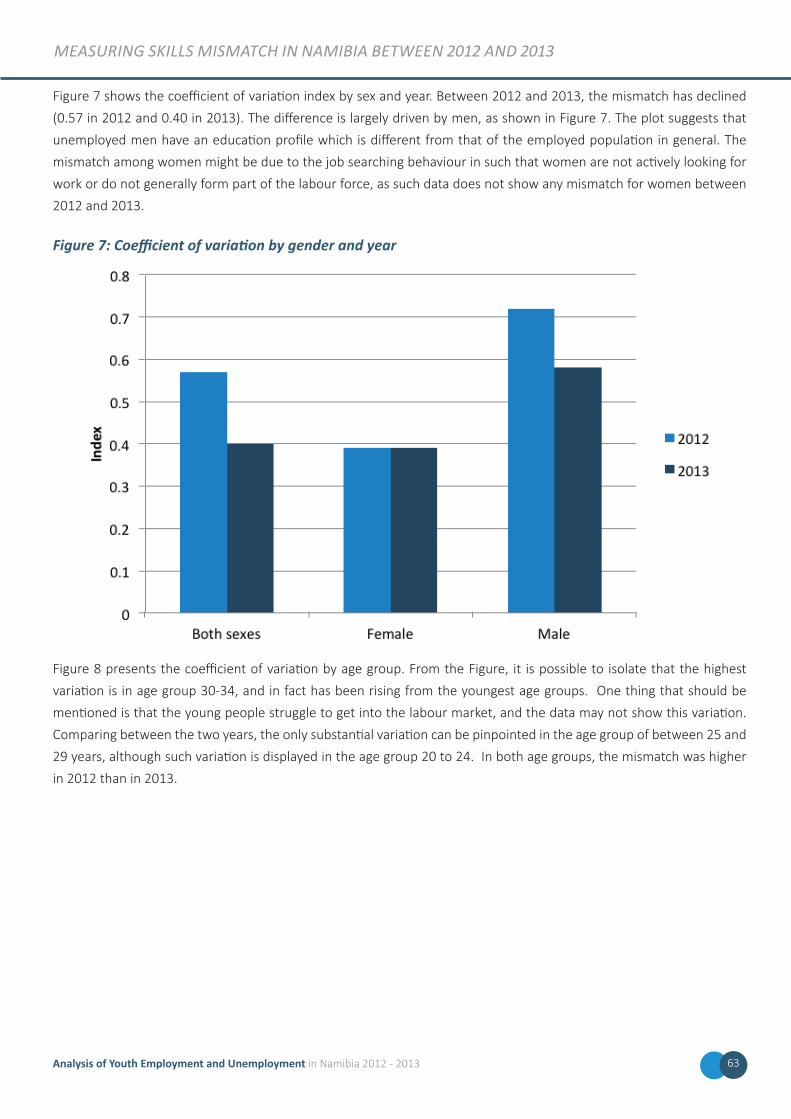
mEasurinG skills mismatcH in namibia bEtwEEn 2012 and 2013
Figure 7 shows the coefficient of variation index by sex and year. Between 2012 and 2013, the mismatch has declined
(0.57 in 2012 and 0.40 in 2013). The difference is largely driven by men, as shown in Figure 7. The plot suggests that
unemployed men have an education profile which is different from that of the employed population in general. The
mismatch among women might be due to the job searching behaviour in such that women are not actively looking for
work or do not generally form part of the labour force, as such data does not show any mismatch for women between
2012 and 2013.
Figure 7: Coefficient of variation by gender and year
Figure 8 presents the coefficient of variation by age group. From the Figure, it is possible to isolate that the highest
variation is in age group 30-34, and in fact has been rising from the youngest age groups. One thing that should be
mentioned is that the young people struggle to get into the labour market, and the data may not show this variation.
Comparing between the two years, the only substantial variation can be pinpointed in the age group of between 25 and
29 years, although such variation is displayed in the age group 20 to 24. In both age groups, the mismatch was higher
in 2012 than in 2013.
63Analysis of Youth Employment and Unemployment in Namibia 2012 - 2013
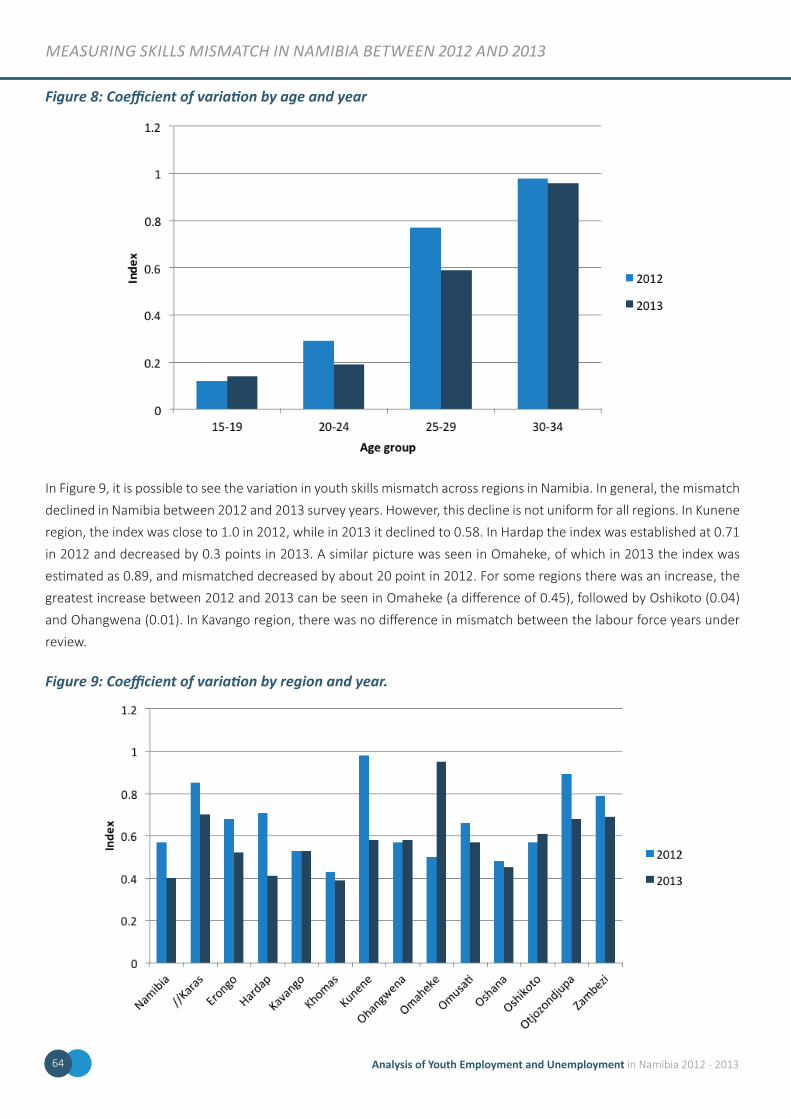
mEasurinG skills mismatcH in namibia bEtwEEn 2012 and 2013
Figure 8: Coefficient of variation by age and year
In Figure 9, it is possible to see the variation in youth skills mismatch across regions in Namibia. In general, the mismatch
declined in Namibia between 2012 and 2013 survey years. However, this decline is not uniform for all regions. In Kunene
region, the index was close to 1.0 in 2012, while in 2013 it declined to 0.58. In Hardap the index was established at 0.71
in 2012 and decreased by 0.3 points in 2013. A similar picture was seen in Omaheke, of which in 2013 the index was
estimated as 0.89, and mismatched decreased by about 20 point in 2012. For some regions there was an increase, the
greatest increase between 2012 and 2013 can be seen in Omaheke (a difference of 0.45), followed by Oshikoto (0.04)
and Ohangwena (0.01). In Kavango region, there was no difference in mismatch between the labour force years under
review.
Figure 9: Coefficient of variation by region and year.
Analysis of Youth Employment and Unemployment in Namibia 2012 - 201364
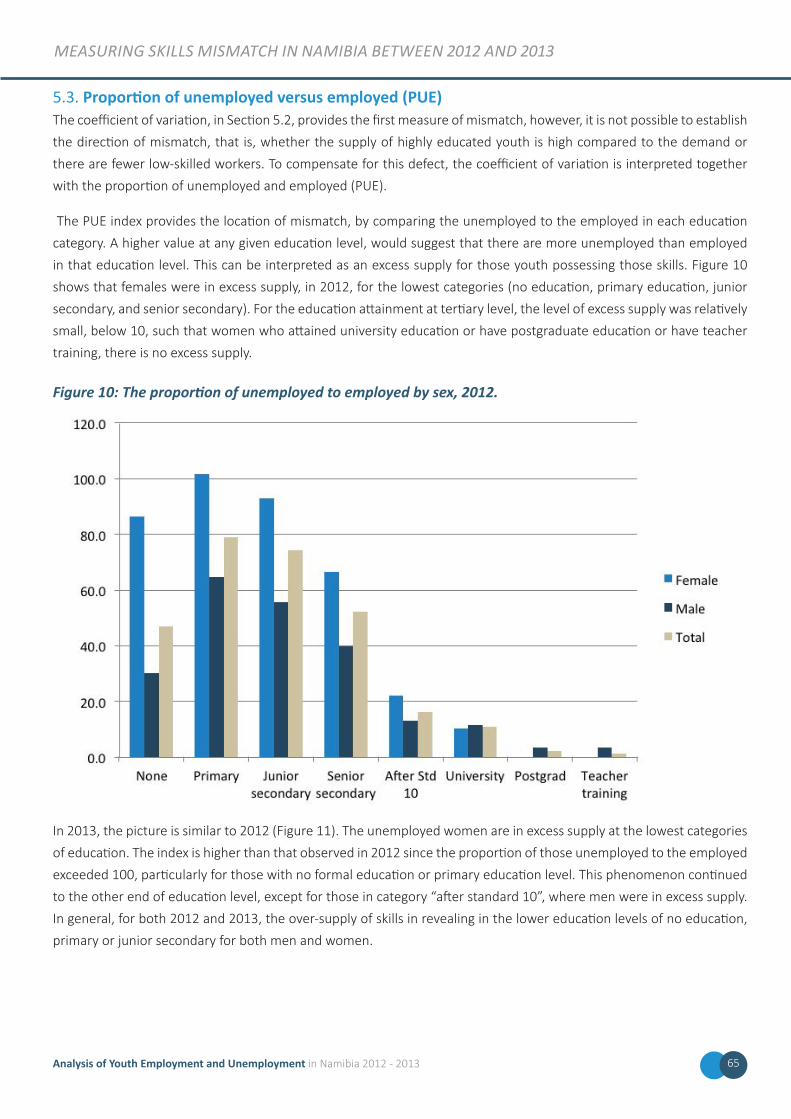
mEasurinG skills mismatcH in namibia bEtwEEn 2012 and 2013
5.3. Proportion of unemployed versus employed (PUE)The coefficient of variation, in Section 5.2, provides the first measure of mismatch, however, it is not possible to establish
the direction of mismatch, that is, whether the supply of highly educated youth is high compared to the demand or
there are fewer low-skilled workers. To compensate for this defect, the coefficient of variation is interpreted together
with the proportion of unemployed and employed (PUE).
The PUE index provides the location of mismatch, by comparing the unemployed to the employed in each education
category. A higher value at any given education level, would suggest that there are more unemployed than employed
in that education level. This can be interpreted as an excess supply for those youth possessing those skills. Figure 10
shows that females were in excess supply, in 2012, for the lowest categories (no education, primary education, junior
secondary, and senior secondary). For the education attainment at tertiary level, the level of excess supply was relatively
small, below 10, such that women who attained university education or have postgraduate education or have teacher
training, there is no excess supply.
Figure 10: The proportion of unemployed to employed by sex, 2012.
In 2013, the picture is similar to 2012 (Figure 11). The unemployed women are in excess supply at the lowest categories
of education. The index is higher than that observed in 2012 since the proportion of those unemployed to the employed
exceeded 100, particularly for those with no formal education or primary education level. This phenomenon continued
to the other end of education level, except for those in category “after standard 10”, where men were in excess supply.
In general, for both 2012 and 2013, the over-supply of skills in revealing in the lower education levels of no education,
primary or junior secondary for both men and women.
65Analysis of Youth Employment and Unemployment in Namibia 2012 - 2013
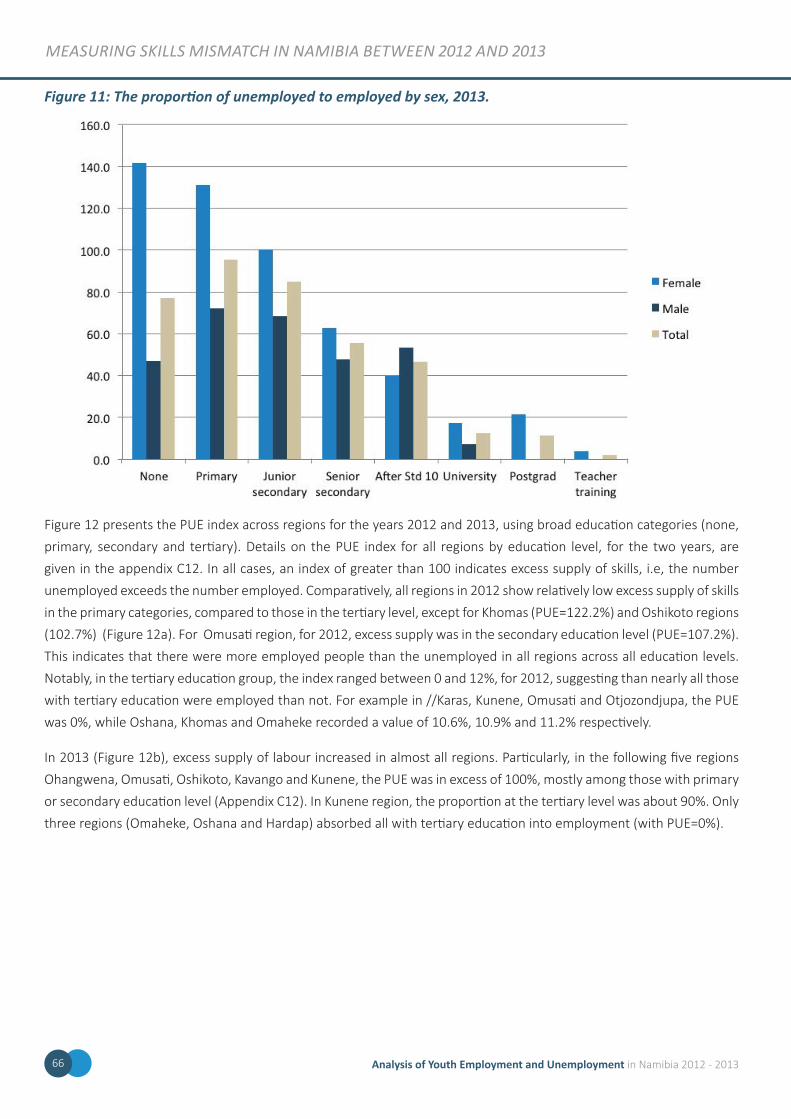
mEasurinG skills mismatcH in namibia bEtwEEn 2012 and 2013
Figure 11: The proportion of unemployed to employed by sex, 2013.
Figure 12 presents the PUE index across regions for the years 2012 and 2013, using broad education categories (none,
primary, secondary and tertiary). Details on the PUE index for all regions by education level, for the two years, are
given in the appendix C12. In all cases, an index of greater than 100 indicates excess supply of skills, i.e, the number
unemployed exceeds the number employed. Comparatively, all regions in 2012 show relatively low excess supply of skills
in the primary categories, compared to those in the tertiary level, except for Khomas (PUE=122.2%) and Oshikoto regions
(102.7%) (Figure 12a). For Omusati region, for 2012, excess supply was in the secondary education level (PUE=107.2%).
This indicates that there were more employed people than the unemployed in all regions across all education levels.
Notably, in the tertiary education group, the index ranged between 0 and 12%, for 2012, suggesting than nearly all those
with tertiary education were employed than not. For example in //Karas, Kunene, Omusati and Otjozondjupa, the PUE
was 0%, while Oshana, Khomas and Omaheke recorded a value of 10.6%, 10.9% and 11.2% respectively.
In 2013 (Figure 12b), excess supply of labour increased in almost all regions. Particularly, in the following five regions
Ohangwena, Omusati, Oshikoto, Kavango and Kunene, the PUE was in excess of 100%, mostly among those with primary
or secondary education level (Appendix C12). In Kunene region, the proportion at the tertiary level was about 90%. Only
three regions (Omaheke, Oshana and Hardap) absorbed all with tertiary education into employment (with PUE=0%).
Analysis of Youth Employment and Unemployment in Namibia 2012 - 201366
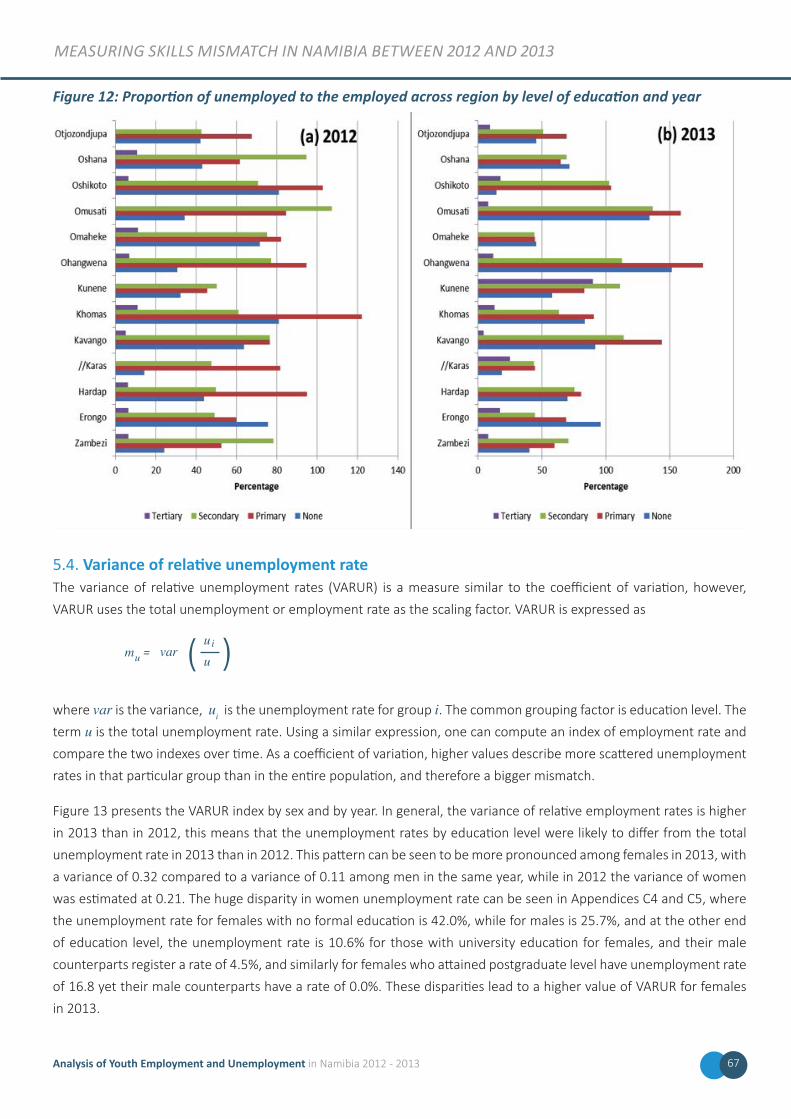
mEasurinG skills mismatcH in namibia bEtwEEn 2012 and 2013
Figure 12: Proportion of unemployed to the employed across region by level of education and year
5.4. Variance of relative unemployment rateThe variance of relative unemployment rates (VARUR) is a measure similar to the coefficient of variation, however,
VARUR uses the total unemployment or employment rate as the scaling factor. VARUR is expressed as
m = ( uuu
i )var
where var is the variance, ui is the unemployment rate for group i. The common grouping factor is education level. The
term u is the total unemployment rate. Using a similar expression, one can compute an index of employment rate and
compare the two indexes over time. As a coefficient of variation, higher values describe more scattered unemployment
rates in that particular group than in the entire population, and therefore a bigger mismatch.
Figure 13 presents the VARUR index by sex and by year. In general, the variance of relative employment rates is higher
in 2013 than in 2012, this means that the unemployment rates by education level were likely to differ from the total
unemployment rate in 2013 than in 2012. This pattern can be seen to be more pronounced among females in 2013, with
a variance of 0.32 compared to a variance of 0.11 among men in the same year, while in 2012 the variance of women
was estimated at 0.21. The huge disparity in women unemployment rate can be seen in Appendices C4 and C5, where
the unemployment rate for females with no formal education is 42.0%, while for males is 25.7%, and at the other end
of education level, the unemployment rate is 10.6% for those with university education for females, and their male
counterparts register a rate of 4.5%, and similarly for females who attained postgraduate level have unemployment rate
of 16.8 yet their male counterparts have a rate of 0.0%. These disparities lead to a higher value of VARUR for females
in 2013.
67Analysis of Youth Employment and Unemployment in Namibia 2012 - 2013
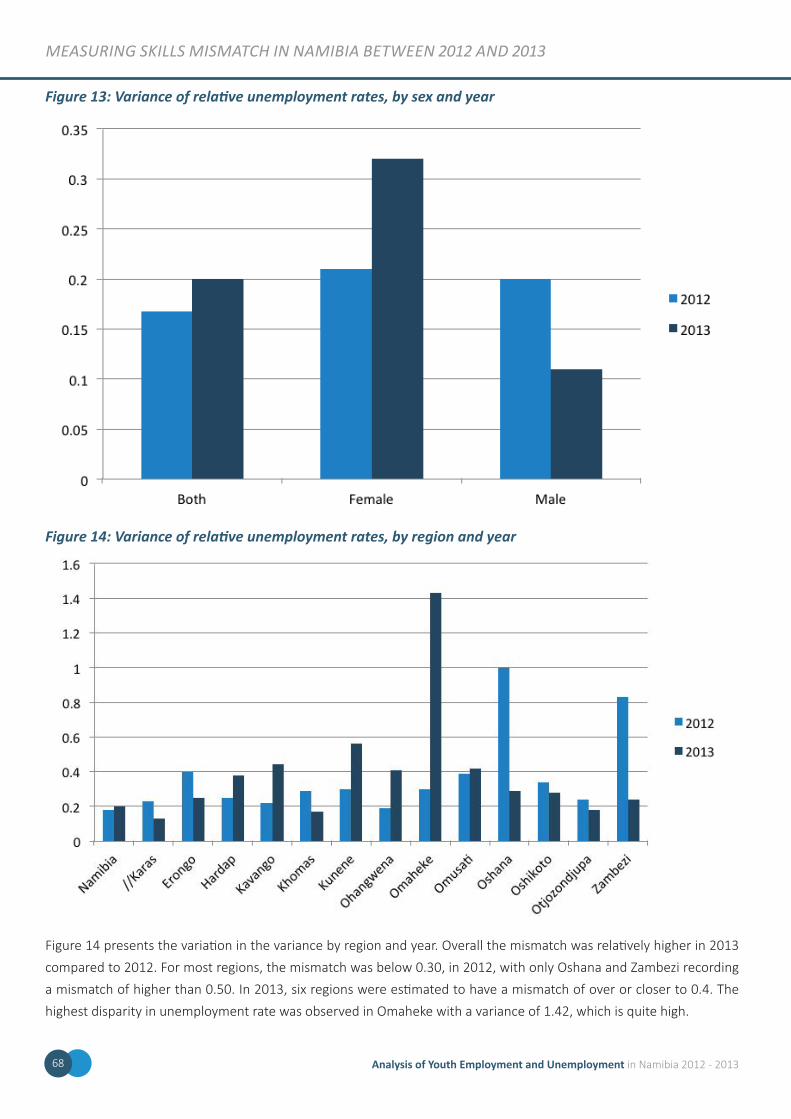
mEasurinG skills mismatcH in namibia bEtwEEn 2012 and 2013
Figure 13: Variance of relative unemployment rates, by sex and year
Figure 14: Variance of relative unemployment rates, by region and year
Figure 14 presents the variation in the variance by region and year. Overall the mismatch was relatively higher in 2013
compared to 2012. For most regions, the mismatch was below 0.30, in 2012, with only Oshana and Zambezi recording
a mismatch of higher than 0.50. In 2013, six regions were estimated to have a mismatch of over or closer to 0.4. The
highest disparity in unemployment rate was observed in Omaheke with a variance of 1.42, which is quite high.
Analysis of Youth Employment and Unemployment in Namibia 2012 - 201368
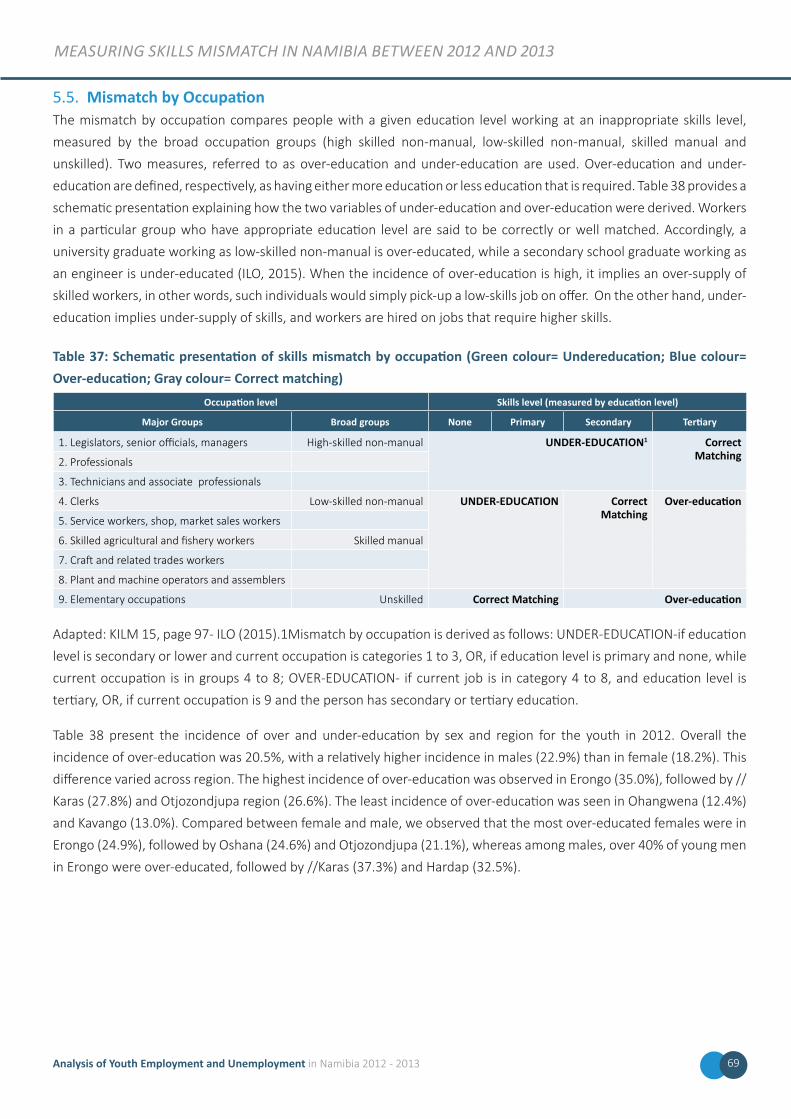
mEasurinG skills mismatcH in namibia bEtwEEn 2012 and 2013
5.5. Mismatch by OccupationThe mismatch by occupation compares people with a given education level working at an inappropriate skills level,
measured by the broad occupation groups (high skilled non-manual, low-skilled non-manual, skilled manual and
unskilled). Two measures, referred to as over-education and under-education are used. Over-education and under-
education are defined, respectively, as having either more education or less education that is required. Table 38 provides a
schematic presentation explaining how the two variables of under-education and over-education were derived. Workers
in a particular group who have appropriate education level are said to be correctly or well matched. Accordingly, a
university graduate working as low-skilled non-manual is over-educated, while a secondary school graduate working as
an engineer is under-educated (ILO, 2015). When the incidence of over-education is high, it implies an over-supply of
skilled workers, in other words, such individuals would simply pick-up a low-skills job on offer. On the other hand, under-
education implies under-supply of skills, and workers are hired on jobs that require higher skills.
Table 37: Schematic presentation of skills mismatch by occupation (Green colour= Undereducation; Blue colour= Over-education; Gray colour= Correct matching)
Occupation level Skills level (measured by education level)
Major Groups Broad groups None Primary Secondary Tertiary
1. Legislators, senior officials, managers High-skilled non-manual UNDER-EDUCATION1 Correct Matching2. Professionals
3. Technicians and associate professionals
4. Clerks Low-skilled non-manual UNDER-EDUCATION Correct Matching
Over-education
5. Service workers, shop, market sales workers
6. Skilled agricultural and fishery workers Skilled manual
7. Craft and related trades workers
8. Plant and machine operators and assemblers
9. Elementary occupations Unskilled Correct Matching Over-education
Adapted: KILM 15, page 97- ILO (2015).1Mismatch by occupation is derived as follows: UNDER-EDUCATION-if education
level is secondary or lower and current occupation is categories 1 to 3, OR, if education level is primary and none, while
current occupation is in groups 4 to 8; OVER-EDUCATION- if current job is in category 4 to 8, and education level is
tertiary, OR, if current occupation is 9 and the person has secondary or tertiary education.
Table 38 present the incidence of over and under-education by sex and region for the youth in 2012. Overall the
incidence of over-education was 20.5%, with a relatively higher incidence in males (22.9%) than in female (18.2%). This
difference varied across region. The highest incidence of over-education was observed in Erongo (35.0%), followed by //
Karas (27.8%) and Otjozondjupa region (26.6%). The least incidence of over-education was seen in Ohangwena (12.4%)
and Kavango (13.0%). Compared between female and male, we observed that the most over-educated females were in
Erongo (24.9%), followed by Oshana (24.6%) and Otjozondjupa (21.1%), whereas among males, over 40% of young men
in Erongo were over-educated, followed by //Karas (37.3%) and Hardap (32.5%).
69Analysis of Youth Employment and Unemployment in Namibia 2012 - 2013
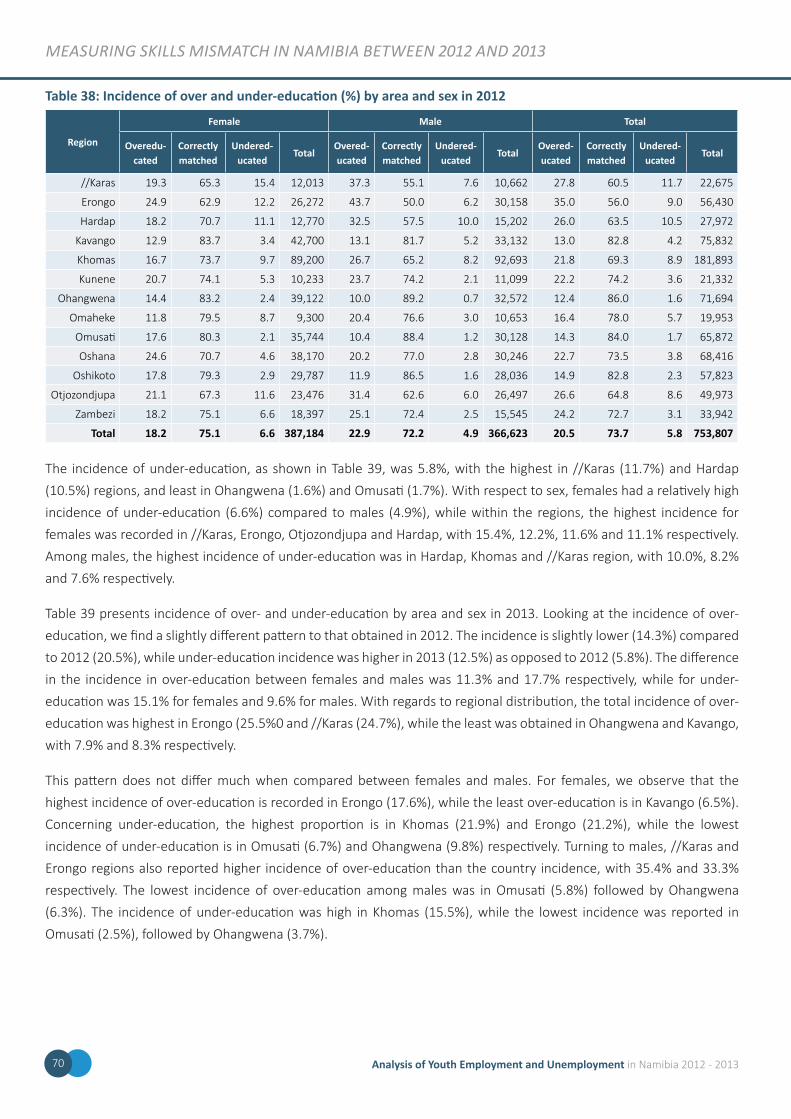
mEasurinG skills mismatcH in namibia bEtwEEn 2012 and 2013
Table 38: Incidence of over and under-education (%) by area and sex in 2012
Region
Female Male Total
Overedu-cated
Correctly matched
Undered-ucated
TotalOvered-ucated
Correctly matched
Undered-ucated
TotalOvered-ucated
Correctly matched
Undered-ucated
Total
//Karas 19.3 65.3 15.4 12,013 37.3 55.1 7.6 10,662 27.8 60.5 11.7 22,675
Erongo 24.9 62.9 12.2 26,272 43.7 50.0 6.2 30,158 35.0 56.0 9.0 56,430
Hardap 18.2 70.7 11.1 12,770 32.5 57.5 10.0 15,202 26.0 63.5 10.5 27,972
Kavango 12.9 83.7 3.4 42,700 13.1 81.7 5.2 33,132 13.0 82.8 4.2 75,832
Khomas 16.7 73.7 9.7 89,200 26.7 65.2 8.2 92,693 21.8 69.3 8.9 181,893
Kunene 20.7 74.1 5.3 10,233 23.7 74.2 2.1 11,099 22.2 74.2 3.6 21,332
Ohangwena 14.4 83.2 2.4 39,122 10.0 89.2 0.7 32,572 12.4 86.0 1.6 71,694
Omaheke 11.8 79.5 8.7 9,300 20.4 76.6 3.0 10,653 16.4 78.0 5.7 19,953
Omusati 17.6 80.3 2.1 35,744 10.4 88.4 1.2 30,128 14.3 84.0 1.7 65,872
Oshana 24.6 70.7 4.6 38,170 20.2 77.0 2.8 30,246 22.7 73.5 3.8 68,416
Oshikoto 17.8 79.3 2.9 29,787 11.9 86.5 1.6 28,036 14.9 82.8 2.3 57,823
Otjozondjupa 21.1 67.3 11.6 23,476 31.4 62.6 6.0 26,497 26.6 64.8 8.6 49,973
Zambezi 18.2 75.1 6.6 18,397 25.1 72.4 2.5 15,545 24.2 72.7 3.1 33,942
Total 18.2 75.1 6.6 387,184 22.9 72.2 4.9 366,623 20.5 73.7 5.8 753,807
The incidence of under-education, as shown in Table 39, was 5.8%, with the highest in //Karas (11.7%) and Hardap
(10.5%) regions, and least in Ohangwena (1.6%) and Omusati (1.7%). With respect to sex, females had a relatively high
incidence of under-education (6.6%) compared to males (4.9%), while within the regions, the highest incidence for
females was recorded in //Karas, Erongo, Otjozondjupa and Hardap, with 15.4%, 12.2%, 11.6% and 11.1% respectively.
Among males, the highest incidence of under-education was in Hardap, Khomas and //Karas region, with 10.0%, 8.2%
and 7.6% respectively.
Table 39 presents incidence of over- and under-education by area and sex in 2013. Looking at the incidence of over-
education, we find a slightly different pattern to that obtained in 2012. The incidence is slightly lower (14.3%) compared
to 2012 (20.5%), while under-education incidence was higher in 2013 (12.5%) as opposed to 2012 (5.8%). The difference
in the incidence in over-education between females and males was 11.3% and 17.7% respectively, while for under-
education was 15.1% for females and 9.6% for males. With regards to regional distribution, the total incidence of over-
education was highest in Erongo (25.5%0 and //Karas (24.7%), while the least was obtained in Ohangwena and Kavango,
with 7.9% and 8.3% respectively.
This pattern does not differ much when compared between females and males. For females, we observe that the
highest incidence of over-education is recorded in Erongo (17.6%), while the least over-education is in Kavango (6.5%).
Concerning under-education, the highest proportion is in Khomas (21.9%) and Erongo (21.2%), while the lowest
incidence of under-education is in Omusati (6.7%) and Ohangwena (9.8%) respectively. Turning to males, //Karas and
Erongo regions also reported higher incidence of over-education than the country incidence, with 35.4% and 33.3%
respectively. The lowest incidence of over-education among males was in Omusati (5.8%) followed by Ohangwena
(6.3%). The incidence of under-education was high in Khomas (15.5%), while the lowest incidence was reported in
Omusati (2.5%), followed by Ohangwena (3.7%).
Analysis of Youth Employment and Unemployment in Namibia 2012 - 201370
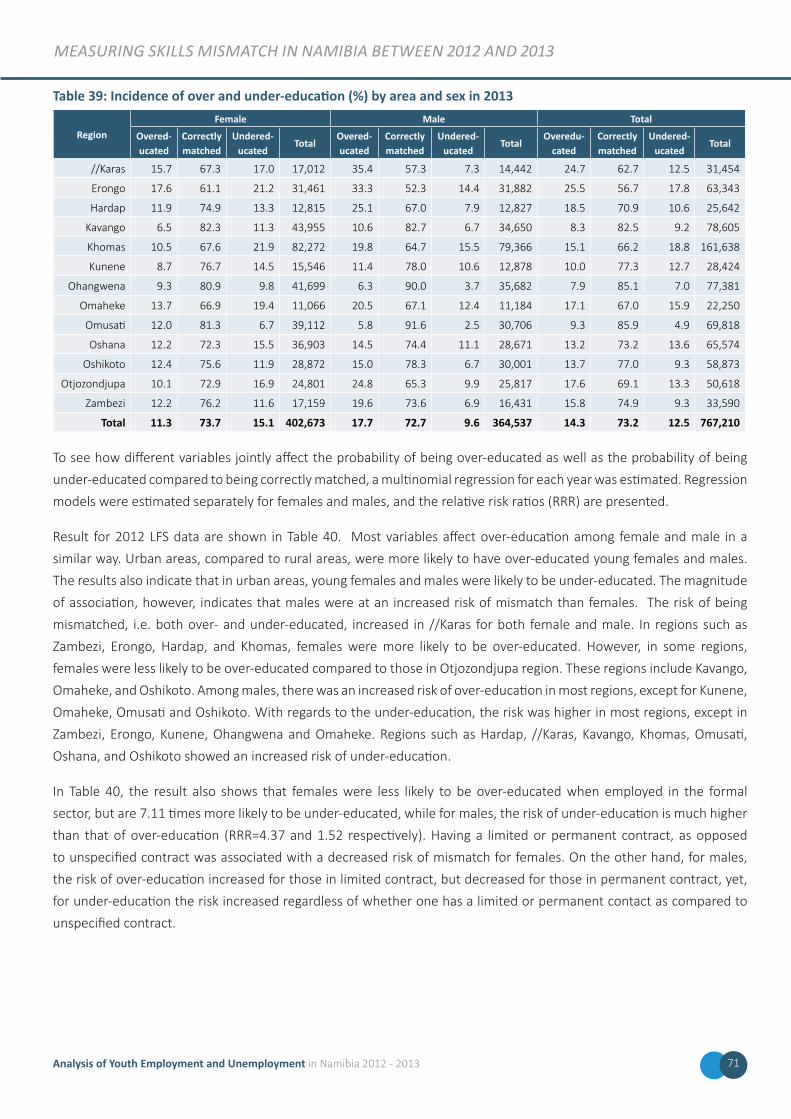
mEasurinG skills mismatcH in namibia bEtwEEn 2012 and 2013
Table 39: Incidence of over and under-education (%) by area and sex in 2013
RegionFemale Male Total
Overed-ucated
Correctly matched
Undered-ucated
TotalOvered-ucated
Correctly matched
Undered-ucated
TotalOveredu-
catedCorrectly matched
Undered-ucated
Total
//Karas 15.7 67.3 17.0 17,012 35.4 57.3 7.3 14,442 24.7 62.7 12.5 31,454
Erongo 17.6 61.1 21.2 31,461 33.3 52.3 14.4 31,882 25.5 56.7 17.8 63,343
Hardap 11.9 74.9 13.3 12,815 25.1 67.0 7.9 12,827 18.5 70.9 10.6 25,642
Kavango 6.5 82.3 11.3 43,955 10.6 82.7 6.7 34,650 8.3 82.5 9.2 78,605
Khomas 10.5 67.6 21.9 82,272 19.8 64.7 15.5 79,366 15.1 66.2 18.8 161,638
Kunene 8.7 76.7 14.5 15,546 11.4 78.0 10.6 12,878 10.0 77.3 12.7 28,424
Ohangwena 9.3 80.9 9.8 41,699 6.3 90.0 3.7 35,682 7.9 85.1 7.0 77,381
Omaheke 13.7 66.9 19.4 11,066 20.5 67.1 12.4 11,184 17.1 67.0 15.9 22,250
Omusati 12.0 81.3 6.7 39,112 5.8 91.6 2.5 30,706 9.3 85.9 4.9 69,818
Oshana 12.2 72.3 15.5 36,903 14.5 74.4 11.1 28,671 13.2 73.2 13.6 65,574
Oshikoto 12.4 75.6 11.9 28,872 15.0 78.3 6.7 30,001 13.7 77.0 9.3 58,873
Otjozondjupa 10.1 72.9 16.9 24,801 24.8 65.3 9.9 25,817 17.6 69.1 13.3 50,618
Zambezi 12.2 76.2 11.6 17,159 19.6 73.6 6.9 16,431 15.8 74.9 9.3 33,590
Total 11.3 73.7 15.1 402,673 17.7 72.7 9.6 364,537 14.3 73.2 12.5 767,210
To see how different variables jointly affect the probability of being over-educated as well as the probability of being
under-educated compared to being correctly matched, a multinomial regression for each year was estimated. Regression
models were estimated separately for females and males, and the relative risk ratios (RRR) are presented.
Result for 2012 LFS data are shown in Table 40. Most variables affect over-education among female and male in a
similar way. Urban areas, compared to rural areas, were more likely to have over-educated young females and males.
The results also indicate that in urban areas, young females and males were likely to be under-educated. The magnitude
of association, however, indicates that males were at an increased risk of mismatch than females. The risk of being
mismatched, i.e. both over- and under-educated, increased in //Karas for both female and male. In regions such as
Zambezi, Erongo, Hardap, and Khomas, females were more likely to be over-educated. However, in some regions,
females were less likely to be over-educated compared to those in Otjozondjupa region. These regions include Kavango,
Omaheke, and Oshikoto. Among males, there was an increased risk of over-education in most regions, except for Kunene,
Omaheke, Omusati and Oshikoto. With regards to the under-education, the risk was higher in most regions, except in
Zambezi, Erongo, Kunene, Ohangwena and Omaheke. Regions such as Hardap, //Karas, Kavango, Khomas, Omusati,
Oshana, and Oshikoto showed an increased risk of under-education.
In Table 40, the result also shows that females were less likely to be over-educated when employed in the formal
sector, but are 7.11 times more likely to be under-educated, while for males, the risk of under-education is much higher
than that of over-education (RRR=4.37 and 1.52 respectively). Having a limited or permanent contract, as opposed
to unspecified contract was associated with a decreased risk of mismatch for females. On the other hand, for males,
the risk of over-education increased for those in limited contract, but decreased for those in permanent contract, yet,
for under-education the risk increased regardless of whether one has a limited or permanent contact as compared to
unspecified contract.
71Analysis of Youth Employment and Unemployment in Namibia 2012 - 2013
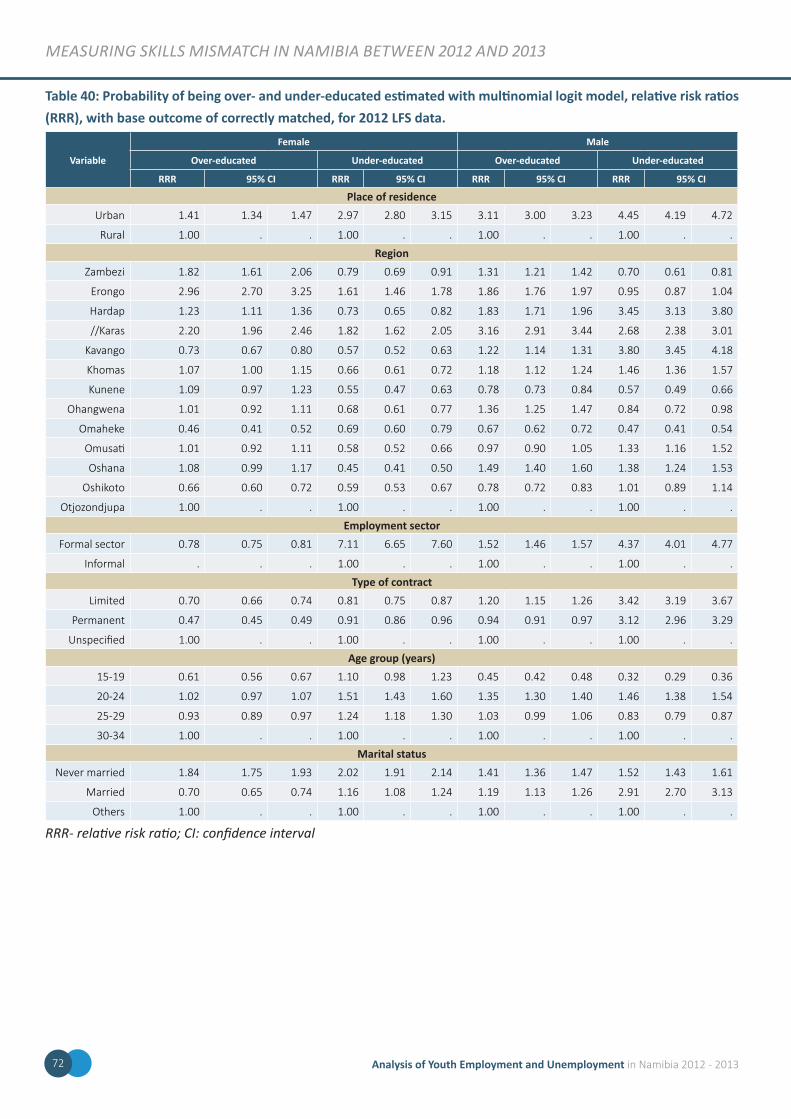
mEasurinG skills mismatcH in namibia bEtwEEn 2012 and 2013
Table 40: Probability of being over- and under-educated estimated with multinomial logit model, relative risk ratios (RRR), with base outcome of correctly matched, for 2012 LFS data.
Variable
Female Male
Over-educated Under-educated Over-educated Under-educated
RRR 95% CI RRR 95% CI RRR 95% CI RRR 95% CI
Place of residenceUrban 1.41 1.34 1.47 2.97 2.80 3.15 3.11 3.00 3.23 4.45 4.19 4.72
Rural 1.00 . . 1.00 . . 1.00 . . 1.00 . .
RegionZambezi 1.82 1.61 2.06 0.79 0.69 0.91 1.31 1.21 1.42 0.70 0.61 0.81
Erongo 2.96 2.70 3.25 1.61 1.46 1.78 1.86 1.76 1.97 0.95 0.87 1.04
Hardap 1.23 1.11 1.36 0.73 0.65 0.82 1.83 1.71 1.96 3.45 3.13 3.80
//Karas 2.20 1.96 2.46 1.82 1.62 2.05 3.16 2.91 3.44 2.68 2.38 3.01
Kavango 0.73 0.67 0.80 0.57 0.52 0.63 1.22 1.14 1.31 3.80 3.45 4.18
Khomas 1.07 1.00 1.15 0.66 0.61 0.72 1.18 1.12 1.24 1.46 1.36 1.57
Kunene 1.09 0.97 1.23 0.55 0.47 0.63 0.78 0.73 0.84 0.57 0.49 0.66
Ohangwena 1.01 0.92 1.11 0.68 0.61 0.77 1.36 1.25 1.47 0.84 0.72 0.98
Omaheke 0.46 0.41 0.52 0.69 0.60 0.79 0.67 0.62 0.72 0.47 0.41 0.54
Omusati 1.01 0.92 1.11 0.58 0.52 0.66 0.97 0.90 1.05 1.33 1.16 1.52
Oshana 1.08 0.99 1.17 0.45 0.41 0.50 1.49 1.40 1.60 1.38 1.24 1.53
Oshikoto 0.66 0.60 0.72 0.59 0.53 0.67 0.78 0.72 0.83 1.01 0.89 1.14
Otjozondjupa 1.00 . . 1.00 . . 1.00 . . 1.00 . .
Employment sectorFormal sector 0.78 0.75 0.81 7.11 6.65 7.60 1.52 1.46 1.57 4.37 4.01 4.77
Informal . . . 1.00 . . 1.00 . . 1.00 . .
Type of contractLimited 0.70 0.66 0.74 0.81 0.75 0.87 1.20 1.15 1.26 3.42 3.19 3.67
Permanent 0.47 0.45 0.49 0.91 0.86 0.96 0.94 0.91 0.97 3.12 2.96 3.29
Unspecified 1.00 . . 1.00 . . 1.00 . . 1.00 . .
Age group (years)15-19 0.61 0.56 0.67 1.10 0.98 1.23 0.45 0.42 0.48 0.32 0.29 0.36
20-24 1.02 0.97 1.07 1.51 1.43 1.60 1.35 1.30 1.40 1.46 1.38 1.54
25-29 0.93 0.89 0.97 1.24 1.18 1.30 1.03 0.99 1.06 0.83 0.79 0.87
30-34 1.00 . . 1.00 . . 1.00 . . 1.00 . .
Marital statusNever married 1.84 1.75 1.93 2.02 1.91 2.14 1.41 1.36 1.47 1.52 1.43 1.61
Married 0.70 0.65 0.74 1.16 1.08 1.24 1.19 1.13 1.26 2.91 2.70 3.13
Others 1.00 . . 1.00 . . 1.00 . . 1.00 . .
RRR- relative risk ratio; CI: confidence interval
Analysis of Youth Employment and Unemployment in Namibia 2012 - 201372
mEasurinG skills mismatcH in namibia bEtwEEn 2012 and 2013
The risk of mismatch for both female and male showed a U-shaped nonlinear pattern with age. For over-education for
females, for example, was low in 15-19 age-group then rises to 1.02 in the age group 20-24, and dropped again to 0.93
in the age 25 to 29. With regards to under-education in the same female cohort, although the risk was high, it was also
highest in the age group of 20-24. In males, the risk of mismatch was lower for the age group of 15-19 years, but rises
sharply in the immediate age band of 20-24, with RRR=1.35 for over-education, and RRR=1.46 for under-education,
then drops in the age range of 25-29 years. A more stable family situation, as indicated by being married, is associated
with a lower probability of over-education, but a higher probability of under-education among females, while for males,
a higher risk of mismatch (this is both over-education and under-education) regardless of marital status was observed.
Table 41 gives regression coefficients of risk of mismatch for 2013 study group. The probability of mismatching was
higher for both female and male in urban areas compared to rural areas. Being in Erongo and //Karas increased the risk
of being over-educated for females, while increasing the risk of under-education for the same group. For males, on the
other hand, the risk of mismatch increased for those males in Zambezi, Erongo, Hardap, //Karas, and Oshikoto.
With regards to being in formal sector employment relative to informal sector, the risk of over-education was lower for
females but higher for males, while the risk of under-education was high for both groups. Having a permanent contract
relative to having an unspecified contract reduced the risk of over-education and under-education for females, but
for males, this applied for over-education only. However, the risk of under-education increased with males holding a
permanent contract. A limited duration contract was associated with higher probability of over-education for females
and males, but a lower risk of under-education for both groups.
Generally, the risk of mismatch was much lower for those at the lowest age (15-19 years), compared to those at 30-34
years. Mismatch of over-education was persistently lower for females, nevertheless, the pattern shows an increasing
trend with increased age. On under-education for females, the risk was higher for those aged 20-24 and 25-29 years
compared to those at age 30-34 years. For males, the risk was equally higher but showed a U-shaped pattern for
both indicators of mismatch. Being married also showed a decreased risk of mismatch for females, but only so for
over-education among males. The never married females were more likely to be over-educated (RRR=1.31) and under-
educated (RRR=1.33). This association is seen in under-educated males only (RRR=1.11), but reversed for over-education
for the same cohort (RRR=0.88).
73Analysis of Youth Employment and Unemployment in Namibia 2012 - 2013
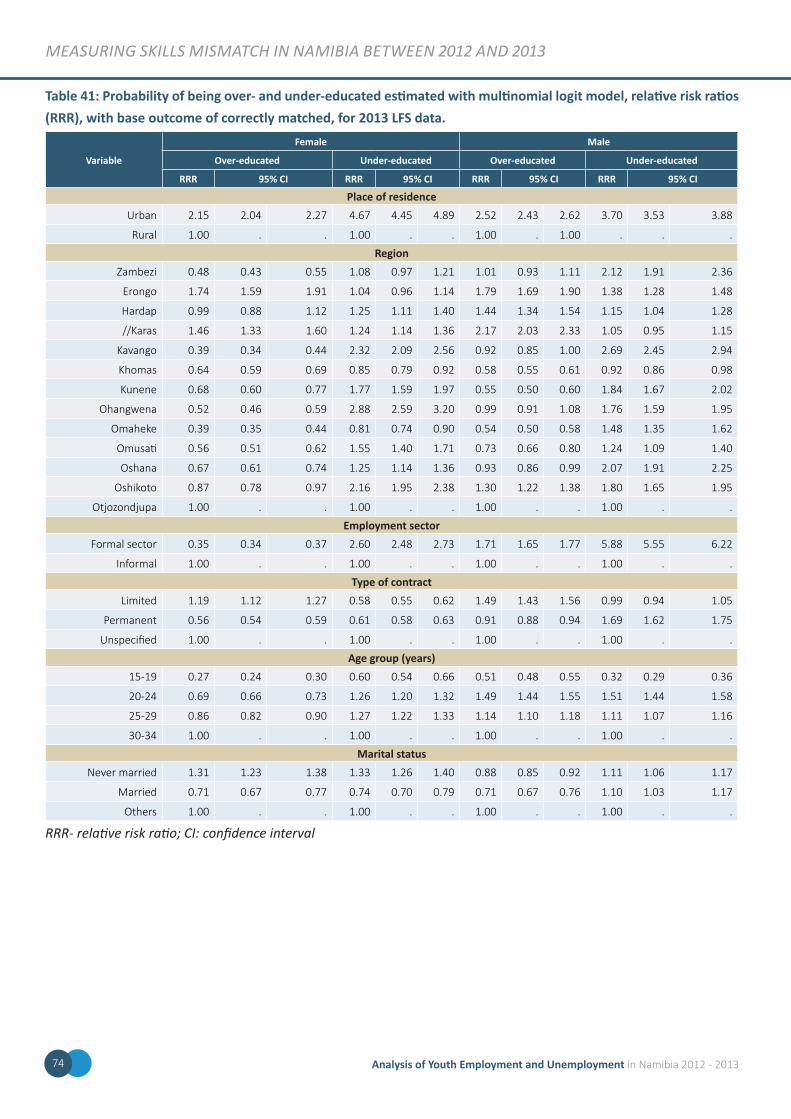
mEasurinG skills mismatcH in namibia bEtwEEn 2012 and 2013
Table 41: Probability of being over- and under-educated estimated with multinomial logit model, relative risk ratios (RRR), with base outcome of correctly matched, for 2013 LFS data.
Variable
Female Male
Over-educated Under-educated Over-educated Under-educated
RRR 95% CI RRR 95% CI RRR 95% CI RRR 95% CI
Place of residenceUrban 2.15 2.04 2.27 4.67 4.45 4.89 2.52 2.43 2.62 3.70 3.53 3.88
Rural 1.00 . . 1.00 . . 1.00 . 1.00 . . .
RegionZambezi 0.48 0.43 0.55 1.08 0.97 1.21 1.01 0.93 1.11 2.12 1.91 2.36
Erongo 1.74 1.59 1.91 1.04 0.96 1.14 1.79 1.69 1.90 1.38 1.28 1.48
Hardap 0.99 0.88 1.12 1.25 1.11 1.40 1.44 1.34 1.54 1.15 1.04 1.28
//Karas 1.46 1.33 1.60 1.24 1.14 1.36 2.17 2.03 2.33 1.05 0.95 1.15
Kavango 0.39 0.34 0.44 2.32 2.09 2.56 0.92 0.85 1.00 2.69 2.45 2.94
Khomas 0.64 0.59 0.69 0.85 0.79 0.92 0.58 0.55 0.61 0.92 0.86 0.98
Kunene 0.68 0.60 0.77 1.77 1.59 1.97 0.55 0.50 0.60 1.84 1.67 2.02
Ohangwena 0.52 0.46 0.59 2.88 2.59 3.20 0.99 0.91 1.08 1.76 1.59 1.95
Omaheke 0.39 0.35 0.44 0.81 0.74 0.90 0.54 0.50 0.58 1.48 1.35 1.62
Omusati 0.56 0.51 0.62 1.55 1.40 1.71 0.73 0.66 0.80 1.24 1.09 1.40
Oshana 0.67 0.61 0.74 1.25 1.14 1.36 0.93 0.86 0.99 2.07 1.91 2.25
Oshikoto 0.87 0.78 0.97 2.16 1.95 2.38 1.30 1.22 1.38 1.80 1.65 1.95
Otjozondjupa 1.00 . . 1.00 . . 1.00 . . 1.00 . .
Employment sectorFormal sector 0.35 0.34 0.37 2.60 2.48 2.73 1.71 1.65 1.77 5.88 5.55 6.22
Informal 1.00 . . 1.00 . . 1.00 . . 1.00 . .
Type of contractLimited 1.19 1.12 1.27 0.58 0.55 0.62 1.49 1.43 1.56 0.99 0.94 1.05
Permanent 0.56 0.54 0.59 0.61 0.58 0.63 0.91 0.88 0.94 1.69 1.62 1.75
Unspecified 1.00 . . 1.00 . . 1.00 . . 1.00 . .
Age group (years)15-19 0.27 0.24 0.30 0.60 0.54 0.66 0.51 0.48 0.55 0.32 0.29 0.36
20-24 0.69 0.66 0.73 1.26 1.20 1.32 1.49 1.44 1.55 1.51 1.44 1.58
25-29 0.86 0.82 0.90 1.27 1.22 1.33 1.14 1.10 1.18 1.11 1.07 1.16
30-34 1.00 . . 1.00 . . 1.00 . . 1.00 . .
Marital statusNever married 1.31 1.23 1.38 1.33 1.26 1.40 0.88 0.85 0.92 1.11 1.06 1.17
Married 0.71 0.67 0.77 0.74 0.70 0.79 0.71 0.67 0.76 1.10 1.03 1.17
Others 1.00 . . 1.00 . . 1.00 . . 1.00 . .
RRR- relative risk ratio; CI: confidence interval
Analysis of Youth Employment and Unemployment in Namibia 2012 - 201374
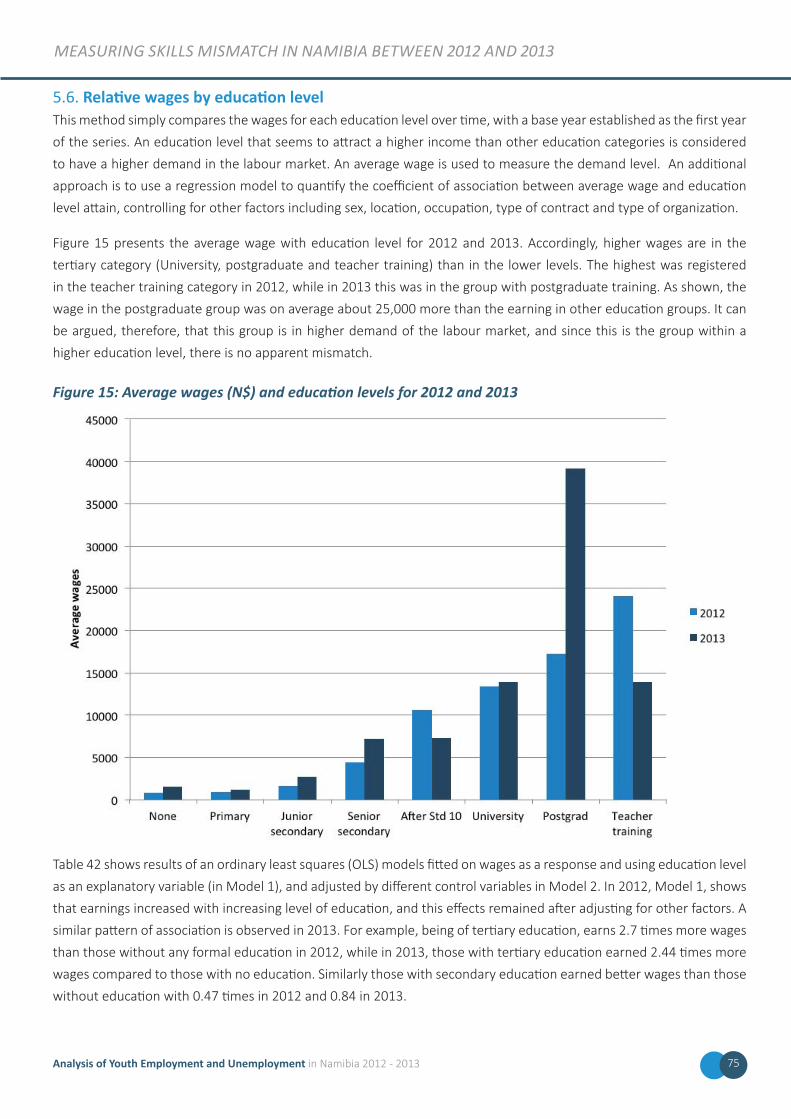
mEasurinG skills mismatcH in namibia bEtwEEn 2012 and 2013
5.6. Relative wages by education levelThis method simply compares the wages for each education level over time, with a base year established as the first year
of the series. An education level that seems to attract a higher income than other education categories is considered
to have a higher demand in the labour market. An average wage is used to measure the demand level. An additional
approach is to use a regression model to quantify the coefficient of association between average wage and education
level attain, controlling for other factors including sex, location, occupation, type of contract and type of organization.
Figure 15 presents the average wage with education level for 2012 and 2013. Accordingly, higher wages are in the
tertiary category (University, postgraduate and teacher training) than in the lower levels. The highest was registered
in the teacher training category in 2012, while in 2013 this was in the group with postgraduate training. As shown, the
wage in the postgraduate group was on average about 25,000 more than the earning in other education groups. It can
be argued, therefore, that this group is in higher demand of the labour market, and since this is the group within a
higher education level, there is no apparent mismatch.
Figure 15: Average wages (N$) and education levels for 2012 and 2013
Table 42 shows results of an ordinary least squares (OLS) models fitted on wages as a response and using education level
as an explanatory variable (in Model 1), and adjusted by different control variables in Model 2. In 2012, Model 1, shows
that earnings increased with increasing level of education, and this effects remained after adjusting for other factors. A
similar pattern of association is observed in 2013. For example, being of tertiary education, earns 2.7 times more wages
than those without any formal education in 2012, while in 2013, those with tertiary education earned 2.44 times more
wages compared to those with no education. Similarly those with secondary education earned better wages than those
without education with 0.47 times in 2012 and 0.84 in 2013.
75Analysis of Youth Employment and Unemployment in Namibia 2012 - 2013
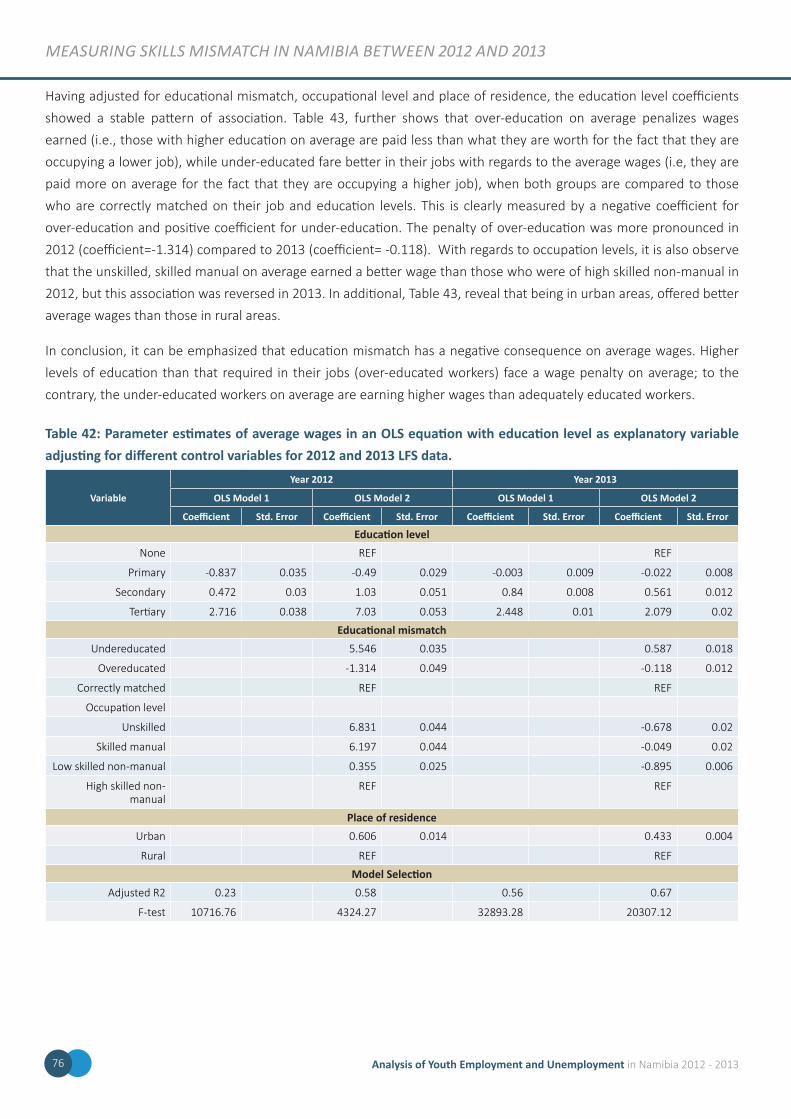
mEasurinG skills mismatcH in namibia bEtwEEn 2012 and 2013
Having adjusted for educational mismatch, occupational level and place of residence, the education level coefficients
showed a stable pattern of association. Table 43, further shows that over-education on average penalizes wages
earned (i.e., those with higher education on average are paid less than what they are worth for the fact that they are
occupying a lower job), while under-educated fare better in their jobs with regards to the average wages (i.e, they are
paid more on average for the fact that they are occupying a higher job), when both groups are compared to those
who are correctly matched on their job and education levels. This is clearly measured by a negative coefficient for
over-education and positive coefficient for under-education. The penalty of over-education was more pronounced in
2012 (coefficient=-1.314) compared to 2013 (coefficient= -0.118). With regards to occupation levels, it is also observe
that the unskilled, skilled manual on average earned a better wage than those who were of high skilled non-manual in
2012, but this association was reversed in 2013. In additional, Table 43, reveal that being in urban areas, offered better
average wages than those in rural areas.
In conclusion, it can be emphasized that education mismatch has a negative consequence on average wages. Higher
levels of education than that required in their jobs (over-educated workers) face a wage penalty on average; to the
contrary, the under-educated workers on average are earning higher wages than adequately educated workers.
Table 42: Parameter estimates of average wages in an OLS equation with education level as explanatory variable adjusting for different control variables for 2012 and 2013 LFS data.
Variable
Year 2012 Year 2013
OLS Model 1 OLS Model 2 OLS Model 1 OLS Model 2
Coefficient Std. Error Coefficient Std. Error Coefficient Std. Error Coefficient Std. Error
Education levelNone REF REF
Primary -0.837 0.035 -0.49 0.029 -0.003 0.009 -0.022 0.008
Secondary 0.472 0.03 1.03 0.051 0.84 0.008 0.561 0.012
Tertiary 2.716 0.038 7.03 0.053 2.448 0.01 2.079 0.02
Educational mismatchUndereducated 5.546 0.035 0.587 0.018
Overeducated -1.314 0.049 -0.118 0.012
Correctly matched REF REF
Occupation level
Unskilled 6.831 0.044 -0.678 0.02
Skilled manual 6.197 0.044 -0.049 0.02
Low skilled non-manual 0.355 0.025 -0.895 0.006
High skilled non-manual
REF REF
Place of residenceUrban 0.606 0.014 0.433 0.004
Rural REF REF
Model Selection Adjusted R2 0.23 0.58 0.56 0.67
F-test 10716.76 4324.27 32893.28 20307.12
Analysis of Youth Employment and Unemployment in Namibia 2012 - 201376
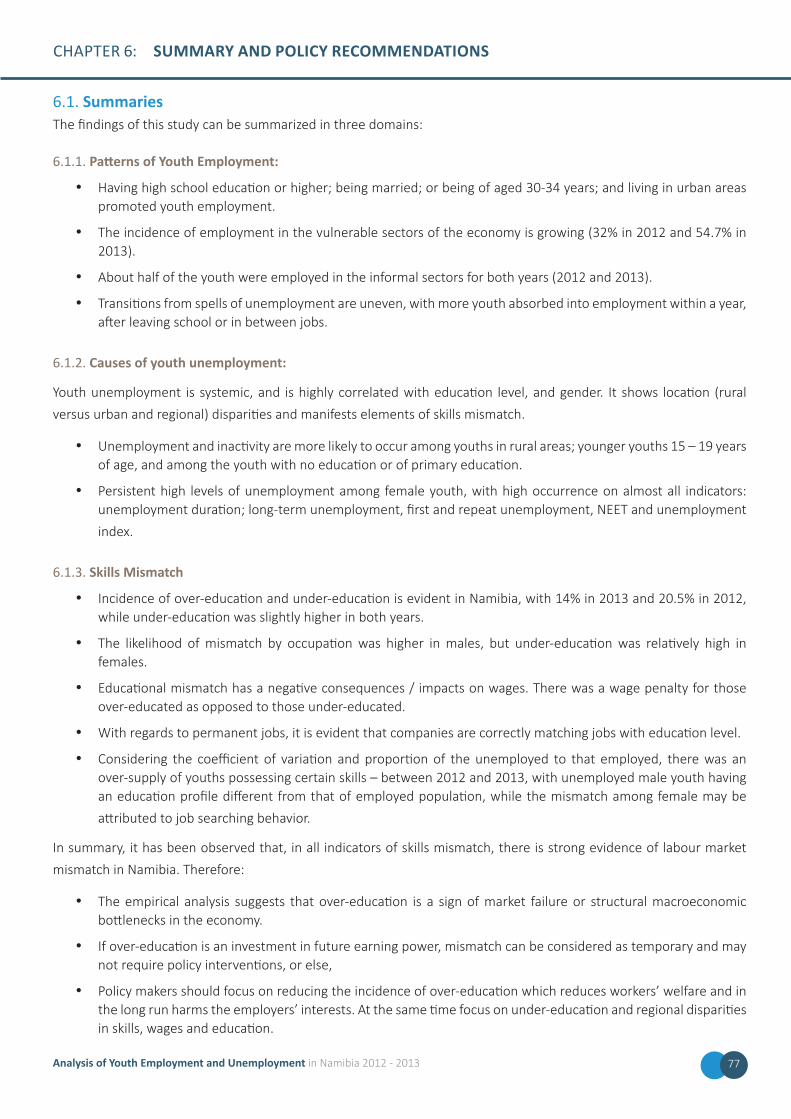
CHAPTER 6: SUMMARY AND POLICY RECOMMENDATIONS
6.1. SummariesThe findings of this study can be summarized in three domains:
6.1.1. Patterns of Youth Employment:
• Having high school education or higher; being married; or being of aged 30-34 years; and living in urban areas promoted youth employment.
• The incidence of employment in the vulnerable sectors of the economy is growing (32% in 2012 and 54.7% in 2013).
• About half of the youth were employed in the informal sectors for both years (2012 and 2013).
• Transitions from spells of unemployment are uneven, with more youth absorbed into employment within a year, after leaving school or in between jobs.
6.1.2. Causes of youth unemployment:
Youth unemployment is systemic, and is highly correlated with education level, and gender. It shows location (rural
versus urban and regional) disparities and manifests elements of skills mismatch.
• Unemployment and inactivity are more likely to occur among youths in rural areas; younger youths 15 – 19 years of age, and among the youth with no education or of primary education.
• Persistent high levels of unemployment among female youth, with high occurrence on almost all indicators: unemployment duration; long-term unemployment, first and repeat unemployment, NEET and unemployment
index.
6.1.3. Skills Mismatch
• Incidence of over-education and under-education is evident in Namibia, with 14% in 2013 and 20.5% in 2012, while under-education was slightly higher in both years.
• The likelihood of mismatch by occupation was higher in males, but under-education was relatively high in females.
• Educational mismatch has a negative consequences / impacts on wages. There was a wage penalty for those over-educated as opposed to those under-educated.
• With regards to permanent jobs, it is evident that companies are correctly matching jobs with education level.
• Considering the coefficient of variation and proportion of the unemployed to that employed, there was an over-supply of youths possessing certain skills – between 2012 and 2013, with unemployed male youth having an education profile different from that of employed population, while the mismatch among female may be
attributed to job searching behavior.
In summary, it has been observed that, in all indicators of skills mismatch, there is strong evidence of labour market
mismatch in Namibia. Therefore:
• The empirical analysis suggests that over-education is a sign of market failure or structural macroeconomic bottlenecks in the economy.
• If over-education is an investment in future earning power, mismatch can be considered as temporary and may not require policy interventions, or else,
• Policy makers should focus on reducing the incidence of over-education which reduces workers’ welfare and in the long run harms the employers’ interests. At the same time focus on under-education and regional disparities in skills, wages and education.
77Analysis of Youth Employment and Unemployment in Namibia 2012 - 2013
summary and Policy rEcommEndations
6.2. Policy Recommendations for Tackling Youth Employment and Unemployment Throughout the study there has been one common trait, and that is, youth unemployment rates in Namibia are
alarmingly high. Although there has been a decrease in 2014 the number still remains high. Given this, there is a need
to identify and propose policies that can help do away with the lack of effective policy interventions. Policy factors play
an important role in determining unemployment rates (Scarpetta 1996) and further address labour market policies
with the aim of facilitating entry into the labour market. This study has revealed that policy recommendations will help
address structural changes in the current labour market. This could be a way to lessen the imbalance between demand
and supply of young workers if they possess skills that speak to the labour market demands.
6.2.1. Recommended Policies
General Labour market reforms have seen employment opportunities for the young people affected by structural
changes in the labour market. Entries to the labour market for young people have disappeared without being replaced
with other entries. There is a need to look into existing policies that address the structural changes in the current labour
market and re work them in a way that they are in line with the current changes in the labour system. Young people
are no longer transitioning easily from school to the world of work hence proper guidelines for transition need to be in
place.
Firstly, policies that deal with education need to be revisited. This study identified that many young people lack a sound
educational background to make them appealing to the labour market. The no re-admission policy by the Ministry of
Education needs to be re-looked. Many young people are affected by this policy because they do not complete their
high school studies which in most cases is the first level needed to enter the labour market, therefore, making them less
desirable to the employers.
Secondly, schools can be encouraged to develop curriculums that are relevant for tasks where the employment prospects
are good for example Elementary which has seen as increase in employment rates from 23.8% in 2012 and 25.1% in
2013 and other areas such as skilled agriculture, services and sales, craft and trade which have recorded to have higher
employment rates than other areas.. This could be a way to lessen the imbalance between demand and supply of
young workers if they possess skills that speak to labour market demands. This would require that a steering committee
be developed and tasked with drafting a document that provides proper guidelines for schools on how to develop
curriculums that are in-line with the changing labour market. That way the education system will be governed by policies
that help facilitating easier entry into the labour market and hopefully lessen skills mismatch.
Development of policies around youth opportunity that caters for school goers and leavers is crucial, and funds should be
appropriated for such a program. Data will have to be generated in order to determine on who attends these programs,
what are opportunities are out there for these youth, do they have skills that are in demand if not what can be done to
address this.
Creating incentives for public-private partnerships to benefit young unemployed people for example a voluntary
mentorship scheme. The changes in the labour market have made employers reluctant to take on school leavers as they
lack experience and can be seen as an expense or liability. Therefore if policies are put in place that offer some sort of
benefits for potential employers, they (employers) could be more willing to benefit the unemployed youth.
Analysis of Youth Employment and Unemployment in Namibia 2012 - 201378

summary and Policy rEcommEndations
Development of targeted policies to increase the demand and supply of labour for young workers should be promoted.
Firstly develop or revise current school drop-out prevention policies by offering the young people more programs that
lead to employment. For example develop apprentice systems, they are the most effective targeted measure to keep
down youth unemployment in the long run. If students can be engaged in vocational training at work places when
they are not in school this could help with the transition from school to work. For this to work it means that with close
cooperation between schools, workplaces, local employers’ organization and unions is highly needed for this apprentice
system.
There could be a development of a Namibian Charter for Quality Internships and Apprenticeship that solely deals with
this matter of internships and apprenticeships as educational opportunities that give skills to young people. This will
clearly state the conditions of internships and apprenticeships, the quality and code of conduct.
[*if such plans are already in place maybe expand and revise the existing programs to see where the gap is.]
The existing policies on redistribution of resources need to be closely re-examined. High levels of youth unemployment
also contribute to poverty and social exclusion.
Gender policies that address issues affecting male and female youth when it comes to employment and unemployment
should be strongly revised. As the findings of this study show, females have a higher rate of unemployment than men.
There should be a policy where every female child must go to school, because some households cannot afford to send
all their children to school. Namibian organizations, churches, unions, employers and government need to promote free
education for every single child. Furthermore, there is need to promote the inclusion and retention of the girl child into
the education system from grass root level.
Although education credentials are important in securing jobs, education alone is not sufficient meet to the skills
required.
Entrepreneurship in Namibia – Incentives should be provided to private sectors or SMEs that promote student internship;
encourage employers to introduce and expand quality internship programs that offer experience and translate into skills
for job search methods.
Insertion of orientation programme /work placement schemes – poorly integrated new entrants in job markets often
have qualifications but not necessary skills, thus the need for programmes to address making the transition from
education to work place
Vocational training in school curricula – strengthen the role and effectiveness of vocational training education. Private
sector should own/shape the Vocational training curricula. For example Vocational Education and Training (VET) and
Namibia Training Authority (NTA) are effectively providing this service, and it has been successful and therefore this
service of vocational training must continue to be enforced as it has generated good results in trying to address the skills
mismatch in the country.
The Employment Creation Policy 2013/14-2016/17 was released in 2013 but it seems that the policy is slow to take off
the ground. There is need to see this policy being effectively used for the timeframe it was designed for therefore all
concerned stakeholders need to start implementing the policy and providing results of this.
1See Policy on Unemployment. Adopted at the Council of Members Brussels, Belgium, 19-20 April
79Analysis of Youth Employment and Unemployment in Namibia 2012 - 2013
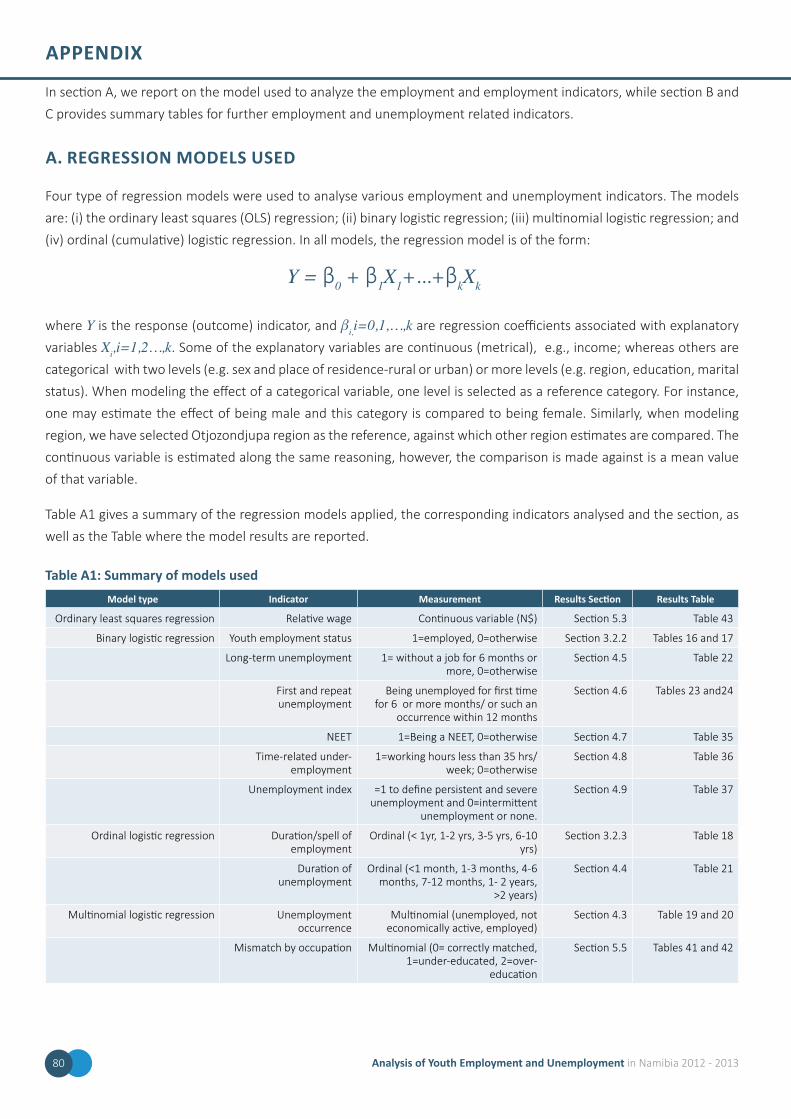
APPENDIX
In section A, we report on the model used to analyze the employment and employment indicators, while section B and
C provides summary tables for further employment and unemployment related indicators.
A. REGRESSION MODELS USED
Four type of regression models were used to analyse various employment and unemployment indicators. The models
are: (i) the ordinary least squares (OLS) regression; (ii) binary logistic regression; (iii) multinomial logistic regression; and
(iv) ordinal (cumulative) logistic regression. In all models, the regression model is of the form:
Y = β0 + β1X1+...+βkXk
where Y is the response (outcome) indicator, and βi,i=0,1,…,k are regression coefficients associated with explanatory
variables Xi,i=1,2…,k. Some of the explanatory variables are continuous (metrical), e.g., income; whereas others are
categorical with two levels (e.g. sex and place of residence-rural or urban) or more levels (e.g. region, education, marital
status). When modeling the effect of a categorical variable, one level is selected as a reference category. For instance,
one may estimate the effect of being male and this category is compared to being female. Similarly, when modeling
region, we have selected Otjozondjupa region as the reference, against which other region estimates are compared. The
continuous variable is estimated along the same reasoning, however, the comparison is made against is a mean value
of that variable.
Table A1 gives a summary of the regression models applied, the corresponding indicators analysed and the section, as
well as the Table where the model results are reported.
Table A1: Summary of models usedModel type Indicator Measurement Results Section Results Table
Ordinary least squares regression Relative wage Continuous variable (N$) Section 5.3 Table 43
Binary logistic regression Youth employment status 1=employed, 0=otherwise Section 3.2.2 Tables 16 and 17
Long-term unemployment 1= without a job for 6 months or more, 0=otherwise
Section 4.5 Table 22
First and repeat unemployment
Being unemployed for first time for 6 or more months/ or such an
occurrence within 12 months
Section 4.6 Tables 23 and24
NEET 1=Being a NEET, 0=otherwise Section 4.7 Table 35
Time-related under-employment
1=working hours less than 35 hrs/week; 0=otherwise
Section 4.8 Table 36
Unemployment index =1 to define persistent and severe unemployment and 0=intermittent
unemployment or none.
Section 4.9 Table 37
Ordinal logistic regression Duration/spell of employment
Ordinal (< 1yr, 1-2 yrs, 3-5 yrs, 6-10 yrs)
Section 3.2.3 Table 18
Duration of unemployment
Ordinal (<1 month, 1-3 months, 4-6 months, 7-12 months, 1- 2 years,
>2 years)
Section 4.4 Table 21
Multinomial logistic regression Unemployment occurrence
Multinomial (unemployed, not economically active, employed)
Section 4.3 Table 19 and 20
Mismatch by occupation Multinomial (0= correctly matched, 1=under-educated, 2=over-
education
Section 5.5 Tables 41 and 42
80 Analysis of Youth Employment and Unemployment in Namibia 2012 - 2013
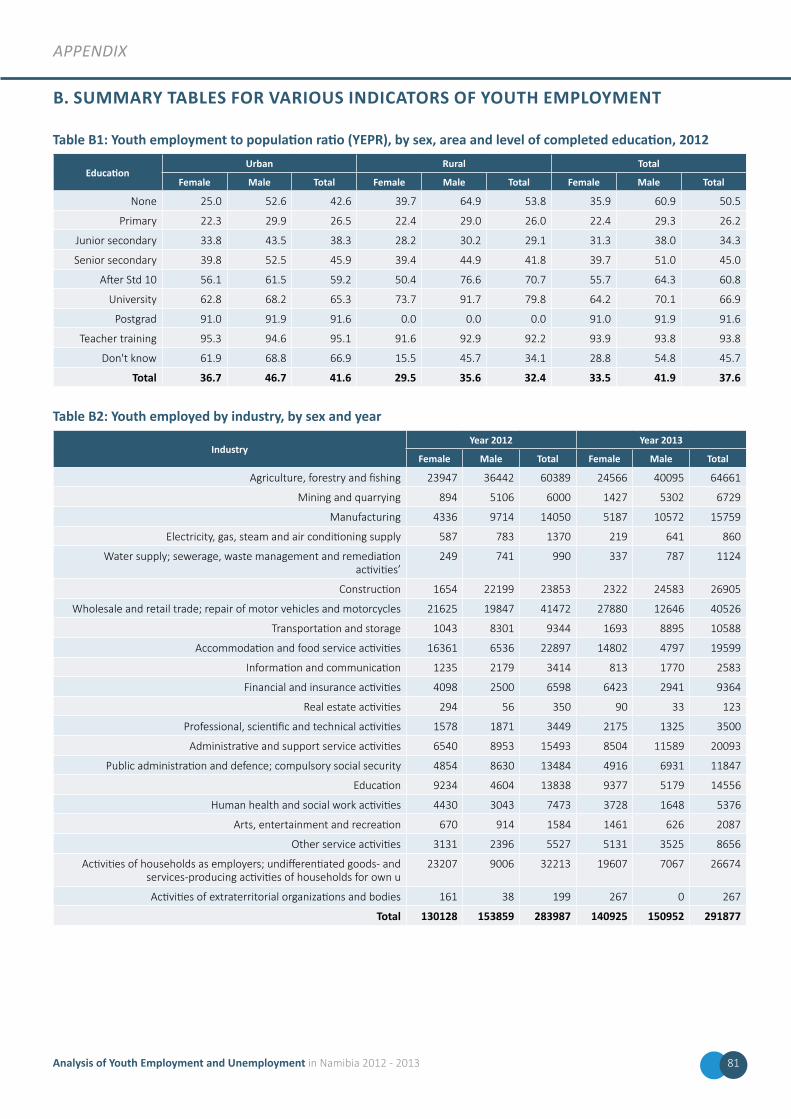
aPPEndix
B. SUMMARY TABLES FOR VARIOUS INDICATORS OF YOUTH EMPLOYMENT
Table B1: Youth employment to population ratio (YEPR), by sex, area and level of completed education, 2012
EducationUrban Rural Total
Female Male Total Female Male Total Female Male Total
None 25.0 52.6 42.6 39.7 64.9 53.8 35.9 60.9 50.5
Primary 22.3 29.9 26.5 22.4 29.0 26.0 22.4 29.3 26.2
Junior secondary 33.8 43.5 38.3 28.2 30.2 29.1 31.3 38.0 34.3
Senior secondary 39.8 52.5 45.9 39.4 44.9 41.8 39.7 51.0 45.0
After Std 10 56.1 61.5 59.2 50.4 76.6 70.7 55.7 64.3 60.8
University 62.8 68.2 65.3 73.7 91.7 79.8 64.2 70.1 66.9
Postgrad 91.0 91.9 91.6 0.0 0.0 0.0 91.0 91.9 91.6
Teacher training 95.3 94.6 95.1 91.6 92.9 92.2 93.9 93.8 93.8
Don't know 61.9 68.8 66.9 15.5 45.7 34.1 28.8 54.8 45.7
Total 36.7 46.7 41.6 29.5 35.6 32.4 33.5 41.9 37.6
Table B2: Youth employed by industry, by sex and year
IndustryYear 2012 Year 2013
Female Male Total Female Male Total
Agriculture, forestry and fishing 23947 36442 60389 24566 40095 64661
Mining and quarrying 894 5106 6000 1427 5302 6729
Manufacturing 4336 9714 14050 5187 10572 15759
Electricity, gas, steam and air conditioning supply 587 783 1370 219 641 860
Water supply; sewerage, waste management and remediation activities’
249 741 990 337 787 1124
Construction 1654 22199 23853 2322 24583 26905
Wholesale and retail trade; repair of motor vehicles and motorcycles 21625 19847 41472 27880 12646 40526
Transportation and storage 1043 8301 9344 1693 8895 10588
Accommodation and food service activities 16361 6536 22897 14802 4797 19599
Information and communication 1235 2179 3414 813 1770 2583
Financial and insurance activities 4098 2500 6598 6423 2941 9364
Real estate activities 294 56 350 90 33 123
Professional, scientific and technical activities 1578 1871 3449 2175 1325 3500
Administrative and support service activities 6540 8953 15493 8504 11589 20093
Public administration and defence; compulsory social security 4854 8630 13484 4916 6931 11847
Education 9234 4604 13838 9377 5179 14556
Human health and social work activities 4430 3043 7473 3728 1648 5376
Arts, entertainment and recreation 670 914 1584 1461 626 2087
Other service activities 3131 2396 5527 5131 3525 8656
Activities of households as employers; undifferentiated goods- and services-producing activities of households for own u
23207 9006 32213 19607 7067 26674
Activities of extraterritorial organizations and bodies 161 38 199 267 0 267
Total 130128 153859 283987 140925 150952 291877
81Analysis of Youth Employment and Unemployment in Namibia 2012 - 2013
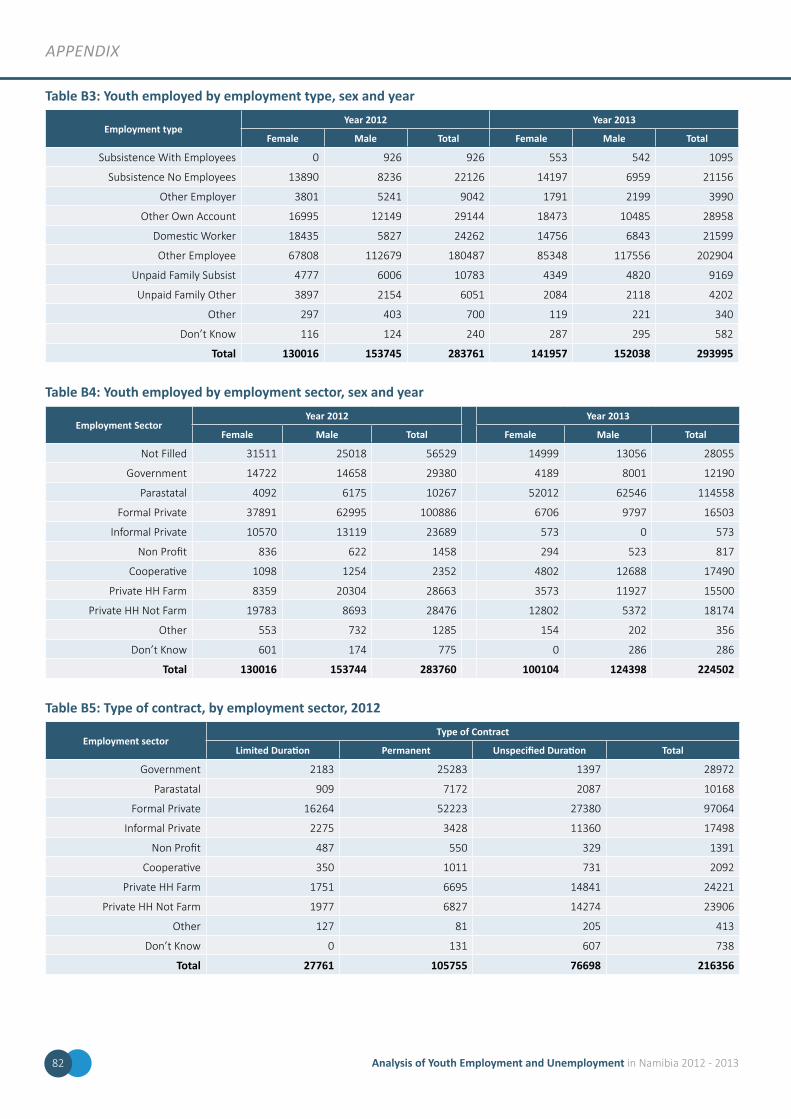
aPPEndix
Table B3: Youth employed by employment type, sex and year
Employment typeYear 2012 Year 2013
Female Male Total Female Male Total
Subsistence With Employees 0 926 926 553 542 1095
Subsistence No Employees 13890 8236 22126 14197 6959 21156
Other Employer 3801 5241 9042 1791 2199 3990
Other Own Account 16995 12149 29144 18473 10485 28958
Domestic Worker 18435 5827 24262 14756 6843 21599
Other Employee 67808 112679 180487 85348 117556 202904
Unpaid Family Subsist 4777 6006 10783 4349 4820 9169
Unpaid Family Other 3897 2154 6051 2084 2118 4202
Other 297 403 700 119 221 340
Don’t Know 116 124 240 287 295 582
Total 130016 153745 283761 141957 152038 293995
Table B4: Youth employed by employment sector, sex and year
Employment SectorYear 2012 Year 2013
Female Male Total Female Male Total
Not Filled 31511 25018 56529 14999 13056 28055
Government 14722 14658 29380 4189 8001 12190
Parastatal 4092 6175 10267 52012 62546 114558
Formal Private 37891 62995 100886 6706 9797 16503
Informal Private 10570 13119 23689 573 0 573
Non Profit 836 622 1458 294 523 817
Cooperative 1098 1254 2352 4802 12688 17490
Private HH Farm 8359 20304 28663 3573 11927 15500
Private HH Not Farm 19783 8693 28476 12802 5372 18174
Other 553 732 1285 154 202 356
Don’t Know 601 174 775 0 286 286
Total 130016 153744 283760 100104 124398 224502
Table B5: Type of contract, by employment sector, 2012
Employment sectorType of Contract
Limited Duration Permanent Unspecified Duration Total
Government 2183 25283 1397 28972
Parastatal 909 7172 2087 10168
Formal Private 16264 52223 27380 97064
Informal Private 2275 3428 11360 17498
Non Profit 487 550 329 1391
Cooperative 350 1011 731 2092
Private HH Farm 1751 6695 14841 24221
Private HH Not Farm 1977 6827 14274 23906
Other 127 81 205 413
Don’t Know 0 131 607 738
Total 27761 105755 76698 216356
82 Analysis of Youth Employment and Unemployment in Namibia 2012 - 2013
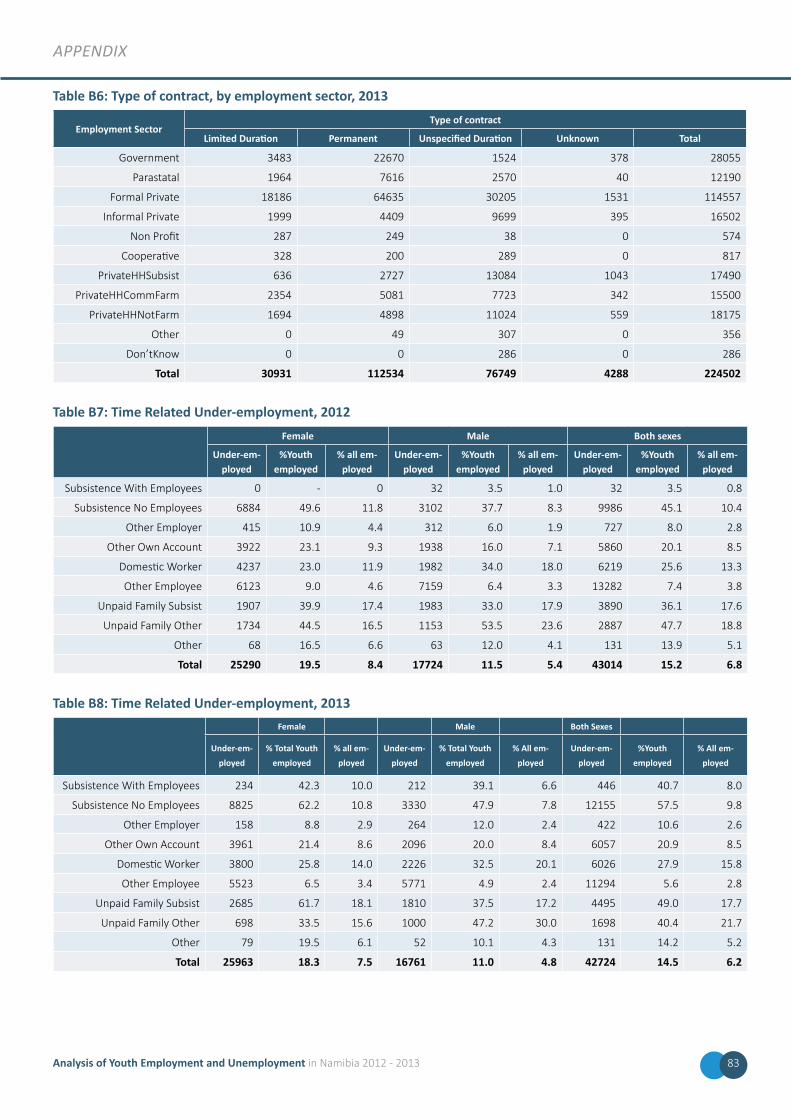
aPPEndix
Table B6: Type of contract, by employment sector, 2013
Employment SectorType of contract
Limited Duration Permanent Unspecified Duration Unknown Total
Government 3483 22670 1524 378 28055
Parastatal 1964 7616 2570 40 12190
Formal Private 18186 64635 30205 1531 114557
Informal Private 1999 4409 9699 395 16502
Non Profit 287 249 38 0 574
Cooperative 328 200 289 0 817
PrivateHHSubsist 636 2727 13084 1043 17490
PrivateHHCommFarm 2354 5081 7723 342 15500
PrivateHHNotFarm 1694 4898 11024 559 18175
Other 0 49 307 0 356
Don’tKnow 0 0 286 0 286
Total 30931 112534 76749 4288 224502
Table B7: Time Related Under-employment, 2012Female Male Both sexes
Under-em-ployed
%Youth employed
% all em-ployed
Under-em-ployed
%Youth employed
% all em-ployed
Under-em-ployed
%Youth employed
% all em-ployed
Subsistence With Employees 0 - 0 32 3.5 1.0 32 3.5 0.8
Subsistence No Employees 6884 49.6 11.8 3102 37.7 8.3 9986 45.1 10.4
Other Employer 415 10.9 4.4 312 6.0 1.9 727 8.0 2.8
Other Own Account 3922 23.1 9.3 1938 16.0 7.1 5860 20.1 8.5
Domestic Worker 4237 23.0 11.9 1982 34.0 18.0 6219 25.6 13.3
Other Employee 6123 9.0 4.6 7159 6.4 3.3 13282 7.4 3.8
Unpaid Family Subsist 1907 39.9 17.4 1983 33.0 17.9 3890 36.1 17.6
Unpaid Family Other 1734 44.5 16.5 1153 53.5 23.6 2887 47.7 18.8
Other 68 16.5 6.6 63 12.0 4.1 131 13.9 5.1
Total 25290 19.5 8.4 17724 11.5 5.4 43014 15.2 6.8
Table B8: Time Related Under-employment, 2013Female Male Both Sexes
Under-em-ployed
% Total Youth employed
% all em-ployed
Under-em-ployed
% Total Youth employed
% All em-ployed
Under-em-ployed
%Youth employed
% All em-ployed
Subsistence With Employees 234 42.3 10.0 212 39.1 6.6 446 40.7 8.0
Subsistence No Employees 8825 62.2 10.8 3330 47.9 7.8 12155 57.5 9.8
Other Employer 158 8.8 2.9 264 12.0 2.4 422 10.6 2.6
Other Own Account 3961 21.4 8.6 2096 20.0 8.4 6057 20.9 8.5
Domestic Worker 3800 25.8 14.0 2226 32.5 20.1 6026 27.9 15.8
Other Employee 5523 6.5 3.4 5771 4.9 2.4 11294 5.6 2.8
Unpaid Family Subsist 2685 61.7 18.1 1810 37.5 17.2 4495 49.0 17.7
Unpaid Family Other 698 33.5 15.6 1000 47.2 30.0 1698 40.4 21.7
Other 79 19.5 6.1 52 10.1 4.3 131 14.2 5.2
Total 25963 18.3 7.5 16761 11.0 4.8 42724 14.5 6.2
83Analysis of Youth Employment and Unemployment in Namibia 2012 - 2013
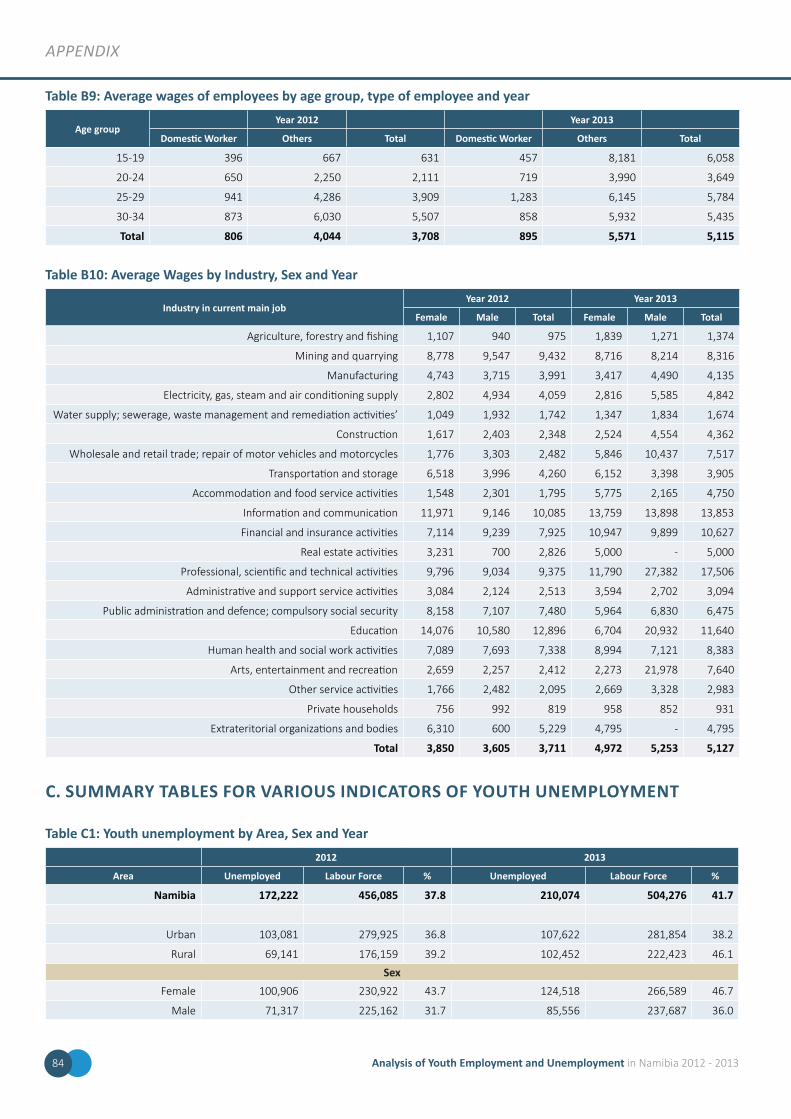
aPPEndix
Table B9: Average wages of employees by age group, type of employee and year
Age groupYear 2012 Year 2013
Domestic Worker Others Total Domestic Worker Others Total
15-19 396 667 631 457 8,181 6,058
20-24 650 2,250 2,111 719 3,990 3,649
25-29 941 4,286 3,909 1,283 6,145 5,784
30-34 873 6,030 5,507 858 5,932 5,435
Total 806 4,044 3,708 895 5,571 5,115
Table B10: Average Wages by Industry, Sex and Year
Industry in current main jobYear 2012 Year 2013
Female Male Total Female Male Total
Agriculture, forestry and fishing 1,107 940 975 1,839 1,271 1,374
Mining and quarrying 8,778 9,547 9,432 8,716 8,214 8,316
Manufacturing 4,743 3,715 3,991 3,417 4,490 4,135
Electricity, gas, steam and air conditioning supply 2,802 4,934 4,059 2,816 5,585 4,842
Water supply; sewerage, waste management and remediation activities’ 1,049 1,932 1,742 1,347 1,834 1,674
Construction 1,617 2,403 2,348 2,524 4,554 4,362
Wholesale and retail trade; repair of motor vehicles and motorcycles 1,776 3,303 2,482 5,846 10,437 7,517
Transportation and storage 6,518 3,996 4,260 6,152 3,398 3,905
Accommodation and food service activities 1,548 2,301 1,795 5,775 2,165 4,750
Information and communication 11,971 9,146 10,085 13,759 13,898 13,853
Financial and insurance activities 7,114 9,239 7,925 10,947 9,899 10,627
Real estate activities 3,231 700 2,826 5,000 - 5,000
Professional, scientific and technical activities 9,796 9,034 9,375 11,790 27,382 17,506
Administrative and support service activities 3,084 2,124 2,513 3,594 2,702 3,094
Public administration and defence; compulsory social security 8,158 7,107 7,480 5,964 6,830 6,475
Education 14,076 10,580 12,896 6,704 20,932 11,640
Human health and social work activities 7,089 7,693 7,338 8,994 7,121 8,383
Arts, entertainment and recreation 2,659 2,257 2,412 2,273 21,978 7,640
Other service activities 1,766 2,482 2,095 2,669 3,328 2,983
Private households 756 992 819 958 852 931
Extrateritorial organizations and bodies 6,310 600 5,229 4,795 - 4,795
Total 3,850 3,605 3,711 4,972 5,253 5,127
C. SUMMARY TABLES FOR VARIOUS INDICATORS OF YOUTH UNEMPLOYMENT
Table C1: Youth unemployment by Area, Sex and Year2012 2013
Area Unemployed Labour Force % Unemployed Labour Force %
Namibia 172,222 456,085 37.8 210,074 504,276 41.7
Urban 103,081 279,925 36.8 107,622 281,854 38.2
Rural 69,141 176,159 39.2 102,452 222,423 46.1
SexFemale 100,906 230,922 43.7 124,518 266,589 46.7
Male 71,317 225,162 31.7 85,556 237,687 36.0
84 Analysis of Youth Employment and Unemployment in Namibia 2012 - 2013
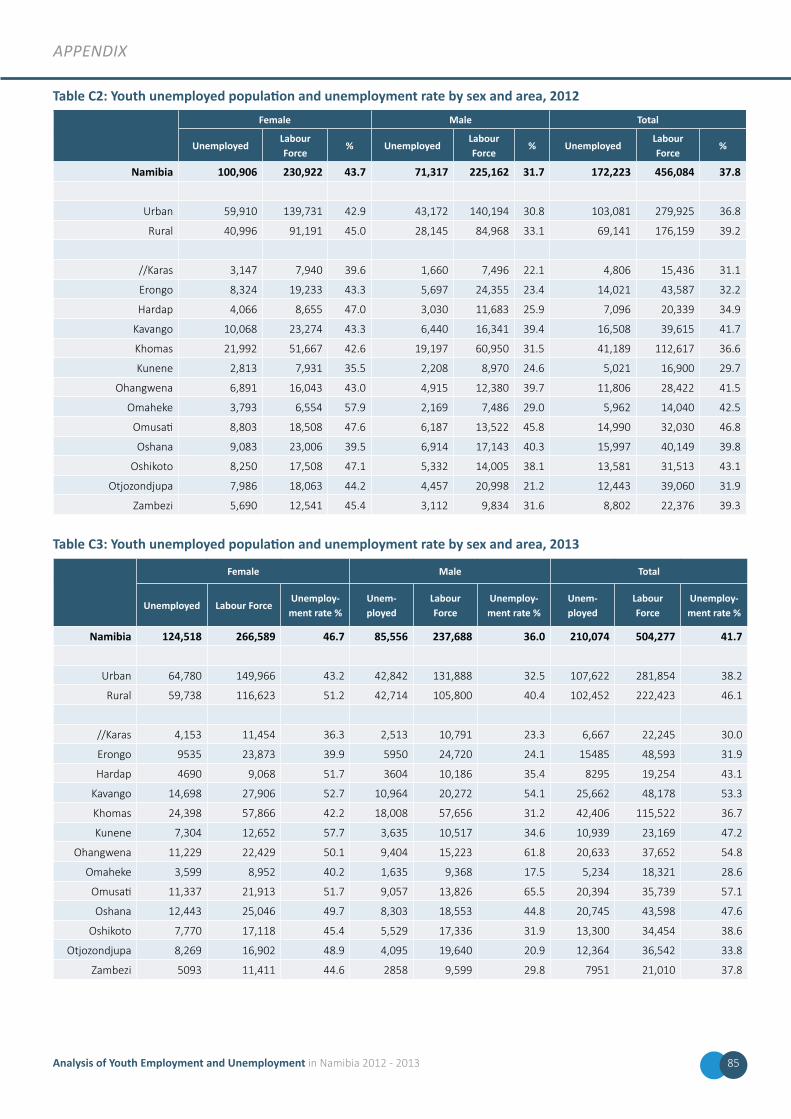
aPPEndix
Table C2: Youth unemployed population and unemployment rate by sex and area, 2012
Female Male Total
UnemployedLabour Force
% UnemployedLabour Force
% UnemployedLabour Force
%
Namibia 100,906 230,922 43.7 71,317 225,162 31.7 172,223 456,084 37.8
Urban 59,910 139,731 42.9 43,172 140,194 30.8 103,081 279,925 36.8
Rural 40,996 91,191 45.0 28,145 84,968 33.1 69,141 176,159 39.2
//Karas 3,147 7,940 39.6 1,660 7,496 22.1 4,806 15,436 31.1
Erongo 8,324 19,233 43.3 5,697 24,355 23.4 14,021 43,587 32.2
Hardap 4,066 8,655 47.0 3,030 11,683 25.9 7,096 20,339 34.9
Kavango 10,068 23,274 43.3 6,440 16,341 39.4 16,508 39,615 41.7
Khomas 21,992 51,667 42.6 19,197 60,950 31.5 41,189 112,617 36.6
Kunene 2,813 7,931 35.5 2,208 8,970 24.6 5,021 16,900 29.7
Ohangwena 6,891 16,043 43.0 4,915 12,380 39.7 11,806 28,422 41.5
Omaheke 3,793 6,554 57.9 2,169 7,486 29.0 5,962 14,040 42.5
Omusati 8,803 18,508 47.6 6,187 13,522 45.8 14,990 32,030 46.8
Oshana 9,083 23,006 39.5 6,914 17,143 40.3 15,997 40,149 39.8
Oshikoto 8,250 17,508 47.1 5,332 14,005 38.1 13,581 31,513 43.1
Otjozondjupa 7,986 18,063 44.2 4,457 20,998 21.2 12,443 39,060 31.9
Zambezi 5,690 12,541 45.4 3,112 9,834 31.6 8,802 22,376 39.3
Table C3: Youth unemployed population and unemployment rate by sex and area, 2013
Female Male Total
Unemployed Labour ForceUnemploy-ment rate %
Unem-ployed
Labour Force
Unemploy-ment rate %
Unem-ployed
Labour Force
Unemploy-ment rate %
Namibia 124,518 266,589 46.7 85,556 237,688 36.0 210,074 504,277 41.7
Urban 64,780 149,966 43.2 42,842 131,888 32.5 107,622 281,854 38.2
Rural 59,738 116,623 51.2 42,714 105,800 40.4 102,452 222,423 46.1
//Karas 4,153 11,454 36.3 2,513 10,791 23.3 6,667 22,245 30.0
Erongo 9535 23,873 39.9 5950 24,720 24.1 15485 48,593 31.9
Hardap 4690 9,068 51.7 3604 10,186 35.4 8295 19,254 43.1
Kavango 14,698 27,906 52.7 10,964 20,272 54.1 25,662 48,178 53.3
Khomas 24,398 57,866 42.2 18,008 57,656 31.2 42,406 115,522 36.7
Kunene 7,304 12,652 57.7 3,635 10,517 34.6 10,939 23,169 47.2
Ohangwena 11,229 22,429 50.1 9,404 15,223 61.8 20,633 37,652 54.8
Omaheke 3,599 8,952 40.2 1,635 9,368 17.5 5,234 18,321 28.6
Omusati 11,337 21,913 51.7 9,057 13,826 65.5 20,394 35,739 57.1
Oshana 12,443 25,046 49.7 8,303 18,553 44.8 20,745 43,598 47.6
Oshikoto 7,770 17,118 45.4 5,529 17,336 31.9 13,300 34,454 38.6
Otjozondjupa 8,269 16,902 48.9 4,095 19,640 20.9 12,364 36,542 33.8
Zambezi 5093 11,411 44.6 2858 9,599 29.8 7951 21,010 37.8
85Analysis of Youth Employment and Unemployment in Namibia 2012 - 2013
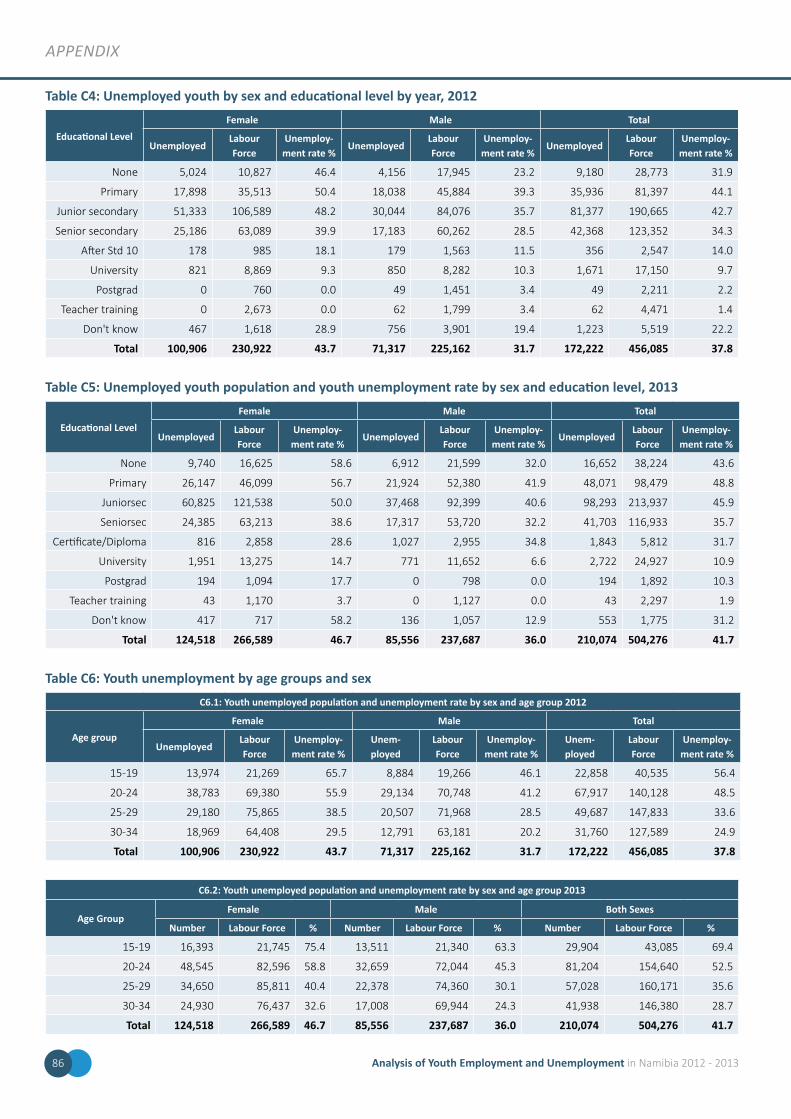
aPPEndix
Table C4: Unemployed youth by sex and educational level by year, 2012
Educational LevelFemale Male Total
UnemployedLabour Force
Unemploy-ment rate %
UnemployedLabour Force
Unemploy-ment rate %
UnemployedLabour Force
Unemploy-ment rate %
None 5,024 10,827 46.4 4,156 17,945 23.2 9,180 28,773 31.9
Primary 17,898 35,513 50.4 18,038 45,884 39.3 35,936 81,397 44.1
Junior secondary 51,333 106,589 48.2 30,044 84,076 35.7 81,377 190,665 42.7
Senior secondary 25,186 63,089 39.9 17,183 60,262 28.5 42,368 123,352 34.3
After Std 10 178 985 18.1 179 1,563 11.5 356 2,547 14.0
University 821 8,869 9.3 850 8,282 10.3 1,671 17,150 9.7
Postgrad 0 760 0.0 49 1,451 3.4 49 2,211 2.2
Teacher training 0 2,673 0.0 62 1,799 3.4 62 4,471 1.4
Don't know 467 1,618 28.9 756 3,901 19.4 1,223 5,519 22.2
Total 100,906 230,922 43.7 71,317 225,162 31.7 172,222 456,085 37.8
Table C5: Unemployed youth population and youth unemployment rate by sex and education level, 2013
Educational LevelFemale Male Total
UnemployedLabour Force
Unemploy-ment rate %
UnemployedLabour Force
Unemploy-ment rate %
UnemployedLabour Force
Unemploy-ment rate %
None 9,740 16,625 58.6 6,912 21,599 32.0 16,652 38,224 43.6
Primary 26,147 46,099 56.7 21,924 52,380 41.9 48,071 98,479 48.8
Juniorsec 60,825 121,538 50.0 37,468 92,399 40.6 98,293 213,937 45.9
Seniorsec 24,385 63,213 38.6 17,317 53,720 32.2 41,703 116,933 35.7
Certificate/Diploma 816 2,858 28.6 1,027 2,955 34.8 1,843 5,812 31.7
University 1,951 13,275 14.7 771 11,652 6.6 2,722 24,927 10.9
Postgrad 194 1,094 17.7 0 798 0.0 194 1,892 10.3
Teacher training 43 1,170 3.7 0 1,127 0.0 43 2,297 1.9
Don't know 417 717 58.2 136 1,057 12.9 553 1,775 31.2
Total 124,518 266,589 46.7 85,556 237,687 36.0 210,074 504,276 41.7
Table C6: Youth unemployment by age groups and sexC6.1: Youth unemployed population and unemployment rate by sex and age group 2012
Age groupFemale Male Total
UnemployedLabour Force
Unemploy-ment rate %
Unem-ployed
Labour Force
Unemploy-ment rate %
Unem-ployed
Labour Force
Unemploy-ment rate %
15-19 13,974 21,269 65.7 8,884 19,266 46.1 22,858 40,535 56.4
20-24 38,783 69,380 55.9 29,134 70,748 41.2 67,917 140,128 48.5
25-29 29,180 75,865 38.5 20,507 71,968 28.5 49,687 147,833 33.6
30-34 18,969 64,408 29.5 12,791 63,181 20.2 31,760 127,589 24.9
Total 100,906 230,922 43.7 71,317 225,162 31.7 172,222 456,085 37.8
C6.2: Youth unemployed population and unemployment rate by sex and age group 2013
Age GroupFemale Male Both Sexes
Number Labour Force % Number Labour Force % Number Labour Force %
15-19 16,393 21,745 75.4 13,511 21,340 63.3 29,904 43,085 69.4
20-24 48,545 82,596 58.8 32,659 72,044 45.3 81,204 154,640 52.5
25-29 34,650 85,811 40.4 22,378 74,360 30.1 57,028 160,171 35.6
30-34 24,930 76,437 32.6 17,008 69,944 24.3 41,938 146,380 28.7
Total 124,518 266,589 46.7 85,556 237,687 36.0 210,074 504,276 41.7
86 Analysis of Youth Employment and Unemployment in Namibia 2012 - 2013
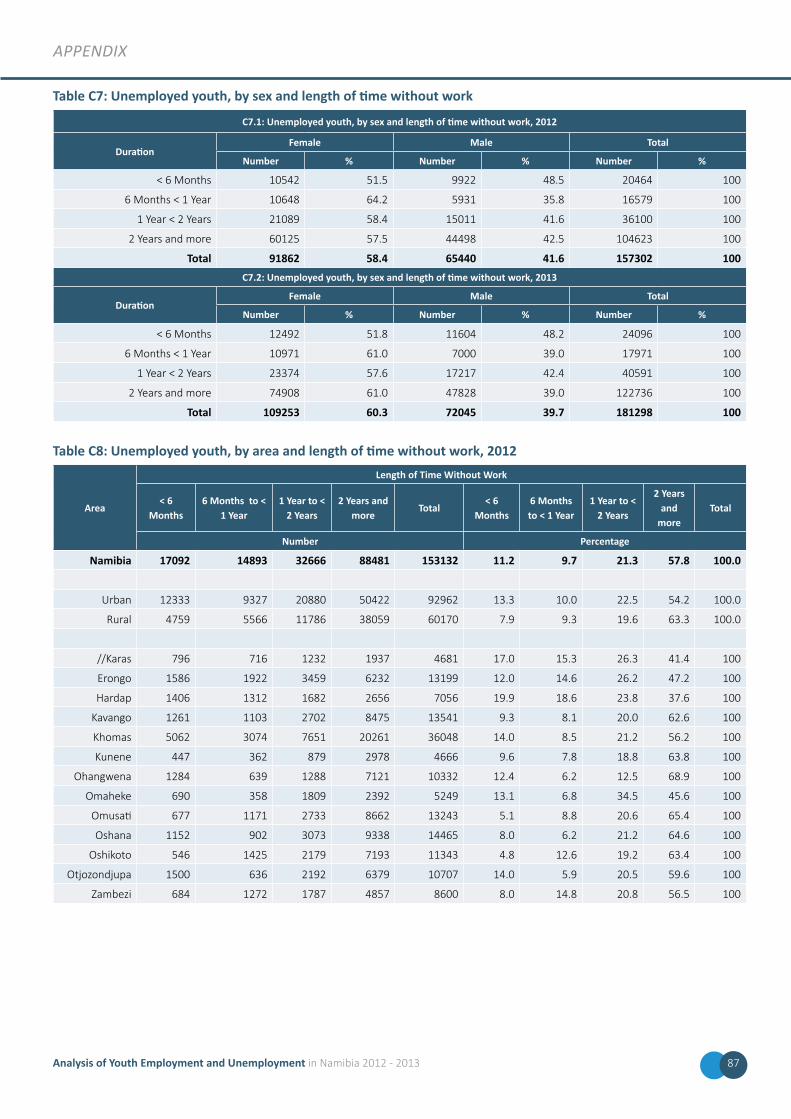
aPPEndix
Table C7: Unemployed youth, by sex and length of time without work
C7.1: Unemployed youth, by sex and length of time without work, 2012
DurationFemale Male Total
Number % Number % Number %
< 6 Months 10542 51.5 9922 48.5 20464 100
6 Months < 1 Year 10648 64.2 5931 35.8 16579 100
1 Year < 2 Years 21089 58.4 15011 41.6 36100 100
2 Years and more 60125 57.5 44498 42.5 104623 100
Total 91862 58.4 65440 41.6 157302 100C7.2: Unemployed youth, by sex and length of time without work, 2013
DurationFemale Male Total
Number % Number % Number %
< 6 Months 12492 51.8 11604 48.2 24096 100
6 Months < 1 Year 10971 61.0 7000 39.0 17971 100
1 Year < 2 Years 23374 57.6 17217 42.4 40591 100
2 Years and more 74908 61.0 47828 39.0 122736 100
Total 109253 60.3 72045 39.7 181298 100
Table C8: Unemployed youth, by area and length of time without work, 2012
Area
Length of Time Without Work
< 6 Months
6 Months to < 1 Year
1 Year to < 2 Years
2 Years and more
Total< 6
Months6 Months to < 1 Year
1 Year to < 2 Years
2 Years and
moreTotal
Number Percentage
Namibia 17092 14893 32666 88481 153132 11.2 9.7 21.3 57.8 100.0
Urban 12333 9327 20880 50422 92962 13.3 10.0 22.5 54.2 100.0
Rural 4759 5566 11786 38059 60170 7.9 9.3 19.6 63.3 100.0
//Karas 796 716 1232 1937 4681 17.0 15.3 26.3 41.4 100
Erongo 1586 1922 3459 6232 13199 12.0 14.6 26.2 47.2 100
Hardap 1406 1312 1682 2656 7056 19.9 18.6 23.8 37.6 100
Kavango 1261 1103 2702 8475 13541 9.3 8.1 20.0 62.6 100
Khomas 5062 3074 7651 20261 36048 14.0 8.5 21.2 56.2 100
Kunene 447 362 879 2978 4666 9.6 7.8 18.8 63.8 100
Ohangwena 1284 639 1288 7121 10332 12.4 6.2 12.5 68.9 100
Omaheke 690 358 1809 2392 5249 13.1 6.8 34.5 45.6 100
Omusati 677 1171 2733 8662 13243 5.1 8.8 20.6 65.4 100
Oshana 1152 902 3073 9338 14465 8.0 6.2 21.2 64.6 100
Oshikoto 546 1425 2179 7193 11343 4.8 12.6 19.2 63.4 100
Otjozondjupa 1500 636 2192 6379 10707 14.0 5.9 20.5 59.6 100
Zambezi 684 1272 1787 4857 8600 8.0 14.8 20.8 56.5 100
87Analysis of Youth Employment and Unemployment in Namibia 2012 - 2013
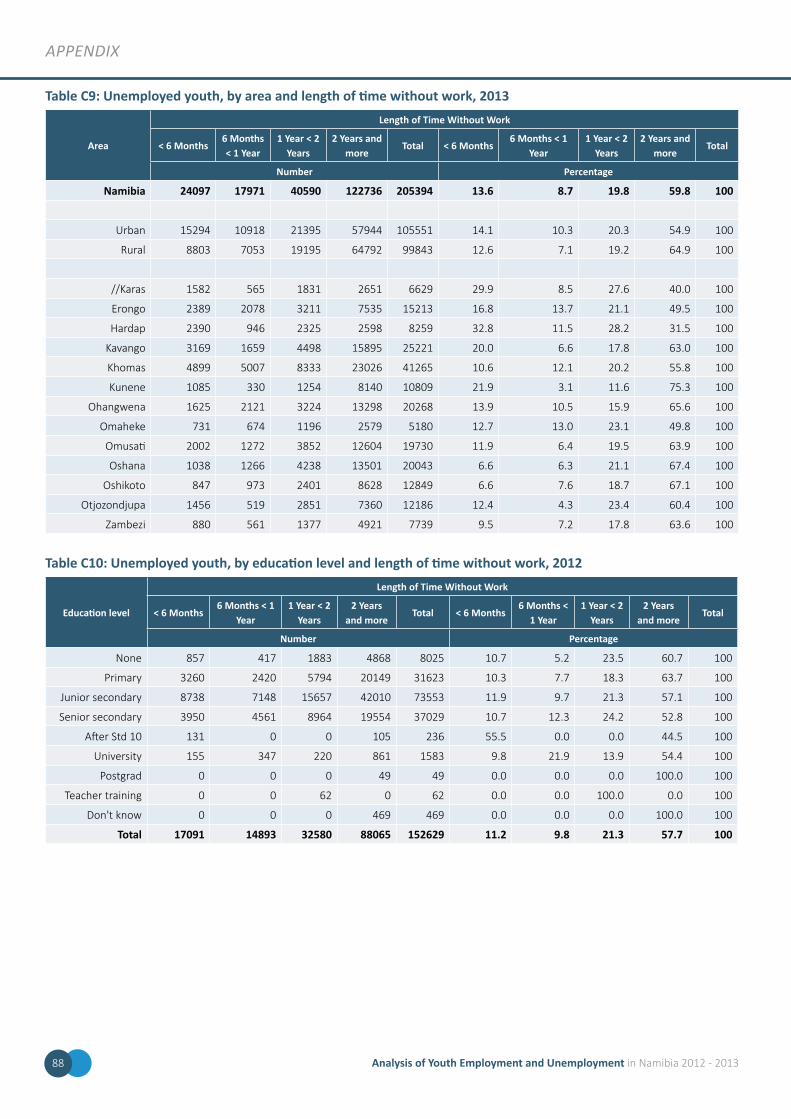
aPPEndix
Table C9: Unemployed youth, by area and length of time without work, 2013
Area
Length of Time Without Work
< 6 Months6 Months < 1 Year
1 Year < 2 Years
2 Years and more
Total < 6 Months6 Months < 1
Year1 Year < 2
Years2 Years and
moreTotal
Number Percentage
Namibia 24097 17971 40590 122736 205394 13.6 8.7 19.8 59.8 100
Urban 15294 10918 21395 57944 105551 14.1 10.3 20.3 54.9 100
Rural 8803 7053 19195 64792 99843 12.6 7.1 19.2 64.9 100
//Karas 1582 565 1831 2651 6629 29.9 8.5 27.6 40.0 100
Erongo 2389 2078 3211 7535 15213 16.8 13.7 21.1 49.5 100
Hardap 2390 946 2325 2598 8259 32.8 11.5 28.2 31.5 100
Kavango 3169 1659 4498 15895 25221 20.0 6.6 17.8 63.0 100
Khomas 4899 5007 8333 23026 41265 10.6 12.1 20.2 55.8 100
Kunene 1085 330 1254 8140 10809 21.9 3.1 11.6 75.3 100
Ohangwena 1625 2121 3224 13298 20268 13.9 10.5 15.9 65.6 100
Omaheke 731 674 1196 2579 5180 12.7 13.0 23.1 49.8 100
Omusati 2002 1272 3852 12604 19730 11.9 6.4 19.5 63.9 100
Oshana 1038 1266 4238 13501 20043 6.6 6.3 21.1 67.4 100
Oshikoto 847 973 2401 8628 12849 6.6 7.6 18.7 67.1 100
Otjozondjupa 1456 519 2851 7360 12186 12.4 4.3 23.4 60.4 100
Zambezi 880 561 1377 4921 7739 9.5 7.2 17.8 63.6 100
Table C10: Unemployed youth, by education level and length of time without work, 2012
Education level
Length of Time Without Work
< 6 Months6 Months < 1
Year1 Year < 2
Years2 Years
and moreTotal < 6 Months
6 Months < 1 Year
1 Year < 2 Years
2 Years and more
Total
Number Percentage
None 857 417 1883 4868 8025 10.7 5.2 23.5 60.7 100
Primary 3260 2420 5794 20149 31623 10.3 7.7 18.3 63.7 100
Junior secondary 8738 7148 15657 42010 73553 11.9 9.7 21.3 57.1 100
Senior secondary 3950 4561 8964 19554 37029 10.7 12.3 24.2 52.8 100
After Std 10 131 0 0 105 236 55.5 0.0 0.0 44.5 100
University 155 347 220 861 1583 9.8 21.9 13.9 54.4 100
Postgrad 0 0 0 49 49 0.0 0.0 0.0 100.0 100
Teacher training 0 0 62 0 62 0.0 0.0 100.0 0.0 100
Don't know 0 0 0 469 469 0.0 0.0 0.0 100.0 100
Total 17091 14893 32580 88065 152629 11.2 9.8 21.3 57.7 100
88 Analysis of Youth Employment and Unemployment in Namibia 2012 - 2013
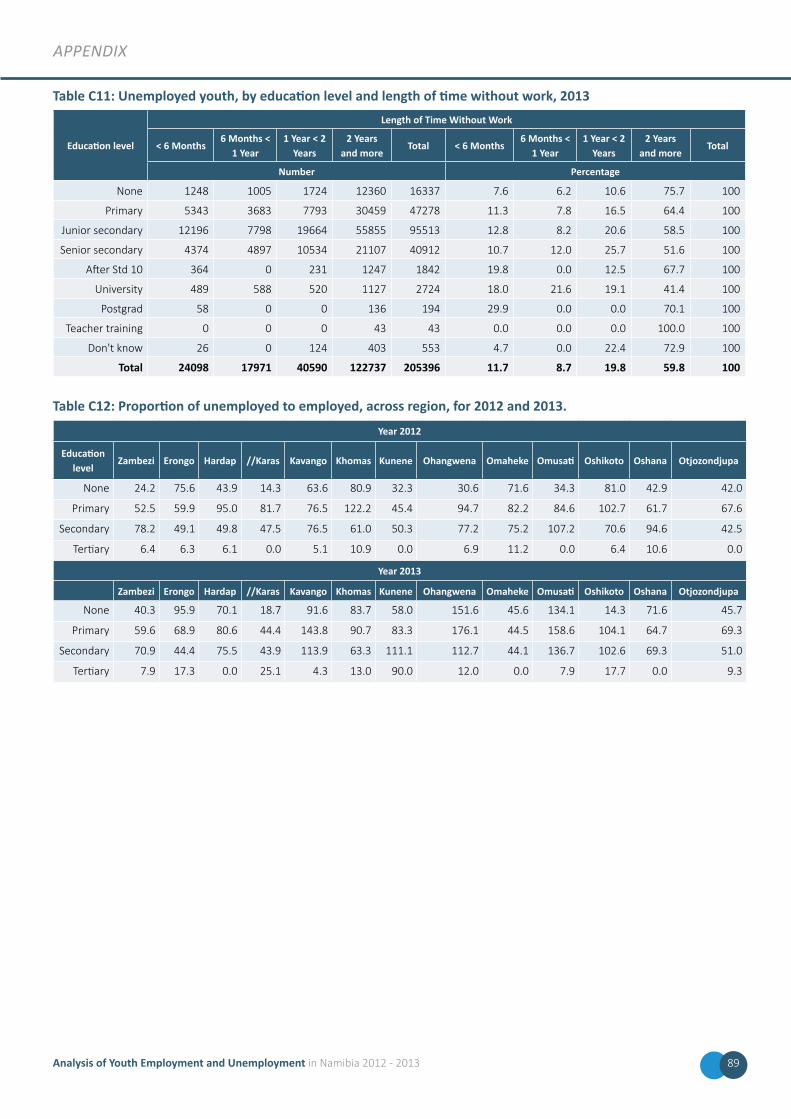
aPPEndix
Table C11: Unemployed youth, by education level and length of time without work, 2013
Education level
Length of Time Without Work
< 6 Months6 Months <
1 Year1 Year < 2
Years2 Years
and moreTotal < 6 Months
6 Months < 1 Year
1 Year < 2 Years
2 Years and more
Total
Number Percentage
None 1248 1005 1724 12360 16337 7.6 6.2 10.6 75.7 100
Primary 5343 3683 7793 30459 47278 11.3 7.8 16.5 64.4 100
Junior secondary 12196 7798 19664 55855 95513 12.8 8.2 20.6 58.5 100
Senior secondary 4374 4897 10534 21107 40912 10.7 12.0 25.7 51.6 100
After Std 10 364 0 231 1247 1842 19.8 0.0 12.5 67.7 100
University 489 588 520 1127 2724 18.0 21.6 19.1 41.4 100
Postgrad 58 0 0 136 194 29.9 0.0 0.0 70.1 100
Teacher training 0 0 0 43 43 0.0 0.0 0.0 100.0 100
Don't know 26 0 124 403 553 4.7 0.0 22.4 72.9 100
Total 24098 17971 40590 122737 205396 11.7 8.7 19.8 59.8 100
Table C12: Proportion of unemployed to employed, across region, for 2012 and 2013.
Year 2012
Education level
Zambezi Erongo Hardap //Karas Kavango Khomas Kunene Ohangwena Omaheke Omusati Oshikoto Oshana Otjozondjupa
None 24.2 75.6 43.9 14.3 63.6 80.9 32.3 30.6 71.6 34.3 81.0 42.9 42.0
Primary 52.5 59.9 95.0 81.7 76.5 122.2 45.4 94.7 82.2 84.6 102.7 61.7 67.6
Secondary 78.2 49.1 49.8 47.5 76.5 61.0 50.3 77.2 75.2 107.2 70.6 94.6 42.5
Tertiary 6.4 6.3 6.1 0.0 5.1 10.9 0.0 6.9 11.2 0.0 6.4 10.6 0.0
Year 2013
Zambezi Erongo Hardap //Karas Kavango Khomas Kunene Ohangwena Omaheke Omusati Oshikoto Oshana Otjozondjupa
None 40.3 95.9 70.1 18.7 91.6 83.7 58.0 151.6 45.6 134.1 14.3 71.6 45.7
Primary 59.6 68.9 80.6 44.4 143.8 90.7 83.3 176.1 44.5 158.6 104.1 64.7 69.3
Secondary 70.9 44.4 75.5 43.9 113.9 63.3 111.1 112.7 44.1 136.7 102.6 69.3 51.0
Tertiary 7.9 17.3 0.0 25.1 4.3 13.0 90.0 12.0 0.0 7.9 17.7 0.0 9.3
89Analysis of Youth Employment and Unemployment in Namibia 2012 - 2013
REFERENCES
1. Amare, T. (2014). Africa’s high youth unemployment; is population to blame. The Guardian. Retrieved from http://www.apastyle.org/learn/faqs/cite-newspaper.aspx AYFC, 2014
2. African Economic Outlook, (2012). Promoting youth employment. Retrieved from Http//: www.africaneconomicoutlook.org/enin-depth/youth-employment. [Last Accessed 2015].
3. Atwoli, F. (2014). We need to create more sustainable jobs for youth in Africa. ILO News and Media Release. 2nd April, 2014. http://www.ilo.org/actrav/media-center/news/WCMS_240325/lang--en/index.htm
4. Blum, W. R., (2007). Youth in Sub-Sahara Africa. 41, (3), pp. 230-238
5. Barbagelata, H.-H (2012). Youth, Unemployment and Education. In Sánchez-Castañeda, A., Serraniand, L. Sperotti, F. Editors. Youth Unemployment and Joblessness: Causes, Consequences, Responses. Cambridge Scholars Publishing.
6. Central Bureau of Statistics, Namibia, (March 11, 2015). Retrieved from http:// www.tradingeconomics.com/namibia/unemploymenrate [Last Accessed 11/03/15]
7. Chuma, A. (2013). Internal Director for Africa: Interview with CBNC Africa.
8. Devlin, K. (2013). Reducing Youth Unemployment in Sub-Saharan Africa. Population Reference Bureau, Washington, DC.
9. Economist (2013). Why is youth unemployment so high? 8th May, 2013.
10. Eita, J.H., Ashipala, J.M. (2010). Determinants of Unemployment in Namibia. International Journal of Business and Management. Vol. 5, No. 10; October 2010
11. European Training Foundation [ETF] (2012). Measuring Mismatch in ETF Partner Countries: A Methodological Note. European Training Foundation, Working Paper.
12. Flanagan, R.J. (1994). Labor Market Responses to a Change in Economic System. Proceedings of the World Bank Annual Conference on Development Economics.
13. Garcia, J., R. (2011): Youth Unemployment in Spain; Causes and Solutions BBVA research. 2011
14. Higgins, O. (2001). Youth Unemployment and Employment Policy: A Global Perspective. Geneva: International Labour Office.
15. ILO (2015). Key Indicators of the Labour Market, Eighth edition. Geneva: International Labour Office.
16. ILO (2014a). International Labour Office Global Employment trends 2014: Risk of jobless recovery? pp.21
17. ILO (2014b). African Youth forum Conference presentation
18. ILO, (2014c). African Youth Forum: World Bank 2014 Statistics presentation
19. ILO (2014d). African Youth Forum: ILO calls for bold political action to promote youth employment in Africa. ILO News and Press Release, 29th Jan, 2014. ILO: Geneva.
20. ILO (2013a). Comparative Analysis of National Skills Development Policies: A Guide for Policy Makers. International Labor Office, Pretoria.
21. ILO (2013b). Global Employment Trends for Youth: A Generation at Risk, Geneva: International Labour Organization.
22. ILO (2012). The youth employment crisis highlights of the 2012 International Labour Conference report.
23. ILO (2011). Global Employment Trends for Youth, Geneva.
24. ILO (2011). African Youth Report. International Labour Organization. Geneva. Retrieved from http://www.ilo.org/global/docs/WCMS_182332/lang--en/index.htm
25. ILO (2004). World Employment Report 2004-5. Employment productivity and poverty reduction.
90 Analysis of Youth Employment and Unemployment in Namibia 2012 - 2013
rEfErEncEs
26. Labour Resource and Research Institute [LaRRi] (2011). The crisis of youth unemployment in Namibia: Recommendations for pro-youth economic and Employment policies. October 2011
27. Lindbeck, A. (2014). Tackling youth unemployment. A proposal on Youth Unemployment. http://www.global-economic-symposium.org/knowledgebase/the-global-society/tackling-youth-unemployment/proposals/youth-unemployment
28. Links, F. (2010). Namibia’s Skills Deficits: Cross-sectoral perceptions and experiences. Research Associate Institute for Public Policy Research (IPPR) Commissioned by Namibian Employers’ Federation (NEF). From http://www.ipmnamibia.org/resources/docs/ SkillsResearchDeficit.pdf
29. Namibia Statistics Agency [NSA] (2015). Namibia Labour Force Survey Report for 2014.
30. Namibia Statistics Agency [NSA] NSA (2014). Namibia Labour Force Survey Report for 2013.
31. Namibia Statistics Agency [NSA] NSA (2013). Namibia Labour Force Survey Report for 2012.
32. Nyahungwa, F.N. (2014). Namibia: Unemployment rate increases to 29.6%. Namibia Economist, All Africa Global Media. Retrieved from http://allafrica.com/stories/201403280949.html accessed 16/03/2015
33. Oosthuizen M., Cassim A. (2014). The state of youth unemployment in South Africa. www.brookings.edu Published August 15 2014
34. Ortiz. I., Cummins, M. (2012). When the global crisis and youth bulge collide: Double the jobs trouble for the youth. UNICEF Social and Economic working paper. February 2012
35. Pazvakawambwa, L., Tjikune, C. (2013). Bio-demographic factors impacting youth unemployment in Namibia: A binary logistic regression model. Journal Systems and Mathematical Sciences. 3:426-436.
36. Singell, L.D., Lillydahl, J.H. (1989). Some Alternative of Youth Unemployment: Means for Improved Understanding and Policy Formulation. The American Journal of Economics and Sociology. 48 (4), pp. 457-477
37. Southern African Development Community [SADC] (2015). SADC Facts and Figures. Retrieved from http://www.sadc.int/about-sadc/overview/sadc-facts-figures 2015. SADC. Gaborone.
38. Scarpetta, S. (1996). Assessing the role of labour market policies and institutional settings on unemployment: A cross country study. OECD Economic Studies No.26 1996/1
39. Suonpaa. M. Matswetu. T. (2012). Unemployment and the youth in Namibia. A booklet for stakeholders done by Afronaut Foundation for the PLDDSJ Project. Retrieved from http://www.sadc.int [Last Accessed 03/2015].
40. Tjikune, C.B.H. (2012). Socio-Economic Factors Impacting Youth Unemployment in Namibia. 1st ed. University of Namibia: University of Namibia, Dept. of Statistics.
41. UNECA (2005). Youth, Education, Skills and Employment.: United Nations Economic Commission for Africa. Addis Ababa.
42. United Nations Population Fund [ UNFPA] (2011). State of the African Youth Report.
43. World Bank 2014 Report. Retrieved from www.worldbank.org
91Analysis of Youth Employment and Unemployment in Namibia 2012 - 2013

list of fiGurEs
92 Analysis of Youth Employment and Unemployment in Namibia 2012 - 2013

93Analysis of Youth Employment and Unemployment in Namibia 2012 - 2013
Analysis of Youth Employment and Unemployment in Namibia 2012 - 201394
Analysis of Youth Employment and Unemployment
in Namibia 2012 - 2013
Namibia Statistics AgencyP.O. Box 2133, FGI House, Post Street Mall,Windhoek, Namibia
Tel: +264 61 431 3200Fax: +264 61 431 3253 | +264 61 431 3240Email: [email protected]
Scan to find more statistics information about Namibia
Like us on Facebook:facebook.com/NamibiaStatisticsAgency
Follow us on Twitter:@namstatsagency
Subscribe to us on YouTube:youtube.com/namstatsagency