Wine & Spirits Monitor - Great American Group -- Auctions ... and Spirits... · wine, beer, and...
14
Wine & Spirits Monitor
Transcript of Wine & Spirits Monitor - Great American Group -- Auctions ... and Spirits... · wine, beer, and...
1 March 2014 — Wine & Spirits Monitor
1
Wine & Spirits Monitor

1 March 2014 — Wine & Spirits Monitor
1 Trend Tracker
NOLVS NOLVs increased for producers by up to two
percentage points over the previous quarter due to
improved sales and market conditions, as well as
decreased for distributors by up to five percentage
points over the last year due to reduced margins.
SALES TRENDS Sales trends increased overall due to the successful
introduction of new brands and varietals, increased
sales of lower‐priced labels, as well as a stronger
overall fourth quarter in 2013 versus 2012.
GROSS MARGIN Gross margins increased for certain producers due
to operational efficiencies and lower‐cost vintages
and decreased for other companies due to increased
discounts and lower‐margin product offerings.
INVENTORY Inventory levels increased for producers as they
harvest and process bulk wine, while inventory
levels decreased for distributors due to holiday
sales.
PRICING Pricing was mixed for bulk wine depending on the
demand of specific varietals and appellations, while
corn and wheat prices decreased due to increased
supplies.
NOLVs Mixed
Sales Trends Increasing
Gross Margin Mixed
Inventory Mixed
Pricing Mixed
INVENTORY

2 March 2014 — Wine & Spirits Monitor
2 Overview
Higher consumer economic confidence, continued consumption by Baby
Boomers, rise of the Millennials, and an increase in direct‐to‐consumer
sales have continued to propel the wine and spirits industry. Danny
Brager, senior vice president of Nielsen’s Beverage Alcohol Practice Area,
cites that across major consumer goods categories, only wine, coffee, and
snacks have experienced consistent five‐year growth (not including
specific categories such as craft beer or prepared cocktails).
Consumers are also willing to spend on
average 3% more on a bottle of wine than in
years past, but “the pricing sweet‐spot is still
between $10 and $15,” says Brager.
Though Baby Boomers comprise the base of
high‐frequency wine drinkers, according to
John Gillespie, president of the Wine Market
Council, Millennials (ages 20 to 37) are not to
be ignored. “The youngest Millennials will be
of legal drinking age in 2015,” says Gillespie,
adding, “and there are 70 million of them.”
Millennials comprise 30% of drinkers and
purchase wine over $20 with frequency,
though Baby Boomers still spend more money
on average for a single bottle of wine. In
addition, Baby Boomers carry the domestic
market, but Millennials are more likely to
purchase imported bottles, underscoring the
generation’s exploratory spirit.
U.S. wine exports, 90% from California,
reached a record high $1.6 billion in winery
revenues in 2013, up 16.4% compared to the
previous year, an increase for the fourth
consecutive year by value. Volume shipments
reached 435.2 million liters or 48.4 million
cases, up 7.5%.
“Consumers across the globe continue to
recognize the quality, diversity, and value of
California wines, despite significant trade
barriers and heavily subsidized foreign
competitors,” said Wine Institute President
and CEO Robert P. (Bobby) Koch. “While the
U.S. remains our largest, most important
market, California exports a fifth of its wine,
and we are on track to reach our goal of $2
billion in exports by 2020. Our outstanding
2012 and 2013 California vintages, heralded
for quality as well as quantity, were a record
high so we have the ability to expand.”
As direct‐to‐consumer wine sales become
more available, wine drinkers are exploring
their options. Tourism and winery visits
drive the majority of a winery’s repeat sales
and wine clubs, but retailers are also stepping
up their game. According to Brager, there are
now 522,000 nationwide retail outlets for
wine, beer, and spirits. Citing companies that
have started carrying wine like Walgreens
and 7‐Eleven, Brager notes that there are now
more chains than independent shops selling
wine. “It’s helping to convert occasional
drinkers into high‐frequency drinkers,” said
Brager.

3 March 2014 — Wine & Spirits Monitor
3 Overview
WINE
California wine producers shipped an estimated 3.6%
more wine to U.S. markets last year, increasing from
208 million nine‐liter cases in 2012 to 216 million in
2013. U.S. wine shipments rose 2.7% last year to 370
million cases, according to estimates by Gomberg
Fredrikson & Associates based on state and federal
data through October or November.
“The industry is in a state of transition from a severe
shortage to a more balanced market,” said industry
analyst Jon Fredrikson. That transition came as a
shortage of wine from smaller 2010 and 2011
California vintages created a surge in grape and wine
prices in the past two years, Fredrikson said.
Although 2013 was not great for wine sales, the
industry is positioned for “strong” growth this year,
he said.
Small wineries have been benefitting from more sales
directly to consumers, now reaching 40 states nine
years after the 2005 U.S. Supreme Court’s Granholm
decision started to open such access. Increasing e‐
commerce by physical and virtual wine shops are
providing even more options for producers, while
the “flash” sale website phenomenon has been
waning as winery inventories dwindled.
The volume of direct sales grew 9.3% last year,
according to the latest figures from ShipCompliant, a
major wine shipping regulatory compliance conduit.
U.S. off‐premise wine sales increased 3.1% for the
four weeks ended November 9, 2013 versus the prior
year, according to data from Nielsen. Domestic and
imported wine sales increased 3.6% and 1.7%,
respectively. In case volume during the same period,
domestic and imported case volume decreased 0.3%
and 1.1%, respectively.
Sales for wine across all price points above $9.0
increased, with the over $20.00 segment exhibiting
the most growth of 23.2% in sales and 19.0% in
volume.
The $9.00 to $11.99, $12.00 to $14.99, and $15.00 to
$19.99 segments all grew between 2% and 9% in sales
and volume. All price points under $9.0 fell in both
sales and volume.
Chardonnay continued to represent the top‐selling
varietal, maintaining 19.0% of the market share in
sales and 19.4% in volume. During the four weeks
ended November 9, 2013, chardonnay grew 0.8% in
sales and 1.3% in volume. The second‐largest
varietal, cabernet sauvignon, represented 16.0% of
sales and 13.4% of case volume. Over the same four‐
week period, cabernet sauvignon grew 5.4% in sales
and 2.4% in volume.
0%2%4%6%8%
10%12%14%16%18%20%22%24%
Sales VolumeSource: Nielsen
Off-Premise Wine Sales by Price SegmentFor the Four Weeks Ended November 9, 2013 versus 2012
(Per
cent
Cha
nge)
-15%-13%-11%
-9%-7%-5%-3%-1%1%3%5%7%9%
(Per
cent
Cha
nge)
Off-Premise Wine Sales by VarietalFor the Four Weeks Ended November 9, 2013 versus 2012
Source: Nielsen
4 March 2014 — Wine & Spirits Monitor
4 Overview
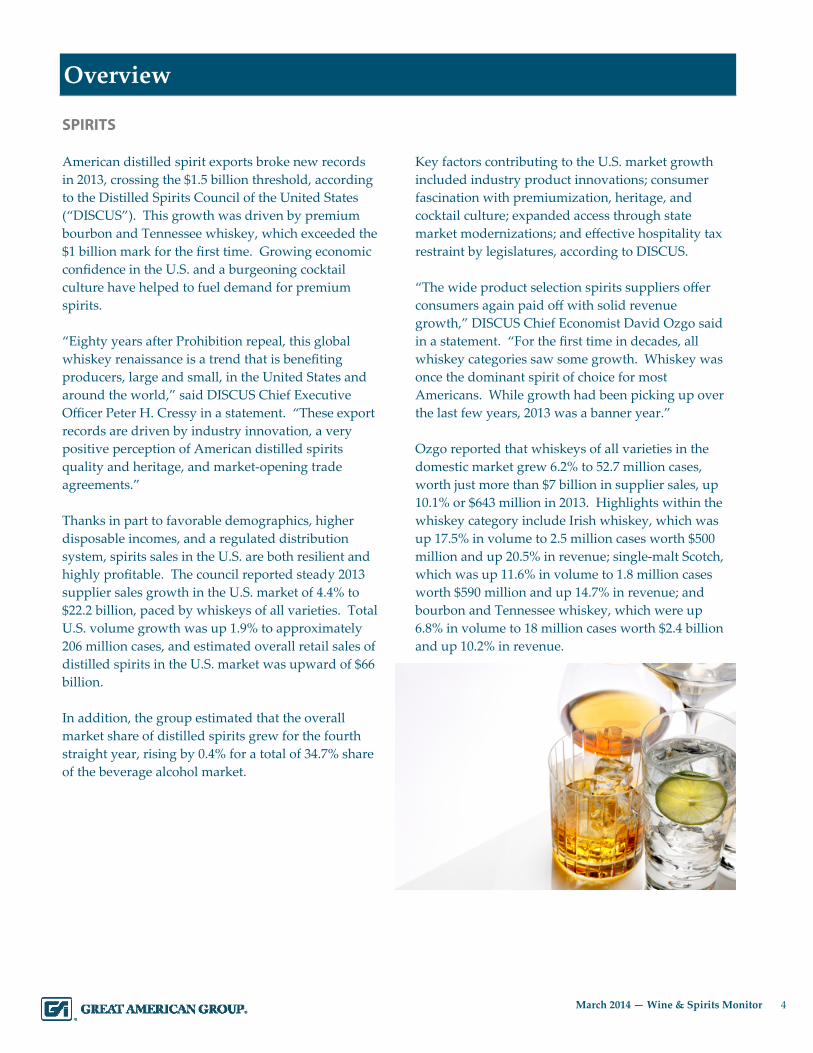
SPIRITS
American distilled spirit exports broke new records
in 2013, crossing the $1.5 billion threshold, according
to the Distilled Spirits Council of the United States
(“DISCUS”). This growth was driven by premium
bourbon and Tennessee whiskey, which exceeded the
$1 billion mark for the first time. Growing economic
confidence in the U.S. and a burgeoning cocktail
culture have helped to fuel demand for premium
spirits.
“Eighty years after Prohibition repeal, this global
whiskey renaissance is a trend that is benefiting
producers, large and small, in the United States and
around the world,” said DISCUS Chief Executive
Officer Peter H. Cressy in a statement. “These export
records are driven by industry innovation, a very
positive perception of American distilled spirits
quality and heritage, and market‐opening trade
agreements.”
Thanks in part to favorable demographics, higher
disposable incomes, and a regulated distribution
system, spirits sales in the U.S. are both resilient and
highly profitable. The council reported steady 2013
supplier sales growth in the U.S. market of 4.4% to
$22.2 billion, paced by whiskeys of all varieties. Total
U.S. volume growth was up 1.9% to approximately
206 million cases, and estimated overall retail sales of
distilled spirits in the U.S. market was upward of $66
billion.
In addition, the group estimated that the overall
market share of distilled spirits grew for the fourth
straight year, rising by 0.4% for a total of 34.7% share
of the beverage alcohol market.
Key factors contributing to the U.S. market growth
included industry product innovations; consumer
fascination with premiumization, heritage, and
cocktail culture; expanded access through state
market modernizations; and effective hospitality tax
restraint by legislatures, according to DISCUS.
“The wide product selection spirits suppliers offer
consumers again paid off with solid revenue
growth,” DISCUS Chief Economist David Ozgo said
in a statement. “For the first time in decades, all
whiskey categories saw some growth. Whiskey was
once the dominant spirit of choice for most
Americans. While growth had been picking up over
the last few years, 2013 was a banner year.”
Ozgo reported that whiskeys of all varieties in the
domestic market grew 6.2% to 52.7 million cases,
worth just more than $7 billion in supplier sales, up
10.1% or $643 million in 2013. Highlights within the
whiskey category include Irish whiskey, which was
up 17.5% in volume to 2.5 million cases worth $500
million and up 20.5% in revenue; single‐malt Scotch,
which was up 11.6% in volume to 1.8 million cases
worth $590 million and up 14.7% in revenue; and
bourbon and Tennessee whiskey, which were up
6.8% in volume to 18 million cases worth $2.4 billion
and up 10.2% in revenue.

5 March 2014 — Wine & Spirits Monitor
5 Overview
BEER
Although mainstream beer is on the decline, craft
beer is on the rise. In the U.S., wine and spirits sales
have cut into beer’s market share. In 2002, 60% of
consumers purchased beer, with only 13% and 27%
purchasing wine and spirits, respectively. Today,
beer still boasts the majority (51.1%), but it is not
experiencing the same robust growth as wine or
segments of the spirits industry. Sales of beer‐
adjacent beverages, such as ciders and flavored
malts, however, are growing, and craft beer is
basking in double‐digit growth, with a third of the
market share.
According to Technomic’s 2014 Special Trends in
Adult Beverage Report: State of the Industry report, craft
beer production was up 9.6% in 2013, while overall
beer production fell 1.4%. This growing popularity
of specialty beers is paving the way for a new crop of
beer makers.
“Over the last couple of years, the number of new
brewery openings has been at near unprecedented
levels,” said Bart Watson, Ph.D., staff economist at
Brewers Association, a craft beer industry group.
“We’re seeing breweries open at about a rate of 1.2
per day.”
Craft beer is predominantly consumed by high‐
income, young white men, while the Wine Market
Council determined that women are more likely to be
high‐frequency, high‐end wine drinkers. While wine
drinkers are overwhelmingly white, African‐
American and Hispanic drinkers are increasingly
introduced to wine through blended wines, which is
also a growing drink category.

6 March 2014 — Wine & Spirits Monitor
6 Recent Appraisal Trends
WINE AND SPIRITS PRODUCERS
NOLVs for wine and spirits producers have
increased by up to two percentage points over the
previous quarter due to improved sales and market
conditions.
Sales trends have increased overall due to increased
sales of lower‐priced labels, as well as a stronger
overall fourth quarter in 2013 versus 2012.
Gross margins increased for certain producers due to
operational efficiencies and lower‐cost vintages and
decreased for other companies due to lower‐margin
product offerings.
Based on the cyclical nature of wine production,
aging, and release, producers maintain increased
levels of bulk wine due to the recent wine grape
harvest. The level of bulk wines will decrease as the
2012 vintage is aged and bottled.
WINE AND SPIRITS DISTRIBUTORS
NOLVs decreased year‐over‐year by up to five
percentage points due to reduced margins.
For the companies that GA appraised, sales increased
due to the successful introductions of new brands
and varietals, while another company’s sales
decreased due to the loss of a major contract.
Gross margins have decreased for distributors due to
increased discounts and an increase in lower‐margin
product offerings.
Inventory levels decreased for most distributors as a
result of holiday sales.

7 March 2014 — Wine & Spirits Monitor
7 Pricing Trends
BULK WINE
Though California has been stricken by drought, the
state celebrated a record wine grape harvest.
According toe Cyril Penn, editor of Wine Business
Monthly, the state’s preliminary crush report says
4.23 million tons of wine grapes were crushed in
2013, representing an increase of 5% over the 4.02
million tons crushed in 2012.
One of the reasons for California’s second bumper
crop in a row is that growers have been planting
more grapes. The record harvest also benefited from
good weather for grape growing in recent years. In
places such as Napa Valley, there is still enough
water underground to keep the vineyards thriving
despite the drought.
Though some grape growers are making contingency
plans for the potential lack of water in the future,
grapes fortunately use less water compared to a lot of
other crops.
Between November 1, 2013 and January 1, 2014,
Ciatti values for bulk wine varied significantly based
on origin and varietal. Prices for Napa Valley
cabernet sauvignon and pinot noir increased by up to
6%, though decreased by up to 4% for merlot and
chardonnay.
In Sonoma Valley, prices for cabernet sauvignon and
pinot noir remained unchanged, while merlot and
chardonnay decreased by up to 17%. In the Central
Valley, prices for cabernet sauvignon and merlot
decreased by up to 14%, while pinot noir remained
unchanged and chardonnay increased 12%.
According to the California Department of Food and
Agriculture’s preliminary 2013 grape crop report,
new tonnage records were set stateside, while, on
average, grape prices declined. Industry analyst
George Schofield reported that “Napa is out of sync
with everybody. The entire state is up in volume and
down in price, and Napa is just the opposite.”
GA relies on bulk wine prices from the nation’s two
leading brokerage companies, Ciatti Company and
Turrentine Brokerage. Turrentine claims that its
broad range of values covers approximately 95% of
sales, while its most likely range applies to roughly
80% of sales. However, estimates from neither
brokerage are guaranteed to reflect actual market
prices.
$11
$13
$15
$17
$19
$21
$23
$25
$27
$29
Napa ValleyCalifornia Wine Varietals Pricing Trends
April 1, 2013 to November 1, 2013
Cabernet Merlot Pinot Noir Chardonnay
(Pric
ep
er G
allo
n)
$9
$11
$13
$15
$17
$19
$21
$23
Sonoma ValleyCalifornia Wine Varietals Pricing Trends
April 1, 2013 to November 1, 2013
Cabernet Merlot Pinot Noir Chardonnay
(Pric
ep
er G
allo
n)
$450
$500
$550
$600
$650
$700
$750
$800
$850
$900
California Grape CrushPrice Per Ton by Type
2004 to 2013
Red Varietals White Varietals
Source: USDA, National Agricultural Statistics Service, California Field Office

8 March 2014 — Wine & Spirits Monitor
8 Pricing Trends
CORN
The USDA estimates the U.S. harvested a record corn
crop of 13,985 billion bushels in 2013/2104 from 92
million acres, with an average yield of 165.3 bushels
per acre. The current corn crop is up slightly from
the prior year’s record of 13,925 billion bushels.
High inventory levels will mean bigger inventories
before next year’s harvests, leaving stockpiles on
August 31, 2015 at 2.111 billion bushels, which would
be the highest since 2005 and 43% larger than the
1.481 billion projected for a year earlier, according to
the USDA.
“Better weather is likely to improve corn...yields this
year,” said Mark Ash, a USDA economist.
“Even with smaller global crops, large carryover
stocks of corn...will sustain competition for U.S.
exports. Crop prices will continue to decline.”
The monthly average farm price received for corn has
decreased for the 12 months ended January 2014
from $7.04 per bushel in February 2013 to $4.42 per
bushel in January 2014, a decrease of 37.2%. The
price as of February 28 was $4.47 per bushel.
Due to these lower prices, the Department of
Agriculture said U.S. farmers were likely to plant less
corn in the upcoming season, switching land to
soybeans and wheat instead, but that normal weather
would still result in bumper crops all around.
$4.00
$4.50
$5.00
$5.50
$6.00
$6.50
$7.00
$7.50
$8.00
U.S. Corn Average Farm Price ReceivedFor the 12 Months Ended January 2014 versus 2013
2013/2014 2012/2013
(Pric
e p
er B
ushe
l)
Source: USDA, National Agricultural Statistics Service

9 March 2014 — Wine & Spirits Monitor
9 Pricing Trends
WHEAT
According to the USDA’s Wheat Outlook, the
2013/2014 season‐average farm price range
approximates $6.85 to $6.95 per bushel, which is a
decrease from the record $7.77 per bushel reported
for the 2012/2013 season.
U.S. wheat inventories are expected to rise to 587
million bushels before the 2015 harvest, compared
with 558 million projected for June 1, according to the
USDA. Production may rise 1.4% to 2.16 billion
bushels as farmers harvest a larger percentage of
planted acreage.
The monthly average farm price received for wheat
decreased from $7.00 per bushel in October 2013 to
$6.31 per bushel in January 2014, a decline of 9.9%.
The price as of February 28 was $6.67 per bushel.
$6.30
$6.50
$6.70
$6.90
$7.10
$7.30
$7.50
$7.70
$7.90
$8.10
$8.30
$8.50
Wheat U.S. Average Farm Price ReceivedFor the 12 Months Ended January 2014 versus 2013
2013/2014 2012/2013Source: USDA, National Agricultural Statistics Service
(Pric
ep
er B
ushe
l)

10 March 2014 — Wine & Spirits Monitor
10 Wine and Spirits Reference Sheet
PRICING TRENDS
Bulk Wine (California Varietals) – Percent change in varietal prices from the previous period
Region Date Varietal
Cabernet Merlot Pinot Noir Chardonnay
Napa Valley
January 1, 2014 4% (3%) 6% (4%)
November 1, 2013 (4%) (3%) (3%) 14%
June 1, 2013 (4%) (6%) (3%) (15%)
Sonoma Valley
January 1, 2014 0% (17%) 0% (9%)
November 1, 2013 8% (14%) 0% 16%
June 1, 2013 0% 0% (9%) (17%)
Central Valley
January 1, 2014 (14%) (8%) 0% 12%
November 1, 2013 0% (4%) ‐ 6%
June 1, 2013 0% 4% ‐ (20%)
U.S. Wheat – Farm Price Received ($ per bushel)
Marketing Year January February November October September August July June
2014/2013 $6.31 $6.73 $6.85 $7.00 $6.80 $6.87 $6.93 $7.32
2013/2012 $8.12 $8.30 $8.47 $8.38 $8.27 $8.04 $7.89 $6.70
Change (28.7%) (23.3%) (23.6%) (19.7%) (21.6%) (17.0%) (13.9%) 8.5%
U.S. Corn – Farm Price Received ($ per bushel)
Marketing Year January December November October September August
2014/2013 $4.42 $4.31 $4.35 $4.61 $5.40 $6.21
2013/2012 $6.96 $6.87 $7.01 $6.78 $6.89 $7.63
Change (57.5%) (59.4%) (61.1%) (47.1%) (27.6%) (22.9%)
July
$6.79
$7.14
(5.2%)
June
$6.97
$6.37
8.6%

11 March 2014 — Wine & Spirits Monitor
11 Experience
GA was involved in the liquidation of Havens Wine Cellars and Billington Imports LLC and has liquidated several
national and regional grocery stores that included wine and spirits such as A&P, Andronicos, Cost Cutter, Food
Pavilion, and The Markets. GA has also worked with and appraised numerous companies within the wine and spirits
industry. While our clients remain confidential, they include industry leaders, including large distributors and
specialty retailers of alcoholic beverages, producers of wine and beer, and national and regional grocery stores.
Products have included a wide variety of value‐priced, mid‐tier, premium, and ultra‐premium brands throughout the
industry including highly recognizable and reputable names. GA’s extensive list of appraisal experience includes:
Leading regional distributors of spirits, wine, and
beer with products such as vodka, whiskey, cognac,
rum, brandy, scotch, tequila, various wines, craft
beers, and non‐alcoholic beverages such as mixers,
water, and carbonated drinks.
Producers and rectifiers of whiskey and other
distilled spirits, including vodka, gin, tequila,
liqueurs, and absinthe, which are sold under well‐
recognized, nationally distributed brands.
A producer and distributor of private label wine,
beer, and spirits for large retailers primarily in the
U.S. and the U.K.
One of the largest specialty retailers of alcoholic
beverages in the West that offers more than 3,000
types of wine, 1,500 types of spirits, and 1,200 types
of beer.
One of the largest distributors of wine and spirits in
the U.S. with revenues of over $1.5 billion and
servicing liquor stores, grocery stores, restaurants,
and bars, as well as casinos and reservations.
National and regional grocery stores that sell a
wide variety of beer, wine, and spirits.
In addition to our vast liquidation and appraisal experience, GA maintains contacts within the wine and spirits industry that we utilize for insight and perspective on recovery values.
In addition to wholesalers of case and bulk wine, including those mentioned on the previous page, GA also maintains
extensive appraisal experience with numerous domestic wineries, allowing for additional specialization:
A well‐known producer of ultra‐premium, luxury
wines from estate vineyards in Napa Valley and
Anderson Valley, as well as from vineyards in the
Russian River Valley and Sonoma Valley.
A producer of wines originating primarily from
California’s North and Central Coasts, as well as
from the Lodi AVA in the Central Valley, which are
sold under its well‐known labels throughout the
U.S. and the world.
A producer of moderate‐ to high‐end wines, with
varietals including pinot noir and chardonnay and
sourced from its three estate vineyards in the
Carneros American Viticulture Area, while the
remainder is sourced from growers primarily in the
same AVA in Napa and Sonoma counties.
A bottler and distributor of wines under several
proprietary labels, with varietals including cabernet
sauvignon, chardonnay, meritage, and zinfandel,
sourced from California and internationally.
A Napa Valley producer of high‐end wines sold
under its well‐known proprietary labels, with over
99% of its grapes sourced from its 235‐acre estate
vineyard in Rutherford, California.
A producer and marketer of moderate‐ to high‐end
wines in the Napa Valley and Sonoma County, all
of which are produced with estate‐grown fruit and
sold under three owned brands.
A producer of moderate‐ to high‐priced wines in
the Pacific Northwest and California including
eight well‐known brands with an annual
production of over half a million cases.
A high‐end producer of wines, including Bordeaux‐
style blends and varietals such as merlot,
chardonnay, and pinot noir, which are sourced
from its own 100‐acre vineyard near Napa,
California, while the remainder is from several
California vineyards.
Numerous importers and marketers of more than
500 foreign and domestic brands of wine.

12 March 2014 — Wine & Spirits Monitor
12 Monitor Information
The Wine & Spirits Monitor relates information covering most wine and spirits, including industry
trends, market pricing, and their relation to our valuation process. GA provides our customer base
with a concise document highlighting the wine and spirits industry. Due to the commodity nature of
bulk wine and spirits, timely reporting is necessary to understand an ever‐changing marketplace. GA
strives to contextualize important indicators in order to provide a more in‐depth perspective of the
market as a whole. GA welcomes the opportunity to make our expertise available to you in every
possible way. Should you need any further information or wish to discuss recovery ranges for a
particular segment, please feel free to contact your GA Business Development Officer using the contact
information shown in this and all Wine & Spirits Monitor issues.
GA’s Wine & Spirits Monitor provides market value and industry trend information for a variety of
wine and spirits. The information contained herein is based on a composite of GA’s industry
expertise, contact with industry personnel, liquidation and appraisal experience, and data compiled
from a variety of well‐respected sources believed to be reliable. We do not guarantee the
completeness of such information or make any representation as to its accuracy.

13 March 2014 — Wine & Spirits Monitor
13 Appraisal & Valuation Team
BUSINESS DEVELOPMENT
Lester Friedman
Chief Executive Officer
(818) 884‐3737
Ken Bloore
Chief Operating Officer
(818) 884‐3737
Paul Arceri
Director, Wine and Spirits Specialist
(818) 884‐3737
Timothy Sands
Associate Project Manager, Wine and Spirits Specialist
(818) 884‐3737
About Great American Group
GA is a leading provider of asset disposition solutions and valuation and appraisal services to a wide
range of retail, wholesale, and industrial clients, as well as lenders, capital providers, private equity
investors, and professional services firms. In addition to the Wine & Spirits Monitor, GA also provides
clients with industry expertise in the form of monitors for the U.S. chemicals and plastics; metals;
building materials and woodworking equipment; food; automotive; and textiles and apparel industries,
among others. GA also offers Europe Monitors via its subsidiary, GA Europe Valuations Limited.
Headquarters
21860 Burbank Blvd. Suite 300 South
Woodland Hills, CA 91367 800‐45‐GREAT www.greatamerican.com
OPERATIONS
Mike Marchlik
National Sales & Marketing Director
(818) 746‐9306
David Seiden
Executive Vice President, Southeast Region
(770) 551‐8114
Ryan Mulcunry
Executive Vice President ‐ Northeast Region, Canada & Europe
(617) 692‐8310
Bill Soncini
Senior Vice President, Midwest Region
(312) 777‐7945
Drew Jakubek
Managing Director, Southwest Region
(972) 996‐5632
Jennie Kim
Vice President, Western Region
(818) 746‐9370
Gordon Titley
Director of Valuations, GA Europe Valuations Limited
+44 (0) 20 7318‐0574