Windows 7 / Windows 8 Desktop User manual
31
Intel® Education Lab Camera by Intellisense Windows 7 / Windows 8 Desktop User manual CONTENTS Introduction General Information Common Features Time Lapse Kinematics Motion Cam Microscope Universal Logger Pathfinder Graph Challenge
Transcript of Windows 7 / Windows 8 Desktop User manual
Intel® Education Lab Camera by Intellisense
Windows 7 / Windows 8 DesktopUser manual
CONTENTS
IntroductionGeneral InformationCommon FeaturesTime LapseKinematicsMotion CamMicroscopeUniversal LoggerPathfinderGraph Challenge
Lab Camera is a web camera based natural science exploration and data logging laboratory that allowsstudents and teachers to carry out substantial scientific observations and measurements, using a computerand the software.
The software has currently seven functions all of them are very easy to use. Students can use it in class oreven to solve their homework, but it also encourages independent experiments that can be carried outeffectively, giving further boosts to Science based subjects. Lab Camera arouses curiosity about thesurrounding world around you and it ignites creativity in how you explore it.
This User Guide provides an overview of the components and all features of LabCam.
Enjoy experimenting!
Protect the environment & yourself
Please do not harm any animals, plants, or the surrounding environment when you carry out experimentswith LabCam. Experiment responsibly and carefully for your own safety. Lab Camera takes noresponsibility for any damages that might occur during your use of the software. While we are confidentthat Lab Camera is one of the safest ways to undertake science experiments, please enjoy the software atyour own risk!
INTRODUCTION
GENERAL INFORMATION
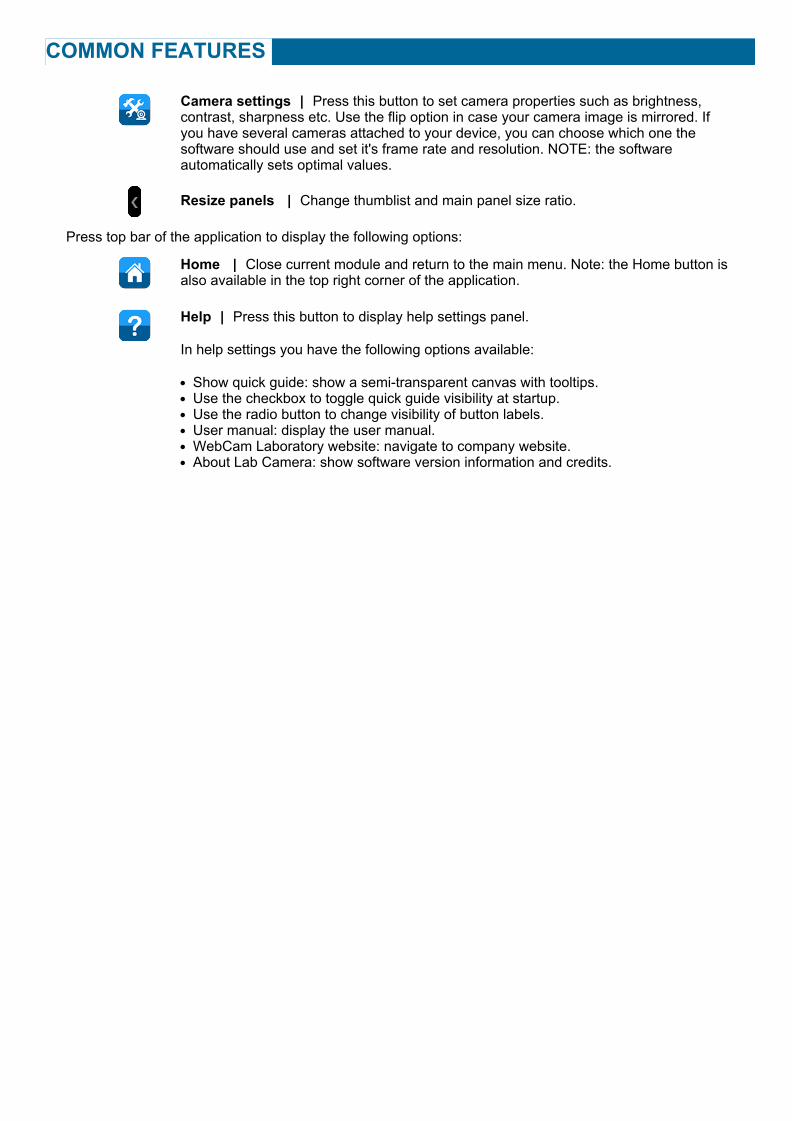
Camera settings | Press this button to set camera properties such as brightness,contrast, sharpness etc. Use the flip option in case your camera image is mirrored. Ifyou have several cameras attached to your device, you can choose which one thesoftware should use and set it's frame rate and resolution. NOTE: the softwareautomatically sets optimal values.
Resize panels | Change thumblist and main panel size ratio.
Press top bar of the application to display the following options:
Home | Close current module and return to the main menu. Note: the Home button isalso available in the top right corner of the application.
Help | Press this button to display help settings panel.
In help settings you have the following options available:
Show quick guide: show a semi-transparent canvas with tooltips.Use the checkbox to toggle quick guide visibility at startup.Use the radio button to change visibility of button labels.User manual: display the user manual.WebCam Laboratory website: navigate to company website.About Lab Camera: show software version information and credits.
COMMON FEATURES
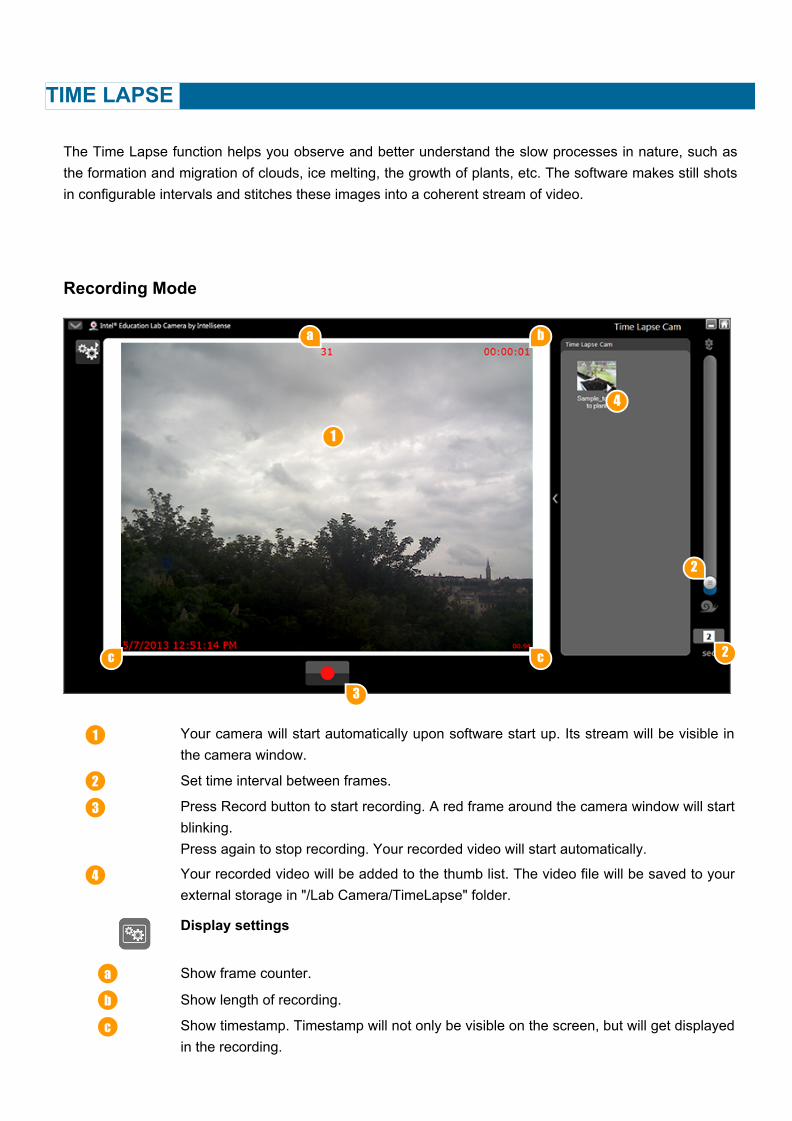
The Time Lapse function helps you observe and better understand the slow processes in nature, such asthe formation and migration of clouds, ice melting, the growth of plants, etc. The software makes still shotsin configurable intervals and stitches these images into a coherent stream of video.
Recording Mode
Your camera will start automatically upon software start up. Its stream will be visible inthe camera window.
Set time interval between frames.
Press Record button to start recording. A red frame around the camera window will startblinking. Press again to stop recording. Your recorded video will start automatically.
Your recorded video will be added to the thumb list. The video file will be saved to yourexternal storage in "/Lab Camera/TimeLapse" folder.
Display settings
Show frame counter.
Show length of recording.
Show timestamp. Timestamp will not only be visible on the screen, but will get displayedin the recording.
TIME LAPSE
1
2
2
3
4
a b
c c
1
2
3
4
a
b
c

Show frame intervals.d
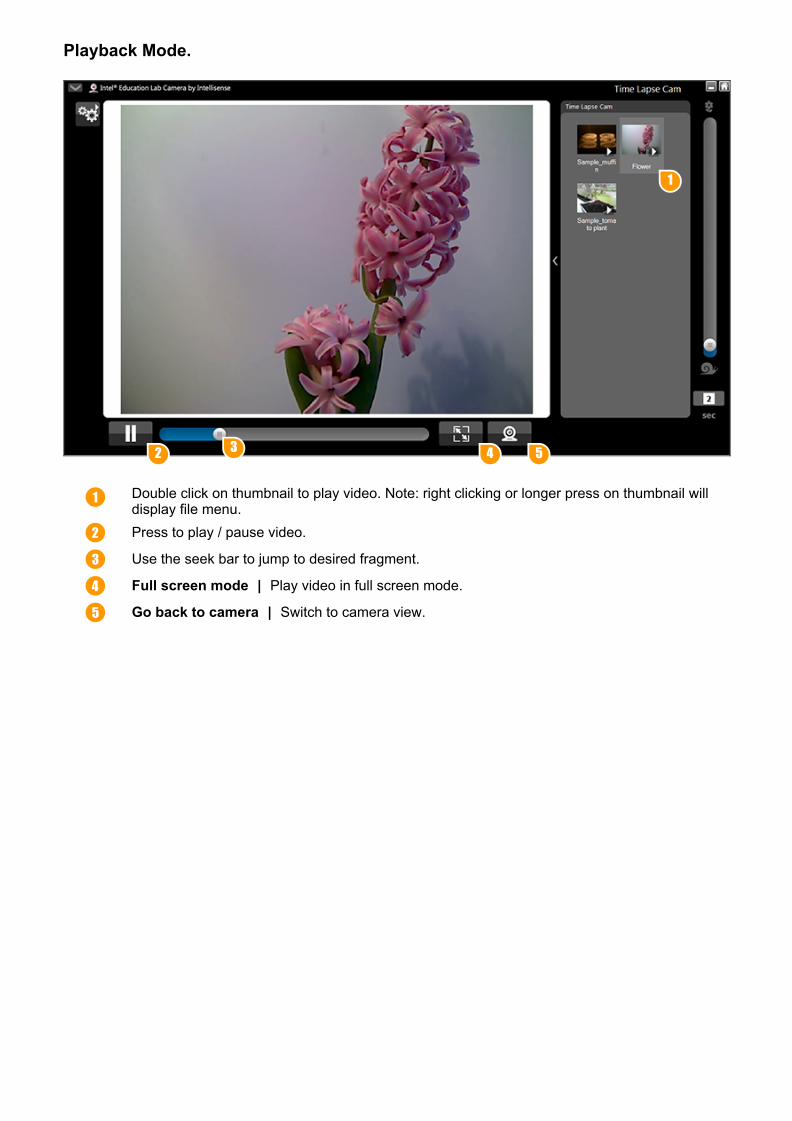
Playback Mode.
Double click on thumbnail to play video. Note: right clicking or longer press on thumbnail willdisplay file menu.Press to play / pause video.
Use the seek bar to jump to desired fragment.
Full screen mode | Play video in full screen mode.
Go back to camera | Switch to camera view.
1
2 3 4 5
1
2
3
4
5
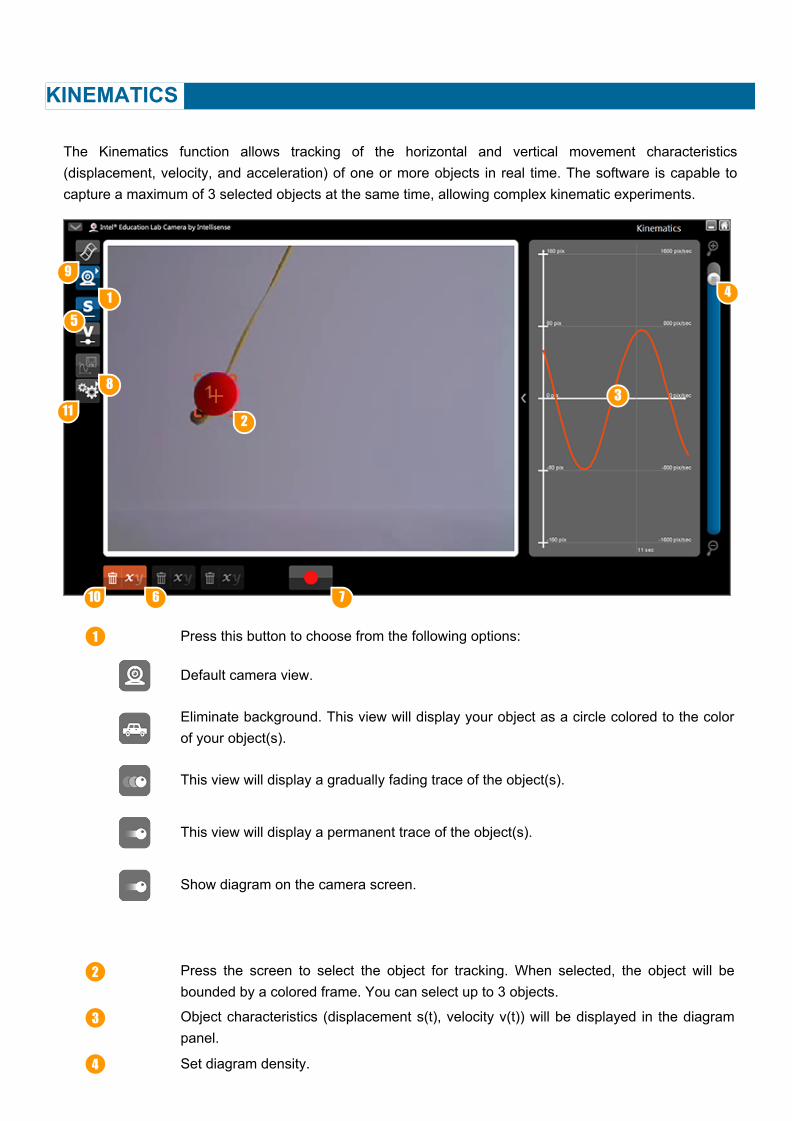
The Kinematics function allows tracking of the horizontal and vertical movement characteristics(displacement, velocity, and acceleration) of one or more objects in real time. The software is capable tocapture a maximum of 3 selected objects at the same time, allowing complex kinematic experiments.
Press this button to choose from the following options:
Default camera view.
Eliminate background. This view will display your object as a circle colored to the colorof your object(s).
This view will display a gradually fading trace of the object(s).
This view will display a permanent trace of the object(s).
Show diagram on the camera screen.
Press the screen to select the object for tracking. When selected, the object will bebounded by a colored frame. You can select up to 3 objects.
Object characteristics (displacement s(t), velocity v(t)) will be displayed in the diagrampanel.
Set diagram density.
KINEMATICS
1
2
3
4
5
6 7
8
9
10
11
1
2
3
4
Choose to display displacement, velocity or both.
Choose which axis you would like to monitor. Press to select x, y or xy.
Press to start recording. A red frame around the camera window will start blinking.
Press to display recorded diagram. NOTE: this button gets active after successfulrecording.
Load a pre-recorded video. This feature is particulary useful if there is no time for a real-time setup or the experiment can be dangerous.
Delete object.
Press this button to choose from the following options:
Calibration process: Place an object of known size into the camera’s field of vision at thesame distance your target object is. Next mark the known size with the calibration tool,input the size value and define the measurement unit.
Set color sensitivity, diagram filter or toggle highlight mode. Use the red coordinate axesto define the origin of your object’s movement graph.
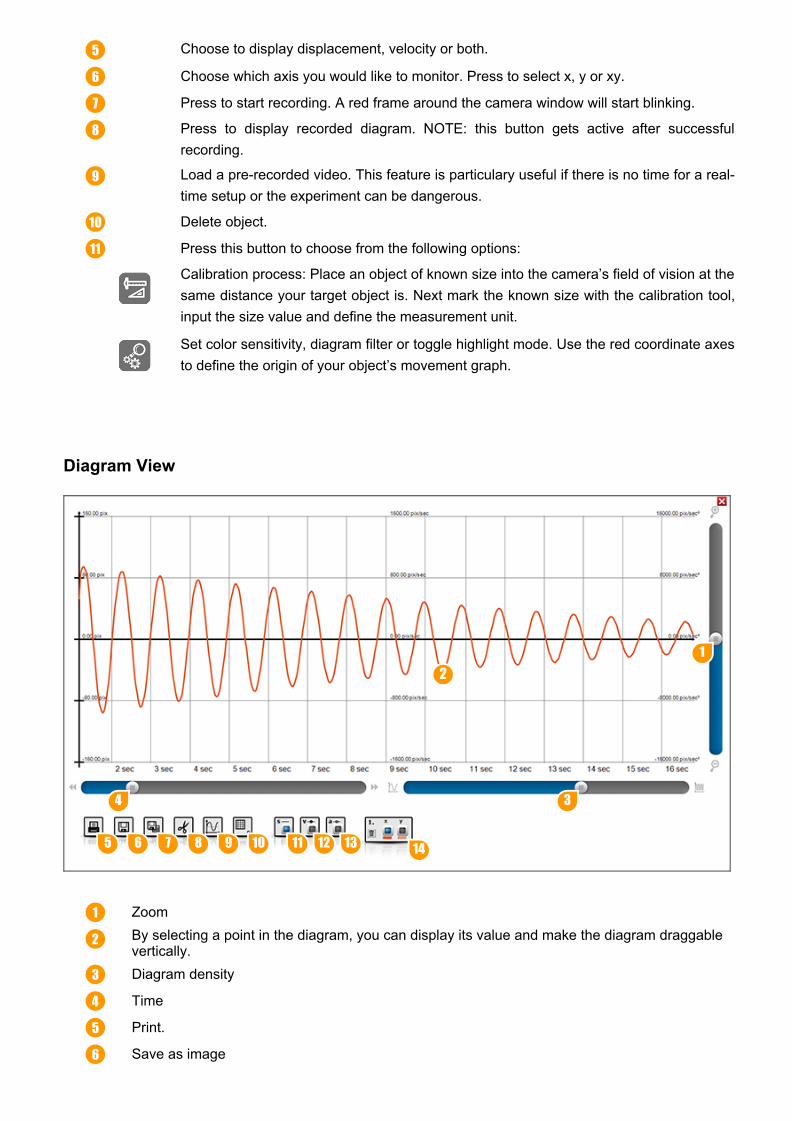
Diagram View
ZoomBy selecting a point in the diagram, you can display its value and make the diagram draggablevertically.Diagram density
Time
Print.
Save as image
5
6
7
8
9
10
11
12
34
5 6 7 8 9 10 11 12 13 14
1
2
3
4
5
6
Save data table
Cut
Smooth diagram. Note: In some cases smoothing can significantly alter your diagram.
Set grid density.
Display s(t) (displacement).
Display v(t) (velocity).
Display a(t) (acceleration).
Chose movement axis along which you would like to display your diagram.
7
8
9
10
11
12
13
14
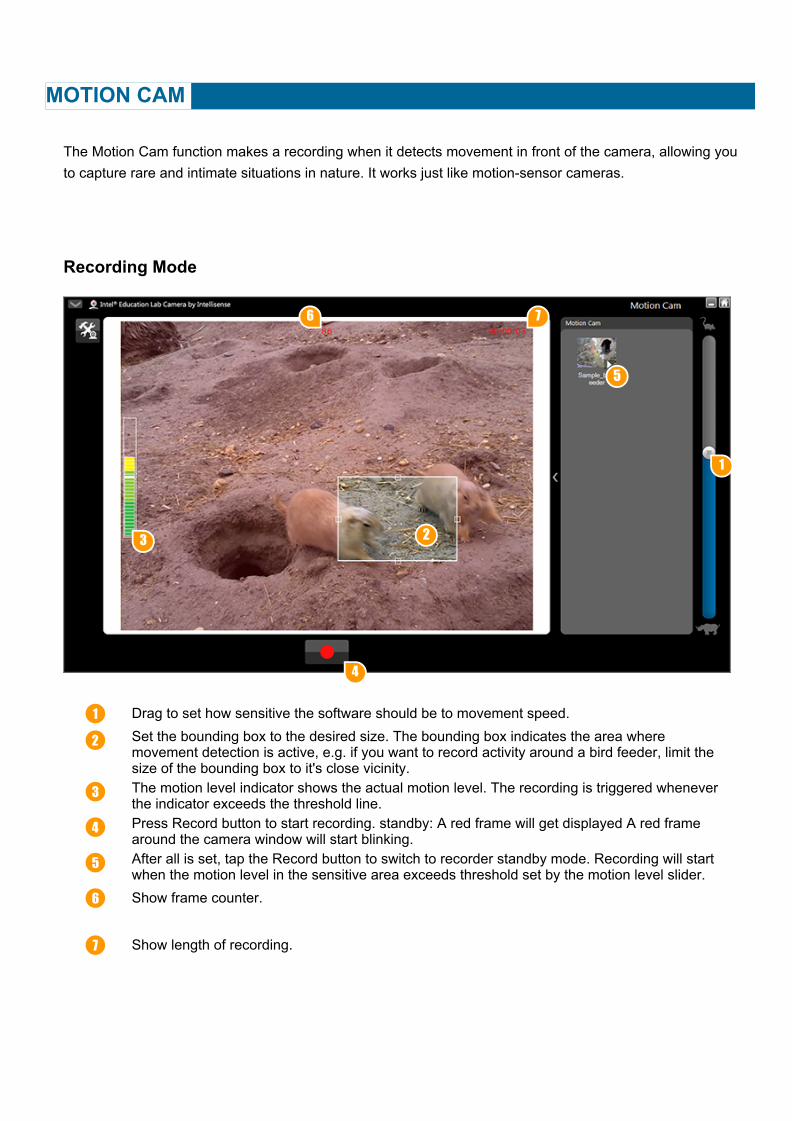
The Motion Cam function makes a recording when it detects movement in front of the camera, allowing youto capture rare and intimate situations in nature. It works just like motion-sensor cameras.
Recording Mode
Drag to set how sensitive the software should be to movement speed.Set the bounding box to the desired size. The bounding box indicates the area wheremovement detection is active, e.g. if you want to record activity around a bird feeder, limit thesize of the bounding box to it's close vicinity.The motion level indicator shows the actual motion level. The recording is triggered wheneverthe indicator exceeds the threshold line.Press Record button to start recording. standby: A red frame will get displayed A red framearound the camera window will start blinking.After all is set, tap the Record button to switch to recorder standby mode. Recording will startwhen the motion level in the sensitive area exceeds threshold set by the motion level slider.Show frame counter.
Show length of recording.
MOTION CAM
1
23
4
5
6 7
1
2
3
4
5
6
7
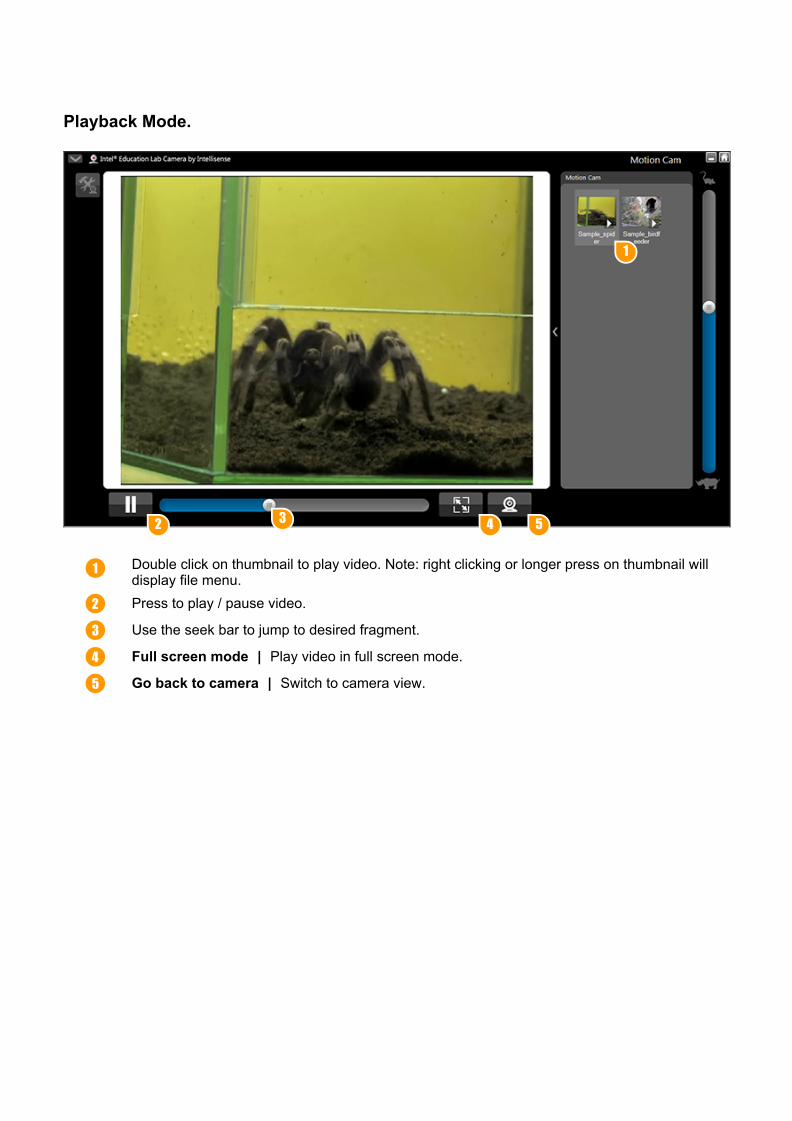
Playback Mode.
Double click on thumbnail to play video. Note: right clicking or longer press on thumbnail willdisplay file menu.Press to play / pause video.
Use the seek bar to jump to desired fragment.
Full screen mode | Play video in full screen mode.
Go back to camera | Switch to camera view.
1
2 3 4 5
1
2
3
4
5
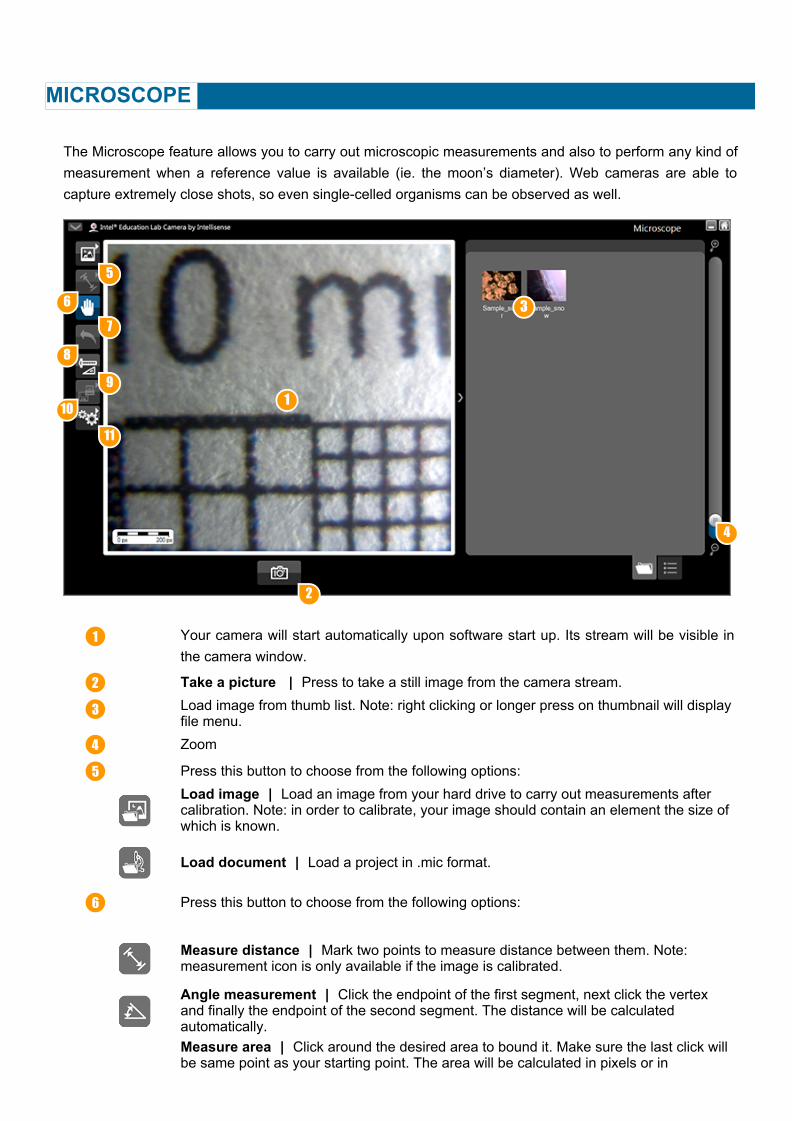
The Microscope feature allows you to carry out microscopic measurements and also to perform any kind ofmeasurement when a reference value is available (ie. the moon’s diameter). Web cameras are able tocapture extremely close shots, so even single-celled organisms can be observed as well.
Your camera will start automatically upon software start up. Its stream will be visible inthe camera window.
Take a picture | Press to take a still image from the camera stream.Load image from thumb list. Note: right clicking or longer press on thumbnail will displayfile menu.Zoom
Press this button to choose from the following options:Load image | Load an image from your hard drive to carry out measurements aftercalibration. Note: in order to calibrate, your image should contain an element the size ofwhich is known.
Load document | Load a project in .mic format.
Press this button to choose from the following options:
Measure distance | Mark two points to measure distance between them. Note:measurement icon is only available if the image is calibrated.
Angle measurement | Click the endpoint of the first segment, next click the vertexand finally the endpoint of the second segment. The distance will be calculatedautomatically.Measure area | Click around the desired area to bound it. Make sure the last click willbe same point as your starting point. The area will be calculated in pixels or in
MICROSCOPE
1
2
3
4
5
67
8
9
10
11
1
2
3
4
5
6
measurement units defined during calibration. The more segments you define, thecloser your measurement will be to the area of the real object.
Move the image | Click and drag to pan your image when zoomed.Undo | Press to undo last measurent. You can undo as many measurements as youwant.Size calibration | Calibration enables you to carry out measurements based on areference item. Place an object of known size in front of the camera and click thecalibration button. Next mark the starting and ending points of the known segment anddefine the value and measurement units. From now on all measutrements will becalculated in reference to the defined segment.Press this button to choose from the following options:
Save in image format | You can save your work as plain image, image along withyour measurements and as a measurement protocol page.
Print | Print your work as plain image, image along with your measurements or as ameasurement protocol page.
Save in Microscope format | Your project will be saved in .mic format for later use.
Press this button to choose from the following options:
Visual settings | Correct your still image by fine tuning it’s brightness, contrast andhues.
Color schemes | Change the color of your measuring tool. Default is red. You canchose different colors for different categories of items.
7
8
9
10
11
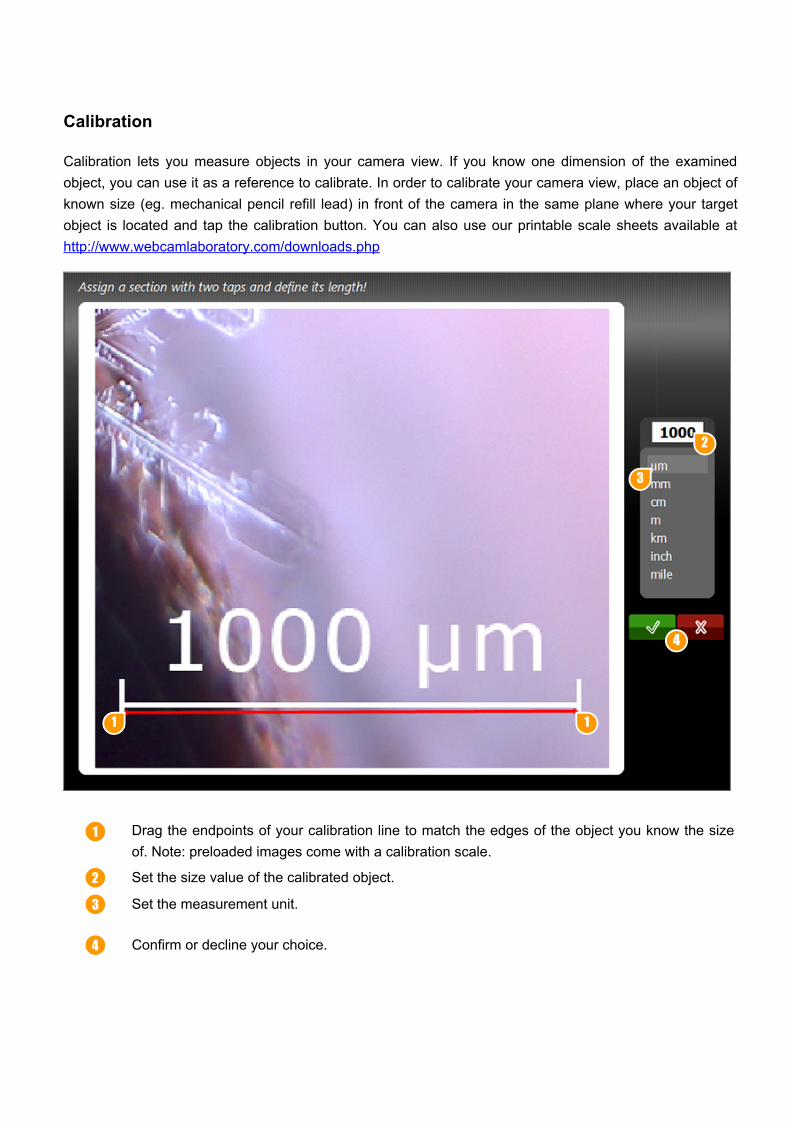
Calibration
Calibration lets you measure objects in your camera view. If you know one dimension of the examinedobject, you can use it as a reference to calibrate. In order to calibrate your camera view, place an object ofknown size (eg. mechanical pencil refill lead) in front of the camera in the same plane where your targetobject is located and tap the calibration button. You can also use our printable scale sheets available athttp://www.webcamlaboratory.com/downloads.php
Drag the endpoints of your calibration line to match the edges of the object you know the sizeof. Note: preloaded images come with a calibration scale.
Set the size value of the calibrated object.
Set the measurement unit.
Confirm or decline your choice.
1 1
2
3
4
1
2
3
4
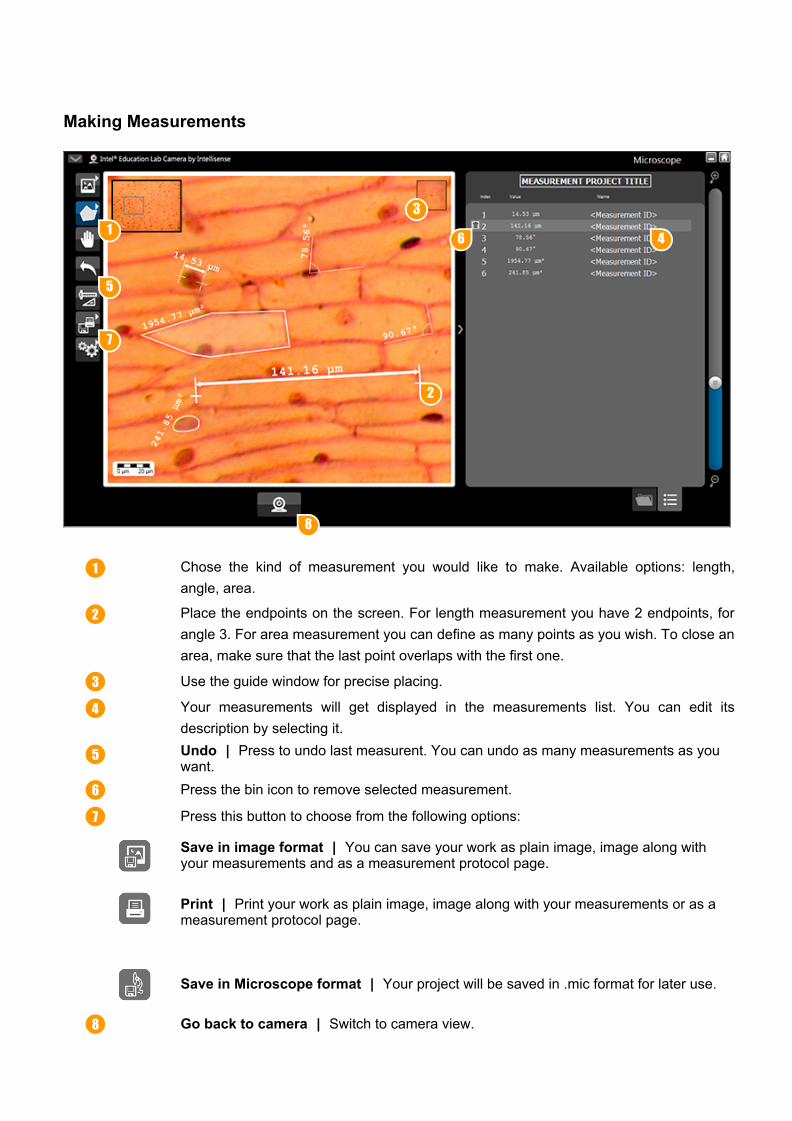
Making Measurements
Chose the kind of measurement you would like to make. Available options: length,angle, area.
Place the endpoints on the screen. For length measurement you have 2 endpoints, forangle 3. For area measurement you can define as many points as you wish. To close anarea, make sure that the last point overlaps with the first one.
Use the guide window for precise placing.
Your measurements will get displayed in the measurements list. You can edit itsdescription by selecting it.Undo | Press to undo last measurent. You can undo as many measurements as youwant.Press the bin icon to remove selected measurement.
Press this button to choose from the following options:
Save in image format | You can save your work as plain image, image along withyour measurements and as a measurement protocol page.
Print | Print your work as plain image, image along with your measurements or as ameasurement protocol page.
Save in Microscope format | Your project will be saved in .mic format for later use.
Go back to camera | Switch to camera view.
1
2
3
4
5
6
7
8
1
2
3
4
5
6
7
8
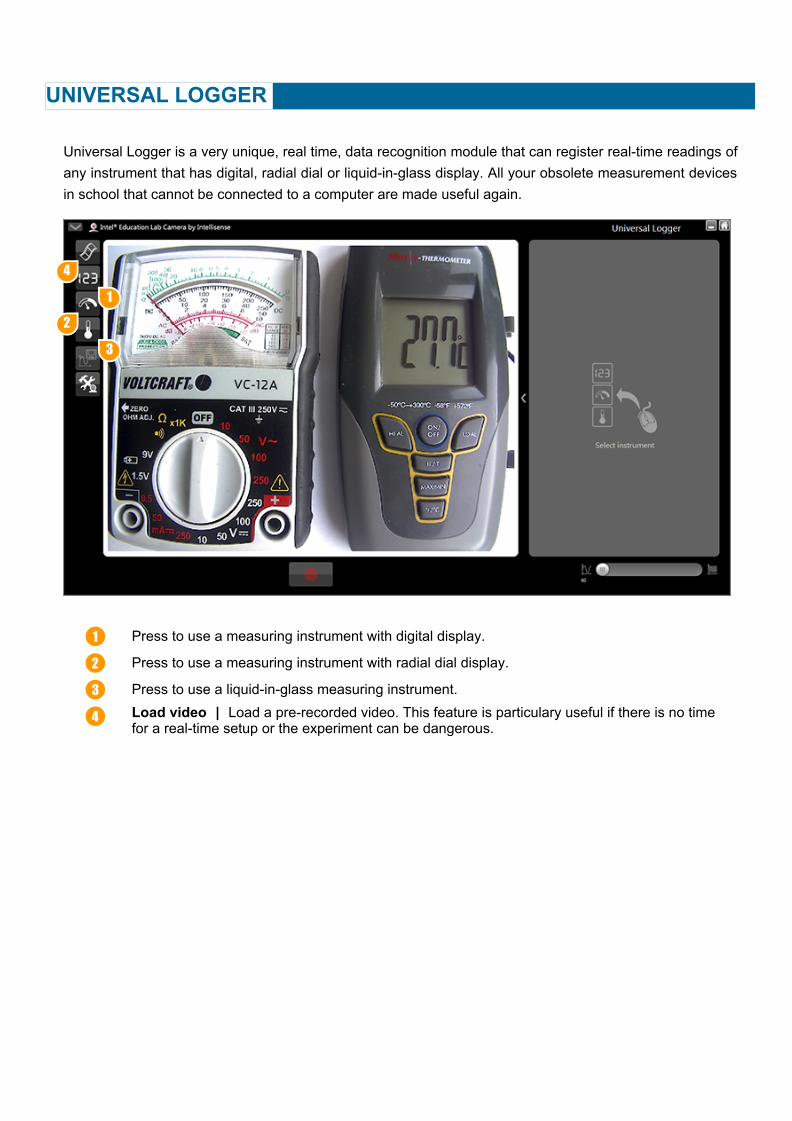
Universal Logger is a very unique, real time, data recognition module that can register real-time readings ofany instrument that has digital, radial dial or liquid-in-glass display. All your obsolete measurement devicesin school that cannot be connected to a computer are made useful again.
Press to use a measuring instrument with digital display.
Press to use a measuring instrument with radial dial display.
Press to use a liquid-in-glass measuring instrument.Load video | Load a pre-recorded video. This feature is particulary useful if there is no timefor a real-time setup or the experiment can be dangerous.
UNIVERSAL LOGGER
1
2
3
4
1
2
3
4
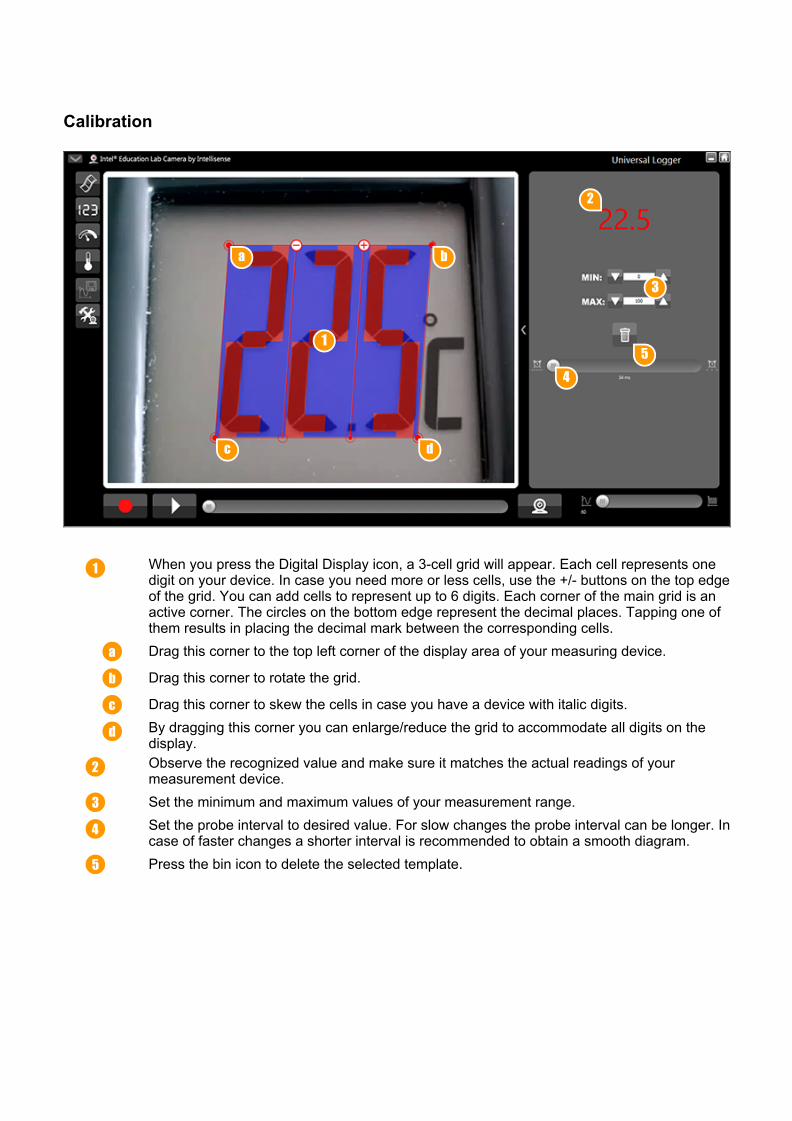
Calibration
When you press the Digital Display icon, a 3-cell grid will appear. Each cell represents onedigit on your device. In case you need more or less cells, use the +/- buttons on the top edgeof the grid. You can add cells to represent up to 6 digits. Each corner of the main grid is anactive corner. The circles on the bottom edge represent the decimal places. Tapping one ofthem results in placing the decimal mark between the corresponding cells.Drag this corner to the top left corner of the display area of your measuring device.
Drag this corner to rotate the grid.
Drag this corner to skew the cells in case you have a device with italic digits.By dragging this corner you can enlarge/reduce the grid to accommodate all digits on thedisplay.Observe the recognized value and make sure it matches the actual readings of yourmeasurement device.Set the minimum and maximum values of your measurement range.Set the probe interval to desired value. For slow changes the probe interval can be longer. Incase of faster changes a shorter interval is recommended to obtain a smooth diagram.Press the bin icon to delete the selected template.
1
a b
c d
2
3
45
1
a
b
c
d
2
3
4
5
The goal is to align the grid with the display in such a way that each cell covers one digit and the decimalmark is in the same place as on the device. NOTE: reflection of light and insufficient lighting may affect theaccuracy of readings.
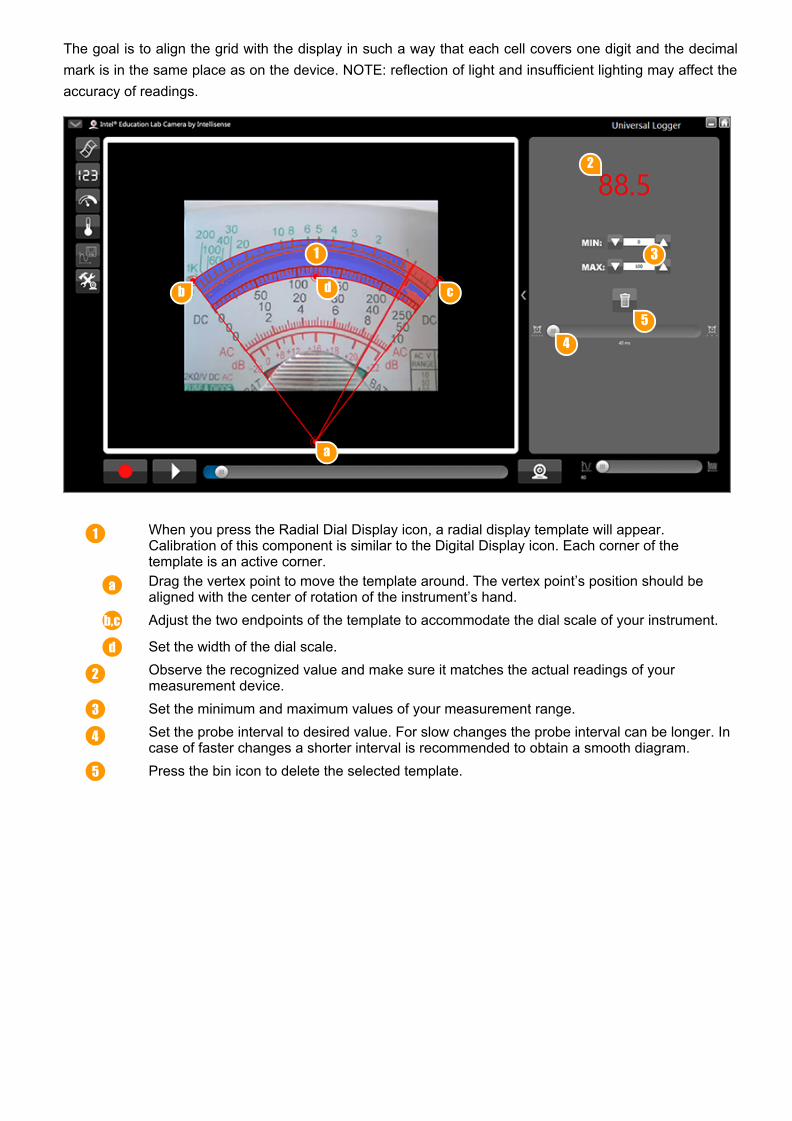
When you press the Radial Dial Display icon, a radial display template will appear.Calibration of this component is similar to the Digital Display icon. Each corner of thetemplate is an active corner.Drag the vertex point to move the template around. The vertex point’s position should bealigned with the center of rotation of the instrument’s hand.Adjust the two endpoints of the template to accommodate the dial scale of your instrument.
Set the width of the dial scale.Observe the recognized value and make sure it matches the actual readings of yourmeasurement device.Set the minimum and maximum values of your measurement range.Set the probe interval to desired value. For slow changes the probe interval can be longer. Incase of faster changes a shorter interval is recommended to obtain a smooth diagram.Press the bin icon to delete the selected template.
1
a
b cd
2
3
45
1
a
b,c
d
2
3
4
5
If setup is correct the arm of your template should cover the arm of your instrument. Set the minimum andmaximum values of your device using the right panel. Please also note that reflection of light andinsufficient lighting may affect the accuracy of readings.
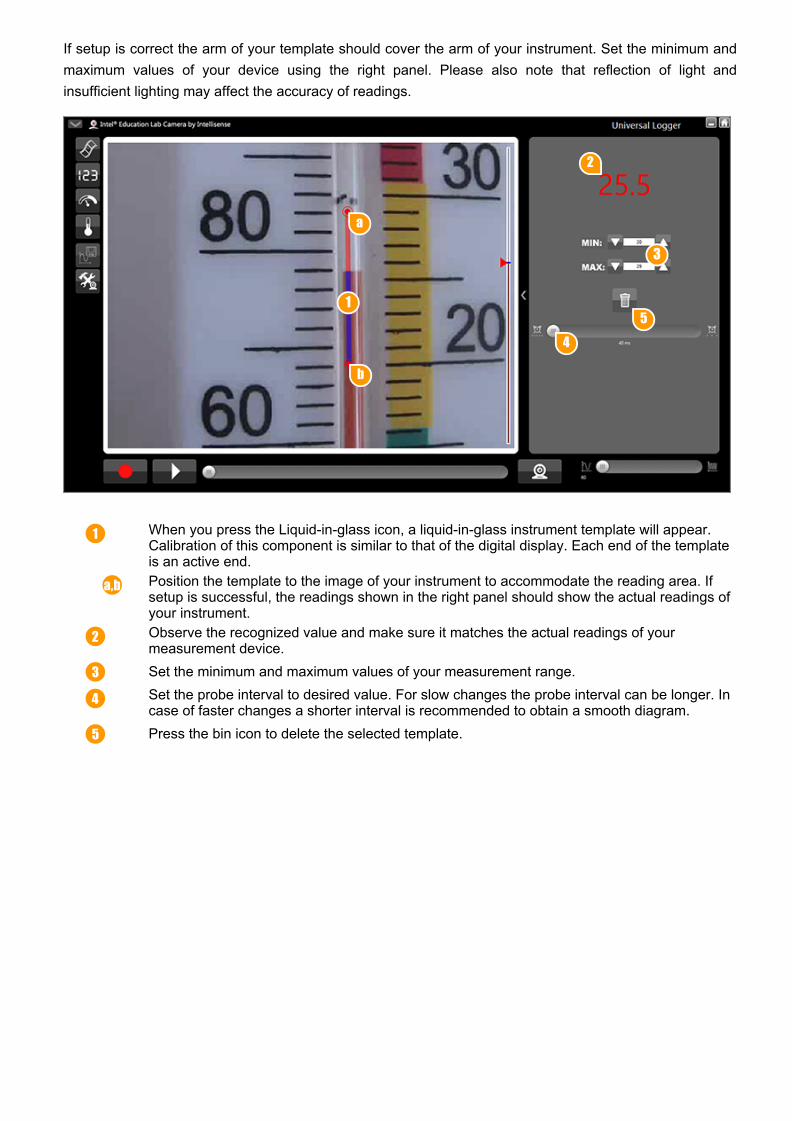
When you press the Liquid-in-glass icon, a liquid-in-glass instrument template will appear.Calibration of this component is similar to that of the digital display. Each end of the templateis an active end.Position the template to the image of your instrument to accommodate the reading area. Ifsetup is successful, the readings shown in the right panel should show the actual readings ofyour instrument.Observe the recognized value and make sure it matches the actual readings of yourmeasurement device.Set the minimum and maximum values of your measurement range.Set the probe interval to desired value. For slow changes the probe interval can be longer. Incase of faster changes a shorter interval is recommended to obtain a smooth diagram.Press the bin icon to delete the selected template.
1
a
b
2
3
45
1
a,b
2
3
4
5
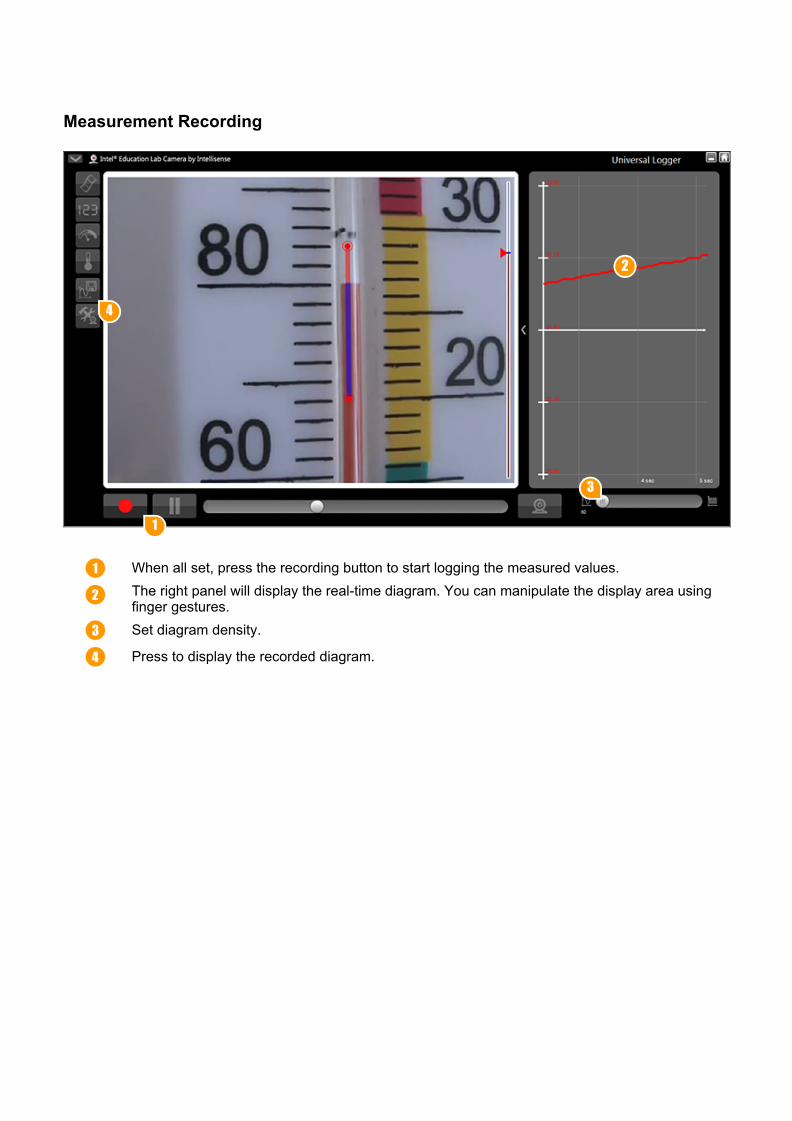
Measurement Recording
When all set, press the recording button to start logging the measured values.The right panel will display the real-time diagram. You can manipulate the display area usingfinger gestures.Set diagram density.
Press to display the recorded diagram.
1
2
3
4
1
2
3
4
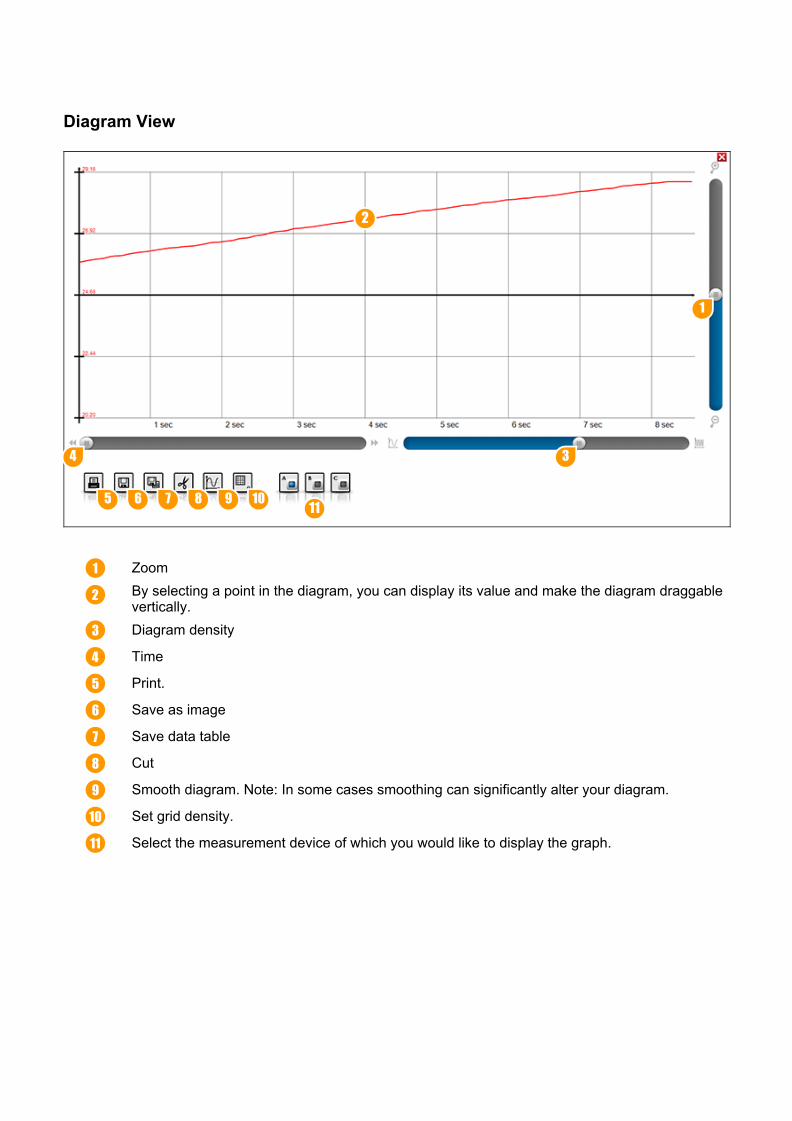
Diagram View
ZoomBy selecting a point in the diagram, you can display its value and make the diagram draggablevertically.Diagram density
Time
Print.
Save as image
Save data table
Cut
Smooth diagram. Note: In some cases smoothing can significantly alter your diagram.
Set grid density.
Select the measurement device of which you would like to display the graph.
1
2
34
5 6 7 8 9 10 11
1
2
3
4
5
6
7
8
9
10
11
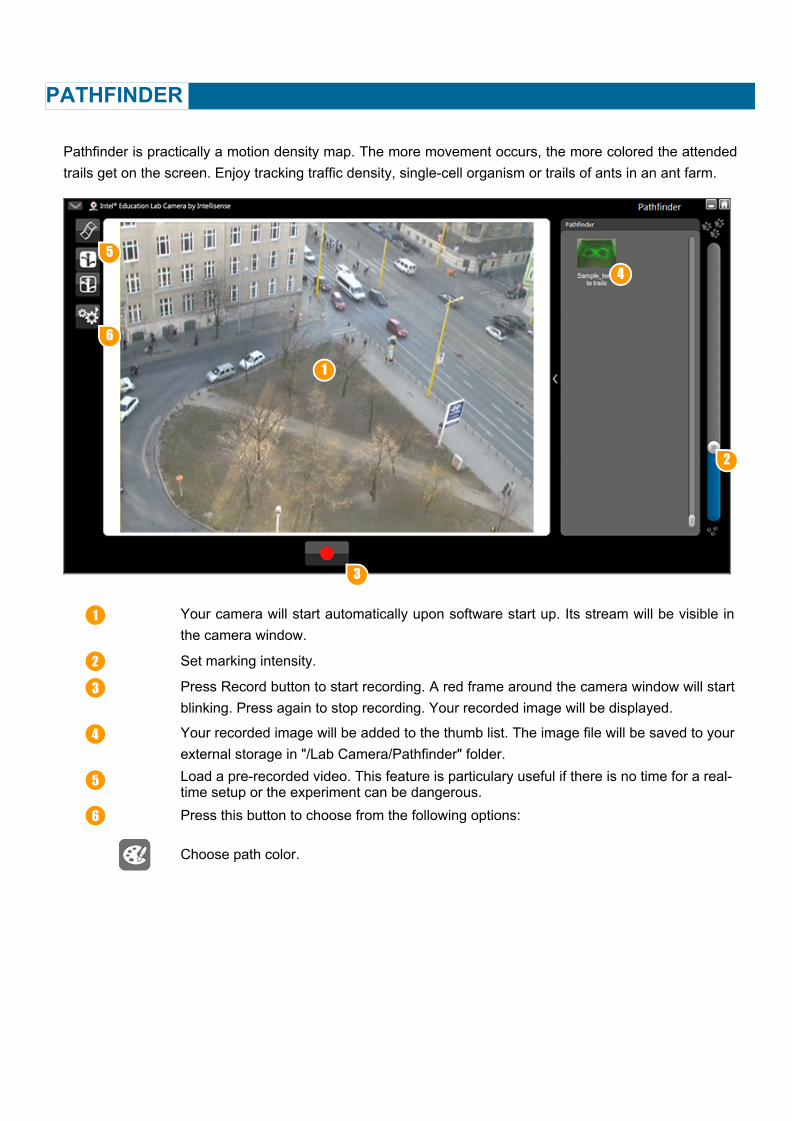
Pathfinder is practically a motion density map. The more movement occurs, the more colored the attendedtrails get on the screen. Enjoy tracking traffic density, single-cell organism or trails of ants in an ant farm.
Your camera will start automatically upon software start up. Its stream will be visible inthe camera window.
Set marking intensity.
Press Record button to start recording. A red frame around the camera window will startblinking. Press again to stop recording. Your recorded image will be displayed.
Your recorded image will be added to the thumb list. The image file will be saved to yourexternal storage in "/Lab Camera/Pathfinder" folder.Load a pre-recorded video. This feature is particulary useful if there is no time for a real-time setup or the experiment can be dangerous.Press this button to choose from the following options:
Choose path color.
PATHFINDER
1
2
3
45
6
1
2
3
4
5
6
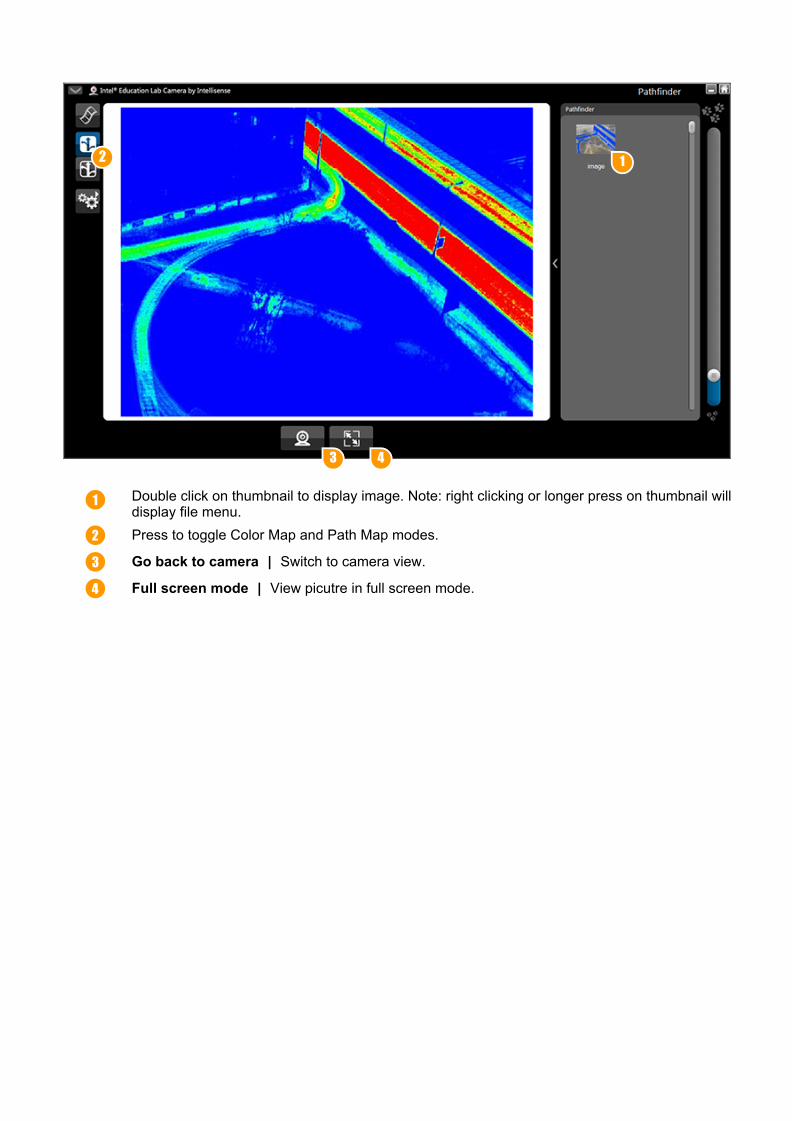
Double click on thumbnail to display image. Note: right clicking or longer press on thumbnail willdisplay file menu.Press to toggle Color Map and Path Map modes.
Go back to camera | Switch to camera view.
Full screen mode | View picutre in full screen mode.
12
3 4
1
2
3
4
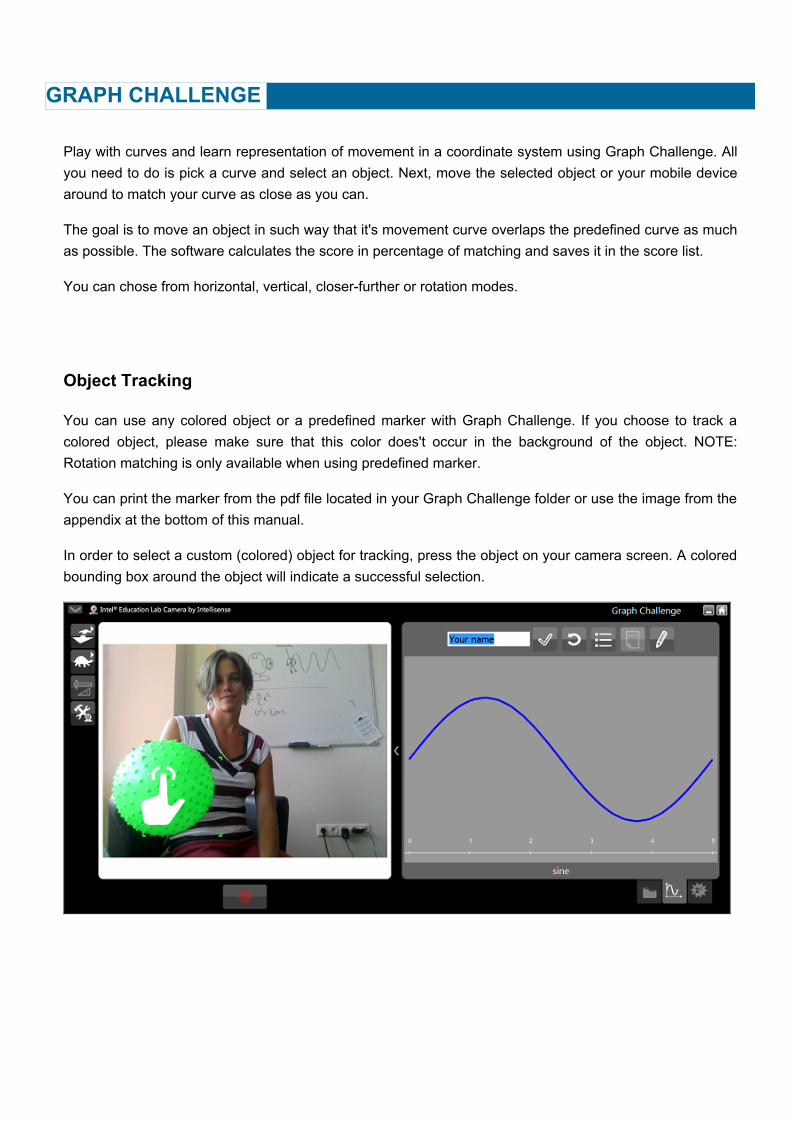
Play with curves and learn representation of movement in a coordinate system using Graph Challenge. Allyou need to do is pick a curve and select an object. Next, move the selected object or your mobile devicearound to match your curve as close as you can.
The goal is to move an object in such way that it's movement curve overlaps the predefined curve as muchas possible. The software calculates the score in percentage of matching and saves it in the score list.
You can chose from horizontal, vertical, closer-further or rotation modes.
Object Tracking
You can use any colored object or a predefined marker with Graph Challenge. If you choose to track acolored object, please make sure that this color does't occur in the background of the object. NOTE:Rotation matching is only available when using predefined marker.
You can print the marker from the pdf file located in your Graph Challenge folder or use the image from theappendix at the bottom of this manual.
In order to select a custom (colored) object for tracking, press the object on your camera screen. A coloredbounding box around the object will indicate a successful selection.
GRAPH CHALLENGE
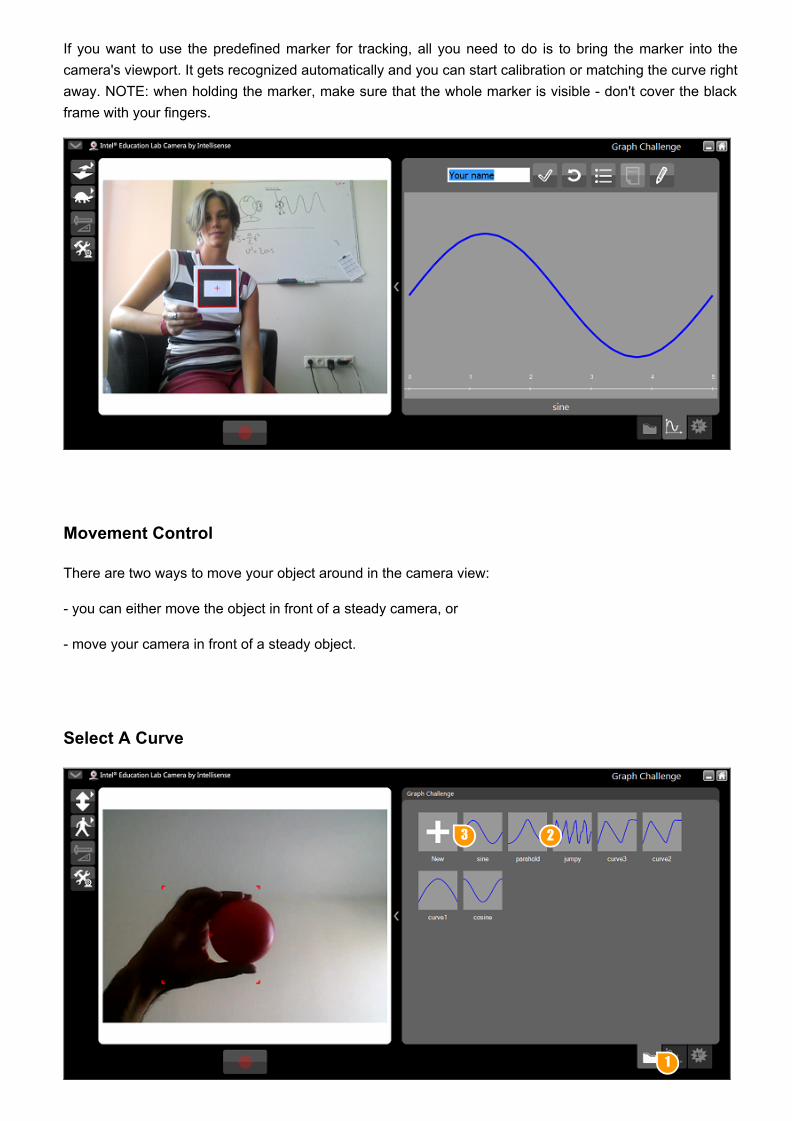
If you want to use the predefined marker for tracking, all you need to do is to bring the marker into thecamera's viewport. It gets recognized automatically and you can start calibration or matching the curve rightaway. NOTE: when holding the marker, make sure that the whole marker is visible - don't cover the blackframe with your fingers.
Movement Control
There are two ways to move your object around in the camera view:
- you can either move the object in front of a steady camera, or
- move your camera in front of a steady object.
Select A Curve
1
23
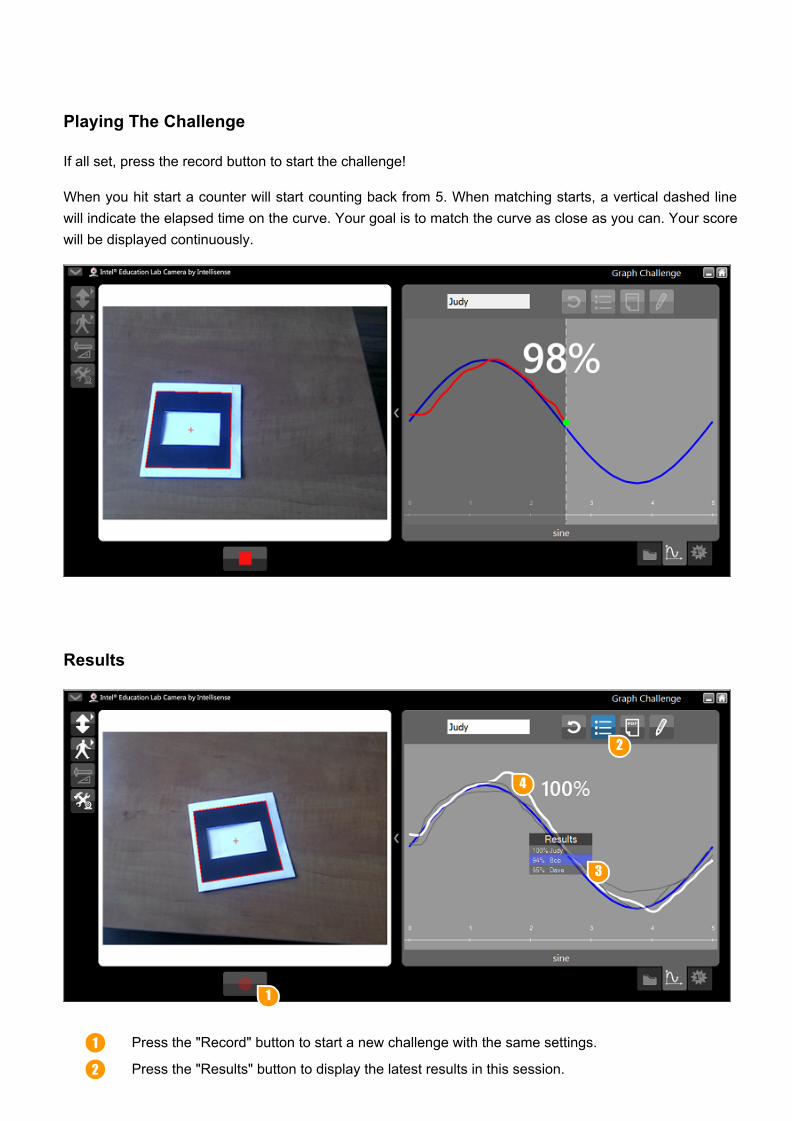
If all set, press the record button to start the challenge!
To select a curve, simply press its thumbnail
Press the "New" thumbnail to create a new curve. This action will open the editor window.Please find the editor help in the "Curve editor" section below
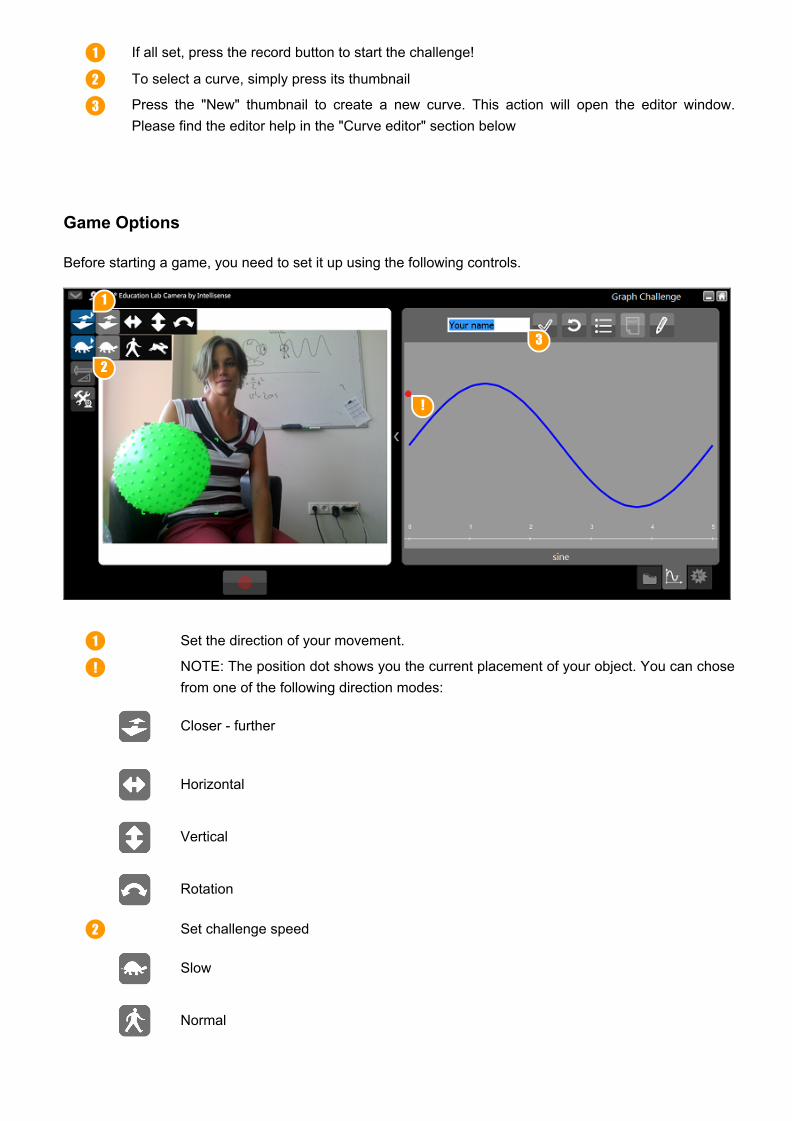
Game Options
Before starting a game, you need to set it up using the following controls.
Set the direction of your movement.
NOTE: The position dot shows you the current placement of your object. You can chosefrom one of the following direction modes:
Closer - further
Horizontal
Vertical
Rotation
Set challenge speed
Slow
Normal
1
2
3
1
2
3
!
1
!
2
Fast
Optionally, you can input your name here. This name will be displayed in the scorespanel and in the hall of fame. Inputting your name is particularly useful if several playerstake turns to match the same graph and would like to distinguish their results.
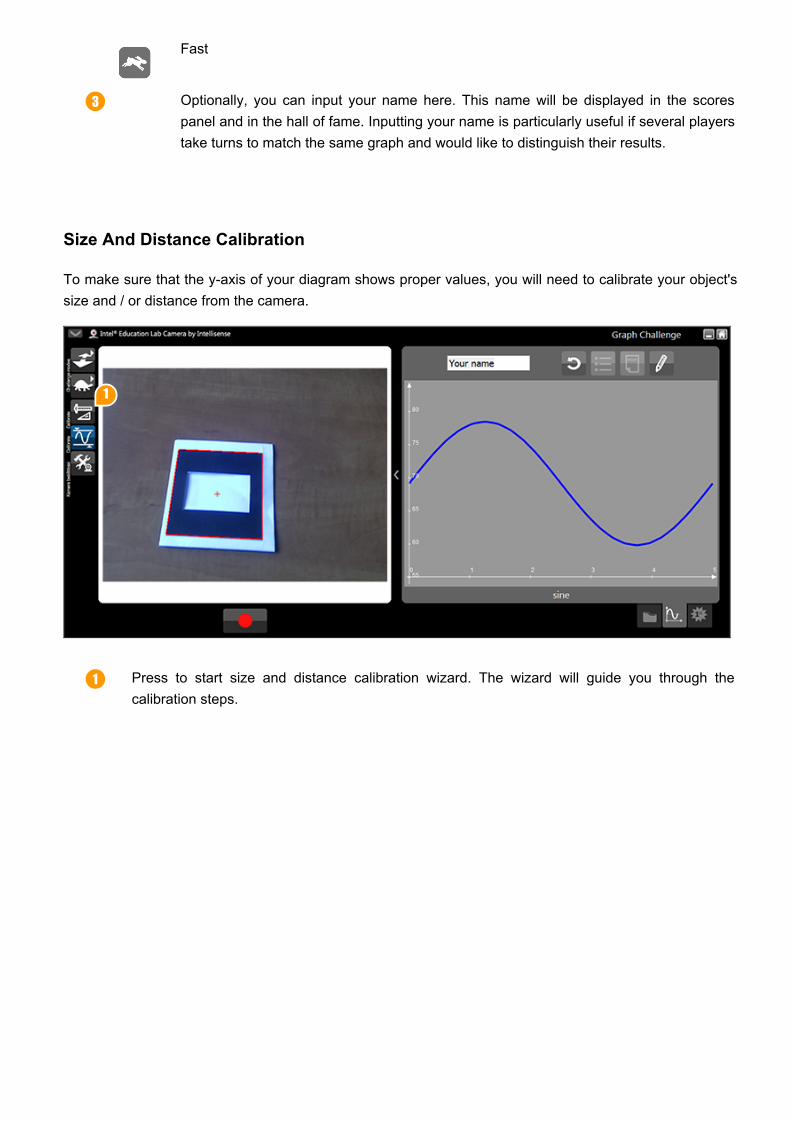
Size And Distance Calibration
To make sure that the y-axis of your diagram shows proper values, you will need to calibrate your object'ssize and / or distance from the camera.
Press to start size and distance calibration wizard. The wizard will guide you through thecalibration steps.
3
1
1
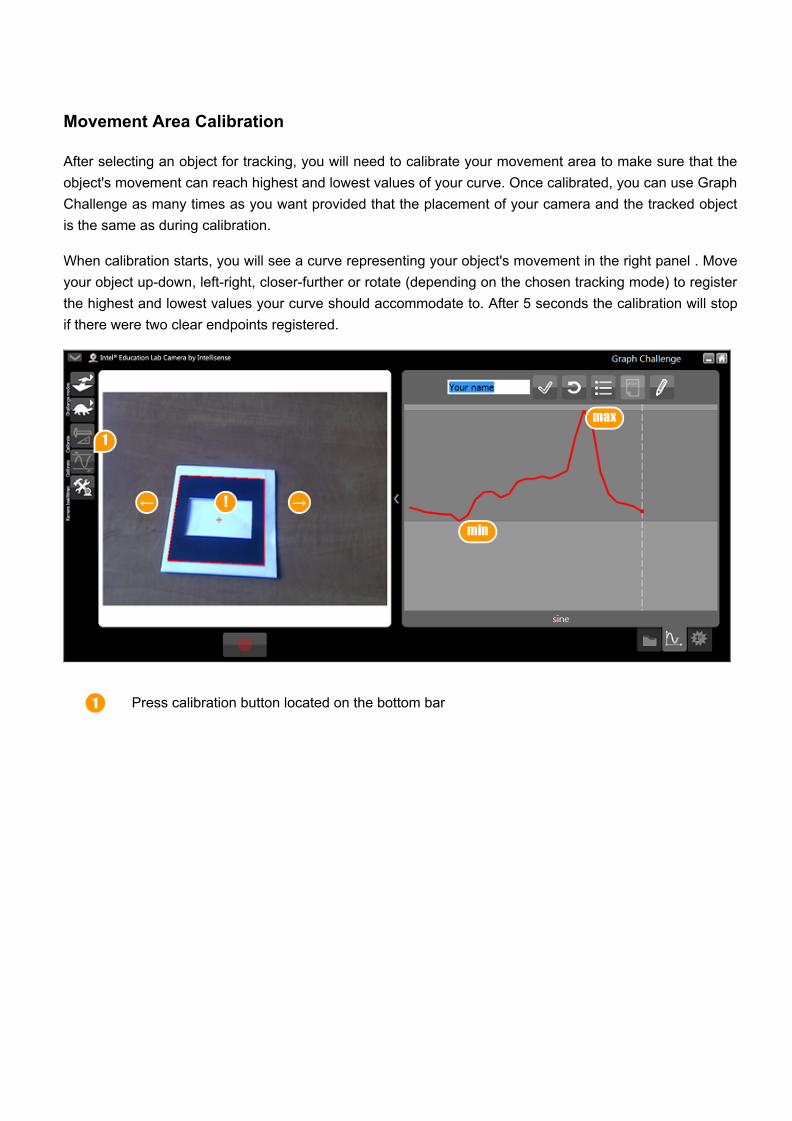
Movement Area Calibration
After selecting an object for tracking, you will need to calibrate your movement area to make sure that theobject's movement can reach highest and lowest values of your curve. Once calibrated, you can use GraphChallenge as many times as you want provided that the placement of your camera and the tracked objectis the same as during calibration.
When calibration starts, you will see a curve representing your object's movement in the right panel . Moveyour object up-down, left-right, closer-further or rotate (depending on the chosen tracking mode) to registerthe highest and lowest values your curve should accommodate to. After 5 seconds the calibration will stopif there were two clear endpoints registered.
Press calibration button located on the bottom bar
1
!← →
min
max
1
Playing The Challenge
If all set, press the record button to start the challenge!
When you hit start a counter will start counting back from 5. When matching starts, a vertical dashed linewill indicate the elapsed time on the curve. Your goal is to match the curve as close as you can. Your scorewill be displayed continuously.
Results
Press the "Record" button to start a new challenge with the same settings.
Press the "Results" button to display the latest results in this session.
1
2
3
4
1
2
The results panel lets you review previous matches in the same session.
The selected curve will be highlighted.
Curve Editor
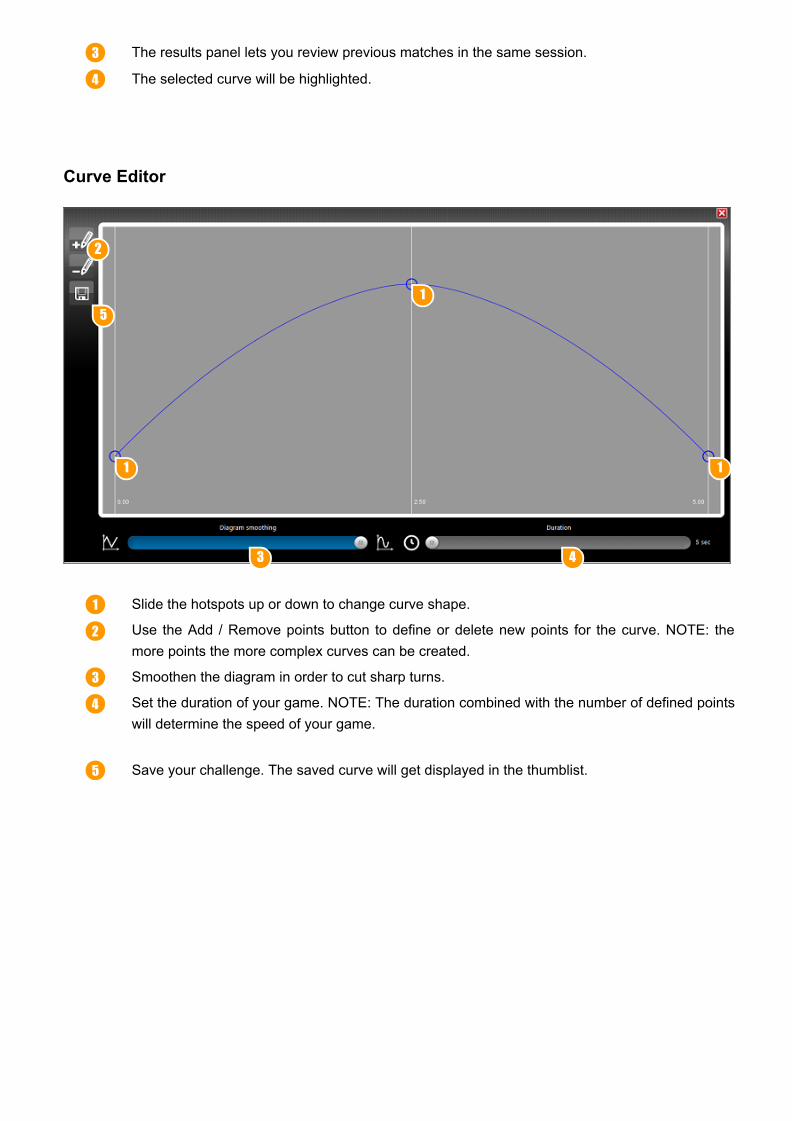
Slide the hotspots up or down to change curve shape.
Use the Add / Remove points button to define or delete new points for the curve. NOTE: themore points the more complex curves can be created.
Smoothen the diagram in order to cut sharp turns.
Set the duration of your game. NOTE: The duration combined with the number of defined pointswill determine the speed of your game.
Save your challenge. The saved curve will get displayed in the thumblist.
3
4
1
1
1
2
3 4
5
1
2
3
4
5
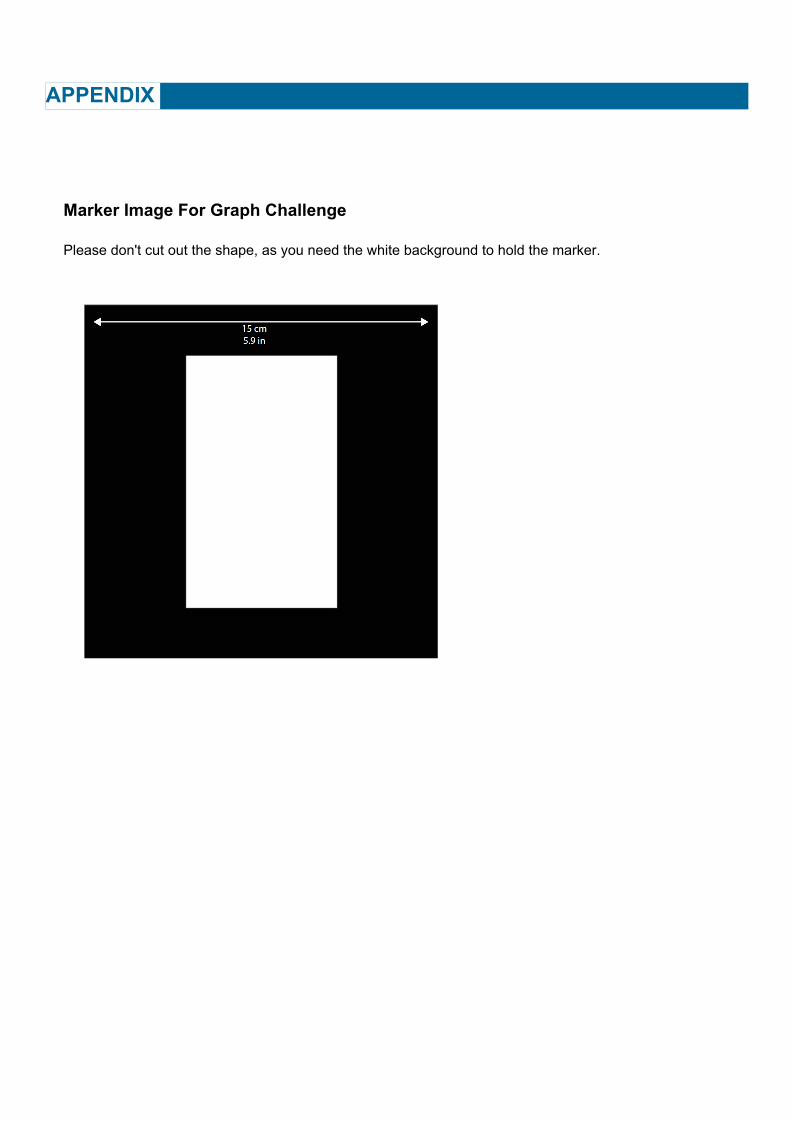
Marker Image For Graph Challenge
Please don't cut out the shape, as you need the white background to hold the marker.
APPENDIX