What Drives Market Prices in the Wine Industry - Ceris - CNR
25
Ceris-Cnr, W.P. N° 11/2004 What Drives Market Prices in the Wine Industry ? Estimation of a Hedonic Model for Italian Premium Wines ♣ Luigi Benfratello a,b , Massimiliano Piacenza b , Stefano Sacchetto c a Faculty of Economics, University of Turin, Corso Unione Sovietica 218bis, 10134 Torino, Italy. E-mail: [email protected] b Ceris-CNR, Institute for Economic Research on Firms and Growth, Italian National Research Council, Email: [email protected] c London Business School, Regent´s Park, London NW1 4SA, United Kingdom. E-mail: [email protected] Abstract. The aim of this paper is to provide new evidence on the factors affecting wine prices on both methodological and factual grounds. On the methodological ground, this study is the first to apply a general Box-Cox transformation within the context of hedonic models which exploit all the variables (objective and sensorial characteristics, reputation) pointed out by previous literature as relevant in driving market prices. On the factual ground, the paper fills the lack of empirical evidence on the issue for Italy, one of the leading wine producers, by using a large dataset on two premium quality wines (Barolo and Barbaresco) covering the 1995-1998 vintages. Our results support the evidence obtained using data from other countries, showing that sensorial traits, the reputation of wines and producers, as well as objective variables are all important factors influencing the consumers’ willingness to pay. More importantly, by resorting to a non-nested statistical test (Vuong, 1989) we compare two alternative specifications (taste vs. reputation) and find that the reputation model significantly outperforms the one containing the taste variables. In turn, this result suggests that the reputation model is closer than the taste one to the true model that generated the data. Keywords: Hedonic pricing; Box-Cox estimation; Sensorial characteristics; Reputation; Vuong test JEL Classification: C52; D43; L66 ♣ Paper presented at the 2 nd Annual International Industrial Organization Conference (IIOC), Kellogg School of Management, Northwestern University, Chicago, April 23-24, 2004. We wish to thank Paola Giordano, Rosalba Ignaccolo, and Alessandro Sembenelli for helpful comments on an earlier draft.
Transcript of What Drives Market Prices in the Wine Industry - Ceris - CNR

Ceris-Cnr, W.P. N° 11/2004
What Drives Market Pricesin the Wine Industry ?Estimation of a Hedonic Modelfor Italian Premium Wines ♣
Luigi Benfratelloa,b, Massimiliano Piacenzab,Stefano SacchettocaFaculty of Economics, University of Turin, Corso Unione Sovietica 218bis, 10134 Torino, Italy.E-mail: [email protected], Institute for Economic Research on Firms and Growth, Italian National Research Council,Email: [email protected]
cLondon Business School, Regent´s Park, London NW1 4SA, United Kingdom.E-mail: [email protected]
Abstract. The aim of this paper is to provide new evidence on the factors affecting wine priceson both methodological and factual grounds. On the methodological ground, this study is thefirst to apply a general Box-Cox transformation within the context of hedonic models whichexploit all the variables (objective and sensorial characteristics, reputation) pointed out byprevious literature as relevant in driving market prices. On the factual ground, the paper fillsthe lack of empirical evidence on the issue for Italy, one of the leading wine producers, byusing a large dataset on two premium quality wines (Barolo and Barbaresco) covering the1995-1998 vintages. Our results support the evidence obtained using data from other countries,showing that sensorial traits, the reputation of wines and producers, as well as objectivevariables are all important factors influencing the consumers’ willingness to pay. Moreimportantly, by resorting to a non-nested statistical test (Vuong, 1989) we compare twoalternative specifications (taste vs. reputation) and find that the reputation model significantlyoutperforms the one containing the taste variables. In turn, this result suggests that thereputation model is closer than the taste one to the true model that generated the data.
Keywords: Hedonic pricing; Box-Cox estimation; Sensorial characteristics; Reputation; Vuong test
JEL Classification: C52; D43; L66
♣ Paper presented at the 2nd Annual International Industrial Organization Conference (IIOC), Kellogg School ofManagement, Northwestern University, Chicago, April 23-24, 2004. We wish to thank Paola Giordano, RosalbaIgnaccolo, and Alessandro Sembenelli for helpful comments on an earlier draft.
Ceris-Cnr, W.P. N° 11/2004
2
WORKING PAPER CERIS-CNRWorking paper N. 11/2004Anno 6, N° 11 – 2004Autorizzazione del Tribunale di TorinoN. 2681 del 28 marzo 1977
Direttore ResponsabileSecondo Rolfo
Direzione e RedazioneCeris-CnrIstituto di Ricerca sull’Impresa e lo Sviluppo
Sede di TorinoVia Avogadro, 810121 Torino, ItalyTel. +39 011 5601.111Fax +39 011 [email protected]://www.ceris.cnr.it
Sezione di Ricerca di RomaIstituzioni e Politiche per la Scienza e la TecnologiaVia dei Taurini, 1900185 Roma, ItalyTel. 06 49937810Fax 06 49937884
Sezione di Ricerca di MilanoDinamica dei Sistemi EconomiciVia Bassini, 1520121 Milano, Italytel. 02 23699501Fax 02 23699530
Segreteria di redazioneMaria Zittino e Silvana [email protected]
DistribuzioneSpedizione gratuita
Fotocomposizione e impaginazioneIn proprio
StampaIn proprio
Finito di stampare nel mese di January 2005
Copyright © 2004 by Ceris-CnrAll rights reserved. Parts of this paper may be reproduced with the permission of the author(s) and quoting the source.
Tutti i diritti riservati. Parti di questo articolo possono essere riprodotte previa autorizzazione citando la fonte.
Ceris-Cnr, W.P. N° 11/2004
3
CONTENTS
1. Motivation and previous literature ..................................................................................................... 5
2. Data Description ................................................................................................................................... 72.1. The Barolo and Barbaresco wines ................................................................................................. 72.2. The variables .................................................................................................................................. 8
3. Empirical strategy .............................................................................................................................. 10
4. Results.................................................................................................................................................. 12
5. Final remarks ...................................................................................................................................... 13
DATA APPENDIX ........................................................................................................................................ 18
References ................................................................................................................................................. 20
Working Paper Series (2004-1993) ......................................................................................................I-V
Ceris-Cnr, W.P. N° 11/2004
he so-called hedonic price techniquerelates the price of a differentiatedproduct to its characteristics, whereby
allowing an estimate of the consumers’evaluation of the latter. Classic applications ofthis technique have analysed durable goods,such as cars, computers, and houses. However,in the last decade hedonic price analyses havebeen performed also for some non-durablegoods, in particular wine. Whereas wine is awidely differentiated product and therefore asuitable candidate for this sort of empiricalstudies, it is difficult to identify the propercharacteristics which affect prices. The relevantcharacteristics could relate to tasting properties(the so-called sensorial variables), such as thewine’s aroma, body, and finish. However, thesevariables could be hardly recognised byconsumers, in particular in advance with respectto purchase (in fact, wine is an experiencegood). Given the imperfect information setting,other kinds of variables become additionalcandidates as determinants of wine price, inprimis wine reputation, as well as observabletraits appearing on the bottle label.
Not surprisingly, the very few hedonicanalyses carried out so far on wine haveexplained price formation with different sets ofvariables. Broadly speaking, two differentapproaches have been followed. The first one(Combris et al., 1997; 2000) examines the roleof wine’s sensorial characteristics, alongsidewith observable “objective” attributes such asvintage, denomination, grape variety and thelike, which usually appear on the label. Thisapproach claims that consumers recognize thelatter more easily, so that the former tends to beinsignificant in determining the market price.The second approach (Landon and Smith, 1997;1998) points out the importance of thereputation of wines and producers amongconsumers. Imperfect information (Akerlof,1970) could be overcome if producers acquirereputation over time, so that expected winequality could be proxied by long-termreputation. In turn, reputation would influencemarket prices and it would seem economicallyfar more important than current quality asmeasured by overall sensory quality scores (e.g.evaluation given by professional tasters, as forexample those provided by Wine Spectatormagazine). To the best of our knowledge, noprevious paper has attempted to jointly use all
these kinds of variables (objective, sensorial,reputation and quality) in order to assess theirrelative importance.
The main purpose of this paper is fill this gapand try to shed light on the relative importanceof the aforementioned sets of characteristics onprice. To this end, it exploits a unique data seton two Italian premium wines (Barolo andBarbaresco) produced in a very restricted area inthe Piedmont region in Northern Italy.Compared with those used by previousliterature, our dataset enjoys at least twoadvantages. Firstly, it contains all the variableswhich might influence wine price. Secondly,observations are very homogeneous, in terms ofboth origin and characteristics, wherebyallowing us to focus on single producer andsingle wine reputation instead of collective repu-tation (i.e. reputation of groups of producers andwines). As a secondary purpose, our analysisintends to provide evidence on the factorsdriving wine price also for Italy which, in spiteof its leading role as a wine producer, has notbeen so far the object of empirical analyses.
By a way of anticipation, our results showthat all various kinds of variables, except currentquality, play an important role in explainingmarket prices. More importantly, we find that ahedonic model including objective andreputation variables outperforms, on statisticalgrounds, a model with objective and sensorialcharacteristics. In turn, this suggests that agreater amount of information on how the wineprice is formed is contained in the reputationspecification.
The rest of the paper unfolds as follows. Thenext section motivates this paper by reviewingthe relevant previous literature on hedonic pricein the wine industry. Section 3 presents the maincharacteristics of the two wines and describesthe dataset used. Section 4 specifies theempirical strategy whereas section 5 presentsthe ensuing econometric results. Section 6provides some final remarks and a dataappendix concludes the paper.
1. Motivation and previous literature
Since the seminal contributions by Griliches(1971) and Rosen (1974), several papers haveestimated, using the hedonic price technique, theimplicit prices of some characteristics whichdifferentiate closely related products. In order to
T

Ceris-Cnr, W.P. N° 11/2004
6
illustrate the approach in the simplest possiblemanner, let us consider two units of a givengood that are identical except for a particularattribute. One would expect their prices todiffer. If consumers place a value on thischaracteristic, the difference in market pricebetween the two units should, ceteris paribus,express their willingness to pay for animprovement in the attribute. More generally, itis possible to isolate the contribution of variousfactors to the market price through the use ofeconometric techniques.1
Not surprisingly, these studies have mostlyused data on housing (e.g. Brookshire et al.,1981; Can, 1992), cars (e.g. Griliches, 1971;Murray and Sarantis, 1999), and personalcomputers (e.g. Chow, 1967; Berndt andGriliches, 1990; Baker, 1997) which lendthemselves to this kind of analysis being highlydifferentiated and with easy-to-identifycharacteristics. In recent years, however,researchers have also analysed the relationshipbetween prices and characteristics for some non-durable goods. In particular, a few papers haverecently estimated hedonic price functions forthe wine industry, as wine is highlydifferentiated and then suitable for hedonicanalyses. Generally speaking, three main typesof variables appear in the specification ofhedonic models for the wine price. A first basiccategory embraces the so-called objectivecharacteristics – such as the wine’s year ofvintage, denomination (i.e. whether the winecomes from a particular “cru”), region, or grapevariety – which usually appear on the label and 1 Formally, following Johansson (1987), suppose any unit
x of a given good can be completely described by kcharacteristics. Then the price of this good is a functionof its attributes:
xCCfP xkxxx allfor ),...,( 1=
where C denotes good’s characteristics. This is a hedonicor implicit price function. In fact, this function is a locusof equilibrium consumers’ marginal willignesses to payfor improvements in the k attributes of good x.Supposing that a particular form of the hedonic functionhas been estimated, the coefficient for the partialderivative with respect to the jth characteristic
)( xjxCxj
x CfCP
=∂∂
indicates the increase in maket equilibrium expenditureon good x that is required to obtain the good with onemore unit of attribute Cxj (for more details on this issuesee Freeman, 1979).
are therefore easy to identify by consumers. Thetwo remaining sets of variables relate to winequality. In fact, a peculiar feature of wine is thatquality attributes, reasonably expected to affectconsumer preferences and then market prices,are not easy to evaluate objectively. To this regard,previous literature has focused on two broad groupsof variables which are related to quality evaluations,inserting them into hedonic regressions alongsidewith objective characteristics.
A first approach rests on the argument thatwine quality is generally recognized to dependon sensory evaluations. Although tastes areintrinsically subjective, wine experts claim thatfew codified characteristics univocallydetermine the quality of the wine and, in turn,its price. These codified characteristics are theso-called sensorial variables such as the wine’saroma, finish or harmony of components.According to this line of reasoning, Combris etal. (1997, 2000) use data for Bordeaux andBurgundy wine to estimate a hedonic pricefunction and what is referred to as a jury gradeequation to explain the variation in price andquality respectively. In both studies sensorialcharacteristics are found to be important indetermining wine quality, while price is stronglyexplained by objective attributes appearing onthe label of the bottle. As for the role ofsensorial variables in price formation, theevidence is partially inconclusive. Indeed,unlike the Bordeaux study, where most ofsensorial characteristics have poor relevance,results of the second analysis show threesensorial attributes (acidity, fat, andconcentration) having a significant impact onthe wine price in all estimates. Notwithstanding,the authors conclude that consumers may decideto vary their willingness to pay for wineprimarily according to observable attributes.2 Infact, given the context of imperfect information,objective characteristics (in particular rankingand vintage) are much easier and less costly toidentify by consumers than sensorial attributes.3
A second approach stresses the importance ofthe reputation of wines and producers amongconsumers. Imperfect information could beovercome if producers acquire reputation over 2 The relevance of the objective traits is also underlined in
Oczkowski (1994).3 Indeed, the acquisition of information about sensorial
variables would require tasting, learning, and buyingwine guides.
Ceris-Cnr, W.P. N° 11/2004
7
time, so that well-established or expected winequality could be proxied by long-termreputation, which, in turn, would influencemarket prices. Furthermore, current qualitycould be proxied by overall sensory qualityscore measures from widely accessiblepublished wine guides. However, consumersmay not possess this information before price isdetermined and whether this informationincreases consumers’ knowledge of the productis therefore unclear. Following this line ofreasoning, Landon and Smith (1997) use anunbalanced panel of 196 red wines (559observations) from the five Bordeaux vintagesof 1987 to 1991 and estimate two hedonic priceequations. The first equation includes onlyobjective variables and an overall sensoryquality index; the second one considersobservable characteristics and reputationvariables, the latter being referred to both singlewines (individual reputation) and groups ofwines (collective reputation). Apart fromconfirming the relevance of the objective traits,the authors find that long-term reputationexplains much more variation in the consumers’willingness to pay than does short-term qualitychanges and that ignoring reputation indicatorsleads to overstate the impact of current qualityon market price. This finding has beencorroborated by focusing only on a balancedpanel of 151 wines for the 1989 and 1990vintages (Landon and Smith, 1998).4
Subsequent applications to Australian premiumwines by Oczkowski (2001) and to premiumwines from North America, Australia, SouthAfrica and Chile by Schamel (2000) support thepresence of significant reputation effects.However, while Oczkowski’s results indicate anirrelevant impact of current quality, theeconometric evidence in Schamel points to highlysignificant implicit prices also for overall sensorywine quality.
Summing up, the previous literature onhedonic wine prices has alternatively employed,in addition to objective characteristics, sensorialand reputation variables in order to take into 4 In this study expected quality is explicitely assumed to
depend on reputation according to a forecasting equationwhich is estimated jointly with the hedonic pricefunction, the latter having as arguments current qualityand expected quality.
account the effects of quality attributes.However, to the best of our knowledge, no studyhas so far attempted to jointly use both types offactors to assess their relative importance indetermining market prices. As a consequence,whether taste or reputation is more relevant inexplaining wine price is still unclear. To shedlight on the issue, this paper exploits a very richdataset embracing information on all kinds ofaforementioned variables for two premiumItalian wines: Barolo and Barbaresco. Thedescription of the dataset is the object of thenext section.
2. Data Description
2.1. The Barolo and Barbaresco wines
The present paper exploits a unique datasetcollecting data on two premium Italian redwines: Barolo and Barbaresco. Although theformer is more widely known than the latter,these two wines have several common featureswhich justifies the joint analysis put forth in thispaper. In particular, the Disciplinary Texts oftheir “Denominazione d’Origine Controllata eGarantita” (DOCG) label specifies that the basicgrape must be the same for both wines (theNebbiolo variety). Furthermore, both winescome from the same area in the Piedmont regionin Northern Italy, the Langhe, which is quiterestricted (only 1,930 hectares). In turn, theamount produced is very small (approximately12 million bottles per year) and the two winesdisplay quite similar sensorial characteristicsand vintage quality.5 The most noteworthydifferences between the two wines concern thematuring process imposed by the DisciplinaryTexts (2 years for the Barbaresco wine and 3 forBarolo) and the production areas, very close toeach other but carried out in different villages.
The production of Barolo and Barbaresco winesis very fragmented, due to the large number oflandowners: there are approximately 750 producersof Barolo and 380 producers of Barbaresco.Accordingly, the average quantity produced per 5 For comparison purposes, consider that the Bordeaux
region is much wider (250,000 hectars), production islarger (approximately 660 million bottles) and uses fivedifferent grape varieties.

Ceris-Cnr, W.P. N° 11/2004
8
firm is very low: only 4.15% of Barolo winemakersproduce more than 100,000 bottles, whereas forBarbaresco this figure reduces to 2%.
2.2. The variables
The variables used in this paper have beencollected by inspecting several publishedsources and through direct or phone interviewswith the wine producers carried out during theJuly – September 2002 period.6
In particular, our starting point inconstructing the database has been the analysisof two leading wine guides: Wine Spectator,probably the best known wine guide which hasalso been used by some previous literature (e.g.Landon and Smith, 1997; 1998), and theDuemila Vini guide edited by the ItalianAssociation of Sommeliers (professional winetasters, AIS henceforth). Both guides might bereasonably supposed to be independent fromwine producers and therefore represent reliablesources of information.
We identified all the Barolo and Barbarescowines cited in the two guides for the 1995-97vintages for Barolo and the 1996-98 vintages forBarbaresco (i.e. the last three vintages for whichinformation was available in 2002). We keptonly those 227 wines for which data wereavailable for at least two of the three years (603observations, 111 different producers). Hence-forth, we will use the term “bottle” to identify aspecific producer-wine-year observation.
From these two guides we retrievedinformation on several variables of interest.Firstly, Wine Spectator reports an overalljudgement of the wine, ranging from aminimum of 50 to a maximum of 100 (variableVSPE). Secondly, from the AIS guide wederived wines’ alcoholic gradation (ALC).Finally, from both guides we derived: i) data onquantity produced (BOTT); ii) a specificjudgement on six sensorial traits for each wine 6 For more detailed information on variable definition and
sources refer to the Appendix 1 at the end of the paper.For descriptive statistics on the variables see Table 1. Formore details on data collection and variable caracteristicssee Sacchetto (2002).
(INTE, FINE, COMP, HARM, TANI, FINI); iii)three objective variables, namely vintage(AN97), type, i.e. whether the wine is a Baroloor a Barbaresco (TYPE), and denomination, i.e.whether the label identifies a particular “cru”(DEN). It is worthwhile to give some detailsabout the three objective traits and theirexpected impact on wine price. As for vintage,all the four years considered in this paper(1995–1998) are good quality vintages.However, 1997 is unanimously considered thebest year and therefore is the only vintage wesingle out through a dummy variable (AN97) inthe econometric analysis to check the presenceof a positive effect on market price. Thevariable TYPE is included in the hedonic modelto take into account that, in spite of the commonhigh quality standard, Barolo wine is morewidely known than Barbaresco and thiscircumstance could lead to a higher willingnessto pay for the former. Finally, the mark on thelabel of a special denomination (“cru”) inaddition to DOCG, such as, for instance, theorigin from particular vineyards, is likely torepresent an important distinction factor forconsumers, able to push wine price upward.
The very localised production area allowedus to keep also direct and phone interviews withproducers. Through these contacts we recoveredinformation on prices and on whether wine passedan aging period in barrique barrels. In particular,we asked producers to report the retail price atwhich they would sell the bottles directly to theconsumer in their estate wineshop, tax included.Inspection of Table 1, which presents thedescriptive statistics for the variables, reveals thevery large variability in price, which ranges from11.5 to 93 euros per bottle. Barrique barrels aresmaller and manufactured from higher quality oakthan traditional ones, so that they convey a specialtaste to the wine. Several producers nowadays blendwine aged in these barrels with wine aged intraditional barrels. As this information is notreported in the guides (nor on the label) we askedproducers whether their wine contains wine aged inbarrique barrels.7 7 The direct contact with producers allowed us also to
check data on the quantity produced and to fill somemissing values in the alcoholic gradation.
Ceris-Cnr, W.P. N° 11/2004
9
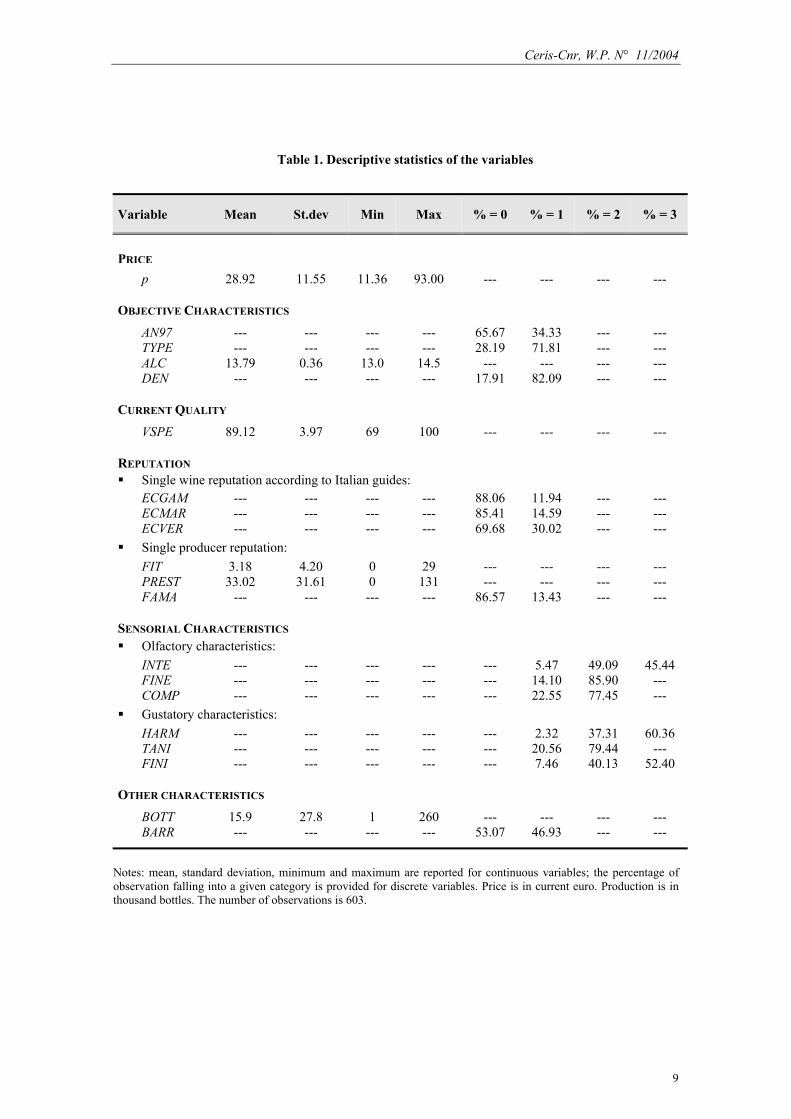
Table 1. Descriptive statistics of the variables
Variable Mean St.dev Min Max % = 0 % = 1 % = 2 % = 3
PRICE
p 28.92 11.55 11.36 93.00 --- --- --- ---
OBJECTIVE CHARACTERISTICS
AN97 --- --- --- --- 65.67 34.33 --- ---TYPE --- --- --- --- 28.19 71.81 --- ---ALC 13.79 0.36 13.0 14.5 --- --- --- ---DEN --- --- --- --- 17.91 82.09 --- ---
CURRENT QUALITY
VSPE 89.12 3.97 69 100 --- --- --- ---
REPUTATION Single wine reputation according to Italian guides:
ECGAM --- --- --- --- 88.06 11.94 --- ---ECMAR --- --- --- --- 85.41 14.59 --- ---ECVER --- --- --- --- 69.68 30.02 --- ---
Single producer reputation:FIT 3.18 4.20 0 29 --- --- --- ---PREST 33.02 31.61 0 131 --- --- --- ---FAMA --- --- --- --- 86.57 13.43 --- ---
SENSORIAL CHARACTERISTICS
Olfactory characteristics:INTE --- --- --- --- --- 5.47 49.09 45.44FINE --- --- --- --- --- 14.10 85.90 ---COMP --- --- --- --- --- 22.55 77.45 ---
Gustatory characteristics:HARM --- --- --- --- --- 2.32 37.31 60.36TANI --- --- --- --- --- 20.56 79.44 ---FINI --- --- --- --- --- 7.46 40.13 52.40
OTHER CHARACTERISTICS
BOTT 15.9 27.8 1 260 --- --- --- ---BARR --- --- --- --- 53.07 46.93 --- ---
Notes: mean, standard deviation, minimum and maximum are reported for continuous variables; the percentage ofobservation falling into a given category is provided for discrete variables. Price is in current euro. Production is inthousand bottles. The number of observations is 603.
Ceris-Cnr, W.P. N° 11/2004
10
Finally, we relied on wine publications toconstruct two crucial groups of variables, thoselinked with the reputation of wines andproducers. As for single wine reputation, weused three widely known Italian guides (I vini diVeronelli by Veronelli, Guida dei Vini Italianiby Maroni, and Guida ai Vini d’Italia by AA.VV.) to construct three bottle-specific dummyvariables (ECVER, ECMAR, ECGAM,respectively) representing single winereputation among consumers. In fact, theseguides select, according to various criteria,“best” wines, which soon become well knownamong consumers. Each of our dummies takes avalue of 1 (and 0 otherwise) if the bottle hasbeen selected as one of these “best” wines. Thereason why we include all the three variables istwofold. On the one hand, guides might differ intheir judgment, so that the choice of “best”wines differ from one guide to the other. On theother hand, we do not know the samplingprocess of these guides, i.e. they might select“best” wines not among those in our wholesample, but among smaller, and possibledifferent, sub-samples. As far as the reputationof producers is concerned, we constructed threeproducer-specific time-invariant variables. Thefirst one, labeled FIT, represents producers’reputation in Italy: it is the number of excellenceratings given by the Guida ai Vini d’Italiapublication over the 1987-2002 period to anywine (not only Barolo and Barbaresco) of asingle producer.8 Likewise, the variable PRESTcaptures producers’ reputation abroad: it is thenumber of ratings provided to each producer bythe Wine Spectator magazine. Finally, weconstructed a dummy variable (FAMA) whichtakes a value of 1 only for producers ranked insome well known charts (see the Appendix 1 forfurther details).
3. Empirical strategy
Although the hedonic price technique has beenwidely used in the empirical applications tostudy the process of price formation in several 8 This guide has been preferred to the other two (I vini di
Veronelli and Guida ai vini d’Italia) for several reasons:it is the best known, it covers the largest set of wines, andit is the most selective in providing excellence ratings.
markets, economic theory provides littleguidance about the functional form of thedependence of price on good’s attributes. Theresearch strategy followed by the previousliterature on the wine industry is characterizedby the preliminary choice of the hedonic pricemodel to estimate (i.e. sensorial or reputation),and the subsequent selection of the appropriatefunctional form (e.g. log-log, log-linear,reciprocal, and the like) according to somespecification tests (e.g. the Reset test). Thepresent study sharply departs from this strategy,as we neither select ex ante the model type norits functional form.
More precisely, the research line of this paperrelies on three steps. As the aim of the paper isto screen among different models withoutimposing any structure a priori, we firstlyestimate different Box-Cox transformations(Box and Cox, 1964) of the dependent andindependent variables for each of the twomodels suggested by previous literature (theCombris et al. specification – CLV henceforth –and the Landon & Smith one – LS henceforth),so as to let the data “suggest” the properspecification of the hedonic price function.9 Wethen select the best sensorial and the bestreputation model on the basis of standardlikelihood ratio (LR) statistics. In the secondstep, we simplify the two preferred models byapplying zero-restrictions LR tests oncoefficients. As the simplified best models arenon-nested, in the final stage we compare themthrough the Vuong (1989) test.
At the first stage, we consider severalvariants of the Box-Cox transformations. Themost general one we estimate is:
( ) εγβ λθ ++= ∑∑∈∈
kkKk
jjJj
xxp )( [1]
where V (b) – for a generic variable V = p, x anda generic parameter b = θ, λ – denotes the Box- 9 Goodman (1978) carried out one of the first applications
of the Box-Cox transformation within the context ofhedonic prices in the housing market and found that alinear specification is generally rejected in favor of theBox-Cox model. Successively, Cropper et al. (1988)performed a Monte Carlo analysis to study the behaviorof six different hedonic price specifications, pointing outthe better performance of the Box-Cox regression as forthe estimates of marginal attributes prices.
Ceris-Cnr, W.P. N° 11/2004
11
Cox metric
→
≠−
=
,0for ln
0for 1)(
bV
bb
VV
b
b [1b]
J is the set of regressors xj which can besensibly logged, and K is the set of regressors xk
which cannot sensibly logged, includingvariables such as constant term, dummies, timetrends, etc. The crucial feature of this model isthat both regressand (p) and at least a set ofregressors (J) are transformed through adifferent Box-Cox parameter (θ and λrespectively). We will refer to this model asTHETA.
A slightly less general specification than [1]is as follows:
( ) εγβ λλ ++= ∑∑∈∈
kkKk
jjJj
xxp )( [2]
where both regressand and at least a set ofregressors are transformed through the sameBox-Cox parameter (λ). We will refer to model[2] as LAMBDA.
Proceeding with further simplifications, wecan imagine to transform only (a set of)regressors or the regressand only, leading to thefollowing specifications:
( ) εγβ λ ++= ∑∑∈∈
kkKk
jjJj
xxp [3]
εγβθ ++= ∑∑∈∈
kkKk
jjJj
xxp )( [4]
Again, we will refer to model [3] as LIN-RHSand to model [4] as LHS-LIN.
Note finally that model [1] can be furthersimplified by letting θ = λ = 0 (LOG-LOG model),θ = λ = 1 (LIN-LIN model), θ = 0 (LOG-RHSmodel) and λ = 0 (LHS-LOG model).
All eight models (models [1]-[4] and the fourLOG and LIN transformations) have beenestimated for both the CLV and the LSspecifications. Variables common to both sets ofmodels are the objective and othercharacteristics (AN97, TYPE, ALC, and DEN;
BOTT and BARR). We included only INTE,FINE, COMP, HARM, TANI, FINI (sensorialcharacteristics) in the CLV models and onlyVSPE (current quality)10, ECGAM, ECMAR,ECVER (individual wine reputation), FIT,PREST, FAMA (individual producer reputation)in the LS specifications. Notice that the set oftransformed variables J includes ALC, BOTT,VSPE, FIT and PREST, whereas the remainingregressors belong to the set K of untransformedvariables.11 Once we have estimated all the 16hedonic models, we select the one best fittingthe data within each category (CLV, LS) usingstandard LR tests.
For the sake of parsimony, in the secondstage we simplify the two preferred CLV andLS specifications through a stepwise procedure:we gradually delete the least significant variableand stop only when all the estimatedcoefficients for retained regressors aresignificant at least at the 5% level.
Finally, we resort to the Vuong (1989) test tocompare the best simplified models. Assuggested by Gasmi, Laffont and Vuong (1992),this statistic must be adjusted to take intoaccount the different number of parametersincluded in the compared models. Threeadjustments have been proposed by theliterature, differing in the penalties for thenumber of estimated parameters, namely theHannan and Quinn (1979), the Akaike (1973),and the Schwarz (1978) correction factors. Inorder to check the robustness of our results, wedecided to apply all the three adjustments. Wewill refer to these corrected statistics as “VuongAdjusted Likelihood Ratio” (VALR). 10 In a preliminary regression we checked that wine quality(VSPE) is well explained by the sensorial characteristics.These results, available upon request to the authors,confirm that the Wine Spectator rating is given on the basisof some widely recognised and objective criteria, wherebyjustifying the use of this variable in the price equations.11 To avoid tranformations of zero values, we replaced thevariables FIT with (FIT + 1) and PREST with (PREST + 1).Furthermore, we estimated all models by standardizing thedependent variable by its geometric mean. As discussed,among the others, in Davidson and MacKinnon (1993,chapter 14), this transformation does not affect the valuesof the estimated λ and θ. However, it does affect the valuesof β and γ ; therefore, in testing the significance of thesecoefficients we will rely on LR and not on Wald testswhich, as is well known, are not invariant with respect tonon-linear transformations of the variables.
Ceris-Cnr, W.P. N° 11/2004
12
4. Results
All the models above have been estimatedusing the Stata software, version 8.0. Theresults are presented in Tables 2 to 8.
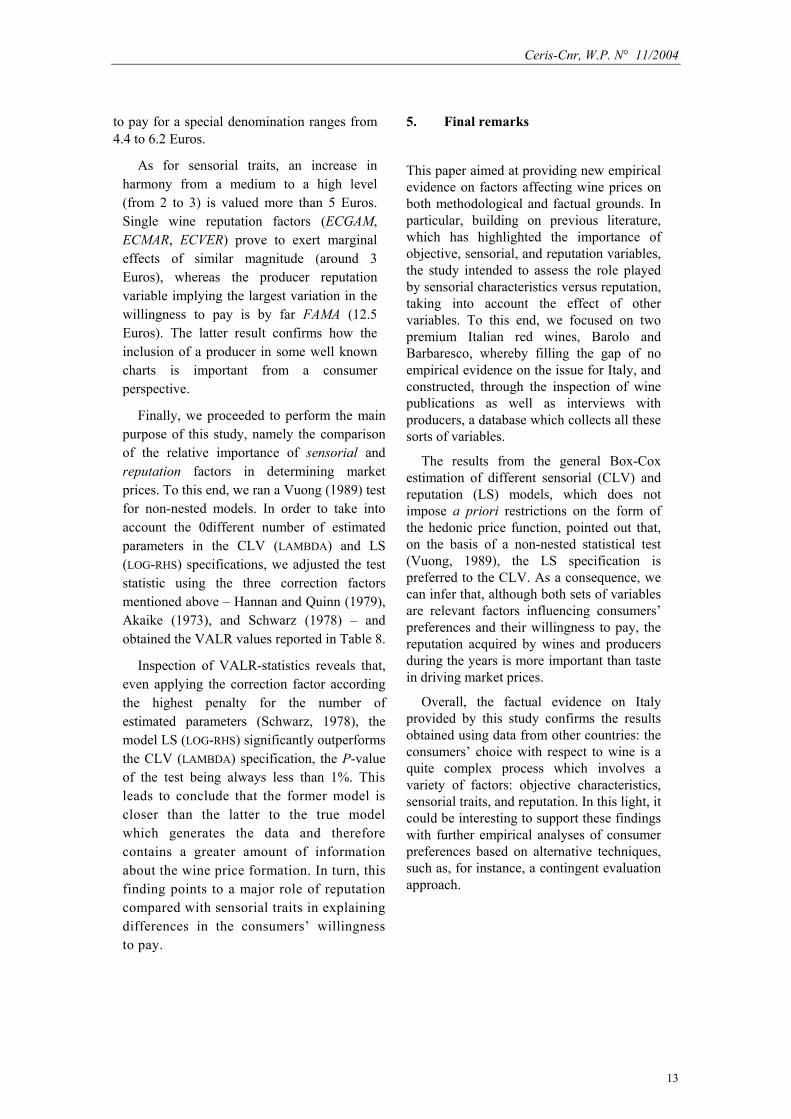
Estimates of the eight Box-Coxspecifications for the CLV-type hedonicequation (or sensorial model) are shown inTable 2. Both parameters of the general model(THETA) have reasonable magnitude and arestatistically significant at the 5% level.Proceeding across the possible simplifications,we notice that the estimated parameter θ (i.e.the one transforming the dependent variable p)proves to be quite stable (values ranging from-0.52 and -0.50), whereas the estimates of λ(the parameter transforming the independentvariables) show high variability. Comparisonsbetween the THETA model and its varioussimplifications are presented in Table 3. Notsurprisingly, all the specifications where thetransformation of regressand is restricted to agiven value (LIN-RHS, LOG-LOG, LIN-LIN, LOG-RHS) are strongly rejected whereas the chi-squared statistic for the other models is muchlower. Notwithstanding, the only specificationnot rejected at the 10% level is the LAMBDAmodel.
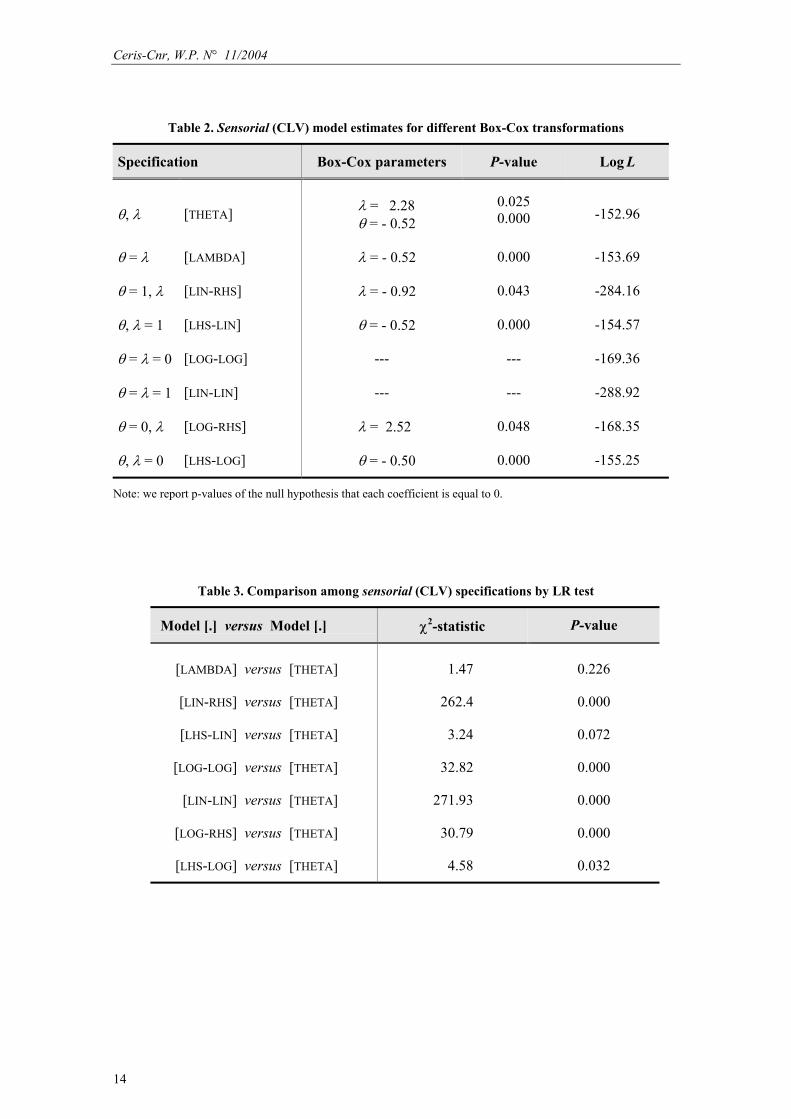
As for the LS-type hedonic equation (orreputation model), estimates of the Box-Coxtransformations reported in Table 4 revealremarkable differences with respect to those ofthe CLV-type models. In fact, in the THETAspecification the transformation of theindependent variables (λ) is 0.49 and proves tobe statistically significant, whereas theparameter θ is modest in value andinsignificant. Again, the estimates forparameter θ are quite robust across thedifferent specification and close to zero,while λ shows larger variability (rangingbetween 0.06 and 1.27). LR testscomparing general and restrictedspecifications (see Table 5) clearly favourthe LOG-RHS model where the value of θ isconstrained to be zero.We then simplified the two preferred Box-
Cox transformations for the CLV (LAMBDA)and LS (LOG-RHS) specifications by applying
the stepwise procedure described above.Coefficients estimates for the general andsimplified versions of the two models arepresented in Table 6. As the values of retainedexplanatory variables are very similar in bothcases, we will comment only upon the resultsof the restricted versions.
The estimated parameters for the CLV(LAMBDA) hedonic model (third column)support the importance of both the objectiveand the sensorial variables. In fact, thedummies for the 1997 vintage (AN97 = 1), forBarolo wines (TYPE = 1), and for a specialdenomination (DEN = 1) turn out to bepositive and significant at the 2% level,whereby confirming our a priori. Turning tothe sensorial characteristics, the onlysignificant one is the harmony among winecomponents (HARM): this finding can beexplained as this trait is the easiest among thesensorial ones to be recognised by consumers.Finally, the number of bottles (BOTT) exerts apositive and significant impact on prices.
The fifth column of Table 6 presents theresults of the LS (LOG-RHS) hedonic model.All the coefficients have the expected sign.Moreover, the variables representingindividual wine reputation (ECGAM, ECVER,ECMAR) and producer reputation (FIT,FAMA, PREST) are all statistically significantat the 1% level. Estimated coefficients forobjective and other characteristics have thesame sign as those of CLV (LAMBDA) model,the only exceptions being the dummy for theuse of barrique barrels (BARR), which turnsout to exert a positive impact on prices, andthe quantity produced (BOTT), which provesto have a negative sign. The latter result can beinterpreted in the light of a possible “snob”effect on prices due to a limited availability ofa particular bottle.
Table 7 shows absolute marginal effects onprice for the variables included in the restrictedCLV and LS models. Rather comfortably,impacts tend to be quite similar for thoseregressors appearing in both specifications.Consumers appraise the 1997 vintage from 2to 2.8 Euros and Barolo type with respect toBarbaresco from 1.6 to 1.9 Euros. Willingness
Ceris-Cnr, W.P. N° 11/2004
13
to pay for a special denomination ranges from4.4 to 6.2 Euros.
As for sensorial traits, an increase inharmony from a medium to a high level(from 2 to 3) is valued more than 5 Euros.Single wine reputation factors (ECGAM,ECMAR, ECVER) prove to exert marginaleffects of similar magnitude (around 3Euros), whereas the producer reputationvariable implying the largest variation in thewillingness to pay is by far FAMA (12.5Euros). The latter result confirms how theinclusion of a producer in some well knowncharts is important from a consumerperspective.
Finally, we proceeded to perform the mainpurpose of this study, namely the comparisonof the relative importance of sensorial andreputation factors in determining marketprices. To this end, we ran a Vuong (1989) testfor non-nested models. In order to take intoaccount the 0different number of estimatedparameters in the CLV (LAMBDA) and LS(LOG-RHS) specifications, we adjusted the teststatistic using the three correction factorsmentioned above – Hannan and Quinn (1979),Akaike (1973), and Schwarz (1978) – andobtained the VALR values reported in Table 8.
Inspection of VALR-statistics reveals that,even applying the correction factor accordingthe highest penalty for the number ofestimated parameters (Schwarz, 1978), themodel LS (LOG-RHS) significantly outperformsthe CLV (LAMBDA) specification, the P-valueof the test being always less than 1%. Thisleads to conclude that the former model iscloser than the latter to the true modelwhich generates the data and thereforecontains a greater amount of informationabout the wine price formation. In turn, thisfinding points to a major role of reputationcompared with sensorial traits in explainingdifferences in the consumers’ willingnessto pay.
5. Final remarks
This paper aimed at providing new empiricalevidence on factors affecting wine prices onboth methodological and factual grounds. Inparticular, building on previous literature,which has highlighted the importance ofobjective, sensorial, and reputation variables,the study intended to assess the role playedby sensorial characteristics versus reputation,taking into account the effect of othervariables. To this end, we focused on twopremium Italian red wines, Barolo andBarbaresco, whereby filling the gap of noempirical evidence on the issue for Italy, andconstructed, through the inspection of winepublications as well as interviews withproducers, a database which collects all thesesorts of variables.
The results from the general Box-Coxestimation of different sensorial (CLV) andreputation (LS) models, which does notimpose a priori restrictions on the form ofthe hedonic price function, pointed out that,on the basis of a non-nested statistical test(Vuong, 1989), the LS specification ispreferred to the CLV. As a consequence, wecan infer that, although both sets of variablesare relevant factors influencing consumers’preferences and their willingness to pay, thereputation acquired by wines and producersduring the years is more important than tastein driving market prices.
Overall, the factual evidence on Italyprovided by this study confirms the resultsobtained using data from other countries: theconsumers’ choice with respect to wine is aquite complex process which involves avariety of factors: objective characteristics,sensorial traits, and reputation. In this light, itcould be interesting to support these findingswith further empirical analyses of consumerpreferences based on alternative techniques,such as, for instance, a contingent evaluationapproach.
Ceris-Cnr, W.P. N° 11/2004
14
Table 2. Sensorial (CLV) model estimates for different Box-Cox transformations
Specification Box-Cox parameters P-value Log L
θ, λ [THETA] λ = 2.28θ = - 0.52
0.0250.000 -152.96
θ = λ [LAMBDA] λ = - 0.52 0.000 -153.69
θ = 1, λ [LIN-RHS] λ = - 0.92 0.043 -284.16
θ, λ = 1 [LHS-LIN] θ = - 0.52 0.000 -154.57
θ = λ = 0 [LOG-LOG] --- --- -169.36
θ = λ = 1 [LIN-LIN] --- --- -288.92
θ = 0, λ [LOG-RHS] λ = 2.52 0.048 -168.35
θ, λ = 0 [LHS-LOG] θ = - 0.50 0.000 -155.25
Note: we report p-values of the null hypothesis that each coefficient is equal to 0.
Table 3. Comparison among sensorial (CLV) specifications by LR test
Model [.] versus Model [.] χ2-statistic P-value
[LAMBDA] versus [THETA] 1.47 0.226
[LIN-RHS] versus [THETA] 262.4 0.000
[LHS-LIN] versus [THETA] 3.24 0.072
[LOG-LOG] versus [THETA] 32.82 0.000
[LIN-LIN] versus [THETA] 271.93 0.000
[LOG-RHS] versus [THETA] 30.79 0.000
[LHS-LOG] versus [THETA] 4.58 0.032
Ceris-Cnr, W.P. N° 11/2004
15
Table 4. Reputation (LS) model estimates for different Box-Cox transformations
Specification Box-Cox parameters P-value Log L
θ, λ [THETA] λ = 0.49θ = - 0.05
0.0000.572 68.88
θ = λ [LAMBDA] λ = 0.06 0.453 63.61
θ = 1, λ [LIN-RHS] λ = 1.27 0.000 -13.95
θ, λ = 1 [LHS-LIN] θ = 0.00 0.994 63.69
θ = λ = 0 [LOG-LOG] --- --- 63.33
θ = λ = 1 [LIN-LIN] --- --- -14.30
θ = 0, λ [LOG-RHS] λ = 0.50 0.000 68.72
θ, λ = 0 [LHS-LOG] θ = - 0.06 0.471 63.60
Note: we report p-values of the null hypothesis that each coefficient is equal to 0.
Table 5. Comparison among reputation (LS) specifications by LR test
Model [.] versus Model [.] χ2-statistic P-value
[LAMBDA] versus [THETA] 10.53 0.001
[LIN-RHS] versus [THETA] 165.66 0.000
[LHS-LIN] versus [THETA] 10.37 0.001
[LOG-LOG] versus [THETA] 11.09 0.001
[LIN-LIN] versus [THETA] 166.35 0.000
[LOG-RHS] versus [THETA] 0.32 0.571
[LHS-LOG] versus [THETA] 10.56 0.001

Ceris-Cnr, W.P. N° 11/2004
16
Table 6. Coefficient estimates of the general and restricted CVL and LS preferred models
Variable General CVL[LAMBDA]
Restricted CVL[LAMBDA]
General LS[LOG-RHS]
Restricted LS[LOG-RHS]
AN97 0.104(0.000)
0.115(0.000)
0.063(0.002)
0.073(0.000)
TYPE 0.075(0.010)
0.067(0.020)
0.068(0.001)
0.068(0.001)
ALC 0.985(0.667) --- 0.117
(0.312) ---
DEN 0.286(0.000)
0.301(0.000)
0.154(0.000)
0.166(0.000)
BARR 0.038(0.176) --- 0.036
(0.069)0.045
(0.018)
BOTT 0.102(0.037)
0.102(0.037)
- 0.011(0.000)
- 0.011(0.000)
INTE 0.016(0.514) --- --- ---
FINE 0.037(0.365) --- --- ---
COMP - 0.042(0.239) --- --- ---
HARM 0.120(0.000)
0.140(0.000) --- ---
TANI 0.011(0.758) --- --- ---
FINI 0.024(0.336) --- --- ---
ECGAM --- --- 0.083(0.005)
0.085(0.005)
ECMAR --- --- 0.113(0.000)
0.114(0.000)
ECVER --- --- 0.093(0.000)
0.100(0.000)
FIT --- --- 0.039(0.000)
0.043(0.000)
PREST --- --- 0.015(0.000)
0.015(0.000)
FAMA --- --- 0.383(0.000)
0.389(0.000)
VSPE --- --- 0.034(0.147)
---
Box-Cox parameter - 0.515 - 0.521 0.503 0.497Log L - 153.69 - 157.15 68.72 66.96
Note: the dependent variable is the wine price (p). The number of observations is 603. P-values of the null hypothesis that eachcoefficient is equal to 0 are reported in brackets.

Ceris-Cnr, W.P. N° 11/2004
17
Table 7. Marginal effects on price
Variable Restricted CVL[LAMBDA]
Restricted LS[LOG-RHS]
AN97 2.78 2.03
TYPE 1.55 1.86
DEN 6.23 4.36
BOTT 0.04 -0.07
HARM 5.53 ---
BARR --- 1.25
ECGAM --- 2.42
ECMAR --- 3.28
ECVER --- 2.83
FIT --- 0.57
PREST --- 0.07
FAMA --- 12.47
Note: In the CVL model effects have been computed at the mean value of the regressorsexcept for HARM equalised to 2. For dummy variables (HARM) the effect represents thechange in the dependent variable when the dummy (HARM) changes from 0 to 1 (from 2 to3).In the LS model effects have been computed at the mean value of all regressors. For dummyvariables the effect represents the change in the dependent variable when the dummychanges from 0 to 1.
Table 8. Comparison among restricted CLV and LS models by Vuong (1989) test
LS [LOG-RHS] versus CLV [LAMBDA] VALR-statistics a P-value
Correction factor:
- Hannan and Quinn 6.636 0.000
- Akaike 6.630 0.000
- Schwarz 6.432 0.000
a These statistics are distributed as a N (0,1) under the null hypothesis that the two models are equally distant to thetrue model.

Ceris-Cnr, W.P. N° 11/2004
18
DATA APPENDIX
Variable definition and data sources
ALC: alcoholic content as it appears on the label of the bottle. As imposed from theDisciplinary Text for Barolo and Barbaresco, the alcoholic degree reported on the labelcan differ from the actual value determined by chemical analysis by at most ±0,5% vol.Sources: AA.VV. Duemila vini, Associazione Italiana Sommeliers ed., years 2000, 2001,2002 and direct or phone interviews with producers between July and September 2002.
AN97: a dummy variable which equals 1 if the wine vintage is 1997 and 0 otherwise.
BARR: a dummy variable which equals 1 if a percentage of the wine passed an aging period inbarrique barrels and 0 otherwise. Source: direct or phone interviews with producersbetween July and September 2002.
BOTT: number of bottles produced for each wine in thousands. Sources: AA.VV. Duemila vini,Associazione Italiana Sommeliers ed., years 2000, 2001, 2002 and the wine ratingsdatabase at www.winespectator.com. We checked the information provided by WineSpectator through direct or phone interviews with producers between July andSeptember 2002.
COMP: a dummy variable which reflects the complexity of the aroma. It equals 2 if the olfactorycharacteristic is present, 1 otherwise. Sources: AA.VV. Duemila vini, AssociazioneItaliana Sommeliers ed., years 2000, 2001, 2002 and the wine ratings database atwww.winespectator.com.
DEN: a dummy variable which equals 1 if the wine appellation on the label is not just “Barolo”or “Barbaresco”, but it contains more information (e.g. the vineyard or the indications ofthe terroir where the grapes are produced, or the word Riserva: these dictions have beenintended as indicators of a special wine, i.e. a “cru” one) and 0 otherwise.
ECGAM: a dummy variable which equals 1 (0 otherwise) if the wine obtained a “Tre Bicchieri”award from the Italian wine guidebook “Guida ai Vini d’Italia” during the 2000-02period. Sources: AA.VV. Guida ai Vini d'Italia, Gambero Rosso ed., years 2000, 2001,2002, and the web site www.gamberorosso.it.
ECMAR: a dummy variable which equals 1 (0 otherwise) if the wine obtained a rating higher than76/100 from the Italian wine guidebook “Guida dei Vini Italiani” during the 2000-02period. This threshold is used by the author to identify “excellent wines”. Source:Maroni, L. Guida dei Vini Italiani, LM ed., years 2000, 2001, 2002.
ECVER: a dummy variable which equals 1 (0 otherwise) if the wine obtained a rating higher than90/100 from the Italian wine guidebook “I vini di Veronelli” during the 2000-02 period.This threshold is used by the author to identify “excellent wines”. Source: Veronelli, L. Ivini di Veronelli, Veronelli ed., years 2000, 2001, 2002.
FAMA: a dummy variable which equals 1 (0 otherwise) if the wine producer has been included atleast once in one of the following charts:
Ceris-Cnr, W.P. N° 11/2004
19
1992-2002 “Top 100” wines of the year chart, yearly published by the WineSpectator Magazine. The source is the wine ratings database atwww.winespectator.com.
“Outstanding Wine” rating in the chart of Piedmont wines made by Robert Parker.The sources are the web site www.erobertparker.com and Parker, R. RobertParker’s Wine Buyers’ guide, 2002.
the chart proposed by the Italian wine review Civiltà del Bere (April 2002), whichindicates the wine producers that obtained a rating of excellence in 2002 from atleast three of the five most important Italian wine guidebooks (Veronelli, L. I vini diVeronelli; Masnaghetti, A. I Vini d’Italia 2002; Maroni, L. Guida dei Vini Italiani;AIS ed., Duemila vini; Gambero Rosso ed., Guida ai Vini d'Italia);
FINE: a dummy variable which equals 2 if the wine is characterized by finesse of aroma, 1otherwise. The sources are the same as for COMP.
FINI: a dummy variable which reflects the persistence of the taste in the finish. It equals 3 ifthe finish is long, 2 if it is medium, 1 if it is short. The sources are the same as forCOMP.
FIT: total number of “Tre Bicchieri” awarded during the 1987-2002 period to any wine of aproducer by the Italian wine guidebook “Guida ai Vini d'Italia”. The source is the sameas for ECGAM.
HARM: a dummy gustatory variable which contemplates the harmony between the componentsof the wine. It equals 3 if the wine is well balanced, 2 if it is balanced, 1 if it isunbalanced. The sources are the same as for COMP.
INTE: a dummy variable which reflects the level of aromatic intensity of the wine. It equals 3 ifthe wine’s aroma is strong, 2 if it is classic and 1 if it is discreet. The sources are thesame as for COMP.
p: price per bottle of wine in current Euros. Data have been collected by direct or phoneinterviews with the wine producers during the July – September 2002 period. Theproducers were asked to provide the retail price at which they would sell the winedirectly to the consumer in their estate wineshop.
PREST: number of ratings assigned to any wine of a producer during the years by the WineSpectator Magazine. Source: the wine ratings database at www.winespectator.com.
TANI: a dummy variable which indicates the presence of fine tannins. It equals 2 if there arefine tannins, 1 otherwise. The sources are the same as for COMP.
TYPE: a dummy variable which equals 1 if the wine is a Barolo and 0 if it is a Barbaresco.
VSPE: a variable which indicates the valuation in a 100 points scale assigned to each bottle bythe Wine Spectator Magazine if the rating is not missing (452 observations out of 603).The remaining 151 cases have been adjusted according to two criteria: i) the averageWine Spectator rating obtained from the same wine in other vintages; ii) the averagerating obtained from the same vineyard’s and producer’s wines. Source: the wine ratingsdatabase at www.winespectator.com.
Ceris-Cnr, W.P. N° 11/2004
20
References
AA.VV., (2002), Civiltà del bere, April.AA.VV., Duemila vini, Associazione Italiana
Sommeliers (ed.), years 2000, 2001, 2002.AA.VV., Guida ai vini d’Italia, Gambero Rosso
(ed.), years 2000, 2001, 2002 and web sitewww.gamberorosso.it.
Akaike, H. (1973), “Information Theory and anExtension of the Likelihood Ratio Principle”,in Petrov, B. N. and Coaki, F. (ed.),Proceedings of the Second InternationalSymposium of Information Theory,Akademiai Kiado, Budapest, pp. 257-281.
Akerlof, G. A. (1970) “The market for“lemons”: Quality uncertainty and themarket mechanism”, Quarterly Journal ofEconomics, 84, pp. 488-500.
Baker, T. A. (1997), “Quality-Adjusted PriceIndexes for Portable Computers”, AppliedEconomics, 29, pp. 1115-1123.
Berndt, E. R. and Griliches, Z. (1990), PriceIndexes for Microcomputers: an ExplanatoryStudy, Working Paper No. 3378, NBER,Cambridge, MA.
Box, G. E. P. and Cox, D. R. (1964), “AnAnalysis of Transformations”, Journal of theRoyal Statistical Society, Series B, pp. 211-243.
Brookshire, D.S., D’Arge, R. C., Schulze, W. D.and Thayer, M. A. (1981), “Experiments inValuing Public Goods”, in Smith, K. V.(ed.), Advances in Applied Microeconomics,vol. 1, JAI Press, Greenwich, Connecticut.
Can, A. (1992), “Specification and Estimationof Hedonic Housing Price Models”, RegionalScience and Urban Economics, 22(3), pp.453-74.
Chow, G. C. (1967), “Technological Changeand the Demand for Computers”, AmericanEconomic Review, 57, pp. 1117-1130.
Combris, P., Lecocq, S., and Visser, M. (1997),“Estimation of a Hedonic Price Equation forBordeaux Wine: Does Quality Matter?”,Economic Journal, 107, pp. 390-402.
Combris, P., Lecocq, S. and Visser, M. (2000),“Estimation of a Hedonic Price Equation forBurgundy Wine”, Applied Economics, 32,pp. 961-967.
Cropper, M., Deck, L. and McConnell, K.(1988), “On the Choice of Functional Formfor Hedonic Price Functions”, Review ofEconomics and Statistics, 70(4), November,pp. 668-675.
Davidson, R. and MacKinnon, J. (1993),Estimation and Inference in Econometrics,Oxford University Press.
Freeman, A. M. (1979), “Hedonic Prices,Property Values and MeasuringEnvironmental Benefits: A Survey of theIssues”, Scandinavian Journal of Economics,81, pp. 154-73.
Gasmi, F., Laffont, J.J. and Vuong, Q. H.(1992), “Econometric Analysis of CollusiveBehavior in a Soft-Drink Market”, Journal ofEconomics and Management Strategy, 1(2),pp. 277-311.
Goodman, A. (1978), “Hedonic Prices, PriceIndices and Housing Markets”, Journal ofUrban Economics, 5(4), pp. 471-484.
Griliches, Z. (1971), Price Indexes and QualityChange, Harvard University Press,Cambridge, Massachusetts.
Hannan, E. J. and Quinn, B. G. (1979), “TheDetermination of the Order of anAutoregression”, Journal of the RoyalStatistical Society, 41, pp. 190-195.
Johansson, P. (1987), The Economic Theory andMeasurement of Environmental Benefits,Cambridge University Press, Cambridge,Massachusetts.
Landon, S. and Smith, C. E. (1997), “The Use ofQuality and Reputation Indicators byConsumer: the Case of Bordeaux Wine”,Journal of Consumer Policy, 20, pp. 289-323.
Landon, S. and Smith, C. E. (1998), “QualityExpectation. Reputation and Price”, SouthernEconomic Journal, 64, pp. 628-647.
Maroni, L., Guida dei Vini Italiani, LM (ed.),Roma, years 2000, 2001, 2002.
Masnaghetti, A. (2002), I Vini d’Italia 2002,Gruppo Editoriale L’Espresso, Roma.
Murray, J. and Sarantis, N. (1999), “PriceQuality Relations and Hedonic Price Indexesfor Cars in the United Kingdom”,International Journal of the Economics ofBusiness, 6(1), pp. 5-27.
Ceris-Cnr, W.P. N° 11/2004
21
Oczkowski, E. (1994), “A Hedonic PriceFunction for Australian Premium TableWine”, Australian Journal of AgriculturalEconomics, 38, pp. 93-110.
Oczkowski, E. (2001), “Hedonic Price WineFunctions and measurement error”, TheEconomic Record, 239(77), pp. 374-382.
Parker, R. (2002), Robert Parker’s WineBuyers’ guide, New York and web sitewww.erobertparker.com.
Rosen, S. (1974), “Hedonic Price and ImplicitMarkets: Product Differentiation in PureCompetition”, Journal of Political Economy,82, pp. 34-55.
Sacchetto, S. (2002), Prezzo e qualità nel settorevinicolo: il caso italiano del Barolo e del
Barbaresco, University of Turin, mimeo.Schamel, G. (2000), Individual and Collective
Reputation Indicators of Wine Quality,Policy Discussion Paper No. 0009, CIES,University of Adelaide, Australia.
Schwarz, G. (1978), “Estimating the Dimensionof a Model”, Annals of Statistics, 6, pp. 461-464.
Veronelli, L., I vini di Veronelli, Veronelli (ed.),Bergamo, years 2000, 2001, 2002.
Vuong, Q. H. (1989), “Likelihood Ratio Testsfor Model Selection and non-nestedHypotheses”, Econometrica, 57(2), pp. 307-333.
Wine Spectator, various issues and web sitewww.winespectator.com.
I
WORKING PAPER SERIES (2004-1993) 2004 1/04 Le origini dell’economia dell’innovazione: il contributo di Rae, by Mario Coccia 2/04 Liberalizzazione e integrazione verticale delle utility elettriche: evidenza empirica da un campione italiano di
imprese pubbliche locali, by Massimiliano Piacenza and Elena Beccio 3/04 Uno studio sull’innovazione nell’industria chimica, by Anna Ceci, Mario De Marchi, Maurizio Rocchi 4/04 Labour market rigidity and firms’ R&D strategies, by Mario De Marchi and Maurizio Rocchi 5/04 Analisi della tecnologia e approcci alla sua misurazione, by Mario Coccia 6/04 Analisi delle strutture pubbliche di ricerca scientifica: tassonomia e comportamento strategico, by Mario Coccia 7/04 Ricerca teorica vs. ricerca applicata. Un’analisi relativa al Cnr, by Mario Coccia and Secondo Rolfo 8/04 Considerazioni teoriche sulla diffusione delle innovazioni nei distretti industriali: il caso delle ICT, by Arianna
Miglietta 9/04 Le politiche industriali regionali nel Regno Unito, by Elisa Salvador 10/04 Going public to grow? Evidence from a panel of Italian firms, by Robert E. Carpenter and L. Rondi 11/04 What Drives Market Prices in the Wine Industry? Estimation of a Hedonic Model for Italian Premium Wine, by
Luigi Benfratello, Massimiliano Piacenza and Stefano Sacchetto 12/04 Brief notes on the policies for science-based firms, by Mario De Marchi, Maurizio Rocchi 13/04 Countrymetrics e valutazione della performance economica dei paesi: un approccio sistemico, by Mario Coccia 14/04 Analisi del rischio paese e sistemazione tassonomica, by Mario Coccia 15/04 Organizing the Offices for Technology Transfer, by Chiara Franzoni 16/04 Le relazioni tra ricerca pubblica e industria in Italia, by Secondo Rolfo 17/04 Modelli di analisi e previsione del rischio di insolvenza: una prospettiva delle metodologie applicate, by Nadia
D’Annunzio e Greta Falavigna 18/04 SERIE SPECIALE: Lo stato di salute del sistema industriale piemontese: analisi economico-finanziaria delle
imprese piemontesi, Terzo Rapporto 1999-2002, by Giuseppe Calabrese, Fabrizio Erbetta, Federico Bruno Rolle 19/04 SERIE SPECIALE: Osservatorio sulla dinamica economico-finanziaria delle imprese della filiera del tessile e
dell’abbigliamento in Piemonte, Primo rapporto 1999-2002, by Giuseppe Calabrese, Fabrizio Erbetta, Federico Bruno Rolle
20/04 SERIE SPECIALE: Osservatorio sulla dinamica economico-finanziaria delle imprese della filiera dell’auto in Piemonte, Secondo Rapporto 1999-2002, by Giuseppe Calabrese, Fabrizio Erbetta, Federico Bruno Rolle
2003 1/03 Models for Measuring the Research Performance and Management of the Public Labs, by Mario Coccia, March 2/03 An Approach to the Measurement of Technological Change Based on the Intensity of Innovation, by Mario
Coccia, April 3/03 Verso una patente europea dell’informazione: il progetto EnIL, by Carla Basili, June 4/03 Scala della magnitudo innovativa per misurare l’attrazione spaziale del trasferimento tecnologico, by Mario
Coccia, June 5/03 Mappe cognitive per analizzare i processi di creazione e diffusione della conoscenza negli Istituti di ricerca, by
Emanuele Cadario, July 6/03 Il servizio postale: caratteristiche di mercato e possibilità di liberalizzazione, by Daniela Boetti, July 7/03 Donne-scienza-tecnologia: analisi di un caso di studio, by Anita Calcatelli, Mario Coccia, Katia Ferraris and
Ivana Tagliafico, July 8/03 SERIE SPECIALE. OSSERVATORIO SULLE PICCOLE IMPRESE INNOVATIVE TRIESTE. Imprese innovative in Friuli
Venezia Giulia: un esperimento di analisi congiunta, by Lucia Rotaris, July 9/03 Regional Industrial Policies in Germany, by Helmut Karl, Antje Möller and Rüdiger Wink, July 10/03 SERIE SPECIALE. OSSERVATORIO SULLE PICCOLE IMPRESE INNOVATIVE TRIESTE. L’innovazione nelle new
technology-based firms in Friuli-Venezia Giulia, by Paola Guerra, October 11/03 SERIE SPECIALE. Lo stato di salute del sistema industriale piemontese: analisi economico-finanziaria delle
imprese piemontesi, Secondo Rapporto 1998-2001, December 12/03 SERIE SPECIALE. Osservatorio sulla dinamica economico-finanziaria delle imprese della meccanica specializzata
in Piemonte, Primo Rapporto 1998-2001, December 13/03 SERIE SPECIALE. Osservatorio sulla dinamica economico-finanziaria delle imprese delle bevande in Piemonte,
Primo Rapporto 1998-2001, December
2002 1/02 La valutazione dell’intensità del cambiamento tecnologico: la scala Mercalli per le innovazioni, by Mario
Coccia, January

II
2/02 SERIE SPECIALE IN COLLABORAZIONE CON HERMES. Regulatory constraints and cost efficiency of the Italian public transit systems: an exploratory stochastic frontier model, by Massimiliano Piacenza, March
3/02 Aspetti gestionali e analisi dell’efficienza nel settore della distribuzione del gas, by Giovanni Fraquelli and Fabrizio Erbetta, March
4/02 Dinamica e comportamento spaziale del trasferimento tecnologico, by Mario Coccia, April 5/02 Dimensione organizzativa e performance della ricerca: l’analisi del Consiglio Nazionale delle Ricerche, by
Mario Coccia and Secondo Rolfo, April 6/02 Analisi di un sistema innovativo regionale e implicazioni di policy nel processo di trasferimento tecnologico, by
Monica Cariola and Mario Coccia, April 7/02 Analisi psico-economica di un’organizzazione scientifica e implicazioni di management: l’Istituto Elettrotecnico
Nazionale “G. Ferraris”, by Mario Coccia and Alessandra Monticone, April 8/02 Firm Diversification in the European Union. New Insights on Return to Core Business and Relatedness, by
Laura Rondi and Davide Vannoni, May 9/02 Le nuove tecnologie di informazione e comunicazione nelle PMI: un’analisi sulla diffusione dei siti internet nel
distretto di Biella, by Simona Salinari, June 10/02 La valutazione della soddisfazione di operatori di aziende sanitarie, by Gian Franco Corio, November 11/02 Analisi del processo innovativo nelle PMI italiane, by Giuseppe Calabrese, Mario Coccia and Secondo Rolfo,
November 12/02 Metrics della Performance dei laboratori pubblici di ricerca e comportamento strategico, by Mario Coccia,
September 13/02 Technometrics basata sull’impatto economico del cambiamento tecnologico, by Mario Coccia, November 2001 1/01 Competitività e divari di efficienza nell'industria italiana, by Giovanni Fraquelli, Piercarlo Frigero and Fulvio
Sugliano, January 2/01 Waste water purification in Italy: costs and structure of the technology, by Giovanni Fraquelli and Roberto
Giandrone, January 3/01 SERIE SPECIALE IN COLLABORAZIONE CON HERMES. Il trasporto pubblico locale in Italia: variabili esplicative
dei divari di costo tra le imprese, by Giovanni Fraquelli, Massimiliano Piacenza and Graziano Abrate, February 4/01 Relatedness, Coherence, and Coherence Dynamics: Empirical Evidence from Italian Manufacturing, by Stefano
Valvano and Davide Vannoni, February 5/01 Il nuovo panel Ceris su dati di impresa 1977-1997, by Luigi Benfratello, Diego Margon, Laura Rondi,
Alessandro Sembenelli, Davide Vannoni, Silvana Zelli, Maria Zittino, October 6/01 SMEs and innovation: the role of the industrial policy in Italy, by Giuseppe Calabrese and Secondo Rolfo, May 7/01 Le martingale: aspetti teorici ed applicativi, by Fabrizio Erbetta and Luca Agnello, September 8/01 Prime valutazioni qualitative sulle politiche per la R&S in alcune regioni italiane, by Elisa Salvador, October 9/01 Accords technology transfer-based: théorie et méthodologie d’analyse du processus, by Mario Coccia, October 10/01 Trasferimento tecnologico: indicatori spaziali, by Mario Coccia, November 11/01 Does the run-up of privatisation work as an effective incentive mechanism? Preliminary findings from a sample
of Italian firms, by Fabrizio Erbetta, October 12/01 SERIE SPECIALE IN COLLABORAZIONE CON HERMES. Costs and Technology of Public Transit Systems in Italy:
Some Insights to Face Inefficiency, by Giovanni Fraquelli, Massimiliano Piacenza and Graziano Abrate, October
13/01 Le NTBFs a Sophia Antipolis, analisi di un campione di imprese, by Alessandra Ressico, December 2000 1/00 Trasferimento tecnologico: analisi spaziale, by Mario Coccia, March 2/00 Poli produttivi e sviluppo locale: una indagine sulle tecnologie alimentari nel mezzogiorno, by Francesco G.
Leone, March 3/00 La mission del top management di aziende sanitarie, by Gian Franco Corio, March 4/00 La percezione dei fattori di qualità in Istituti di ricerca: una prima elaborazione del caso Piemonte, by Gian
Franco Corio, March 5/00 Una metodologia per misurare la performance endogena nelle strutture di R&S, by Mario Coccia, April 6/00 Soddisfazione, coinvolgimento lavorativo e performance della ricerca, by Mario Coccia, May 7/00 Foreign Direct Investment and Trade in the EU: Are They Complementary or Substitute in Business Cycles
Fluctuations?, by Giovanna Segre, April 8/00 L’attesa della privatizzazione: una minaccia credibile per il manager?, by Giovanni Fraquelli, May

III
9/00 Gli effetti occupazionali dell’innovazione. Verifica su un campione di imprese manifatturiere italiane, by Marina Di Giacomo, May
10/00 Investment, Cash Flow and Managerial Discretion in State-owned Firms. Evidence Across Soft and Hard Budget Constraints, by Elisabetta Bertero and Laura Rondi, June
11/00 Effetti delle fusioni e acquisizioni: una rassegna critica dell’evidenza empirica, by Luigi Benfratello, June 12/00 Identità e immagine organizzativa negli Istituti CNR del Piemonte, by Paolo Enria, August 13/00 Multinational Firms in Italy: Trends in the Manufacturing Sector, by Giovanna Segre, September 14/00 Italian Corporate Governance, Investment, and Finance, by Robert E. Carpenter and Laura Rondi, October 15/00 Multinational Strategies and Outward-Processing Trade between Italy and the CEECs: The Case of Textile-
Clothing, by Giovanni Balcet and Giampaolo Vitali, December 16/00 The Public Transit Systems in Italy: A Critical Analysis of the Regulatory Framework, by Massimiliano
Piacenza, December
1999 1/99 La valutazione delle politiche locali per l’innovazione: il caso dei Centri Servizi in Italia, by Monica Cariola and
Secondo Rolfo, January 2/99 Trasferimento tecnologico ed autofinanziamento: il caso degli Istituti Cnr in Piemonte, by Mario Coccia, March 3/99 Empirical studies of vertical integration: the transaction cost orthodoxy, by Davide Vannoni, March 4/99 Developing innovation in small-medium suppliers: evidence from the Italian car industry, by Giuseppe
Calabrese, April 5/99 Privatization in Italy: an analysis of factors productivity and technical efficiency, by Giovanni Fraquelli and
Fabrizio Erbetta, March 6/99 New Technology Based-Firms in Italia: analisi di un campione di imprese triestine, by Anna Maria Gimigliano,
April 7/99 Trasferimento tacito della conoscenza: gli Istituti CNR dell’Area di Ricerca di Torino, by Mario Coccia, May 8/99 Struttura ed evoluzione di un distretto industriale piemontese: la produzione di casalinghi nel Cusio, by
Alessandra Ressico, June 9/99 Analisi sistemica della performance nelle strutture di ricerca, by Mario Coccia, September 10/99 The entry mode choice of EU leading companies (1987-1997), by Giampaolo Vitali, November 11/99 Esperimenti di trasferimento tecnologico alle piccole e medie imprese nella Regione Piemonte, by Mario Coccia,
November 12/99 A mathematical model for performance evaluation in the R&D laboratories: theory and application in Italy, by
Mario Coccia, November 13/99 Trasferimento tecnologico: analisi dei fruitori, by Mario Coccia, December 14/99 Beyond profitability: effects of acquisitions on technical efficiency and productivity in the Italian pasta industry,
by Luigi Benfratello, December 15/99 Determinanti ed effetti delle fusioni e acquisizioni: un’analisi sulla base delle notifiche alle autorità antitrust, by
Luigi Benfratello, December 1998 1/98 Alcune riflessioni preliminari sul mercato degli strumenti multimediali, by Paolo Vaglio, January 2/98 Before and after privatization: a comparison between competitive firms, by Giovanni Fraquelli and Paola Fabbri,
January 3/98 Not available 4/98 Le importazioni come incentivo alla concorrenza: l'evidenza empirica internazionale e il caso del mercato unico
europeo, by Anna Bottasso, May 5/98 SEM and the changing structure of EU Manufacturing, 1987-1993, by Stephen Davies, Laura Rondi and
Alessandro Sembenelli, November 6/98 The diversified firm: non formal theories versus formal models, by Davide Vannoni, December 7/98 Managerial discretion and investment decisions of state-owned firms: evidence from a panel of Italian
companies, by Elisabetta Bertero and Laura Rondi, December 8/98 La valutazione della R&S in Italia: rassegna delle esperienze del C.N.R. e proposta di un approccio alternativo,
by Domiziano Boschi, December 9/98 Multidimensional Performance in Telecommunications, Regulation and Competition: Analysing the European
Major Players, by Giovanni Fraquelli and Davide Vannoni, December 1997 1/97 Multinationality, diversification and firm size. An empirical analysis of Europe's leading firms, by Stephen
Davies, Laura Rondi and Alessandro Sembenelli, January
IV
2/97 Qualità totale e organizzazione del lavoro nelle aziende sanitarie, by Gian Franco Corio, January 3/97 Reorganising the product and process development in Fiat Auto, by Giuseppe Calabrese, February 4/97 Buyer-supplier best practices in product development: evidence from car industry, by Giuseppe Calabrese, April 5/97 L’innovazione nei distretti industriali. Una rassegna ragionata della letteratura, by Elena Ragazzi, April 6/97 The impact of financing constraints on markups: theory and evidence from Italian firm level data, by Anna
Bottasso, Marzio Galeotti and Alessandro Sembenelli, April 7/97 Capacità competitiva e evoluzione strutturale dei settori di specializzazione: il caso delle macchine per
confezionamento e imballaggio, by Secondo Rolfo, Paolo Vaglio, April 8/97 Tecnologia e produttività delle aziende elettriche municipalizzate, by Giovanni Fraquelli and Piercarlo Frigero,
April 9/97 La normativa nazionale e regionale per l’innovazione e la qualità nelle piccole e medie imprese: leggi, risorse,
risultati e nuovi strumenti, by Giuseppe Calabrese, June 10/97 European integration and leading firms’ entry and exit strategies, by Steve Davies, Laura Rondi and Alessandro
Sembenelli, April 11/97 Does debt discipline state-owned firms? Evidence from a panel of Italian firms, by Elisabetta Bertero and Laura
Rondi, July 12/97 Distretti industriali e innovazione: i limiti dei sistemi tecnologici locali, by Secondo Rolfo and Giampaolo
Vitali, July 13/97 Costs, technology and ownership form of natural gas distribution in Italy, by Giovanni Fraquelli and Roberto
Giandrone, July 14/97 Costs and structure of technology in the Italian water industry, by Paola Fabbri and Giovanni Fraquelli, July 15/97 Aspetti e misure della customer satisfaction/dissatisfaction, by Maria Teresa Morana, July 16/97 La qualità nei servizi pubblici: limiti della normativa UNI EN 29000 nel settore sanitario, by Efisio Ibba, July 17/97 Investimenti, fattori finanziari e ciclo economico, by Laura Rondi and Alessandro Sembenelli, rivisto sett. 1998 18/97 Strategie di crescita esterna delle imprese leader in Europa: risultati preliminari dell'utilizzo del data-base
Ceris "100 top EU firms' acquisition/divestment database 1987-1993", by Giampaolo Vitali and Marco Orecchia, December
19/97 Struttura e attività dei Centri Servizi all'innovazione: vantaggi e limiti dell'esperienza italiana, by Monica Cariola, December
20/97 Il comportamento ciclico dei margini di profitto in presenza di mercati del capitale meno che perfetti: un'analisi empirica su dati di impresa in Italia, by Anna Bottasso, December
1996 1/96 Aspetti e misure della produttività. Un'analisi statistica su tre aziende elettriche europee, by Donatella
Cangialosi, February 2/96 L'analisi e la valutazione della soddisfazione degli utenti interni: un'applicazione nell'ambito dei servizi sanitari,
by Maria Teresa Morana, February 3/96 La funzione di costo nel servizio idrico. Un contributo al dibattito sul metodo normalizzato per la
determinazione della tariffa del servizio idrico integrato, by Giovanni Fraquelli and Paola Fabbri, February 4/96 Coerenza d'impresa e diversificazione settoriale: un'applicazione alle società leaders nell'industria
manifatturiera europea, by Marco Orecchia, February 5/96 Privatizzazioni: meccanismi di collocamento e assetti proprietari. Il caso STET, by Paola Fabbri, February 6/96 I nuovi scenari competitivi nell'industria delle telecomunicazioni: le principali esperienze internazionali, by
Paola Fabbri, February 7/96 Accordi, joint-venture e investimenti diretti dell'industria italiana nella CSI: Un'analisi qualitativa, by Chiara
Monti and Giampaolo Vitali, February 8/96 Verso la riconversione di settori utilizzatori di amianto. Risultati di un'indagine sul campo, by Marisa Gerbi
Sethi, Salvatore Marino and Maria Zittino, February 9/96 Innovazione tecnologica e competitività internazionale: quale futuro per i distretti e le economie locali, by
Secondo Rolfo, March 10/96 Dati disaggregati e analisi della struttura industriale: la matrice europea delle quote di mercato, by Laura
Rondi, March 11/96 Le decisioni di entrata e di uscita: evidenze empiriche sui maggiori gruppi italiani, by Alessandro Sembenelli
and Davide Vannoni, April 12/96 Le direttrici della diversificazione nella grande industria italiana, by Davide Vannoni, April 13/96 R&S cooperativa e non-cooperativa in un duopolio misto con spillovers, by Marco Orecchia, May 14/96 Unità di studio sulle strategie di crescita esterna delle imprese italiane, by Giampaolo Vitali and Maria Zittino,
July. Not available 15/96 Uno strumento di politica per l'innovazione: la prospezione tecnologica, by Secondo Rolfo, September
V
16/96 L'introduzione della Qualità Totale in aziende ospedaliere: aspettative ed opinioni del middle management, by Gian Franco Corio, September
17/96 Shareholders’ voting power and block transaction premia: an empirical analysis of Italian listed companies, by Giovanna Nicodano and Alessandro Sembenelli, November
18/96 La valutazione dell'impatto delle politiche tecnologiche: un'analisi classificatoria e una rassegna di alcune esperienze europee, by Domiziano Boschi, November
19/96 L'industria orafa italiana: lo sviluppo del settore punta sulle esportazioni, by Anna Maria Gaibisso and Elena Ragazzi, November
20/96 La centralità dell'innovazione nell'intervento pubblico nazionale e regionale in Germania, by Secondo Rolfo, December
21/96 Ricerca, innovazione e mercato: la nuova politica del Regno Unito, by Secondo Rolfo, December 22/96 Politiche per l'innovazione in Francia, by Elena Ragazzi, December 23/96 La relazione tra struttura finanziaria e decisioni reali delle imprese: una rassegna critica dell'evidenza
empirica, by Anna Bottasso, December 1995 1/95 Form of ownership and financial constraints: panel data evidence on leverage and investment choices by Italian
firms, by Fabio Schiantarelli and Alessandro Sembenelli, March 2/95 Regulation of the electric supply industry in Italy, by Giovanni Fraquelli and Elena Ragazzi, March 3/95 Restructuring product development and production networks: Fiat Auto, by Giuseppe Calabrese, September 4/95 Explaining corporate structure: the MD matrix, product differentiation and size of market, by Stephen Davies,
Laura Rondi and Alessandro Sembenelli, November 5/95 Regulation and total productivity performance in electricity: a comparison between Italy, Germany and France,
by Giovanni Fraquelli and Davide Vannoni, December 6/95 Strategie di crescita esterna nel sistema bancario italiano: un'analisi empirica 1987-1994, by Stefano Olivero
and Giampaolo Vitali, December 7/95 Panel Ceris su dati di impresa: aspetti metodologici e istruzioni per l'uso, by Diego Margon, Alessandro
Sembenelli and Davide Vannoni, December 1994 1/94 Una politica industriale per gli investimenti esteri in Italia: alcune riflessioni, by Giampaolo Vitali, May 2/94 Scelte cooperative in attività di ricerca e sviluppo, by Marco Orecchia, May 3/94 Perché le matrici intersettoriali per misurare l'integrazione verticale?, by Davide Vannoni, July 4/94 Fiat Auto: A simultaneous engineering experience, by Giuseppe Calabrese, August 1993 1/93 Spanish machine tool industry, by Giuseppe Calabrese, November 2/93 The machine tool industry in Japan, by Giampaolo Vitali, November 3/93 The UK machine tool industry, by Alessandro Sembenelli and Paul Simpson, November 4/93 The Italian machine tool industry, by Secondo Rolfo, November 5/93 Firms' financial and real responses to business cycle shocks and monetary tightening: evidence for large and
small Italian companies, by Laura Rondi, Brian Sack, Fabio Schiantarelli and Alessandro Sembenelli, December
Free copies are distributed on request to Universities, Research Institutes, researchers, students, etc.
Please, write to: MARIA ZITTINO
Working Papers Coordinator CERIS-CNR
Via Real Collegio, 30; 10024 Moncalieri (Torino), Italy Tel. +39 011 6824.914; Fax +39 011 6824.966; [email protected]; http://www.ceris.cnr.it
Copyright © 2004 by CNR-Ceris All rights reserved. Parts of this paper may be reproduced with the permission of the author(s) and quoting the authors
and CNR-Ceris