Water Resources Center Annual Technical Report FY 2002 · PDF fileWater Resources Center...
31
Water Resources Center Annual Technical Report FY 2002 Introduction There are two new research projects for the FY2002 annual research program for the Water Resources Center at the University of Rhode Island. The first project develops a multi-dimensional relational database management system (GeoInfoDB), which permits storage and retrieval of complete hydrologic data for sampling sites. This relational database uses Access for data storage and ArcView for data access and analysis. Querying, display and analysis of data (including site location, field data, laboratory data) are possible, thereby creating the capacity to complete spatial analysis of the data in a geographic information system (GIS). This database can be used by future investigators to submit hydrologic data in electronic format as part of their reporting procedure. The second project aims to accomplish a comprehensive hydro-geologic groundwater investigation describing the characteristics of fresh water - salt water relationships in a small rock island in a salt water environment. This investigation will greatly aid applied scientists and water resource engineers in the more appropriate application of groundwater flow theory and models for other rock islands where water resource development may be contemplated. There is also an information transfer project funded this year. Under this project completion reports of projects funded through the Water Rresources Center are converted into electronic format and placed online. Research Program
Transcript of Water Resources Center Annual Technical Report FY 2002 · PDF fileWater Resources Center...

Water Resources Center Annual Technical Report
FY 2002
IntroductionThere are two new research projects for the FY2002 annual research program for the Water ResourcesCenter at the University of Rhode Island.
The first project develops a multi-dimensional relational database management system (GeoInfoDB),which permits storage and retrieval of complete hydrologic data for sampling sites. This relationaldatabase uses Access for data storage and ArcView for data access and analysis. Querying, display andanalysis of data (including site location, field data, laboratory data) are possible, thereby creating thecapacity to complete spatial analysis of the data in a geographic information system (GIS). This databasecan be used by future investigators to submit hydrologic data in electronic format as part of their reportingprocedure.
The second project aims to accomplish a comprehensive hydro-geologic groundwater investigationdescribing the characteristics of fresh water - salt water relationships in a small rock island in a salt waterenvironment. This investigation will greatly aid applied scientists and water resource engineers in themore appropriate application of groundwater flow theory and models for other rock islands where waterresource development may be contemplated.
There is also an information transfer project funded this year. Under this project completion reports ofprojects funded through the Water Rresources Center are converted into electronic format and placedonline.
Research Program

Hydrologic Relational Database for Rhode Island
Basic Information
Title: Hydrologic Relational Database for Rhode Island
Project Number: 2002RI1B
Start Date: 3/1/2002
End Date: 12/31/2003
Funding Source: 104B
Congressional District: 2
Research Category: Not Applicable
Focus Category: Management and Planning, Water Quality, Groundwater
Descriptors:
Principal Investigators: Anne I Veeger, Nasir Hamidzada
Publication

Hydrologic Relational Database for Rhode Island
Anne I. Veeger, Nasir Hamidzada Dept. of Geosciences
University of Rhode Island
Prashanth Galisukumar, Udayan Dutta Dept. of Computer Science University of Rhode Island

Veeger – Hydrologic Relational Database for Rhode Island Page 2
Abstract The ability to store, retrieve and analyze hydrologic data is a key component of efficient planning and environmental management. In Rhode Island, existing hydrologic data are stored in a variety of U.S. Geological Survey, RI DEM, RI Department of Health, and individual investigator files and databases. Data collected through RI Water Resources (RIWRC) Center funded research for example, is stored in paper format in the form of a final report. This limits the potential application and usefulness of the data to State and local agencies and other investigators. A multi-dimensional relational database management system (GeoInfoDB), which permits storage and retrieval of hydrologic data for sampling sites, addresses the need for unified and accessible data storage. The database incorporates both spatial and non-spatial data by using a GIS approach. The spatial data are stored in an ArcInfo Coverage and the non-spatial data are stored in Access. Querying, display and analysis of data (including site location, field data, laboratory data) is possible, thereby creating the capacity to complete spatial analysis of the data in a geographic information system (GIS). This database can be used by future investigators to submit hydrologic data in electronic format as part of their reporting procedure. This will ensure continued population of the relational database with up-to-date hydrologic information. The resulting Rhode Island hydrologic data coverages are compatible with existing RIGIS coverages and are an important planning and assessment tool for the State.
Veeger – Hydrologic Relational Database for Rhode Island Page 3
Introduction The ability to store, retrieve and analyze hydrologic data is a key component of efficient planning and environmental management. In Rhode Island, existing hydrologic data are stored in a variety of U.S. Geological Survey, RI DEM, RI Department of Health, and individual investigator files and databases. Data collected through RI Water Resources (RIWRC) Center funded research for example, is stored in paper format in the form of a final report. This limits the potential application and usefulness of the data to State and local agencies and other investigators.
Clearly, there is a need to develop a unified database to improve storage of and access to the hydrologic data generated through the funding activities of the RIWRC.
This need is addressed through the development of a multi-dimensional relational database management system (GeoInfoDB), which permits storage and retrieval of complete hydrologic data for sampling sites. This relational database uses Access for data storage and ArcView for data access and analysis. Querying, display and analysis of data (including site location, field data, laboratory data) are possible, thereby creating the capacity to complete spatial analysis of the data in a geographic information system (GIS). This database can be used by future investigators to submit hydrologic data in electronic format as part of their reporting procedure. This will ensure continued population of the relational database with up-to-date hydrologic information. This database can also be expandable to include data from ongoing monitoring projects such as the URI Watershed Watch Program.
The resulting Rhode Island hydrologic data coverages are compatible with existing RIGIS coverages and will be an important planning and assessment tool for the State. This database will also provide the RIWRC with an information technology and outreach tool. Nature, scope, and objectives of the project This project contributed to the development of a relational database called GeoInfo (in Microsoft Access) capable of storing hydrologic data from surface-water and ground-water sites. Relational databases are powerful tools for data storage because they permit the development of complex and multi-dimensional relations between data elements. When linked with the capacities of a geographic information system (GIS) the database becomes a powerful tool for not only storing, retrieving and displaying data, but also spatial and temporal analysis. The objectives of this project were as follows:
• Development of database structure. This represents the synthesis of data components into a framework for the database. Through meetings with interested parties we will establish the types and range of data to be included in the database. A site database template will serve as the main data table that will link to associated data tables (field data, laboratory data, well data, geologic/soil data, interpretation, etc).
• Construction of relational database. • Population of the relational database with data from projects in the Pawcatuck
Watershed and from Jamestown RI. Produce digital maps that display the location of all database sites on a variety of map

Veeger – Hydrologic Relational Database for Rhode Island Page 4
bases (topographic, digital orthophoto, cultural). These maps and the associated database will be compatible with the State’s GIS system (i.e. RIGIS).
Introduction to GeoInfoDB
GeoInfoDB is a relational database developed at the Department Of Geosciences, University Of Rhode Island. It is designed to handle a wide varieties of hydrologic, geological and geotechnical data. Currently it stores data related to three data types, water quality, wells/boreholes, and soil-gas radon.
The database is designed to be scalable which allows addition of new data types or removal of existing data types from the database. All data information pertaining to individual data type exists in a modular structure aiding in ease of flow of data within the database. Spatial and Thematic data can be incorporated within the database and can be linked to GIS software’s and Rock ware database without any difficulty paving way for advanced analysis of the data. The database has been normalized to reduce redundancy. Multilevel referential integrity has been maintained throughout the database, which ensures data consistency.
GeoInfoDB incorporates essential elements of each date type. For water quality sites this includes site information (location, site type, altitude) and both field and laboratory water quality parameters including major and minor inorganic constituents, stable and radioactive isotopes as well as nutrients and trace metals. For well or borehole sites, data include land-surface elevation; depth to water table; depth to bedrock; and interval data on selected material properties, including low and/or high blow count zones, organic soils, and artificial fill. The complete subsurface record of the borehole lithology can also be recorded. Radon data related to soil gas and indoor radon can include radon related chemistry.
The existing data can be viewed and modified at any point of time. Data retrieval can be performed using several existing queries based on criteria’s such as location (county, city, quad, X and Y coordinates), project names, depth to bedrock, depth to water, hole depth, company names (Funding Agency, Engineering company, Geotechnical Company, Drilling Company). Data for the multiple entries like lithology, fill, organic material and Blow count are retrieved using existing queries. Scanned log sheets if present for existing borehole data can be viewed in bitmap format.
This database can be applied to store information about the water quality, subsurface geology, and radon data for any region in Rhode Island. GeoInfoDB is one part of a larger project, designed to develop an interactive, web-based, and GIS-oriented library of geological data in Rhode Island. The GeoInfoDB project is jointly funded by the Rhode Island Water Resources Center (water quality module) and the University of Rhode Island Transportation Center and Rhode Island Department of Transportation (subsurface geology module) and the URI Department of Geosciences (radon module).
DATABASE STRUCTURE AND CHARACTERISTICS GeoInfoDB design addresses the following goals: layer-by-layer (multi-value for a single field) data capacity, incorporation of legacy data, data import capability, and scalability to include diverse data as well as future database expansion. This is accomplished through a tiered structure with related tables for each category and type of data (figure 1). At present the database design includes three different types of data: borehole, water quality and

Veeger – Hydrologic Relational Database for Rhode Island Page 5
soil-gas radon. The data type associated with each record determines the data fields that will be populated. Each point location may be associated with multiple records and data types. The resulting modular database is therefore scalable, allowing future development and incorporation of additional data modules. The relational database will reside in a SQL server. Data access and querying, as well as display and analysis, can be accomplished through GIS applications (ArcView, ArcInfo). This will permit querying and display of water quality data, and access to all borehole related information. System Requirements
Hardware Requirements
GeoInfoDB is a relational database that runs on Windows environment with the following minimum requirements Windows PC • Intel Pentium II or compatible • 128 MB of available RAM • 400 MB of hard disk space
Software Requirements
• Windows 2000 Professional or XP Professional or Home Edition • Microsoft Access 2000 or XP • ArcView 3.2 or later

Veeger – Hydrologic Relational Database for Rhode Island Page 6
Figure 1. Model relational database architecture for GeoINfoDB.
Site
Soil-gas Radon Data Source
Shared Information
Type-specific data
Data Type
Water Quality Data Source Borehole
Data Source
Type-specific data
Type-specific data

Hydro-geologic Investigation of the Fresh Water lens in a SmallRock
Basic Information
Title: Hydro-geologic Investigation of the Fresh Water lens in a Small Rock
Project Number: 2002RI2B
Start Date: 3/1/2002
End Date: 12/31/2003
Funding Source: 104B
Congressional District: 2
Research Category: Not Applicable
Focus Category: Groundwater, Methods, Water Quality
Descriptors:
Principal Investigators: Daniel W Urish
Publication

1
HYDRO-GEOLOGIC INVESTIGATION OF THE FRESH WATER LENS IN A SMALL ROCK ISLAND USING GEOPHYSICAL METHODS
Rhode Island Water Resources Center (USGS) Grant Account 5-35695
Daniel W. Urish, Ph.D, P.E., University of Rhode Island
ABSTRACT
Rose Island is a small rock island located in Narragansett Bay, Rhode Island It has evolved as a protected bird sanctuary since its release to private ownership in 1970s, after 200 years of military fortification status. The island surface is composed of irregular, but low topography covered with dense second growth vegetation, except for the immediate lighthouse area. Bedrock is shallow, composed of very old granitic and sedimentary rocks, separated by two southwest- northeast trending fracture zones. The overburden is largely glacially derived fine sand and silt sediments. The average precipitation is 46.5 inches/year with an estimated 20 inches entering the water table from which it eventually reaches the island coastline to merge with the surrounding salt water of the bay. Some groundwater exists during the rainy periods in a perched status over compressed hardpan layers. Because of the relatively thin, less than 4 feet of soil and unconsolidated sediment much of the soil moisture and near surface groundwater is lost during the summer months through evapo-transpiration. Measurements in 12 monitoring wells and geo-electrical surveys of the island confirm the shallow water table and near surface highly irregular underlying bedrock. There does not appear to be any sediment deposits of high permeability. Much of the groundwater appears to move toward and be focused in a flow pattern by higher permeability bedrock fractures. A limited and irregular thin freshwater lens appears to exist. Groundwater quality near the shorelines is generally high in salinity, but the interior of the island yields fresh water. However, as a result of the high bird population the ground water is very high in nutrients, reaching levels of 20 mg/l of nitrogen (in the nitrate form), twice the acceptable level for drinking water. 1. INTRODUCTION 1.1 Location
Rose Island is a small 18.5 acre rock island located in Narragansett Bay, Rhode Island (Fig. 1), and is classified as a protected wildlife and environmental educational area. During the period of April 1 through August 15th the island access is restricted because of its status as a bird nesting sanctuary. The island is also a significant historic site with fortifications dating back to the Revolutionary War era. Access to the island is only by boat. The entire island is controlled by the Rose Island Lighthouse Foundation, which owns the island, except for the lighthouse. The purpose of the Rose Island Lighthouse Foundation is “to preserve the historic and environmental integrity of Rose Island, to maintain and operate its Lighthouse and to provide education and access for all people” (Johnson, 2002). The Foundation is particularly supportive of ecosystem directed

2
studies since it enhances their knowledge of the physical and environmental aspects of the island.
Figure 1. Location map of Rose Island
1.2 Personnel The personnel involved in this study have included other university researchers in the geologic sciences, students at both the undergraduate and graduate levels, and various lay person volunteers for data collection. The approach of the study has been to incorporate the participants in a team effort, while contributing to each individual’s personal knowledge and appreciation of Rose Island as a unique study area. This is conformance with the mission of the Rose Island Lighthouse Foundation “to provide education and public access for all people”.

3
2. STUDY OBJECTIVES
The primary purpose of this study is to evaluate and characterize the hydro- geologic and hydro-environmental characteristics of a small rock island. This island is unique in that it provides a small rock island that has reverted from a highly developed state to a natural condition without significant anthropogenic influences, and is small enough to allow a comprehensive study. As such it will contribute to the rather limited knowledge of the hydro-geology of rock islands in a salt water environment, as well as the interactions of a natural ecosystem. Additionally, the study will provide supplemental information to other scientific researchers, including botanists, geologists and ecologists to assist in their work, and a library of island educational information for the public at large.
3.0 TASKS AND METHODLOGY
A variety of techniques and tools were employed to accomplish the tasks
associated with the objectives of this study as described in the following paragraphs.
3.1 Data collection 1) Twelve monitor wells were installed in order to collect monthly groundwater
level and water quality data for a period of 15 months. These were placed by hand digging and augering. Soil samples were collected. The locations of the wells are shown on Fig.2. These wells consisted of both open-ended 1 ¾ inch PVC pipe and steel well points with 18 inch screens as detailed in Table 1. Depths ranged from 3 ft to 12 ft. A reference datum was established for the island and the tops of all monitor wells were surveyed by use of a TOPCON automatic level. Locations were established by the Global Positioning System (GPS) method.

4
Figure 2. Monitor well locations TABLE 1

5
2) Because the water levels in the island are dependent on the tidal boundary it was necessary to establish a record of the tidal fluctuation. This was done by the installation of a tide gage on an old pier piling at the south end of the island. The installed tide gage was a Ecotone water level electrical capacitance logger which was programmed to take water level readings every 15 minutes. The measuring mark on the tide gage was related to an island reference datum
3) Water quality was measured in-situ for temperature, salinity and electrical
conductivity. The measurements were made by direct down-hole insertion of a YSI probe (YSI Model 30) and also on water samples by salinity refractometer (VISTA Model A366ATC)

6
4) Water samples were extracted by hand operated vacuum pump. In addition automatic temperature loggers were installed in the groundwater at 3 monitor locations, at an air station and in the Bay. These loggers collected readings every 30 minutes. Bottled water samples were collected for later lab analysis for nutrients, chlorides and pH.
5) Geophysical surveys were accomplished in order to assist in the determination of
location of bedrock and water table. These consisted of electrical resisitivity surveys using both direct current vertical electrical soundings and a state-of-the-art electrical resistivity OhmMapper TR1 profiler. This techniques is a non-invasive method which inputs an electrical current into the ground and measures the response given by variations in subsurface material and water electrical conductivity; this can then be interpreted in terms of depths to water table and bedrock, types of subsurface material and water salinity.
6) The geology of the island was identified using both existing geologic map
information and field reconnaissance with special reference to the location of fracture zones. Soil characteristics were determined from published government soils maps and verified by field sampling and laboratory analysis.
7) Precipitation data was collected from published records for Rose Island and three
other stations in the Narragansett area having long term records in able to develop correlations of precipitation patterns over Rose Island. In addition, direct storm information with water samples was collected from a precipitation gage installed on the island.
3.2 Laboratory analysis
3.2.1 Soil samples
Soil samples were collected dried and sieved for grain size analysis. Porosity
was determined for the dry samples by the weight-volume method, assuming that the sediment is the usually quartz composition; examination by microscope (Swift ULTRA LITE Stereo Model SM85BF) shows this to be true of interior samples, but nearshore and shore line sands contain a high proportion of calcium carbonate from sea shells and other marine organisms.
3.2.2 Water samples
Water samples were collected and measured for salinity and electrical conductivity and temperature in the lab using a YSI Yellow Spring Model 30 S-T-C meter. Less precise measurements of salinity were also taken using the salinity refractometer (Vista Model A366ATC) as an independent check. The pH was determined using a pH meter (IQ Scientific, ISFET Model IQ 120). Additionally, water samples were collected and analyzed in the laboratory for nitrogen, phosphate and calcium using Hach chemical analysis kits.

7
3.3 Computer based analysis
3.3.1 Precipitation
Statistical analysis of means, deviations and correlation was accomplished to determine long-term precipitation relationships between Rose Island and other regional climatological stations (Dunne and Leopold, 1978). The object was to ascertain both monthly and annual precipitation trends over the Bay with special reference to Rose Island.
3.3.2 Water budgets
Water budgets for the island were developed using the Thornthwaite Method (Thornthwaite, 1955; Dunne and Leopold, 1978) to ascertain island groundwater recharge, runoff and evapo-transpiration. This method calculates the distribution of precipitation on a monthly basis, taking into account the ambient air temperature and water use by vegetation.
4. RESULTS AND DISCUSSION
4.1Geology 4.11 Soils Rose Island is covered by three basic soil types (U.S. Department of Agriculture, 1981) distributed as shown on Fig. 3. Descriptions of these soil types is as follows:
A) Ba – Beach deposits B) CeC – Canton and Charlton fine sandy loams, very rock, 3 to 5 percent slopes C) MmA – Merrimac sandy loam 0 to 3 percent slopes In general, these soils are glacially derived, both by direct water-borne deposition and limited Aeolian deposits (Newport, 1988). They constitute a thin veneer on the underlying bedrock There does not appear to be any coarse sands or gravels, most likely because Rose Island during immediate post-glacial times, when sea level stood some 320 feet below present sea level, was the high point of a small bedrock high some 150 feet above the present bay bottom to the west. In this setting of limited runoff it is unlikely that significant coarse sediments would be deposited. The sandy soil is derived from granite and gneiss bedrock parent materials. The silty material is from parent shales and slates. There are no defined stream channels on the island. While some sheet runoff occurs along the island margins, especially from the exposed bedrock, much of the precipitation in the interior of the island infiltrates directly into the soil from topographic depressions.

8
4.12 Bedrock
The bedrock of Rose Island is of three principal rock formations separated by major southwest-notheast trending thrust fault zones (Quinn, 1971; Hermes, et al, 1994) located as shown on Fig. 3 and described from north to south as follows:
A) Pnbr – Rhode Island Formation composed of sandstone, shale and conglomerate. B) Pnbs – Sachuest Arcose composed of smoky quartz granule, conglomerate, sandstone and phyllite
C) Znpn – Price Neck Formation composed of graded beds of feldspatic siltstone and sandstone, carbonate conglomerate, and ash-flow tuff and lapilli tuff.
In addition to the two major thrust faults identified on Fig. 3 there are numerous fracture lines which are apparent manifested in many locations by the lowered topography cause by weaker bedrock structure. There are strong indications that these may be significant from a bedrock groundwater flow viewpoint. 4.13 Geo-physical surveys Geo-electrical surveys were accomplished over several areas of the island as shown on Fig. 4 in order to explore the subsurface characteristics of the island in a non-invasive manner. There were 3 survey lines run using the recently developed OhmMapper developed by Geometrics, Inc. of San Jose, CA. This is a high production

9
system with a coupled electrical transmitter and receiver which is pulled along the ground taking subsurface electrical resistance readings at the rate of two per second. The system was able to “view’ approximately 20 feet below the surface, sufficient to locate the water table and bedrock surfaces. In addition, 4 conventional vertical electrical soundings have been made to probe much deeper, down to approximately 100 feet. These were able to pick up deeper bedrock with salt water in the fractures. Additional work with geophysics is planned to locate more definitive bedrock fracture zones.
4.2 Climate 4.21 Precipitation The precipitation amounts for Rose Island were collected and analyzed using both monthly and annual values collected directly on the island and compared with other regional climatological stations, namely Jamestown, Prudence Island, Kingston and Green Airport. It was decided that The Kingston University of Rhode Island Station and the Green Airport Station were the most reliable long term records to use in extrapolating

10
precipitation information for Rose Island which has a much shorter term of record. Based on ten years of record, a period of 1993 through 2002, Rose Island had an average annual precipitation of 46.5 inches and experienced a low of 38.1 inches and a high of 55.4 inches. The annual regression equation between Rose Island and Kingston is: R = 0.68 K + 11.60 (1) Where R is Rose Island annual precipitation and K is Kingston annual precipitation. Precipitation for selected recurrence intervals can be predicted using this annual regression relationship along with the a long term recurrence frequency analysis for Kingston. When this is done for the 1/20 year recurrence frequency it is predicted that Rose Island can expect a dry year with 37.4 inches and a wet year with 56.5 inches once every 20 years. 4.22 Water Budgets The water budget analysis (Thornthwaite and Mather, 1955; Dunne and Leopold, 1978) is an attempt to evaluate what happens to the precipitation that falls on Rose Island in any period of time. In the case of Rose Island, a closed hydrologic system, the water budget can be simply defined as: P = Rs + Rg – ET (2) Where P is precipitation, Rs is surface runoff, Rg is groundwater runoff and ET is evapo-transpiration. In order to evaluate the water budget adequately and meaningfully the water balance must be examined on a monthly basis. It is especially important to note the major difference in evapo-trnspiration (ET) between summer months when the ET may be as high as 6.5 inches/month, greatly exceeding the monthly precipitation which on the average is about 3.5 inches, but may be as little as 0.5 inches. The water balance during the summer months hence is strongly in favor of ET which requires that moisture be taken by the vegetation from the vadose zone soil moisture and from the shallow water table; the soil then drys up and the water table is lowered; in the case of Rose Island about 2-3 feet. For Rose Island the approximate annual water budget is:
46.5 (P) = 5.5 (Rs) + 20.0 (Rg) + 21 (ET)
4.3 Water levels 4.3.1 Groundwater

11
The groundwater is an essential component of the island ecosytem, acting as the source of water to satisfy the demands of the vegetation over the dry summer months. Because the water table is shallow and the grain size of the soil is fine there is relatively high capillarity which moves the water from the water table continuously into the root zone of much of the vegetation. This drastically lowers the water table since water is only stored in the open pore spaces betweens soil grains: the available moisture is a saturated volume of soil or silty sand is about 25 to 35 %; hence the use of 4 inches of moisture from the ground in a summer month will lower the water table as much as a foot, if there is no precipitation recharge. The water budget show a moisture deficit with no groundwater recharge for the island during the period of June through September.
The fluctuations of the water table during the 9-month period of October, 2002 to June, 2003 are shown in Table 2. The maximum fluctuation range in the monitor wells is

12
2.7 feet, but is expected to show much greater range as the summer months of July and August are measured. Figure 5 is a cross-section of the eastern side of the island extending from the shore inland 300 feet. This shows the ground surface in relationship to the water table in a set of 6 monitor wells over the 9-month period. The range of water table is shown for each well. It is especially noteworthy that the water table gradient is toward the interior of the island, rather than to the shoreline as would normally be expected. This strongly suggests a relatively high permeable (bedrock fracture?) zone in the interior of the island that encourages the groundwater flow toward itself.
4.3.2 Tidal boundary Figure 5 also shows the tidal boundary, which is the key determinant of water level in the island. The normal tidal range for the Bay at Rose Island is about 3.5 feet, but during a spring tide is 4.7 feet. The lateral boundary moves 100 to 150 feet as the tide moves up and down the shoreline. This tidal movement also causes a fluctuation in the groundwater near the shore which attenuates and lags in times as it progresses inland. Under normal conditions the average annual water table can be no lower than the average sea water boundary elevation, and in most relatively wet islands such as Rose Island a thin fresh water lens 10 to 15 feet thick would form with its average upper surface about 0.5 feet above the mean sea level, thickening in the winter and thinning in the summer. In the case of the complex geologic structure of Rose Island some semblance of a fresh water lens probably persists throughout the year, but is highly irregular. Continuing summer measurements will help to define any existence of fresh water on Rose Island and its relationship with the salt water boundary.
13
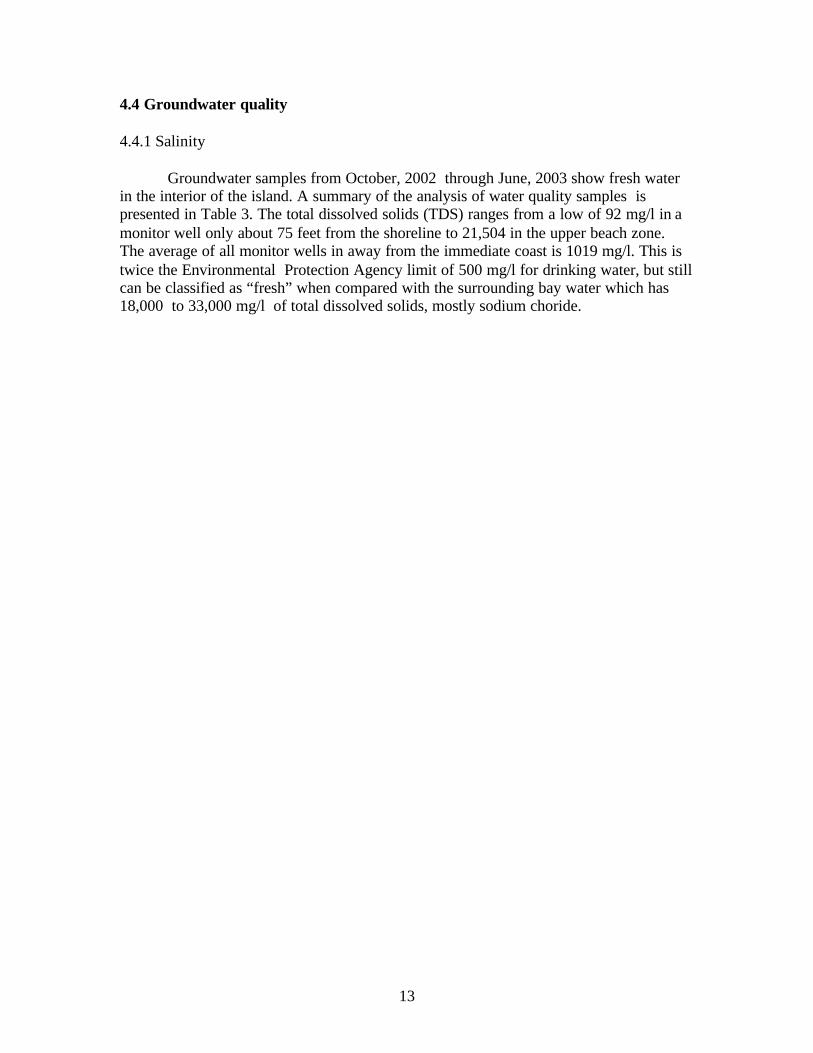
4.4 Groundwater quality 4.4.1 Salinity
Groundwater samples from October, 2002 through June, 2003 show fresh water in the interior of the island. A summary of the analysis of water quality samples is presented in Table 3. The total dissolved solids (TDS) ranges from a low of 92 mg/l in a monitor well only about 75 feet from the shoreline to 21,504 in the upper beach zone. The average of all monitor wells in away from the immediate coast is 1019 mg/l. This is twice the Environmental Protection Agency limit of 500 mg/l for drinking water, but still can be classified as “fresh” when compared with the surrounding bay water which has 18,000 to 33,000 mg/l of total dissolved solids, mostly sodium choride.

14
4.4.2 Nutrients The high contribution of nutrients into the groundwater is a unique feature of Rose Island. The deposit of guano throughout the island April through August by thousand of birds rapidly moves without attenuation into the shallow groundwater system. While there is take up of nutrients by the lush vegetation much of this simply recycles back into the system. Since the growing bird nesting population is a fairly recent event in time, viz. the last 30 years, it is not know if this has stabilized with maximum nesting sites or is still increasing. If still increasing, then the level of nutrients in the groundwater may continue to increase also. The current range of a key conservative nutrient, nitrogen, is from 1 to 20 mg/l, with an average in all monitor wells of 5.2,

15
above the Environmental Protection Agency limit of 5.0 mg/l for drinking water. A summary of the nitrogen (in nitrate form) levels is presented in Table 3. The high level of nitrogen, however, seems not to have any negative effects as long as the water is not used for drinking. 4.4.3 Temperature Normally the temperature of groundwater at a depth lower than 20 feet below the ground remains near the average annual temperature the year around. In the case of Rose Island the water table is no more than 6 feet in any of the wells and most are less than 3 feet. Accordingly, the groundwater temperature fluctuates with the seasonal temperature, but with a lag time, depending on the depth to water. During the period of measurement the minimum temperature measured of 2.90 C occurred in March and the high of 11.90 C occurred in November. This can be compared with the Bay water temperature range from 1.80 C to 12.60 C.
5 CONCLUSIONS 5.1 Current conclusions Rose Island has a very complex hydro-geologic structure, consisting of soils of high variability in hydraulic conductivity and infiltration capability. A fresh water lens overlying salt water exists on the island, but is highly fragmented and controlled mainly by higher permeability bedrock fracture zones in the shallow bedrock. Water quality is poor, but still classifies as a viable fresh water source for island creatures and vegetation. High evapo-transpiration during the summer drastically takes water from soil and the shallow water table by capillary action. Water quality is greatly affected by the large number of nesting birds and excrement during the nesting season April through August. This provides nutrients, good for the vegetation, but bad for humans from a drinking water quality viewpoint. Additionally, the shallow water table provides little opportunity for mitigation of nutrients or pathogens by filtration or adsorption processes. 5.2 Continuing Tasks As an environmental study it is essential that data be collected and observations be made over a period of at least 15 months at Rose Island. This is necessary to ensure that a complete annual cycle of seasonal influences is included in the study. This is especially important in the case of Rose Island since there is not only the normal seasonal variations in temperature, precipitation and vegetation growth, but also the seasonal effects of the bird population on groundwater quality. Because of the restrictions placed on human activity during the bird nesting season, the initial monitor wells were not placed until October, 2002. Accordingly, it is planned to continue collecting precipitation data, water level measurements and water quality measurements through the month of

16
December, 2003. Additionally, when access to the interior of the island is possible in late August additional geophysical surveys will be accomplished to further document the subsurface features of the island.
6 ACKNOWLEDGEMENTS
The valuable support and encouragement of the Executive Director of the Rose Island Lighthouse Foundation , Charlotte Johnson, was essential to this study, and is greatly appreciated. Dr. Reinhard Frohlich, geophysicist with the University of Rhode Island was both a very valuable co-researcher in field operations, as well as a contributing expert in interpretation of the geophysical techniques employed. Valuable contributions in determination of bedrock fracture zones was made by Patrick Barosh, formerly of the U.S. Geological Survey. The study was also greatly enhanced by the participation of University of Rhode Island graduate student Bjoern Michaelis, who made a significant contribution in his special study of the island precipitation and water budget. Through the generosity of Joseph Fresella, the engineering company of Fresella Engineers freely provided most valuable information on past island surveys. REFERENCES
Dunne, T. and L.B. Leopold, 1978, Water in the Environment, W.H. Freeman & Co., San Francisco, CA., pp 236-254. Geometrics Inc., 1998, GEOPROFILES, “Ohm-Mapper TR1”, June, 1998, 5pp. Hermes, O. D., L. P. Gromet, D. P. Murray, 1994, Bedrock Geologic Map of Rhode Island, RI Map Series No. 1, Office of the RI State Geologist. Johnson, C., 2002, “About Rose Island”,website www.roseisland.org/roseisle.htm. Newport, 1988, Rose Island Environmental Review Team Report, The City of Newport, RI, 43 pp.
Quinn, A. W., 1971, The Bedrock Geologic Map of Rhode Island, U. S. Geologic Survey Bulletin No. 1295, Plate 1. Reed’s, 2002 and 2003, Tide and Current Tables, Thomas Reed Publications, Inc. for the East Coast. Shiner and Gonthier, 1965, Ground-water Map of the Prudence Island and Newport Quadrangles, GWM 20, RI Water Resources Coordinating Board. Thornthwaite, C. W., and J. R. Mather, 1955, The Water Balance, Publications in Climatology, Vol. VIII, No. 1, 86 pp.

17
Todd, D. K., 1980, GROUNDWATER HYDROLOGY, John Wiley and Sons, Inc., New York, N. Y., p 280. U. S. Department of Agriculture, 1981, Soil Survey of Rhode Island, Conservation Service, July, 1981, 200pp. U. S. Department of the Interior, 1949, Open-file Report, U. S. Geologic Survey, Water Resources Branch, Providence RI Office, “Well Schedule for the Naval Torpedo Station”, 2 pp. U. S. Geological Survey, 1975, Topographic Map of the Newport Quadrangle. U. S. National Oceanic and Oceanographic Office, 2002, Climatologic Data for Rose Island, Kingston and Greene Airport.

Information Transfer Program

Electronic Conversion of Results of Research Sponsored by the Center
Basic Information
Title: Electronic Conversion of Results of Research Sponsored by the Center
Project Number: 2002RI3B
Start Date: 3/1/2002
End Date: 2/28/2003
Funding Source: 104B
Congressional District: 2
Research Category: Not Applicable
Focus Category: Water Supply, Groundwater, Surface Water
Descriptors:
Principal Investigators: George Tsiatas
Publication

This project initiated the conversion to electronic format of published completion reportsfor projects sponsored by the Water Resources Center. During this phase of the project emphasiswas on recent reports for which a file in word or wordperfect format was available. These wereconverted to pdf files and are being placed online for wide dissemination. During the next phaseof the project reports with no electronic version will be first scanned and then they will beconverted into pdf format.

USGS Summer Intern Program

Student Support
Student Support
CategorySection 104Base Grant
Section 104RCGP Award
NIWR-USGS Internship
Supplemental Awards
Total
Undergraduate 1 0 0 0 1
Masters 3 0 0 0 3
Ph.D. 2 0 0 0 2
Post-Doc. 1 0 0 0 1
Total 7 0 0 0 7
Notable Awards and Achievements
Publications from Prior Projects