
Water Demand Management Study: Baseline Survey of ... · Water Demand Management Study: Baseline...
83
Water Demand Management Study: Baseline Survey of Household Water Use (Part A) Anneliese Spinks 1 , Kelly Fielding 1 , Sally Russell 2 , Aditi Mankad 1 and Jennifer Price 1 February 2011 Urban Water Security Research Alliance Technical Report No. 40
Transcript of Water Demand Management Study: Baseline Survey of ... · Water Demand Management Study: Baseline...

Water Demand Management Study: Baseline Survey of Household Water Use (Part A) Anneliese Spinks1, Kelly Fielding1, Sally Russell2, Aditi Mankad1 and Jennifer Price1 February 2011
Urban Water Security Research AllianceTechnical Report No. 40

Urban Water Security Research Alliance Technical Report ISSN 1836-5566 (Online) Urban Water Security Research Alliance Technical Report ISSN 1836-5558 (Print) The Urban Water Security Research Alliance (UWSRA) is a $50 million partnership over five years between the Queensland Government, CSIRO’s Water for a Healthy Country Flagship, Griffith University and The University of Queensland. The Alliance has been formed to address South-East Queensland's emerging urban water issues with a focus on water security and recycling. The program will bring new research capacity to South-East Queensland tailored to tackling existing and anticipated future issues to inform the implementation of the Water Strategy. For more information about the:
UWSRA - visit http://www.urbanwateralliance.org.au/ Queensland Government - visit http://www.qld.gov.au/ Water for a Healthy Country Flagship - visit www.csiro.au/org/HealthyCountry.html The University of Queensland - visit http://www.uq.edu.au/ Griffith University - visit http://www.griffith.edu.au/
Enquiries should be addressed to: The Urban Water Security Research Alliance PO Box 15087 CITY EAST QLD 4002 Ph: 07-3247 3005; Fax: 07-3405 3556 Email: [email protected]
Authors: 1 - CSIRO; 2 - Griffith University
Spinks, A., Fielding, K. Russell, S., Mankad, A. and Price, J. (2011). Water Demand Management Study: Baseline Survey of Household Water Use (Part A). Urban Water Security Research Alliance Technical Report No. 40.
Copyright
© 2011 CSIRO. To the extent permitted by law, all rights are reserved and no part of this publication covered by copyright may be reproduced or copied in any form or by any means except with the written permission of CSIRO.
Disclaimer
The partners in the UWSRA advise that the information contained in this publication comprises general statements based on scientific research and does not warrant or represent the accuracy, currency and completeness of any information or material in this publication. The reader is advised and needs to be aware that such information may be incomplete or unable to be used in any specific situation. No action shall be made in reliance on that information without seeking prior expert professional, scientific and technical advice. To the extent permitted by law, UWSRA (including its Partner’s employees and consultants) excludes all liability to any person for any consequences, including but not limited to all losses, damages, costs, expenses and any other compensation, arising directly or indirectly from using this publication (in part or in whole) and any information or material contained in it.
Cover Photograph:
For the Love of Jasmine © Spinks and Schroder, 2010

Water Demand Management Study: Baseline Survey of Household Water Use (Part A) Page i
ACKNOWLEDGEMENTS
This research was undertaken as part of the South East Queensland Urban Water Security Research Alliance, a scientific collaboration between the Queensland Government, CSIRO, The University of Queensland and Griffith University. Particular thanks go to Sarah Malkin, the helpful and ever–patient staff at Direct Service Marketing, Tommi Productions, Impact Lists, Prospect Shop, Survey Sampling International, colleagues, friends and family who undertook piloting of the survey and finally, but most importantly to the participants who took part in the research.

Water Demand Management Study: Baseline Survey of Household Water Use (Part A) Page ii
FOREWORD
Water is fundamental to our quality of life, to economic growth and to the environment. With its booming economy and growing population, Australia's South East Queensland (SEQ) region faces increasing pressure on its water resources. These pressures are compounded by the impact of climate variability and accelerating climate change. The Urban Water Security Research Alliance, through targeted, multidisciplinary research initiatives, has been formed to address the region’s emerging urban water issues. As the largest regionally focused urban water research program in Australia, the Alliance is focused on water security and recycling, but will align research where appropriate with other water research programs such as those of other SEQ water agencies, CSIRO’s Water for a Healthy Country National Research Flagship, Water Quality Research Australia, eWater CRC and the Water Services Association of Australia (WSAA). The Alliance is a partnership between the Queensland Government, CSIRO’s Water for a Healthy Country National Research Flagship, The University of Queensland and Griffith University. It brings new research capacity to SEQ, tailored to tackling existing and anticipated future risks, assumptions and uncertainties facing water supply strategy. It is a $50 million partnership over five years. Alliance research is examining fundamental issues necessary to deliver the region's water needs, including: ensuring the reliability and safety of recycled water systems. advising on infrastructure and technology for the recycling of wastewater and stormwater. building scientific knowledge into the management of health and safety risks in the water supply
system. increasing community confidence in the future of water supply. This report is part of a series summarising the output from the Urban Water Security Research Alliance. All reports and additional information about the Alliance can be found at http://www.urbanwateralliance.org.au/about.html.
Chris Davis Chair, Urban Water Security Research Alliance

Water Demand Management Study: Baseline Survey of Household Water Use (Part A) Page iii
CONTENTS
Acknowledgements ................................................................................................................. i
Foreword ................................................................................................................................. ii
Executive Summary ................................................................................................................ 1
1. Introduction ................................................................................................................... 3
2. Conceptual Framework ................................................................................................. 3
3. Methodology .................................................................................................................. 6 3.1. Setting and Study Period ..................................................................................................... 6 3.2. Ethics ................................................................................................................................... 6 3.3. Study Design ........................................................................................................................ 6 3.4. Study Population and Participants ....................................................................................... 7
3.4.1. Study Population Characteristics ...................................................................................... 7 3.4.2. Participant Recruitment Procedures ................................................................................. 7
3.5. Data Collection ..................................................................................................................... 8 3.5.1. Instruments ....................................................................................................................... 8 3.5.2. Study Variables ................................................................................................................ 9
3.6. Data Management and Analysis .......................................................................................... 9 3.6.1. Scale Construction ........................................................................................................... 9 3.6.2. Analytic Strategy ............................................................................................................... 9
4. Results ......................................................................................................................... 10 4.1. Baseline Survey: Survey Response ................................................................................. 10 4.2. Participant Characteristics: Household and Demographic Variables ............................... 12
4.2.1. Regional Comparisons: Demographic and Household Variables .................................. 12 4.3. Psycho-Social and Behavioural Self-Report Variables ...................................................... 13
4.3.1. Curtailment Behaviour .................................................................................................... 13 4.3.2. Efficiency Behaviour (Installation of Water Saving Devices) .......................................... 15
4.4. Expanded Theory of Planned Behaviour: Prediction of Water Saving Intentions ............ 16 4.4.1. Overall Curtailment Intentions ........................................................................................ 16 4.4.2. Specific Curtailment Intentions ....................................................................................... 17 4.4.3. Overall Efficiency Intentions ........................................................................................... 19 4.4.4. Specific Efficiency Intentions .......................................................................................... 20
5. Conclusion ................................................................................................................... 22 5.1. Summary and Implications ................................................................................................ 22 5.2. Methodological Strengths and Weaknesses ..................................................................... 24
Appendix A - Post Codes of Study Regions ...................................................................................... 25
Appendix B - Initial and Reminder Recruitment Postcards ............................................................. 26
Appendix C - Online Pre-Recruitment Survey ................................................................................... 27
Appendix D - Participant Information Sheet ...................................................................................... 28
Appendix E - Household Water Use Survey ...................................................................................... 30
Appendix F - Consent Form for Release of Water Data ................................................................... 49
Appendix G - Study Variables and Scale Construction ................................................................... 50
Appendix H - Construction of Expanded TPB Regression Models ................................................. 53
Appendix I - Bivariate Correlations: Curtailment and Efficiency Variables .................................. 55
Appendix J - Demographic Comparisons: Psycho-Social and Behavioural Self-Report Variables ..................................................................................................................................... 57
References ............................................................................................................................ 76
Water Demand Management Study: Baseline Survey of Household Water Use (Part A) Page iv
LIST OF FIGURES Figure 1. Theory of Planned Behaviour Model. ................................................................................................ 4 Figure 2. Expanded Theory of Planned Behaviour Model. ............................................................................... 5
LIST OF TABLES Table 1. Baseline Survey Response. ............................................................................................................ 11 Table 2. Comparison of Age and Number in Household across Regions. ..................................................... 12 Table 3. Comparison of Gender across Regions........................................................................................... 12 Table 4. Household Income Categories for each Region. ............................................................................. 12 Table 5. Highest Level of Education across Regions. ................................................................................... 13 Table 6. Cultural Background across Regions. ............................................................................................. 13 Table 7. Self-Reported Water Use Category across Regions. ...................................................................... 13 Table 8. Expanded TPB: Prediction of Overall Curtailment Intentions. ........................................................ 16 Table 9. Expanded TPB: Prediction of Specific Curtailment Intentions. ....................................................... 18 Table 10. Expanded TPB: Prediction of Overall Efficiency Intentions. ........................................................... 19

Water Demand Management Study: Baseline Survey of Household Water Use (Part A) Page 1
EXECUTIVE SUMMARY
Population growth, changes in land use, and climate change are putting pressure on existing water resources worldwide and it is not certain that supplies are adequate to meet the increasing demand for water (Bates et al., 2008). Effective water resource management is critical to facilitating sustainable water use. A key example is Australia, where inconsistent rainfall and rapid urbanisation have contributed to frequent water restrictions due to unsustainable water practices (CSIRO, 2010). South East Queensland (SEQ) has been subject to periods of prolonged drought and this has forced water policy makers to pursue water demand management strategies and explore alternative water sources, particularly at the household level. The SEQ Water Strategy’s main aim is to delay the need for major water infrastructure by encouraging the community to adopt water saving strategies and hence use less water around the home. As residential water use accounts for most urban water use in SEQ, it is important that researchers develop a comprehensive understanding of the social and behavioural aspects of household water use. There is a need to understand how people use water, and how sustainable levels of water use can be achieved and maintained in the long-term. The Residential Water Demand Management project addresses these issues. This report (Part A) presents preliminary results from the second phase of the Residential Water Demand Management Project. The research involved a quantitative survey of free-standing owner-occupied households from the SEQ community. The survey identified psycho-social and socio-demographic drivers of residential water use, using the Theory of Planned Behaviour (TPB) as the overarching theoretical framework (Ajzen, 1991). An Expanded TPB model was tested and provided a systematic framework to identify the predictors of two different types of household water conservation behaviours: 1) curtailment behaviours, which refers to everyday water saving actions (e.g., taking shorter showers, turning tap off while brushing teeth); and 2) efficiency behaviours, which refers to one-off installations of water efficient appliances (e.g. water efficient washing machines, rainwater tanks; Gardner and Stern, 1996). It was hypothesised that individuals who held positive attitudes toward water conservation (attitudes), believed there was support from important others for engaging in water conservation (subjective norm), and perceived that they could easily engage in this activity (perceived behavioural control) and should have strong intentions to conserve water in the household. Additional predictors were also thought to influence behaviour and were added into the model, including: community and self identity (as a water conserver), moral and descriptive norms, household culture, and past behaviour (i.e. habits). The study was conducted within four local government areas (LGAs) in the SEQ region: Brisbane, Gold Coast, Ipswich and Sunshine Coast. Participants were owner occupiers of free-standing dwellings in the target regions and were recruited via a commercial list supplier (n = 1381) or through an online research panel (n = 603). Targeted households were connected to the central water supply and had an individual water meter attached to their premises. Participants completed The Household Water Use Survey (paper or online version), which consisted of 27 multi-item questions which were designed to elicit information about participants’ household water use and conservation, as well as standard demographic and household composition data. In the analyses, variables were assessed based on the Expanded TPB model and responses were distinguished as curtailment and efficiency water saving behaviours, with associated attitudes and intentions. Results revealed regional and demographic differences in water conservation attitudes and intentions. Younger respondents were less likely to demonstrate positive attitudes, perceived less support to engage in water saving behaviours, and felt less morally obliged to save water than their older counterparts. Females were more likely to feel a moral obligation to conserve water and reported higher self-efficacy in relation to water saving behaviours. Females also reported higher intentions to engage in both curtailment and efficiency behaviours around the home, as did people within the lower income and education categories. Respondents in the lower income and education categories also reported engaging in past curtailment actions more often than other groups of participants.

Water Demand Management Study: Baseline Survey of Household Water Use (Part A) Page 2
Interestingly, households in the top two income categories were less likely to have installed greywater systems in their homes. However, there was a linear relationship between household income and past installation of water efficient washing machines. Linear regression models were performed to test how well the Expanded TPB variables were able to predict intentions to carry out curtailment and efficiency related behaviours, when demographic and household characteristics were controlled for. Consistent with past research framed by the TPB (Armitage and Conner, 2001; Conner and Armitage, 1998), the results of the baseline survey showed that stronger overall intentions to engage in water conservation practices - both everyday actions and installation of efficient devices - were associated with more positive attitudes to these actions, a greater sense of personal obligation to engage in the actions, and a greater sense of self-efficacy (i.e. confidence that one can save water). Looking specifically at intentions to engage in water curtailment actions (i.e. everyday water saving practices), it was clear that a sense of personal moral obligation to conserve water around the home was the strongest determinant of intentions to engage in everyday water saving practices. It was also evident that living in a household that had a culture of water conservation was an important determinant of respondents’ intentions to engage in everyday water saving practices. In terms of overall water efficiency intentions, feeling a sense of personal moral obligation to save water was again the strongest predictor of efficiency intentions. It was also evident that stronger overall efficiency intentions were associated with a greater sense that others in the community had installed efficiency devices (i.e. descriptive norms) and householders who identified more with the SEQ community had stronger efficiency intentions. These findings suggest that water efficiency intentions are, in part, influenced by householders’ connection with the larger community and their observations of what others in the community are doing. The results also highlight the important influence of past behaviour on future intentions - both overall and specific intentions (cf. Conner and Armitage, 1998). Specific past behaviours were significant predictors of overall curtailment and efficiency intentions. Past behaviour was also the strongest predictor of future intentions to engage in specific water curtailment actions (e.g. checking and fixing leaking taps, taking shorter showers). The only other consistent predictor was self-identity, with stronger efficiency intenders perceiving themselves as great water conservers. This finding is consistent with identity theory (Stryker, 1968; 1980) and with past research demonstrating that self-identity is an important addition to the TPB (e.g. Conner and Armitage, 1998; Fielding, McDonald and Louis, 2008). In terms of predictors of intentions to install specific water efficient appliances, the most consistent predictors across the different appliances were moral norms and self-efficacy. Householders who felt confident that they could save water around their homes reported stronger intentions to take action. Taken together, these results suggest avenues for motivating householders’ willingness to engage in water conservation practices. Feeling a sense of personal moral obligation to conserve water is an important determinant of overall water curtailment and efficiency intentions and intentions to install specific water efficiency devices. Messages that highlight the link between individual actions and the collective outcome and those that emphasise the responsibility of all citizens to address the issue of water conservation may help to develop this sense of moral obligation. Creating a culture of water conservation, within the household and within the broader community, may promote willingness to engage in water conserving actions. Providing procedural information or rebates and incentives (e.g. for installing water efficient appliances) may help to develop householders’ confidence and efficacy. Further, providing prompts at the point of water use or developing implementation intentions, such as a written plan of when, where, and how to enact particular behaviours may help to do this. Once people acquire an identity as a water conserver, they are likely to pursue actions that are congruent with that identity. The Part B report will detail the key predictors of householders’ objective household water use, allowing us to investigate whether householders’ water conservation intentions are translated into action.

Water Demand Management Study: Baseline Survey of Household Water Use (Part A) Page 3
1. INTRODUCTION
Access to water is a critical issue globally and nationally. Moreover, existing stressors on water resources including population growth, change in land use, and urbanisation are expected to be greatly exacerbated by climate change (Bates et al., 2008). The challenge, then, is to creatively manage water resources in the context of increasing water scarcity and this challenge is particularly pressing in Australia (CSIRO, 2010). As the driest inhabited continent, but one of the highest water users (CSIRO, 2010), the effective management of water resources is a critical issue facing Australia. Recent evidence of this comes from prolonged drought conditions around Australia, requiring water policy makers to manage demand and explore alternative sources of water. In South East Queensland (SEQ), one of the many Australian regions affected by prolonged drought, a key platform of the recently formulated South East Queensland Water Strategy is to delay the need for major water infrastructure through encouraging the community to use less water. As residential water use accounts for most urban water use in SEQ, achieving the goal of reducing water grid demand hinges on developing a comprehensive understanding of the social and behavioural aspects of household water use. There is a need to understand how people use water, and how sustainable levels of water use can be achieved and maintained in the long-term. Despite the clear need for social and behavioural research on residential water use, to date there has been relatively little social research in this area (Russell and Fielding, 2010; Fielding, Louis, Warren, and Thompson, 2009). The Residential Water Demand Management project within the Systematic Social Analysis project addresses this shortcoming. The Residential Water Demand management project aims to understand how households use water in their daily lives and how water conserving behaviours may be supported as a “way of life” in SEQ through a mix of interventions. Specifically, the project aims:
to identify the psycho-social and socio-demographic drivers of residential water using practices; to determine the effectiveness of targeted intervention strategies for achieving long-term
sustainable residential water use; and to make a significant contribution to the scientific literature on water demand management. The research addressing these questions is proceeding in three stages. The first stage involved qualitative focus groups to identify the salient beliefs associated with household water conservation (Fielding, Russell, and Grace, 2010). The current report describes the second phase of the research. The second phase - the quantitative survey of free-standing owner occupied households from the SEQ community - identifies the psycho-social and socio-demographic drivers of residential water use. In the third phase of the project, results of the survey study will be used to design interventions that target the key psycho-social and socio-demographic drivers of household water use. Phase 3 will consequently entail a trial of the interventions to evaluate their effectiveness for achieving long-term household water conservation. The project makes a significant applied and empirical contribution to the literature on residential water demand management. It provides concrete information to policy makers about the key drivers of household water use. Moreover, the rigorous theoretical approach combined with the collection of self-report and actual water use data ensures that the research addresses many of the limitations of previous research in this area (see Russell and Fielding, 2010) and, thus, makes a significant contribution to the scientific literature.
2. CONCEPTUAL FRAMEWORK
The overarching theoretical framework adopted for the research is the Theory of Planned Behaviour (Ajzen, 1991). This model has been used extensively to understand a range of behavioural decision-making contexts, including household water conservation (Clark and Finley, 2007; Harland et al., 1999; Kantola et al., 1982; Lam, 1999, 2006). It should be noted, however, that previous research using this model to address household water conservation has been marked by methodological and measurement limitations (Russell and Fielding, 2010) including the failure to distinguish between

Water Demand Management Study: Baseline Survey of Household Water Use (Part A) Page 4
different types of water conservation practices (e.g. everyday actions versus installing efficient appliances), failure to collect objective household water use data, and the tendency to link individual psycho-social drivers to a collective outcome (i.e. household water use). The current project is designed to overcome these past limitations. The Theory of Planned Behaviour (TPB) is a parsimonious model (see Figure 1) of the informational and motivational influences that combine to predict behaviours. In the TPB, the most immediate predictor of behaviour is an intention (i.e. a motivation or plan) to engage in the behaviour. The TPB proposes intention to be determined by the additive effects of attitude, subjective norm and perceived behavioural control. Attitudes refer to the overall positive or negative evaluation of performing the behaviour (e.g. water conservation). Subjective norms are based on individuals’ perception of whether important other people in their life would want them to perform the behaviour, and perceived behavioural control reflects the extent to which individuals consider the behaviour to be within their control. Therefore, according to the TPB, individuals who hold positive attitudes toward water conservation, think that there is support from important others for engaging in water conservation, and who perceive that they can easily engage in this activity, should have strong intentions to conserve water in the household. In addition, to the extent that perceived behavioural control is a proxy for actual control, it may also directly impact on behaviour, such that a greater sense of control over conserving water around the house will be associated with higher levels of actual household water conservation.
Figure 1. Theory of Planned Behaviour Model.
The TPB is recognised as a parsimonious model of the drivers of people’s behavioural decisions (e.g. decisions to engage in water conservation actions), however, there is also recognition that additional predictors may increase the predictive power of the model in certain behavioural contexts (Conner and Armitage, 1998). A review of the literature on household water conservation (Russell and Fielding, 2010) suggests the importance of a number of additional predictors of household water use. In addition to subjective norms which capture people’s sense that important others support a behaviour, we have also included measures of descriptive norms and moral norms. Descriptive norms describe typical or normal behaviour – what people actually do as opposed to what they ought to do (Cialdini, Kalgren and Reno, 1990). Cialdini and colleagues (1990) argue that descriptive norms motivate behaviour because they provide information about what is adaptive and effective in a given situation. Moral norms tap into a person’s sense of personal obligation to engage in a behaviour. We reason, in accordance with past literature (Manstead and Parker, 1995), that if people have a sense that it is their moral duty to conserve water then they will be more likely to engage in water conservation behaviours. Note that moral norms are different from injunctive norms in that the former reflect social consensus about what is appropriate whereas the latter reflects a sense of personal moral obligation.
Intention
Attitude toward the behaviour
Subjective Norm
Perceived behavioural
control
Behavioural beliefs (Behavioural belief x outcome evaluation)
Normative beliefs (Normative belief x
motivation to comply)
Behavioural control beliefs (Control belief x perceived
power)
Behaviour

Water Demand Management Study: Baseline Survey of Household Water Use (Part A) Page 5
In accordance with recent theorising, we have also incorporated into the basic model measures of identity: community identification (i.e. as a member of the SEQ community), self-identification (i.e. as a water conserver), and household culture. We reason that people who are more identified with the SEQ community may be more aware of and concerned about water security issues, and therefore will be more committed to conserving water. Past research has also shown that self-identity, for example as a water conserver, is a powerful motivator of behaviour (Conner and Armitage, 1998). The logic for the relationship comes from identity theory (Stryker, 1968; 1980): identity motivates action, and to not engage in role-appropriate behaviour (e.g. water conservation) creates a state of internal tension due to conflict between identity and actions. Therefore, householders who have a strong sense of themselves as water conservers may be more likely to engage in water conservation actions. We have also tried to capture the predominantly collective nature of water conservation through the inclusion of a measure of household culture. One of the limitations of past social and behavioural research on household water conservation is that it has primarily drawn on individual data (e.g. individuals’ attitudes) to predict (what is usually) a collective outcome (i.e. household water use). In the current study, we have sought to overcome this limitation in two ways: 1) by recruiting multiple participants from each household; and 2) by assessing the culture of the household in relation to water conservation. The latter variable assesses the extent to which the culture (i.e. the norms and identity) of the household supports water conservation. Thus, although an individual household member might be committed to water conservation, unless that person’s attitudes and actions are shared by the rest of the household, there may be little relationship between reported individual attitudes and household water use. Finally, in many cases our actions are determined not by reasoning but by automatic, habitual processes (e.g. Ouellette and Wood, 1998). For example, for actions that are performed on a regular basis (e.g. brushing teeth, showering), we do not necessarily weigh up the costs and benefits or think about whether others approve or disapprove. Rather we act automatically. In previous literature, habit is usually measured by assessing the extent to which people have engaged in an action in the past. Where past behavioural engagement is high, this indicates that an action is likely a habit and that people are more likely to engage in that action in the future. The Expanded Theory of Planned Behaviour (ETPB) model incorporating descriptive norms, moral norms, community identification, self-identity, household culture and habits (i.e. past behaviour) is represented in Figure 2.
Figure 2. Expanded Theory of Planned Behaviour Model.

Water Demand Management Study: Baseline Survey of Household Water Use (Part A) Page 6
In the first phase of the research, focus groups were conducted to identify the key beliefs that underpin attitudes, subjective norms, and perceived behavioural control (Fielding, Russell, and Grace, 2010). Findings from the Phase 1 focus groups provide insight into the costs and benefits of engaging in everyday water conservation and installing water efficient appliances - beliefs that are thought to underpin attitudes. The focus groups also elicited the barriers and facilitators of water conservation - beliefs that underpin perceptions of control, and the main influences on water conservation behaviour - beliefs that feed into perceptions of normative support. The second quantitative survey phase of the research (described in this report) tested the ETPB model. The ETPB model provided a systematic and rigorous framework to identify the predictors of two different types of household water conservation behaviours: 1) curtailment behaviours that refer to everyday water saving actions such as taking shorter showers, and only washing full loads of clothes; and 2) efficiency behaviours that refer to one-off installation of water efficient appliances such as water efficient washing machines and rainwater tanks (Gardner and Stern, 1996). It must be acknowledged that there may be some overlap between these two types of actions; for example, a person can only use a half flush option if they have installed a dual flush toilet. Nevertheless, this distinction exists in the conservation literature and is useful in delineating everyday, habitual conservation behaviours from more one-off actions that allow for ongoing efficiencies. Moreover, past research has shown that different factors may be related to water curtailment than water efficiency actions (Russell and Fielding, 2010). This report (Part A) provides details of the methods of the Baseline Survey of Household Water Use, as well as results of analyses testing the ability of the ETPB model to explain intentions to engage in water conservation. The ability of the model to explain objective household water use will be the focus of a future report (Part B) for this second phase of the research.
3. METHODOLOGY
3.1. Setting and Study Period The study was conducted within four local government areas (LGAs) in the SEQ Region: Brisbane, Gold Coast, Ipswich and the Sunshine Coast. The main elements of the study were implemented in September 2009, however, study data covers the time period from July 2007 until 2010.
3.2. Ethics Ethical clearance for the study was provided by The University of Queensland Human Research Ethics Committee.
3.3. Study Design The study consisted of a cross-sectional Household Water Use Survey matched with historic and prospective water consumption data sourced from the water utility of each of the regional city councils. The Household Water Use Survey was designed to be answered by individuals, however it was recognised that the majority of households in the region (84% of free standing dwellings; ABS, 2006) are comprised of two or more people. Therefore, attempts were made to recruit two members from each participating household who would independently complete their own version of the survey. This was done in order to account for the fact that household water use is a collective variable that depends on the behaviour of all members of the household.

Water Demand Management Study: Baseline Survey of Household Water Use (Part A) Page 7
3.4. Study Population and Participants
3.4.1. Study Population Characteristics
The targeted study population consisted of householders residing within the designated study region postcodes (See Appendix A). Due to the necessity of being able to access individual household water consumption data, targeted households were owner-occupiers of dwellings connected to the central water supply with an individual water meter attached to the premises (i.e. not a multiple-tenancy complex with shared/body corporate water records).
3.4.2. Participant Recruitment Procedures
Participants were recruited via two separate methods: either Direct Mail or through an Online Research Panel. The purpose of using both recruitment strategies was to reduce the overall bias in participant recruitment that was likely to occur if only one method was used.
3.4.2.1 Direct Mail Recruitment
Name and address details of households in the study regions were purchased from two commercial list suppliers. The commercial list providers selected names and addresses based on the criteria of being a home owner (owned home outright or mortgage) of a free-standing dwelling, not intending to move residence for 12 months. Due to the commercial list provider having information for a limited number of households in Ipswich, additional (N = 473) Ipswich names and addresses were supplied by a second commercial provider who was able to search for individuals who were resident owners of free-standing dwellings. As mentioned previously, the application of these criteria was limited by the accuracy of the information held by the list suppliers, so that some of the household details that were supplied did not correspond with the target population. A total of 4423 households were targeted: 1250 each from Brisbane and Gold Coast, 899 from Ipswich and 1024 from the Sunshine Coast. The recruitment process entailed a three-stage mailout of: 1) Initial postcard; 2) Survey pack; and 3) Reminder postcard (See Appendix B for Initial and Reminder postcards). The purpose of the initial postcard was to notify people that they had been selected for participation in the study and to provide a brief rationale of the study’s purpose prior to their receiving the survey itself. Both the initial and reminder postcards were intended to boost the survey response rate. The Survey Pack consisted of a Participant Information Sheet (see below for more details), two copies of a Household Water Use Survey (see below for more details), a reply paid envelope and a small incentive to encourage participation, consisting of two teabags sourced from an Australian owned, organic tea company (Koala Tea) and either a CSIRO, Griffith University or University of Queensland pen. Contact details for the study project team were provided on the Participant Information Sheet and the project team responded to approximately 70 phone and 100 email enquiries that resulted from the direct mail recruitment process. The majority of enquiries were from individuals who either did not wish to participate or were not connected to main water supply and thus unsure of whether or not they should complete the survey. In general, the tone of the enquiries was positive with very little suspicion or hostility expressed.
3.4.2.2 Online Research Panel Recruitment
A commercial online research company was sub-contracted to administer an online version of the survey to members of their research panel. Panel members were individuals who had signed up to complete surveys on a wide array of research topics in return for a small financial incentive ($10) for each survey completed. Based on previously collected information, the online survey company attempted to recruit panel members who fell into the study target category. This was done by emailing panel members who met the target criteria and inviting them to complete a pre-recruitment survey which checked their eligibility for participation (Appendix C). The online company used this strategy to target the following number of eligible participants for each region: Brisbane, N = 450; Gold Coast, N = 250; Ipswich, N = 100; Sunshine Coast N = 150.

Water Demand Management Study: Baseline Survey of Household Water Use (Part A) Page 8
Eligible participants were told that they would be contacted again shortly via email and asked to take part in the main study. In addition, given that one of the study aims was to recruit a second member of each participating household, eligible panel members were also asked to provide a name and email address for another adult member of their household who would also be willing to complete the survey. Subsequently, eligible online survey participants completed all survey questions on the internet after being contacted via email by the online recruitment company. In order to increase the survey completion rate, the online research company sent reminder emails to eligible participants who either did not complete or only partially completed the survey. All online survey participants were asked to provide postal contact details (name and address) so that a Water Data Release Consent form could be mailed to them, along with a reply paid envelope to allow for the return of the signed consent form. A reminder letter with a second consent form was mailed to all participants who had not returned a completed consent form after three weeks.
3.5. Data Collection
3.5.1. Instruments
3.5.1.1 Participant Information Sheet
The Participant Information Sheet explained to potential participants the purpose of the study and what would be involved. Briefly, participants were required to complete and return the enclosed Household Water Use Survey and provide consent for the city council water utility to release historic and future water consumption records to the project team. The information sheet was either included in the survey pack mailed to participants recruited via the Direct Mail method or was made available as a web-page for participants recruited via the Online Research Panel method. Given the variation in recruitment methods, the information provided to participants differed slightly to the instructions for completing the survey (See Appendix D).
3.5.1.2 Household Water Use Survey
The Household Water Use Survey (Appendix E) consisted of 27 multi-item questions (103 items in total) which were designed to elicit information from participants about various aspects of household water use and conservation, as well as standard demographic and household composition data. The majority of questions used the Likert Scale response format, however, some open-ended and categorical multi-choice questions were also included. The Household Water Use Survey was available in two formats which were administered according to the participant recruitment method. Direct Mail participants received the survey as part of a Household Survey Booklet which also contained a Water Data Release Consent Form (see below). The Online Research Panel participants completed an online version of the survey.
3.5.1.3 Consent Form for Release of Water Data
The Water Data Release Consent Form (See Appendix F) required participants to provide details of their property account (including the name the account was held in, property assessment/ID number and property address) and to sign to provide permission for the relevant city council water utility to release water consumption data. For the direct mail participants, the consent form was included in the Household Survey Booklet (the page was able to be removed via a perforated tear). The consent was mailed separately to participants who had been recruited via the Online Research Panel method.
3.5.1.4 ABS Census Data
Australian Bureau of Statistics 2006 Census data were accessed from the ABS website http://www.abs.gov.au/ to allow for the demographic comparison of study respondents with the targeted population.
Water Demand Management Study: Baseline Survey of Household Water Use (Part A) Page 9
3.5.2. Study Variables
3.5.2.1 Household Water Use Survey Variables
The Household Water Use Survey assessed variables from the ETPB model. Importantly, however, the survey also distinguished between curtailment and efficiency water saving behaviours and their associated attitudes and intentions. All variables from the Household Water Use Survey fall into two categories: those either directly measured through participant self-report or from council water utility records and those constructed based on participant responses to one or more survey items. Details of the variables, including their format and construction are in Appendix G.
3.6. Data Management and Analysis
3.6.1. Scale Construction
Scale construction was undertaken by combining the data items relevant to each constructed scale (See Appendix G). The internal consistency of each scale was tested by Cronbach’s alpha, also shown in Appendix G. One of the anticipated scales relevant to the ETPB: Perceived Behavioural Control did not display sufficient consistency among the three items. On closer examination, it was decided that one of the items was worded in a confusing way and a decision was made to discard that item from further analysis. The remaining two items of that scale were not combined but treated separately in all further analyses. The separate items measured perceived control and self-efficacy.
3.6.2. Analytic Strategy
3.6.2.1 Participant Characteristics: Household and Demographic Characteristics
The household and demographic characteristics of participants were compared across the four LGAs (or regions): Brisbane, Ipswich, Gold Coast, and Sunshine Coast. One-way analysis of variance (ANOVA) was used to analyse the continuous dependent variables with Tukey’s posthoc tests conducted to test the difference between means. Chi-square test for independence was used to analyse the categorical (e.g. gender) and ordinal level (e.g. education level) dependent variables. To control for Type 1 error due to the large number of comparisons being conducted, a more stringent alpha level of p<.01 was adopted for all analyses.
3.6.2.2 Psycho-Social and Behavioural Self-Report Variables
The TPB and additional variables were compared across regions and household/demographic variables using ANOVA with Tukey’s posthoc tests to test for differences between means. As for the household and demographic factors (see above), Chi-square test for independence was used to analyse the categorical (e.g. gender) and ordinal level (e.g. education level) dependent variables. To control for Type 1 error due to the large number of comparisons being conducted, a more stringent alpha level of p<.01 was adopted for all analyses.
3.6.2.3 Theory of Planned Behaviour: Prediction of Water Saving Behaviour Intentions
Linear regression models were performed to test how well the expanded TPB variables were able to predict intentions to engage in water saving behaviours. More specifically, models were constructed to predict:
Overall Curtailment intentions Specific Curtailment intentions Overall Efficiency intentions Specific Efficiency intentions.
The regression models were based on the ETPB and also controlled for demographic and household characteristics. Survey data from respondents who lived in households not connected to a central water supply were not included in the analyses. Details pertaining to the construction of the regression models are shown in Appendix H.

Water Demand Management Study: Baseline Survey of Household Water Use (Part A) Page 10
4. RESULTS
4.1. Baseline Survey: Survey Response A total of 1,179 households returned a Direct Mail survey (27% of those invited), while 570 households completed the survey online. Additionally, a second survey was received from 195 (16.5%) households. However, water consumption data were not available for all households completing the survey. A portion of surveys were completed by non-targeted households who had either shared water meters (i.e. multi-dwelling complexes) or were not connected to a central water supply. Additionally, not all participants returned a signed consent form to allow for the release of water consumption data by the city councils. The survey response statistics broken down by recruitment method, region and availability of water consumption data are shown in Table 1.

Water Demand Management Study: Baseline Survey of Household Water Use (Part A) Page 11
Table 1. Baseline Survey Response.
Brisbane Gold Coast Ipswich Sunshine
Coast
Unknown
Region
Total
Households Respondents
Direct Mail Survey
Surveys sent 1250 1250 958 965 - 4423
Received Water use data available 232
(49) 203 (35) 197 (29) 260 (60) - 892 1065
No water data: tank water - 28 (2) 4 (0) 28 (3) - 60 65
No water data: other 67 (9) 91 (11) 26 (3) 21 (1) 22 227 251
Total postal surveys received 299 (58) 322 (48) 227 (32) 309 (64) 22 1179 1381
Online Survey
Targeted 300 200 100 120 720
Completed Water use data available 80 (11) 32 (6) 18 (3) 21 (2) - 163 185
No water data: tank water - 11 (2) - 11 (1) - 22 25
No water data: other 144 (5) 90 (2) 26 (1) 48 (0) 89 385 393
Total online surveys completed 224 (16) 133 (10) 44 (3) 80 (3) 89 570 603
Total Surveys received / completed 523 (74) 455 (58) 271 (36) 389 (27) 111 1749 1984
** Not including 41 duplicate surveys –survey is counted as a Direct Mail survey when completed by recruitment methods. Numbers in brackets indicate the number of second surveys received/completed within the household.

Water Demand Management Study: Baseline Survey of Household Water Use (Part A) Page 12
4.2. Participant Characteristics: Household and Demographic Variables
4.2.1. Regional Comparisons: Demographic and Household Variables
The regional comparisons involve the comparison of respondents in four groups: Brisbane, Ipswich, Gold Coast, and Sunshine Coast. A significant difference emerged in the age of the householders across the regions (F(3, 1818) = 20.65, p<.001). Respondents in the Brisbane and Gold Coast regions were similar in age, as were Ipswich and Sunshine Coast respondents, however, Brisbane and Gold Coast respondents were significantly younger than Ipswich and Sunshine Coast respondents (See Table 2). There was also a significant difference in the number of people in the house across regions (F(3, 1859) = 11.88, p<.001). As Table 2 shows, household size did not differ for respondents in the Brisbane and Gold Coast regions or Ipswich and the Sunshine Coast, however, Brisbane and Gold Coast households had more people than Ipswich and Sunshine Coast households.
Table 2. Comparison of Age and Number in Household across Regions.
Variable Brisbane
(Mean) Gold Coast
(Mean) Ipswich (Mean)
Sunshine Coast (Mean)
Age 50.51a 52.66a 56.09b 57.02b
No in household 2.87 2.91 2.57 2.51
Table 3. Comparison of Gender across Regions.
Variable Brisbane
(%) Gold Coast
(%) Ipswich
(%) Sunshine Coast
(%)
Males 46.4 38.0 45.4 43.4
Females 53.4 61.8 56.4 56.4
There was no difference in the ratio of males to females who responded to the survey across regions (2 = 9.32, df = 3, p = .156) (Table 3). Regions significantly differed, however, in their household annual income (2 = 120.02, df = 3, p<.001). Table 4 shows that the general pattern is for more low income households (<$30,000) in Ipswich and the Sunshine Coast, fewer middle income households in Brisbane compared to the other regions and more high income households (i.e., >$90,000) in Brisbane than in the other regions.
Table 4. Household Income Categories for each Region.
Household Income Level Brisbane
(%) Gold Coast
(%) Ipswich
(%) Sunshine Coast
(%)
<$30,000 14.2 17.2 27.9 22.7
$30,000 – 59,999 17.7 27.5 20.8 31.2
$60,000 – 89,999 20.4 26.3 26.0 25.4
$90,000 – 119,999 19.8 12.5 12.1 12.3
$120,000 – 149,999 12.3 6.0 6.4 3.6
>$150,000 8.1 5.4 4.9 3.4
Prefer not to respond 7.5 5.1 1.9 1.4
There was a significant difference across regions in their highest level of education (2 = 126.34, df = 3, p<.001) (Table 5). A greater number of respondents in Ipswich had primary school as their highest level of education than other regions. In general, a higher number of respondents in Ipswich, Gold Coast and Sunshine Coast than Brisbane had high school or Trade/TAFE qualifications whereas a higher number of Brisbane respondents had tertiary qualifications than in other regions.

Water Demand Management Study: Baseline Survey of Household Water Use (Part A) Page 13
Table 5. Highest Level of Education across Regions.
Education Level Brisbane
(%) Gold Coast
(%) Ipswich
(%) Sunshine Coast
(%)
Primary school 1.9 .8 10.3 2.4
High school 29.3 39.6 37.1 32.4
Trade/TAFE 21.3 27.0 29.1 33.7
Tertiary undergraduate 25.0 17.9 12.9 17.1
Tertiary postgraduate 22.5 14.7 10.6 14.4
Regions also significantly differed on cultural background (2 = 45.93, df = 3, p<.001). In general, there was greater cultural diversity amongst the Brisbane and Gold Coast respondents than amongst the Ipswich and Sunshine Coast respondents (Table 6).
Table 6. Cultural Background across Regions.
Cultural Background Brisbane
(%) Gold Coast
(%) Ipswich
(%) Sunshine Coast
(%)
Anglo-European 87.1 90.9 93.2 97.3
Asian/Middle Eastern 6.7 2.6 2.0 .7
Other 6.2 6.5 4.7 2.0
In terms of water use, respondents from the different regions differed in whether they classified themselves as low, medium, or high water users (2 = 82.05, df = 3, p<.001). Compared to other regions, respondents in Ipswich were more likely to classify their household as a low water user and less likely to classify their household as a medium water user (Table 7). Brisbane and Gold respondents, on the other hand, were more likely to classify themselves as high water users.
Table 7. Self-Reported Water Use Category across Regions.
Self Reported Water Use
Brisbane (%)
Gold Coast (%)
Ipswich (%)
Sunshine Coast (%)
Low water user 34.6 36.6 57.5 40.7
Medium water user 37.5 41.8 28.4 41.8
High water user 25.1 16.8 11.0 11.7
Don’t know 2.7 4.8 3.0 5.8
4.3. Psycho-Social and Behavioural Self-Report Variables One way ANOVAs were performed to determine regional and demographic differences in the ETPB variables. A summary of the statistically significant differences revealed by these analyses is provided below, while detailed results are available in Appendix I.
4.3.1. Curtailment Behaviour
4.3.1.1 Attitudes
Females were more likely than males to have positive attitudes to curtailment actions. Respondents aged 15-24 years were less likely to demonstrate positive curtailment attitudes than respondents aged over 55 years.
4.3.1.2 Subjective Norms
Respondents aged 15-24 years were less likely to perceive support from important others for engaging in curtailment actions to save water than all other age groups.

Water Demand Management Study: Baseline Survey of Household Water Use (Part A) Page 14
4.3.1.3 Moral Norms
Females were more likely than males to feel a moral obligation to engage in curtailment actions. Respondents aged 15-24 years were less likely to feel a moral obligation to engage in curtailment actions than all other age groups. Respondents who had completed undergraduate tertiary education felt less moral obligation to engage in curtailment actions than respondents with high school education.
4.3.1.4 Perceived Community Norms
Sunshine Coast residents perceived less conservation in their community through curtailment actions than Ipswich or Gold Coast residents. Females perceived more conservation through curtailment actions in their community than did males.
4.3.1.5 Self-Efficacy
Females had higher levels than males of perceived self-efficacy (i.e. confident they could save water in this way) in relation to curtailment actions. Respondents aged 25-54 years had greater self-efficacy in relation to curtailment actions than respondents aged 65 year and over.
4.3.1.6 Perceived Control
Respondents aged 15-24 years were less likely to feel that they had control over engaging in curtailment actions than all other age groups. Respondents with high school education or below felt greater control over curtailment actions than respondents with postgraduate education.
4.3.1.7 Intentions to Engage in Curtailment Behaviour
Compared to residents from other regions, Sunshine Coast residents reported lower intentions to collect rainwater for use on garden, wash cars with minimal water, collect and use greywater on garden and to be water-wise in the garden. Compared to Brisbane residents, Gold coast residents reported less intention to collect and use rain water on their gardens. Females reported higher intentions than did males to only run dishwasher and washing machine if full, wash cars with minimal water, use minimal water in the kitchen, collect and use greywater on the garden, turn off taps when brushing teeth and being water-wise in the garden. Respondents aged 15-24 years had fewer intentions to engage in a range of curtailment actions than all other age groups. Respondents in lower income categories had stronger intentions to engage in a range of curtailment actions than respondents in higher income categories. Respondents with high school level education and below consistently reported higher intentions to engage in curtailment actions than all other respondents.
4.3.1.8 Past Curtailment Behaviour
Sunshine Coast residents reported lower levels of curtailment actions in the last six months, including collecting rainwater for use on garden, washing cars with minimal water, collecting greywater for the garden and being water-wise in the garden compared to residents from other regions. However, Sunshine coast residents reported checking and fixing leaking taps more than Brisbane and Ipswich residents. Females reported higher curtailment actions in the last six months than males. Younger respondents (15–24 year olds) were also less likely to have engaged in specific curtailment actions in the last six months compared with all other age groups. Respondents in lower income categories had engaged in more curtailment actions in the last six months than respondents in higher income categories. Respondents with high school level education and below consistently reported having engaged in curtailment actions in the last six months more than all other respondents.

Water Demand Management Study: Baseline Survey of Household Water Use (Part A) Page 15
4.3.2. Efficiency Behaviour (Installation of Water Saving Devices)
4.3.2.1 Attitudes
Females were more likely than males to have positive attitudes to installing water saving devices (i.e. efficiency actions). Respondents aged 15-24 years reported less positive efficiency attitudes than all other age groups.
4.3.2.2 Subjective Norms
Respondents aged 15-24 year perceived less support from important others for installing water saving devices than respondents aged 25-64 years.
4.3.2.3 Moral Norms
Females were more likely than males to feel a sense of moral obligation to install water saving appliances.
4.3.2.4 Perceived Community Norms
Gold Coast residents perceived that more people in their community install water saving devices than Sunshine Coast residents. Respondents aged 65 years and over perceived that fewer people in their community installed water saving devices than those aged between 25 and 54 years.
4.3.2.5 Self-Efficacy
Females had higher levels of self-efficacy than males in relation to installing water saving devices, specifically water-wise washing machines. Respondents aged 65 years and over reported lower levels of self-efficacy related to efficiency actions than respondents aged 54 years and under. Respondents from households in the lowest income category had less confidence about being able to save water through installing water saving devices than all other respondents.
4.3.2.6 Perceived Behavioural Control
Respondents with high school education or below reported higher perceptions of control in relation to installing water saving devices than respondents with postgraduate education.
4.3.2.6 Intentions to Engage in Efficiency Actions (for Respondents without Devices Already Installed)
Ipswich residents reported lower intentions to install water saving devices than Brisbane and Gold Coast residents, while Sunshine Coast residents reported lower intentions to install water saving devices than Brisbane residents. Females were more likely than males to report that they were likely to install devices. Respondents aged 65 years and over reported lower intentions to install water saving devices than respondents aged between 25 and 54 years. Specifically, they were more likely to install shower timers but less likely to install plumbed water tanks and water efficient dishwashers. Households in lower income categories had lower intentions to install water tanks and water efficient dishwashers than households in higher income categories. Respondents with high school education or below and TAFE/Trade qualifications reported lower intentions to install water saving devices than respondents with postgraduate education.
4.3.2.7 Past Efficiency Actions
Ipswich residents were less likely to have installed dual flush toilets or water efficient washing machines than residents in other regions. Gold Coast and Ipswich residents were more likely to have greywater systems than other regions. Sunshine Coast residents were less likely to have non-plumbed water tanks than other regions. Females were more likely than males to have installed low flow taps and fixtures, water-wise plants and shower timers. Respondents aged between 55 and 64 years were more likely to have installed water saving devices than all other age groups. Households in the top two income categories were less likely to have installed greywater systems in their homes. There was a linear relationship between household income and past installation of water-wise washing machines.

Water Demand Management Study: Baseline Survey of Household Water Use (Part A) Page 16
4.4. Expanded Theory of Planned Behaviour: Prediction of Water Saving Intentions
4.4.1. Overall Curtailment Intentions
In addition to the ETPB variables and demographic variables, recruitment method was entered as a control variable in the regression analysis. The final regression model based on the ETPB predicted 73% of the variance. The changes in R2 between each of the regression model steps is shown in Appendix H in Table H.1. Table 8 shows the standardised beta coefficients for the final regression model. Bivariate correlations between the model variables are shown in Appendix I. As indicated in Table 8, significant predictors of intentions to engage in curtailment water saving behaviours were:
specific past behaviours - householders with stronger overall intentions to engage in everyday water saving behaviours reported that they had engaged in more washing cars with minimal water and turning the tap off while brushing teeth in the past;
attitudes - more positive attitudes were associated with stronger intentions to engage in curtailment behaviour;
moral norms - a greater sense of moral obligation to save water was associated with stronger curtailment intentions;
self-efficacy - greater confidence to engage in curtailment behaviour was associated with stronger intentions; and
household culture - a greater sense of the household having a water saving culture was associated with higher curtailment intentions.
Table 8. Expanded TPB: Prediction of Overall Curtailment Intentions.
Variable Standardised
Coefficient (Beta) Sig.
Recruitment method -.01 .50
Education level -.01 .73
Age .01 .84
Household size: adults .04 .71
Household size: children .04 .10
Household income .034 .11
Gender .00 .98
Region: Brisbane -.01 .70
Region: Gold Coast -.05 .16
Region: Ipswich -.03 .24
Region: Sunshine Coast -.02 .59
Past behaviour: full dishwasher .05 .04
Past behaviour: washing cars .07 .01
Past behaviour: shorter showers .01 .65
Past behaviour: washing machine .01 .63
Past behaviour: water-wise garden .00 .87
Past behaviour: toilet half-flush -.01 .76
Past behaviour: leaking taps .00 .85
Past behaviour: kitchen -.02 .55
Past behaviour: greywater on garden .01 .73
Past behaviour: rain water on garden -.01 .56
Past behaviour: brushing teeth .06 .01
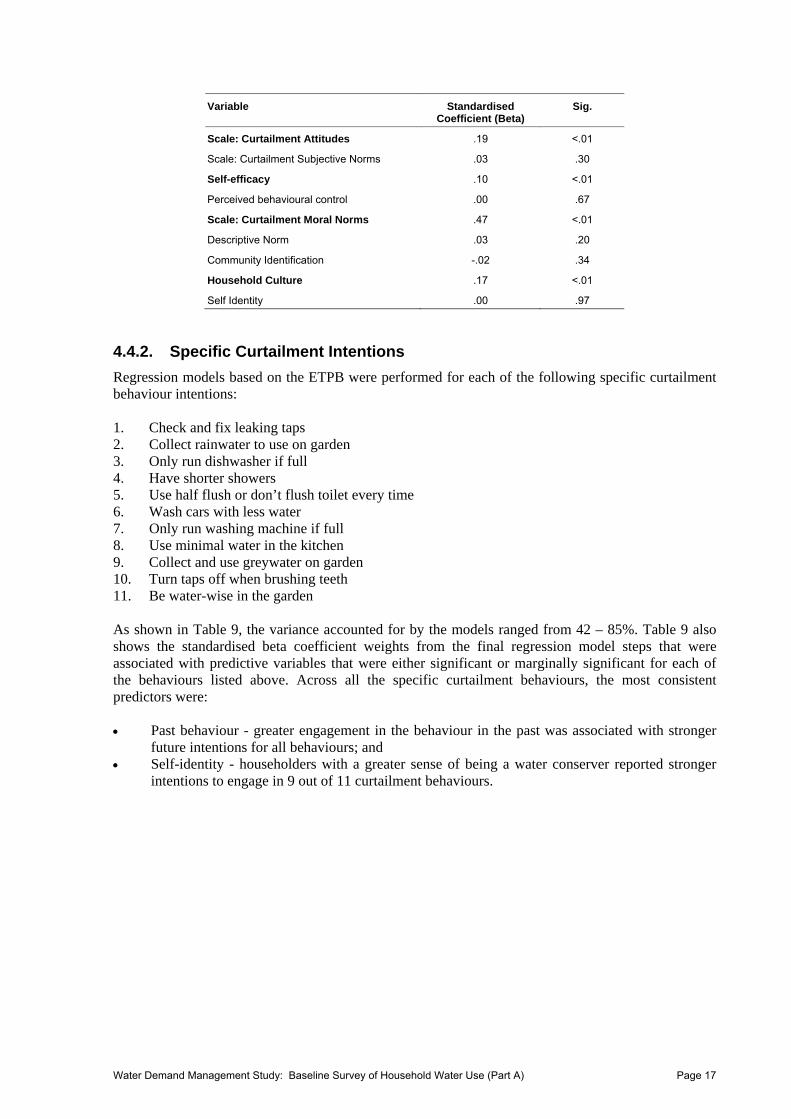
Water Demand Management Study: Baseline Survey of Household Water Use (Part A) Page 17
Variable Standardised Coefficient (Beta)
Sig.
Scale: Curtailment Attitudes .19 <.01
Scale: Curtailment Subjective Norms .03 .30
Self-efficacy .10 <.01
Perceived behavioural control .00 .67
Scale: Curtailment Moral Norms .47 <.01
Descriptive Norm .03 .20
Community Identification -.02 .34
Household Culture .17 <.01
Self Identity .00 .97
4.4.2. Specific Curtailment Intentions
Regression models based on the ETPB were performed for each of the following specific curtailment behaviour intentions: 1. Check and fix leaking taps 2. Collect rainwater to use on garden 3. Only run dishwasher if full 4. Have shorter showers 5. Use half flush or don’t flush toilet every time 6. Wash cars with less water 7. Only run washing machine if full 8. Use minimal water in the kitchen 9. Collect and use greywater on garden 10. Turn taps off when brushing teeth 11. Be water-wise in the garden As shown in Table 9, the variance accounted for by the models ranged from 42 – 85%. Table 9 also shows the standardised beta coefficient weights from the final regression model steps that were associated with predictive variables that were either significant or marginally significant for each of the behaviours listed above. Across all the specific curtailment behaviours, the most consistent predictors were: Past behaviour - greater engagement in the behaviour in the past was associated with stronger
future intentions for all behaviours; and Self-identity - householders with a greater sense of being a water conserver reported stronger
intentions to engage in 9 out of 11 curtailment behaviours.

Water Demand Management Study: Baseline Survey of Household Water Use (Part A) Page 18
Table 9. Expanded TPB: Prediction of Specific Curtailment Intentions.
Specific Curtailment Behaviour: Standardised Coefficients (Beta)
Variable 1 2 3 4 5 6 7 8 9 10 11
Adjusted R squared (%) .61 .85 .42 .76 .63 .59 .65 .62 .84 .74 .62 Recruitment method .04* .03+
Education level
Age .08** .04+ .04+ -.05** -.04+
Household size: adults
Household size: children
Household income -.04*
Gender .06* .03+ .04+
Region: Brisbane .09*
Region: Gold Coast .07+
Region: Ipswich .10**
Region: Sunshine Coast .08* -.08+
Past behaviour: full dishwasher - - .57** - - - - - - - -
Past behaviour: washing cars - - - - - .67** - - - - -
Past behaviour: shorter showers - - - .81** - - - - - - -
Past behaviour: washing machine - - - - - - .78** - - - -
Past behaviour: water-wise garden - - - - - - - - - - .69**
Past behaviour: toilet half-flush - - - - .75** - - - - - -
Past behaviour: leaking taps 0.68** - - - - - - - - - -
Past behaviour: kitchen - - - - - - - .73** - - -
Past behaviour: greywater on garden - - - - - - - - .89** - -
Past behaviour: rain water on garden - 0.90** - - - - - - - - -
Past behaviour: brushing teeth - - - - - - - - - .84** -
Scale: Curtailment Attitudes 0.05* 0.03+ .06+
Scale: Curtailment Subjective Norms -.03* .04+ -.03+
Scale: Curtailment Moral Norms
Descriptive Norm -.04* .05*
Self-efficacy .05** .03+ . .05*
Perceived Behavioural Control .03+
Community Identification 0.02+ .03*
Household Culture .04* .09**
Self Identity 0.10** 0.03+ .13** .04* .04+ .09** .05* .05** .07**
* p < .05, ** p < .01, + p < .1 (-) indicates variable not included in the model

Water Demand Management Study: Baseline Survey of Household Water Use (Part A) Page 19
4.4.3. Overall Efficiency Intentions
In addition to the ETPB variables and demographic variables, recruitment method was entered as a control variable in the regression analysis. The final regression model based on the ETPB predicted 36% of the variance. The changes in R2 between each of the regression model steps are shown in Appendix H in Table H.2. Table 10 shows the standardised beta coefficients for the final regression model. Bivariate correlations between the model variables are shown in Appendix I. As indicated in Table 10, significant predictors of general intentions to install water saving devices in the house and garden were region, Anglo-European culture, younger age, not having previously installed a water-wise washing machine, attitudes to efficiency behaviour, efficiency moral norms, efficiency descriptive norms, perceived behavioural control and community identification. The method of recruitment also influenced intentions (online participants had stronger intentions). To summarise, stronger intentions to install water efficient appliances in the next six months were associated with: younger age; residing in either Brisbane, Gold Coast or Ipswich; not having installed a water efficient washing machine; more positive attitudes to installing water efficient appliances; greater feelings of moral obligation to install efficient appliances; greater sense that others in the community had installed water efficient appliances; a greater sense that installing the appliances was within the householders’ control; and stronger identification with the SEQ community.
Table 10. Expanded TPB: Prediction of Overall Efficiency Intentions.
Variable Standardised
Coefficients (Beta) Sig.
(p = )
Recruitment method .10 <.01
Education level .00 .91
Gender -.01 .80
Age -.08 .01
Household size: adults .04 .08
Household size: children -.02 .55
Household income -.04 .11
Region: Brisbane -.10 .04
Region: Gold Coast -.14 .00
Region: Ipswich -.10 .02
Region: Sunshine Coast -.04 .38
Already installed: low flow taps -.04 .14
Already installed: Pool cover .00 .85
Already installed: trigger hose / timed sprinkler .02 .36
Already installed: water-wise plants .03 .19
Already installed: Dual flush toilet .01 .85
Already installed: Shower timer .03 .16
Already installed: Greywater system .01 .62
Already installed: Plumbed rainwater tank -.02 .30
Already installed: Non-plumbed rainwater tank -.01 .81
Already installed: Water-wise washing machine -.07 .01
Already installed: Water-wise dishwasher .00 .93
Scale: Efficiency Attitudes .16 <.01

Water Demand Management Study: Baseline Survey of Household Water Use (Part A) Page 20
Variable Standardised Coefficients (Beta)
Sig. (p = )
Scale: Efficiency Subjective Norms .04 .27
Self Efficacy .08 .00
Perceived Behavioural Control .04 .13
Scale: Efficiency Moral Norms .40 <.01
Descriptive Norm .07 <.01
Community Identification .07 .<.01
Household Culture -.01 .82
Self Identity -.05 .13
4.4.4. Specific Efficiency Intentions
Regression models based on the ETPB were performed for each of the following specific efficiency behaviour intentions: 1. Low-flow taps and / or shower heads on all fittings 2. Pool cover 3. Hose with trigger or a timed sprinkler 4. Water-wise plants and/or gardens 5. Dual-flush or composting toilet 6. Shower timer 7. Greywater system 8. A rainwater tank plumbed into the house 9. A rainwater tank not plumbed into the house 10. Water-wise washing machine 11. Water efficient dishwasher As shown in Table 11, the variance accounted for by the models ranged from 7–27%. Table 11 also shows the standardised coefficient weights associated with predictive variables that were either significant or marginally significant for each of the behaviours listed above. Consistent with the analysis of overall efficiency intentions, the control variable, recruitment method, was a significant predictor of 10 out of 11 specific efficiency intentions. Across all of the efficiency intentions, the most consistent predictors were: moral norms - householders with a greater sense of moral obligation had stronger intentions to
install 8 out of 11 water efficient appliances; self-identity - householders with a greater sense of being a water conserver had stronger
intentions to install 8 out of 11 water efficient appliances; and self-efficacy - householders with a greater confidence that they can save water through
installing efficiency items had stronger intentions to install 6 out of 11 water efficient appliances.

Water Demand Management Study: Baseline Survey of Household Water Use (Part A) Page 21
Table 11. Expanded TPB: Prediction of Specific Efficiency Intentions.
Specific Efficiency Behaviour: Standardised Coefficients (Beta)
Variable 1 2 3 4 5 6 7 8 9 10 11
Adjusted R squared .28 .07 .21 .15 .14 .15 .14 .13 .12 .14 .08 Recruitment method .09+ .13* .17** .12* .09* .12** .12** ,10* .10* .11+
Education level
Age -.11* -.13** -.09* -.20** -.13**
Household size: adults .15** .07* .08** .09+ .11*
Household size: children .11*
Household income -.17** -.09* -.11** -.15** -.15**
Gender .14**
Region: Brisbane
Region: Gold Coast -.31+ -.17* -.19+
Region: Ipswich
Region: Sunshine Coast -.13+
Scale: Efficiency Attitudes .17* .08+
Scale: Efficiency Subjective Norms
.20+
Scale: Efficiency Moral Norms .31** .25** .16* .17** .19** .11* .26** .15*
Efficiency Descriptive Norm .10* .05+ -.07+
Self-efficacy .11* .13* .08* .11** .14** .11*
Perceived Behavioural Control .10* .09*
Community Identification .12* .10** .08*
Household Culture .17* -.15+
Self Identity .15* .12+ .11+ .10* .16** .11** .11* .14+
* p < .05, ** p < .01, + p < .1

Water Demand Management Study: Baseline Survey of Household Water Use (Part A) Page 22
5. CONCLUSION
5.1. Summary and Implications Consistent with past research framed by the Theory of Planned Behaviour (Armitage and Conner, 2001; Conner and Armitage, 1998), the results of the Household Water Use Survey show that stronger overall intentions to engage in water conservation practices - both everyday actions and installation of efficient devices - were associated with more positive attitudes, a greater sense of personal obligation to engage in the actions, and a greater sense of self-efficacy (i.e., confidence that one can save water). Looking more closely at overall intentions to engage in water curtailment actions (i.e., everyday water saving practices), it was clear that a sense of personal moral obligation to conserve water around the home was the strongest determinant of intentions to engage in every day water saving practices. It was also evident that living in a household that had a culture of water conservation was an important determinant of respondents’ intentions to engage in everyday water saving practices. In light of previous research showing that the actions of others can facilitate or act as a barrier to water conservation (Fielding, Russell and Grace, 2010), it is not surprising that being part of a household which agrees about the importance of water conservation and which engages in water saving practices, is a motivator of intentions. In terms of overall water efficiency intentions (i.e., intentions to install water efficient appliances), feeling a sense of personal moral obligation to save water was again the strongest predictor of efficiency intentions. It was also evident that stronger overall efficiency intentions were associated with a greater sense that others in the community had installed efficiency devices (i.e., descriptive norms). Past research has also shown that descriptive norms can influence environmentally-related behaviour (e.g., Ciadini et al., 1990; Nolan, Schultz, Cialdini, Goldstein, and Griskevicius, 2008). Interestingly, householders who identified more with the SEQ community also had stronger efficiency intentions. Taken together, these findings suggest that water efficiency intentions are in part influenced by householders’ connection with the larger community and their observations of what others in the community are doing. Demographic factors also played a role in water efficiency intentions; younger householders who resided in Brisbane, Gold Coast or Ipswich were more willing to install water efficient devices. Greater willingness of householders in these regions to install efficient appliances may relate to environmental conditions; these regions were more impacted by the recent drought than the Sunshine Coast. The results clearly highlight the important influence of past behaviour on future intentions - both overall and specific intentions (cf. Conner and Armitage, 1998). Specific past behaviours were significant predictors of overall curtailment and efficiency intentions. Past behaviour was also the strongest predictor of future intentions to engage in specific water curtailment actions (e.g., checking and fixing leaking taps, taking shorter showers). The link between past behaviour and future intentions may reflect the role of habit; through repetition, actions become habitual and are performed automatically rather than being underpinned by reasoned processes. In the first qualitative phase of this research (Fielding et al., 2010), householders noted the role of habits in water conservation, highlighting that some water conservation actions had become habits and that changing habitual behaviour was a barrier to conserving water around the house. Past behaviour of installing water efficient appliances may reflect a general commitment to saving water through water efficient appliances. The analyses also identified the predictors of intentions to engage in specific water curtailment actions. Apart from past behaviour (which as argued above, may reflect habits), the only other consistent predictor was self-identity. This finding is consistent with identity theory (Stryker, 1968; 1980) and with past research demonstrating that self-identity is an important addition to the Theory of Planned Behaviour (e.g., Conner and Armitage, 1998; Fielding, McDonald and Louis, 2008). According to Identity theory, we act in accordance with our self-image - to do otherwise would create a sense of psychological discomfort and tension. Thus, a water conserver will feel most comfortable and affirmed when engaging in actions that are consistent with the water conserver identity.

Water Demand Management Study: Baseline Survey of Household Water Use (Part A) Page 23
In terms of predictors of intentions to install specific water efficient appliances, there were a number of consistent predictors. Moral norms and self-identity were important predictors, with householders who felt a stronger personal moral obligation to save water and who had a greater sense of being water conservers having stronger intentions to install most of the water efficient appliances. Great confidence (i.e. self-efficacy) to install efficient appliances was also a fairly consistent predictor. In addition to the focal analyses investigating the key predictors of water conservation intentions, we also explored whether there were regional and demographic differences across the water curtailment and efficiency attitudes and behaviours. The most consistent differences emerged for gender and age, with women reporting more positive water conserving attitudes and behaviours than men, and younger people (i.e. 15 to 24) reporting fewer positive water conserving attitudes and behaviours than older age groups. These findings are consistent with past research showing that women express more pro-environmental attitudes than men (Zelezny, Chua, and Aldrich, 2000) and young people are less pro-environmental than older age groups (Partridge, 2008). Some differences also emerged across regions, education levels, and income groups. For example, in relation to water curtailment actions, Sunshine Coast respondents perceived fewer of these actions in their community and reported that they engaged in fewer of these actions themselves compared to other regions. These responses may reflect reality in that the Sunshine Coast was less affected by drought and was not subject to the same water restrictions as other SEQ regions. Respondents in lower income categories and those with high school education reported engaging in more water curtailment actions than other respondents. Conversely, lower income respondents had less confidence in their ability to install water efficient devices and they had installed fewer water efficient appliances in their home than higher income households. The commitment to curtailment approaches to water conservation no doubt reflects the economic constraints experienced by lower income households; for them, behavioural approaches to saving water help to reduce water costs at no extra economic cost to the household. Taken together, these results suggest avenues for motivating householders’ willingness to engage in water conservation practices: Moral norms: Feeling a sense of personal moral obligation to conserve water is an important determinant of overall water curtailment and efficiency intentions and intentions to install specific water efficiency devices. Messages that highlight the link between individual actions and the collective outcome and those that emphasise the responsibility of all citizens to address the issue of water conservation may help to develop this sense of moral obligation. Self-efficacy: Householders need to feel confident that they can easily engage in water conserving practices. Providing procedural information or rebates and incentives (e.g. for installing water efficient appliances) may help to develop householders’ confidence and efficacy. Water saving habits: Actions that we engage in repetitively become habits. Therefore, promoting water conservation may, in part, be a matter of disrupting water wasting habits and replacing these with water saving habits. Providing prompts at the point of water use or developing implementation intentions (i.e. a written plan of when, where, and how to enact particular behaviours; e.g. Holland, Aarts, and Langendam, 2006) may help to do this. Developing technology that makes water conserving actions easier may also be a way to promote good water saving habits. Normative support for water conservation: Our findings suggest that creating a culture of water conservation, within the household and within the broader community, may promote willingness to engage in water conserving actions. Household water champions may help to do this within the household. Providing feedback about household water use and community water saving actions and levels of community water use may help to develop water saving norms within the household and the community.

Water Demand Management Study: Baseline Survey of Household Water Use (Part A) Page 24
Identity: Once people acquire an identity, for example, as a water conserver, they strive to engage in actions that are congruent with that identity. Public commitments such as stickers that proclaim: “I’m a water conserver” or public pledges to conserve water may help to develop this identity. It is worth noting that that some of these strategies (e.g. providing water use feedback, rebates, procedural information, etc.) have already been implemented in SEQ and may account, at least in part, for the dramatic decreases in household water use in recent years. In conclusion, the current report describes the key predictors of householders’ intentions to engage in everyday water saving actions and to install water efficient appliances and provides recommendations of ways that these factors may be influenced. Whether or not householders’ intentions are translated into action will be the focus of Part B of the report (forthcoming) in which we will detail the key predictors of householders’ objective household water use.
5.2. Methodological Strengths and Weaknesses A key strength of the research is that it is framed by a well-tested theoretical framework that has been developed and expanded to include key variables identified as important to water conservation. The research was also designed to overcome limitations of past research (see Russell and Fielding, 2010). In addition to self-report measures of water conservation, the study also collected objective measures of household water use (to be reported in the Part B report). It also collected responses from multiple household members (for a proportion of participating households), thereby facilitating an examination of how psycho-social similarities and differences amongst household members impacts on household water use. These analyses will be forthcoming in Part B of the report. To overcome the inherent biases of any one recruitment method, the study recruited participants through postal and online methods. It was interesting to note that recruitment method influenced intentions to install water efficient appliances. This is an interesting finding that highlights the importance of gaining greater diversity of respondents through multiple recruitment methods. As with all research, however, the current study has some limitations that must be acknowledged. There is the potential for biases in our sample with people who have a keen interest in the issue of water conservation more likely to have responded to the survey. We attempted to overcome this bias by recruiting some of our sample from an online survey panel. People who are part of the panel have signed up to take part in research generally and are paid a small amount for their participation. Therefore, it is less likely that they are focused on a specific research issue. In Part B of this report (forthcoming), we will report on actual household water use (obtained from water billing records) and this may help us to establish the extent to which households represent a range of water use within the community. Further limitations of the research are that our sample consists of owner-occupiers and survey length constraints meant that some information (e.g. assessing beliefs identified in Phase 1 of the project, and greater assessment of economic factors) could not be included in the survey. The decision to recruit owner-occupiers was a practical one; it is easier to obtain consent to access water billing data from owner-occupiers.

Water Demand Management Study: Baseline Survey of Household Water Use (Part A) Page 25
APPENDIX A - Post Codes of Study Regions
Local Government Area Postal Codes
Brisbane 4000 ‐ 4018, 4025 ‐ 4113, 4115, 4116, 4120 ‐ 4123, 4151 ‐ 4156, 4169 ‐ 4179
Sunshine Coast 4517 - 4519, 4550 - 4569, 4571, 4575
Gold Coast 4205 - 4287 Ipswich 4300 - 4305, 4340 but NOT 4306

Water Demand Management Study: Baseline Survey of Household Water Use (Part A) Page 26
APPENDIX B - Initial and Reminder Recruitment Postcards
Postcard Image (Initial and Reminder Postcard)
Initial Postcard
Reminder Postcard

Water Demand Management Study: Baseline Survey of Household Water Use (Part A) Page 27
APPENDIX C - Online Pre-Recruitment Survey
Survey on Household Water Use We are seeking your help in a study on household water use in South East Queensland. This study will provide better understanding of how people use water, and the information will help government and policy makers. Who should participate and why? We would like to invite home-owners in South East Queensland to participate in this study. By participating you can make an important contribution to the environment and the community, as water is vital to everyone. Will my responses be kept private? Your information will be completely confidential and will only be used for the purposes of this research project. The data will be released only as summaries in which no individual’s answers can be identified. What do I have to do if I choose to participate? We are collecting two types of information over a two year period: 1) Surveys: We will ask you and any other adult members of your household to complete the survey that asks a range
of questions about using water around your house and garden. 2) Recording water use: We need to track actual water use in your household. We can do this by accessing your
council water records (with your consent) for the year prior to the survey and for two years after the initial survey. Apart from providing consent by signing the forms that we will mail to you after you complete the survey, this part of the study will not impact on you in any way.
What do I get for my participation? If you choose to participate you will receive a $10 dollar gift voucher upon completion of the survey. We will mail this to your home address. Questions
1 Do you own your home? [ ] Yes Continue [ ] No screenout
2 What is your postcode?
[ ] if not in range, screenout 3 In which age-range do you fall?
a. 18-24 b. 25-34 c. 34-44 d. 45-54 e. 55+
4 How many adults (aged 18 years and over) normally live in your household?
a. One b. Two route to question 2b c. More than two route to question 2b
Other than you, are there persons in your household willing to complete a 20 minute survey on household water use?
Yes route to 3b No route to end
3b Please enter the name of other adults in your household [ ] 3c Please enter the email address of other adults in your household [ ]
End Thank you. We will contact you in the coming weeks with our survey on water household use.

Water Demand Management Study: Baseline Survey of Household Water Use (Part A) Page 28
APPENDIX D - Participant Information Sheet
INFORMATION SHEET
Systematic Social Analysis of Household Water Use We are seeking your help in a study of household water use in South East Queensland. This study will provide an in depth understanding of how people use water. This information will help government and water policy makers, who need to ensure that we, as a community, have enough water in the future. Who should participate and why? We need people from all walks of life to take part in this study. It is also important that we have households that range in their use of water – from those who are low water users to those who are high water users. Ideally we would like all adults in the household to take part. For example, in a household with two adults and two children we would like the two adults to complete a survey each. However, we would appreciate responses even from one adult in the household. It is also important that your house has an individual water meter. What do I have to do if I choose to participate? We are collecting two types of information over a two year period:
3) Surveys: We will ask you to complete the survey that asks a range of questions about using water around your house and garden.
4) Recording water use: We need to track actual water use in your household. We can do this by accessing your council water records (with your consent) for the year prior to the survey and for two years after the initial survey. Apart from providing consent by signing the forms that we will mail to you after you complete this survey, this part of the study will not impact on you in any way.
Are there any risks involved in taking part in the study? We do not anticipate any risks associated with this research, as we will simply be asking your opinions about water use in your home and measuring your actual water use. If you have any concerns about any aspects of the study, please contact Dr. Anneliese Spinks (see next page for contact details). What do I do if I decide I don’t want to be part of the study anymore? You are free to withdraw from the study at any time and you will not be penalised for doing so. If you decide to withdraw, you can ask for any or all of your data to be removed from the study. Simply contact Dr. Anneliese Spinks (see contact details below). Will my responses be kept private? Your information (survey responses and water meter readings) will be completely confidential and will only be used for the purposes of this research project. The data will be released only as summaries in which no individual’s answers can be identified. How can I find out more about the study? If you would like to receive a summary of the findings of the study once it is concluded, please tick the appropriate box on the consent form attached. In addition, you may contact us at any time during the study for more information. What is the best way to contact someone about the research? Please feel free to contact Dr Anneliese Spinks about any aspect of this project. Phone: 07 3214 2307; email: [email protected] ; postal address: CSIRO Sustainable Ecosystems, 306 Carmody Road, St Lucia, Qld, 4067.

Water Demand Management Study: Baseline Survey of Household Water Use (Part A) Page 29
This study has been cleared in accordance with the ethical review processes of the University of Queensland. If you have any questions concerning your participation in the study feel free to contact the researchers involved. If you would like to speak to an officer of the University not involved in the study, you may contact the University of Queensland Ethics Officer on 3365 3924. Yours sincerely, Dr Kelly Fielding Senior Research Fellow Institute for Social Science Research The University of Queensland Visiting Scientist , CSIRO Sustainable Ecosystems 306 Carmody Road St Lucia, Qld, 4067 Tel: 07 3214 2419 Email: [email protected] or [email protected] Dr Anneliese Spinks Project Scientist CSIRO Sustainable Ecosystems 306 Carmody Road St Lucia, Qld, 4067 Tel: 07 3214 2307 Email: [email protected] Dr Sally Russell Lecturer Griffith Business School Nathan Campus 170 Kessels Road Nathan, Qld, 4111 Tel: 07 3735 7577 Email: [email protected]
Dr Rodney Stewart Senior Lecturer School of Engineering Griffith University Gold Coast Campus Parklands Drive Southport, Qld, 4215 Tel: 07 5552 8778 Email: [email protected] Dr Aditi Mankad Project Scientist CSIRO Sustainable Ecosystems 306 Carmody Road St Lucia, Qld, 4067 Tel: 07 3214 2331 Email: [email protected]

Water Demand Management Study: Baseline Survey of Household Water Use (Part A) Page 30
APPENDIX E - Household Water Use Survey

Water Demand Management Study: Baseline Survey of Household Water Use (Part A) Page 31
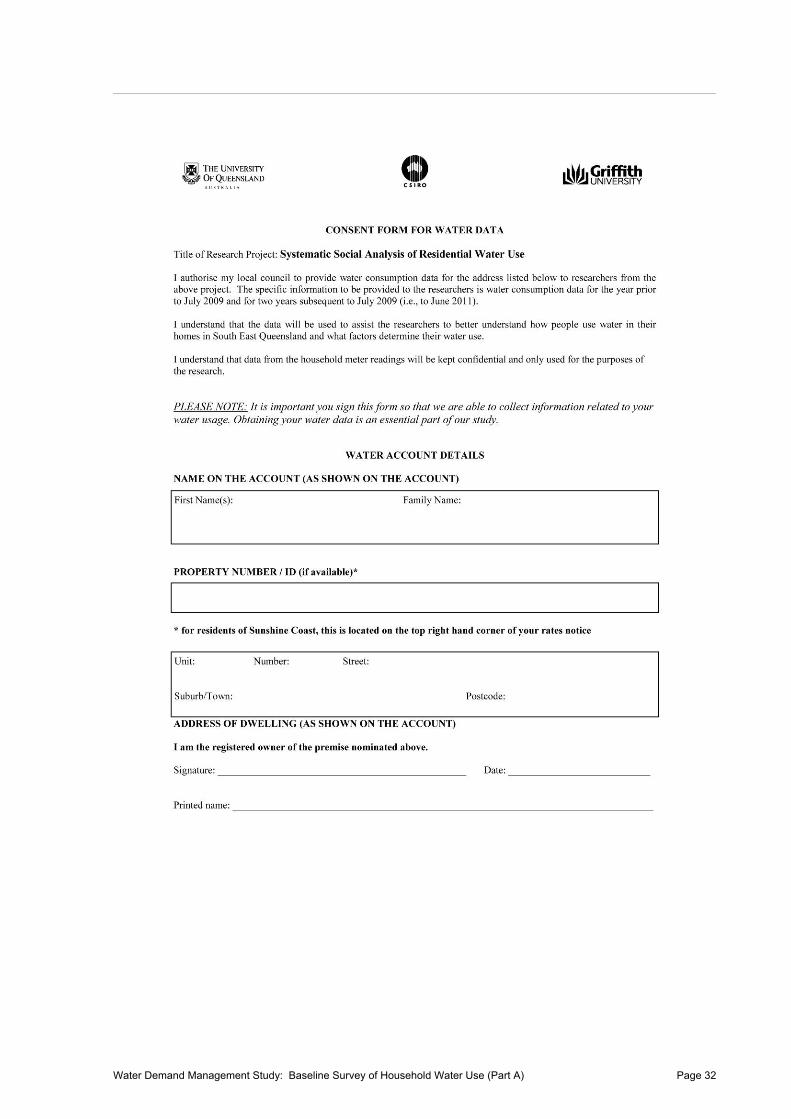
Water Demand Management Study: Baseline Survey of Household Water Use (Part A) Page 32

Water Demand Management Study: Baseline Survey of Household Water Use (Part A) Page 33

Water Demand Management Study: Baseline Survey of Household Water Use (Part A) Page 34

Water Demand Management Study: Baseline Survey of Household Water Use (Part A) Page 35

Water Demand Management Study: Baseline Survey of Household Water Use (Part A) Page 36

Water Demand Management Study: Baseline Survey of Household Water Use (Part A) Page 37

Water Demand Management Study: Baseline Survey of Household Water Use (Part A) Page 38

Water Demand Management Study: Baseline Survey of Household Water Use (Part A) Page 39

Water Demand Management Study: Baseline Survey of Household Water Use (Part A) Page 40

Water Demand Management Study: Baseline Survey of Household Water Use (Part A) Page 41

Water Demand Management Study: Baseline Survey of Household Water Use (Part A) Page 42

Water Demand Management Study: Baseline Survey of Household Water Use (Part A) Page 43

Water Demand Management Study: Baseline Survey of Household Water Use (Part A) Page 44

Water Demand Management Study: Baseline Survey of Household Water Use (Part A) Page 45

Water Demand Management Study: Baseline Survey of Household Water Use (Part A) Page 46

Water Demand Management Study: Baseline Survey of Household Water Use (Part A) Page 47

Water Demand Management Study: Baseline Survey of Household Water Use (Part A) Page 48

Water Demand Management Study: Baseline Survey of Household Water Use (Part A) Page 49
APPENDIX F - Consent Form for Release of Water Data
CONSENT FORM FOR WATER DATA
Title of Research Project: Systematic Social Analysis of Residential Water Use Please tick one of the options below: □ I / we authorise my local council to provide water consumption data for the address listed below to
researchers from the above project. The specific information to be provided to the researchers is water consumption data for the year prior to July 2009 and for two years subsequent to July 2009 (i.e., to June 2011).
I understand that the data will be used to assist the researchers to better understand how people use water in their homes in South East Queensland and what factors determine their water use.
I understand that data from the household meter readings will be kept confidential and only used for the purposes of the research.
□ I / we do not have an individual water meter connected to the residence.
(Please provide your contact details below for our records) □ I / we rely solely on tank / bore water.
(Please provide your contact details below for our records)
WATER ACCOUNT DETAILS (if applicable)
NAME ON THE ACCOUNT (AS SHOWN ON THE ACCOUNT) First name: Family Name: ACCOUNT NUMBER (IF AVAILABLE)* * for Sunshine Coast Residents this information is available in the top right hand corner of your rates bill
ADDRESS OF DWELLING (AS SHOWN ON THE ACCOUNT) Unit: Number: Street Suburb/Town: Postcode: I am /we are the registered owner/s of the premise nominated above Signature: _______________________________ Date: ____________________________ Printed name: ___________________________________________________________________ If you would like to be informed of the results please tick what information you would prefer:
Summary of findings Copy of final publications

Water Demand Management Study: Baseline Survey of Household Water Use (Part A) Page 50
APPENDIX G - Study Variables and Scale Construction
Table G.1 Items Assessing Curtailment Theory of Planned Behaviour Variables.
Variable Variable Format Variable Source
Directly measured variables (No. items)
Attitudes (4) 7 point Likert Scale Participant reported
Subjective Norms (3) 7 point Likert Scale Participant reported
Moral Norms (3) 7 point Likert Scale Participant reported
Descriptive Norm (1) 7 point Likert Scale Participant reported
Perceived Behavioural Control (PBC) (3) 7 point Likert Scale Participant reported
Past Behaviour (11) 5 point Likert Scale plus ‘NA’ option
Participant reported
Overall Intentions (3) 7 point Likert Scale Participant reported
Specific Intentions (11) 5 point Likert Scale plus ‘NA’ option
Participant reported
Constructed variables
Curtailment Attitudes Scale Constructed from Curtailment Attitude items
Curtailment Subjective Norms Scale Constructed from Curtailment Subjective Norm items
Curtailment Moral norms Scale Constructed from Curtailment Moral Norm items
Curtailment Overall Intentions Scale Constructed from Curtailment Overall Intention items
Table G.2 Items Assessing Efficiency Theory of Planned Behaviour Variables.
Variable Variable Format Variable Source
Directly measured variables (No. items)
Attitudes (4) 7 point Likert Scale Participant reported
Subjective Norms (3) 7 point Likert Scale Participant reported
Moral Norms (3) 7 point Likert Scale Participant reported
Descriptive Norm (1) 7 point Likert Scale Participant reported
Perceived Behavioural Control (PBC) (3) 7 point Likert Scale Participant reported
Past Behaviour (11) 5 point Likert Scale plus ‘NA’ and ‘Already Installed’ options
Participant reported
Overall Intentions (3) 7 point Likert Scale Participant reported
Specific Intentions (11) 5 point Likert Scale plus ‘NA’ and ‘Already Installed’ options
Participant reported
Constructed variables
Efficiency Attitudes Scale Constructed from Efficiency Attitude items
Efficiency Subjective Norms Scale Constructed from Efficiency Subjective Norm items
Efficiency Moral Norms Scale Constructed from Efficiency Moral Norm items
Past Behaviour Index Scale Constructed from Efficiency Past Behaviour items
Efficiency Overall Intentions Scale Constructed from Efficiency Overall Intention items
Table G.3 Expanded Theory of Planned Behaviour Variables.
Variable Variable Format Variable Source
Directly measured variables (No. items)
Community Identification (3) 7 point Likert Scale Participant reported
Self Identity (2) 7 point Likert Scale Participant reported
Household Identity (8) 7 point Likert Scale Participant reported
Constructed variables
Community Identification Scale Scale Constructed from Community Identification items
Self Identity Scale Scale Constructed from Self Identity items
Household Culture Scale Constructed from Household Identity items

Water Demand Management Study: Baseline Survey of Household Water Use (Part A) Page 51
Table G.4 Participant Demographic and Household Variables.
Variable Variable Format Variable Source
Directly measured variables
Year of birth DD/MM/YYYY Participant reported
Gender 1) male 2) female
Participant reported
Household income 1) < $30 000 2) $30 000-59 999 3) $60 000-89 999 4) $90 000-119 999 5) $120 000-149 999 6) > $150 000 7) prefer not to respond
Participant reported
Household occupants 1) adults 2) children
Participant reported
Education 1) primary school 2) high school 3) trade/TAFE 4) tertiary undergraduate 5) tertiary postgraduate
Participant reported
Cultural background 1) Aboriginal/Torres Strait Islander 2) Anglo-European 3) Asian/Sub-continental 4) Polynesian 5) Middle-Eastern 6) African 7) Other
Participant reported
Household water user type 1) High water user 2) Medium water user 3) Low water user 4) Don’t know
Participant reported
Constructed variables
Age Years Calculated from report of year of birth
Age Category 1) 15 – 24 years 2) 25 – 54 years 3) 54 – 64 years 4) 65 years and over
Calculated from report of year of birth
Household Size Total number of occupants Calculated from number of residents

Water Demand Management Study: Baseline Survey of Household Water Use (Part A) Page 52
Table G.5 Scale Construction for Expanded Theory of Planned Behaviour Variables.
Scale Name Included Questionnaire Item * Reliability
Curtailment Attitudes Question 1: Bad - Good
Question 1: Harmful - Beneficial
Question 1: Worthless - Valuable
Question 1: Unpleasant - Pleasant
Alpha .813
Variable computed
Curtailment subjective norms Question 3A
Question 3B
Question 3C
Alpha .632
Variable computed
Curtailment moral norms Question 3D
Question 3E
Question 3F
Alpha .859
scale computed
Curtailment general intentions Question 2
Question 4
Question 8
Alpha .882
Variable computed
Efficiency Attitudes Question 10: Bad - Good
Question 10: Harmful - Beneficial
Question 10: Worthless - Valuable
Question 10: Unpleasant - Pleasant
Alpha = .866
Scale computed
Efficiency subjective norms Question 12A
Question 12B
Question 12C
Alpha = .759
scale computed
Efficiency moral norms Question 12D
Question 12E
Question 12F
Alpha = .888
scale computed
Efficiency general intentions Question 11
Question 13
Question 15
Alpha = .890
scale computed
Community identification Question 18A
Question 18B
Question 18C
Alpha = .914
Scale computed
Self identity Question 23A
Question 23B
Correlation (r) = .789
Mean calculated
Household culture Question 24A
Question 24B
Question 24C
Question 24D
Question 24E
Question 24F
Question 24G
Question 24H
Alpha = .955
scale computed

Water Demand Management Study: Baseline Survey of Household Water Use (Part A) Page 53
APPENDIX H - Construction of Expanded TPB Regression Models
Table H.1 Linear Regression Model Construction to Predict Curtailment Intentions.
Predicted Variable Model Step
(Adjusted R2)
Variable Specific Variables
Overall curtailment intentions
Step 1
(0.011)
Step 2
(0.043)
Recruitment method
Household / Socio-demographic variables
Recruitment method
Region *
Age
Gender
Education level
Household income level
No. children in the household
No. adults in the household
Step 3
(0.361)
Past curtailment behaviour
11 specific curtailment behaviours (previous 6 months)
Step 4
(0.612)
Traditional TPB variables Curtailment attitudes
Subject norms
Perceived behavioural control
Step 5 (0.717)
Expanded TPB variables (Norms)
Moral norms
Descriptive norm
Step 6
(0.732)
Expanded TPB variables (Identity variables)
Community identity
Household Identity
Self Identity
Specific curtailment intentions (x 11)
Step 1
Step 2
Recruitment method
Household / Socio-demographic variables
Recruitment method
Region *
Age
Gender
Education level
Household income level
No. children in the household
No. adults in the household
Step 3 Past curtailment behaviour
Specific curtailment behaviour (previous 6 months)
Step 4
Traditional TPB variables Curtailment attitudes
Subject norms
Perceived behavioural control
Step 5 Expanded TPB variables (Norms)
Moral norms
Descriptive norm
Step 6
Expanded TPB variables (Identity variables)
Community identity
Household Identity
Self Identity * Categorical variables were dummy-coded into (k-1) variables to enter into regression model.

Water Demand Management Study: Baseline Survey of Household Water Use (Part A) Page 54
Table H.2 Linear Regression Model Construction to Predict Efficiency Intentions.
Predicted Variable Model Step
(Adjusted R2)
Variable Specific Variables
Overall efficiency intentions
Step 1
(0.017)
Step 2
(0.030)
Recruitment method
Household / Socio-demographic variables
Recruitment method
Region*
Age
Gender
Education level
Household income level
No. children in the household
No. adults in the household
Step 3
(0.058)
Past efficiency behaviour
11 water saving devices already installed
Step 4
(0.291)
Traditional TPB variables Curtailment attitudes
Subject norms
Perceived behavioural control
Step 5 (0.358)
Expanded TPB variables (Norms)
Moral norms
Descriptive norm
Step 6 (0.362)
Expanded TPB variables (Identity variables)
Community identity
Household Identity
Self Identity
Specific efficiency intentions (x 11)
Step 1
Step 2
Recruitment method
Household / Socio-demographic variables
Recruitment method
Region*
Age
Gender
Education level
Household income level
No. children in the household
No. adults in the household
Step 3
Traditional TPB variables Curtailment attitudes
Subject norms
Perceived behavioural control
Step 4 Expanded TPB variables (Norms)
Moral norms
Descriptive norm
Step 5
Expanded TPB variables (Identity variables)
Community identity
Household Identity
Self Identity
* Categorical variables were dummy-coded into (k-1) variables to enter into regression model.

Water Demand Management Study: Baseline Survey of Household Water Use (Part A) Page 55
APPENDIX I - Bivariate Correlations: Curtailment and Efficiency Variables Table I.1 Bivariate Correlations: Curtailment Variables.
Curtailment
Overall Intentions
Curtailment Attitudes
Curtailment Moral Norms
Curtailment Subjective
Norms
Curtailment Descriptive
Norm
Self Efficacy
Perceived Behavioural
Control
Household Culture
Community Identity
Self Identity
Gender Age
Curtailment Overall Intentions
Pearson Correlation 1 .648** .764** .489** .251** .449** -.228** .624** .264** .588** .149** .045
Sig. (2-tailed) .000 .000 .000 .000 .000 .000 .000 .000 .000 .000 .054
N 1894 1892 1888 1889 1872 1885 1881 1705 1889 1892 1881 1833
Curtailment Attitudes
Pearson Correlation .648** 1 .584** .379** .239** .339** -.188** .472** .248** .457** .157** .072**
Sig. (2-tailed) .000 .000 .000 .000 .000 .000 .000 .000 .000 .000 .002
N 1892 1892 1886 1887 1870 1883 1880 1703 1887 1890 1879 1831
Curtailment Moral Norms
Pearson Correlation .764** .584** 1 .576** .246** .384** -.186** .565** .298** .574** .145** .103**
Sig. (2-tailed) .000 .000 .000 .000 .000 .000 .000 .000 .000 .000 .000
N 1888 1886 1888 1886 1869 1881 1878 1703 1885 1888 1875 1828
Curtailment Subjective Norms
Pearson Correlation .489** .379** .576** 1 .236** .278** -.097** .451** .242** .354** .036 .107**
Sig. (2-tailed) .000 .000 .000 .000 .000 .000 .000 .000 .000 .115 .000
N 1889 1887 1886 1889 1869 1883 1879 1702 1885 1888 1876 1829
Curtailment Descriptive Norm
Pearson Correlation .251** .239** .246** .236** 1 .127** -.091** .207** .184** .230** .095** -.021
Sig. (2-tailed) .000 .000 .000 .000 .000 .000 .000 .000 .000 .000 .381
N 1872 1870 1869 1869 1872 1866 1864 1689 1869 1872 1859 1814
Self efficacy Pearson Correlation .449** .339** .384** .278** .127** 1 -.269** .300** .149** .335** .110** -.071**
Sig. (2-tailed) .000 .000 .000 .000 .000 .000 .000 .000 .000 .000 .003
N 1885 1883 1881 1883 1866 1885 1878 1698 1881 1884 1873 1827
Perceived Behavioural Control
Pearson Correlation -.228** -.188** -.186** -.097** -.091** -.269** 1 -.216** -.054* -.246** -.016 -.006
Sig. (2-tailed) .000 .000 .000 .000 .000 .000 .000 .019 .000 .486 .795
N 1881 1880 1878 1879 1864 1878 1881 1696 1878 1881 1868 1823
Household Culture
Pearson Correlation .624** .472** .565** .451** .207** .300** -.216** 1 .330** .573** .038 .124**
Sig. (2-tailed) .000 .000 .000 .000 .000 .000 .000 .000 .000 .114 .000
N 1705 1703 1703 1702 1689 1698 1696 1705 1702 1705 1693 1648
Community Identity
Pearson Correlation .264** .248** .298** .242** .184** .149** -.054* .330** 1 .276** .015 .086**
Sig. (2-tailed) .000 .000 .000 .000 .000 .000 .019 .000 .000 .513 .000
N 1889 1887 1885 1885 1869 1881 1878 1702 1889 1889 1876 1829
Self Identity Pearson Correlation .588** .457** .574** .354** .230** .335** -.246** .573** .276** 1 .135** .199**
Sig. (2-tailed) .000 .000 .000 .000 .000 .000 .000 .000 .000 .000 .000
N 1892 1890 1888 1888 1872 1884 1881 1705 1889 1892 1879 1832
Gender Pearson Correlation .149** .157** .145** .036 .095** .110** -.016 .038 .015 .135** 1 -.100**
Sig. (2-tailed) .000 .000 .000 .115 .000 .000 .486 .114 .513 .000 .000
N 1881 1879 1875 1876 1859 1873 1868 1693 1876 1879 1881 1832
Age Pearson Correlation .045 .072** .103** .107** -.021 -.071** -.006 .124** .086** .199** -.100** 1
Sig. (2-tailed) .054 .002 .000 .000 .381 .003 .795 .000 .000 .000 .000
N 1833 1831 1828 1829 1814 1827 1823 1648 1829 1832 1832 1833
**. Correlation is significant at the 0.01 level (2-tailed). *. Correlation is significant at the 0.05 level (2-tailed).

Water Demand Management Study: Baseline Survey of Household Water Use (Part A) Page 56
Table I.2 Bivariate Correlations: Efficiency Variables.
Efficiency
Overall Intentions
Efficiency Attitudes
Efficiency Moral Norms
Efficiency Subjective
Norms
Efficiency Descriptive
Norm
Self Efficacy
Perceived Behavioural
Control
Household Culture
Community Identity
Self Identity
Gender Age
Efficiency Overall Intentions
Pearson Correlation 1 .391** .413** .549** .219** .308** -.009 .304** .258** .238** .062** -.104**
Sig. (2-tailed) .000 .000 .000 .000 .000 .698 .000 .000 .000 .007 .000
N 1885 1883 1882 1879 1831 1880 1876 1698 1882 1885 1872 1825
Efficiency Attitudes
Pearson Correlation .391** 1 .380** .523** .221** .301** -.128** .517** .265** .461** .174** .046*
Sig. (2-tailed) .000 .000 .000 .000 .000 .000 .000 .000 .000 .000 .047
N 1883 1889 1885 1882 1833 1883 1878 1703 1886 1889 1876 1829
Efficiency Moral Norms
Pearson Correlation .413** .380** 1 .699** .232** .277** -.042 .394** .279** .312** .040 .021
Sig. (2-tailed) .000 .000 .000 .000 .000 .069 .000 .000 .000 .087 .377
N 1882 1885 1888 1885 1833 1884 1879 1702 1885 1888 1875 1829
Efficiency Subjective Norms
Pearson Correlation .549** .523** .699** 1 .248** .365** -.121** .494** .288** .421** .132** -.025
Sig. (2-tailed) .000 .000 .000 .000 .000 .000 .000 .000 .000 .000 .294
N 1879 1882 1885 1885 1833 1881 1878 1699 1882 1885 1872 1826
Efficiency Descriptive Norm
Pearson Correlation .219** .221** .232** .248** 1 .210** -.035 .243** .210** .210** .051* -.103**
Sig. (2-tailed) .000 .000 .000 .000 .000 .136 .000 .000 .000 .029 .000
N 1831 1833 1833 1833 1836 1832 1830 1656 1833 1836 1824 1778
Self efficacy Pearson Correlation .308** .301** .277** .365** .210** 1 -.185** .274** .153** .263** .092** -.148**
Sig. (2-tailed) .000 .000 .000 .000 .000 .000 .000 .000 .000 .000 .000
N 1880 1883 1884 1881 1832 1886 1880 1699 1884 1886 1873 1827
Perceived Behavioural Control
Pearson Correlation -.009 -.128** -.042 -.121** -.035 -.185** 1 -.211** -.020 -.222** -.044 -.024
Sig. (2-tailed) .698 .000 .069 .000 .136 .000 .000 .378 .000 .058 .310
N 1876 1878 1879 1878 1830 1880 1881 1694 1879 1881 1868 1822
Household Culture
Pearson Correlation .304** .517** .394** .494** .243** .274** -.211** 1 .330** .573** .038 .124**
Sig. (2-tailed) .000 .000 .000 .000 .000 .000 .000 .000 .000 .114 .000
N 1698 1703 1702 1699 1656 1699 1694 1705 1702 1705 1693 1648
Community Identity
Pearson Correlation .258** .265** .279** .288** .210** .153** -.020 .330** 1 .276** .015 .086**
Sig. (2-tailed) .000 .000 .000 .000 .000 .000 .378 .000 .000 .513 .000
N 1882 1886 1885 1882 1833 1884 1879 1702 1889 1889 1876 1829
Self Identity Pearson Correlation .238** .461** .312** .421** .210** .263** -.222** .573** .276** 1 .135** .199**
Sig. (2-tailed) .000 .000 .000 .000 .000 .000 .000 .000 .000 .000 .000
N 1885 1889 1888 1885 1836 1886 1881 1705 1889 1892 1879 1832
Gender Pearson Correlation .062** .174** .040 .132** .051* .092** -.044 .038 .015 .135** 1 -.100**
Sig. (2-tailed) .007 .000 .087 .000 .029 .000 .058 .114 .513 .000 .000
N 1872 1876 1875 1872 1824 1873 1868 1693 1876 1879 1881 1832
Age Pearson Correlation -.104** .046* .021 -.025 -.103** -.148** -.024 .124** .086** .199** -.100** 1
Sig. (2-tailed) .000 .047 .377 .294 .000 .000 .310 .000 .000 .000 .000
N 1825 1829 1829 1826 1778 1827 1822 1648 1829 1832 1832 1833
**. Correlation is significant at the 0.01 level (2-tailed). *. Correlation is significant at the 0.05 level (2-tailed).

Water Demand Management Study: Baseline Survey of Household Water Use (Part A) Page 57
APPENDIX J - Demographic Comparisons: Psycho-Social and Behavioural Self-Report Variables
J.1 Regional Comparisons: Psycho-Social and Behavioural Self-Report Variables
In terms of the Theory of Planned Behaviour questions relating to saving water through curtailment actions, there was only a significant difference across regions on the perceived community norms item (F(3, 1845) = 5.46, p<.001) (Table J.1). Follow up analyses showed that respondents on the Sunshine Coast perceived less water conservation in their community than respondents in Ipswich and the Gold Coast.
Table J.1 Theory of Planned Behaviour Curtailment Items across Regions.
Curtailment Variable Brisbane (Mean)
Gold Coast (Mean)
Ipswich (Mean)
Sunshine Coast (Mean)
Attitudes 6.21 6.29 6.22 6.31
Subjective norms 5.70 5.70 5.74 5.77
Moral Norms 6.09 6.10 6.04 6.09
Self-efficacy 6.03 6.01 5.96 5.97
Perceived control
General intentions 6.35 6.30 6.29 6.31
Perceived community norms 5.19 5.30 5.29 5.05**
** p< 0.01
Analyses of intentions to engage in specific curtailment actions showed that respondents in the different regions differed in the extent to which they intended to collect rainwater to use on their garden (F(3,1668) = 12.39, p<.001), wash cars with minimal water (F(3,1720) = 17.02, p<.001), collect and use greywater on their garden (F(3,1700) = 10.84, p<.001), and be water-wise in the garden (F(3,1739) = 11.75, p<.001). Sunshine coast respondents reported lower intentions to engage in these actions than respondents in the other regions (Table J.2). In addition, Gold Coast respondents reported lower intentions than Brisbane respondents to collect rainwater to use on their garden.
Table J.2 Curtailment Intentions across Regions.
Curtailment Intention Brisbane (Mean)
Gold Coast (Mean)
Ipswich (Mean)
Sunshine Coast (Mean)
Check and fix leaking taps 4.50 4.57 4.58 4.63
Collect rainwater for garden 4.07 3.80** 4.03 3.51**
Run dishwasher when full 4.65 4.70 4.58 4.65
Shorter showers 4.21 4.22 4.26 4.23
Use half flush 4.61 4.63 4.56 4.70
Wash cars with minimal water 4.68 4.52 4.67 4.33**
Run washing machine when full 4.52 4.56 4.49 4.48
Use minimal water in kitchen 4.39 4.42 4.43 4.38
Use greywater on garden 3.09 3.17 3.24 2.68**
Turn taps off when brushing teeth 4.57 4.58 4.53 4.52
Be water-wise in garden 4.47 4.45 4.43 4.19**
** p< 0.01

Water Demand Management Study: Baseline Survey of Household Water Use (Part A) Page 58
Not surprisingly, respondents across the regions also differed in how much they reported they had had engaged in water curtailment actions in the past (Table J.3) . Participants from different regions differed in how they had collected rainwater to use on their garden (F(3,1675) = 16.17, p<.001), washed cars with minimal water (F(3,1675) = 20.33, p<.001), collected and used greywater on their garden (F(3,1680) = 14.31, p<.001), and were water-wise in the garden (F(3,1705) = 12.60, p<.001) over the last six months. Although the pattern was not as clear cut for past behaviour as it was for intentions, in general, the Sunshine Coast respondents reported engaging in less of these actions than respondents in other regions. In addition, a significant difference emerged across regions in terms of how much they had checked and fixed leaking taps (F(3,1821) = 4.12, p= .006). Sunshine Coast respondents reported checking and fixing leaking taps more than Brisbane and Ipswich respondents. There were no other significant differences on the curtailment items.
Table J.3 Curtailment Past Behaviour across Regions.
Curtailment Past Behaviour Brisbane (Mean)
Gold Coast (Mean)
Ipswich (Mean)
Sunshine Coast(Mean)
Check and fix leaking taps 4.46 4.55 4.46 4.63**
Collect rainwater for garden 4.04 3.73 3.93 3.35**
Run dishwasher when full 4.62 4.60 4.44 4.59
Shorter showers 4.17 4.19 4.18 4.16
Use half flush 4.56 4.57 4.48 4.62
Wash cars with minimal water 4.65 4.45 4.51 4.20**
Run washing machine when full 4.45 4.56 4.48 4.49
Use minimal water in kitchen 4.35 4.40 4.44 4.38
Use greywater on garden 3.13 3.18 3.30 2.63**
Turn taps off when brushing teeth 4.57 4.58 4.52 4.49
Be water-wise in garden 4.46 4.41 4.33 4.13**
** p< 0.01
Consistent with the curtailment action analyses, respondents across the regions significantly differed in their perception of how much people in their community install water efficient devices in their home and garden (F(3, 1809) = 4.80, p = .002). Respondents on the Gold Coast had greater perceptions that their community installs water efficient devices than respondents on the Sunshine Coast (Table J.4).
Table J.4 Theory of Planned Behaviour Efficiency Items across Regions.
Efficiency Variable Brisbane (Mean)
Gold Coast (Mean)
Ipswich (Mean)
Sunshine Coast(Mean)
Attitudes 6.15 6.25 6.20 6.22
Subjective norms 4.98 4.91 4.95 4.97
Moral Norms 5.32 5.26 5.28 5.28
Self-efficacy 5.64 5.71 5.53 5.57
Perceived control
General intentions 4.67 4.60 4.56 4.65
Perceived community norms 4.83 4.98** 4.81 4.74**
** p< 0.01
For those respondents who had not already installed specific water efficient devices, there was a significant difference across regions in their intentions to install a water efficient dishwasher (F(3, 463) = 8.19, p<.001). Ipswich respondents reported lower intentions than Brisbane and Gold Coast respondents and Sunshine Coast respondent reported lower intentions than Brisbane respondents (Table J.5).

Water Demand Management Study: Baseline Survey of Household Water Use (Part A) Page 59
Table J.5 Intentions to Install Water Efficient Devices.
Efficiency Intention Brisbane (Mean)
Gold Coast (Mean)
Ipswich (Mean)
Sunshine Coast (Mean)
Low flow taps and showers 3.21 3.08 3.24 3.13
Pool cover 2.63 2.57 2.62 2.42
Trigger hose or time sprinkler 3.35 3.23 3.66 3.33
Water-wise garden 3.65 3.65 3.52 3.65
Dual flush toilet 3.20 2.63 3.18 3.14
Shower timer 2.83 2.60 2.70 2.56
Greywater system 2.55 2.44 2.50 2.30
Plumbed rainwater tank 2.45 2.42 2.48 2.39
Non-plumbed rainwater tank 2.41 2.57 2.67 2.67
Water-wise washing machine 3.11 3.00 2.91 2.90
Water efficient dishwasher 2.93 2.85 2.09** 2.45
** p< 0.01
When comparing those respondents who had already installed the water efficient devices with those who had not across regions, there was a significant difference in installation of dual flush toilets (2 = 13.70, p=.003), greywater systems (2 = 40.13, df = 3, p<.001), non-plumbed rainwater tanks (2 = 32.37, p<.001), and water efficient washing machines (2 = 32.04, df = 3, p<.001). Inspection of Table J.6 shows that Ipswich respondents were less likely to have installed dual flush toilets than other regions, Gold Coast and Ipswich respondents were more like to have greywater systems than other regions, Sunshine Coast respondents were less likely to have non-plumbed water tanks than other regions, and Ipswich respondents were least likely to have water efficient washing machines.
Table J.6 Percentage of Respondents across Regions who had Installed Water Efficient Devices.
Efficiency Installations Brisbane (Mean)
Gold Coast (Mean)
Ipswich (Mean)
Sunshine Coast (Mean)
Low flow taps and showers 71.7 73.7 64.8 68.0
Pool cover 12.1 9.0 11.4 8.8
Trigger hose or timed sprinkler 66.2 66.5 61.6 66.0
Water-wise garden 59.8 65.5 54.7 59.9
Dual flush toilet 82.9 85.4 77.5** 87.1
Shower timer 45.2 43.3 45.9 39.9
Greywater system 14.7** 27.1 26.4 15.4**
Plumbed rainwater tank 16.4 19.5 14.0 22.1
Non-plumbed rainwater tank 40.7 37.2 45.0 26.8**
Water-wise washing machine 48.2 45.8 29.6** 46.7
Water efficient dishwasher 60.6 65.9 62.5 62.5
Finally, there were no significant differences across regions in terms of how much respondents identify as a member of South East Queensland, how much they think of themselves as a water conserver, and their household culture in relation to water conservation (Fs<1) (Table J.7).
Table J.7 Comparison of Community Identification, Self-Identity, and Household Culture across Regions.
Variable Brisbane (Mean)
Gold Coast (Mean)
Ipswich (Mean)
Sunshine Coast (Mean)
Community identification 4.84 4.93 4.95 4.82
Water conserver self-identity 5.89 5.94 5.95 5.86
Household culture 5.82 5.83 5.87 5.80

Water Demand Management Study: Baseline Survey of Household Water Use (Part A) Page 60
J.2 Gender Comparisons: Psycho-Social and Behavioural Self-Report Variables
In terms of the Theory of Planned Behaviour questions relating to saving water through curtailment actions, there were a number of significant differences between males and females. Females were significantly more likely to: have positive attitudes to curtailment (F(1, 1967) = 52.86, p<.001); identify moral norms (F(1, 1963) = 45.18, p<.001) and community norms (F(1, 1945) = 15.7, p<.001) associated with water saving; have intentions to engage in water curtailment actions (F(1, 1969) = 25.21, p<.001); and have higher levels of perceived self-efficacy in terms of curtailment (F(1, 1960) = 26.13, p<.001) (Table J.8).
Table J.8 Theory of Planned Behaviour Curtailment Items for Each Gender.
Curtailment Variables Male
(Mean) Female (Mean)
Attitudes 6.12 6.34**
Subjective Norms 5.66 5.75*
Moral Norms 5.90 6.19**
General Intentions 6.17 6.40**
Perceived community norms 5.10 5.28**
Self-efficacy 5.85 6.09**
Perceived control 2.37 2.33
** p< .01 *p<.05
Further analyses suggest male and female respondents significantly differed in their intentions to engage in most of the specific curtailment actions listed (table 3.3.9). For instance, females were significantly more likely to intend to: only run the dishwasher if it is full (F(1, 1289) = 23.91, p<.001); wash cars with less water (F(1, 1809) = 22.78, p<.001); only run the washing machine if it is full (F(1, 1920) = 25.81, p<.001); use minimal water in the kitchen (F(1, 1946) = 16.10, p<.001); collect and use greywater on the garden (F(1, 1791) = 15.6559, p<.001); turn off taps when brushing teeth (F(1, 1952) = 42.65, p<.001); and be water-wise in the gardens (F(1, 1832) = 32.68, p<.001). There were no significant differences observed for the remaining curtailment intentions.
Table J.9 Curtailment Intentions for Each Gender.
Curtailment Intention Male
(Mean) Female (Mean)
Check and fix leaking taps 4.51 4.56
Collect rainwater for garden 3.75 3.93*
Run dishwasher when full 4.54 4.73**
Shorter showers 4.18 4.26
Use half flush 4.60 4.63
Wash cars with minimal water 4.43 4.62**
Run washing machine when full 4.41 4.58**
Use minimal water in kitchen 4.32 4.46**
Use greywater on garden 2.88 3.17**
Turn taps off when brushing teeth 4.41 4.65**
Be water-wise in garden 4.26 4.48**
** p< .01 *p<.05
Male and female respondents also significantly differed in how much they reported undertaking curtailment behaviours in the last 6 months. Females were significantly more likely to report that they: only run the dishwasher if it is full (F(1, 1276) = 15.07, p<.001); collect rainwater for the garden (F(1, 1767) = 22.68, p<.001); check and fix leaking taps (F(1, 1289) = 23.91, p<.001); only run the washing machine if it is full (F(1, 1915) = 21.56, p<.001); are water-wise in the garden (F(1, 1793) = 18.21,

Water Demand Management Study: Baseline Survey of Household Water Use (Part A) Page 61
p<.001); collect and use greywater on the garden (F(1, 1769) = 13.10, p<.001); and turn off the taps when brushing teeth (F(1, 1953) = 39.21, p<.001). There were no significant differences observed for the remaining curtailment behaviours.
Table J.10 Curtailment Past Behaviour in the Last Six Months for Each Gender.
Curtailment Past-Behaviour Male
(Mean) Female (Mean)
Check and fix leaking taps 4.48 4.64**
Collect rainwater for garden 4.33 4.54**
Run dishwasher when full 4.13 4.20**
Shorter showers 4.40 4.56
Use half flush 4.23 4.41
Wash cars with minimal water 4.55 4.57
Run washing machine when full 4.49 4.53
Use minimal water in kitchen 4.33 4.42
Use greywater on garden 2.90 3.17**
Turn taps off when brushing teeth 3.73 3.80**
Be water-wise in garden 4.41 4.64**
** p< .01 *p<.05
Male and female respondents also significantly differed in their perceptions of water efficiency actions. Females were significantly more likely than males to: have more positive attitudes to installing water efficiency appliances (F(1, 1964) = 65.95, p<.001); identify efficiency moral norms (F(1, 1276) = 15.07, p<.001); indicate that they intended to install water efficient appliances (F(1, 1957) = 9.68, p<.005); and have higher levels of self-efficacy in terms of saving water through water efficiency devices (F(1, 1960) = 20.79, p<.001).
Table J.11 Theory of Planned Behaviour Efficiency Items for Each Gender.
Efficiency Variables Male
(Mean) Female (Mean)
Attitudes 6.04 6.31**
Subjective Norms 4.88 4.99
Moral Norms 5.06 5.44**
General Intentions 4.52 4.72**
Community norms 4.78 4.90
Self-efficacy 5.46 5.72**
Control 2.78 2.68
** p< .01
For those respondents who had not already installed specific water efficient devices, females were significantly more likely than males to indicate that they intended to install a water-wise washing machine (F (1, 667) = 10.49, p<.01).

Water Demand Management Study: Baseline Survey of Household Water Use (Part A) Page 62
Table J.12 Intentions to Install Water Efficient Devices for Each Gender.
Efficiency Intention Male
(Mean) Female (Mean)
Low flow taps and showers 3.09 3.25
Pool cover 2.57 2.51
Trigger hose or time sprinkler 3.31 3.41
Water-wise garden 3.56 3.68
Dual flush toilet 3.10 3.02
Shower timer 2.62 2.77
Greywater system 2.46 2.48
Plumbed rainwater tank 2.44 2.45
Non-plumbed rainwater tank 2.51 2.62
Water-wise washing machine 2.84 3.15**
Water efficient dishwasher 2.64 2.72
** p< .01
Those respondents who had already installed the water efficient devices were compared with those who had not for each gender. Females were significantly more likely than males to report having installed low flow taps and fixtures (2 = 13.76, df = 1, p<.001); water-wise plants (2 (1, N=1971)= 18.95, p<.001) and shower timers (2 = 20.11, df = 1, p<.001). Inspection of Table J.13 shows higher proportions of females had installed every water efficient device compared to men.
Table J.13 Percentage of Males and Females who had Installed Water Efficient Devices.
Efficiency Installations Male
(Mean) Female (Mean)
Low flow taps and showers 65.2 73.0
Pool cover 9.9 10.5
Trigger hose or time sprinkler 62.8 66.2
Water-wise garden 55.0 64.6
Dual flush toilet 81.2 84.6
Shower timer 37.2 47.3
Greywater system 17.6 22.4
Plumbed rainwater tank 17.0 19.3
Non-plumbed rainwater tank 35.2 37.9
Water-wise washing machine 43.2 44.8
Water efficient dishwasher 60.3 64.6
Finally, females were significantly more likely than males to think of themselves as a water conserver (F (1, 1967) = 37.13, p<.01). No differences were observed, however, in terms of how much respondents identify as a member of South East Queensland, and their household culture in relation to water conservation (Fs<1).
Table J.14 Comparison of Community Identification, Self-Identity, and Household Culture for Each Gender.
Variable Male
(Mean) Female (Mean)
Community identification 4.83 4.88
Water conserver self-identity 5.74 5.99**
Household Culture 5.76 5.85
** p< .01

Water Demand Management Study: Baseline Survey of Household Water Use (Part A) Page 63
J.3 Age Comparisons: Psycho-Social and Behavioural Self-Report Variables
There were a number of significant differences observed between the different age categories in terms of the Theory of Planned Behaviour questions relating to saving water through curtailment actions. These include: curtailment attitudes (F(3, 1914) = 5.05, p<.005); subjective norms (F(3, 1912) = 9.09, p<.001); moral norms (F(3, 1911) = 8.88, p<.001); curtailment intentions (F(3, 1916) = 5.68, p<.005); self-efficacy associated with water saving (F(3, 1909) = 5.12, p<.005); and perceived control (F(3, 1905) = 6.92, p<.001). Further analyses indicate that respondents aged 15 to 24 years were significantly less likely to: demonstrate positive curtailment attitudes than those aged over 55 years; identify curtailment subjective norms and moral norms than all other ages; have curtailment intentions than all age groups; and have curtailment control beliefs than all other age categories. Those aged 25 to 54 years were significantly more likely to report self-efficacy in terms of water saving than those aged 65 and over. Table J.15 Theory of Planned Behaviour Curtailment Items for Each Age Category.
15-24 years
(Mean) 25-54 years
(Mean) 55-64 years
(Mean) 65 years +
(Mean)
Attitudes 5.91** 6.21 6.28 6.29
Subjective Norms 5.13** 5.65 5.77 5.79
Moral Norms 5.50** 5.99 6.14 6.15
General Intentions 5.87** 6.28 6.36 6.30
Community norms 4.97 5.22 5.26 5.11
Self-efficacy 5.74 6.05** 6.01 5.83
Control 3.33** 2.27 2.36 2.37
** p< .01 *p<.05
Analyses also suggest that respondents in different age categories significantly differed in their intentions to engage in a number of specific curtailment actions (see table 3.3.16). These include: checking and fixing taps (F(3, 1866) = 53.51, p<.001); having shorter showers (F(3, 1894) = 56.81, p<.001); using half flush on the toilet (F(3, 1883) = 18.36, p<.001); washing cars with minimal water (F(3, 1765) = 8.98, p<.001); only running the washing machine when full (F(3, 1871) = 9.71, p<.001); using minimal water in the kitchen (F(3, 1894) = 21.7, p<.001); using greywater on the garden (F(3, 1744) = 6.76, p<.001); and turning off taps when brushing teeth. (F(3, 1900) = 4.24, p<.001). There were no significant differences observed for the remaining curtailment intentions.
Post-hoc analyses indicated that those aged 15 to 24 were significantly less likely to intend to: check and fix leaking taps and run the washing machine when full than all other age categories. They were also less likely than those 55 years and over to intend to have shorter showers, use half flush on the toilet, wash cars with minimal water and use minimal water in the kitchen. Those aged 25 to 54 years were significantly less likely to intend to: check and fix leaking taps than those over 55 years; and use greywater on the gardens compared to those aged 55 to 64 years. Table J.16 Curtailment Intentions for Each Age Category.
15-24 years
(Mean) 25-54 years
(Mean) 55-64 years
(Mean) 65 years +
(Mean)
Check and fix leaking taps 3.53** 4.39 4.70 4.77
Collect rainwater for garden 3.47 3.76 3.97 3.92
Run dishwasher when full 4.42 4.64 4.69 4.63
Shorter showers 3.51** 4.00 4.42 4.54
Use half flush 4.23** 4.51 4.73 4.74
Wash cars with minimal water 4.09** 4.47 4.64 4.62
Run washing machine when full 3.89** 4.51 4.56 4.52
Use minimal water in kitchen 3.95** 4.28 4.51 4.56
Use greywater on garden 2.89 2.89 3.27 3.12
Turn taps off when brushing teeth 4.72 4.60 4.54 4.45
Be water-wise in garden 4.08 4.41 4.43 4.33
** p< .01

Water Demand Management Study: Baseline Survey of Household Water Use (Part A) Page 64
Respondents in different age categories also significantly differed in how much they reported undertaking curtailment behaviours in the last 6 months. These differences include: collecting rainwater for the garden (F(3, 1726) = 5.00, p<.001); running the dishwasher when it is full (F(3, 1896) = 56.19, p<.001); having shorter showers (F(3, 1865) = 5.51, p<.001); use half flush on the toilet (F(3, 1744) = 4.18, p<.001); wash cars with minimal water (F(3, 1889) = 16.41, p<.001); run washing machine when full (F(3, 1868) = 54.70, p<.001); use minimal water in the kitchen (F(3, 1894) = 27.82, p<.001); and using greywater on the garden (F(3, 1722) = 7.40, p<.001). Posthoc analyses indicated that those aged 15 to 24 years were significantly less likely to wash cars with minimal water and only run the washing machine when full than all other age categories. They were also less likely than those aged 55 years and over to run the dishwasher when full, have shorter showers and use minimal water in the kitchen. In addition, those aged 15 to 24 years were less likely that those aged 55 to 64 years to collect rainwater for the garden. Those aged 25 to 54 years were significantly less likely than those aged 55 years and over to wash cars with minimal water, run the washing machine when full and use minimal water in the kitchen. They were also less likely to use greywater on the garden than those aged between 55 to 64 years.
Table J.17 Curtailment Past Behaviour in the Last Six Months for Each Age Category.
15-24 years
(Mean) 25-54 years
(Mean) 55-64 years
(Mean) 65 years +
(Mean)
Check and fix leaking taps 4.22 4.57 4.63 4.54
Collect rainwater for garden 4.06** 4.41 4.56 4.42
Run dishwasher when full 3.50** 3.94 4.38 4.50
Shorter showers 4.10** 4.47 4.56 4.49
Use half flush 3.92 4.33 4.41 4.29
Wash cars with minimal water 4.08** 4.48** 4.67 4.67
Run washing machine when full 3.44** 4.34** 4.66 4.78
Use minimal water in kitchen 3.87** 4.24** 4.51 4.56
Use greywater on garden 2.84 2.89** 3.29 3.14
Turn taps off when brushing teeth 3.42 3.67 3.92 3.83
Be water-wise in garden 4.67 4.57 4.53 4.49
** p< .01
Respondents in different age categories also significantly differed in their perceptions of behaviour efficiency. These differences include: attitudes towards behaviour efficiency (F(3, 1912) = 4.941, p<.005); identified subjective norms (F(3, 1911) = 5.12, p<.005), moral norms (F(3, 1964) = 4.97, p<.005) and community norms (F(3, 1857) = 8.32, p<.001); general intentions (F(3, 1905) = 8.96, p<.001); and self-efficacy (F(3, 1909) = 16.83, p<.001). Further analyses indicated that those respondents aged 15 to 24 years demonstrated significantly less: positive attitudes about behaviour efficiency than all other age categories; subjective norms associated with behaviour efficiency than those aged between 25 and 64 years. Those aged 65 years and over demonstrated significantly fewer: intentions regarding behaviour efficiency and perceived community norms than those aged between 25 and 54; as well as self-efficacy associated with behaviour efficiency than those aged 54 years and under. Table J.18 Theory of Planned Behaviour Efficiency Items for Each Age Category.
15-24 years
(Mean) 25-54 years
(Mean) 55-64 years
(Mean) 65 years +
(Mean)
Attitudes 5.74** 6.18 6.22 6.21
Subjective Norms 4.26** 4.96 5.00 4.87
Moral Norms 4.75 5.33 5.34 5.12
General Intentions 4.59 4.78 4.63 4.35**
Community norms 4.68 4.94 4.84 4.65**
Self-efficacy 5.56 5.74 5.68 5.24**
Control 3.49 2.70 2.72 2.70

Water Demand Management Study: Baseline Survey of Household Water Use (Part A) Page 65
For those respondents who had not already installed specific water efficient devices, there were significant differences between the age categories in terms of their stated intentions to install the following: Shower timers (F (3, 992) = 6.18, p<.001); plumbed water tanks (F (3, 1378) = 15.89, p<.001); Non-plumbed water tanks (F (3, 915) = 7.43, p<.001); and water efficient dishwashers (F (3, 485) = 7.94, p<.001). Further analyses suggest that those aged 65 years and over were significantly more likely to intend to install shower times than those aged 54 years and younger; however they were significantly less likely to install: a plumbed water tank and water efficient dishwashers compared to all other age categories; and a non-plumbed water tank compared to those aged 54 and younger (Table J.19). Table J.19 Intentions to Install Water Efficient Devices for Each Age Category.
15-24 years
(Mean) 25-54 years
(Mean) 55-64 years
(Mean) 65 years +
(Mean)
Low flow taps and showers 3.48 3.19 3.16 3.00
Pool cover 3.25 2.57 2.44 2.53
Trigger hose or time sprinkler 3.44 3.39 3.44 3.24
Water-wise garden 3.68 3.66 3.66 3.54
Dual flush toilet 3.68 3.66 3.66 3.54
Shower timer 3.32 2.80 2.64 2.43**
Greywater system 2.61 2.52 2.48 2.31
Plumbed rainwater tank 3.10 2.57 2.46 2.01**
Non-plumbed rainwater tank 3.21 2.69 2.58 2.21**
Water-wise washing machine 3.05 3.10 3.06 2.81
Water efficient dishwasher 3.56 2.78 2.78 2.16**
** p< 0.01
Those respondents who had already installed the water efficient devices were compared with those who had not for each age category. The pattern of responses was significantly different for installation of the following: low flow taps and showers (2 = 20.79, df = 3, p<.001); trigger hoses or sprinklers (2 = 12.46, df = 3, p<.01); water-wise gardens (2 = 15.18, df = 3, p<.005); dual flush toilets (2 = 12.46, df = 3, p<.01); greywater systems (2 = 16.15, df = 3, p<.005); and water efficient dishwashers (2 = 15.38, df = 3, p<.005). Inspection of Table 3.3.20 shows higher proportions of respondents aged between 55 and 64 years had installed water efficient devices than the other age categories. Table J.20 Percentage of Age Categories who had Installed Water Efficient Devices.
15-24 years
(%) 25-54 years
(%) 55-64 years
(%) 65 years +
(%)
Low flow taps and showers 41.0 67.8 73.8 70.9
Pool cover 10.3 11.4 11.5 6.2
Trigger hose or time sprinkler 43.6 64.4 68.6 61.9
Water-wise garden 41.0 61.2 65.0 55.5
Dual flush toilet 61.5 84.7 84.8 80.4
Shower timer 25.6 42.4 43.2 43.8
Greywater system 12.8 18.3 26.4 18.3
Plumbed rainwater tank 15.4 18.7 18.0 18.5
Non-plumbed rainwater tank 30.8 35.6 39.1 36.3
Water-wise washing machine 33.3 46.9 45.7 38.3
Water efficient dishwasher 43.6 66.0 62.5 57.7
Finally, respondents in age categories significantly differed in terms of whether they: viewed themselves as a water conserver (F (3, 1915) = 22.70, p<.001); identified themselves as a member of South East Queensland community (F (3, 1912) = 4.60, p<.005); and felt their household culture involved water conservation (F (3, 1720) = 11.17, p<.001) (Table J.21).

Water Demand Management Study: Baseline Survey of Household Water Use (Part A) Page 66
Table J.21 Comparison of Community Identification, Self-Identity, and Household Culture for Each Age Category.
15-24 years
(Mean) 25-54 years
(Mean) 55-64 years
(Mean) 65 years +
(Mean)
Community identification 4.51 4.77 4.92 5.03
Water conserver self-identity 5.21 5.76 6.00 6.06
Household Culture 5.25 5.73 5.88 5.94
J.4 Income Level Comparisons: Psycho-Social and Behavioural Self-Report
Variables To assess whether income level impacted on responses, the original variable was reduced to five levels: (1) <$30,000, (2) $30,000 to 59,999, (3) $60,000 to 89,999, (4) $90,000 to 119,999, (5) $120,000 and above. A series of one-way analysis of variance (ANOVA) was used to analyse the continuous dependent variables with Tukey’s posthoc tests conducted to test the difference between means. Chi-square test for independence was used to analyse the categorical level variables (e.g., whether households had installed a water efficient device or not). Note that the focus of the comparisons is differences across the water conservation-related questions. The mean responses on the theory of planned behaviour questions are shown in Table J.22 below. The only difference to emerge between income levels on the questions about curtailment actions was on moral norms (F(4,1652) = 3.46, p = .008). The posthoc tests did not reveal a clear pattern: there was a tendency for those in the second bottom income category to have a stronger sense of moral obligation to save water through curtailment actions than those in the middle income category (p = .052). There were no other significant differences across income levels (Fs<2.04, ps>.08). Table J.22 Mean Responses to Theory of Planned Behaviour Curtailment Items by
Household Income Level.
Variable <$30,000 (Mean)
$30,000 – 59,999(Mean)
$60,000 – 89,999(Mean)
$90,000 – 119,999 (Mean)
$120,000 + (Mean)
Attitudes 6.31 6.29 6.25 6.22 6.17
Subjective norms 5.71 5.73 5.70 5.71 5.78
Moral Norms 6.16 6.17 6.00 6.00 5.99
Self-efficacy 5.87 6.06 6.00 5.99 6.09
Perceived control 2.38 2.29 2.34 2.45 2.23
General intentions 6.32 6.36 6.28 6.29 6.27
Perceived community norms 5.10 5.21 5.23 5.18 5.25
In terms of intentions to engage in the curtailment actions, significant differences emerged between income categories on checking and fixing leaking taps (F(4,1618) = 11.62, p<.001), having shorter showers (F(4,1637) = 17.89, p<.001), using half flush or not flushing every time (F(4,1628) = 6.45, p<.001), washing cars with less water (F(4,1533) = 3.32, p=.01), using minimal water in the kitchen (F(4,1637) = 14.52, p<.001), and collecting and using greywater on the garden (F(4,1510) = 7.63, p<.001) (Table J.23). No other significant differences emerged (Fs<2.48, ps>.04). Posthoc tests to investigate these differences reveal a fairly clear pattern: people in the lower income categories had stronger intentions to engage in these curtailment actions than people in the higher income categories. More specifically, households in the lowest income category had stronger intentions to check and fix leaking taps and wash cars with minimal water than households in the top income category. Households in the bottom two income categories had stronger intentions to take shorter showers and use minimal water in the kitchen than households in all other income categories. Finally, households in the bottom two income categories had stronger intentions to use half flush or flush less and collect and use greywater on the garden than households in the top two income categories (all ps<.05).

Water Demand Management Study: Baseline Survey of Household Water Use (Part A) Page 67
Table J.23 Curtailment Intentions by Income Levels.
Variable <$30,000(Mean)
$30,000 – 59,999(Mean)
$60,000 – 89,999(Mean)
$90,000 – 119,999 (Mean)
$120,000 + (Mean)
Check and fix leaking taps 4.78 4.57 4.47 4.44 4.38
Collect rainwater for garden 3.96 3.94 3.69 3.85 3.74
Run dishwasher when full 4.60 4.73 4.63 4.61 4.58
Shorter showers 4.45 4.35 4.12 3.97 3.99
Use half flush 4.72 4.68 4.59 4.52 4.46
Wash cars with minimal water 4.63 4.59 4.48 4.49 4.41
Run washing machine when full 4.58 4.50 4.54 4.48 4.39
Use minimal water in kitchen 4.56 4.50 4.32 4.19 4.18
Use greywater on garden 3.24 3.22 2.98 2.68 2.81
Turn taps off when brushing teeth
4.53 4.55 4.58 4.58 4.55
Be water-wise in garden 4.43 4.44 4.39 4.29 4.36
Analyses of the questions assessing how much households had engaged in the curtailment actions over the past six months revealed a similar pattern with differences emerging between income categories on checking and fixing leaking taps (F(4,1617) = 13.83, p<.001), having shorter showers (F(4,1641) = 19.31, p<.001), using half flush or not flushing every time (F(4,1635) = 3.88, p=.004), using minimal water in the kitchen (F(4,1640) = 15.10, p<.001), and collecting and using greywater on the garden (F(4,1497) = 6.84, p<.001) (Table 3.2.24). The pattern of results revealed by the posthoc analyses is largely consistent with the findings for curtailment intentions with households in lower income categories reporting more engagement in curtailment actions than households in the higher income categories. Specifically, households in the two lowest income category reported checking and fixing leaking taps more than households in all other income categories, and they also differed from each other (i.e., bottom category higher than second category). Households in the bottom income category reported using half flush or flushing less and collecting and using greywater on the garden more than households in the top two income categories. Finally, the bottom two income categories had shorter showers and used minimal water in the kitchen more often than households in the top three income categories (all ps<.05). Table J.24 Curtailment Past Behaviour by Income Levels.
Variable <$30,000(Mean)
$30,000 – 59,999(Mean)
$60,000 – 89,999(Mean)
$90,000 – 119,999 (Mean)
$120,000 + (Mean)
Check and fix leaking taps 4.76 4.57 4.40 4.35 4.32
Collect rainwater for garden 3.82 3.87 3.59 3.74 3.68
Run dishwasher when full 4.49 4.57 4.61 4.58 4.51
Shorter showers 4.39 4.32 4.05 3.84 3.97
Use half flush 4.64 4.59 4.57 4.46 4.43
Wash cars with minimal water 4.48 4.49 4.44 4.44 4.32
Run washing machine when full 4.58 4.51 4.49 4.44 4.40
Use minimal water in kitchen 4..55 4.50 4.27 4.18 4.18
Use greywater on garden 3.27 3.19 2.99 2.71 2.78
Turn taps off when brushing teeth
4.51 4.58 4.53 4.56 4.52
Be water-wise in garden 4.37 4.37 4.33 4.28 4.26
Analyses of the theory of planned behaviour questions relating to efficiency actions revealed significant differences between households across income levels on self-efficacy (F(4,1649) = 5.96, p<.001). Posthoc analyses showed that households in the bottom income category had less confidence than households in all other income categories that they could save water through installing water efficient devices. There were no other significant differences (Fs<3.27, ps>.01).

Water Demand Management Study: Baseline Survey of Household Water Use (Part A) Page 68
Table J.25 Mean Responses to Theory of Planned Behaviour Efficiency Items by Household Income Level.
Variable <$30,000 (Mean)
$30,000 – 59,999(Mean)
$60,000 – 89,999(Mean)
$90,000 – 119,999 (Mean)
$120,000 + (Mean)
Attitudes 6.22 6.25 6.19 6.25 6.08
Subjective norms 4.82 4.99 4.99 5.06 5.00
Moral Norms 5.08 5.43 5.26 5.35 5.30
Self-efficacy 5.31 5.67 5.71 5.68 5.70
Perceived control 2.72 2.66 2.79 2.93 2.53
General intentions 4.45 4.75 4.64 4.78 4.58
Perceived community norms 4.70 4.89 4.93 4.91 4.87
Householders who had not already installed a water efficiency appliance and for whom the appliance was applicable, indicated their future intentions to install each of the appliances. Significant differences in intentions emerged across income categories for intentions to install a rainwater tank plumbed into the house (F(4,1197) = 3.50, p=.007), and intentions to install a water efficient dishwasher (F(4,418) = 4.35, p=.002) (Table J.26). There were no other significant differences across income categories (Fs<2.92, ps>.02). Posthoc anlayses showed that households in the lowest income category had weaker intentions that those in the middle income category to install a rainwater tank plumbed to the house. Households in the lowest income category also had weaker intentions than all other income categories to install a water efficient dishwasher. Table J.26 Intentions to Install Water Efficient Devices by Income Category.
Variable <$30,000 (Mean)
$30,000 – 59,999(Mean)
$60,000 – 89,999(Mean)
$90,000 – 119,999 (Mean)
$120,000 + (Mean)
Low flow taps and showers 3.04 3.30 3.29 3.30 2.76
Pool cover 2.81 2.56 2.49 2.47 2.39
Trigger hose or time sprinkler 3.28 3.31 3.39 3.49 3.37
Water-wise garden 3.54 3.76 3.54 3.77 3.59
Dual flush toilet 3.03 2.72 3.27 3.68 3.23
Shower timer 2.65 2.70 2.73 2.94 2.51
Greywater system 2.41 2.54 2.47 2.46 2.39
Plumbed rainwater tank 2.21 2.47 2.63 2.49 2.392.37
Non-plumbed rainwater tank 2.37 2.73 2.72 2.45 2.39
Water-wise washing machine 2.75 3.20 2.99 3.10 3.11
Water efficient dishwasher 2.08 2.82 2.72 2.97 2.82
Analyses were also conducted comparing respondents who had installed each of the water efficient appliances with those who had not across income categories. Significant differences emerged for greywater systems (2 = 15.21, df = 4, p = .004), non-plumbed rainwater tanks (2 = 18.32, df = 4, p = .001), and water-wise washing machines (2= 40.54, df = 4, p<.001). Inspection of Table J.27 shows that less households in the top two income categories than other income categories had installed greywater systems. The pattern was less clear for non-plumbed rainwater tanks; it appears that the highest levels of installation are for the second and top income categories. For water-wise washing machines, there appears to be a linear relationship between income category and the number of households that have this type of appliance. There were no other significant differences on any other appliances (chi-square analyses ps>.01).

Water Demand Management Study: Baseline Survey of Household Water Use (Part A) Page 69
Table J.27 Percentage of Respondents across Income Categories who had Installed Water Efficient Devices.
Variable <$30,000 (Mean)
$30,000 – 59,999(Mean)
$60,000 – 89,999(Mean)
$90,000 – 119,999 (Mean)
$120,000 + (Mean)
Low flow taps and showers 69.2 75.8 66.8 67.4 65.7
Pool cover 8.2 9.0 9.7 12.0 12.9
Trigger hose or timed sprinkler 57.9 69.9 65.6 65.5 65.7
Water-wise garden 53.0 63.4 60.9 60.5 63.1
Dual flush toilet 78.4 85.5 85.1 87.2 84.1
Shower timer 42.4 45.6 44.5 36.8 34.8
Greywater system 19.2 23.3 22.5 13.2 15.5
Plumbed rainwater tank 15.2 18.1 20.4 19.8 15.9
Non-plumbed rainwater tank 35.7 42.0 29.9 35.7 43.3
Water-wise washing machine 31.1 40.9 47.9 53.5 51.1
Water efficient dishwasher 57.6 65.8 64.0 62.4 64.8
Significant differences emerged across income categories on level of community identification (F(4,1655) = 4.63, p=.001), the extent to which respondents identity themselves as water conservers (F(4,1656) = 12.16, p<.001), and whether there is a culture of water conservation in the household (F(4,1478) = 5.02, p<.001). Postdoc analyses indicate that households in the lowest income category were more identified with their community than households in the middle and top income categories and households in the second lowest income category were more identified than those in the top income category. Respondents in the lowest two income categories also reported that they think of themselves more as water conservers than respondents in the other income categories. Finally, a culture of household water conservation was more evident in households in the bottom two income categories than in the middle or top income categories. Table J.28 Comparison of Community Identification, Self-Identity, and Household Culture
by Household Income Category.
Variable <$30,000 (Mean)
$30,000 – 59,999(Mean)
$60,000 – 89,999(Mean)
$90,000 – 119,999 (Mean)
$120,000 + (Mean)
Community identification 5.09 4.97 4.79 4.79 4.64
Water conserver self-identity 6.08 6.02 5.80 5.72 5.68
Household culture 5.95 5.93 5.74 5.75 5.69
A number of clear differences emerged across income categories. Households in the two lowest income categories reported stronger intentions (for six out of 11 curtailment actions) and more engagement in everyday water saving actions (for five of the 11 curtailment actions) than households in the higher income categories. In contrast, households in the lowest income category had less confidence in their ability to save water through installing water efficient devices. Consistent with the lack of confidence, they reported lower intentions to install two of the 11 water efficient appliances and there was evidence of lower levels of installation of some water efficient appliances among the lower income categories. Interestingly, respondents in the lower income households had greater identification with their community, a greater sense of themselves as water conservers, and more of a culture of household conservation.

Water Demand Management Study: Baseline Survey of Household Water Use (Part A) Page 70
J.6 Education Level Comparisons: Psycho-Social and Behavioural Self-Report Variables
In terms of the Theory of Planned Behaviour questions relating to saving water through curtailment actions, there were significant differences across educational levels for curtailment attitudes (F(3, 1937) = 2.70, p = .045), moral norms (F(4, 1935) = 3.88, p = .009) as well as perceived control (F(4, 1926) = 4.50, p = .004). Follow up analyses showed that respondents who had achieved undergraduate level education felt less personal obligation to save water around the house and garden, when compared to respondents who had completed high school or below. Further, respondents who had completed high school or below also felt they had greater control in saving water around the house, when compared to those who had completed postgraduate education (Table J.29). Table J.29 Theory of Planned Behaviour Curtailment Items across Educational Levels.
Variable High School or below (Mean)
TAFE/Trade (Mean)
Undergraduate (Mean)
Postgraduate (Mean)
Attitudes 6.29 6.25 6.21 6.18
Subjective norms 5.75 5.71 5.70 5.66
Moral Norms 6.15a 6.04 5.98a 6.00
Self-efficacy 5.94 6.00 6.01 6.07
Perceived control 2.47b 2.28 2.32 2.13b
General intentions 6.33 6.26 6.31 6.30
Perceived community norms 5.24 5.16 5.19 5.19
Analyses of intentions to engage in specific curtailment actions (Table J.30) showed that respondents with differing levels of education varied in their intentions to check and fix leaking taps (F(3, 1890) = 2.86, p = .036), collect rainwater to use on the garden (F(3, 1733) = 3.66, p = .012), have shorter showers (F(3, 1916) = 9.99, p < .001), use half-flush (F(3, 1907) = 5.49, p = .001), only run washing machine when full (F(3, 1890) = 3.07, p = .027), use minimal water in the kitchen (F(3, 1918) = 10.82, p < .001), and intention to collect and use greywater on their garden (F(3, 1765) = 3.83, p = .009). Respondents with high school education or below consistently reported stronger intentions to carry out each of the significant curtailment behaviours. Table J.30 Curtailment Intentions across Educational Levels.
Variable High School or below (Mean)
TAFE/Trade(Mean)
Undergraduate (Mean)
Postgraduate (Mean)
Check and fix leaking taps 4.59a 4.56 4.45a 4.52
Collect rainwater for garden 3.97b 3.86 3.83 3.62b
Run dishwasher when full 4.67 4.66 4.58 4.65
Shorter showers 4.34c,d 4.26e,f 4.08c,e 4.07d,f
Use half flush 4.68g 4.63h 4.50g,h 4.59
Wash cars with minimal water 4.60 4.50 4.51 4.51
Run washing machine when full 4.55i 4.51 4.41i 4.53
Use minimal water in kitchen 4.52j,k,l 4.39j 4.26k 4.31l
Use greywater on garden 3.20m 2.98 2.95 2.90m
Turn taps off when brushing teeth 4.57 4.52 4.54 4.54
Be water-wise in garden 4.41 4.37 4.35 4.40
Respondents with varying education levels were significantly different from each other when reporting past behaviour related to having shorter showers (F(3, 1919) = 9.64, p < .001), only running washing machine when full (F(3,1888) = 5.96, p < .001), using a half-flush (F(3, 1913) = 2.93, p = .033), checking and fixing leaking taps (F(3, 1888) = 5.24, p = .001), using minimal water in the kitchen (F(3, 1918) = 8.11, p < .001), and collecting and using greywater on the garden (F(3, 1741) = 4.11, p = .006). Once again, those respondents falling in the lower education groups reported engaging in past curtailment behaviours more often than those in the higher education groups. Specifically, those in the

Water Demand Management Study: Baseline Survey of Household Water Use (Part A) Page 71
undergraduate level group tended to check and fix leaking taps more often, use a half flush, and run washing machine only when full less frequently than those with high school education. Those respondents with postgraduate education reported having longer showers, using more water in the kitchen, and collecting greywater for the garden less often than those with lower education (Table J.31). Table J.31 Curtailment Past Behaviour across Educational Levels.
Variable High School or below (Mean)
TAFE/Trade(Mean)
Undergraduate (Mean)
Postgraduate (Mean)
Check and fix leaking taps 4.58f 4.51 4.36f 4.51
Collect rainwater for garden 3.84 3.78 3.78 3.59
Run dishwasher when full 4.62 4.55 4.53 4.58
Shorter showers 4.30a,b 4.18 4.05a 4.02b
Use half flush 4.62e 4.53 4.50e 4.55
Wash cars with minimal water 4.50 4.40 4.38 4.49
Run washing machine when full 4.54c 4.51d 4.35c,d 4.49
Use minimal water in kitchen 4.48g,h 4.39i 4.25g,i 4.30h
Use greywater on garden 3.21j,k 3.02 2.92j 2.89k
Turn taps off when brushing teeth 4.56 4.54 4.52 4.52
Be water-wise in garden 4.39 4.34 4.27 4.34
Consistent with the curtailment action analyses, respondents across educational levels significantly differed in their attitudes related to installing water efficient appliances (F(3, 1935) = 2.77, p = .040), as well as perceptions of control with regards to saving water around the house and garden (F(3, 1928) = 2.93, p = .032) (Table J.32). Additionally, respondents from the various educational levels also differed in their general intentions to install water efficient appliances (F(3, 1928) = 3.79, p = .010). Participants with high school education or below reported significantly higher perceptions of control related to saving water around the home, when compared to respondents with postgraduate education. Further, participants with high school and TAFE/Trade levels of education reported weaker intentions to install water efficient appliances in their homes within the next six months, when compared to participants with postgraduate level of education. Table J.32 Theory of Planned Behaviour Efficiency Items across Educational Levels.
Variable High School or below (Mean)
TAFE/Trade(Mean)
Undergraduate (Mean)
Postgraduate(Mean)
Attitudes 6.24 6.20 6.13 6.12
Subjective norms 4.93 4.92 4.97 4.98
Moral Norms 5.26 5.24 5.32 5.26
Self-efficacy 5.55 5.63 5.65 5.65
Perceived control 2.83a 2.71 2.66 2.52a
General intentions 4.72b 4.69c 4.56 4.42b,c
Perceived community norms 4.81 4.83 4.91 4.84
For those respondents who had not already installed specific water efficient devices, there was a significant difference across education levels in intentions to install a plumbed rain water tank (F(3, 1397) = 7.24, p<.001). Specifically, those with TAFE/Trade level education had the greatest intention to install a rain water tank and plumb it into their home, when compared to respondents with high school or below levels of education and those with undergraduate education. The latter group reported the weakest intention to install a plumbed rain water tank (Table J.33). There were no other significant differences between specific intentions to install efficiency appliances across education levels, although differences between groups regarding the intention to install a water-wise garden was approaching significance (F(3, 628) = 2.60, p = .051).
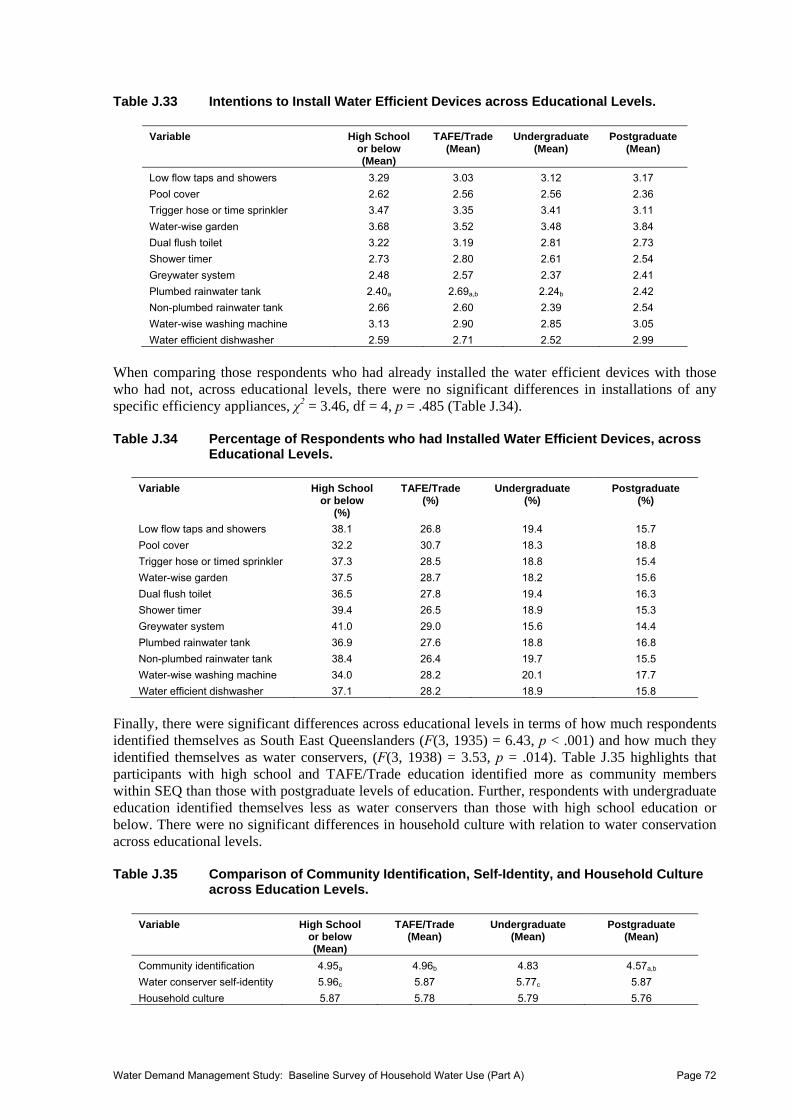
Water Demand Management Study: Baseline Survey of Household Water Use (Part A) Page 72
Table J.33 Intentions to Install Water Efficient Devices across Educational Levels.
Variable High School or below (Mean)
TAFE/Trade(Mean)
Undergraduate (Mean)
Postgraduate(Mean)
Low flow taps and showers 3.29 3.03 3.12 3.17
Pool cover 2.62 2.56 2.56 2.36
Trigger hose or time sprinkler 3.47 3.35 3.41 3.11
Water-wise garden 3.68 3.52 3.48 3.84
Dual flush toilet 3.22 3.19 2.81 2.73
Shower timer 2.73 2.80 2.61 2.54
Greywater system 2.48 2.57 2.37 2.41
Plumbed rainwater tank 2.40a 2.69a,b 2.24b 2.42
Non-plumbed rainwater tank 2.66 2.60 2.39 2.54
Water-wise washing machine 3.13 2.90 2.85 3.05
Water efficient dishwasher 2.59 2.71 2.52 2.99
When comparing those respondents who had already installed the water efficient devices with those who had not, across educational levels, there were no significant differences in installations of any specific efficiency appliances, χ2 = 3.46, df = 4, p = .485 (Table J.34). Table J.34 Percentage of Respondents who had Installed Water Efficient Devices, across
Educational Levels.
Variable High School or below
(%)
TAFE/Trade(%)
Undergraduate (%)
Postgraduate (%)
Low flow taps and showers 38.1 26.8 19.4 15.7
Pool cover 32.2 30.7 18.3 18.8
Trigger hose or timed sprinkler 37.3 28.5 18.8 15.4
Water-wise garden 37.5 28.7 18.2 15.6
Dual flush toilet 36.5 27.8 19.4 16.3
Shower timer 39.4 26.5 18.9 15.3
Greywater system 41.0 29.0 15.6 14.4
Plumbed rainwater tank 36.9 27.6 18.8 16.8
Non-plumbed rainwater tank 38.4 26.4 19.7 15.5
Water-wise washing machine 34.0 28.2 20.1 17.7
Water efficient dishwasher 37.1 28.2 18.9 15.8
Finally, there were significant differences across educational levels in terms of how much respondents identified themselves as South East Queenslanders (F(3, 1935) = 6.43, p < .001) and how much they identified themselves as water conservers, (F(3, 1938) = 3.53, p = .014). Table J.35 highlights that participants with high school and TAFE/Trade education identified more as community members within SEQ than those with postgraduate levels of education. Further, respondents with undergraduate education identified themselves less as water conservers than those with high school education or below. There were no significant differences in household culture with relation to water conservation across educational levels. Table J.35 Comparison of Community Identification, Self-Identity, and Household Culture
across Education Levels.
Variable High School or below (Mean)
TAFE/Trade (Mean)
Undergraduate (Mean)
Postgraduate (Mean)
Community identification 4.95a 4.96b 4.83 4.57a,b
Water conserver self-identity 5.96c 5.87 5.77c 5.87
Household culture 5.87 5.78 5.79 5.76
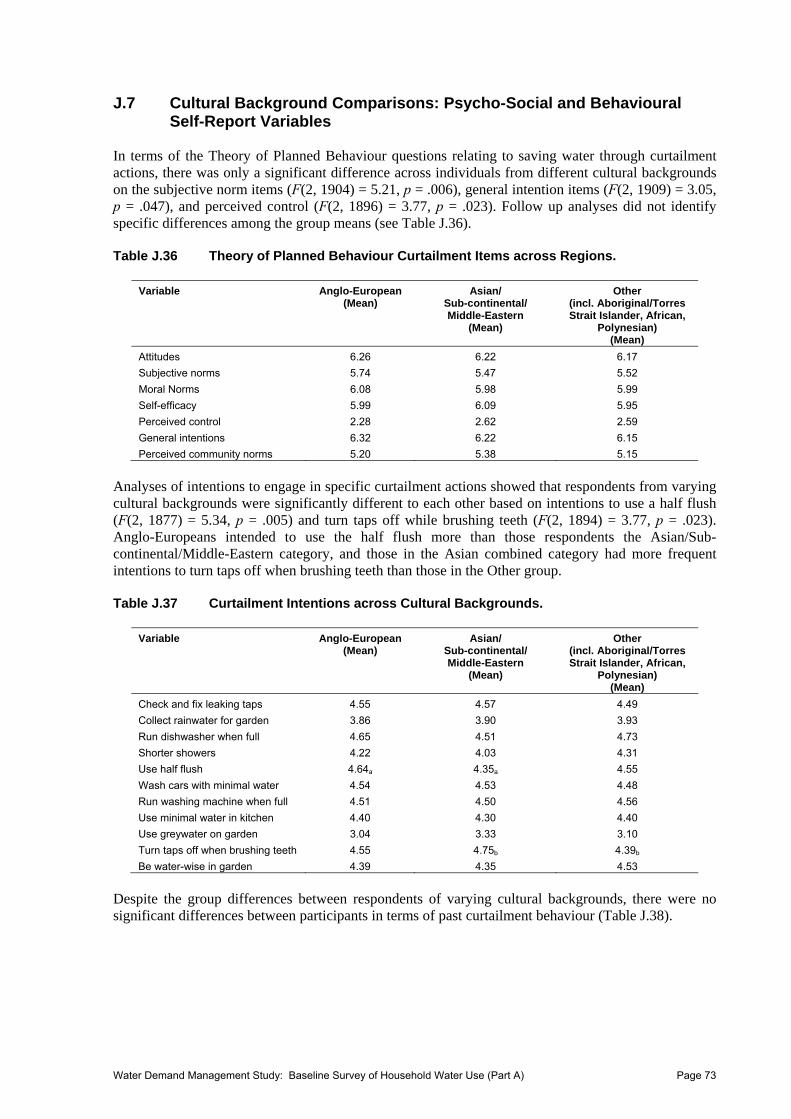
Water Demand Management Study: Baseline Survey of Household Water Use (Part A) Page 73
J.7 Cultural Background Comparisons: Psycho-Social and Behavioural Self-Report Variables
In terms of the Theory of Planned Behaviour questions relating to saving water through curtailment actions, there was only a significant difference across individuals from different cultural backgrounds on the subjective norm items (F(2, 1904) = 5.21, p = .006), general intention items (F(2, 1909) = 3.05, p = .047), and perceived control (F(2, 1896) = 3.77, p = .023). Follow up analyses did not identify specific differences among the group means (see Table J.36). Table J.36 Theory of Planned Behaviour Curtailment Items across Regions.
Variable Anglo-European (Mean)
Asian/ Sub-continental/ Middle-Eastern
(Mean)
Other (incl. Aboriginal/Torres Strait Islander, African,
Polynesian) (Mean)
Attitudes 6.26 6.22 6.17
Subjective norms 5.74 5.47 5.52
Moral Norms 6.08 5.98 5.99
Self-efficacy 5.99 6.09 5.95
Perceived control 2.28 2.62 2.59
General intentions 6.32 6.22 6.15
Perceived community norms 5.20 5.38 5.15
Analyses of intentions to engage in specific curtailment actions showed that respondents from varying cultural backgrounds were significantly different to each other based on intentions to use a half flush (F(2, 1877) = 5.34, p = .005) and turn taps off while brushing teeth (F(2, 1894) = 3.77, p = .023). Anglo-Europeans intended to use the half flush more than those respondents the Asian/Sub-continental/Middle-Eastern category, and those in the Asian combined category had more frequent intentions to turn taps off when brushing teeth than those in the Other group. Table J.37 Curtailment Intentions across Cultural Backgrounds.
Variable Anglo-European (Mean)
Asian/ Sub-continental/ Middle-Eastern
(Mean)
Other (incl. Aboriginal/Torres Strait Islander, African,
Polynesian) (Mean)
Check and fix leaking taps 4.55 4.57 4.49
Collect rainwater for garden 3.86 3.90 3.93
Run dishwasher when full 4.65 4.51 4.73
Shorter showers 4.22 4.03 4.31
Use half flush 4.64a 4.35a 4.55
Wash cars with minimal water 4.54 4.53 4.48
Run washing machine when full 4.51 4.50 4.56
Use minimal water in kitchen 4.40 4.30 4.40
Use greywater on garden 3.04 3.33 3.10
Turn taps off when brushing teeth 4.55 4.75b 4.39b
Be water-wise in garden 4.39 4.35 4.53
Despite the group differences between respondents of varying cultural backgrounds, there were no significant differences between participants in terms of past curtailment behaviour (Table J.38).

Water Demand Management Study: Baseline Survey of Household Water Use (Part A) Page 74
Table J.38 Past Curtailment Behaviour across Cultural Background.
Variable Anglo-European (Mean)
Asian/ Sub-continental/ Middle-Eastern
(Mean)
Other (incl. Aboriginal/Torres Strait Islander, African,
Polynesian) (Mean)
Check and fix leaking taps 4.51 4.54 4.43
Collect rainwater for garden 3.77 3.75 3.84
Run dishwasher when full 4.58 4.52 4.56
Shorter showers 4.17 4.16 4.26
Use half flush 4.58 4.41 4.49
Wash cars with minimal water 4.46 4.42 4.38
Run washing machine when full 4.49 4.52 4.61
Use minimal water in kitchen 4.39 4.30 4.39
Use greywater on garden 3.03 3.41 3.19
Turn taps off when brushing teeth 4.54 4.73 4.44
Be water-wise in garden 4.33 4.50 4.48
With regards to items related to efficiency, respondents from different cultural groups reported significantly different general intentions to install water efficient appliances around the home (F(2, 1898) = 5.51, p = .004). Specifically, Anglo-Europeans reported fewer intentions to install water efficient appliances in their homes within the next six months, when compared to both the Asian and Other cultural groups (see Table J.39). There were no other differences among culturally different participants with regards to the Theory of Planned Behaviour variables. Table J.39 Theory of Planned Behaviour Efficiency Items across Cultural Backgrounds.
Variable Anglo-European (Mean)
Asian/ Sub-continental/ Middle-Eastern
(Mean)
Other (incl. Aboriginal/Torres Strait Islander, African,
Polynesian) (Mean)
Attitudes 6.20 6.08 6.21
Subjective norms 4.95 5.00 4.76
Moral Norms 5.27 5.35 5.30
Self-efficacy 5.60 5.77 5.72
Perceived control 2.68 3.02 2.88
General intentions 4.59a,b 5.04a 4.95b
Perceived community norms 4.84 5.12 4.74
For those respondents who had not already installed specific water efficient devices, there was a significant differences across cultural background with regards to participants’ intentions to install low flow taps and/or shower heads (F(2, 489) = 3.04, p = .049), pool covers (F(2, 434) = 10.29, p < .001), shower timers (F(2, 984) = 3.25, p = .039), greywater systems (F(2, 1332) = 8.12, p < .001), a plumbed rain water tank (F(2, 1375) = 6.04, p = .002), an unplumbed rain water tank (F(2, 899) = 3.67, p = .026), and a water efficient dishwasher (F(2, 487) = 3.12, p = .042). Further comparisons of the means indicate that Anglo-Europeans were least likely to install pool covers compared to the other two cultural groups, and the Asian/Sub-continental/Middle-Eastern group were significantly more likely to install shower timers than the Anglo-European group. Anglo-Europeans were also less likely to install greywater systems or plumbed rain water tanks when compared to the Asian and Other cultural groups (see Table J.40).

Water Demand Management Study: Baseline Survey of Household Water Use (Part A) Page 75
Table J.40 Intentions to Install Water Efficient Devices across Cultural Groups.
Variable Anglo-European (Mean)
Asian/ Sub-continental/ Middle-Eastern
(Mean)
Other (incl. Aboriginal/Torres Strait Islander, African,
Polynesian) (Mean)
Low flow taps and showers 3.12 3.73 3.38
Pool cover 2.45a,b 3.47a 3.45b
Trigger hose or time sprinkler 3.35 3.61 3.52
Water-wise garden 3.60 3.68 3.88
Dual flush toilet 3.01 3.33 3.50
Shower timer 2.67c 3.23c 2.80
Greywater system 2.42d,e 3.02d 2.79e
Plumbed rainwater tank 2.41f,g 2.88f 2.81g
Non-plumbed rainwater tank 2.52 2.96 2.96
Water-wise washing machine 2.97 3.56 3.00
Water efficient dishwasher 2.62 3.05 3.32
When comparing those respondents who had already installed the water efficient devices with those who had not, across cultural groups, there was a significant difference in the installation of water-wise gardens only, 2 = 11.41, df = 2, p = .003). Specifically, inspection of Table J.41 shows that respondents within the combined Asian cultural category were the least likely cultural group to have installed a water-wise garden. Table J.41 Percentage of Respondents across Cultural Backgrounds who have Installed
Water Efficient Devices.
Variable Anglo-European %
Asian/ Sub-continental/ Middle-Eastern
%
Other (incl. Aboriginal/Torres Strait Islander, African,
Polynesian) %
Low flow taps and showers 91.6 3.0 5.4
Pool cover 92.9 2.0 5.1
Trigger hose or time sprinkler 92.1 2.7 5.2
Water-wise garden 92.2 2.2 5.5
Dual flush toilet 91.9 3.2 4.9
Shower timer 90.1 3.4 6.5
Greywater system 91.8 2.1 6.2
Plumbed rainwater tank 93.4 2.3 4.3
Non-plumbed rainwater tank 91.0 3.6 5.3
Water-wise washing machine 91.4 3.1 5.6
Water efficient dishwasher 90.5 3.6 5.9
Finally, there were no significant differences between the three cultural groups in terms of how much respondents identified themselves as members of South East Queensland, how much they thought of themselves as a water conserver, and their household culture in relation to water conservation (Table J.42). Table J.42 Comparison of Community Identification, Self-Identity, and Household Culture
across Cultural Groups.
Variable Anglo-European (Mean)
Asian/ Sub-continental/ Middle-Eastern
(Mean)
Other (incl. Aboriginal/Torres Strait Islander, African,
Polynesian) (Mean)
Community identification 4.86 5.09 4.89
Water conserver self-identity 5.90 5.77 5.76
Household culture 5.82 5.82 5.69

Water Demand Management Study: Baseline Survey of Household Water Use (Part A) Page 76
REFERENCES
Australian Bureau of Statistics. (2006). Census of Population and Housing. Ajzen, I. (1991).The theory of planned behavior, Organizational Behavior and Human Decision Processes,
50(2), 179-211. Armitage, C.J. and Conner, M. (2001). Efficacy of the theory of planned behaviour: A meta-analytic
review. British Journal of Social Psychology, 40, 471-499. Bates, B., Kundzewicz, Z.W., Wu, S. and Palutikof, J. (2008).Climate Change and Water: IPCC Technical
Report VI, IPCC Secretariat, Geneva. Cialdini, R.B., Reno, R.R. and Kallgren, C.A. (1990). A focus theory of normative conduct: Recycling the
concept of norms to reduce littering in public places. Journal of Personality and Social Psychology, 58(6), 1015-1026.
Clark, W. A., and J. C. Finley (2007). Determinants of water conservation intention in Blagoevgrad, Bulgaria, Society and Natural Resources, 20, 613-327.
Conner, M., and Armitage, C.J. (1998). Extending the theory of planned behaviour: A review and avenues for further research. Journal of Applied Social Psychology, 28(15), 1429-1464.
CSIRO, (2010). Water overview. Retrieved April 7, 2010 from http://www.csiro.au/org/WaterOverview.html. Fielding, K.S., Louis, W.R., Warren, C. and Thompson, A. (2009). Environmental sustainability in
residential housing: Understanding attitudes and behaviour towards waste, water, and energy consumption and conservation among Australian households. Melbourne, Victoria: Australian Housing and Urban Research institute.
Fielding, K.S., Russell, S. and Grace, R. (2010). Residential water demand management in South East Queensland: A report on water conservation beliefs. Urban Water Security Research Alliance, Technical Report (# TBA) (in publication).
Gardner, G. T., and P. C. Stern (1996). Environmental problems and human behavior, Allyn and Bacon, Boston.
Holland, R.W., Aarts, H. and Langendam, D. (2006). Breaking and creating habits on the working floor: A field-experiment on the power of implementation intentions. Journal of Experimental Social Psychology, 42, 776-783.
Kantola, S. J., Syme, G.J. and Campbell, N.A. (1982). The role of individual differences and external variables in a test of the sufficiency of Fishbein's model to explain behavioral intentions to conserve water, Journal of Applied Social Psychology, 12(1), 70-83.
Lam, S.-P. (1999). Predicting intentions to conserve water from the theory of planned behavior, perceived moral obligation, and perceived water right, Journal of Applied Social Psychology, 29(5), 1058-1071.
Lam, S.-P. (2006). Predicting intention to save water: Theory of planned behavior, response efficacy, vulnerability, and perceived efficiency of alternative solutions, Journal of Applied Social Psychology, 36(11), 2803-2824.
Manstead, A.S.R. and Parker, D. (1995). Evaluating and extending the theory of planned behaviour. In W. Stroebe and M. Hewstone (Eds), European Review of Social Psychology (Vol. 6, pp. 69-96). Chichester: Wiley.
Nolan, J M., Schultz, P. W., Cialdini, R B., Goldstein, N J. and Griskevicius, V. (2008). Normative Social Influence is Underdetected. Personality and Social Psychology Bulletin, 34, 913–923.
Ouellette, J.A. and Wood, W. (1998). Habit and intention in everyday life: The multiple processes by which past behaviour predicts future behaviour. Psychological Bulletin, 124, 54-74.
Partridge, E. (2008). From ambivalence to activism: Young people’s environmental views and actions. Youth Studies Australia, 27, 18-25.
Russell, S. and Fielding, K. (2010). Water demand management research: A psychological perspective. Water Resources Research, 46, W05302, doi:10.1029/2009WR008408.
Stryker, S. (1968). Identity salience and role performance: The importance of symbolic interaction theory for family research. Journal of Marriage and the Family, 30, 558-564.
Stryker, S. (1980). Symbolic interactionism: A social structural version. Palo Alto CA: Benjamin/Cummings.
Zelezny, L.C., Chua, P-P. and Aldrich, C. (2000). Elaborating on gender differences in environmentalism. Journal of Social Issues, 56(3), 443-457.

Urban Water Security Research Alliance
www.urbanwateralliance.org.au