Baseline Survey Report - Energypedia...BASELINE SURVEY REPORT Energy Utilization and Demand Baseline...
73
BASELINE SURVEY REPORT Energy Utilization and Demand Baseline Assessment (2009) Rural Support Program Network Pakistan Domestic Biogas Programme Head Office, House # 7, Street 49, F-6/4 Plot #1, Rose Valley, Islamabad Pakistan. Amin Town, Faisalabad. Tel: (+92-51) 2822476, 2821736 Tel: (+92-41) 8850371-3 www.rspn.org
Transcript of Baseline Survey Report - Energypedia...BASELINE SURVEY REPORT Energy Utilization and Demand Baseline...

BASELINE SURVEY REPORT Energy Utilization and Demand Baseline Assessment (2009)
Rural Support Program Network Pakistan Domestic Biogas Programme Head Office, House # 7, Street 49, F-6/4 Plot #1, Rose Valley, Islamabad Pakistan. Amin Town, Faisalabad. Tel: (+92-51) 2822476, 2821736 Tel: (+92-41) 8850371-3 www.rspn.org

Table of Contents
Executive Summary
1 INTRODUCTION 1
1.1 Background ................................................................................................................................... 1
1.2 Objectives of the Survey ............................................................................................................... 1
2 SURVEY APPROACH & METHODOLOGY 3
2.1 Approach ....................................................................................................................................... 3
2.1.1 Primary Data Collection Tools ............................................................................................... 3 2.1.2 Sampling Methodology .......................................................................................................... 4
2.1.2.1 Sample Size 4
2.2 Study Methodology ....................................................................................................................... 5
2.2.1 Planning Meeting with Client ................................................................................................. 5 2.2.2 Development/Pre-testing/Finalization of Information Collection Tools ................................. 5 2.2.3 Hiring and Training of Enumerators ...................................................................................... 5 2.2.4 Field Survey .......................................................................................................................... 5
2.2.4.1 Steps for Selection of Sampled Villages and Households: 5 2.2.4.2 Women’s FGDs 6
2.2.5 Quality Assurance ................................................................................................................. 6 2.2.6 Data Entry/Cleaning/Processing ........................................................................................... 7 2.2.7 Report Writing (First Draft) .................................................................................................... 7 2.2.8 Final Report ........................................................................................................................... 7
3 AREA PROFILE 8
3.1 Sample Population ........................................................................................................................ 8
3.2 Facilities ........................................................................................................................................ 8
3.2.1 Educational Facilities ............................................................................................................ 8 3.2.2 Other Facilities ...................................................................................................................... 9
3.3 Type of Houses ........................................................................................................................... 10
3.4 Water Sources ............................................................................................................................. 11
3.5 Livestock ..................................................................................................................................... 11
3.6 Economic & Community Groups ................................................................................................. 12
3.7 Energy Sources ........................................................................................................................... 13
3.8 Awareness about Bio-gas and willingness to opt Bio-gas .......................................................... 15
3.9 Access to Credit .......................................................................................................................... 16
4 HOUSEHOLD SURVEY FINDINGS 17
4.1 Characteristics of Respondents .................................................................................................. 17

4.1.1 Age of Respondents ............................................................................................................ 17 4.1.2 Respondents Literacy Level ................................................................................................ 17 4.1.3 Respondents Employment Levels ....................................................................................... 18
4.2 Social Characteristics .................................................................................................................. 18
4.2.1 Household Type and Size ................................................................................................... 18 4.2.1.1 Family Size 18 4.2.1.2 Age 18 4.2.1.3 Education 18 4.2.1.4 Hours Spent by Children Doing School Work 20 4.2.1.5 Division of Labour in the Household 20 4.2.1.6 Women Mobility 21 4.2.1.7 Decision Making 23 4.2.1.8 Health and Hygiene 24 4.2.1.9 Water Availability 25
4.3 Economic Characteristics ............................................................................................................ 27
4.3.1 Household Monthly Income & Expenditure ......................................................................... 27 4.3.2 Access to Credit .................................................................................................................. 28
4.3.2.1 Occupation and Entrepreneurship 29 4.3.2.2 Type and Size of the House 30 4.3.2.3 Livestock and Land Holdings 31 4.3.2.4 Use of Fertilizer 32
4.4 Access and Usage of Energy Sources ....................................................................................... 33
4.4.1.1 Available Energy Sources & Fuel Usage 33 4.4.1.2 Manure Availability and Use 36
4.5 Community Awareness about Bio-Gas ....................................................................................... 37
4.5.1.1 Knowledge of bio-gas and sources of information 37 4.5.1.2 Perception/Views about Bio-gas 37 4.5.1.3 Willingness to Promote Bio-gas 39
5 CONCLUSIONS & RECOMMENDATIONS 40
6 FOCUS GROUP DISCUSSION ON BIOGAS WITH WOMEN – A SUMMARY 42
Appendix: Tables
Annexes:
Annex-1: Survey Tools Annex-1 Survey Tools.zip
Annex-2: Women’s Focus Group Discussions Annex
FG-2 Women Ds.zip
Annex-3: Faisalabad and Vehari Districts Statistics Annex-4 Census
Record.doc

EUDBA Survey Report, 2009
P a g e | i
EXECUTIVE SUMMARY
SNV (Netherlands Development Organization) and Winrock International are providing technical support for launching a national level Pakistan Domestic Bio-gas Program (PDBP) in Pakistan through the Rural Support Program Network (RSPN). RSPN contracted SEBCON to carry out the Energy Utilization of Demand Baseline Amount in order to understand the energy demand and utilization patterns of rural farmers, the project’s economic and social impacts, to estimate the impact of the project as economic and social indicators to enable it to measure the market and non-market benefits of domestic gas.
A socio-economic profile of the surveyed areas has been drawn from primary data collected through key informants at the village and household levels. In terms of number of households, the average number of total households per village in Distt. Faisalabad is around 780, and 633 households for Distt./Tehsil Vehari. All villages in both districts have access to electricity and around a fifth have access to water supply in both the districts. Only 20% villages in Distt. Faisalabad have gas in the form of cylinders while none of the villages in Vehari have this facility. Around 4/5th of the villages in both districts have a drainage system, while only 20% villages in Distt. Faisalabad had a bank.
The most common type of house construction was bricked with cement construction in both the districts, Hand-pumps are the main source of water in the villages in Distt. Faisalabad, followed by electric pump. In Vehari, most of the households in the sampled villages used electric pumps as their main source of water, followed by hand-pumps.
Majority of the working population in the villages belonged to agriculture and livestock related professions/occupations. All villages covered in Distt. Faisalabad have access to/availability of dung cakes within their village as a source for fuel (for cooking). The second most accessible energy source was electricity (for lighting purposes), and third was kerosene oil followed by firewood. In Distt. Vehari, all villages have access to dung cakes and electricity as an available energy source within their villages, followed by kerosene oil. Similar results can also be seen in the data from the National Census Report (see annex 4).
Banks were the most popular in both districts and personal loans were the second most accessible source for credit in the Faisalabad region. The main purpose behind the bank loans as well as those from other sources in both districts was for use in agriculture/livestock, while personal consumption/social needs were the main purposes behind the personal loans. The major constraints as cited in both districts included high mark-up rates as well as no collateral.
As part of the Baseline Assessment a survey was also conducted at the household (HH) level at each of the sampled villages in both districts, one component consisting of interviews with head of households and the other component consisting of interviews with female respondents. According to the women’s responses in both districts, most of the domestic work was the women’s responsibility with the help of the female child in some cases. The outside work was chiefly carried out by the men with the help of the male child in some cases. The results were again very similar for both the districts in terms of the average number of hours spent on the various tasks identified. Cooking and cleaning the house took around 3.5 hours, while making dung cakes took just over an hour, as did caring for children. Comparatively, the men spent

EUDBA Survey Report, 2009
P a g e | ii
around 21/2 hours involved in agriculture or livestock, wood collection or preparation, and around an hour in buying food or social activities.
In terms of mobility, majority of the women faced few constraints and were quite free to move around for various purposes, and the women confirmed this in the FGDs as well. Work was the most common purpose for going out of the house with an average of 35% citing this as their main reason in Faisalabad, and 40% for Vehari. Most of the women in both districts were not accompanied by anybody when going out but sometimes they were accompanied by either a young male member of the household or an adult male or the HoHH.
Men dominated by being the main decision-makers in most areas, making decisions regarding agriculture, livestock, and purchase and sale of assets. Decisions about children’s education were jointly made, as were decisions about health, marriage and other social areas. According to the observations made by the interviewers in the women’s survey, overall cleanliness in the houses ranged from good to fair for majority of the houses surveyed in both the districts. Regarding the health of women involved in cooking in the households, the health status ranged from good to fair in both districts.
Food constituted the largest proportion of average monthly expenditure for both districts, and this was followed by transport, and electricity took up 8% of the average monthly expenditure for both the districts. Expenditure on other sources of fuel amounted 5% of the total for Faisalabad, while in Vehari it amounted to 3.8%. The available energy sources at present include firewood, crop residue/grass, dung cakes, kerosene oil, coal, LPG, and electricity. Firewood is the most used form of fuel for cooking, followed by dung cakes, and LPG in both districts.
The average daily production of manure across the surveyed households in Distt. Faisalabad is 83 Kg, whereas it is 111 Kg for Vehari. The most common uses of manure across Faisalabad region are for composting and burning, whereas for Vehari the most common use is for burning followed by composting.
According to the responses from the male FGDs, there is quite a high level of awareness about bio-gas as an alternate source of energy in both the districts, with most of those aware of bio-gas in Faisalabad district hearing about it from friends, relatives and other villagers. The majority of communities in both districts are of the opinion that communities with livestock would like to opt for bio-gas as an alternate source of energy. On the other hand, the HH survey results are quite different from the FGD responses. Only about a third of the HH survey respondents in both districts are aware about bio-gas, the majority hearing about it through friends/relatives. Only a third of those aware of bio-gas have ever seen a bio-gas plant. Among the women, less than a fifth had heard about bio-gas as an energy source. There is a strong willingness to opt for bio-gas for their houses, with 60% of men and women willing to do so in both districts. The most obvious benefit of bio-gas as perceived by 93% of the women surveyed in Faisalabad Distt. and 95% in Vehari is the fact that it is time-saving. This was followed by the fact that it’s a healthier source of energy and is also more cost efficient, opinions most likely based on second-hand information from those who are aware of bio-gas technology.

EUDBA Survey Report, 2009
P a g e | iii
56% of the women in both districts would like to opt for bio-gas but the initial high cost of set-up was considered as a major source of constraint and hindrance, saying the men would never agree to spending so much. 83% of the women in both districts identified the HoHH as the person who will decide whether or not to opt for bio-gas. The fact that some of the villages would eventually be supplied with much-awaited sui-gas, there are those who don’t see any point in spending on bio-gas. This seems to be more of a hope than a fact, if they live in remote villages. It would be useful to add this observation. Around 63% of the female respondents in both districts cited self-financing as the primary source of financial arrangements for bio-gas. Similar figures resulted in the general survey findings as well, with 70% of the respondents identifying personal savings as the main source for financing the construction of a bio-gas plant. There is nevertheless a strong willingness among the women to setup bio-gas plants. They feel women should be made responsible for the repair and maintenance of bio-gas plants in order to ensure the project’s sustainability and better results.

EUDBA Survey Report, 2009
P a g e | 1
1 INTRODUCTION
1.1 Background
The development and exploitation of bio-gas sources can provide a sustainable solution to growing energy demands. Utilization of bio-gas will not only reduce dependence on expensive (and fast rising cost) of fossil fuel, but will enhance environmental quality and provide better opportunities for agriculture production. Other benefits are improved health and sanitation.
The Government of Pakistan plans to electrify 7000 remote villages (to serve 10 million citizens) in Pakistan using off-grid renewable energy technologies including use of Bio-gas. The potential for Bio-gas can be assessed by the fact that Pakistan has an estimated 24 million buffaloes and 22 million cattle. The largest member of this livestock is located in mid and south Punjab.
The key factors in making the bio-gas project successful are;
• Economic perception and realities of the farmers.
• Access to technical resources.
• Bio-physical resource appropriate to the technologies being used and
• Effective leadership especially at the initial stage.
SNV (Netherlands Development Organization) and Winrock International are providing technical support for launching a national level Pakistan Domestic Bio-gas Program (PDBP) in Pakistan through the Rural Support Program Network (RSPN). Over a period of four years the program targets to construct 30,000 domestic bio-gas plants. RSPN contracted SEBCON to carry out the Energy Utilization of Demand Baseline Amount in order to understand the energy demand and utilization pattern of rural farmers, the projects economic and social impacts, to estimate the impact of the project as economic and social indicators to enable it to measure the market and non-market benefits of domestic gas.
1.2 Objectives of the Survey
The Baseline Assessment is part of the Monitoring & Evaluation Framework of the PDBP. The Framework envisages that evaluations will be conducted as i) Baseline (at the start of the project), ii) User surveys (at the end of year 1 to year 3), and iii) Final (at the end of year 4). Study and sample designs of the Baseline Assessment will enable comparisons of the baseline information with user surveys and the Final Assessment. Important gender mainstreaming indicators are also a part of the Baseline Assessment design and the methodology is gender inclusive and friendly.
The study would assist RSPN in estimating and studying the change in energy utilization and demand patterns for a rural household after it has installed and operated a domestic biogas plant for a significant period of time (2 years or more). In addition, it would also help to estimate the impact of installing a domestic biogas plant on economic and social indicators such as income levels, energy & other expenditures, health & sanitation, social status of women in a

EUDBA Survey Report, 2009
P a g e | 2
household, time utilization, etc. Thus, this survey would be very instrumental in measuring the market & non-market benefits of domestic biogas.
An indicative list of variables on which information is required is listed below:
1) What energy sources (firewood, dung patties, agri residue, LPG, candles, kerosene and/or electricity) do the households currently use for cooking, lighting, heating, entertainment (TV and radio) and in what quantities for what purposes?
2) Is electricity available? For how many hours per day? How far away is the nearest Sui Gas pipeline? How far is the LPG, kerosene, firewood dealer? In case of firewood do they collect it for free (from where, how far) or buy (at what rate)?
3) Annual household expenditure with special focus on fuel consumption and expenditure (by fuel and in standardized units of consumption).
4) Annual household income from agriculture, employment, rents, remittances and other income generating sectors – this information can be triangulated from surveys such as Pakistan Integrated Household & Income Surveys
5) Households perceptions about success of biogas plants and their willingness to pay
6) Household member data by age, sex and relationship to the head of household. Education level of household members, number of hours spent by girls and boys doing school work.
7) The general division of labor in the household between women, men and girls and boys.
8) Work load analysis (economic & social) of the women and girls in the households; average time per day spent accomplishing various tasks including fuel collection, cooking, cleaning, etc.
9) Cleanliness level of kitchen & utensils with different fuel types being used
10) Cases of respiratory, digestion, eye, etc related diseases in a family especially in women and children
11) Number of animals in the household (dairy, non-dairy, sedentary, mobile)
12) Current use of animal manure (amount used for burning, fertilizer, composting, etc)?
13) Use of manure and commercial fertilizer in farming (types and quantities)
14) Households’ knowledge of biogas plants
15) What are the views of men and women on the value of the proposed energy technology and what are their priorities?
16) Availability of credit with source and utilization? Willingness to go for a credit?

EUDBA Survey Report, 2009
P a g e | 3
2 Survey Approach & Methodology
2.1 Approach
A baseline survey greatly supports project in efficient and effective planning, monitoring and evaluation of a project. Thus a clear and mutual understanding among the project and consultant over the project progress and performance and impact indicators is very necessary in order to obtain relevant and useful primary data. Therefore SEBCON kept a close liaison with the client throughout the course of this assignment.
SEBCON approached the study by firstly apprehending in detail the project expectations from the baseline survey and making further SMART the following indicators that the survey intended to cover:
• Socio-economic indicators (income & expenditure / education / health & sanitation) • Demographic indicators • Infrastructure • Gender • Energy – sources • Livestock / Agriculture
The socio-economic analysis covered the following;
• Socio-economic profile of the village including information, age, gender, education (structure), number of HHs, education & culture facilities, economic activities, luxuries, employment, poverty, decision making at HHs level.
• Perceived social & economic benefits of bio-gas – economic (expenditures), health environment and impact on agriculture production by increased availability of manure.
• Willingness to pay including capacity to pay and the number of such households in the villages.
• Access to credit both formal & informal. • Institutional arrangements – if any NGO is operational in the target area. Not clear
2.1.1 Primary Data Collection Tools
Based on the final list of indicators, in close consultation with RSPN (including a gender expert), the following four tools (see annex-1 for details) were developed to collect quantitative and qualitative data:
1) Village Profile [to study the general characteristics of the village which mainly included housing, population, access to facilities, livelihood, livestock, available energy sources, awareness about bio-gas, available credit sources, sources of information].
2) Household Questionnaire [the questionnaire included socio-economic characteristics of the sample HHs. The information collected through this questionnaire comprised type,

EUDBA Survey Report, 2009
size and ownership of house; water sources, division of labour in the household, education and employment; use of energy sources, awareness and perception about change in forests in the surrounding areas; livestock and agricultural land, use of manure; HH income and expenditure; awareness about and willingness to opt bio-gas; health; credit; and decision making]
3) Women’s Questionnaire [the questionnaire was designed to capture women’s perspective about some specific issues which included division of labour; sources of water, women’s mobility, cooking places and type of fuel used for cooking; women’s education; children’s schooling; health, awareness about bio-gas; decision making; livestock management, and hygienic conditions of the house]
4) Women’s FGD Checklist [awareness, perceptions and willingness regarding bio-gas; women’s mobility; decision making; empowerment; and possibility of women’s involvement in promoting bio-gas in the area]
2.1.2 Sampling Methodology
As suggested in the ToRs, the survey was conducted in Faisalabad and Vehari districts of the Punjab province. Faisalabad was the intervention group while Vehari the control group for the study, again based on RSPN requirements as outlined in the TORs.
A total of 21 villages were surveyed in the baseline study. 8 villages in Samundri and 7 in Jaranwala Teshils of District Faisalabad were randomly selected for the survey as the intervention group (project focus group), whereas 6 villages from Vehari Tehsil were randomly surveyed as the control group. The sampled villages of Faisalabad district were located on an average distance of 16 km from their respective tehsils, while the average distance of the sampled villages of Vehari from the nearest main town was 9 km.
2.1.2.1 Sample Size
Considering the time and cost limitations, about 20 randomly selected HHs from each sampled village were considered representative of the Samundari and Jaranwal Teshils and sufficient to provide valid estimates of the desired indicators, thus at 95% confidence level and around confidence interval of 6, a sample of 300 HHs from the two teshils of Faisalabad district and 120 HHs from Vehari district were interviewed.
Placed below is the formulas used in our Sample Size Calculation. Sample Size
ss = Z 2 * (p) * (1-p)
c 2 Where: Z = Z value (1.96 for 95% confidence level) p = percentage picking a choice, expressed as decimal (.5 used for sample size needed) c = confidence interval, expressed as decimal (.06 = ±6)
P a g e | 4

EUDBA Survey Report, 2009
P a g e | 5
Two-stage sampling method was used in the survey. At the first stage the required sample of villages was randomly selected while in the second stage eligible HHs were selected for the HH survey.
2.2 Study Methodology
2.2.1 Planning Meeting with Client
Although the ToRs broadly explained the scope of work, yet before starting work on the afore-said tasks, mentioned in ToRs as well, a planning meeting with the client was held. In the meeting the consultants shared their planning with RSPN. It helped both the parties get a better understanding of the assignment.
2.2.2 Development/Pre-testing/Finalization of Information Collection Tools
After the meeting with the RSPN team, SEBCON developed the survey data collection tools which included two household questionnaires (household questionnaire and women’s questionnaire), village profile checklist and the checklist for the Women’s Focus Group Discussions. The women’s FGD checklist was prepared at RSPN. These draft tools were shared with the RSPN team and management to get their feedback. The approved questionnaires and checklists were finalized after pre-testing.
2.2.3 Hiring and Training of Enumerators
Two teams comprising five members each (two males and three females) were hired for the HH survey. The minimum academic qualification of graduation and previous experience of survey, especially in similar cultural and geographical communities were given preference in the selection of the field teams. However, for maximal output, a training session was conducted for the enumerators’ team. A survey guide was developed and fine tuned which directed the team throughout the survey and provided basic information and instructions.
2.2.4 Field Survey
The field survey was directed and guided by a plan shared and submitted to the RSPN prior to the deployment of the team. One village was covered by one team daily, besides development of the village profile.
2.2.4.1 Steps for Selection of Sampled Villages and Households:
1) 15 villages (8 from Samundri & 7 from Jaranwala Tehsils) form the Faisalabad district villages list, and 6 villages from Vehari district list were randomly selected using the list of villages available on the Website of the Faisalabad District Government and 1998 Census Report of Vehari District. Before the household survey, it was ensured through phone calls and physical visits to the selected villages before the field survey that these villages do not, currently or in the near future, have access to sui-gas.

EUDBA Survey Report, 2009
P a g e | 6
2) In each selected village, with the help of the villagers, a sample of 20 eligible HHs (who have two or more buffaloes/cows/large ruminants) was randomly picked for the HH survey.
3) In each sampled household, both household and women’s questionnaires were filled.
Table A: List of Sampled Villages and # of HHs Covered in the Survey
District Tehsil/Vilalge Houshold Questionnaire
Women Questionnaire
Village Profile Women FGD
Fais
alab
ad
Jaranwala Chak 030 GB 20 20 1 0 Chak 064 GB 20 20 1 0 Chak 067 RB 20 19 1 1 Chak 101 GB 20 20 1 1 Chak 105 RB 20 20 1 0 Chak 280 GB 20 20 1 1 Chak 626 GB 20 20 1 1 Total 140 139 7 4 Samundari Chak 048 GB 20 20 1 1 Chak 168 GB 20 20 1 0 Chak 172 GB 20 20 1 1 chak 206 GB 20 19 1 0 Chak 445 GB 20 20 1 1 Chak 475 GB 20 20 1 0 Chak 485 GB 20 19 1 0 Chak 527 GB 20 20 1 0 Total 160 158 8 3
Veha
ri
Vehari Chak 005 WB 20 20 1 0 Chak 053 WB 20 20 1 1 Chak 075 WB 21 20 1 0 Chak 097 WB 19 20 1 0 Chak 216 EB 20 20 1 1 Chak 228 EB 20 19 1 1 Total 120 119 6 3 Total 420 416 21 10
2.2.4.2 Women’s FGDs
In every second sampled village, Women’s FGDs were conducted by SEBCON’s gender experts/Survey Team Leaders with an average of eight women per FGD.
2.2.5 Quality Assurance
The Field Team Supervisor rechecked and reviewed all the questionnaires before leaving the villages to ensure accuracy and quality of the data collected. SEBCON’s monitoring expert also joined the survey team in their first day field work and oversaw the field consultation process. A

EUDBA Survey Report, 2009
P a g e | 7
review meeting was held on the completion of the first day field work in order to ensure that all the survey teams understood the questionnaire perfectly and carried out the HH interviews according to the survey guidelines.
2.2.6 Data Entry/Cleaning/Processing
SEBCON has an in-house data entry staff and the required data entry hardware. The data analyst supervised data entry and carried out data cleaning by using different tests like range tests, etc., to ensure accuracy of data.
2.2.7 Report Writing (First Draft)
A draft report has been developed on an agreed format highlighting the major findings of the baseline survey. The report follows the format indicated in the ToRs. The draft will be shared with the RSPN to get their feedback and comments, which will be incorporated in the Final Draft.
2.2.8 Final Report
After the feedback and comments of the client, the required changes will be made to the report and a final version of the assessment report will be submitted to the RSPN. Baseline survey material and filled questionnaires will be submitted to the client once they have accepted the Final Report.

EUDBA Survey Report, 2009
P a g e | 8
3 AREA PROFILE
A socio-economic profile of the surveyed areas has been drawn from primary data collected through key informants at the village level, providing us with information regarding the demographic and general social characteristics of the villages in the surveyed areas. The fact that there is a control group of 6 villages (in District Vehari) as well as a project focus/intervention group of 15 villages (in District Faisalabad) being covered by the survey, will allow interesting comparisons to be made with indicative results. This Area Profile has been based on information gathered at a village-level scale through a group of representatives of the community as a whole and do not necessarily reflect the characteristics at the household level. Supporting data on various indicators has also been extracted from the National Census Report 1998 and is attached as Annex 4
3.1 Sample Population
As reported by the respondents interviewed, in terms of number of households, the average number of total households per sample village in Distt. Faislabad is around 780 (600 for villages in Jaranwala Tehsil, and 938 for Samundri Tehsil), and it is 633 households on average for Distt./Tehsil Vehari. Population-wise the average total population in the sample village including children is 5,926 for Distt. Faisalabad (4324 for Jaranwala and 7337 for Samundri), and 4950 for Vehari.
Table 3.1: Average # of HHs and Population in Sampled Villages
Description Project Focus Area: Faisalabad Control Area
Vehari Jaranwala Samundri Total Numbers
Houses 600 938 780 633 Population 4,314 7,337 5,926 4,950
Source: EUDBA Survey, Group Discussion
3.2 Facilities
3.2.1 Educational Facilities
Based on FGD findings, in terms of education in District Faisalabad, there are separate primary schools for girls and boys in 86.7% of the communities, and a co-education primary school in 53.3% of the communities. There is no middle school for boys in any of the communities, while there is a middle school for girls in 53.3%, and a co-education middle school in 26.7% of the communities. There is a high school for boys in 40% of the communities, for girls in 13.3%, and a co-educational in 13.3% (only one village). Only 13.3% of the communities have a girl’s college and 6.7% a co-education college. There are no technical institutes for either girls or boys in any of the villages. (Source: EUDBA Survey, Group Discussion)
In District Vehari the figures are comparatively lower, with separate primary schools for girls and boys respectively in 16.7% and 33.3% of the communities, and a co-education primary school also in 16.7% of the communities. There is a middle school for boys in 50% of the communities, while there is a middle school for girls in 66.7%, and no co-educational middle schools in any

EUDBA Survey Report, 2009
P a g e | 9
community. 16.7% of the communities have separate high schools for boys and girls, and no co-educational ones. None of the communities have any girls or co-education colleges, and only 16.7% have technical institutes for girls and boys.
Table 3.2: Details of Educational Institutes in Villages
Types of Institutes
Project Focus Area: Faisalabad Control Area Vehari Jaranwala Samundari Total
Boys Girls Joint Boys Girls Joint Boys Girls Joint Boys Girls Joint Percentages
Primary 86 86 43 88 88 63 87 87 53 33 17 17Middle 0 57 14 0 50 38 0 53 27 50 67 0High 14 0 14 63 25 13 40 13 13 17 17 0College 0 0 0 0 25 13 0 13 7 0 0 0Technical/Vocational 0 0 0 0 0 0 0 0 0 0 0 17Number of Villages 7 8 15 6 Source: EUDBA Survey, Group Discussion
3.2.2 Other Facilities
Regarding availability of other services/facilities in the sampled villages, all the villages covered in both districts have access to electricity and shops. 20% on average per village have access to water supply (i.e. connections to the direct government water supply scheme) in Distt. Faisalabad, whereas this figure is 17% for Distt. Vehari, with the remaining relying on water from private sources such as wells or tube-wells, etc., (as detailed later on in section on Water Sources).
The average distance from the villages in Tehsil Jaranwala to the tehsil headquarters is 18KM, and the average distance to the district headquarters of Faisalabad is 33.3KM. The average distance for villages in Tehsil Samundri to tehsil and district headquarters is 14.6KM and 47.3KM respectively. Vehari being the tehsil as well as district headquarters, the average distance from the villages is 8.8KM.
.Table 3.3: Average Distance (KM) from Tehsil/District Headquarter
Description Project Focus Area: Faisalabad Control Area
Vehari Jaranwala Samundri Total KM
Tehsil Headquarter 18.0 14.6 16.2 8.8 District Headquarter 33.3 47.3 40.7 8.8
Source: EUDBA Survey, Group Discussion
Only 20% villages in Distt. Faisalabad have gas in the form of cylinders while none of the villages in Vehari have this facility. 80% of the villages in Distt. Faisalabad and 83% in Vehari have some sort of a drainage system in the villages and 63% villages in Faisalabad and 65% in Vehari have paved streets. 93% on average per village have paved roads in Distt. Faisalabad, whereas 100% have them in Distt. Vehari. 67% of the villages in both districts have telephone lines, while 87% of the villages around Faisalabad and 83% around Vehari have PCOs as well. 53% villages in Distt. Faisalabad and 33% in Vehari have post offices, while only 20% villages in Distt. Faisalabad have a bank. 47% and 33% of the villages in Faisalabad and Vehari

EUDBA Survey Report, 2009
P a g e | 10
respectively have hospitals. 33% of the villages in both districts have bus stops while none of the villages have any market/mandi or are near any major town.
Table 3.4: Available Services/Facilities
Type of Facility
Project Focus Area: Faisalabad Control Area Vehari Jaranwala Samundari Total
In Village
(%)
Distance (KM)
(Outside Village)
In Village
(%)
Distance (KM)
(Outside Village)
In Village
(%)
Distance (KM)
(Outside Village)
In Village
(%)
Distance (KM)
(Outside Village)
Hospital* 29 2.8 63 3.3 47 3.0 33 4.5Nearest town 0.0 11.8 0.0 10.8 0.0 11.2 0.0 7.3Market/Mandi 0.0 12.6 0.0 12.1 0.0 12.4 0.0 8.8PCO 71 10.0 100 0.0 87 10.0 83 3.0Post Office 57 3.3 50 6.3 53 5.0 33 7.3Bank 14 6.1 25 5.3 20 5.7 0 5.4Bus Stop 29 2.5 38 4.1 33 3.3 33 1.0Shops 100 0.0 100 0.0 100 0.0 100 0.0Paved Road 86 2.0 100 0.0 93 2.0 100 0.0Electricity 100 0.0 100 0.0 100 0.0 100 0.0Cylinder Gas 14 6.4 25 7.2 20 6.8 0 6.3Telephone 43 8.8 88 3.0 67 7.6 67 2.5% Street(Paved) 44 0.0 79 0.0 63 0.0 65 0.0Water Supply 14 2.0 25 3.8 20 3.3 17 7.5Drainage System 57 0.0 100 0.0 80 0.0 83 0.0# of Villages 7 8 15 6
* BHU/RHC/THQ/HDQ/MD/Private Hopital/Quake Source: EUDBA Survey, Group Discussion
3.3 Type of Houses
Type/construction of house is an important indicator for estimating economic status of the target area. The most common type of house construction is bricked with cement construction in both the districts (with an average of 67.8% houses in villages in Faisalabad and 52.5% in Vehari), followed by mixed (19.9% on average in Faisalabad and 37.5% in Vehari), and bricked with mud (12.5% in Faisalabad and 10% in Vehari).
Table 3.5: Type of House Construction
Description Project Focus Area: Faisalabad Control Area
Vehari Jaranwala Samundri Total Percentages
Bricked/Mud 8 17 13 10Bricked/Cement 63 72 68 53Mixed 29 12 20 38Total 100 100 100 100
Source: EUDBA Survey, Group Discussion

EUDBA Survey Report, 2009
3.4 Water Sources
Hand-pumps are the main source of water for 69.3% of houses on average in the villages in Distt. Faisalabad, followed by electric pumps in 24% of the houses on average, while none of the houses in Tehsil Jaranwala have access to piped water and only 12.5% have access in Tehsil Samundri. In Vehari, 69.2% of the households in the villages on average use electric pumps as their main source of water, followed by hand-pumps by 17.5%, and piped water by 13.3%.
Table 3.6: Water Sources (% of house)
Source Project Focus Area: Faisalabad Control Area
Vehari Jaranwala Samundri Total Percentages
Hand pump 74 65 69 18 Piped Water 0 13 7 13 Electric Pump 26 23 24 69 Total 100 100 100 100
Source: EUDBA Survey, Group Discussion
3.5 Livestock
Villages in Distt. Faisalabad have an average of 554 households having 2 or more large ruminants (an average of 364 for villages in Jaranwala and 743 in Samundri), whereas Vehari has an average of 326 households.
6179
52
0102030405060708090100
Jaranwala Samundari Vehari
% of HHs Have => 2 Large Ruminants
In terms of the average number of livestock in the sampled villages, Tehsil Samundri relatively has higher averages for almost all categories of animals in the villages than Tehsil Jaranwala (see Table 3.7). The average number of bulls/ox in the villages in Distt. Faisalabad is around 307 (an average of 312 in villages in Jaranwala, and 302 in Samundri), compared to an average
P a g e | 11

EUDBA Survey Report, 2009
P a g e | 12
of 203 in Vehari. The average number of buffalos is 2183 in Distt. Faisalabad (1050 in Jaranwala and 3175 in Samundri), compared to 1267 in Vehari. The average number of cows is 372 in Distt. Faisalabad (129 in Jaranwala and 585 in Samundri), and it is 265 in Vehari. The average for sheep/goats is 2347 in Distt. Faisalabad (973 in Jaranwala and 3550 in Samundri), whereas it is 1108 in Vehari.
Table 3.7: Average Number of Livestock Per Sampled Village
Type of Animal Project Focus Area: Faisalabad Control Area
Vehari Jaranwala Samundri Total Numbers
Bull/Ox Adult 124 116 120 80 Bull/Ox Young 188 186 187 123
Bull/Ox Total 312 302 307 203 Buffalo Adult 650 1,963 1,350 867 Buffalo Young 400 1,213 833 400
Buffalo Total 1,050 3,175 2,183 1,267 Cow Adult 59 370 225 162 Cow Young 71 215 148 103
Cow Total 129 585 372 265 Sheep/Goat Adult 429 1,744 1,130 567 Sheep/Goat Young 544 1,806 1,217 542
Sheep/Goat Total 973 3,550 2,347 1,108 Horse Adult 2 10 7 9 Horse Young 3 1 2 1
Horse Total 6 11 8 9 Donkey Adult 67 150 111 67 Donkey Young 109 70 88 30
Donkey Total 176 220 199 97 Source: EUDBA Survey, Group Discussion
3.6 Economic & Community Groups
Majority of the working male population in the surveyed villages belongs to agriculture and livestock related professions/occupations, with an average of 67% for Distt. Faisalabad and 75% for Vehari, followed by ‘employment’ (Govt and private) for Faisalabad (14%) and ‘unskilled worker/daily wager’ for Vehari (13%). The FGD results indicate that 15% of the female population is involved in agriculture and livestock related work and similarly 15% female are worked as daily wager.

EUDBA Survey Report, 2009
Table 3.8: Major Economic Groups of the Village
Economic Groups
Project Focus Area: Faisalabad Control Area
Vehari Jaranwala Samundri Total
Percentages (multiple response)
Tota
l
Mal
e
Fem
ale
Tota
l
Mal
e
Fem
ale
Tota
l
Mal
e
Fem
ale
Tota
l
Mal
e
Fem
ale
Agriculture/Livestock 69.3 56.6 12.7 65.0 44.2 20.8 67.0 50.6 16.4 75.2 65.1 10.0Unskilled Worker 11.6 9.0 2.5 10.1 8.1 2.0 10.8 8.5 2.3 12.5 7.9 4.6 Construction related Skills 4.0 4.0 0.0 3.4 3.4 0.0 3.7 3.7 0.0 1.4 1.4 0.0 Overseas 0.4 0.4 0.7 0.7 0.5 0.5 0.9 0.9 Employment 12.4 12.0 0.4 14.8 14.2 0.5 13.6 13.2 0.4 5.2 4.6 0.6 Self Employee 4.1 4.0 0.0 4.6 4.6 0.0 4.3 4.3 0.0 2.3 2.3 0.0
Source: EUDBA Survey, Group Discussion
Distt. Faisalabad has a higher number of community organizations functional in the villages than Distt. Vehari. Political groups (in 40% of the villages covered) are the most popular followed by CCBs/CBOs and religious groups (both in 33% villages). Distt. Vehari only has religious groups functioning in 50% of the villages, followed by CCBs/CBOs in 16.7% of the villages.
In Distt. Faisalabad, political groups followed by religious groups and CCBs, are the most popular forums in priority order at which the male villagers generally discuss community-level issues. In Vehari, religious forums are the most commonly used platform followed by CCBs.
The most popular source of information for communities in Distt. Faisalabad is television (for 100% of communities), followed by newspaper (73.33%), and radio (66.67%). Television is the most popular for 100% of the communities in Vehari as well, followed by radio (83.33%), and newspaper (66.67%).
3.7 Energy Sources
All fifteen villages covered in Distt. Faisalabad have access to/availability of dung cakes within their village as a source for fuel (mainly for cooking and heating) and none have access to bio-gas as an energy source. The second most accessible energy source is electricity (used for lighting), with 14 villages having electricity in households. Third was kerosene oil (10 villages), followed by firewood (9 villages). Only four villages have access to Liquid Petroleum Gas (LPG) within their villages, while three have access to crop residue and grass as an alternate energy source, and coal is not available within any of the villages.
P a g e | 13

EUDBA Survey Report, 2009
0%
20%
40%
60%
80%
100%
Fire wood Dung cakes
Coal Kerosene Oil
electricity Liquid Petroleum
Gas
Bio-Gas
Fuel Availability inside the Village
Fasialabad Vehari
In Distt. Vehari, all six villages have access to dung cakes (for cooking and heating) and electricity (for lighting) as an available energy source within their villages, followed by kerosene oil available at five of the villages. Only one village has access to fire wood within the vicinity, while none of the villages have crop residue/grass, coal, LPG, or bio-gas available within their villages as an alternate energy source.
For fuel sources accessible outside the villages in Distt. Faisalabad, the average distance travelled is 2.92 KM for fire wood, 8.40KM for coal, 8KM for kerosene oil, and 6.50KM for LPG. For fuel sources accessible outside the villages in Distt. Vehari, the average distance travelled is 4KM for fire wood, 6KM for coal, and 6.33KM for LPG.
Table 3.9: Average Distance Travelled to Access Fuel (Villages where fuel not available in the village)
Type of Fuel Project Focus Area: Faisalabad Control Area
Vehari Jaranwala Samundri Total KM
Fire wood 3.13 2.50 2.92 4.00 Coal 3.00 9.75 8.40 6.00 Kerosene Oil 3 13 8 . Liquid Petroleum Gas 6.42 6.60 6.50 6.33
Source: EUDBA Survey, Group Discussion
The average prices in Distt. Faisalabad for the various fuel sources are Rs.231.3/maund (1 maund = 40 kg) for firewood, just under Rs.1 per dung cake, almost Rs.21.7/kg for coal, Rs.67.9/litre for kerosene oil, Rs.5.6/unit for electricity, and Rs.74.7/kg for LPG.
The average prices in Distt. Vehari are comparatively higher for the various fuel sources, with Rs.279.2/maund for firewood, just under Rs.1 per dung cake, Rs.22/kg for coal, Rs.74/litre for kerosene oil, Rs.7/unit for electricity, and Rs.83/kg for LPG.
P a g e | 14

EUDBA Survey Report, 2009
Table 3.10: Average Price* of Fuel (Villages where fuel not available in the village)
Type of Fuel Project Focus Area: Faisalabad Control Area
Vehari Jaranwala Samundri Total Rs
Fire wood (Rs/Maund**) 245.7 218.8 231.3 279.2 Crop residue/grass (Rs/Kg) . . . . Dung cakes (Rs/#) 0.9 0.9 0.9 0.9 Coal (Rs/Kg) 20.0 22.5 21.7 22.0 Kerosene Oil (Rs/Liters) 68.0 67.9 67.9 74.0 Electricity (Rs/Units) 5.4 5.8 5.6 7.0 Liquid Petroleum Gas (Rs/Kg) 72.3 77.1 74.7 83.0
Source: EUDBA Survey, Group Discussion *Average of prices at the time of survey October 2009 **1 Maund = 40KG
3.8 Awareness about Bio-gas and willingness to opt Bio-gas
There is quite a high level of awareness about bio-gas as an alternate source of energy in both the villages, with 73.3% of the villages aware in Distt. Faisalabad and 66.7% of the villages in Distt. Vehari. 45.5% of those aware of bio-gas in Faisalabad district had heard about it from friends, relatives and other villagers, while the figure for the same category stood at 50% for villages in Vehari, while 25% in the area had also heard about bio-gas through NGOs/projects. Whether anybody had tried to obtain information regarding establishment of bio-gas at the domestic level, person(s) in only 33.3% of the villages had tried in Faisalabad, while the figure is even lower for villages in Vehari with 16.7%.
71 75 67
0102030405060708090
100
Jaranwala Samundari Vehari
Awareness about Bio-gas
Only one villager from the communities covered by the village profile survey in Distt. Faisalabad and one in Vehari have tried to establish a bio-gas plant. The major reason cited for not being able to establish more bio-gas plants include lack of sufficient information to help make a decision (according to 43% of the village in Faisalabad district, and 40% in Vehari).
However, the majority of male FGD respondents in both districts (80% in Faisalabad, and 83% in Vehari) are of the opinion that communities with livestock would like to opt for bio-gas as an alternate source of energy. However, the HH survey response was slightly different from the FGDs findings. About 70% male respondents in both districts were willing to opt for bio-gas as an alternate source of energy while 57% women in district Faisalabad and 54% in district Vehari were in favor of this option.
P a g e | 15
EUDBA Survey Report, 2009
P a g e | 16
3.9 Access to Credit
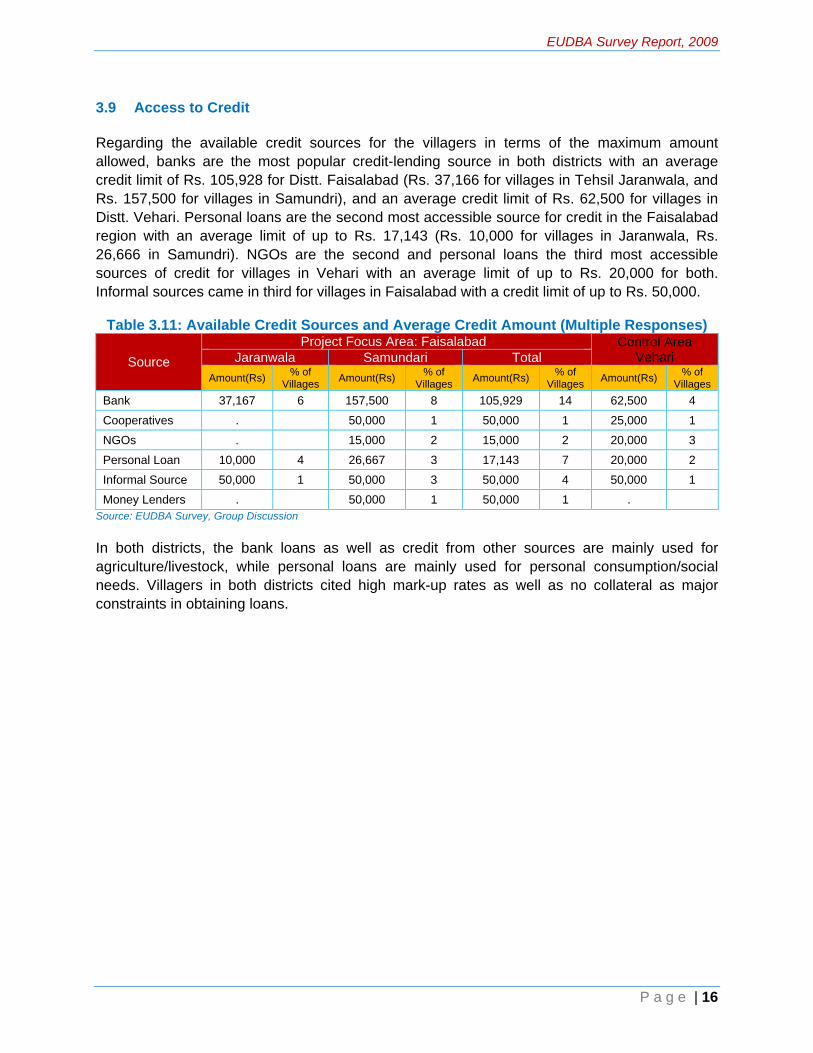
Regarding the available credit sources for the villagers in terms of the maximum amount allowed, banks are the most popular credit-lending source in both districts with an average credit limit of Rs. 105,928 for Distt. Faisalabad (Rs. 37,166 for villages in Tehsil Jaranwala, and Rs. 157,500 for villages in Samundri), and an average credit limit of Rs. 62,500 for villages in Distt. Vehari. Personal loans are the second most accessible source for credit in the Faisalabad region with an average limit of up to Rs. 17,143 (Rs. 10,000 for villages in Jaranwala, Rs. 26,666 in Samundri). NGOs are the second and personal loans the third most accessible sources of credit for villages in Vehari with an average limit of up to Rs. 20,000 for both. Informal sources came in third for villages in Faisalabad with a credit limit of up to Rs. 50,000.
Table 3.11: Available Credit Sources and Average Credit Amount (Multiple Responses)
Source Project Focus Area: Faisalabad Control Area
Vehari Jaranwala Samundari Total Amount(Rs) % of
Villages Amount(Rs) % of Villages Amount(Rs) % of
Villages Amount(Rs) % of Villages
Bank 37,167 6 157,500 8 105,929 14 62,500 4 Cooperatives . 50,000 1 50,000 1 25,000 1 NGOs . 15,000 2 15,000 2 20,000 3 Personal Loan 10,000 4 26,667 3 17,143 7 20,000 2 Informal Source 50,000 1 50,000 3 50,000 4 50,000 1 Money Lenders . 50,000 1 50,000 1 .
Source: EUDBA Survey, Group Discussion
In both districts, the bank loans as well as credit from other sources are mainly used for agriculture/livestock, while personal loans are mainly used for personal consumption/social needs. Villagers in both districts cited high mark-up rates as well as no collateral as major constraints in obtaining loans.

EUDBA Survey Report, 2009
P a g e | 17
4 HOUSEHOLD SURVEY FINDINGS
In addition to the Village Profile of both districts, a survey was conducted for a Baseline Assessment at the household (HH) level at each of the villages in the controlled group of six villages in Distt. Vehari as well as the intervention group of 15 villages across two tehsils (Jaranwala and Samundri) in Distt. Faisalabad. In each selected village, a list of all the eligible HHs (who have two or more buffalos/cows and have a bio-gas unit installed) was prepared with the help of the villagers. Using the HH list a sample of 20 HHs in each village was randomly picked for the HH survey, thus 300 HHs from Faisalabad district and 120 HHs from Vehari district were interviewed.
There were two components to the survey questionnaire – the general household questionnaire filled with responses from the male head of HH (HoHH), and the other a women’s questionnaire filled with responses from the spouse of the HoHH. Because of the different size and nature of the samples used in both the components of the survey, there may be variation in the responses to some of the indicators and it is not necessary they will reflect the exact same trends. The same will be the case when comparing the responses from this survey with the information gathered in the Area Profile, as the information has been collected from two different sources i.e. group interviews and individual interviews.
4.1 Characteristics of Respondents
4.1.1 Age of Respondents
43% of the general questionnaire interviewees in Faisalabad and 30% in Vehari were between the ages of 16 and 39, while 46% and 54% respectively in the 40-60 years age group, and 10% in Faisalabad and 16% in Vehari above the age of 60.
The figures from the women’s survey indicate that 68% and 71.4% of the respondents in Faisalabad and Vehari respectively were spouses of the HoHH. 48% of those interviewed in the area of Faisalabad were in the 16-39 age group, while 46.6 were in the 40-60 years age group. In Vehari, 43.7% were in the former age group, while 53% were in the latter.
4.1.2 Respondents Literacy Level
31% of the interviewees in Faisalabad district and 39% in Vehari are illiterate, 35% and 33% respectively have primary-level education, 24% and 18% have matric-level education, and 9% and 10% have education till intermediate level or above.
The level of education of the female respondents was worse with 55% in Faisalabad and 65.5% in Vehari district being illiterate, and only 29.4% and 26% having education up to primary level in each district respectively.

EUDBA Survey Report, 2009
P a g e | 18
4.1.3 Respondents Employment Levels
63% of the respondents were employed in District Faisalabad while the figure was 74% for Vehari, whereas according to the female respondents, 14.9% of the women were employed in District Faisalabad and 13.4% in Vehari.
4.2 Social Characteristics
This section will focus on the demographic and social characteristics of the households based on findings of the survey.
4.2.1 Household Type and Size
4.2.1.1 Family Size
The average family size in Distt. Faisalabad is 7.2 (with a 4.0 male and 3.2 female aspect), whereas it’s 6.8 for Vehari (3.6 male and 3.2 female).
4.2.1.2 Age
In Distt. Faisalabad 33% of the family members (32% male and 35% female) fall in the 21-40 years age group, 29% (30% male and 28% female) in the 10-20 years age group, 14% in the 41-60 years age group, 9% in the 5-9 years age group and 7% in the under-5 age group. Compared to this in Distt. Vehari, 33% of the family members (32% male and 35% female) fall in the 10-20 years age group, 30% (32% male and 29% female) in the 21-40 years age group, 16% in the 41-60 years age group, 12% in the 5-9 years age group and 4% in the under-5 age group.
4.2.1.3 Education
In terms of education levels of family members in the Faisalabad area, 28% (19% male and 39% female) family members aged 10 and above do not have any education, while 26% are educated up to primary-level (22% male and 30% female), 21% (26% male and 14% female) up to middle school, 15% (19% male and 10% female) up to matric, and 13% (13% male and 11% female) are educated up to intermediate level or above.
The situation in villages in Vehari is slightly better in some aspects. 27% (17% male and 38% female) family members aged 10 and above do not have any education, while 20% are educated up to primary-level (21% male and 19% female), 16% (17% male and 14% female) up to middle school, 22% (27% male and 15% female) up to matric, and 9% (13% male and 7% female) are educated up to intermediate level or above.
In terms of the highest level of education attained by a woman in each household, almost 26% of the households in the Faisalabad area stated primary-level, 20.5% stated matric, 14% stated middle-school, and almost 23% stated intermediate level or above as the highest level of education amongst the women in the household. For Vehari, the results are 31.5% stating primary-level, 21.3% stating middle, 13.5% stating matric, and just over 21% stating intermediate level or above as the highest level of education amongst the women in the

EUDBA Survey Report, 2009
P a g e | 19
household. None of the women are literate in 14% of the households in Faisalabad district, while this is the case in only 4.5% of the households in Vehari.
The average number of children going to school per household is around 2 for both Faisalabad and Vehari districts, and in response to whether all school-aged children in the household go to school, around 84% of the respondents in both the districts said yes.
Table 4.2: Family Profile
Characteristics Project Focus Area: Faisalabad Control Area
Vehari Jaranwala Samundari Total Male Female Total Male Female Total Male Female Total Male Female Total
A. POPULATION Average Family Size 3.9 3.2 7.0 4.2 3.2 7.4 4.0 3.2 7.2 3.6 3.1 6.8 Age Groups Less than 5 Years 5% 6% 6% 9% 9% 9% 7% 8% 7% 4% 4% 4% 5 to 9 Years 9% 13% 11% 9% 6% 8% 9% 9% 9% 11% 13% 12% 10 to 20 Years 31% 29% 30% 30% 28% 29% 30% 28% 29% 32% 35% 33% 21-40 Years 32% 31% 32% 32% 38% 35% 32% 35% 33% 32% 29% 30% 41-60 Years 15% 14% 15% 14% 13% 14% 15% 14% 14% 16% 16% 16% Above 60 Years 7% 7% 7% 5% 4% 4% 6% 5% 6% 6% 3% 5% Age not specified 0% 0% 0% 1% 1% 1% 1% 1% 1% 0% 0% 0%
Total 100% 100% 100% 100% 100% 100% 100% 100% 100% 100% 100% 100% B. EDUCATION (10 Years and Over) None 25% 48% 35% 14% 32% 22% 19% 39% 28% 17% 38% 27% Madrasa School 2% 2% 2% 2% 1% 1% 2% 1% 2% 3% 2% 2% Primary 21% 18% 20% 21% 20% 20% 21% 19% 20% 22% 30% 26% Middle 18% 15% 17% 16% 13% 15% 17% 14% 16% 26% 14% 21% Matric 22% 10% 16% 32% 20% 27% 27% 15% 22% 19% 10% 15% Intermediate/Diploma 7% 6% 7% 11% 8% 10% 9% 7% 9% 8% 4% 6% BA/BSc 3% 1% 2% 2% 4% 3% 2% 3% 3% 3% 2% 2% Post Graduate 2% 0% 1% 1% 2% 2% 2% 1% 1% 2% 1% 1% Professional 1% 0% 0% 0% 0% 0% 0% 0% 0% 0% 0% 0%
Total 100% 100% 100% 100% 100% 100% 100% 100% 100% 100% 100% 100% Currently Enrolled Students / Average hours/day spent on doing school work Primary 2.3 2.0 2.2 1.6 1.9 1.7 1.9 2.0 1.9 1.6 1.9 1.8 Middle 2.2 3.0 2.6 2.2 2.2 2.2 2.2 2.6 2.4 2.0 2.2 2.0 Matric 3.0 3.8 3.2 2.3 2.6 2.4 2.5 2.9 2.6 2.3 2.4 2.3 Intermediate/Diploma 4.0 3.6 3.9 3.5 3.1 3.3 3.7 3.2 3.4 3.3 2.5 2.9 BA/BSc 2.5 2.0 2.3 4.3 3.6 3.9 3.7 3.1 3.4 3.2 2.0 3.0 Post Graduate 1.0 . 1.0 1.0 2.7 2.3 1.0 2.7 2.0 . . . Professional 2.5 . 2.5 . . . 2.5 . 2.5 . . .
Source: EUDBA Survey, Household Survey

EUDBA Survey Report, 2009
P a g e | 20
4.2.1.4 Hours Spent by Children Doing School Work
The average number of hours children spend per day in the Faisalabad region on doing school work varies with the class level as follows: at the primary level it’s almost 2 hours, middle is almost 2½ hours, matric is just over 2½ hours, at intermediate/diploma/BA/BSc level it is almost 3½ hours, and post graduate is 2 hours. The average number of hours children spent per day in Vehari on doing school work is almost 2 hours at the primary level, middle is 2 hours, matric is 2.3 hours, at intermediate/diploma level it is almost 3 hours, and at BA/BSc level it’s 3 hours.
4.2.1.5 Division of Labour in the Household
According to the women’s responses in both districts (results being very similar), most of the domestic work is the women’s responsibility with the help of the female child in some cases, (such as cleaning of the house, cooking, washing utensils, caring for children, making dung cakes, and even helping the men out with the livestock). Moreover, the responsibility of cooking in the household goes to mainly the women in most cases across the two districts (71% in Faisalabad and 88% in Vehari).
The men mainly carry out the outside work with the help of the male child in some cases (agriculture and livestock care, wood collection & preparation, purchase of fuel, buying food, minor house repairs and other social activities).
Table 4.3a: Division of Labor in the HH (Primary Responsibility)
Activities
Project Focus Area: Faisalabad Control Area Vehari Jaranwala Samundari
Male Female Male Child
Female child Male Female Male
Child Female
child Male Female Male Child
Female child
Percentages Cleaning of House 1.4 93.5 0.0 20.1 0.0 94.9 0.0 18.5 0.0 95.0 0.0 11.8
Cooking 0.7 92.8 0.0 14.4 0.0 96.2 0.0 15.3 0.0 96.6 0.0 10.9
Washing Utensils 1.4 92.8 0.0 18.7 0.0 93.0 0.0 14.0 0.0 93.3 0.0 7.6
Making Dung Cakes 0.0 88.5 0.7 8.6 12.1 89.2 0.6 5.7 10.1 94.1 0.0 4.2
Purchase of Fuel 67.6 13.7 3.6 0.0 57.3 6.4 5.7 0.0 57.1 10.9 1.7 1.7
Caring for Children 13.7 74.8 0.0 2.2 7.0 71.3 0.6 4.5 4.2 70.6 0.8 0.8
Water Fetching 13.7 7.2 3.6 2.9 16.6 6.4 7.6 3.8 8.4 3.4 1.7 0.0
Livestock care 90.6 31.7 7.9 0.7 94.3 35.0 9.6 3.2 95.8 32.8 5.9 2.5
Agriculture 89.9 15.1 7.2 0.7 88.5 12.7 8.9 0.6 85.7 5.9 4.2 2.5
Social Activities 83.5 55.4 4.3 1.4 85.4 50.3 2.5 2.5 87.4 33.6 2.5 0.0
Educating Children 46.8 24.5 1.4 0.0 39.5 29.9 0.6 1.3 34.5 16.8 1.7 4.2
Buying Food 83.5 24.5 5.8 1.4 94.3 12.1 5.7 1.3 95.8 5.0 5.0 1.7
Minor House Repair 85.6 16.5 2.2 0.0 93.6 5.1 1.9 1.3 97.5 4.2 2.5 0.8
Wood Collection 87.8 10.1 5.8 0.7 93.0 5.7 9.6 1.3 89.9 8.4 4.2 0.8
Wood Preparation 89.9 15.8 6.5 0.7 94.9 7.0 8.9 0.6 89.9 9.2 4.2 0.8 Source: EUDBA Survey, Household Survey – Women Interview

EUDBA Survey Report, 2009
P a g e | 21
The results are very similar for both the districts in terms of the average number of hours spent on the various tasks identified. Cooking and cleaning the house took around 3.5 hours, while making dung cakes took just over an hour, as did caring for children. Comparatively, the men spent around 21/2 hours involved in agriculture or livestock, wood collection or preparation, and around an hour in buying food or social activities.
Female adults (at 96% and 95% of the households in Distts. Faisalabad and Vehari respectively) are responsible for the regular maintenance of cooking stoves, and in the case of LPG stoves, the women (62% in Faisalabad and 72% in Vehari) share the maintenance with the male adult members in the household (36% and 25% for Distts. Faisalabad and Vehari respectively).
Table 4.3b: Division of Labor in the HH (Average Time Spend)
Activities
Project Focus Area: Faisalabad Control Area Vehari Jaranwala Samundari
Male Female Male Child
Female child Male Female Male
Child Female
child Male Female Male Child
Female child
Average # of hours Daily Cleaning of House 0.0 1.6 0.0 0.2 0.0 1.4 0.0 0.2 0.0 1.6 0.0 0.2
Cooking 0.0 1.8 0.0 0.2 0.0 2.2 0.0 0.2 0.0 2.4 0.0 0.2
Washing Utensils 0.0 1.1 0.0 0.1 0.0 0.9 0.0 0.1 0.0 1.2 0.0 0.0
Making Dung Cakes 0.1 1.1 0.0 0.1 0.2 1.0 0.0 0.0 0.2 1.1 0.0 0.0
Purchase of Fuel 0.8 0.2 0.0 0.0 0.6 0.1 0.1 0.0 0.6 0.2 0.0 0.0
Caring for Children 0.1 1.1 0.0 0.0 0.1 1.1 0.0 0.0 0.0 1.0 0.0 0.0
Water Fetching 0.1 0.2 0.0 0.0 0.2 0.1 0.0 0.0 0.4 0.1 0.0 0.0
Livestock care 2.4 0.9 0.3 0.0 2.5 0.7 0.2 0.0 2.8 0.8 0.1 0.0
Agriculture 2.3 0.5 0.3 0.0 2.9 0.2 0.3 0.0 3.1 0.2 0.1 0.0
Social Activities 1.0 0.6 0.0 0.0 0.9 0.4 0.0 0.0 1.1 0.4 0.0 0.0
Educating Children 0.4 0.2 0.0 0.0 0.4 0.4 0.0 0.0 0.3 0.3 0.0 0.0
Buying Food 0.8 0.3 0.0 0.0 0.7 0.2 0.1 0.0 0.9 0.1 0.0 0.0
Minor House Repair 0.6 0.1 0.0 0.0 0.6 0.0 0.0 0.0 1.1 0.0 0.0 0.0
Wood Collection* 2.1 0.1 0.1 0.0 2.8 0.2 0.3 0.0 3.0 0.1 0.2 0.0
Wood Preparation* 1.6 0.1 0.1 0.0 2.0 0.1 0.1 0.0 2.0 0.0 0.1 0.0 * Average hours per week Source: EUDBA Survey, Household Survey – Women Interview
4.2.1.6 Women Mobility
In terms of mobility, majority of the women face few constraints and are quite free to move around for various purposes, and the women confirmed this in the FGDs as well. Of the total responses for Faisalabad district, just over 70% of women belonging to all the groups identified (married and unmarried) went out on a daily basis, while the figure is 75.4% for Vehari.
Work is the most common purpose for going out of the house with an average of 35% citing this as their main reason in Faisalabad, and 40% for Vehari. This is followed by over 29% in Faisalabad and almost 35% in Vehari claiming to go out for health treatment purposes (child and/or self), followed by 13.6% and 11.3% going out to purchase goods, and 13.4% for social obligations in Faisalabad and 18.2% for social calls in Vehari district. Relatives’ houses are the most popular destinations in both districts, followed by houses of other villagers, and shops within the villages.

EUDBA Survey Report, 2009
Table 4.4a: Women Mobility
Faisalabad Vehari Jaranwala Samundari Total
Mobility Mobility Mobility Mobility D
aily
Wee
kly
Mon
thly
Oth
er
Tota
l
Res
pons
es
Dai
ly
Wee
kly
Mon
thly
Oth
er
Tota
l
Res
pons
es
Dai
ly
Wee
kly
Mon
thly
Oth
er
Tota
l
Res
pons
es
Dai
ly
Wee
kly
Mon
thly
Oth
er
Tota
l
Res
pons
es
% % % %
GROUPS
Married Women Age >12 and <18 Years
61.3 6.5 32.3 0.0 100 31 50.0 19.0 31.0 0.0 100 42 54.8 13.7 31.5 0.0 100 73 40.0 28.0 32.0 0.0 100 25
Married Women Age >18 and < 40 Years
60.0 16.9 20.0 3.1 100 65 59.2 22.5 14.1 4.2 100 71 59.6 19.9 16.9 3.7 100 136 76.1 13.0 8.7 2.2 100 46
Married Women Age 40 Years and Above
74.1 8.6 17.3 0.0 100 81 75.6 7.3 14.6 2.4 100 72 74.8 8.0 16.0 1.2 100 163 79.7 5.1 15.3 0.0 100 59
Un-married Women Age > 12 and < 18 Years
73.3 11.1 13.3 2.2 100 45 88.5 1.9 9.6 0.0 100 52 81.4 6.2 11.3 1.0 100 97 84.4 6.3 6.3 3.1 100 32
Un-married Women Age 18 and < 40 Years
59.3 14.8 25.9 0.0 100 27 77.1 18.8 4.2 0.0 100 49 70.7 17.3 12.0 0.0 100 75 76.7 13.3 6.7 3.3 100 30
Un-married Women Age 40 years and above
100.0 0.0 0.0 0.0 100 9 100.0 0.0 0.0 0.0 100 15 100.0 0.0 0.0 0.0 100 24 100.0 0.0 0.0 0.0 100 11
Total 68.2 11.2 19.4 1.2 100 258 71.9 12.9 13.5 1.6 100 301 70.2 12.1 16.2 1.4 100 568 75.4 10.8 12.3 1.5 100 203 Source: EUDBA Survey, Household Survey – Women Interview
P a g e | 22

EUDBA Survey Report, 2009
P a g e | 23
Table 4.4b: Women Mobility - Place
Place Project Focus Area: Faisalabad Control Area
Vehari Jaranwala Samundri Total Percentages (Multiple Response)
Relatives house 39.69 48.20 44.31 54.85
Other villagers house 35.02 39.34 37.37 42.72
Shop in the village 21.40 20.33 20.82 24.27
Shop outside the village 5.84 12.79 9.61 9.22
Training center/school in the village 6.23 8.85 7.65 10.19
Training center/school outside the village 3.50 7.54 5.69 4.37
Outside the village any other purpose 12.45 6.89 9.43 6.31
All 19.07 18.03 18.51 14.56 Source: EUDBA Survey, Household Survey – Women Interview
Table 4.4b: Women Mobility Purpose
Purpose Project Focus Area: Faisalabad Control Area
Vehari Jaranwala Samundri Total Percentages (Multiple Response)
For work 35.32 35.29 35.30 40.39
Children health treatment 17.86 16.01 16.85 19.21
Self health treatment 11.51 12.75 12.19 15.76
Purchase of goods 11.51 15.36 13.62 11.33
Social obligations 11.11 15.36 13.44 15.76
Children school/education 7.54 13.07 10.57 11.33
Social calls 11.90 11.76 11.83 18.23
Leisure 0.79 0.65 0.72 0.99
Other 3.17 0.98 1.97 0.49
All 14.68 14.05 14.34 10.84 Source: EUDBA Survey, Household Survey – Women Interview
Most of the women in both districts are not accompanied by anybody when going out but sometimes are accompanied by either a young male member of the household or an adult male or the HoHH.
4.2.1.7 Decision Making
Regarding decision-making in the house, men dominate this aspect being the main decision-makers in most areas. In both Faisalabad and Vehari, around 86% of those surveyed (in both the general and women’s questionnaires) make the decisions regarding agriculture, and around 84% for livestock. Men also make the decisions about the purchase and sale of assets in around 79%/80% of the households. Decisions about children’s education are jointly made in 55% to 58% of the households in Faisalabad, and almost 50% of the households in Vehari district, followed by men making the decision in around 27% and 34% of the households in both the districts respectively.
Decisions about health are jointly made in 56.6% and 53% of the households in Faisalabad and Vehari districts respectively (59% and 54% in the women’s survey), followed by men deciding in 26% and 28% of the households respectively (24% and 30% in the women’s

EUDBA Survey Report, 2009
P a g e | 24
survey). Decisions regarding marriage also followed a similar story, with 60% in Faisalabad and 52% in Vehari making the decision jointly (62% and 54% in the women’s survey), whereas men decided in 19.5% and 22.7% of the households (18% and 20% in the women’s survey).
Men and women jointly make decisions regarding other social areas in 51.6% and 42.4% of the households in Faisalabad and Vehari (51% and 45% in the women’s survey), whereas 27.7% and 30.5% households respectively still have men making these decisions (28% and 32% in the women’s survey).
Table 4.5: Decision Making In the House
Issues Project Focus Area: Faisalabad Control Area
Vehari Jaranwala Samundri Total Percentages
AGRICULTURE Male's Decision 82.5 89.5 86.2 86.7 Females' Decision 0.7 0.0 0.3 0.9 Joint 10.2 7.2 8.6 3.5 Joint but more male domination 6.6 3.3 4.8 8.8
Total 100.0 100.0 100.0 100.0 LIVESTOCK RELATED Male's Decision 82.0 87.4 84.9 84.0 Females' Decision 0.7 0.0 0.3 1.7 Joint 10.8 8.8 9.7 4.2 Joint but more male domination 6.5 3.8 5.0 10.1
Total 100.0 100.0 100.0 100.0 PURCHASE OF ASSETS Male's Decision 77.0 82.4 79.7 79.8 Females' Decision 1.5 0.0 0.7 1.0 Joint 13.3 13.2 13.3 7.7 Joint but more male domination 8.1 4.4 6.3 11.5
Total 100.0 100.0 100.0 100.0 SALE OF ASSETS Male's Decision 78.4 82.4 80.4 78.4 Females' Decision 1.5 0.0 0.7 2.0 Joint 11.9 13.2 12.6 7.8 Joint but more male domination 8.2 4.4 6.3 11.8
Total 100.0 100.0 100.0 100.0 Source: EUDBA Survey, Household Survey
4.2.1.8 Health and Hygiene
According to the observations made by the interviewers in the women’s survey, overall cleanliness in the houses ranged from good to fair for majority of the houses surveyed in both the districts. The floor of the kitchen was clean in around two-thirds of the houses surveyed in both districts, but the walls and roof of the kitchen/cooking area at almost the same number of houses in both districts had black patches built up and only around a third were clean. The

EUDBA Survey Report, 2009
P a g e | 25
cooking pans/pots that could be seen were clean for over 40% of the houses surveyed in both districts.
Regarding the health of women involved in cooking in the households, the health status ranged from good to fair in both districts (52% good and 25% fair in Faisalabad, and 52% good and 17% fair in Vehari). The majority had not faced any health problems in the last 15 days (64% in the Faisalabad region, and 76% in Vehari according to the women’s survey, and 71% and 75% according to the general survey results), or in the last 3 months (76% in Faisalabad and 86% in Vehari according to the women’s survey, and according to the general survey, 80% and 88%). The women who had faced health problems mainly complained about cold/cough/respiratory infections over the last 15 days and the last 3 months, indicating the possible health hazards being caused by smoke from burning firewood.
Table 4.6: General Health Status of the Women who normally Cooks Food
Health Status* Project Focus Area: Faisalabad Control Area
Vehari Jaranwala Samundri Total Percentages
Very Good 8.6 7.5 8.0 11.7
Good 47.9 55.0 51.7 52.5
Fair 23.6 26.3 25.0 16.7
Poor 9.3 2.5 5.7 6.7
Not specified 10.7 8.8 9.7 12.5 Total 100.0 100.0 100.0 100.0 Source: EUDBA Survey, Household Survey *Very Good: Never fell ill during last one year Good: Very rare illness but not requiring special treatment Fair: Fell ill a few times last one year but not of a serious nature Poor: Frequently fell ill
4.2.1.9 Water Availability
Drinking water is available inside the house in 80% and 97% of the houses in Faisalabad and Vehari districts, and water for other purposes is also available inside the houses in 98% and 100% of the houses in both districts respectively.
Table 4.7: Water Availability inside the House
Purpose Project Focus Area: Faisalabad Control Area
Vehari Jaranwala Samundari Total % # % # % # % #
Drinking Yes 88 123 73 116 80 239 97 116No 12 17 27 43 20 60 3 4
Total 100 140 100 159 100 299 100 120Other Purpose Yes 98 136 97 155 98 291 100 119No 2 3 3 4 2 7 0 0
Total 100 139 100 159 100 298 100 119Source: EUDBA Survey, Household Survey In order to fetch water, the closest water source is at an average distance 2.1km from houses in Fasialabad Distt., whereas it is at a distance of 0.5km in Vehari. The average time taken for a round trip is around 27mins for Faisalabad Distt., whereas it is 20mins for Distt. Vehari.

EUDBA Survey Report, 2009
P a g e | 26
4.3

EUDBA Survey Report, 2009
P a g e | 27
Economic Characteristics
This section will focus on the economic characteristics of the households based on findings of the survey.
4.3.1 Household Monthly Income & Expenditure
The total monthly ad is Breaking this down int me and ind/consum tal cash income of Rs. 15,7 nstitutes 6 the total monthly income, whereas the remainder is total income in-kind/consumed am a t l of R . Sa f m esto con 5%
), and sale of ani v 6%).
i, the to n av e 6,306 akcash inco a me in- /c ed, tota sh e of Rs 8,
itutes 69% of th m incom he e rem r tota eind/consumed amounting to a total of Rs. 8,081. Sale of milk from livestock contribu 4%
otal monthly incom e, follo b rm sou s ( agricul /cr), and sale of anim ve 6%).
Table 4.8: Household Average Monthly In e (
income per h stt. Faisalabousehold on average for Di Rs. 23,815. o cash inco income in-k ed, to
16 co 6% ofounting to ota s. 8,098 le o ilk from liv ck tributes 3 of
the total monthly income on average, followed by off-farm sources (34%), agriculture/crops (26% mals/li estock (
For Distt. Vehar tal monthly income per household o erag is Rs. 2 . Bre ing this down into me nd inco kind onsum l ca incom . 1 225 const e total onthly e, w reas th ainde 31% is l incom in-k tes 4 of the t e
a on averag wed y off-fa rce 32%), ture ops
(17% ls/li stock (
com Rs)
Source of income Proje cu Faisalact Fo s Area: bad Con retrol A a
Vehari Jaranwala S amundari Total Income % Income % Income % Income %
Cash Income Off-farm 5 35% 4 5,287 35% ,583 5,44 35% 6,519 36%Livestock - Sale of Milk 5,047 33% 3,832 24% 4,406 28% 7,234 40%Livestock Sale of Animals 1,033 7% 1,284 8% 1,166 7% 1,240 7%Agriculture-Crop 3,954 26% 5,341 33% 4,700 30% 3,233 18%
Total 15,320 100% 16,040 100% 15,716 100% 18,225 100%In Kind/Consumed Off-farm 1,341 21% 3,628 38% 2,561 32% 1,996 25%Livestock - Sale of Milk 3,581 55% 4,377 46% 4,004 49% 4,470 55%Livestock Sale of Animals 101 2% 200 2% 154 2% 417 5%Agriculture-Crop 1,494 23% 1,278 13% 1,379 17% 1,199 15%
Total 6,517 100% 9,482 100% 8,098 100% 8,081 100%Total Cash +In Kind Off-farm 6,627 30% 9,211 36% 8,005 34% 8,514 32%Livestock - Sale of Milk 8,627 40% 8,208 32% 8,410 35% 11,703 44%Livestock Sale of Animals 1,134 5% 1,484 6% 1,320 6% 1,656 6%Agriculture-Crop 5,448 25% 6,619 26% 6,079 26% 4,432 17%
Total 21,837 100% 25,522 100% 23,815 100% 26,306 100%Source: EUDBA Survey, Household Survey
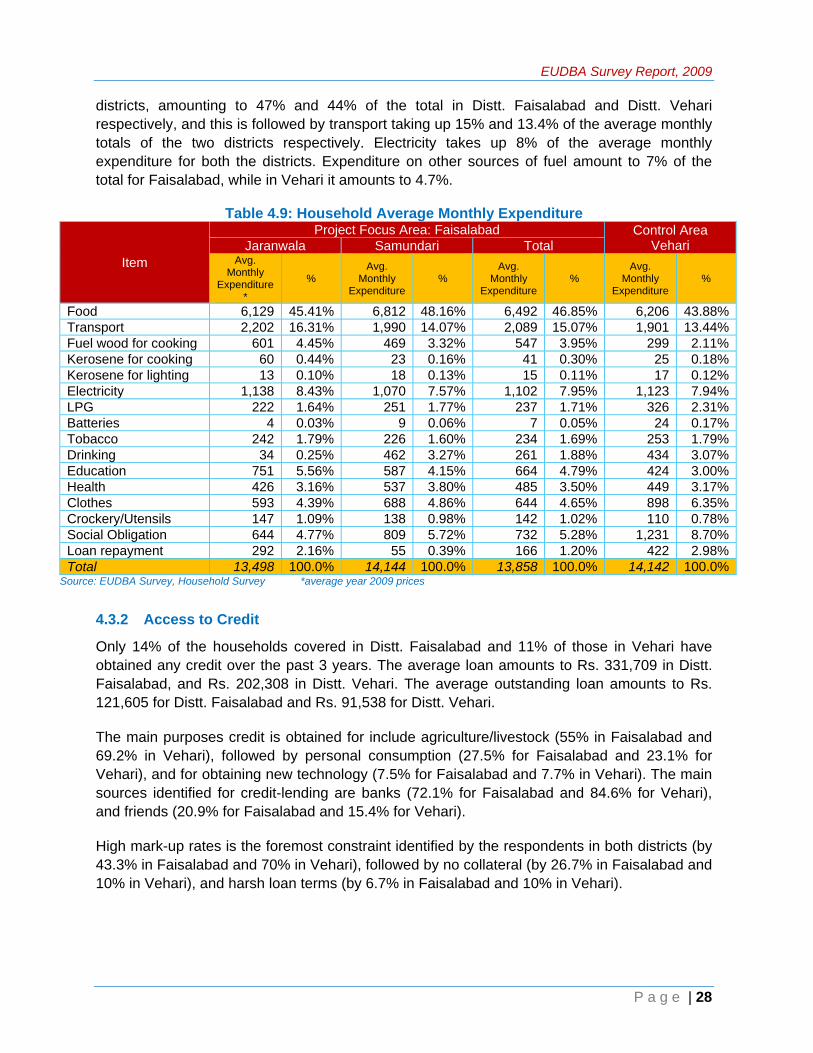
The total average monthly expenditure is Rs.13,858 for Faisalabad, and it is Rs.14,142 for Vehari. Food constitutes the largest proportion of average monthly expenditure for both
EUDBA Survey Report, 2009
P a g e | 28
district ehari respectively, and this is followed by 3.4% of th nthly totals of istricts re Ele es up of the av monthly expenditure for both the distric Expenditure on other sources of fuel amount to 7% of the
Faisalabad, while in Veh ri it am unts 4.7%
Table 4.9: Household Average Monthly Expenditure
s, amounting to 47% and 44% of the total in Distt. Faisalabad and Distt. Vtransport taking up 15% and 1 e average mo
the two d spectively. ctricity tak 8% erage ts.
total for a o to .
Item
Proje us Area: Faisalabadct Foc Control Area Vehari J ala aranw Samundari Total
Avg. Monthly
Expenditure*
% Avg.
Monthly Expenditure
% Avg.
Monthly Expenditure
% Avg.
Monthly Expenditure
%
Food 6,129 45.41% 1 492 .85% 6,206 .88% 6,812 48. 6% 6, 46 43Tran 2,202 16.31% 4.0 089 .07% 1,901 .44%sport 1,990 1 7% 2, 15 13Fuel g 601 4.45% 469 3.3 547 .95% 299 wood for cookin 2% 3 2.11%Kero g 60 0.44% 23 0.1 41 .30% 25sene for cookin 6% 0 0.18%Kero 0.10% 18 0 1 .11% sene for lighting 13 .13% 5 0 17 0.12%Elec 1,138 1,070 7.57% 1,102 7.95% 1,123 7.94%tricity 8.43%LPG 222 1.64% 251 1. 237 .71% 32 77% 1 6 2.31%Batte 4 0.03% 9 0. 7 .05% 2ries 06% 0 4 0.17%Toba 1.79% 226 1.6 234 .69% 253cco 242 0% 1 1.79%Drink 34 0.25% 462 3.2 261 .88% 43ing 7% 1 4 3.07%Educ 5.56% 587 4 664 .79% 4ation 751 .15% 4 24 3.00%Health 426 3. 537 3 48 .50% 416% .80% 5 3 49 3.17%Clothes 593 4.39% 688 4.86% 644 4.65% 898 6.35%Crockery/Utensils 147 1.09% 138 0.98% 142 1.02% 110 0.78%Social Obligation 644 4.77% 809 5.72% 732 5.28% 1,231 8.70%Loan repayment 292 2.16% 55 0.39% 166 1.20% 422 2.98%Total 13,498 100.0% 14,144 100.0% 13,858 100.0% 14,142 100.0%
Source
4.3.2 Ac
Only 14% of the households cove 11% of those e obta it over thFaisalabad, and Rs. 2 i e e s n1 istt. Faisalabad and Rs. 91,538 for Dis
The main p d ed for include agriculture/livestock (55% in Faisalabad and 69.2% in Vehari), followed by personal consum 23.1% for Vehari), and for obtaining w no y ( % Fa bad and 7.7% in Vehari). The main sources identified for credit-lending 72.1% for Fa lab nd 84.6% for haand friends (20.9% for Faisalabad a r a
High mark-up rates is the rem t c tra ed the respondents in both districts (by 43.3% in Faisalabad and % in eh , fo ed no lla l (b 6.7% in Faisalabad and 10% in Vehari), and harsh loan terms (by 6.7% in Faisalabad a 10 in V ari)
: EUDBA Survey, Household Survey *average year 2009 prices
cess to Credit
red in Distt. Faisalabad and in Vehari havined any cred e past 3 years. The average loan amounts to Rs. 331,709 in Distt.
02,308 in D stt. V hari. The averag out tanding loa amounts to Rs. 21,605 for D tt. Vehari.
urposes cre it is obtainption (27.5% for Faisalabad and
for ne tech log 7.5 isalaare banks ( isa ad a Ve ri),
nd 15.4% fo Veh ri).
fo os ons int identifi by 70 V ari) llow by co tera y 2
nd % eh .

EUDBA Survey Report, 2009
P a g e | 29
Table 4.10: Sources and Purpose of Credit Obtained by Sampled Households
Description Project Focus Area: Faisalabad Control Area
Vehari Jaranwala Samundari Total # % # % # % # %
Source Banks 21 70.0 10 76.9 31 72.1 11 84.6 NGOs 0 0.0 1 7.7 1 2.3 0 0.0 Friends 8 26.7 1 7.7 9 20.9 2 15.4 Money Lenders 1 3.3 1 7.7 2 4.7 0 0.0
Total 30 100.0 13 100.0 43 100.0 13 100.0 Purpose Personal Consumption 8 29.6 3 23.1 11 27.5 3 23.1 Agriculture/Livestock 14 51.9 8 61.5 22 55.0 9 69.2 Get new technology 2 7.4 1 7.7 3 7.5 1 7.7 To get off-grid technology 0 0.0 0 0.0 0 0.0 0 0.0 Social needs 1 3.7 1 7.7 2 5.0 0 0.0 Run a business 0 0.0 0 0.0 0 0.0 0 0.0 Other 2 7.4 0 0.0 2 5.0 0 0.0
Total 27 100.0 13 100.0 40 100.0 13 100.0 Constraints High Mark-up 8 44.4 5 41.7 13 43.3 7 70.0 No collateral 6 33.3 2 16.7 8 26.7 1 10.0 Cumbersome and long procedu .3 0 0.0 re 1 5.6 0 0.0 1 3Harsh loan terms .7 1 11 5.6 1 8.3 2 6 0.0 Other 2 11.1 3 0 14 33. 6 20. 1 0.0
Total 18 100.0 12 100.0 30 10 .0 0 10 100.0 Source: EUDBA Su urvey
ip nd 8 fem ) of fa m be ve
the age of 10 age of 60 (excludin do not work, 38 (54 ma an13% female) are either self-employed, have a ne ar olv n ul li17% are work d with the Government.
Tab d Place o ork ge b een -60 ear
rvey, Household S
4.3.2.1 OccupOccupation-wise in Faisalabad, 38% (10% mal
ation and Entrepreneurshe a 1% ale the mily em rs o r
and under the g students) % % le d busi ss or e inv ed i agric ture/ vestock,
ing in the private sector, and 7% are employe
le 4.11: Occupation an f W (A etw 10 Y s)
Characteristics Pro ocu a: labject F s Are Faisa ad Control Area
Vehari Jaranwala Sa darimun Total Male Female Total Male Female Total Male Female Total Male Female Total
Occupations Percentages (%) Govt. Servant 10 1 7 11 4 1 3 7 8 3 6 8 1 Private Service 32 3 20 21 3 2 3 17 18 2 11 Worker 14 6 Self employed* 15 34 12 1 38 48 59 41 54 3 64 6 40 No work 81 39 9 2 8 3 1 811 8 38 10 1 8 0 9 43
Total 100 100 100 100 100 100 100 100 100 100 100 100 Place of Work In village 71 96 73 68 81 8 71 7 8169 69 8 9 79 Outside village 27 4 25 25 9 12 25 2 19 21 25 26 0 0 Abroad 2 0 7 0 2 6 5 0 4 1 0 1
Total 100 100 100 100 100 100 100 100 100 100 100 100 * Business/Shop/Agriculture/Livestock Source: EUDBA
n bly diffe with 43% (10% male and 89% female) no work, 40% (64% male and 6% female) self-
Survey, Household Survey
The situatio for Vehari is not remarka rent household members having

EUDBA Survey Report, 2009
P a g e | 30
employed/business/agriculture/livestock, 11% working in the private sector, and 6% are Government servants.
In Distt. Faisalabad, 71% of those working did so within their villages, 25% work outside their villages, and 4% work abroad, whereas in Vehari 79% work within their villages, 20% outside their villages, and onl
The women in the villages are quite entrepreneurial according to the FGDs, involving themselves in decorating shoe erie overs a wls, making and selling dung cakes, etc.
and Size of the Hou
an important indicator for estimating economic status of the
Table 4 ouse
y 1% work abroad.
s, embroid s on bed c nd sha
4.3.2.2 Type se
Type/construction of house is also target area. The most common plot size for houses is the 5 to 10 marlas with 47% of the houses surveyed in Faisalabad based on a plot size within these dimensions, and 36% of those in Vehari. Bricked with cement is the most common type of construction base for the houses surveyed, with 53% in Faisalabad and 47% in Vehari, and the houses are mostly self-owned (87% in Faisalabad and 96% in Vehari).
.12: Characteristics of the H
Faisalabad Vehari Jaranwala Samundari Total
% # % # % # % #
Plot Size of the House
Up to 5 Marlas 21 30 16 56 13 16 26 19 Above 5 and up to 10 Marlas 43 60 50 47 140 36 43 80Above 10 and up to 15 Marlas 18 2 14 16 47 13 5 22 16Above 15 and up to 20 Marlas 13 1 17 15 45 24 8 27 29Above 20 Marlas 5 7 3 5 4 13 12 16
Total 100 140 100 160 100 300 100 120
Type of House
Katcha (mud+stone) 19 2 9 14 16 7 15 42 19Pacca (Bricked/cemented) 53 7 53 84 53 58 47 4 1 56Pacca/Katcha (bricks+mud) 38 38 60 3327 98 37 44 Not Specified 1 1 2 1 1 1 1 1
Total 100 140 100 160 100 300 100 120
Ownership Status House
of
78 10 94 151 87 60 96 Self Owned 9 2 115Rental 0 0 0 0 0 0 0 0 Joint Ownership 13 1 5 9 3 8 8 26 4 Relative's House 0 0 0 0 0 0 1 1 Leased 0 0 0 0 0 0 0 0 Free on Landlord Property 9 1 1 4 0 2 1 13 0 Other 1 1 0 0 0 1 0 0 Not specified 0 0 0 0 0 0 0 0
Total 100 140 100 160 100 300 100 120
Bed Rooms
Up to 3 rooms 72 101 69 111 71 212 69 83 Between 4-6 rooms 24 33 26 42 25 75 26 31 Above 6 rooms 4 6 4 7 4 13 5 6
Total 100 140 100 160 100 300 100 120 Separate Room for Kitchen
Yes 60 84 70 112 65 196 77 92 No 40 56 30 48 35 104 23 28
Total 100 140 100 160 100 300 100 120
Bathroom Yes 75 105 94 150 85 255 95 114 No 25 35 6 10 15 45 5 6
Total 100 140 100 160 100 300 100 120 Spare Land For constructing BGP (Marlas) 4.25 4.00 4.12 5.97 Source: EUDBA Survey, Household Survey

EUDBA Survey Report, 2009
P a g e | 31
Around 70% of hous in Faisalabad and 77% in Vehari have a separate room for the seholdsFaisalabad hari have a oom % of the houses
yed in Faisalabad and 88% in Vehari have toilets in the h
Table 4.13: Percentage of Houses Having Toilets
es in both districts have up to three bedrooms, 65% kitchen, and 85% of the hou surveyed in
and 95% in Ve separate r for the bathrooouse.
m. 87surve
Toilets in House Project Fo rea: Faisalacus A bad Control Area
Vehari Jaranwala Samundari Total # % # % # % # %
Yes 79 111 150 261 88 94 87 105No 19 27 5 8 12 35 6 7 Not specified 1 2 1 2 1 4 7 8 Total 100 140 100 160 100 300 100 120 Source: EUDBA Survey, Household Survey Of the houses surveyed in both districts, almost 82% in Faisalabad region and 90% in Vehari have their cooking place based outdoors in the summers. In the winters in both districts, around 31% in Faisalabad and 37.6% in Vehari move the kitchen to either a separate building used as a kitchen (23% in both districts), or a separate room in the same building used as a kitchen (24.4% in Faisalafor both districts).
bad and 20.5% in Vehari), or a room used for living and sleeping (1%
Table 4.14: Cooking Place
Cooking Place Project Focus Area: Faisalabad Control Area
Vehari Jaranwala Samundri Total Percentages
Cooking Place in Summer
In a room used for living or sleeping 0.7 0.7 0.6 0.0
In a separate ro building used as 5.8 7.2 .6 om in same kitchen 8.8 2
In a separate building used as a kitchen 15.4 10.0 6.9 5.2
Outdoors 74.3 88.4 81.8 89.7
Other 0.7 0.0 0.3 0.9
Total 100.0 100.0 100.0 100.0
Cooking Place in Winter
In a room used for living or sleeping 2.2 0.0 1.0 0.9
In a separate room in same building used as kitche 22.1 26.5 n 24.4 20.5
In a separate building used as a kitchen 25.7 21.9 23.7 23.1
Outdoors 49.3 51.6 50.5 52.1
Other 0.7 0.0 0.3 3.4
Total 100.0 100.0 100.0 100.0 Source: EUDBA Survey, Household Survey
4.3.2.3 Livestock and Land Holdings
The average number of livestock in the sampled households of Distt. Faisalabad includes one bull, 5.28 buffaloes, 1.8 cow, and 3.2 sheep/goat. In Vehari, the average number stands at 1.24 bull, 6.78 buffaloes, 2.38 cows, and 4 sheep/goat. Regarding their feeding arrangement, staff-fed is the most common form of feeding arrangement for the animals in both the districts, followed by a mixture of staff-fed and grazing.

EUDBA Survey Report, 2009
P a g e | 32
Table 4.15: Average Number of Livestock Per HH
Type of Animal Project Focus Area: Faisalabad Control Area
Vehari Jaranwala Samundri Total Numbers
Bull 1.03 1.24 0.79 1.25 Buffalo 4. 6.78 78 5.73 5.28Cow 1.78 1.7 2.38 1.82 9 Sheep/g 4oat 2.56 3.67 3.15 .04 Horse . . 0.0.01 0 01 0 01 01 Donkey 0.30 0.18 0.23 0.06 Source: EUDBA Survey, Household Su
fo g liv to the m le f t oas highlighted in section 4.2 ll a rom he ur Tmembers of the family take most of the respo sibility for livestock in both districts, including collecting/cutting fodder, feeding, grazi farmyard manure as well as any other livestock ta ction of dung and mak g cakes are two areas in which women take the main responsibility.
land holdings, 8 he rve Distt. Faisalabad have 81% The a of se surveyed in Faisalabad p to 5 ere in a figu is 55% having farms up to 5
Ave ge n ing
rvey
Bulk of the responsibility r maintainin es ck falls on a members o he h usehold .1.5 as we s in Table 4.3a f t women’s s vey. he male
nng, preparing
sks. Colle ing dun
In terms of 7.5% of t su yed households in agricultural land, as do in Vehari. m
ajority (58%) tho
have on average farms u acres, wh s Veh ri the re acres
Table 4.16: ra La d Hold *
Farm Size Proj a: alabad ect Focus Are Fais Control Area
Vehari Jara alnw a Samundri Total Percentages
Upto 5 Acres 62.7 53.1 57.5 54.6 Above 5 and Upto 10 Acres 21.2 23.1 22.2 19.6 Above 10 and Upto 15 Acres 7.6 10.5 9.2 10.3 Above 15 and upto 20 Acres 4.2 3.5 3.8 4.1 Above 20 Acres 4.2 9.8 7.3 11.3 Total 100.0 100.0 100.0 100.0 * Landless are excluded Source: EUDBA Survey, Household Survey
4.3.2.4 Use of Fertilizer
Regarding the use of fertilizers in farming, the results indicate that two main types of fertilizers – DAP and Urea – are being used (based on usage pattern of the last crop), and of the two, although the use of urea is greater, the annual expenditure on DAP is far more than on urea as it is more expensive.
Utilization is greater in Distt. Faisalabad as compared to Distt. Vehari, due to the greater number of farms there, majority being up to a size of 5 acres. There are 192 (102 of which are up to 5 acres in size) in Distt. Faisalabad that are using DAP fertilizer on which they are spending an average of Rs.17,164 annually per farm, while 218 farms (120 up to 5 acres in size) using urea worth Rs.11,881 on average per farm on an annual basis.
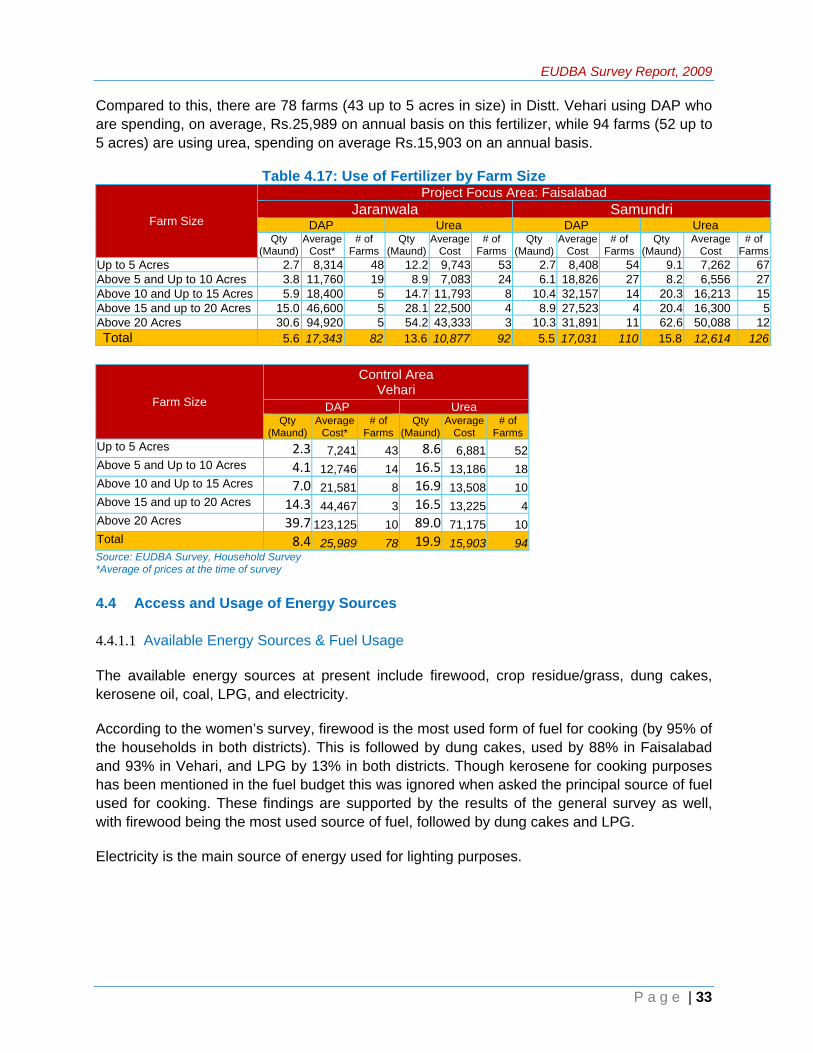
EUDBA Survey Report, 2009
P a g e | 33
Compared to th sing DAP who are spending, on average, Rs.25,989 on ann e 94 far5 acres) are pending on ave ,90
Table 4.17: Use of Fertilizer by Size
is, there are 78 farms (43 up to 5 acres in size) in Distt. Vehari uual basis on this fertilizer, whil ms (52 up to
using urea, s rage Rs.15 3 on an annual basis.
Farm
Farm Size
Project F Area: Fais d ocus alabaJaranwala Samundri
DAP Urea DAP Urea Qty
(Maund) Average
Cost* # of
Farmsty nd)
Average Cost
Qty (Maund)
Average # of Farms (M
Average Cost
# of Farms
Q(Mau
# of Farms Cost
Qty aund)
Up to 5 Acres 2.7 8,314 4 9,743 2.7 54 7,262 678 12.2 53 8,408 9.1Above 5 and Up to 10 Acres 3.8 11,760 1 8.9 7,083 6.1 27 6,556 279 24 18,826 8.2Above 10 and Up to 15 Acres 5.9 18,400 4.7 11,793 10.4 14 16,213 155 1 8 32,157 20.3Above 15 and up to 20 Acres 15.0 46,600 28.1 22,500 4 8.9 2 4 16,300 55 7,523 20.4Above 20 Acres 30.6 94,920 5 54.2 43,333 3 10.3 31,891 11 62.6 50,088 12Total 5.6 17,343 82 13.6 10,877 92 5.5 17,031 110 15.8 12,614 126
Farm Size
Control Area Vehari
DAP Urea Qty
(Maund) Average
Cost* # of
FarmsQty
(Maund)Average
Cost # of
FarmsUp to 5 Acres 2.3 7,241 43 8.6 6,881 52Above 5 and Up to 10 Acres 4.1 12,746 14 16.5 13,186 18Above 10 and Up to 15 Acres 7.0 21,581 8 16.9 13,508 10Above 15 and up to 20 Acres 14.3 44,467 3 16.5 13,225 4Above 20 Acres 39.7 10 123,125 10 89.0 71,175Total 8.4 25,989 78 19.9 15,903 94Source: EUDBA vey, Hous Survey *Average of prices at the tim
and Us of En Sou s
4.4.1.1 Available Energy Sources & Fuel Usage
The available energy sources at present include firewood, crop residue/grass, dung cakes, kerosene oil, coal, LPG, and electricity.
ewood is the most used form of fuel for cooking (by 95% of s in bo stric is is followed by dung cakes, used by 88% in Faisalabad
13% in both districts. Though kerosene for cooking purposes
oses.
Sur ehold e of survey
4.4 Access age ergy rce
According to the women’s survey, firthe household th di ts). Thand 93% in Vehari, and LPG byhas been mentioned in the fuel budget this was ignored when asked the principal source of fuel used for cooking. These findings are supported by the results of the general survey as well, with firewood being the most used source of fuel, followed by dung cakes and LPG.
Electricity is the main source of energy used for lighting purp

EUDBA Survey Report, 2009
P a g e | 34
Table 4.18: Principal Fuel for cooking (multiple responses)
Type of Fuel Project Focus Area: Faisalabad Control Area
Vehari Jaranwala Samundri Total P s (Hercentage H)
Fire wood 95.5 4.994.93 4 95.25 9 6
Crop residue/grass 6.3 88 2.90 7 4.75 5.
Dung cakes 86.23 90.45 .28 88.47 93
Coal 0.72 0.00 0.34 3.36
Kerosene Oil 0.00 0.00 0.00 0.00
Electricity 0.00 0.64 0.34 0.00
Liquid Petroleum Gas 10.14 15.29 12.88 12.61
Total number of HHs 139 157 296 119 Source: EUDBA Survey
The averag use of firewood seho 6.6 Maunds for Faisalabad 5% of which is purchased and 65% is collected free), and Maunds fo se in Vehari (of which 17% is purchased and 83% is collected for e). Private forests
cases) are the main source for firewood collection (used by 57% in Faisalabad an % and 19% respectively i 1districts).
Table 4.19: Per Househ vera onth se of wood
, Household Survey – Women Interview
e monthly at the hou ld level isregion (3 for 6.4 r thosurveyed fre(their own in almost all the
d 48% in Vehari), followed by transboundary forests (used by 15n the two districts market (used by ), and purchased from the 4% in both
old A ge M ly U Fire
Description
Project ab Focus Area: Faisal ad Control Area Vehari Jaranw ala Samundri Total
Qty. (Maunds*) % Qty.
(Maunds) % Qty. (Maunds) % Qty.
(Maunds) %
Purchased 2.4 36% % 1 2.2 34% 2.3 35 1.1 7% Collected Free 4.3 64% % 8 4.3 66% 4.3 65 5.3 3% Total 6.7 100% 6.5 100% 6.6 100% 6.4 100%
Description Overall Sample
Qty. (Maunds) %
Purchased 1.9 29%Collected Free 4.6 71% Total 6.5 100% *1M 40KG Source: EUDBA Survey, Househol According to the respondents, 61% and 49% (in Faisalabad and Vehari) of those collecting
th o change in forest coverage over the last 5 er, a g pondents stated that the increased firewood need of the a m asing forest trees.
The survey results indicate a high trend in change in the firewood price over last two years. rly 50% yearly creas n price was reported by the respondents in both
dis The per mo nd price at the time of survey in Faislabad was Rs. 219 while in vehari 7.
aund = d Survey
firewood from eir own forests have noticed nyears. Howev the rem inin rescommunity is ajor cause of decre
Nea in e i the firewood tricts. u
district the price was Rs. 23

EUDBA Survey Report, 2009
P a g e | 35
Table 4.19b: Firewood Price (per maund) Trend
Item
Project Focus Area: Faisalabad Control Area Vehari Jaranwala Samundari Total
Average Price
% Change
Average Price
% Change
Average Price
% Change
Average Price
% Change
Two - 111.67 - 118 - 114 - Years Ago* 123.18 Last Year 169.09 37% 161.11 44% 165.5 40% 172.67 51% This Year (2009) 225 83% 211.67 90% 219 86% 236.67 108%
* Base Source
Distance and Time in Collecting Fuel Wood
Year : EUDBA Survey, Household Survey
For fuel wood collection, on an average the household members travel on average 1 and half km which takes nearly 1 hour to cover this distance.
Table 4.19c:Farm Size Project Focus Area: Faisalabad Control Area
Vehari Jaranwala Samundri Total Distan ) 1.2 1.6 1.4 1.6 ce (Km Time 39 56 47 (Minutes) 73 Source
e Monthly Expenditure on Fuel
: EUDBA Survey, Household Survey
Table 4.19d: Household Averag
Item
Project Focus Area: Faisalabad Control Area Vehari Jaranwala Samundari Total
Ave
rage
Q
uant
ity
Avg
. m
onth
ly
Exp
endi
ture
%*
Ave
rage
Q
uant
ity
Avg
. m
onth
ly
Exp
endi
ture
%*
Ave
rage
Q
uant
ity
Avg
. m
onth
ly
Exp
endi
ture
%*
Ave
rage
Q
uant
ity
Avg
. m
onth
ly
Exp
endi
ture
%*
Fuel 469 25.5 2.3 Maunds 547 28.1 1.1 Maunds 299 16.5 wood for cooking 2.4 Maunds 601 29.5 2.2 MaundsKero 23 1.3 0.6 Liters 41 2.1 0.3 Liters 25 1.4 sene for cooking 0.9 Liters 60 2.9 0.3 Liters Kero 18 1.0 0.2 Liters 15 0.8 0.2 Liters 17 0.9 sene for lighting 0.2 Liters 13 0.6 0.3 Liters Elect 1,070 58.2 197 Units 1,102 56.6 160 Units 1,123 61.9 ricity 211 Units 1,138 55.8 185 Units LPG 3.1 Kg 222 10.9 3.3 Kg 251 13.6 3.2 Kg 237 12.2 3.9 Kg 326 18.0 Batteries - 4 0.2 - 9 0.5 - 7 0.4 - 24 1.3
Total 2,038 100 1,840 100 1,949 100 1,814 100
Item
Overall Sample
Ave
rage
Q
uant
ity
Avg
. m
onth
ly
Exp
endi
ture
%*
Fuel wood for cooking 1.9 Maunds 467 24.5 Kerosene for cooking 0.5 Liters 36 1.9 Kerosen ting 0.2 Liters 16 0.8 e for lighElectricit 184 Units 1108 58.3 y LPG 3.5 Kg 263 13.8 Batteries - 12 0.6
Total 1,901 100.0
Source: EUDBA Survey, Household Survey * Percentage of total expenditure on fuel

EUDBA Survey Report, 2009
The household average monthly expenditure on energy sources is around Rs. 1901 in the 420 sampled household (Rs.1949 for Distt. Faisalabad and Rs.1814 for Vehari). Expenditure on
.650 in Vehari), while for lighting it is Rs.1136 (Rs. 1124 in Faisalabad and Rs.1164 in Vehari - electricity, kerosene and batteries
uel for cooking constitutes 42.4% of the total average expenditure on energy (28.1% on fuel wood, 2.1% on kerosene and 12.2%
Vehari it is around 35.9% (16.5% on fuel wood, 1.4% on
animals ction of m 47KG nd 300 ls. The across isalabad hari.
across
and burning (46%), whereas for Vehari the 0%)
followed by composting (49.4%). Most of the ma
cooking is around Rs.766 (Rs. 825 in Faisalabad and Rs
combined for both districts).
A major proportion of the expenditure on energy sources is on electricity/lighting, constituting for 57.6% of the total average expenditure in Distt. Faisalabad (56.4% on electricity, 0.8% on kerosene and 0.4% on batteries), and 64.1% of the total average expenditure in Vehari (61.9% on electricity, 1.3% on batteries and 0.9% on kerosene). F
on LPG) in Distt. Faisalabad, while in kerosene and 18% on LPG).
4.4.1.2 Manure Availability and Use
Based on the number of large available, the average daily produmanure in both the district ranges frofrom up to 4 large ruminants, to arouKG from more than 20 large animaaverage daily production of manurethe surveyed households in Distt. Fais 83 KG, whereas it is 111 KG for Ve
The most common uses of manure Faisalabad region are for composting (51%)
P a g e | 36
most common use is for burning (5 nure is stored in the form of piles (by 51% in
47 45.4 46.1 49.9
49 53.3 51.3 49.4
1.2 1.2 1.2 01.6 0.8 0
0
10
20
30
40
50
60
70
80
90
100
Jaranwala Samundari Total(Faisalabad) Vehari
Use of Manure
Burning Composting Sale Give Free Nothing
Faisalabad and 62% in Vehari).
Table 4.20: Daily Production of Animal Manure by Number of Animals
Number of Large Animals Project Focus Area: Faisalabad Control Area
Vehari Jaranwala Samundri Total Average Daily Production (Kg)
Upto 2 29 22 24 26 2-4 53 55 51 54 5-6 54 58 52 56 7-8 66 75 72 71 9-10 78 72 79 74 10-20 143 108 178 124 > 20 216 381 297 315 Total 77 88 111 83
Source: EUDBA Survey, Household Survey

EUDBA Survey Report, 2009
4.5 Community Awar
4.5.1.1 Knowledge of bio-gas and source
ntly, only about a third of the surveye pulation in aware about bio- and the majority of them heard about it through friends/relativ n
and Vehari respectively). Only around a third of those aware of bio-gas have ever gas plant, that too within their village (for 60% i in Vehari),
d and Veh aw it ou heir villa relatives’ places ces (44% in Vehari).
Among the women, only 18% (Faisalabad) and 13% (Vehari) have heard about bio-gas as an energy source, and from thesewomen, 78% (Faisalabad) and56% (Vehari) have heard about it through friends and relatives. Only 24% in the Faisalabad region and 50% in the Vehari region have seen a bio-gas plant. Naturally, 95% of the respondents across both the districts don’t know how to operate a bio-gas plant. Only 22% in Faisalabad Distt. and 11% in Vehari have tried to obtaininformation about establishing a bio-gas plant.
4.5.1.2 Perception/Views about Bio-gas
There is a strong willingness among those surveyed to opt for bio-gas as an alternate source of energy for their houses, with 60% willing to do so in both districts. The most obvious benefit of bio-gas perceived by 93% of the women surveyed in Faisalabad Distt. and 95% in Vehari is that it is time-saving, and that it’s a healthier source of energy and is also more cost efficient.
As a result, an encouraging 56% of the women in both districts would like to opt for bio-gas but the initial high cost of set-up is a major source of constraint and hindrance, as well as lack of information and illiteracy, as also expressed by the women in the FGDs, saying the men would never agree to spending so much and that they would have been able to manage raising the funds had the cost been a little less.
The willingness to opt for bio-gas by female respondents is somewhat less than the overall HH response indicating men are more keen to opt for bio-gas. 83% of the women in both districts identified the HoHH as the person who will decide whether or not to opt for bio-gas. Also brought up in FGDs is the fact that some of the villages would eventually be supplied with much-awaited sui-gas, thus there are those who don’t see any point in spending on bio-gas.
eness about Bio-Gas
s of information
Curre d po the two districts isgas, es (76% and 92% iFaisalabad seen a bio- n Faisalaba
tside td and 69% ge atwhile 40% and 31% (Faisalaba
4% for Faisalabad) and friends plaari) s
(5
0102030405060708090100
Jaranwala Samundari Vehari
Awareness about Bio-gas
Male Female
P a g e | 37

EUDBA Survey Report, 2009
P a g e | 38
Table 4.21a: Willingness to Opt for Bio-Gas (Household Response)
Willingness Project Focus Area: Faisalabad Control Area
Vehari Jaranwala Samundri Total Percentages
Yes 61.4 58.8 60.0 59.2
No 33.6 38.1 36.0 39.2
Don't know 5.0 3.1 4.0 1.7
Total 100.0 100.0 100.0 100.0 Source: EUDBA Survey, Household Survey

EUDBA Survey Report, 2009
P a g e | 39
Table 4.21a: Willingness to(Women Respo
Opt for Bio-Gas nse)
Willingness Project Focus Area: Faisalabad Control Area
Vehari Jaranwala Samundri Total Percentages
Yes 58.3 55.4 56.8 55.5
No 39.6 43.3 41.6 39.5
Don't know 2.2 1.3 1.7 5.0
Total 100.0 100.0 100.0 100.0 Source: EUDBA Survey, Household Survey – Women Interview
Thus, a lot of mobilization is required to create awareness about bio-gas and its benefits. This aspect has also been emphasized on in the FGDs, along with the fact that in order to enable
respondents in both districts cited self-financing as the primary source of financial arrangements for bio-gas. Similar figures resulted in the general survey
setup bio-gas plants as can be gauged by their respon he FGDs. According to
e
both districts stated that another woman can do the mixing as well. 46% and 50% from Faisalabad
maximum women to participate in such project activities, several sessions should be organized with the men to give them maximum information as they are the main decision-makers. Also, technical, financial and functioning details would be required before deciding if they liked the idea. The villagers also stated that they would need to see a bio-gas plant functioning to help them make a decision.
Around 63% of the female
findings as well, with 70% of the respondents identifying personal savings as the main source for financing the construction of a bio-gas plant, followed by credit from a formal source (17% for Faisalabad and 20% for Vehari), and credit from relatives as a third option.
4.5.1.3 Willingness to Promote Bio-gas
There is nevertheless a strong willingness among the women toses to some of the survey questions and in t
th , once a few families have installed the plant in their villages, it would then be easier for others to follow. Women should be made responsible for the repair and maintenance of bio-gas plants in order to ensure the project’s sustainability and better results. 55% and 51% of the women (for Faisalabad and Vehari) are willing to mix the dung and water. 37% from
m
and Vehari are willing to attend User Training, with the most popular choice of a convenient location being their own houses, followed by the village hall, for the Training Program. However, as expressed in the FGDs, the women would not be willing to attend trainings conducted by men so female trainers would have to be used.

EUDBA Survey Report, 2009
P a g e | 40
5 CONCLUSIONS & RECOMMENDATIONS
• Overall, both men and women expressed strong interest in and willingness to opt for bio-gas technology, provided the financial and technical constraints are addressed appropriately.
• Mobility of women is not an issue in either of the districts. The women are willing to attend any training in and outside the village, as long as the trainings are provided by women. Once the plants have been installed, women should be made responsible for their repair and maintenance for better results and better sustainability.
• In order to enable the maximum number of women to participate in project activities, several introductory sessions should be organized with the men, especially on bio-gas technology, to give them maximum information. As expressed in the FGDs and also indicated in the survey findings, men are still the major decision-makers at the household level so they need to be informed about the technology first in order to tap into their investment capabilities.
• Considering that a large number of those interviewed want to see a functioning bio-gas plant before making a decision, it is recommended model bio-gas plants be set-up at key areas to demonstrate to the people how the technology works. Considering the low education levels, exposure in this manner would be more convincing. Media could be used for information dissemination as well. Also, technical, financial and functioning details would be required to help them decide whether they like the idea.
• A lot of mobilization is required to create awareness about bio-gas and its benefits. There is evidence of NGO presence in some villages in Samundri (as NGOs are a source of credit for some of the villages there), thus the networking of such NGOs can be tapped into.
• The cost of bio-gas plant installation is high, meaning most of our rural and potential communities will be deprived of benefiting from the project. In order to involve middle and low income groups, grant or microcredit mechanisms should be worked out to allow the maximum number of families to benefit from the project. A mechanism should also be worked out to involve most vulnerable communities in this project through donor funding and minimum community contribution.
• It was found during the visits that most of the villages closer to the main towns of Jaranwala
and Samundri either already have sui-gas connections or have been promised by their politicians that they will get sui-gas within months, hence their reluctance to consider bio-gas as an alternate source of energy. Thus while selecting project areas for installation of
EUDBA Survey Report, 2009
P a g e | 41
bio-gas plants, remote villages away from the main towns should be selecimplementation of the project. The sampled villages of Faisalabad districts were located on
ted for effective
16 km from their respective tehsils, while the average distance of Vehari from the nearest main town was 9 km.
an average distance of the sampled villages of

EUDBA Survey Report, 2009
P a g e | 42
6 Focus Group Discussion on Biogas With Women – A Summary
General observations:
• Most of the villages had no organizations like NGOs or committees operating in the area. • Women in all the villages were generally very entrepreneurial, involved in agriculture and
livestock as well as small-scale work at home such as embroidery, etc. They were free to move around – mobility was not an issue for them.
es and disadvantages, and the
to have, before installing a Biogas
ts were aware of the smoke-related and other health hazards of burning firewood and crop-residues and were aware of the financial, health, and environmental benefits of biogas.
gas. They were very aware of the fact that if they had gas, it would save their time, money and reduce the workload on families and women in particular but were not
ut this meeting and the topic of discussion. They said they would talk to other village women about the project and provide
d this large amount on biogas. They also mentioned that the best way to communicate information about the project would be through a demo of a successful plant.
• Cow dung was the main source of fuel for the kitchen, followed by agri-residue and firewood.
Question: Did you find the poster easy to understand?
The posters were self-explanatory and easy to understand, generating a lot of questions and discussions regarding the technicalities of bio-gas, its advantagissue of why switch to biogas when they’ll be getting sui-gas soon.
Question: What kind of information would you likeplant?
Technical, financial and functioning details would be required before the villagers could decide if they liked the idea. They would also like to first see a plant functioning.
Question: Perceived benefits of bio-gas plant
Participan
They discussed how easy it was to make a fire and clean dishes with bio-gas. They were happy to hear about this alternate energy proposal but at the same time they repeatedly compared it with sui-
that concerned about the longer-term benefits, repeatedly insisting on sui-gas.
Question: How would you tell other women about the benefits of installing a biogas plant?
What kind of information would they need?
The women promised to mention to the other women abo
them with all the information they had about how it worked and its benefits. They would need to know the exact cost of the plant and stated that it would be very difficult for their men to spen

EUDBA Survey Report, 2009
P a g e | 43
Question: Who are the people in your mohallah or village who would need special help in order to take part in the Biogas Project and to benefit from it?
Almost all of the participants stated that most of the villagers were poor, many working on
p would be needed in terms of financing – either in the form of loans or grants or perhaps having RSPN install the plant and deduct the cost through easy installments.
sometimes with other women or male/female family members.
There was no hesitation among women on mobilizing communities. They did feel though that women could be the best mobilizers only for women, a lot of work needed to be done for the men since they were actually the decision makers. They also felt that a plant should be installed in villages for demonstrative purposes so that others could see it working, only then would it be possible for them to talk about bio-gas and its advantages. They said working as mobilizers for this project would be no problem and that they would talk to women of their village and other villages where they have access, but only once they have experienced that it works and they have sufficient information about it.
Question: In your opinion, what are the 2 or 3 most significant problems faced by women in your village, that affect their ability to take part in projects like this one, or any other initiative?
Illiteracy, lack of information and technical know-how, and most of all financial constraints are the major issues faced by women that hinder their participation in most of the projects like this. Remoteness of the area they live in and ownership of land and houses are also issues for
farms or raising livestock on behalf of the landlords so it would be very difficult for them to raise the large amount of money needed to finance the bio-gas plant – they would never be able to do it. Thus special hel
Question: When you go out, who do you usually go to see? (family members, health professionals, teachers, LHWs, others)
Mobility of the women was not an issue. Women freely move within and outside their villages, when and where required: they go out to visit each other, visit their children’s teachers, visit doctors and their relatives – they freely travel when and where required sometimes alone and
Question: Do you think you would be able to take part in a mason’s training for a Biogas plant? (would you want to? Would anyone object?)
According to most of the participants, they would not like to participate in any training that is conducted by men but if there is a female trainer, it would be possible. However, they would not like to work with bricks, mud and cement, especially in the presence of masons – such training would be difficult as this is perceived to be a man’s job and the men would not like them to participate in such activities. Training on repair and maintenance of the bio-gas would be good to learn though, and training on the functioning of the plant would also be of their interest.
Question: Do you think that you or other women would be able to become a ‘mobiliser’ for the Biogas project? What would be necessary to make this possible for yourself? For other women?

EUDBA Survey Report, 2009
P a g e | 44
communities here while considering such projects. Culturally, the men were the main decision-akers, especially where money was involved so it would be better to conduct several
sessions with men to involve them in project act women to participate.
Question: Which factors, if any (social, technical, financial, communication, literacwould make it easy or difficult n to be lved i aspebiogas technology?
rticipation of women oject, the a need to with the men as ers, having trol over resources. This was an expensive project
o convince the men – the en would no le to get involved in any aspect ere not convinced. Many of the women believed this project would help solve
ot be able to raise th e amount d for the project e. They would be very happy to have the biogas p installed but that would only be
en the plants on loan and with rep nts on eas tallments.
project can do a to inc any aspect of nt (for ex reased ability to contribute to
decisions)? If No, why not? If yes, what would you suggest?
Income generating projects on bute to their families’income would strengthen their pos n the fa the co ities.
aximum number of women to participate in project activi l sessions should be men to give them maximum information. Once a few families have installed
then it would be easier for the oth follow. Lo rants w repaymts for the installation of biogas plan ld be one and the would be
train wome repair and maintenance. Wom hould be lved in sants, and they should be made responsible for the repair
nd maintenance and financial management of biogas plants in order to ensure project sustainability and better results. This would women’s ability to participate in decision making fo
mivities before getting the
y) ct e for wome come invo n any of th
In order to help pa in this pr re is workthey were the decision mak conand required t wom t be abuntil the men wmost of their problems but they will n e larg needeat onc lantspossible if they were giv ayme y ins +
Question: Do you think that thiswomen’s and girls’ empowerme
nything rease ample, inc
ly for women enabling them to contri To itions withi milies and mmun enable
m ties, severaorganized with it in the village ers to an or g ith easy ent installmen ts wou aspect other to
n and girls for its en s invo ite selection for installation of biogas pla
improve ther such projects.

EUDBA Survey Report, 2009: Appendix Household Survey Tables
Q18 Major Sources o
Q18.2 Percentage of firewood get from Private Forest
Project Focus Area: Faisalabad Control Area
f Firewood
Vehari Jaranwala Samundari Total Mean
Q182 91.95 0 97.83 95.0 100.00 Sebcon’s UDBA Survey (Household Response)
Project Focus Area: Faisalabad Control Area VehariJaranwala Samund ari Total
Percenta ges %C Fo 13.43 4.52 8.65 4.27 ommunity rest P 5.97 8.39 7.27 5.98 ublic forest (National Forest) Private Forest 58.21 56.77 57.44 47.86 Transboundary 11.19 17.42 14.53 18.80 Purchased from the market 16.42 11.61 13.84 13.68 Other 4.48 6.45 5.54 9.40 Don't know/not specified 0.00 1.29 0.69 1.71
Total Respondents 134.00 155.00 289.00 117.00 Sebcon’s UDBA Survey (Household Response)
Q18.1 Firewood per Maund Price
Proje a: Con Vehari
ct Focus Are Faisalabad trol AreaJaranwala Samundari Total
Mean T 123.18 111.67 118.00 11wo Years Ago 4.00 L 169.09 161.11 165.50 17ast Year 2.67 T 225.00 211.67 219.00 236his Year .67
Total Respondents 22.00 18.00 40.00 16 .00 e se)
S bcon’s UDBA Survey (Household Respon
Q18.3 Distance of Forest from Home to Collect Fire woo
oject Focus : Faisala ontrol ArVehari
ds Pr Area bad C ea
Jaranwala Samundari Total Mean
Q183_distance_meters 1,223.86 1,576.29 1,396.52 1,635.00Q183_time 72.56 38.62 55.59 47.00
Sebcon’s UDBA Survey (Household Response)

EUDBA Survey Report, 2009: Appendix Household Survey Tables
Q18.6Cha t 5 years Project F isalabad Control Area
nge in the Forest Coverage of the Locality is las
ocus Area: Fa
Vehari Jaranwala Samundari Total
Percentages % ChangeForest Coverage Since Last ve Years
in In
fi
creasing 2.6 0.8 1.6 0No change 54.3 66.9 61 48.9S ng 12.9lightly decreasi 5.4 8.9 6.7Rapidly decreasing 14.7 3.8 8.9 16.7Don't know 15.5 23.1 19.5 27.8
Total 100 100 100 100 Total Respondents 116 130 246 90
Sebcon’s UDBA Survey (Household
Q18.6.1 Major Causes of Decreasing Forest Project Fo alabad Control
ri
Response)
cus Area: FaisArea
VehaJaranwala mundari tal Sa ToPercentages %
Increased firewood need of community 81.3 33.3 68.2 38.1 Logs used in community 3.1 25.0 9.1 19.0 Firewood sold outside the community 3.1 25.0 9.1 19.0 Logs sold outside the community 3.1 0.0 2.3 9.5 Fodder needs of the community 3.1 0.0 2.3 4.8 Others 0. 8.3 2.3 4.8 0 Don't know 6.3 8.3 6.8 4.8
Total 100.0 100.0 100.0 100.0 Total Respondents 32.0 12.0 44.0 21.0
Sebcon’s UDBA Survey (H
Q18.7 Details about Rules impose oods fromProje a: Fais Control Area
Vehari
ousehold Response)
d by Govt. to collect fire w Forest
ct Focus Are alabadJaranwala Total Samundari
Percentages % Bring firewood from the forest in not allo 40. 40.4 40.7 48.7wed 9
Allowed for limited and prescribed time 7. 5.8 6.8 2.66Its free, no rule at all 51. 53.8 52.5 48.75
Total 100.0 100.0 100.0 100.0Total Respond 66. 52.0 118.0 39.0ents 0
S DBA Survey (Household Response) ebcon’s U

EUDBA Survey Report, 2009: Appendix Household Survey Tables
Q19 Responsibility for the Stove Maintenance
Faisalabad Vehari Jaranwala Samundari Total
Percentages
Who is responsible
e
Male Members 1.7
for the stovmaintenance
2.9 .60 0.8
Female Members 95.0 95.097.5 96.3
Not specified 2.1 2.0 4.21.9Total 100.0 100.0 00.0 1 100.0
Tot 140.0 160.0 00.0 120.0al Respondents 3Sebcon’s UDBA Surve ousehold Response)
Q20.1: Health status of women inv in cooki
Last 15 day
Project Focus Area: Faisalabad Control Area Vehari
y (H
olve ng
s (Multiple Responses)
Jaranwala Samundari Total Percentages %
C Respiratory Infections 4 oughs/Cold/ 22.1 14.38 18.00 13.33 M 3.13alaria 9.29 6.00 9.17 S ction 1.88kin Infe 3.57 2.67 0.00 Eye infection 71 0. 0.63 0.67 3.33 I njuries 0.71 0.63 0.67 3.33 B urns 0.71 0.00 0.33 0.00 Other 7.14 4.38 5.67 2.50 N 9 o disease 64.2 76.25 70.67 75.00
Sebcon’s UDBA Survey (Household Response)
Sebcon’s UDBA Survey (Household Response)
tatus of women involve in cooking nses)
Project Focus Area: Faisalabad Control Area Vehari
Q20.1: Health sLast 3 months (Multiple Respo
Jaranwala Samundari Total Percentages %
Coughs/Cold/Respiratory Infections 12.86 6.25 9.33 6.67
Malaria 10.00 3.75 6.67 2.50 Skin Infection 3.57 0.63 2.00 0.83 Eye infection 0.71 0.63 0.67 0.83 Injuries 0.71 0.63 0.67 0.83 Burns 0.00 0.00 0.00 0.00 Other 5.00 2.50 3.67 0.83 No disease 72.86 86.88 80.33 88.33

EUDBA Survey Report, 2009: Appendix Household Survey Tables
Q2 k inveProject Focus Are Control Area
Vehari
1 livestoc ntory
a: Faisalabad Jar la Samundari T anwa otal
Mean Bull Adult 0.49 0.74 0.62 0.68
Bull Young 0.29 0.51 0.41 0.57 Bull tal 0To .79 1.25 1.03 1.24
Buffalo Adult 2.86 3.27 3.08 3.98
Buffalo Young 1.91 2.46 2.20 2.81 Buffalo Total 4.78 5.73 5.28 6.78
Cow Adult 1.14 1.03 1.08 1.33
Cow Young 0.68 0.75 0.72 1.05 Cow Total 1.78 1.79 2.38
Sheep/goat Adult 1.99 2.41 2.21 2.57
Sheep/goat Young 0.57 1.26 0.94 1.48
Sheep/goat Total 3.67 3.15 4.04
Horse Adult 0.01 0.00 0.01 0.00
Horse Young 0.00 0.01 0.00 0.01
tal H oorse T 0.01 0.01 0.01
Donkey Adult 0.26 0.14 0.20 0.02
Donkey Young 0.04 0.03 0.04 0.04
D tal onkey To 0.18 0.23 0.06 Sebcon’s UDBA Survey (H esponse) ousehold R

EUDBA Survey Report, 2009: Appendix Household Survey Tables
Q21 Livestock Feeding
Project Focus Area: Faisalabad Control Area Vehari Jaranwala Samundari Total
Percentages % Bulls azing Gr 10.6 7.1 8.5 0.0
Staff-fed 44.7 52.9 49.6 60.3
Both 44.7 40.0 41.9 39.7
Total 100.0 100.0 100.0 100.0 Buffalos razing G 7.8 3.1 5.3 0.0
Staff-fed 51.7 60.2 56.1 69.2
Both 40.5 36.7 38.5 30.8
Total 100.0 100.0 100.0 100.0 Cows Grazing 4.2 0.0 7.2 1.3
Staff-fed 53 60.4 65.3 .6 66.7
Both 39.1 32.0 35.4 34.7
Total 100.0 100.0 100.0 100.0 Sheeps/Goats Grazing 19.7 8.0 13.5 23.2
Staff-fed 39.5 48.3 44.2 42.0
Both 43.7 40.8 42.3 34.8
Total 0 100.0 0 0 100. 100. 100.Horses Grazing 0.0 66.7 50.0 50.0
Staff-fed 33.3 0.0 25.0 0.0
Both 25.0 50.0 0.0 100.0
Total 100 100.0 100.0 .0 100.0 Donkey/Mule Grazing 13.8 22.2 17.0 28.6
Staff-fed 58.6 38.9 51.1 42.9
Both 27.6 38.9 31.9 28.6
Total 100.0 100.0 100.0 100.0 Sebcon’s UDBA Su e rvey (Household Respons

EUDBA Survey Report, 2009: Appendix Household Survey Tables
Q22.1 Cross Tab: Numb f animal manure
CV
er of animals by daily production oProject Focus Area: Faisalabad ontrol Area
ehari J Saranwala amundari Total Q221_Kg Q221_Kg Q221_Kg Q221_Kg
Mean Number Large Anim
of
als
Upto 4 47 4 4 47.05 6.32 6.72 .79 5-6 54 5 5 51.41 8.46 6.15 .96 7-8 6 7 76.06 4.50 71.33 2.00 9-10 78.33 72.41 74.15 79.17 10-20 142.62 107.50 123.89 178.00 > 20 216.17 381.11 315.13 297.00
Total 76.99 88.03 82.89 111.25 Sebcon’s UDBA Survey (Household Response)
Q22.3 Manure nagemenProj ocus Area: Faisalabad Control A
Vehar
Q22.2 use of Manure
ma t ect F rea
i Jaranwala Samund Totalari Perc ges % enta
Management of cattle
Store as pile 47.1 55.0 51.3 62.5
Dung In the pit 1.4 5.6 3.7 1.7Scattered directly into farms 14.3 11.3 12.7 0.0
Other method 0.0 0.0 0.0 0.0Store as pile + In the pit 24.3 13.8 18.7 19.2
Store as pile + Scattered directly into farms
10.7 12.5 11.7 10.0
In the pit + Scattered directly into farms
0.0 0.6 0.3 4.2
Not specified 2.1 1.3 1.7 2.5Total 100.0 100.0 100.0 100.0
Sebcon’s UDBA Survey (Household Response)
Proje ContVehari
ct Focus Area: Faisalabad rol Area Jaranwala Samundari Total
Perc es % entagBurning 47.0 45.4 46.1 49.9 Composting 49.0 53.3 51.3 49.4 Sale 1.2 1.2 1.2 0.0 Give Free 1.2 0.2 0.7 0.6 Nothing 1.6 0.0 0.8 0.0 Sebcon’s UDBA Sur e)vey (Household Respons

EUDBA Survey Report, 2009: Appendix Household Survey Tables
ProjeCo
Vehari
Q23Holding of Agricultural Land ct Focus Area: Faisalabad
ntrol Area Jaranwala Samunda ri Total
Percentages % Have Agricultural Land
85.0 90 87. 8Yes .0 7 0.8 No 15.0 10. 12.3 190 .2
Total 100.0 100 100. 10.0 0 0.0 Sebcon’s UDBA Surv hold Response)
Q 27 Awareness aboht of
Proje a d Control Area ri
ey (House
ut Bio-Gas 27.1 Source of Information and `27.2 Sig Bio-Gas
ct Focus Area: Fais labaVehaJaranwala Samundari Total
Percentages %
Awareness Yes
about Bio-gas
40.7 35.0 37.7 32.5No 58.6 64.4 61.7 66.7 Not responded 0.7 0.6 0.7 0.8
Total 100.0 100.0 100.0 100.0
Sources of Information
Radio/TV 5.6 5.9 5.7 3.8 Newspaper 3.7 7.8 5.7 3.8 Friends/Relatives 81.5 70.6 76.2 92.3 Govt. 1.9 0.0 1.0 0.0 NGO/Project 1.9 3.9 2.9 0.0 Other 0.0 2.0 1.0 0.0 Newspaper Friends 3.7 3.9 3.8 0.0 Friends+NGO/Project 1.9 0.0 1.0 0.0 Radio/TV/Newspaper Friends 0.0 5.9 2.9 0.0
Total 100.0 100.0 100.0 100.0
Seen a Biogas Plant
Yes 31.6 30.4 31.0 35.1 No 68.4 69.6 69.0 64.9
Total 100.0 100.0 100.0 100.0 Sebcon’s UDBA Survey (Household Response)

EUDBA Survey Report, 2009: Appendix Household Survey Tables
Q 27.2.1.1 Land Site and Q27.2.1.2 Ownership of House
ect Focus Area: Faisalabad ntrol Area Proj CoVehari Jar ndari Totaanwala Samu l
Percentages %
Where was the land
In the village .7 52.9 66 60.0 69.2 Outside village 33.3 47.1 40 30.8 .0
Total 100.0 1 0. 100.0 00.0 10 0
Whose House
53.8 54.5 54 22.2 Relatives .2 Friends 0.8 44.4 3 36.4 33.3 Others 15.4 9.1 33.3 12.5
Total 100. 100.0 100.0 100.0 0 Sebcon’s UDBA Survey (Househ pons
e f e H
Project Focus Area: Faisalabad Control Area ehari
old Res e)
Q 29 H alth o Hous old
V Jaranwa und tal la Sam ari ToPercentages %
HH suffered from health problem
Y 4 5.0 6.3 es 9.3 2 3 21.7N 5 5.0 3.7 o 0.7 7 6 78.3
Total 100.0 100.0 100.0 100.0 Sebcon’s UDBA Survey (Household Response)

EUDBA Survey Report, 2009: Appendix Household Survey Tables
Q 31 & 32 (Faisalabad) Gender
Male Female
Q31. Village committee of Male
Q31. Villacommittee of Male
cQ32. Village committee of
Female ge
Q32. Village ommittee of
Female Yes No Yes No Yes No Yes No
Row N %
R Ro Row N %
R %
ow N R %
ow N R %
ow N w N %
ow N %
R %
ow N
District
Faisalabad e % 44.4% 100.0 0 10
Villag Chak 101 GB 55.6 0.0% 100.0% 0.0% % .0% 0.0%
0 10CHAK
105 RB 0.0% 100.0% 0.0% 100.0% 0.0% 100.0
% .0% 0.0%
cha168.g
k b 0 1 90.0% 100.
% 10.0% 90.0% 10.0% 90.0% 0.0% 0.0%
Chak 172 GB % 46.2% 0 1053.8 0.0% 100.0% 57.1% 42.9% .0% 0.0%
chak 206 % 30.8% 0 10Gb 69.2 7.7% 92.3% 14.3% 85.7% .0% 0.0%
Chak 216 EB 00.0% 0.0% 0.0% 0.0% 0.0% 0.0% .0% 0.0%
Chak 228 EB 00.0% 0.0% 0.0% 0.0% 0.0% 0.0% .0% 0.0%
cha280.g
k b % 64.3% 1 835.7 10.0% 90.0% 33.3% 66.7% 6.7% 3.3%
cha30.cha
k k % 9.1% 1 890.9 90.9% 9.1% 11.1% 88.9% 4.3% 5.7%
chak 4GB
45 0 0 100.0% 100.% 0.0% 100.0% 0.0% 100.0
% .0% 0.0%
CHAK475 g
b 0 0 100.0% 100.
% 0.0% 100.0% 80.0% 20.0% .0% 0.0%
chak 48 % 53.8% 0 10GB 46.2 7.7% 92.3% 57.1% 42.9% .0% 0.0%
chak 485.gb 91.7% % 0 108.3% 0.0% 100.0% 0.0% 100.0 .0% 0.0%
cha5.wb
k 0 0.0% 0.0% 0.0% 0.0% 0.0% 0.0% .0% 0.0%
Chak 527 GB % 50.0% 0 1050.0 0.0% 100.0% 60.0% 40.0% .0% 0.0%
Chak
53 0WB 0.0% 0.0% 0.0% 0.0% 0.0% 0.0% .0% 0.0%
chak 626.gb 30.8% 69.2% % 0 100.0% 100.0% 0.0% 100.0 .0% 0.0%
chak 64 GB 13.3% 86.7% % 0 1023.1% 76.9% 0.0% 100.0 .0% 0.0%
Chak 67 RB 73.3% 26.7% 0 106.7% 93.3% 60.0% 40.0% .0% 0.0%
chak 75.w
Sebcon’s UDBA Survey (Household Response)
b 0.0% 0.0%0.0% 0.0% 0.0% 0.0% 0.0% 0.0%
chak 97.wb 0.0% 0.0%0.0% 0.0% 0.0% 0.0% 0.0% 0.0%

EUDBA Survey Report, 2009: Appendix Household Survey Tables
Q 31 & 32 (Control Area Vehari)
Gender Male Female
Q31. Village Committee of Male
QCommittee of
FeQ31
Committee of Mal
Q32. Committee of
Fem
32. Village
male . Village
e
Village
ale Yes No Yes o No es N Yes Y No
Row N % Row N %
Row N %
N
R Row N%
w N %
Row%
ow N %
Ro Row N %
Distri Village Chak 101 GB 0.0% 0.0% 0.0% 0.0% 0.0 0.0% 0% % ct Vehari % 0. 0.0
CHAK 105 RB 0.0% 0.0% 0.0% 0.0% 0.0 0.0% 0% % % 0. 0.0
chak 168.gb 0.0% 0.0% 0.0% 0.0% 0.0% 0.0% 0.0% 0.0%
Chak 172 GB 0.0% .0% 0.0% 0.0% 0.0% 0.0% 0.0% 0.0% 0
chak 206 Gb 0.0% 0.0% 0.0% .0% 0.0% 0.0% 0.0% 0 % 0.0
Chak 216 63.6% 36.4% 44.4% 55.6% 44.4 16.7% 83.3% EB % 55.6%
Chak 228 EB 27.3% 72.7% 0.0% .0% 55. 44.4% 0.0% 0% 100 6% 100.
chak 280.gb 0.0% 0.0% 0.0% 0.0% 0.0 0.0% 0.0% .0% % 0
chak 30.chak 0.0% 0.0% 0.0% 0.0% 0.0 0.0% 0.0% .0% % 0
Chak 0.0% 0.0% % 0.0% 0. 0.0% % 445 GB 0.0 0% 0.0% 0.0
CHAK 475 gb 0.0% 0.0% 0.0% 0.0% 0.0 0.0% 0.0% 0% % 0.
chak 48 GB 0.0% 0.0% 0.0% 0.0% 0.0 0.0% 0.0% 0% % 0.
chak 485.gb 0.0% 0.0% 0.0% 0.0% 0.0 0.0% 0.0% .0% % 0
chak 0.0% 100.0% .5% % 0. 100. % 5.wb 12 87.5 0% 0% 0.0% 100.0
Chak 527 GB 0.0% 0.0% 0.0% 0.0% 0.0% 0.0% 0.0% 0.0%
Chak 53 WB 55.6% 44.4% 0.0% 0.0% 100.0% 36.4% 63.6% 100.0%
chak 626.gb 0.0% 0.0% 0.0% 0% 0% 0.0% 0.0% 0. 0. 0.0%
chak 64 GB 0.0% 0.0% 0.0% 0.0% 0.0% 0.0% 0.0% 0.0%
Chak 67 RB 0.0% 0.0% 0.0% 0.0% 0.0 0.0% 0% % % 0. 0.0
chak 75.wb 26.3% 73.7% 0.0% 0% 0.0 100.0% % % 100. % 0.0 100.0
chak 97.wb 31.3% 68.8% 0.0% .0% 33. 66.7% 0% % 100 3% 0. 100.0
UDBA sehold Response)
s Survey (Hou

EUDBA Survey Report, 2009: Appendix Women Questionnaire Tables
Q 7 Accompany (Women Mobility) Project Focus Area: Faisalabad Control
Area VehariJaranwala Samundari Total
Mean HoHH 12.30 1 1 1 5.41 4.00 1.56Adult male 11.51 18.69 15.44 10.05 Adult female 10.32 1 1 2.79 1.67 7.04 Young male 14.29 1 1 1 9.67 7.24 2.56Young female 3.57 3.28 3.41 1.01 Small children of the HH 8.33 8.20 8.26 10.05 None 46.83 44.92 45.78 59.30 Sebcon’s UDBA Survey ( women Response)
Q 8 Cooking Placet Focus A aisalab Control Area
Vehari
Projec rea: F ad
Jaranwala Samundari TotalPercentages %
Cooking Place in Summer
In a room used for living or sleeping 0.7 0.6 0.7 0.0
In a separate room in same building used as kitchen 8.8 5.8 7.2 2.6
In a separate bu 10.0 6.9 ilding used as a kitchen 15.4 5.2 Outdoors 81.8 74.3 88.4 89.7 Other 0.3 0.7 0.0 0.9
Total 100.0 100.0 100.0 100.0
Cooking Place in Winter
In a room used for living or sleepin 2.2 g 0.0 1.0 0.9 In a separate room in same building kitchen .1 20 used as 22 26.5 24.4 .5 In a separate building used as a kitch .7 23.7 23.en 25 21.9 1 Outdoors 49.3 52.51.6 50.5 1 Other 0.7 0.3 3.40.0
Total .0 100100 100.0 100.0 .0 DBA Survey (women Response)
Sebcon’s U
Q 9 Fuel for Cooking Project Focus Area: Faisalabad Control
Area VehariJaranwala Samundari Total
Mean Fire wood 94.93 95.54 95.25 94.96 Crop residue/grass 2.90 6.37 4.75 5.88 Dung cakes 86.23 90.45 88.47 93.28 Coal 0.72 0.00 0.34 3.36 Kerosene Oil 0.00 0.00 0.00 0.00 Electricity 0.00 0.64 0.34 0.00 Liquid Petroleum Gas 10.14 15.29 12.88 12.61 Bio-gas 0.00 0.00 0.00 0.00 Other 0.00 0.00 0.00 0.00
Sebcon’s UDBA Survey (women Response)

EUDBA Survey Report, 2009: Appendix Women Questionnaire Tables
Q10 & Q11 Regular Maintenance of Cook Stove Project Focus Area: Faisalabad Control
Area VehariJaranwala Samundari Total
Percentages %
Responsibility of Maintenance of Stove
Male Adult 0.7 0.7 0.6 0.0 Female Adult .3 97.1 99.4 98 99.1 Male Child 1.5 0.0 0.7 0.9 Female Child 0.0 0.7 0.0 0.3
Total 100.0 .0 0 00.0 100 100. 1
Responsibility of Maintenance of LPG Stove
25.6 Male Adult 34.0 37.7 36.2Female Adult 2.0 .3 72.1 6 62 62.2Male Child 4.0 .0 2.3 0 1.6 Female Child .0 .0 0.0 0 0 0.0
Total 100.0 100.0 100.0 100.0 UDBA Su en Response) Sebcon’s rvey (wom
Q12 Responsibility of Cooking in Household P t Foc Are isala d Control Area
Veharirojec us a: Fa ba
Jaranwa S mun Tola a dari tal
% * Count % * C t % * Count % * Count oun1. Spouse 7 71.3 06 87.7 10071.6 96 1.0 110 2 2. Mother 3.7 2 1 3.5 4 5 .6 4 3. 9 3. Daughter 12.6 12 36 4.4 7 17 .3 19 12.54. Sister 0.0 3 7 0.9 1 0 .2 5 1. 5 5. Other Female 10.4 10 31 6.1 7 Relatives 14 .4 17 10.76. Other 7.4 4. 9 7 0.9 1 10 5 7 5. 1
Total 105.7 1 105.2 289 103.5 114134 03.9 155 * Multiple Responses
Sebcon’s UDBA Sur ponse) vey (women Res
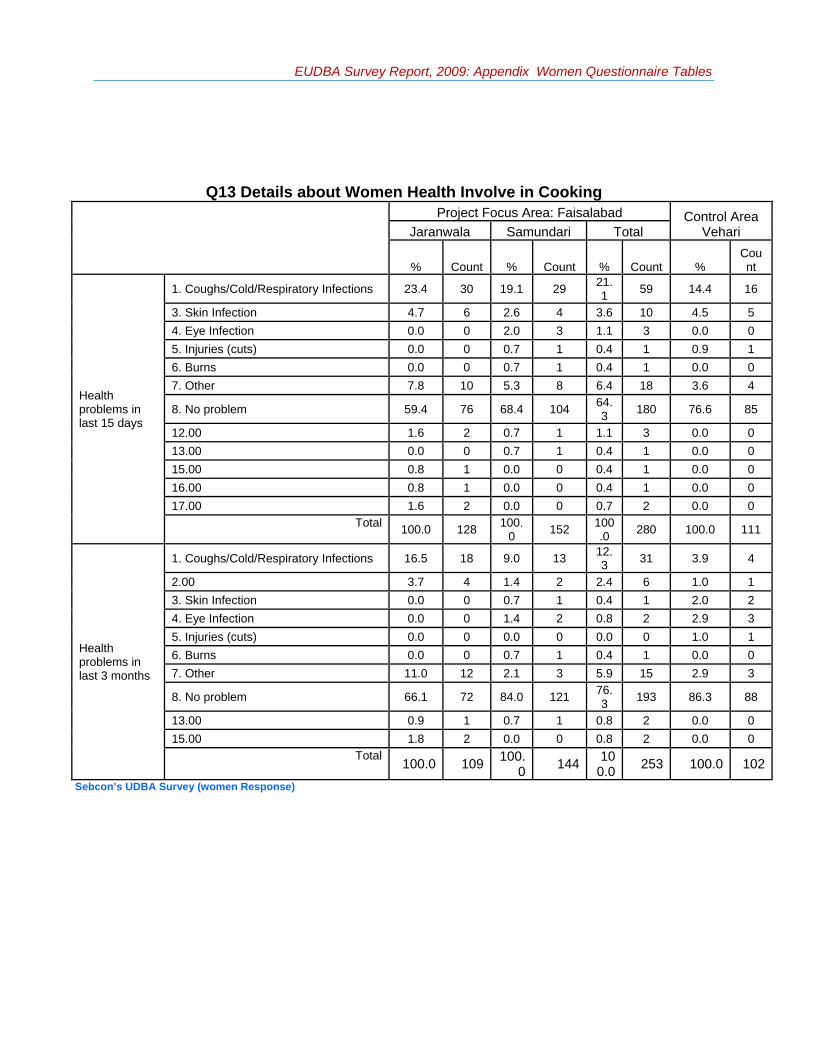
EUDBA Survey Report, 2009: Appendix Women Questionnaire Tables
Q13 Details about Women Health Involve in Cooking Pr cus Area: Faisalabad Control Area
oject FoVehariJaranwa Samundari Totala l
% C % n % Count ount Cou t % Count
Health
1. Coughs/Cold/Resp Infections 19. 29 21.1 14 16
problems in last 15 days
iratory 23.4 30 1 59 .4
3. Skin Infection 4 3.6 4.5 5 4.7 6 2.6 10 4. Eye Infection 2. 3 1.1 0 0 0.0 0 0 3 .0 5. Injuries (cuts) 0.7 1 0.4 0. 1 0.0 0 1 9 6. Burns 0.7 1 0.4 0. 0 0.0 0 1 0 7. Other 1 5.3 8 6.4 3. 4 7.8 0 18 6
8. No problem 59.4 76 68.4 10 3 6 85 4 64. 180 7 .6
12.00 1.6 2 0.7 1 1.1 3 0.0 0 13.00 4 1 0.0 0 0.0 0 0.7 1 0.15.00 0 0.4 0 0.8 1 0.0 1 0.0 16.00 0.0 0.4 0 0.8 1 0 1 0.017.00 1.6 2 0 0.7 2 0.0 0 0.0
Total 100.0 1 100.0 152 280 100 111 28 100
.0 .0
Health problems in last 3 months
1. Coughs/C spiratory Infectio 16.5 1 9.0 13 . 31 3. 4 old/Re ns 8 123 9
2.00 3.7 4 .4 2 2.4 6 1.0 1 13. Skin Infection 0.0 0 0.7 1 0.4 1 2.0 2 4. Eye 2 2.9 3 Infection 0.0 0 1.4 2 0.8 5. Injuries (cuts) 0 0.0 1 0.0 0 0.0 0 1.0 6. Burns 0.7 0.4 0 0.0 0 1 1 0.07. Other 11.0 3 5.9 15 2.9 3 12 2.1
8. No problem 66.1 7 84.0 121 . 193 86 88 2 763 .3
13.00 0.9 0.7 1 2 0. 0 1 0.8 0 15.00 1.8 0.0 0 2 0 0 2 0.8 .0
Tota 100.0 109 100. 144 0.0 253 100.0 102l0
10
Sebcon’s UDBA Survey (women Respons
e)

EUDBA Survey Report, 2009: Appendix Women Questionnaire Tables
Q 14.1 Highest Level o oman in HH
ject Fo isalabad Control Area Vehari
f Education attained by wPro cus Area: Fa
Jaranwala Samund talari To% Count % nt % Count % Count Cou
Illiterate 18.1 17 11.1 15 14 32 4.5 4 Madrasa School 6.4 6 0 0 2.6 6 6.7 6 Primary 31.9 30 21.5 29 25.8 31.5 28 59Middle 11.7 11 15.6 21 14 32 21.3 19 Matric 21.3 20 20 27 20.5 47 13.5 12 Intermediate/Di 6.4 6 14.8 20 11.4 26 12.4 11 ploma BA/BSC 4.3 4 11.9 16 8.7 20 6.7 6 Post Graduate 0 0 4.4 6 2.6 6 2.2 2 Professional 0 0 0.7 1 0.4 1 1.1 1
Total 100 94 100 135 100 229 100 89 Sebcon’s UDBA ey (women Response)
Surv
Q15 Average Number of School going Childs in HH Project Focus Area: Faisalabad Control Area
VehariJa a Saranwal mundari TotalMean
Boys 1.04 1.24 1.15 1.01Girls 0.85 0.99 0.92 1.09
Total 1.88 2.23 2.07 2.10Sebcon’s UDBA Survey (women Response)
Q15.1 Do all School aged Childs in HH go to school?
ject Fo isalabad Control Area Vehari
Pro cus Area: FaJaranwala Samund talari To
Percentages % Yes 79.3 88.4 84.3 83.6No 20.7 11.6 15.7 16.4
Total 100.0 100.0 100.0100.0 Sebcon’s UDBA S (women Response)
urvey
Q16 reness ab io Gas Project Focus Area: Faisalabad Control Area
V
Awa out B
ehariJa a Saranwal mundari TotalPercentages %
Have you ever heard about Bio-gas?
Yes 18.0 18.5 18.2 15.1
No 82.0 81.5 81.8 84.9
Not specified 0.0 0.0 0.0 0.0 Total 100.0 100.0 100.0 100.0
Sebcon’s UDBA Survey (women Response)

EUDBA Survey Report, 2009: Appendix Women Questionnaire Tables
Q16.1 Source of Information about Bio Gas
ntrol Area Vehari
Project Focus Area: Faisalabad CoJaranwala Samundari Total
Percentages %
Source of information
1. Radio/Tv 0.0 3.4 1.9 5.6
2. N paper ews 4.0 3.4 3.7 0.0
3.F Re s/ Vill
riends/lativeagers
92.0 65.5 77.8 55.6
4. Govt. 0.0 0.0 0.0 0.0
5. NGO/Project 4.0 3.4 3.7 0.0
6. Other 1.9 0.0 0.0 3.4
7 0.0 1.9 3.4 0.0
13 0.0 3.4 1.9 0.0
23 0.0 0.0 0 5.6 0.
34 0.0 0.0 0.0 5.6
123 0.0 3.4 1.9 0.0
Not specified 0.0 10.3 5.6 27.8 Total 100.0 100.0 100.0 100.0
Sebcon’s UDBA Surve en Response) y (wom
Q16.2 & 16.3 Knowledge its Operations ject Fo isalabad Control Area
Vehari
about Bio Gas Plant andPro cus Area: Fa
Jaranwala Samundari TotalPercentages %
Ever Seen a
Yes 28.0 20.7 24.1 50.0
Bio-Gas Plant No 72.0 79.3 75.9 50.0
No 0.0 0.0 0.0 0.0 response
Total 1 100.0 1 1 00.0 00.0 00.0
Know how to operate a Bio-Gas Plant
Yes 0.0 10.3 5.6 5.6
No 94.4 100.0 89.7 94.4
No response 0.0 0.0 0.0 0.0
Total 100.0 100.0 100.0 100.0
Sebcon’s UDBA Survey (women Response)

EUDBA Survey Report, 2009: Appendix Women Questionnaire Tables
Q16.4 Gathering Information for Esta t of Bi PlanProject Focus Area: Faisalabad Control Area
V
blishmen o Gas t
ehariJaranwala Samund Totari alPercentages %
Tried to get Detailed Information about Establishing a Bio-Gas Plant
Yes 28.0 17.2 22.2 1 1.1
No 68.0 65.5 66.7 72.2
Not s 4.0 17.2 11.1 1pecified 6.7 Total 100.0 100.0 100.0 100.0
Sebcon’s UDBA Survey (women Response)
Q17 Willingness to have Bio Gas Pr t Focus Area: Faisalabad Control Area
Ve
ojec
hariJaranwala Samund Totaari l
Percentages %
Opt for bio-gas
Yes 58.3 55.4 56.8 5 5.5
No 39.6 43.3 41.6 39.5
Don't know/not 0.0 0.0 0.0 0.0 specified
9.00 2.2 1.3 1.7 5.0 Total 100.0 100.0 100.0 100.0
Sebcon’s UDBA Survey (women Response)
Q17.1 Decision maki for Installation of Plant Project Focus Area: Fais Control Area
V
ng Power alabad
ehariJaranwala Samunda Totari l
Percentages %
Who will Decide to opt for Bio-
as Plant?
81.5 85.1 83.3 8
G
1. HoHH 3.3
2. Adult male members 7.4 1.1 4.2 4.5
3. Adult female members 1.2 2.3 1.8 3.0
4. Other 0.0 0.0 0.0 0.0
Not specified 9.9 11.5 10.7 9.1 Total 100.0 100 .0 100.0 100.0
Sebcon’s UDBA Survey (women Response)

EUDBA Survey Report, 2009: Appendix Women Questionnaire Tables
Faisalabad ri
Q17.2 Financial Arrangements for bio Gas Project Focus Area: Control Area
VehaJar Samundari Total anwalaPer ages % cent
Financial Arrangements
1. Se 61 64 3. 62lf .7 .4 6 1 .1
2. Credit from a formal source 8.6 9.5 16.7 10.3
3. Credit from relati 7 3 5.4 3.ves .4 .4 0
4. S f a t 3 4 4.2 3.ale o sse .7 .6 0
5. O 6 0 3.0 3.ther .2 .0 0
Not specified 4.9 3.4 4.2 4.5
12.00 3. 1 7.1 7. 7 0.3 6
13.00 1. 0 0.6 0. 2 .0 0
14.00 2.5 2.3 2.4 0.0
24.00 0.0 1.1 0.6 0.0 Total 100.0 100.0 100.0 100.0
Sebcon’s UDBA Survey (women Response)
Q17.3 Preference of Cooking eatures
Project Focus Area: Faisalabad Control Area Ve
Stove’s F
hariJaranwala Samundari Total
Percentages %
Preferred Features for
e
er stove 66.7 9 7 7
Cooking Stov
Single burn 75. 1.4 2.7
Double burner stove 28.4 17.2 22.6 25.8
Not specified 4.9 6.0 1.56.9 Total 100.0 100.0 100.0 100.0
Sebcon’s UDBA
S esponse)
urvey (women R
Q17.4 Perceived Benefits of Bio Gas Project Focu a: Faisalabad Control Area
Ve
s Are
hariJaranwala ndari TotalSamu
Percentages % Time Saving 93 93 93 95
Convenience 38 41 40 38
Health Benefits 46 55 51 39
Monthly Fuel Cost 46 61 54 35
Sebcon’s UDBA Survey (women Response)

EUDBA Survey Report, 2009: Appendix Women Questionnaire Tables
Project Fo CoVe
Q18 Responsibility of Livestock in Family cus Area: Faisalabad ntrol Area
hariJaranwala amundari talS To
Mal
e
Fem
ale
Boy
Girl
Fem
ale
Boy
Girl
Mal
e
Fem
a
Boy
Mal
e
Fem
ale
Girl
Mal
e le
Girl
Boy
Percentages % Collecting/Cut 88 13 13 1 92 8 6 1 10 9 5 0 ting Fodder 91 1 86 4
Feeding 90 19 10 0 96 16 5 1 93 17 7 96 8 0 0 1
Grazing 83 12 9 1 11 5 1 82 12 7 82 24 0 82 1 1
Collecting Dun 37 56 5 3 43 50 3 0 41 53 4 45 65 1 g 1 1
Making Cakes 71 1 1 17 70 1 2 19 71 1 21 73 0 22 2 0 Preparing 0 67 5 0 0 74 7 2 0 6 1 Farmyard Manure 81 9 4 77 0
Any Other Livestok tasks 67 6 4 3 0 65 13 1 0 0 61 8 1 1 64 7
Sebcon’s UDBA Survey (women Response)
Q19 & 20 Willingness to run the Pl y Pro Project Focus Area: Faisa
Control Area Vehari
ant and get Training b gramlabad
Jaranwala amundari Total S
Percenta s ge
Willing to Mix the Dung and Water.
Y 54.8 55.1 51es 55.4 .3
No 31.8 34.1 3 36.7 3.6
N 7.9 13.4 10.8 15o response .1
Total 100.0 100.0 100.0 10 0.0
Can Another Woman mix tW
Yes 31.7 41.4 36.8 3
he Dung and ater?
7.0
N 46.0 37.6 41.6 3o 9.5
N 22.3 21.0 21.6 23.5o response Total 100.0 100.0 100.0 10 0.0
Willing to AT
Yes 45.3 45.9 45.6 4
ttend User raining
9.6
N 29.5 29.9 29.7 31o .1
N nse 25.2 24.2 24.7 19o respo .3
Total 100.0 100.0 100.0 100.0
Sebcon’s UDBA Sur nse) vey (women Respo

EUDBA Survey Report, 2009: Appendix Women Questionnaire Tables
venient of Location for Training Program Project Fo Control Area
Vehari
Q20.2 Concus Area: Faisalabad
Jaranwala Samundari Total Count
Training Location
1. V 11 21 32 illage Hall 13 2. AHouGa
1 6 7 t a Neighbor's se that has a Bio
s Plant 6
3. WHouse 33 68 ithin Your own 35 26
4. O 1 1 2 ther 1 12 2 0 2 1 23 10 9 19 8 34 0 1 1 0 123 0 2 2 1 Not Specified 1 1 2 3
Total 63 72 135 59Sebcon’s UDBA Survey (women Response)
Q
isalabad
i
24 Decision Making Process
Project Focus Area: Fa Control Area
VeharJaran mundari wala Sa TotalPercentages %
Agriculture related
Mal 79 95 87 e Members 86Female Members 1 0 0 2 Join 13 4 8 tly 4 Join more Male Domination 8 1 4 tly but 8
Total 100 100 100 100
Livestock related
Male Members 74 94 85 87 Female Members 1 0 1 2 Join 16 5 10 tly 4 Jointly but more M minatio 9 1 5 ale Do n 7
Total 100 100 100 100
Purchase of asset
Mal 76 88 82 e Members 83Female Mem 2 1 1 bers 2 Join 16 10 13 tly 7 Jointly but more M minatio 7 2 4 ale Do n 8
Total 100 100 100 100
Sale of asset
Mal 75 85 80 e Members 82Fem mbers 2 0 1 ale Me 2 Jointly 16 13 15 8 Jointly but more Male Domination 7 2 4 8
Total 100 100 100 100
Children education
Male Members 31 22 26 35 Female Members 6 1 3 2 Jointly 50 64 58 50 Jointly but more Male Domination 13 12 12 14
Total 100 100 100 100 Health Male Members 29 20 24 30

EUDBA Survey Report, 2009: Appendix Women Questionnaire Tables
Fema 2 le Members 9 1 5 Jointly 59 50 68 54 Jointly but more Male Dom 12 12 12 ination 15
Total 100 100 100 100 Male Members 22 14 18 20Female Members 5 1 2 2
Marriage Jointly 56 67 62 54Jointly but more Male Domina 18 18 18 tion 24
Total 100 100 100 100
Other social events
Male Members 30 27 28 32Female Members 10 7 8 8 Jointly 47 55 51 45 Jointly but more Male Domina 13 12 12 tion 15
Total 100 100 100 100 Sebcon’s UDBA Survey (women Response)
Q25 Interviewer Observation
Project Focus Area: Faisalabad Control Area VehariJar nwala Samundari Total a
Percentages %
Overall Cleanliness in the house
Very Good 7 3 5 5
Good 43 53 48 47
Fair 31 33 27 34
Poor 16 22 10 15 Total 100 100 100 100
Floor of the Clean 56 66 61 65
kitchen Dirty 44 34 39 35 Total 0 10 100 100 100
Walls and roof of
ooking
Almost Black
the kitchen/carea
5 4 4 7
Black patches 60 63 62 53
Clean 36 33 34 40 Total 00 1 100 100 100
Cooking pans/pots-outside
Almost Black 11 1 17 14 7
Black patches 48 4 30 44 7
Clean 41 43 42 46 Total 00 1 100 100 100
Sebcon’s UDBA Survey (women Response)

EUDBA Survey Report, 2009: Appendix Village Profile Tables
CV
Q5. Available Services/Facilities in the Sampled VillagesProject Focus Area: Faisalabad ontrol Area
ehari Jaranwala Samundari Total Mean
Hospital 29 63 47 33 Nearest Town 0 0 0 0 Market Mandi 0 0 0 0 PCO 87 83 71 100 Post Office 57 50 53 33 Bank 14 25 20 0 Bus Stop 29 38 33 33 Shops 100 100 100 100 Paved Road 86 100 93 100 Electricity 100 100 100 100 Cylinder Gas 14 25 20 0 Telephone 67 43 88 67 Street Paved 44 79 63 65 Water Supply 17 14 25 20 Drainage Sy1#Yes 2#N
stem o 57 100 80 83
Sebcon’s UDBA Survey (Village Profile)
Q5. dista ject Focu ol Are
hari
nce in KM - outside village
Pro s Area: Faisalabad ContrVe
a Jaranwala Samunda Total ri
Mean Hospital1 2.8 4.5 3.3 3.0 Nearest Town1 8 7.3 11.8 10. 11.2Market Mandi1 8.8 12.6 12.1 12.4 PCO1 10.0 3.0 . 10.0Post Office1 3.3 6.3 5.0 7.3 Bank1 6.1 5.3 5.4 5.7 Bus Stop1 2.5 1.0 4.1 3.3 Shops1 . . . . Paved Road1 2.0 . . 2.0 Electricity1 . . . . Cylinder Gas1 6.4 6.3 7.2 6.8 Telephone1 8.8 2.5 3.0 7.6 Water Supply1 0 .8 7.5 2. 3 3.3
Survey (Village Profile) Sebcon’s UDBA

EUDBA Survey Report, 2009: Appendix Village Profile Tables
Q 5.1 Average Distance from Tehsil/District Headquarter Control Area
hari Project Focus Area: Faisalabad
VeJaranw Total ala Samundari Mean
Tehsil Headquarter 18.0 14.6 16.2 8.8 District Headquarter 8.8 33.3 47.3 40.7 Sebcon’s UDBA Survey (Village Profile)
Q 6 Type of House Constructions Project Focus Area: Faisalabad Control Area
Vehari Jaranwala Samundari Total Mean
Tehsil Headquarter 18.0 14.6 16.2 8.8 District Headquarter 33.3 47.3 40.7 8.8 Mixed 29.3 11.6 19.9 37.5
Sebcon’s UDBA Survey (Village Profile) Q 7. Water Sources (% of Houses)
Project Focus Area: Faisalabad Control Area Vehari Jaranwala Samundari Total
Mean Handpump 74.3 65.0 69.3 17.5 Piped_Water 0.0 12.5 6.7 13.3 Electric_Pump 25.7 22.5 24.0 69.2
Sebcon’s UDBA Survey (Village Profile) Q8. Average Number of Livestock in Sampled Villages
Project Focus Area: Faisalabad Control Area
VehariTotal
Jaranwala Samundari Total
Mean Bull Ox Adult 124 116 120 80 108 Bull Ox Young 188 186 187 123 169 Bull Ox Total 312 302 307 203 277 Buffalo Adult 650 1,963 1,350 867 1,212 Buffalo Young 400 1,213 833 400 710 Buffalo Total 1,050 3,175 2,183 1,267 1,921 Cow Adult 59 370 225 162 207 Cow Young 71 215 148 103 135 Cow Total 129 585 372 265 342 Sheep Goat Adult 429 1,744 1,130 567 969 Sheep Goat Young 544 1,806 1,217 542 1,024 Sheep Goat Total 973 3,550 2,347 1,108 1,993 Horse Adult 2 10 7 9 7 Horse Young 3 1 2 1 1 Horse Total 6 11 8 9 9 Donkey Adult 67 150 111 67 99 Donkey Young 109 70 88 30 71 Donkey Total 176 220 199 97 170
Sebcon’s UDBA Survey (Village Profile)

EUDBA Survey Report, 2009: Appendix Village Profile Tables
Q9. Average # of HH have 2 or more Large Ruminants
Project Focus Area: Faisalabad Control Area
VehariTotal
Jaranwala Samundari Total
Mean Large Ruminants 364 743 554 326 494
Sebcon’s UDBA Survey (Village Profile)