WAGE POLICY OF CONTRACT WORKERS AND ITS IMPACT ON …
16
WAGE POLICY OF CONTRACT WORKERS AND ITS IMPACT ON WORKING ENVIRONMENT (WITH SPECIAL REFERENCE TO BEML LTD KGF COMPLEX) Author Dr. G. ELUMALAI, Assistant Professor of Economics, Government First Grade College, KGF-563122. Contact No.9740469295, email: [email protected] Co-Author Dr.J.ANTHONY GRUZE THANGARAJ, professor Of Commerce Sri Bhagawan Mahaveer Jain First Grade College, Kolar Gold Fields. 563112. Contact No: 8072744513 email:[email protected] ABSTRACT This paper aims to analyze the socio-economic and wage policy of contract workers and its impact on their working environment (with special reference to BEML (Ltd)), Kolar Gold Fields complex, this study contains both Primary and secondary data. The researcher has used a convenient sampling technique for the selection of the 115 respondents. Percentage Analysis is used throughout the study. The researcher has applied the chi-square test by using SPSS to test the relationship between socio-economic profiles of the respondents such as gender, Age, Educational status, monthly income, and employment status, living areas, and the family type and their level of satisfaction. The chi-square results reveal that there is no significant association between gender, age, educational status, and marital status of the respondents and level of satisfaction on wage policy. On the other hand, the hypothesis is rejected for monthly income and residential status it means there is a significant association between the aforesaid two socio- economic factors. In order to find whether the level of satisfaction differs on the basis of present status, employees category and employees division deals with wage policy the researcher has applied Kruskal Wallis test results found that there is no significant association between employees’ category and on the other hand there is a significant association between employees present status and division. Keywords: wage policy, Employment, and Unemployment Survey (EUS), National survey sample, pay commission, Wutan Huatan Jisuan Jishu Volume XVI, Issue X, OCT/2020 ISSN:1001-1749 Page No:500
Transcript of WAGE POLICY OF CONTRACT WORKERS AND ITS IMPACT ON …

WAGE POLICY OF CONTRACT WORKERS AND ITS IMPACT ON WORKING
ENVIRONMENT
(WITH SPECIAL REFERENCE TO BEML LTD KGF COMPLEX)
Author
Dr. G. ELUMALAI,
Assistant Professor of Economics,
Government First Grade College, KGF-563122.
Contact No.9740469295,
email: [email protected]
Co-Author
Dr.J.ANTHONY GRUZE THANGARAJ,
professor Of Commerce
Sri Bhagawan Mahaveer Jain First Grade College,
Kolar Gold Fields. 563112.
Contact No: 8072744513
email:[email protected]
ABSTRACT
This paper aims to analyze the socio-economic and wage policy of contract workers and its
impact on their working environment (with special reference to BEML (Ltd)), Kolar Gold Fields
complex, this study contains both Primary and secondary data. The researcher has used a
convenient sampling technique for the selection of the 115 respondents. Percentage Analysis is
used throughout the study. The researcher has applied the chi-square test by using SPSS to test
the relationship between socio-economic profiles of the respondents such as gender, Age,
Educational status, monthly income, and employment status, living areas, and the family type
and their level of satisfaction. The chi-square results reveal that there is no significant association
between gender, age, educational status, and marital status of the respondents and level of
satisfaction on wage policy. On the other hand, the hypothesis is rejected for monthly income
and residential status it means there is a significant association between the aforesaid two socio-
economic factors. In order to find whether the level of satisfaction differs on the basis of present
status, employees category and employees division deals with wage policy the researcher has
applied Kruskal Wallis test results found that there is no significant association between
employees’ category and on the other hand there is a significant association between employees
present status and division.
Keywords: wage policy, Employment, and Unemployment Survey (EUS), National survey
sample, pay commission,
Wutan Huatan Jisuan Jishu
Volume XVI, Issue X, OCT/2020
ISSN:1001-1749
Page No:500

Introduction
Wage policy adopted in India raises several strong questions among the workers, at the
same time they do not have any alternative ways for claiming their rights in getting right wages
and, whether wage policy adopted is really paid to them becomes a question. As per
Employment and Unemployment Survey (EUS) of national survey sample Office (NSSO), in
2011-2012, the average wage in India was fixed Rs.247 per day and to casual workers it was
Rs.143 per day. After this the government of Indian has implemented 7th
pay commission to all
the central and state government employees in the year 2016, recommendations made on 29th
June 2016 and brought into effect from 1st January 2016, as compared to 7
th pay, the daily wages
and casual employees earning is very low in India. Wage of the employees is fixed only for him
not considered his dependents like family and children. The minim wage of casual labourers is a
standing evidence for it. The implementation of high end of salary one side and leaving others
created a vast difference. It leads for living rich to rich and poor to poor in India and become one
of the reasons for long lasting persistence of Classes in India.
In Indian same wage policy is not adopted by all the 28 states and 9 union territories though
central government has central policy for wage. In India each state follows its own wage policy,
instead of the central policy. And this wage policy is adopted based on skill of the employees and
categorized as unskilled, semi skilled and highly skilled.
Adaptation of wage policy at the time of natural disasters is not properly defined in the wage
policy of India. It creates more confusion and leads unwanted discriminations when such natural
calamities arise. It is evident from the present pandemic COVID-19, many of the private
companies and workers working in unorganized sectors are not paid usual salary and unwanted
cuts in the salary is adopted by the management without prior notice to the employees. Such
Sudden changes in the wage policy and governments non-involvement makes the employees to
face unwanted problems.
On the other hand our government is adopting policy of equality, provides subsides to the private
companies, and free bees to the general public, adopts food bills for distribution of rations at
subsidies cost and direct fund transfer etc… though these policies have been implemented for
the goodness of the people, we cannot avoid the interventions of the intermediaries involvement.
Wutan Huatan Jisuan Jishu
Volume XVI, Issue X, OCT/2020
ISSN:1001-1749
Page No:501

Therefore the government strategy in the intervention of wage policy adopted in the unorganized
sectors is the need of the hours, when the government comes forward to do so, a lot of changes
shall come in the wage policy otherwise it will stand alone as a draft, prevention of poverty and
eliminations of classes is not possible unless right wage policy is adopted. The dream of
visionaries in building India and Indian society should come true only when the differences in
the midst of the community are weeded out. In doing so the implementation of wage policy
becomes one of the tolls. For equalizing people disparities in the earning capacity their earning
capacity should be paralleled. It shall strengthen the economic position of the individuals.
Statement of the problem
The present situation of COVID-19 and its effective spurge in the world has forced the workers
to earn for their livelihood. But when government is imposing lack downs for containing the
virus poses a lot of impediments for earning, already daily workers, contract worker, and casual
labourers are facing earning problem, along with this now wages are not paid according the
minimum wage policy due to continuous lock down and Quarantine procedures, now the
labourers are in a problem for their daily earning
Here in this research the researcher is taking the task of identifying the wages paid to the
contract workers who are working in the BEML (Ltd) Kolar Gold fields complex, though this
coming under central government unit it has tow system of functioning like one and a major is
based on permanent system with the permanent employees on the other hand contract system is
functioning, this study is focusing on the wage system adopted in the contract base of workers.
Review of literature
Fred Luthans and Bruce J. Avolio et al (2007) Investigates the level of performance of
employees in the organization based the psychological factors here investigation is made to
know whether relationship is existing between performance and Psychology of employees. This
is done based on the four comments like hope, resilience, optimism and efficacy of individual’s
Factors considered for performance and satisfaction. This study suggest that employees who are
more hopeful, optimistic, efficacious, and resilient are more efficient in facing the dynamic
global environmental challenges in confronting the organizational challenges with their
counterparts with lower Psychological capital. Initial study also indicates investment in
Wutan Huatan Jisuan Jishu
Volume XVI, Issue X, OCT/2020
ISSN:1001-1749
Page No:502

psychological capital yields more results beyond the traditional forms of capital investment in
consideration of overall human resources, on the other hand the focus is also linking with
psychology capital with the leaders and impacts the followers ,this study provides positive
approach for hope, resilience, efficacy and optimism have core values for psychological capital
that can be measures and related to the performance and satisfaction of employees.
Nitu bose ghosh and geetha Rajaram (2017) “Emotional intelligence and decision making A
requisite for the sustainability of Learning” investigates the role of emotional intelligence and
learning organization the learning of organization from the perspective of vision and mission,
leadership commitments, Team learning, shared vision, experimentation and rewards, effective
transfer of knowledge and organization culture. All the employees in the organization take
decision based on the daily basis and operational efficiency is depending on employee’s
empowerment, team work, and consensus decision-making. This study also reveals that
employee’s diverse decision behavior has different impact on organizational performance
effectiveness.
Objectives of the study
1. To study efficient wage allocation and appropriate systems of payments.
2. To rationalize inter-occupational, wage differential disparities are reduced in a phased manner.
3. To ensure reduction of disparities of wages between differ categories of contract workers.
Hypothec of the study
The following hypothesis is framed to fulfill the objectives of the present design study.
There is no significant association between socioeconomic variables and levels of
satisfaction of contract workers' wages system.
There is no significant influence between the profile of the contract workers and the
level of satisfaction of wages paid.
Methodology
This study is both descriptive and explorative in nature for the study both primary and
secondary data are used. The primary data was collected through the structured questionnaire
and secondary data collected through secondary sources like books, articles and magazines,
Wutan Huatan Jisuan Jishu
Volume XVI, Issue X, OCT/2020
ISSN:1001-1749
Page No:503

websites, and so on. The researcher used a convenient sampling technique for the selection of
115 respondents which is decided by using the use of online sources like www.surveysytm.
To analyze the data, the researcher has used percentage analysis, chi-square test, and Kruskal
Wallis test with the help of SPSS 20 (statistical package for Social Science)
Results and discussions
The researcher has gathered socio-economic profile and working environment profile of the
contract workers in BEML (Ltd) KFG complex.
Socio-Economic Profile of the Respondents
The Researcher has collected the socio-economic profile of the respondents such as gender of
the respondents, Age of the respondents, educational status of the respondents, Monthly Income
of the respondents, Residential status of the respondents, and marital status of the respondents.
These details are presented in Table 1.
Table 1: Socio-Economic Profile of the Respondents
S.No Particulars No of Respondents Percentage 1. Gender Male 113 98.3
Female 2 1.70 Total 115 100.00
2. Age Up to 25 2 1.70 26-35 23 20.0 36- 45 44 38.3 Above 45 46 40.0 Total 115 100.00
3. Educational status SSLC 17 14.8 PUC 1 0.90 Diploma 12 10.4 ITI 70 60.9 others 15 13.0 Total 115 100.00
4. Monthly Income Below Rs.10000 31 27.0 Rs.10001-20000 71 61.7 Rs.20001-30000 1 0.90 and above Rs.30,000 12 10.4 Total 115 100.00
5. Residential status Urban 57 49.60 Rural 32 27.80 Semi-urban 26 22.60 Total 115 100.00
6. Marital status Married 105 91.30 UN –Married 10 8.70 Total 115 100.00
Source: Primary data
Wutan Huatan Jisuan Jishu
Volume XVI, Issue X, OCT/2020
ISSN:1001-1749
Page No:504

Table no 1 shows that out of 115 respondents, 98.3 % of the respondents are male; 40.0%
percentage of respondents under the age group of Above 40 years; 60.9 % of the respondents
studied ITI; 61.70 % of the respondents falling under monthly income category of Rs.10,001-
20,000; 49.60% of the respondents from Urban area; and 91.30 % of the respondents are
married.
Profile of the contract workers in BEML (Ltd.,)
The researcher has collected the data relating to the contract workers profile, like Employees
present status, employees category, Section, Employees Division. These details are presented In
the Table.2.
Table 2: contract workers profile
S.No Particulars No of Respondents Percentage
1. Employees present
status
Turner 22 19.10
Welder 26 22.60
Fitter 27 23.50
parts assembling 9 7.80
others 31 27.0
Total 115 100.00
2. Employees
category
Skilled 78 67.80
Semi skilled 26 22.60
Unskilled 11 9.60
Total 115 100.00
3. Section Technical 89 77.4
Non-technical 26 22.6
Total 115 100.0
4. Employees division Earth moving 79 68.7
Marketing 6 5.2
Hydraulic & power 23 20.0
Research &
development 7 6.1
Total 115 100.0
Source: Primary data.
Table 2 explicit that out of 115 respondents, 27.0% of the respondents belong to other category
under employee’s present status,67.8% of the respondents belong to the skilled category, 77.4%
of the respondents belong to Technical category and 68.70% of the respondents belongs the earth
moving division.
Wutan Huatan Jisuan Jishu
Volume XVI, Issue X, OCT/2020
ISSN:1001-1749
Page No:505

Opinion regarding variables of contract workers wage satisfaction
The researcher has analyzed the opinion of respondents about the variables of contract workers
wage satisfaction. The variables are wage or salary, dearness allowances, Bonus, provident fund,
Leave Benefits, and other allowances. The researcher has collected the opinion about the above
said variables with the help of Likert five point scaling Techniques; Table 3 shows the opinion of
respondents.
Table 3: Opinions regarding variables of contract workers wage satisfaction. S.NO Particulars HS S N D H D Total
Different form of salary or wages
1. Wage or salary 14
12.2
44
(38.3)
39
(33.9)
18
(15.7)
-
115
(100.00)
2. Dearness Allowance 2 (1.7)
21 (18.3)
48 (41.7)
30 (26.6)
14 (12.2)
115 (100.00)
3. Bonus 10
(8.7)
56
(48.7)
36
(31.3)
13
(11.3)
- 115
(100.00)
4. Provident Fund 19 (16.5)
49 (42.6)
39 (33.9)
8 (7.0)
- 115 (100.00)
5. Leave Benefits 1
(0.9)
22
(19.1)
38
(33.0)
47
(40.9)
7
(6.1)
115
(100.00)
6. Other Allowances 1 (0.9)
20 (17.4)
64 (55.7)
26 (22.6)
4 (3.5)
115 (100.00)
II-Incentives for motivating
7. Annual bonus based on the company’s achievements 14
(12.2)
43
(37.4)
46
(40.0)
12
(10.4)
- 115
(100.00)
8. An extra day off as a reward of well- done projects 1
(0.90)
20
(17.4)
27
(23.5)
55
(47.8)
12
(10.4)
115
(100.00)
9. An article of you at work, published in the company
magazine.
3
(2.6)
7
(6.1)
21
(18.3)
55
(47.8)
29
(25.2)
115
(100.00)
10. Lunch with boss and team members in the company’s
Cafeteria as reward
2
(1.7)
14
(12.2)
29
(25.2)
41
(35.7)
29
25.2)
115
(100.00)
11. A personal “ thank you” or Note of appreciation
from supervisor, manager, or co-workers.
11
(9.6)
51
(44.3)
37
(32.2)
15
(13.0)
1
(0.90)
115
(100.00)
12. Verbal Praise of appreciation from the manager in
front of the colleagues
22
(19.1)
40
(34.8)
38
(33.0)
15
(13.0)
- 115
(100.00)
13. Allowed to purchase the work tools and software of choice
3 (2.6)
22 (19.1)
55 (47.8)
35 (30.4)
- 115 (10.00)
14. Flexible office hours 4
(3.5)
35
(30.4)
43
(37.4)
26
(22.6)
7
(6.1)
115
(100.00)
15. Opportunity for promotion - 5 (4.3)
22 (19.1)
62 (53.9)
26 (22.6)
115 (100.00)
16. Relaxation room for lunch 2
(1.7)
10
(8.7)
34
(2.6)
44
(38.3)
25
(21.7)
115
(100.00)
17. Companies benefit programmes to gyms, public swimming pools and other exercising
- 4 (3.5)
17 (14.8)
61 (53.0)
33 (28.7)
115 (100.00)
III- Benefits and services
18. Leave facility 3
(2.6)
34
(29.6)
35
(30.4)
37
(32.2)
6
(5.2)
115
(100.00)
19. Medical facilities(ESI) - 39 (33.9)
52 (45.2)
19 (16.5)
5 4.3)
115 (100.00)
20. Drinking water 1
(0.9)
47
(40.9)
55
(47.8)
8
(7.0)
4
(3.5)
115
(100.00)
21. Refreshment facility 4 (3.5)
51 (44.3)
31 (27.0)
24 (20.9)
5 (4.3)
115 (100.00)
22. Recreational facility 1
(0.90)
11
(9.6)
19
(16.5)
65
(56.5)
19
(16.5)
115
(100.00)
23. Canteen 14 (12.2)
64 (55.7)
24 (20.9)
12 (10.4)
1 (0.90)
115 (100.00)
24. Rest and Lunch room 18
(15.7)
53
(46.1)
29
(25.2)
15
(13.0)
- 115
100.00
Wutan Huatan Jisuan Jishu
Volume XVI, Issue X, OCT/2020
ISSN:1001-1749
Page No:506

25. Children education facilities 1
(0.90)
10
(8.7)
16
(13.9)
66
(57.4)
22
(19.1)
115
(100.00)
26. Supply of uniform 7
(6.1)
52
(45.2)
33
(28.7)
17
(14.8)
6
(5.2)
115
(100.00)
27. Housing facilities - 2 (1.7)
24 (20.9)
56 (48.7)
33 (28.7)
115 (100.00)
28. Special medical aid 2
(1.7)
11
(9.6)
18
(15.7)
51
(44.3)
33
(28.7)
115
(100.00)
29. Retirement benefits 1
(0.90)
4
(3.5)
31
(27.0)
56
(48.7)
23
(20.0)
115
(100.00)
30. Transportation facility 15
(13.0)
41
(35.7)
36
(31.3)
22
(19.1)
1
(0.90)
115
(100.00)
31. Special enrichment training 1 (0.90)
10 (8.7)
12 (10.4)
52 (45.2)
40 (34.8)
115 (100.00)
Source: Primary data;
Figures in Bracket are percent to total
HA= Highly satisfied; S= satisfied; N= Neutral; D=Dissatisfied; HD= Highly Dissatisfied.
Different form of Wages or salaries
Table 3 revealed that most of the respondents have agreed with the statements serial numbered 1,
3, and 4 12.4% of the respondents have highly satisfied with the statement “wages or salaries”;
0.0% of the respondents have disagreed with the statement wages or salaries, Bonus, provident
fund. 40.9% 0f the respondents have disagreed with Leave Benefits and 41.7% of the
respondents have neutralized their stand with Dearness allowance.
Incentives for motivation
Under the opinion regarding incentives and motivation, majority of the respondents have
disagreed with the statements 8, 9, 10, 15 and 16,
Benefits and services
In benefits and services, Majority of the respondents have disagreed with the statements serial
numbered 18,21,22,25,27,28,29 and 31.
Identification of Level of Satisfaction
The researcher has identified 16 out of 31 statements which have value of more than 0.5 from
variables of contract workers wage satisfaction through factor analysis. So the respondents’ level
of satisfaction has been determined and analyzed by 16 statements. For the purpose of
computation of level of satisfaction, the researcher has assigned the following ranks
Wutan Huatan Jisuan Jishu
Volume XVI, Issue X, OCT/2020
ISSN:1001-1749
Page No:507

Highly satisfied Satisfied Neutral Dissatisfied Highly Dissatisfied
5 4 3 2 1
The level of satisfaction is measured in the two levels which are dissatisfied and satisfied. The
respondents who have scored 48 i.e. (3*16) and above are comes under the category of satisfied
and that whose score is below 48 comes under the category of dissatisfied. The level of
satisfaction of 115 respondents is shown in Table 4
Table no 4 Level of satisfaction
S.NO Particulars No. of Respondents Percentage in Total
1. Dissatisfied 63 54.8
2. Satisfied 52 45.2
Total 115 100.0
Source: Computed Primary Data
It has been observed that out of 115 respondents, 63 ( 54.8%) of the contract workers dissatisfied
of the wage system adopted in the BEML(LTD) of KGF complex, and the remaining 52( 45.2%)
of the contract workers are satisfied of the wage system adopted.
A Relationship study between Socio-Economic profile of the respondents and their level of
satisfaction – Application of Chi-square Test
The researcher has used the Chi-square test to the relationship between socio-economic
profiles of the respondents such as Gender, Age, educational status, Monthly Income, Residential
status and marital status and their level of satisfaction with the help of SPSS.
Chi-Square Test
Chi-square Test is one of the simplest and mostly widely used non-parametric tests used in
statistical analysis, the χ2 symbol is Greek letter Chi. the χ2 was first discover by Karl person in
the year 1900. The quantity χ2 describes the magnitude discrepancy between theory and
observation. The test statistics of χ2 has been computed as follows.
𝐶ℎ𝑖 − 𝑆𝑞𝑢𝑎𝑒 χ2 = = o−E
E
𝐸 =𝑅𝑜𝑤 𝑇𝑜𝑡𝑎𝑙 𝑋 𝐶𝑜𝑙𝑢𝑚𝑛 𝑇𝑜𝑡𝑎𝑙
𝐺𝑟𝑎𝑛𝑑 𝑇𝑜𝑡𝑎𝑙
Wutan Huatan Jisuan Jishu
Volume XVI, Issue X, OCT/2020
ISSN:1001-1749
Page No:508

O = Observed frequenciest
E= Expected Frequencies
Df= Degree of Freedom
Df-(r-1) (c-1)
r- Row
C-Column
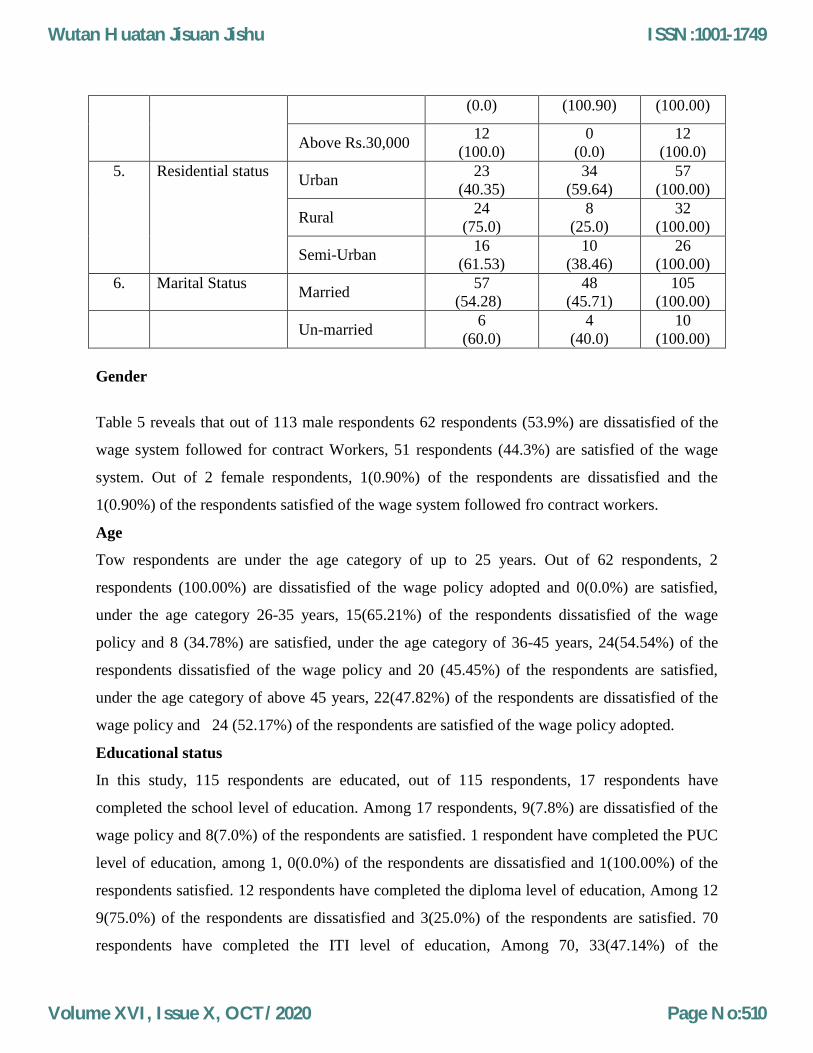
Table 5 shows the cross tabulation of Socio-economic Variables and Level of Penetration.
Table 5: Socio-Economic Variables and level of contract workers wage satisfaction: Cross-
Tab
S.No Particulars Level of satisfaction Total
Dissatisfied Satisfied
1. Gender Male 62
(70.06)
51
(45.13)
113
(100.00)
Female 1
(50.0)
1
(50.0)
02
(100.00)
2. Age Up to 25 2
(100.00)
0
(0.0)
2
(100.00)
26-35 15
(65.21)
8
(34.78)
23
(100.00)
36- 45 24
(54.54)
20
(45.45)
44
(100.00)
Above 45 22
(47.82)
24
52.17)
46
(100.0)
3. Educational status SSLC
9
(7.8)
8
(7.0)
17
(14.8)
PUC
0
(0.0)
1
(100.00)
1.
(100.00)
Diploma 9
(75.0)
3
(25.0)
12
(100.00)
ITI 33
(47.14)
37
(52.85)
70
(100.00)
Others 12
(80.0)
3
(20.0)
15
(100.0)
4. Monthly Income Below Rs.10,000
14
(45.16)
17
(54.83)
31
(100.00)
Rs.10001- 20,000 37
(52.11)
34
(47.8)
71
(100.00)
Rs.20001- 30,000 0 1 1
Wutan Huatan Jisuan Jishu
Volume XVI, Issue X, OCT/2020
ISSN:1001-1749
Page No:509
(0.0) (100.90) (100.00)
Above Rs.30,000 12
(100.0)
0
(0.0)
12
(100.0)
5. Residential status Urban
23
(40.35)
34
(59.64)
57
(100.00)
Rural 24
(75.0)
8
(25.0)
32
(100.00)
Semi-Urban 16
(61.53)
10
(38.46)
26
(100.00)
6. Marital Status Married
57
(54.28)
48
(45.71)
105
(100.00)
Un-married
6
(60.0)
4
(40.0)
10
(100.00)
Gender
Table 5 reveals that out of 113 male respondents 62 respondents (53.9%) are dissatisfied of the
wage system followed for contract Workers, 51 respondents (44.3%) are satisfied of the wage
system. Out of 2 female respondents, 1(0.90%) of the respondents are dissatisfied and the
1(0.90%) of the respondents satisfied of the wage system followed fro contract workers.
Age
Tow respondents are under the age category of up to 25 years. Out of 62 respondents, 2
respondents (100.00%) are dissatisfied of the wage policy adopted and 0(0.0%) are satisfied,
under the age category 26-35 years, 15(65.21%) of the respondents dissatisfied of the wage
policy and 8 (34.78%) are satisfied, under the age category of 36-45 years, 24(54.54%) of the
respondents dissatisfied of the wage policy and 20 (45.45%) of the respondents are satisfied,
under the age category of above 45 years, 22(47.82%) of the respondents are dissatisfied of the
wage policy and 24 (52.17%) of the respondents are satisfied of the wage policy adopted.
Educational status
In this study, 115 respondents are educated, out of 115 respondents, 17 respondents have
completed the school level of education. Among 17 respondents, 9(7.8%) are dissatisfied of the
wage policy and 8(7.0%) of the respondents are satisfied. 1 respondent have completed the PUC
level of education, among 1, 0(0.0%) of the respondents are dissatisfied and 1(100.00%) of the
respondents satisfied. 12 respondents have completed the diploma level of education, Among 12
9(75.0%) of the respondents are dissatisfied and 3(25.0%) of the respondents are satisfied. 70
respondents have completed the ITI level of education, Among 70, 33(47.14%) of the
Wutan Huatan Jisuan Jishu
Volume XVI, Issue X, OCT/2020
ISSN:1001-1749
Page No:510

respondents are dissatisfied of the wage policy adopted and 37(52.85%) of the respondents are
satisfied. 15 respondents have completed other level of education, among 15, 12(80.0%) of the
respondents are dissatisfied of the wage policy and 3(20.0%) of the respondents are satisfied.
Monthly income
31 respondents have earned income of below Rs.10,000, among 31 respondents 14
respondents(45.16%) are not dissatisfied of the earning and 17 (54.83%) of the respondents are
satisfied of the earnings.71 respondents have earned income between Rs.10001- 20,000, among
71 respondents 37 (52.11%) respondents are dissatisfied of the earnings and 34(47.8%) of the
respondents are satisfied of the their earnings. 1 respondent have earned income between
Rs.20001- 30,000,among 1 respondent (0.0%) of the respondents are dissatisfied and 1
respondent (100.00%) are satisfied of the earnings.12 respondents have earned income above
Rs.30,000, among 12 respondents 12(100.00%) of the respondents are dissatisfied and the
(.0.0%) of the respondents are satisfied of their earnings.
Residential status
57 respondents are living in Urban areas, among 57 respondents 23 (40.35%) of the respondents
are dissatisfied of the wage policy adopted and 34(59.64%) of the respondents are satisfied of the
wage policy adopted.32 respondents are living in Rural areas, among 32 respondents 24 (75.0%)
of the respondents are dissatisfied of the wage policy and 8(25.0%) of the respondents are
satisfied of the wage policy. 26 respondents are from Semi-Urban areas, among 26 respondents
16(61.53%) of the respondents are dissatisfied of the wage policy adopted and the remaining
10( 38.46%) of the respondents are satisfied of the wage policy adopted.
Marital Status
105 respondents are falling under the married category, among 105 respondents 57 (54.28%)
respondents are dissatisfied of the wage policy and 48 (45.71%) of the respondents are satisfied
of the wage policy adopted. 10 respondents are falling under the unmarried category, among 10
respondents 6(60.0%) of the respondents are dissatisfied and 4(40.0%) of the respondents are
satisfied of the wage policy adopted.
Chi-square result of socio-economic variables and the level of satisfaction is shown in the
Table 6.
Wutan Huatan Jisuan Jishu
Volume XVI, Issue X, OCT/2020
ISSN:1001-1749
Page No:511

Table 6: Socio-economic variables and level of satisfaction: chi-square Test Result
S.No Particulars Pearson Chi-square
value Hypothesis Result
1. Gender 0.891 Accepted Not significant
2. Age 0.313 Accepted Not significant
3. Educational status 0.069 Accepted Not significant
4. Monthly Income 0.006 Rejected Significant
5. Residential status 0.005 Rejected Significant
6. Marital status 0.713 Accepted Not significant
Source: computed data
With regard to gender, Age, educational status and Marital Status Chi-Square test result revels
that Parsons Chi-square value is greater than the significant value of 0.05. So the null hypothesis
is accepted. Hence, there is no significant association between gender, Age, Educational status
and marital status of the responders and the level of satisfaction on wages received by contract
workers of BEML (Ltd.,) KGF complex.
With regard to other variables, the person’s Chi-square value is less than significant value of
0.05. Therefore, the null hypothesis is rejected. Hence, it is concluded that there is significant
association between socio-economic variables such as Monthly Income and Marital Status and
the level of satisfaction of the contract workers in BEML (Ltd.,) KGF complex.
Contract workers profile and level of satisfaction Application of Kruskal Wallis Test
In order to find out whether the level of satisfaction of the contract workers differ on the
basis of the wage of the contract workers, by taking into consideration of profile of employees
present status, Employees category and employee section. The researcher has applied
Krskal Wallis Test
If several independent samples are involved, analysis of variance is the usual procedure. Failure
to meet the assumptions needed for analysis of variance makes its value doubtful. An alternative
technique was developed called the Kruskal wallis one-way analysis of variance or the H-test.
Wutan Huatan Jisuan Jishu
Volume XVI, Issue X, OCT/2020
ISSN:1001-1749
Page No:512

This test helps in testing the null hypothesis that K independent random samples come from
identical population against the alternative hypothesis that the means of these samples are not all
equal.
As is done in the mann-whitney U-test, all data are ranked as if they were in one sample, from
lowest to highest. Then, the rank sums of each sample are calculated. The H-test is calculated
from the formula:
𝐻 =12
𝑁 𝑁 + 1 𝑅2
𝑛1+𝑅22
𝑛2+𝑅𝑘2
𝑛3 − 3(n + 1)
When n1,n2…rK are the numbers in each of k sample, N= n1+n2+ … nk, and R1,R2…. Rk are
the rank sums of each sample. If there are tied, the usual procedure is followed; but H is fairly
sensitive to ties. So if there are very many of them, a correction should be made. The effect of
the correction is to increase slightly the value of H, so its use is not imperative, for small
samples, H is approximately distributed as chi-square with K-1 degrees of freedom. If the null
hypothesis is true and each sample has at least five observations, the sampling distribution of H
can be approximated closely with a chi-square distribution with k-1 degrees of freedom.
The researcher has framed the hypothesis that “there is no significant difference in the level of
satisfaction of employee’s present status, employee’s category and Employees division”.
Table.7: Results of Kruskal Wallis Test
Type Of The Profile N Mean Rank Result Hypothesis
Level Of
Satisfactions
Turner 22 52.91
0.032 Rejected
Welder 26 67.38
Fitter 27 57.56
Parts Assembling 9 76.72
Other 31 48.69
Total 115
Skilled 78 78
0.334 Accepted Semi Skilled 26 26
Unskilled 11 11
Total 115
Earth moving 79 79 0.002 Rejected
Wutan Huatan Jisuan Jishu
Volume XVI, Issue X, OCT/2020
ISSN:1001-1749
Page No:513

Marketing 6 6
Hydraulic & power 23 23
Research & development 7 7
Total 115
Source: computed primary data
Table.7 reveals that the significant values of kruskal wallis test is less the acceptable level of
0.05.for, emplouees present status and department. Hence the null hypothesis is rejected and it is
concluded that there is significant difference in the level of satisfaction on the basis of wage of
the contract workers,
On the other hand kruskal wallis test is more than the acceptable level of 0.05 for,
employees categories hence the null hypothesis is accepted and it is concluded that there is no
significant difference in the level of satisfaction on the basis of wages of the contract workers
Conclusion:
In the study, it was found that majority of the respondents have agreed with the wage
system adopted in the organization is not having much difference among the different employees
working in the different departments, divisions and under different categories. Hence the
researcher has suggested to the BEML (Ltd) KGF complex to adopt the suitable wage policy for
differentiating the contract employees working under the contract basis. More over this study
reveals that no proper system of wage policy is adopted and employees are working under the
forced circumstance for maintaining their livelihood, the researcher suggest that the suitable
system of wage policy has to be implemented for providing solution for the plight of the contract
workers at least measures suggested might provide satisfaction to them and create congenial
working environment with ideology of employees participation in attaining the goal of
organization.
Wutan Huatan Jisuan Jishu
Volume XVI, Issue X, OCT/2020
ISSN:1001-1749
Page No:514

Reference
1. Fred Luthans and Bruce J. Avolio (2007).Positive Psychological Capital: Measurement and
Relationship with Performance and Satisfaction. Journal of management, 60, pp. 541–572
2. Avey, J. B., Luthans, F., Youssef, C. M. (2010). The additive value of positive psychological
capital in predicting work attitudes and behaviors. Journal of Management, 36(2), 430–452.
3. Nitu Bose Ghosh and Geetha rajarm. ( 2017) Emotional Intelligence and Decision Making A
Requisite for the sustainability of Learning Organization. Journal of management and
Enterpreneurship, 11(2), 67-92.
Webilography
1. https://www.google.com/search?sxsrf=ALeKk01Y6_kunuFjdieCRfCPBnz7FmtOlw%3A159
6159896625&source=hp&ei=mHcjX8G3JI2f4-
EPsPGzuAw&q=wage+policy+in+india&oq=wage+pol&gs_lcp=CgZwc3ktYWIQARgAMg
IIADICCAAyAggAMgIIADICCAAyAggAMgIIADICCAAyAggAMgIIADoHCCMQ6gIQJ
zoNCC4QxwEQrwEQ6gIQJzoHCC4Q6gIQJzoICAAQsQMQgwE6BQgAELEDOgQIIxAn
OgUILhCxAzoCCC46CAguEMcBEK8BUNfQtwNY3OS3A2C28rcDaAFwAHgAgAHPA4
gBhA-SAQkwLjQuMi4xLjGYAQCgAQGqAQdnd3Mtd2l6sAEK&sclient=psy-ab
2. file:///C:/Users/Anthony/Downloads/Chapter%20-%205.pdf
Wutan Huatan Jisuan Jishu
Volume XVI, Issue X, OCT/2020
ISSN:1001-1749
Page No:515