
Can Low-Wage Workers Find Better Jobs? · the early 1980s, traditional middle-skill workers have...
38
This paper presents preliminary findings and is being distributed to economists and other interested readers solely to stimulate discussion and elicit comments. The views expressed in this paper are those of the authors and do not necessarily reflect the position of the Federal Reserve Bank of New York or the Federal Reserve System. Any errors or omissions are the responsibility of the authors. Federal Reserve Bank of New York Staff Reports Can Low-Wage Workers Find Better Jobs? Todd Gabe Jaison R. Abel Richard Florida Staff Report No. 846 April 2018
Transcript of Can Low-Wage Workers Find Better Jobs? · the early 1980s, traditional middle-skill workers have...

This paper presents preliminary findings and is being distributed to economists and other interested readers solely to stimulate discussion and elicit comments.
The views expressed in this paper are those of the authors and do not necessarily reflect the position of the Federal Reserve Bank of New York or the Federal Reserve System. Any errors or omissions are the responsibility of the authors.
Federal Reserve Bank of New York
Staff Reports
Can Low-Wage Workers Find Better Jobs?
Todd GabeJaison R. Abel
Richard Florida
Staff Report No. 846
April 2018

Can Low-Wage Workers Find Better Jobs? Todd Gabe, Jaison R. Abel, and Richard Florida Federal Reserve Bank of New York Staff Reports, no. 846 April 2018 JEL classification: J01, J24, J61, J62
Abstract
There is growing concern over rising economic inequality, the decline of the middle class, and a polarization of the U.S. workforce. This study examines the extent to which low-wage workers in the United States transition to better jobs, and explores the factors associated with such a move up the job ladder. Using data covering the expansion following the Great Recession (2011-17) and focusing on short-term labor market transitions, we find that around 70 percent of low-wage workers stayed in the same job, 11 percent exited the labor force, 7 percent became unemployed, and 6 percent switched to a different low-wage job. Troublingly, just slightly more than 5 percent of low-wage workers found a better job within a 12-month period. Study results point to the importance of educational attainment in helping low-wage workers move up the job ladder.
Key words: low-wage jobs, career ladder, labor market dynamics
_________________
Abel: Federal Reserve Bank of New York. Florida: University of Toronto. Gabe (corresponding author): University of Maine (email: [email protected]). The views expressed in this paper are those of the authors and do not necessarily reflect the position of the University of Maine, the University of Toronto, the Federal Reserve Bank of New York, or the Federal Reserve System.

1
I. INTRODUCTION
The act of finding a better job is not only at the heart of economic development (Gabe,
2017), but it’s a veritable cornerstone of the American Dream of upward mobility, rising living
standards, and a higher quality of life. However, over the past few decades, the ladder of upward
mobility (e.g., children earning more money than their parents) has stalled (Chetty et al., 2017).
Moreover, a growing polarization of the U.S labor market—documented by Autor, Katz, and
Kearney (2006) and Acemoglu and Autor (2011), among others—has made it more difficult for a
large portion of the U.S. workforce to find a good job.
While the economic fortunes of highly-skilled workers have improved substantially since
the early 1980s, traditional middle-skill workers have seen their jobs disappear; forcing more
U.S. workers to take lower-wage jobs (Cortes, 2016). Technological change (e.g., automation)
and globalization (e.g., substituting relatively low-cost labor from other countries) are two of the
driving forces behind these employment patterns. These same forces have increased labor market
opportunities for highly-skilled workers, particularly those who create technology or utilize it to
become more productive. Likewise, many low-skill service industry jobs, which are largely
insulated from these forces because they require physical proximity or face-to-face contact, have
also grown steadily and become a larger part of the U.S. labor market (Autor & Dorn, 2013). As
a result, the U.S. middle class has declined as the labor market and class structure has split into a
small group of high-wage knowledge, professional and creative workers and a much larger
cohort of low-wage workers in routine blue-collar and service jobs (Florida, 2017; Temin, 2017).
These changes in the composition of employment opportunities, coupled with the rising returns
to skill, have been major contributors to economic inequality in the United States (Autor, 2014;
Goldin & Katz, 2010; Murphy & Topel, 2017).
2
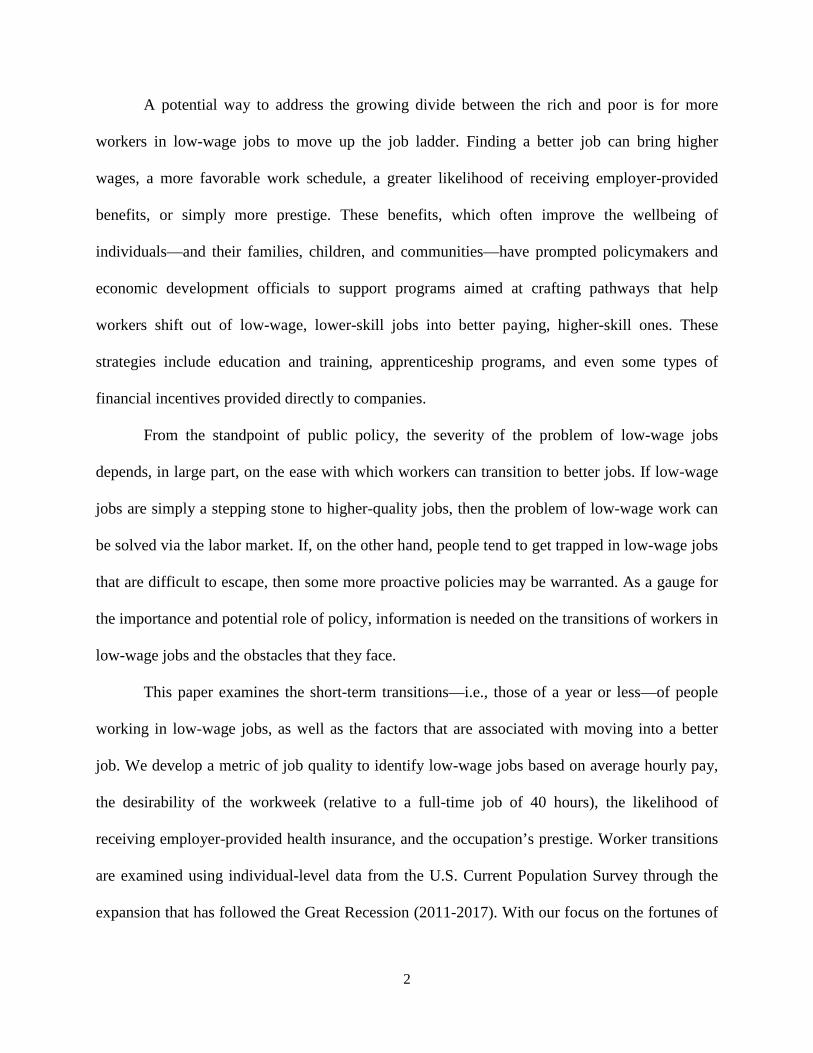
A potential way to address the growing divide between the rich and poor is for more
workers in low-wage jobs to move up the job ladder. Finding a better job can bring higher
wages, a more favorable work schedule, a greater likelihood of receiving employer-provided
benefits, or simply more prestige. These benefits, which often improve the wellbeing of
individuals—and their families, children, and communities—have prompted policymakers and
economic development officials to support programs aimed at crafting pathways that help
workers shift out of low-wage, lower-skill jobs into better paying, higher-skill ones. These
strategies include education and training, apprenticeship programs, and even some types of
financial incentives provided directly to companies.
From the standpoint of public policy, the severity of the problem of low-wage jobs
depends, in large part, on the ease with which workers can transition to better jobs. If low-wage
jobs are simply a stepping stone to higher-quality jobs, then the problem of low-wage work can
be solved via the labor market. If, on the other hand, people tend to get trapped in low-wage jobs
that are difficult to escape, then some more proactive policies may be warranted. As a gauge for
the importance and potential role of policy, information is needed on the transitions of workers in
low-wage jobs and the obstacles that they face.
This paper examines the short-term transitions—i.e., those of a year or less—of people
working in low-wage jobs, as well as the factors that are associated with moving into a better
job. We develop a metric of job quality to identify low-wage jobs based on average hourly pay,
the desirability of the workweek (relative to a full-time job of 40 hours), the likelihood of
receiving employer-provided health insurance, and the occupation’s prestige. Worker transitions
are examined using individual-level data from the U.S. Current Population Survey through the
expansion that has followed the Great Recession (2011-2017). With our focus on the fortunes of

3
low-wage workers, the specific outcomes considered are: exiting the labor force, becoming
unemployed, remaining in the same job, moving into a different low-wage job, or finding a better
job. The regression models, estimated using a multinomial logit framework, include individual-
level characteristics such as educational attainment and age, as well as controls for the industry
of work. Our findings show that only a relatively small percentage of low-wage workers
transition into better jobs. In fact, low-wage workers are more likely to become unemployed than
to move up the job ladder. The analysis further points to the importance of educational
attainment in helping low-wage workers transition into higher-quality occupations. Among the
types of jobs that facilitate this transition, sales-related occupations, administrative support jobs,
and truck drivers appear to offer a particularly important pathway for escaping low-wage work.
Related Literature
Other studies have analyzed occupational and labor market mobility in the United States
(Kambourov & Manovskii, 2008; Moscarini & Thomsson, 2007) and the rest of the world
(Bachmann et al., 2015; Lalé, 2012; Stier & Endeweld, 2015; Theodossiou & Zangelidis, 2009).
Although much of this work examines the mobility of workers across the entire spectrum of job
types, some studies have focused on the movement of U.S. workers in technology-based
occupations and businesses (Almeida & Kogut, 1999; Fallick, Fleischman & Rebitzer, 2006;
Freedman, 2008). Related research has examined occupational mobility over the lifecycle
(Gervais et al., 2016; Gorry, Gorry & Trachter, 2014; Topel & Ward, 1992) and the impacts of
personal characteristics (e.g., gender) on labor market transitions (Bleakley & Lin, 2012; Stier &
Endeweld, 2015; Theodossiou & Zangelidis, 2009; Wilkins & Wooden, 2013). These studies
show that mobility decreases with age, consistent with younger workers trying multiple jobs to
find their optimal match, whereas the effects of characteristics such as gender are less clear cut.

4
Our analysis of the transitions of low-wage workers differs from many studies of occupational
mobility in that we focus on people at the bottom of the labor market, but we use many of the
same characteristics (e.g., age, education, gender) to explain the transitions that occur.
Research on occupational mobility has also examined the role of human capital in job
changes. While having more education and skills generally means a better job and higher wages,
changing jobs can adversely impact some aspects of human capital. Kambourov and Manovskii
(2009) find that a large portion of a person’s human capital is tied to a specific job, and therefore
an occupation change lowers a person’s productivity. This insight explains why occupations
characterized by substantial differences in job tenure have a wide distribution of wages. Focusing
on the skill content of work, Robinson (2017) finds that changing jobs using similar skills carries
a lower wage penalty than moving among occupations with different skill requirements (e.g., an
involuntary switch to a low-skill job). In contrast to studies that examine all sorts of occupation
transitions moving up and down the spectrum of skills required to perform a job, our analysis
focuses on low-wage workers and the outcome of interest is moving into a better job. Thus,
although a worker making this transition may need to acquire some new human capital related to
the job itself, the outcome is viewed as beneficial given the attendant improvement in job
characteristics (e.g., pay, desirability of workweek, access to benefits, prestige).
Theodos and Bednarzik (2006) and Andersson, Holzer, and Lane (2003) examine the
earnings mobility of low-wage workers. Theodos and Bednarzik (2006) find that education has a
positive effect on the earnings growth of low-wage workers—and we expect education to have a
large beneficial influence in our analysis, as well—whereas race and gender do not affect the
earnings mobility of low-wage workers. On the other hand, Andersson, Holzer, and Lane (2003)
find that women and minorities are less likely to transition out of low-earnings occupations.

5
While this research examines changes in earnings of low-wage workers, our study looks at
changes in occupations and other labor market transitions, such as becoming unemployed or
exiting the labor market.
A recent study by Cortes (2016)—utilizing the job-type classification developed by
Acemoglu and Autor (2011)—examines the labor market transitions of a specific cohort of
workers, with a particular focus on those in routine jobs. Consistent with patterns of labor force
polarization, the analysis finds that lower-ability workers in routine jobs (e.g., clerical, laborers)
are more likely to transition into non-routine jobs that involve manual tasks (e.g., services), while
higher-ability workers in routine jobs change to non-routine jobs that involve cognitive tasks
(e.g., business and financial operations). Furthermore, Cortes’ (2016) research shows that people
in routine jobs—referred to as middle-wage workers—experience a large wage premium when
transitioning into non-routine cognitive jobs.
II. IDENTIFYING LOW-WAGE JOBS
What is a low-wage job? Precisely where to draw the line when defining a “low-wage”—
or, more generally, a “low-quality”—job is an important consideration. Researchers interested in
the lower end of the labor market typically focus on either the skills required to perform the job
or the wage level associated with the position itself (Osterman, 2001). Here, we use an
occupation’s average hourly pay to identify low-wage jobs, but also incorporate additional
characteristics related to the desirability of the workweek (compared to a benchmark of 40
hours), the likelihood of receiving employer-provided health insurance, and the occupation’s
prestige. All four job quality metrics are constructed using data on more than 1.3 million
individuals from the 2011 American Community Survey (ACS) (Ruggles et al., 2017), and these
observations are averaged across 487 occupations to create an overall job quality index.

6
Job Characteristics
For the first measure of job quality, hourly pay, the ACS reports an individual’s annual
wage and salary income—and the hourly wage is found by dividing this amount by the estimated
number of hours worked during the year. The 2011 ACS reports a specific value for an
individual’s “usual hours worked per week,” but the number of weeks worked during the past
year is a categorical variable (e.g., 27-39 weeks, 40-47 weeks, 48-49 weeks). For the purposes of
estimating the number of hours worked during the year, we use midpoints of the ranges for the
number of weeks worked. Food service counter attendants, cashiers, and service station
attendants are among the lowest-paying jobs; while the occupations with the highest hourly
wages include physicians, chief executives, and financial analysts.
The second measure of job quality, desirability of the workweek, is found by calculating
the average number of hours worked per week, which was also used to determine the hourly
wage. As an indicator of job quality, however, we compare the average weekly hours in an
occupation to a 40-hour benchmark, with lower deviations (i.e., smaller absolute values) counted
as better jobs. Some of the occupations providing the best hours—i.e., closest to 40 hours per
week—are urban and regional planners, and eligibility interviewers for government programs;
while the jobs with the largest deviations from 40 hours per week include oil and gas drill
operators (more hours), ship and boat captains (more hours), crossing guards (fewer hours), and
dancers (fewer hours).
The third measure of job quality, likelihood of benefits, is the percentage of workers in an
occupation with health insurance provided by the employer or union. Information from the 2011
ACS shows wide variation across occupations in this job quality metric. Over 90 percent of the
workers classified as economists, flight attendants, insurance underwriters, and secondary school

7
teachers—among other occupations—reported having employer-provided health insurance;
compared to less than 35 percent of the workers in occupations such as roofers, dishwashers, and
fishing workers.
The final characteristic used to measure job quality is the occupation’s prestige. This
variable, as reported in the American Community Survey, is based on a framework developed by
P.M. Siegel (1971). In the original job quality index, Siegel (1971) combined information from
several studies, conducted in the 1960s by the National Opinion Research Center, that asked
respondents to evaluate the “social standing” of occupations (Nam, 2000; Stevens and
Hoisington, 1987). Some of the more prestigious occupations include lawyers, aerospace
engineers, and clergy; while the jobs providing the least cachet include maids, animal control
workers, and ushers.
Job Quality Index
We combine the four measures into a single job quality index. The four metrics of job
quality exhibit positive pairwise correlation (as shown in Table 1), with the largest correlation
among occupations being 0.65 for the characteristics of prestige and average hourly wages. Of
the remaining five pairwise combinations, the correlations range from 0.10 to 0.55. The fact that
the individual characteristics of job quality are correlated, but not overly so, suggests that these
dimensions contribute distinct elements to the overall index.
The job quality index is calculated as the sum of the standardized values (i.e., number of
standard deviations above or below the mean) of the four job quality metrics. Some of the
occupations with the lowest overall index scores (with a summation of standardized values of
less than -6.0) are crossing guards, door-to-door sales workers, and dining room attendants;

8
while the highest-quality jobs (with sums of standardized values of more than +5.0) include
chemists, actuaries, and aerospace engineers.
To facilitate our analysis of the transitions of workers along the job quality continuum,
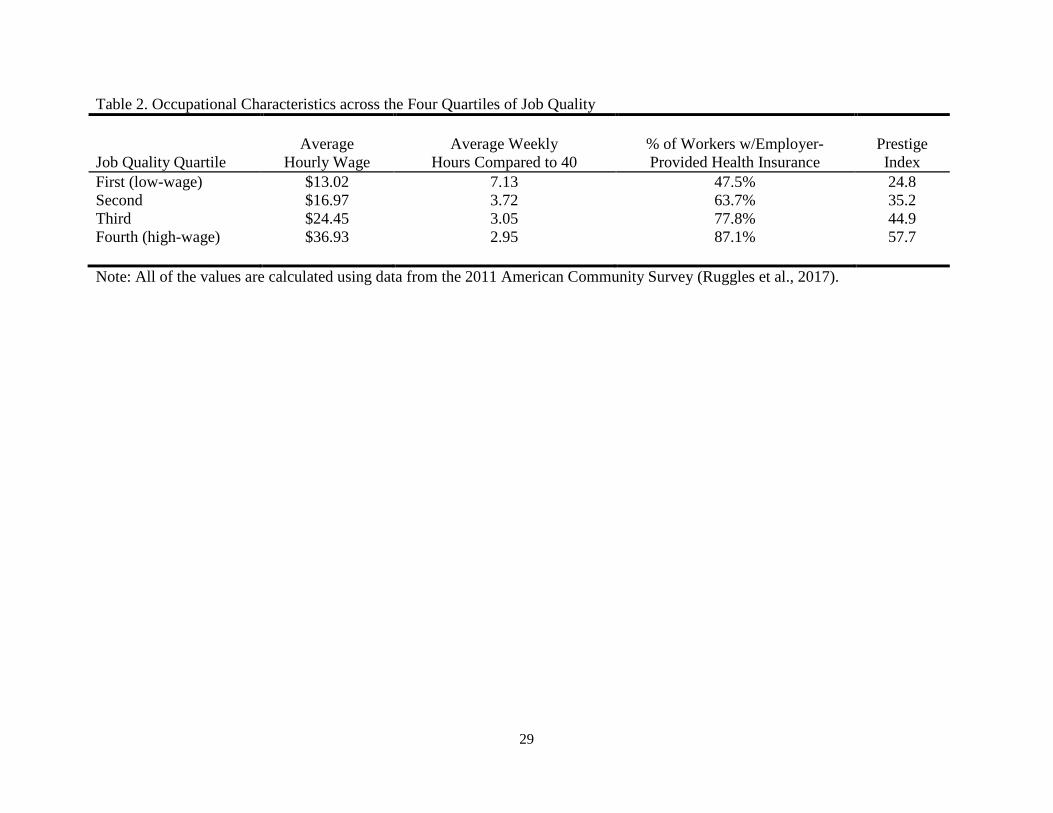
the occupations are placed into quartiles according to the overall index. Table 2 shows average
values of the four job quality metrics for occupations placed in the four quartiles. The
occupations in the first quartile—what we refer to as “low-wage jobs”—have average hourly
wages of about $13.00, an average of a seven-hour deviation from 40 hours per week, and less
than 50 percent of workers in low-wage occupations have employer-provided health insurance.
At the other end of the spectrum, the occupations in the top quartile of the job quality index are
what you could call the “highest-quality” or, simply, “high-wage” jobs. Workers in these
occupations earn an average of just under $37.00 per hour, have schedules that are (on average)
within three hours of 40 hours per week, and almost 90 percent have employer-provided health
insurance.
III. LABOR MARKET TRANSITIONS OF U.S. WORKERS
To analyze the labor market transitions of U.S. workers, we use information on nearly
700,000 individuals covered in the 2011 to 2017 rounds of the March Supplement of the Current
Population Survey (CPS) (Flood et al., 2017). Because these data are not longitudinal, which
would allow us to follow the same group of people over time, we make use of a question that
asks about a person’s “occupation last year” and—to measure short-term labor market
transitions—compare the response to a person’s “current status.”
Some advantages of using the CPS in our analysis are its large sample size, which is
important when focusing on a small segment of the workforce, and its availability through 2017.
Some limitations of using the March CPS to measure labor market transitions are that survey

9
coding errors reduce the accuracy of the data (although these errors have been reduced since
1970) and that “annual” mobility estimates (i.e., comparing a person’s “current” status to “last
year’s occupation”) are more representative of occupational transitions over a shorter time frame
(Kambourov & Manovskii, 2013). The reason for this imprecision around the exact timing of
labor market mobility is that the “current” occupation is, in fact, “the longest job in the previous
calendar year” (Kambourov & Manovskii, 2013; p. 182). Thus, comparing “last year’s
occupation” to one held at some point in the previous year provides a time interval of 12 months
or less.
Other questions from the CPS that refer to a person’s “current status” place workers into
one of the following outcomes as compared to the previous year: (1) exited the labor force, (2)
became unemployed, (3) working in the same occupation, (4) working in a different occupation
of the same quality, or (5) working in a different occupation of a different quality. For workers in
occupations classified as low-wage jobs, the only possible outcome for the last category (i.e.,
different occupation of a different quality) is to have found a better job. For workers in the
second or third quartiles of occupations, the last category could mean that the worker found a
“better” or “worse” position, depending on how the current occupation stacks up to last year’s
job.
Figure 1 shows the percentages of workers, across all four quartiles of job quality, that
fall into the various labor market transition categories. For all workers, the most common
outcome—by a wide margin—is to have the same occupation as the previous year. The
probability of having the same job is much higher, however, for workers in the top quartile of
occupations (87.2 percent) compared to those in low-wage jobs (71.8 percent). Workers in low-
wage jobs are considerably more likely than others to exit the workforce (10.6 percent) or

10
become unemployed (6.7 percent). Accounting for an additional 5.7 percent of workers in the
bottom quartile of occupations that moved into different low-wage jobs, we find that only 5.2
percent of these workers transitioned into better jobs. Given that 87.2 percent of the workers in
the top quartile of jobs reported the same occupation one year later—and another 4.1 percent had
a different occupation in the top quartile—over 91 percent of the workers in the “best jobs”
retained this status.
IV. FINDING A BETTER JOB
Next, we investigate the factors related to the short-term transitions of workers in low-
wage jobs. For this analysis, we focus solely on the roughly 175,000 individuals in our sample
that had—in the previous year—an occupation in the bottom quartile of the job quality index.
Given the discrete nature of the five distinct labor market outcomes described above, we use a
multinomial logit framework for the regression analysis. Occupations in the second, third, and
fourth quartile of the job quality index are grouped into a single category because of the small
share of low-wage workers (i.e., 5.2 percent) who transition to any kind of better job. For ease of
interpretation, the specific results reported in the paper are the estimated marginal effects. These
marginal effects are interpreted as the percentage-point change in the probability of a particular
outcome, given a one-unit change in the explanatory variable. An appealing feature of this
empirical approach is that the sum of the marginal effects for a particular variable, across all five
possible outcomes, is equal to zero. This occurs because if a variable—say, educational
attainment—increases a person’s probability of finding a better job, the same variable must
decrease an individual’s probability of transitioning into one or more of the other outcomes (e.g.,
becoming unemployed).

11
Two of the most important personal characteristics that impact employment outcomes are
education and age, which is a proxy for potential experience. These variables are commonly used
to examine individual earnings and, using a Mincer-style wage regression model, most empirical
studies show positive effects of education and age on earnings (Card, 1999; Gabe, 2009; Goldin
& Katz, 2010; Mincer, 1974). Our regression model used to explore the transitions of workers in
low-wage jobs include four options for a worker’s highest level of formal education: (1) high
school diploma (or equivalent), (2) some college without a degree, (3) two-year college degree,
and (4) four-year college degree or more education. When interpreting the regression results, the
estimated coefficients of these categories are interpreted relative to an “omitted category” of a
worker without a high school diploma (or equivalent). We expect individuals with higher levels
of education to be more apt to find a better job, consistent with studies showing a positive
relationship between earnings and education, and less likely to become unemployed (Mincer,
1991).
The effects of age on the transitions of low-wage workers—despite the positive impacts
of age on earnings—are less clear cut. Past studies of occupational mobility over the lifecycle
find higher rates of job switching for younger workers and labor market transitions decrease with
age (Bleakley & Lin, 2012; Stier & Endeweld, 2015; Theodossiou & Zangelidis, 2009; Wilkins
& Wooden, 2013). One explanation for these findings is that young workers do not have perfect
information about their best occupational fit and that learning takes place, early in a worker’s
career, by trying different jobs. We thus expect younger workers to experience more movement
among occupations, whereas older workers (who may be more entrenched in their jobs) are more
likely to remain in the same occupation.

12
The regression model also includes a set of dummy variables that indicate a worker’s
industry of employment. The specific industry categories used are those that account for at least
five percent of the workers in the bottom quartile of occupations. These include—among
others—the sectors of retail trade, accommodation and food services, construction, healthcare
and social assistance, and “other” services. The omitted category of industries, important for
interpreting the regression results, includes individuals employed in sectors with smaller
percentages of workers in low-wage jobs (e.g., management of companies and enterprises;
professional, scientific, and technical services; finance and insurance). Finally, although not the
main focus of our analysis, the regression model controls for the impacts of other personal
characteristics such as gender, race, ethnicity, and marital status. These variables are commonly
used as control variables in studies of labor market outcomes such as wages and earnings, and
unemployment (Antonovics & Town, 2004; Fortin & Lemieux, 1998; Greenman & Xie, 2008).
Table 3 presents summary statistics of the variables used in the regression analysis. The
results indicate that just 10 percent of workers in low-wage occupations have a four-year college
degree or more (formal) education and 8 percent have a two-year degree, while 37 percent have a
high school diploma and 23 percent have completed “some college.” The omitted category of
“less than a high school diploma” represents 22 percent of the workers in low-wage occupations.
These individuals have an average age of 38 years, and about three-quarters are white. One-
quarter of the workers in low-wage occupations are of Hispanic origin, slightly more than half
are male, and about 40 percent are married.
Estimation Results
Table 4 presents marginal effects from a multinomial logit regression of the outcomes of
workers in low-wage jobs. The results show that, compared to an omitted category of not having

13
a high school diploma, the four educational attainment variables are positively related to the
transition of workers into better jobs. The magnitudes of these impacts are largely in-line with
the amount of education completed, where having at least a four-year college degree is
associated with a 7.4-percentage point increase in finding a better job (compared to someone
without a high school diploma) and a high school degree (or equivalent) is associated with a 2.9-
percentage point bump. These impacts are relatively large, especially when considering that only
5.2 percent of the workers in the bottom quartile of occupations moved into better jobs. Marginal
effects of the educational attainment variables on all five of the potential outcomes are
summarized in Figure 2. While education increases the probability of finding a better job and
remaining in the same occupation, it generally reduces the likelihood of becoming unemployed
or exiting the labor force. Educational attainment has little impact, one way or another, on the
transition of moving into a different low-wage job.
Older workers are considerably more likely than younger people to remain in the same
occupation. The marginal effect suggests that a 20-year increase in age—say, comparing
someone who recently entered the job market to a person who is about 40-years old—is
associated with a 6-percentage point higher probability of remaining in the same job. Although
experience does not appear to help workers in low-wage jobs move up the job ladder, it does
lower the probability of becoming unemployed or exiting the labor force. In other words, the
beneficial impact of experience to workers in low-wage jobs is a reduction in the probability of
an adverse outcome (e.g., becoming unemployed). Conversely, educational attainment lowers the
probability of experiencing an unwanted transition and increases the likelihood of moving up the
job ladder.

14
The industries included in the regression, which are listed in Table 3, are those that
account for at least five percent of the workers in low-wage occupations. The results show that
none of the industry dummy variables, compared to an omitted category of people in any of the
sectors that are less apt to have workers in low-wage occupations, have a positive and significant
effect on the outcome of finding a better job. In fact, workers in low-wage jobs in the five broad
sectors of agriculture, forestry, fishing and hunting; administrative and support and waste
management and remediation services; health care and social assistance; accommodation and
food services; and “other” services are less likely—as compared to individuals in those industries
with smaller percentages of workers in low-wage jobs—of transitioning into better jobs.
Workers with low-wage jobs in the three broad sectors of construction; administrative
and support and waste management and remediation services; and agriculture, forestry, fishing
and hunting have higher probabilities of becoming unemployed, while those in the health care
and social assistance, accommodation and food services, retail trade, and “other” services
industry groups are less apt to transition from low-wage jobs to unemployment. Workers in the
health care and social assistance industry—as well as “other” services, accommodation and food
services, and retail trade—are more likely to remain in the same low-wage occupation (compared
to the omitted category). Finally, workers in the sectors of health care and social assistance;
accommodation and food services; “other” services; and administrative and support and waste
management and remediation services are most likely to transition among different low-wage
jobs.
Male workers are more likely than females to find a better job, although the magnitude of
this effect is small. Men in low-wage occupations also have a higher probability of becoming
unemployed. Furthermore, whites have a higher probability of finding a better job (compared to

15
an omitted category of individuals that are not classified as white, black, or Asian), while Asians
in low-wage occupations are less apt to transition into a better job. Finally, the effects related to
the year of observation suggest that, compared to the initial year of 2011, the years of 2014 to
2017 are associated with approximately one-percentage point higher probabilities of finding a
better job, consistent with an improving labor market during this period. The results also show a
reduction in the likelihood of workers in low-wage occupations becoming unemployed in these
later years.
V. WHAT KINDS OF BETTER JOBS DO LOW-WAGE WORKERS FIND?
For those workers who successfully escape low-wage work, what kinds of jobs are they
able to find? These positions are important because they offer some combination of higher
wages, a more desirable workweek, a greater likelihood of receiving employer-provided health
insurance, and/or more prestige. Figure 3 shows the occupations that granted the largest number
of employment opportunities to people who, in the previous year, worked in low-wage jobs. The
X-axis measures the percentage of workers in low-wage occupations that transitioned into the
job. The low magnitudes of these values, which are all well below one-half of one percentage
point, should come as no surprise given than only 5.2 percent of the workers in low-wage
occupations found a better job. The values on the Y-axis are the occupations’ percentiles along
the overall job quality index. Since low-wage jobs are defined as those that fall in the bottom
quartile, the “better jobs” start above the 25th percentile. Finally, the size of the bubbles shown in
Figure 3 represent differences in the relative percentages of people in the occupation that
worked, one year earlier, in a low-wage job. Whereas the X-axis shows the higher-quality
occupations that are most often found by people transitioning from low-wage jobs, the bubble

16
size indicates the extent to which an occupation is populated by people who moved up the job
quality ladder.
The occupation of truck driver—which falls just above the 30th percentile for overall job
quality—is the most common better job, by a wide margin, found by people working in low-
wage jobs. As the X-axis value of about 0.35 percent suggests, nearly one out of 300 workers in
low-wage jobs became a truck driver. However, the bubble size for truck drivers suggests that it
is not among the occupations with the highest percentages of workers that previously held low-
wage jobs. In fact, the occupation of truck driver ranks 79th out of the 410 higher-quality jobs
according to this metric. This means that, although a relatively large number of workers in low-
wage jobs became truck drivers, the sheer size of this occupation means that a fairly small
percentage of truck drivers were in low-wage occupations one year earlier. Consistent with our
findings, the job of truck driver was noted as an “opportunity occupation” in a study that
identified reasonably well-paying jobs that are attainable without a college degree (Wardrip et
al., 2015).
Other occupations that are among the five “better jobs” most commonly found by low-
wage workers include nursing aides, customer service representatives, secretaries and
administrative assistants, and wholesale and manufacturing sales. These jobs—in addition to
truck drivers—represent only 1.2 percent of the 410 occupations in the top-three quartiles of the
job quality index, but they account for 17 percent of the jobs found by people who escaped low-
wage work. The top-10 percent of occupations according to this metric—that is, the 41
occupations with the highest values on the X-axis of Figure 3—account for 62 percent of those
that found better jobs. Clearly, a relatively small group of occupations are quite important to
low-wage workers looking to move into better jobs.

17
Several of the “better jobs” with the highest numbers of people transitioning out of low-
wage work are in the broad category of sales. For example, financial sales, advertising sales,
insurance sales, wholesale and manufacturing sales, real estate, and “other” sales rank high in
terms of the percentages of better jobs found by low-wage workers (i.e., values along the X-
axis). The larger bubbles for these sales-related jobs suggest that they are also among the leaders
for the percentages of workers in an occupation that held a low-wage job one year earlier. These
results, along with the fact that sales jobs rate relatively well for overall quality (i.e., values along
the Y-axis), makes these occupations very important to workers in low-wage jobs. Similar to our
findings, Wardrip et al. (2015) also list wholesale and manufacturing sales, and “other” sales
among the top ten “most prevalent” opportunity occupations.
In contrast to the abundance of sales jobs noted in Figure 3, none of the highlighted
occupations are typically thought of as manufacturing jobs. Of the occupations in the figure that
are labeled, the closest one to manufacturing is “wholesale and manufacturing sales,” which is
not a production-oriented job. Although the occupation of “miscellaneous assemblers and
fabricators” is the only production-oriented job in the top 15 according to the percentage of low-
wage workers that moved into the occupation (i.e., values along the X-axis), there are several
jobs of this ilk among the top in terms of the percentages of people in the occupation that
previously worked in a low-wage job. These production occupations—such as model makers and
pattern makers, textile winders, and mining machine operators—are indicated by large bubble
sizes, but they are positioned very close to the left side of the figure.
Another important sector of the economy that is largely missing in Figure 3 is healthcare.
With the exception of the occupation of nursing aides, which falls just above the job-quality
threshold of the 25th percentile, there are no healthcare jobs highlighted in the figure.

18
Occupations such as nurses, and various sorts of medical technicians are certainly classified as
“good jobs,” but there are relatively few people that transition into these jobs from low-wage
occupations. Likewise, many healthcare professions are significantly large such that they have
relatively small percentages of their ranks that came out of low-wage jobs in the previous year.
This absence of healthcare jobs should come as no surprise, in light of the regression
results showing that—although people with low-wage jobs in the health care and social
assistance industry are likely to keep the same occupation or transition into a different low-wage
job—healthcare (and social assistance) workers are less likely to move into better jobs. The
results paint a similar picture for low-wage workers in the accommodation and food services
industry. With the exception of first-line food service supervisors, there are no tourism- or
hospitality-related occupations highlighted in the figure. Likewise, the regression results show
that low-wage workers in the accommodation and food services sector are less likely to move
into better jobs, but—similar to those in low-wage healthcare jobs—they are relatively more apt
to keep the same occupation or move into a different low-wage job.
VI. SUMMARY AND CONCLUSIONS
This study examined the short-term transitions of low-wage workers in the United States.
We find that most people worked in the same job as the previous year, and those that changed
occupations are most likely to find jobs of a similar quality. People in low-wage jobs, however,
are more likely than those in higher-quality occupations to exit the labor force or become
unemployed, and, troublingly, only 5.2 percent moved up the job ladder. This means that almost
95 percent of the workers in low-wage occupations were either in jobs of similar quality or not
working (i.e., out of the labor force or unemployed). And for those that successfully escaped
low-wage work, more than half ended up in only a slightly better occupation (i.e., the second

19
quartile of the job quality index). By contrast, over 90 percent of those that worked in the
highest-quality jobs were in similar positions, and only 5.6 percent were not working.
Regression analysis of the transitions of workers in low-wage jobs focused on the
personal characteristics of education and age, and also examined the influence of industry. The
model also included controls for, among other things, gender and race. Our results point to the
importance of education in helping low-wage workers move up the job ladder, with all four
educational attainment categories (e.g., four-year college degree or more, two-year college
degree, high school diploma) having positive coefficients—relative to an omitted category of “no
high school diploma”—on the outcome of finding a better job. Of note, the boost associated with
having a 4-year college degree (or more education) is about 2.5 times larger than the impact from
a high school diploma. Results pertaining to age suggest that older workers are less likely to
move up the job quality ladder, whereas age is positively associated with the outcome of
remaining in the same low-wage occupation. Consistent with the literature on life-cycle job
mobility, these findings imply that job switching is more common among younger workers in
low-wage occupations as they are more likely to move into better jobs.
The regression results pertaining to a person’s industry of employment show that
individuals with low-wage jobs in the health care and social assistance, and accommodation and
food services sectors—which are among the leaders for the percentages of workers in low-wage
occupations—are less apt to move into better jobs (relative to an omitted category of workers in
sectors that account for fewer than five percent of those in low-wage occupations). Healthcare
and tourism/hospitality workers in low-wage jobs, however, are afforded a relatively high level
of job security in that they are less likely to become unemployed or exit the labor force. On the
other hand, workers with low-wage jobs in the agriculture, forestry, fishing and hunting; and

20
administrative and support and waste management and remediation services sectors are more
likely to become unemployed, and—like healthcare and tourism/hospitality—they have a lower
probability of moving up the job quality ladder.
Our analysis of the occupations that provide opportunities to people in low-wage jobs
gives some additional perspective about the influence of industry on the transitions of these
individuals. Very few occupations that are associated with healthcare and the tourism/hospitality
sectors are among the better jobs most commonly found by workers in low-wage occupations,
nor are they typically among the occupations with the highest shares of workers that previously
held low-wage jobs. On the other hand, several sales-related occupations rank high in terms of
these two indicators of the opportunities provided to workers in low-wage jobs.
Challenges Facing Low-Wage Workers
All things considered, the results of this study highlight the following challenges faced by
workers in low-wage occupations attempting to move up the job ladder, and some issues that
merit the attention of policymakers and the agencies and organizations that help workers find
better jobs. First, a lack of formal education appears to be a substantial barrier to finding a better
job. Programs aimed at helping these workers increase their human capital, even to the level of a
high school diploma (or equivalent), can improve the odds of moving up the job ladder. Our
findings related to the effects of education on the transitions of workers in low-wage jobs are
consistent with the results of numerous studies showing a positive relationship between labor
market outcomes (e.g., earnings) and educational attainment.
Second, older workers—even after controlling for the influence of education and
industry—are less likely to move up the job ladder. This finding, which is consistent with past
research showing higher rates of occupational mobility among younger workers, could be due to

21
a variety of factors. Studies on occupational mobility across the life cycle suggest that young
workers change positions more frequently because they are uncertain about their abilities, and
trying different jobs helps determine their optimal match. Although some of the older workers in
low-wage jobs may stay in them because they are resigned to the fact that these occupations are a
“good match,” other factors might explain the lack of upward mobility found for older workers.
These may include a reluctance to give up the perks that come from seniority in a job (even in a
low-wage occupation), a risk aversion associated with leaving their current job, or even an
unfamiliarity with some of the technologies that are commonly used in job searches and/or
higher-quality jobs. Irrespective of the cause, our results suggest that special attention, even
beyond education, should be devoted to assisting experienced workers in low-wage jobs. Helping
older individuals transition into better jobs is especially important given that many of these
workers may remain in the labor force beyond the traditional retirement age due to low savings
and other financial limitations.
Third, our results suggest that sales positions offer relatively high promise for people
moving up the job ladder. This underscores the importance of cultivating strong “people skills”
(e.g., communication, presentation, motivation, organization) that are often needed for success in
sales occupations and have become increasingly important in the U.S. labor market (Deming,
2017). On the other hand, the lack of healthcare and tourism/hospitality occupations among those
that are the most hospitable to workers in low-wage jobs suggests that, especially in the case of
healthcare, there may be barriers to moving up the job ladder related to education, training and
certifications.
Fourth, our results suggest that ongoing technological advances could make it even more
challenging—moving forward—for low-wage workers to move up the job ladder. Indeed, jobs

22
such as receptionists, secretaries, and administrative assistants—fairly common “better jobs”
found by people that escape low-wage work—are classic examples of the “routine” jobs that
have been displaced by technology (Acemoglu & Autor, 2011; Autor, Katz, & Kearney, 2006;
Cortes, 2016). Moreover, the potential for new technological advances, such as the invention of
driverless vehicles, provides a direct threat to a wide array of transportation-related jobs, such as
a truck driver, which we found to be the most common “better job” for people transitioning out
of low-wage occupations. While technologies such as autonomous vehicles are not currently
displacing truck drivers on a large scale, research by Brynjolfsson and McAfee (2014) suggests
that this may not be the case in the future. Of course, the net effect of technological change on
the fortunes of low-wage workers—and those across the entire job quality spectrum—also needs
to account for the new opportunities that are created. The challenge moving forward, however, is
to make sure that workers have the skills necessary to perform the jobs that are created and
enhanced by technology.
Finally, people in low-wage occupations appear to have much less favorable labor market
outcomes than those who are already at higher rungs on the job quality ladder. Workers in low-
wage jobs are considerably more likely than others to exit the labor force or become
unemployed, and these workers have a one in twenty chance of moving into a better job. Our
finding that workers in low-wage jobs are more likely to become unemployed than move into a
better job suggests that keeping the same position, or even sliding into a different low-wage job,
could be considered a “win” for some of these individuals. From this perspective, the fact that
over three-quarters of the workers in low-wage occupations remained in low-wage jobs (either
the same or different) suggests that, above all else, people at the bottom of the job quality ladder
need support and training to succeed in their current positions.

23
This makes finding ways to upgrade the quality of low-wage jobs, by improving their pay
and working conditions, a priority for policymakers as well. Programs that work with businesses
or networks of firms to encourage training and job upgrading as a mechanism for improved
productivity may be particularly promising (Florida, Mellander, & King, 2017; Osterman, 2008).
Indeed, recent research on service jobs finds that improving pay and involving workers in
decision making, customer service, and innovation can improve the productivity and
performance of firms (Ton, 2014). Given the large number of workers in low-wage jobs and the
difficulty escaping them, upgrading these positions may, in fact, be the best option available.

24
REFERENCES
Acemoglu, D., & Autor, D. (2011). Skills, tasks, and technologies: Implications for employment and earnings, in D. Card & O. Ashenfelter (Eds.), Handbook of Labor Economics, Vol. 4 (pp. 1043-1171). Amsterdam: Elsevier-North Holland.
Almeida, P., & Kogut, B. (1999). Location of knowledge and the mobility of engineers in regional networks. Management Science, 45(7), 905-917.
Andersson, F., Holzer, H., & Lane, J. (2003). Worker Advancement in the Low-Wage Labor Market: The Role of ‘Good Jobs.’ Policy Briefs, Center on Urban and Metropolitan Policy, The Brookings Institution.
Antonovics, K., & Town, R. (2004). Are all the good men married? Uncovering the sources of the marital wage premium. American Economic Review, 94(2), 317–321.
Autor, D. (2014). Skills, education, and the rise of earnings inequality among the ‘Other 99 Percent.’ Science, 344(6186), 843-850.
Autor, D., & Dorn, D. (2013). The growth of low-skill service jobs and the polarization of the U.S. labor market. American Economic Review, 103(5), 1553-1597.
Autor, D., Katz, L., & Kearney, M. (2006). The polarization of the U.S. labor market. American Economic Review, 96(2), 189-194.
Bachmann, R., Bechara, P., Kramer, A., & Rzepka, S. (2015). Labour market dynamics and worker heterogeneity during the Great Recession—Evidence from Europe. IZA Journal of European Labor Studies, 4(19), 1-29.
Bleakley, H., & Lin, J. (2012). Thick-market effects and churning in the labor market: Evidence from U.S. Cities. Journal of Urban Economics, 72(2), 87-103.
Brynjolfsson, E., & McAfee, A. (2014). The Second Machine Age: Work, Progress, and Prosperity in a Time of Brilliant Technologies. New York, NY: W.W. Norton & Company.
Card, D. 1999. The causal effects of education on earnings, in O. Ashenfelter & D. Card (Eds.), Handbook of Labor Economics (pp.1801-1863). Amsterdam: Elsevier.
Chetty, R, Grusky, D., Hell, M., Hendren, N., Manduca, R., & Narang, J. (2017). The fading American dream: Trends in absolute income mobility since 1940. Science, 356 (6336), 398-406.
Cortes, G.M. (2016). Where have the middle-wage workers gone? A study of polarization using panel data. Journal of Labor Economics, 34(1), 63-105.
Deming, D. (2017). The growing importance of social skills in the labor market. Quarterly Journal of Economics, 132(4), 1593-1640.

25
Fallick, B., Fleischman, C., & Rebitzer, J. (2006). Job-hopping in Silicon Valley: Some evidence concerning the microfoundations of a high-technology cluster. The Review of Economics and Statistics, 88(3), 472-481.
Flood, S., King, M., Ruggles, S., & Warren, J.R. (2017). Integrated Public Use Microdata Series, Current Population Survey: Version 5.0. [dataset]. Minneapolis: University of Minnesota. https://doi.org/10.18128/D030.V5.0.
Florida, R. (2017). The New Urban Crisis. New York, NY: Basic Books.
Florida, R., Mellander, C., & King, K. (2017). Building 65 Million Good Jobs: The Geography of Low-Paid Service Class Jobs and How to Begin to Upgrade Them. University of Toronto, Rotman School of Management, Martin Prosperity Institute.
Fortin, N., & Lemieux, T. (1998). Rank regressions, wage distributions, and the gender gap. Journal of Human Resources, 33(3), 610–643.
Freedman, M. (2008). Job hopping, earnings dynamics, and industrial agglomeration in the software publishing industry. Journal of Urban Economics, 64(3), 590-600.
Gabe, T. (2009). Knowledge and earnings. Journal of Regional Science, 49(3), 439-457.
Gabe, T. (2017). The Pursuit of Economic Development: Growing Good Jobs in U.S. Cities and States. Cham, Switzerland: Palgrave Macmillan.
Gervais, M., Jaimovich, N., Siu, H., & Yedid-Levi, Y. (2016). What should I be when I grow up? Occupations and unemployment over the life cycle. Journal of Monetary Economics, 83 (October), 54-70.
Goldin, C., & Katz, L. (2010). The Race between Education and Technology. Cambridge, MA: Harvard University Press.
Gorry, A., Gorry, D., & Trachter, N. (2014). Learning and life cycle patterns of occupational transitions. Federal Reserve Bank of Richmond, Working Paper 14-15.
Greenman, E., & Xie, Y. (2008). Double jeopardy? The interaction of gender and race on earnings in the U.S. Social Forces, 86(3), 1217-1244.
Kambourov, G., & Manovskii, I. (2008). Rising occupational and industry mobility in the United States: 1968-97. International Economic Review, 49(1), 41-79.
Kambourov, G., & Manovskii, I. (2009). Occupational mobility and wage inequality. Review of Economic Studies, 76(2), 731-759.
Kambourov, G., & Manovskii, I. (2013). A cautionary note on using (March) Current Population Survey and Panel Study of Income Dynamics data to study worker mobility. Macroeconomic Dynamics, 17(1), 172-194.

26
Lalé, E. (2012). Trends in occupational mobility in France: 1982-2009. Labour Economics, 19(3), 373-387.
Mincer, J. (1974). Schooling, Experience, and Earnings. New York: National Bureau of Economic Research.
Mincer, J. (1991). Education and Unemployment. NBER Working Paper 3838.
Moscarini, G., & Thomsson, K. (2007). Occupational and job mobility in the US. Scandinavian Journal of Economics, 109(4), 807-836.
Murphy, K., & Topel, R. (2016). Human capital investment, inequality, and economic growth. Journal of Labor Economics, 34(S2), S99-S127.
Nam, C. (2000). Comparison of Three Occupational Scales. Center for the Study of Population, Florida State University.
Osterman, P. (2001). Employers in the low-wage/low-skill labor market, in R. Kazis & M. Miller (Eds.), Low-Wage Workers in the New Economy (pp. 67-87). Washington, DC: Urban Institute.
Osterman, P. (2008). Improving job quality: Policies aimed at the demand side of the low-wage labor market, in T. Bartik & S. Houseman (Eds.), A Future of Good Jobs?: America’s Challenge in the Global Economy (pp. 203-244). Kalamazoo, MI: W.E. Upjohn Institute.
Robinson, C. (2017). Occupational mobility, occupation distance and specific human capital. Journal of Human Resources, forthcoming.
Ruggles, S., Genadek, K., Goeken, R., Grover, J. & Sobek, M. (2017). Integrated Public Use Microdata Series: Version 7.0 [dataset]. Minneapolis: University of Minnesota. https://doi.org/10.18128/D010.V7.0
Siegel, P. (1971). Prestige in the American Occupational Structure. Unpublished Ph.D. dissertation, Department of Sociology, University of Chicago.
Stevens, G., & Hoisington, E. (1987). Occupational prestige and the 1980 U.S. labor force. Social Science Research, 16(1), 74-105.
Stier, H., & Endeweld, M. (2015). Employment transitions and labor market exits: Age and gender in the Israeli labor market. Research in Social Stratification and Mobility, 41, 92-102.
Temin, P. (2017). The Vanishing Middle Class: Prejudice and Power in a Dual Economy. Cambridge, MA: The MIT Press.
Theodos, B., & Bednarzik, R. (2006). Earnings mobility and low-wage workers in the United States. Monthly Labor Review, (July), 34-47.

27
Theodossiou, I, & Zangelidis, A. (2009). Should I stay or should I go? The effect of gender, education and unemployment on labour market transitions. Labour Economics, 16(5), 566-577.
Ton, Z. (2014). The Good Jobs Strategy: How the Smartest Companies Invest in Employees to Lower Costs and Boost Profits. Boston, MA: Houghton Mifflin Harcourt Publishing Company.
Topel, R., & Ward, M. (1992). Job mobility and the careers of young men. Quarterly Journal of Economics, 107(2), 439-479.
Wardrip, K., Fee, K., Nelson, L., & Andreason, S. (2015). Identifying Opportunity Occupations in the Nation’s Largest Metropolitan Areas. Special Report of the Federal Reserve Banks of Philadelphia, Cleveland, and Atlanta.
Wilkins, R., & Wooden, M. (2013). Gender differences in involuntary job loss: Why are men more likely to lose their jobs? Industrial Relations, 52(2), 582-608.

28
Table 1. Correlations among Occupational Characteristics Used to Measure Job Quality Average Average Weekly % of Workers w/Employer- Prestige Hourly Wage Hours Compared to 40 Provided Health Insurance Index
Average Hourly Wage 1.00
Average Weekly Hours Compared to 40 0.10 1.00
% of Workers w/Health Insurance 0.55 0.20 1.00 Provided by the Employer
Prestige Index 0.65 0.14 0.54 1.00
Note. Higher values are interpreted as “better” jobs for the characteristics of average hourly wage, percentage of workers with employer-provided health insurance, and the prestige index. For the characteristic of average weekly hours, lower deviations from a 40-hour benchmark are interpreted as “better.” For this reason, negative values are used for the occupation-level characteristic of “average weekly hours compared to 40” when calculating the correlations shown in the table. For example, the results show that occupations with average weekly hours that are more different than 40 are less likely to have employer-provided health insurance, but jobs with “better” hours—i.e., closer to 40—are more likely to have this employment benefit.
29
Table 2. Occupational Characteristics across the Four Quartiles of Job Quality Average Average Weekly % of Workers w/Employer- Prestige Job Quality Quartile Hourly Wage Hours Compared to 40 Provided Health Insurance Index First (low-wage) $13.02 7.13 47.5% 24.8 Second $16.97 3.72 63.7% 35.2 Third $24.45 3.05 77.8% 44.9 Fourth (high-wage) $36.93 2.95 87.1% 57.7 Note: All of the values are calculated using data from the 2011 American Community Survey (Ruggles et al., 2017).

30
Table 3. Descriptive Statistics of U.S. Workers in Low-Wage Jobs Standard Variable Description Mean Deviation High School Diploma Variable equals 1 if highest level of education is a high school 0.37 0.48 diploma or equivalent; 0 otherwise Some College Variable equals 1 if highest level of education is some college 0.23 0.42 without a degree; 0 otherwise 2-Year College Degree Variable equals 1 if highest level of education is a 2-year college 0.08 0.26 degree; 0 otherwise 4-Year College Degree or More Variable equals 1 if highest level of education is a 4-year college 0.10 0.30 degree (or more); 0 otherwise Age Individual age, measured in years 37.73 15.89 Male Variable equals 1 if individual is male; 0 otherwise 0.52 0.50 White Variable equals 1 if individual is white; 0 otherwise 0.77 0.42 Black Variable equals 1 if individual is black; 0 otherwise 0.14 0.35 Asian Variable equals 1 if individual is Asian; 0 otherwise 0.05 0.22 Hispanic Variable equals 1 if individual is Hispanic; 0 otherwise 0.25 0.43 Married Variable equals 1 if individual is married; 0 otherwise 0.39 0.49 Table is continued on the following page.

31
Table 3. Descriptive Statistics of U.S. Workers in Low-Wage Jobs, continued Standard Variable Description Mean Deviation Agriculture, Forestry, Fishing & Variable equals 1 if individual works in the agriculture, forestry, 0.05 0.22 Hunting fishing and hunting industry; 0 otherwise Construction Variable equals 1 if individual works in the construction industry; 0.08 0.26 0 otherwise Retail Trade Variable equals 1 if individual works in the retail trade industry; 0.23 0.42 0 otherwise Administrative & Support & Waste Variable equals 1 if individual works in the administrative and 0.07 0.26 Management & Remediation Services support and waste management and remediation services industry; 0 otherwise Health Care & Social Assistance Variable equals 1 if individual works in the health care and social 0.08 0.27 assistance industry; 0 otherwise Accommodation & Food Services Variable equals 1 if individual works in the accommodation and 0.22 0.41 food services industry; 0 otherwise “Other” Services Variable equals 1 if individual works in the “other” services 0.08 0.27 industry; 0 otherwise Notes: The sample size is 176,567 observations. The data source is the 2011 to 2017 rounds of the March Supplement of the U.S. Current Population Survey.

32
Table 4. Multinomial Logit Marginal Effects: Factors Affecting the Transitions of Workers in Low-Wage Jobs Out of Labor Force Unemployed Same Job Different Low-Wage Better Job High School Diploma -0.067*** -0.001 0.037*** 0.003 0.029*** (0.002) (0.002) (0.004) (0.002) (0.003) Some College -0.029*** -0.020*** 0.006 0.003 0.040*** (0.002) (0.002) (0.004) (0.002) (0.003) 2-Year College Degree -0.070*** -0.020*** 0.039*** -0.001 0.051*** (0.004) (0.004) (0.006) (0.004) (0.003) 4-Year College Degree or More -0.075*** -0.025*** 0.023*** 0.003 0.074*** (0.004) (0.003) (0.006) (0.003) (0.003) Age -0.0011*** -0.0009*** 0.0032*** -0.0006*** -0.0007*** (8.15E-05) (5.76E-05) (1.08E-04) (5.93E-05) (5.75E-05) Male -0.032*** 0.004** 0.028*** -0.006*** 0.006*** (0.002) (0.002) (0.003) (0.002) (0.002) White -0.009* -0.018*** 0.025*** -0.006 0.007** (0.005) (0.004) (0.007) (0.004) (0.004) Black -0.034*** 0.011*** 0.009 0.009** 0.005 (0.005) (0.004) (0.008) (0.004) (0.004) Asian -0.031*** -0.035*** 0.086*** -0.004 -0.016*** (0.006) (0.005) (0.009) (0.005) (0.005) Hispanic -0.062*** -0.008*** 0.094*** -0.004** -0.020*** (0.003) (0.002) (0.004) (0.002) (0.002) Married -0.024*** -0.021*** 0.051*** -0.004** -0.001 (0.002) (0.002) (0.003) (0.002) (0.002) Agriculture, Forestry, Fishing & 0.015*** 0.020*** 0.006 -0.021*** -0.020*** Hunting (0.004) (0.004) (0.007) (0.005) (0.004) Construction -0.021*** 0.042*** -0.012* -0.011*** 0.001 (0.005) (0.003) (0.006) (0.004) (0.003) Table is continued on the following page.

33
Table 4. Multinomial Logit Marginal Effects: Factors Affecting the Transitions of Workers in Low-Wage Jobs, continued Out of Labor Force Unemployed Same Job Different Low-Wage Better Job Retail Trade -0.013*** -0.004* 0.021*** -0.006** 0.002 (0.003) (0.002) (0.004) (0.003) (0.002) Administrative & Support & 0.006 0.031*** -0.026*** 0.008** -0.019*** Waste Management & (0.004) (0.003) (0.006) (0.003) (0.004) Remediation Services Health Care & Social Assistance -0.018*** -0.020*** 0.046*** 0.013*** -0.021*** (0.004) (0.004) (0.006) (0.003) (0.003) Accommodation & Food Services -0.020*** -0.005* 0.022*** 0.017*** -0.015*** (0.003) (0.003) (0.004) (0.002) (0.002) “Other” Services -0.010** -0.023*** 0.032*** 0.012*** -0.011*** (0.004) (0.004) (0.006) (0.003) (0.003) Year 2012 -0.002 -0.006** 0.016*** -0.004 -0.004 (0.003) (0.002) (0.005) (0.003) (0.003) Year 2013 0.009 -0.011*** -0.002 0.002 0.001 (0.003) (0.002) (0.005) (0.003) (0.003) Year 2014 0.002 -0.020*** -0.004 0.012*** 0.010*** (0.003) (0.003) (0.005) (0.003) (0.003) Year 2015 0.004 -0.024*** -0.001 0.012*** 0.009*** (0.003) (0.003) (0.005) (0.003) (0.002) Year 2016 0.000 -0.030*** -0.002 0.018*** 0.014***
(0.003) (0.003) (0.005) (0.003) (0.002) Year 2017 0.001 -0.037*** 0.007 0.016*** 0.013***
(0.003) (0.003) (0.005) (0.003) (0.002)
Notes: Results shown are marginal effects from a multinomial logit model. Standard errors are shown in parentheses. The superscripts ***, ** and * indicate statistical significance at the 1-, 5- and 10-percent levels. The variables Year 2012, Year 2013, etc. are dummy variables for the year an observation was recorded. Results for the “year dummy variables” are interpreted relative to an “omitted category” of 2011. The sample size is 176,567 observations.

34

35

36


