Vs Iqp Final
122
Project Code: JRB-VS06 Market Analysis of Smoke Detection and Applications An Interactive Qualifying Project Report Submitted to the Faculty of WORCESTER POLYTECHNIC INSTITUTE In partial fulfillment of the requirements for the Degree of Bachelor of Science by: __________________________ Nichole L. Carriere __________________________ Ryan A. Graves __________________________ Donald M. Havener __________________________ Mark A. Rizzo Date: Approved: ____________________________ ________ Professor Jonathan R. Barnett, Advisor
-
Upload
vishnu-prakash -
Category
Documents
-
view
217 -
download
0
Transcript of Vs Iqp Final

7/28/2019 Vs Iqp Final
http://slidepdf.com/reader/full/vs-iqp-final 1/122
Project Code: JRB-VS06
Market Analysis of Smoke Detection and Applications
An Interactive Qualifying Project Report
Submitted to the Faculty of
WORCESTER POLYTECHNIC INSTITUTE
In partial fulfillment of the requirements for the
Degree of Bachelor of Science
by:
__________________________
Nichole L. Carriere
__________________________
Ryan A. Graves
__________________________
Donald M. Havener
__________________________ Mark A. Rizzo
Date:
Approved:
____________________________________ Professor Jonathan R. Barnett, Advisor

7/28/2019 Vs Iqp Final
http://slidepdf.com/reader/full/vs-iqp-final 2/122
ii
Abstract
This project researched and evaluated smoke detection and its applications,
including air sampling smoke detection (ASD) systems, conventional ionization, photo-
electric and spot-type heat detectors. An analysis of the National Fire Incident Reports
was used to determine how much more efficient detection systems were at decreasing
property damages, injuries and casualties. Questionnaires were created to gather
feedback from professionals to determine their preference on the topic. The results of this
research assisted in the making of recommendations to further increase the understanding
for the need of early warning detection systems.
Keywords: fire protection, fire detection, smoke detection, air sampling
smoke detection
7/28/2019 Vs Iqp Final
http://slidepdf.com/reader/full/vs-iqp-final 3/122
iii
Executive Summary
The goal of this project was to research and evaluate air sampling systems
compared to other detection systems. In this report the air sampling systems are
contrasted to traditional ionization, photo-electric, and heat detector systems. These
contrasts, along with other methods, were done to find potential markets within larger
commercial buildings for the air sampling smoke detection systems.
To find the best market for these systems various research methods were
employed. An analysis of the National Fire Incident Reporting System (NFIRS)
determined how efficient detection systems were at decreasing damages and casualties.
This was done by looking at the amount of damage with detection versus the amount
without detection. Different areas of origin (i.e. kitchens, storage areas, and function
areas), along with materials ignited (i.e. wood, gases, and natural products), were also
studied in relation to various structure fires from the NFIRS. Numbers regarding fires
originating in various areas were extracted from NFIRS along with the materials that
were ignited. From these numbers it was discovered that the leading areas of origin were
“function areas”, “storage areas”, and “structural areas.” It was also determined that the
leading materials causing fires were “wood, paper”, “fabrics, textiles, furs”, and “natural
products.” This information was used to give a prediction on a potential market for the
air sampling systems.
Another method exercised to obtain results about the air sampling systems was
sending out questionnaires via e-mail to receive feedback from engineers, building
owners, and fire officials. The answers received from the professionals were compared
to determine their qualified preferences on air sampling systems. A perspective based on
7/28/2019 Vs Iqp Final
http://slidepdf.com/reader/full/vs-iqp-final 4/122
iv
their experience was gained from the results of these questionnaires. The engineers
yielded their professional opinions on the strengths, weaknesses, and applications of air
sampling systems against traditional systems.
Very Early Smoke Detection Apparatus’s (VESDA) ability to detect smoke
during the incipit stages or a fire allows the system to be implemented in scenarios where
heat sensitive chemicals or pharmaceutical storage is involved. VESDA also has the
capability to detect small changes in the quantity of smoke particles in the air. This could
allow VESDA to be utilized as a friction/over-friction monitoring device in
manufacturing facilities. However, a two hindrances of the wide spread installation of
VESDA is its price and ability to be integrated into control boxes. There are a few
options that should be considered. First would be to further the capability of VESDA to
be easily integrated into a large number of control boxes. This ability is highly
advantageous to installers and engineers and provides a way to further VESDA’s
penetration into the high end smoke detection market. The next is to consider producing
a scaled-down and less expensive VESDA system for use in smaller spaces. This would
allow the system to be implemented strategically and provide incentive to prospective
buyers. Another route would be to reduce the price of the total system; however it is
beyond the scope of this report to make technical refinements of the system itself.
The goal of this project was to research and evaluate smoke detection and its
applications, including air sampling systems, traditional ionization, photo-electric, and
heat spot-type detectors. Potential markets within larger commercial buildings where air
sampling smoke detection systems could be applied.

7/28/2019 Vs Iqp Final
http://slidepdf.com/reader/full/vs-iqp-final 5/122
v
To find the potential market for smoke detection systems various research
methods were employed. An analysis of National Fire Incident Reports (NFIRS) was
used to determine how much more efficient detection systems were at decreasing
property damages, injuries and casualties. Different areas of fire origin (i.e. kitchens,
storages areas, and function areas), along with materials ignited (i.e. wood, gases, and
natural products), were studied in relation to structure fires in large commercial buildings.
The number of fires originating in various areas with specific materials was extracted
from the NFIRS. From these numbers it was discovered which areas and materials were
most commonly associated with fires.
Questionnaires sent via e-mail were used to receive feedback from design
engineers, consultants, building owners, and fire officials to determine their professional
opinions of the benefit of using smoke detection systems, especially the early warning air
sampling smoke detection (ASD) systems. A perspective based on their experience was
gained from the results of these questionnaires. The engineers yielded their professional
opinions on the strengths, weaknesses, and uses of air sampling systems against
traditional systems.
VESDA®, a leading Air Sampling Smoke Detection Systems, is recognised as
the market leader in early warning smoke detection, VESDA products are used in
industries such as transportation, manufacturing, IT&T, utilities and storage services.
VESDA air sampling smoke detectors are renowned for their ability to consistently
deliver smoke detection that protects a diverse range of global businesses and their
challenging environments providing enhanced life safety and business continuity
solutions.

7/28/2019 Vs Iqp Final
http://slidepdf.com/reader/full/vs-iqp-final 6/122
vi
VESDA’s ability to detect smoke during the incipit stages as well as big fires due
to its very wide sensitivity range, allows the system to be implemented in scenarios
where heat sensitive chemicals or pharmaceutical storage is involved. VESDA system
product ranges allow the use of such an ASD technology in both large and smaller
spaces. This would allow the system to be implemented strategically and provide
incentive to prospective buyers.

7/28/2019 Vs Iqp Final
http://slidepdf.com/reader/full/vs-iqp-final 7/122
vii
Authorship
Nichole Carriere wrote some of the Literature Review and NFIRS Results. She
organized all of the information gathered and put it together in the Literature Review.
Nichole also helped write the Abstract, Executive Summary, Introduction, Results and
Conclusions sections.
Ryan Graves organized the effort to contact and interview contacts. The data was
analyzed and entered into the report. Ryan also assisted in the writing of the Abstract,
Introduction, Literature Review, Results and Conclusions.
Donald Havener contributed to the Literature Review, as well as creating and
arranging all of the NFIRS tables and graphics. Donald also was the main contributor to
the Recommendations and Conclusions section. He also spread his knowledge and
assistance to help with everyone else efforts.
Mark Rizzo was the main contributor for the Methodology section, while also
contributing to the Literature Review, and Results sections.
Overall, the group attempted to evenly distribute the required project’s work.
However, individual specialties and interests did allow for some to contribute to areas
where others felt uncomfortable working.

7/28/2019 Vs Iqp Final
http://slidepdf.com/reader/full/vs-iqp-final 8/122
viii
Acknowledgements
The project team would like to thank the following people and their organizations for
their assistance with the project:
Professor Jonathan BarnettWorcester Polytechnic Institute
Michael Voorhis
Worcester Polytechnic Institute
Ming He
Vision Fire & Security
David Estrela
Vision Fire & Security
Nicole Pennio
Vision Fire & Security
Worcester Polytechnic Institute’s
Fire Protection Alumni

7/28/2019 Vs Iqp Final
http://slidepdf.com/reader/full/vs-iqp-final 9/122
ix
Table of ContentsAbstract........................................................................................................................ ii
Executive Summary.................................................................................................... iii
Executive Summary.................................................................................................... iii
Authorship ................................................................................................................. vii
Acknowledgements................................................................................................... viii
Table of Contents........................................................................................................ ix
Table of Figures.......................................................................................................... xi
Introduction.................................................................................................................. 1
2 Literature Review................................................................................................ 3
2.1 Fire and Building Codes and Standards.............................................................. 3
2.1.1 Fire Codes and Standards............................................................................ 3
2.1.2 Building Codes............................................................................................ 5
2.1.3 Authority Having Jurisdiction..................................................................... 6 2.2 Different Types of Detectors .............................................................................. 6
2.2.1 Smoke Detectors ......................................................................................... 7
2.2.1.1 Ionization Smoke Detectors........................................................................ 7
2.2.1.2 Photo-electric Smoke Detectors.................................................................. 7 2.2.1.3 Air Sampling Smoke Detectors .................................................................. 8
2.2.2 Heat Detectors............................................................................................. 8 2.2.3 Near-Infrared Radiation Detectors.............................................................. 9
2.3 Detection in Commercial Buildings.................................................................... 9
2.3.1 What is used due to Requirements............................................................ 10 2.3.2 What is used in Addition to Requirements ............................................... 10
2.3.3 Insurance Benefits of Additional Detection.............................................. 11
2.3.4 Reasons Certain Smoke Detection is not used.......................................... 12
2.4 What has not been researched........................................................................... 14 3 Methodology..................................................................................................... 15
3.1 Identifying ways to find potential markets ....................................................... 15 3.1.1 National Fire Incident Reporting System ................................................. 15
3.1.2 Interviews.................................................................................................. 16
4 Results and Analysis ......................................................................................... 18
4.1 NFIRS Data Collection..................................................................................... 18
4.1.1 Areas of Fires............................................................................................ 19

7/28/2019 Vs Iqp Final
http://slidepdf.com/reader/full/vs-iqp-final 10/122
x
4.1.2 Materials ignited ....................................................................................... 24
4.1.3 Deaths in relation to Sprinkler and Detection systems ............................. 28 4.2 Interview results............................................................................................ 30
4.3 Compiled Analysis ........................................................................................ 32
5 Conclusions....................................................................................................... 35
6 Glossary of abbreviations ................................................................................. 37
7 Works Cited ...................................................................................................... 38
8 Appendix I -NFIRS sorting programming codes.................................................. 40
9 Appendix II -Data Tables.................................................................................. 46

7/28/2019 Vs Iqp Final
http://slidepdf.com/reader/full/vs-iqp-final 11/122
xi
Table of FiguresFigure 2-Area of Origin's Function Areas ........................................................................ 21
Figure 3-Area of Origins, Storage Areas .......................................................................... 22
Figure 4- Area of Origins, Structural Areas...................................................................... 23
Figure 5-Type of Material Ignited .................................................................................... 24
Figure 6-Type of Material Ignited, Wood and Paper........................................................ 25
Figure 7-Type of Material Ignited , Fabric, Textiles and Fur........................................... 26
Figure 8-Type of Material Ignited , Natural Products ...................................................... 27
Figure 9-Casualty Data with/without Sprinklers and Detectors ....................................... 28
Figure 10-Casualties by Detector Type ............................................................................ 29

7/28/2019 Vs Iqp Final
http://slidepdf.com/reader/full/vs-iqp-final 12/122
1 Introduction
Since the beginning of civilization, fire has been a large hazard facing
communities. During the year 2005 in the United States there were over 1,602,000 fires
causing 10.6 billion dollars in property loss and 3,675 casualties. These numbers seem
large, but they have declined from previous years. It is also important to consider that
there are over 300 million people in the United States and 3,675 casualties is a small
percentage number compared to the population. (Karter, Michale K)
The businesses that supply products and services are vulnerable to fire.
Production and dispersion of items require storage and production facilities, all of which
are at risk. When fires occur, there is usually one of two outcomes; loss of property and
productivity or quick, decisive action resulting in minimal loss. With a small fire, the fire
department must be notified, detection and suppression systems must be reset, and
insurance companies most likely become involved. When taking downtime into account,
a small fire quickly escalates into a costly situation. (Karter, Micheal K)
There are systems that can be used in conjunction with fire suppression, namely
heat detection and smoke detection. Some of these products are precise enough to detect
microscopic smoke particles in large quantities of air. Systems such as those provided by
Vision Systems use optical detectors to sense the presence of smoke particles as low as
0.005 percent obscurity per meter, compared to the average 2 percent obscuration per
foot. At present, these high sensitivity detectors are found in commercial and industrial
buildings where suppression can be costly. The best option is human intervention before
a smoldering or overheat condition can progress to a fire. The rise of market awareness

7/28/2019 Vs Iqp Final
http://slidepdf.com/reader/full/vs-iqp-final 13/122
2
and concern over fire related safety could cause an increase in the market for these high
quality ASD detectors. The intent of this report is to analyze possible markets for high
end ASD detectors like VESDA. (Vision Systems document 10947, version 01)
7/28/2019 Vs Iqp Final
http://slidepdf.com/reader/full/vs-iqp-final 14/122
3
2 Literature Review
2.1 Fire and Building Codes and Standards
In order to identify areas within the general fire market for very early warning
smoke detection systems, it was first necessary to identify where smoke detection may
already be required by law, building codes, or fire codes. NFPA (National Fire
Protection Association) standards, building codes, and fire codes on a state-by-state basis
were researched with the goal of uncovering code requirements as well as requirements
that could be added to increase fire safety standards.
It is important to understand the difference between fire and building codes and
standards. A fire code is a requirement for buildings that already exists and buildings yet
to be constructed. Fire codes are in place to provide guidelines for achieving an
acceptable level of safety and must be maintained. A building code is a set of
requirements, regarding fire safety, for a structure that is being built. A standard sets
forth the details of how to do things in the building. For the purposes of this report, the
focus of fire and building codes and standards will be on smoke detection requirements.
2.1.1 Fire Codes and Standards
NFPA 72 (National Fire Alarm Code) provides requirements for the installation,
performance, testing, inspection, and maintenance of a fire alarm system. These systems
range from basic domestic smoke alarms comprised of battery operated smoke detectors,
to large scale integrated systems for large scale residential, commercial and public places.
Each system is defined in the entire NFPA’s codes and standards by its composition,

7/28/2019 Vs Iqp Final
http://slidepdf.com/reader/full/vs-iqp-final 15/122
4
building size, and fire load capabilities. Although commercial and public buildings are
required to have fire alarm systems in place, they may not be required to have smoke
detection of any kind. Manual “pull boxes” generally satisfy code requirements.
NFPA 101 (Life Safety Code) was researched for its implementation of fire alarm
requirements in various types of commercial buildings. It compliments NFPA 72, by
classifying different building types and determining whether a fire alarm system is
required in a given occupancy. This “Life Safety” code gives recommended and safe
practices which can offer the building and its occupant’s protection. (National Fire
Protection Association)
State fire codes are mainly comprised of adopted NFPA standards. Most states
choose to modify these standards in order to better protect building types and conditions
common to their jurisdiction. An example of this would be a rural state such as Maine.
Maine has fewer high-rise buildings than states like California and therefore might not
need such in-depth codes concerning high-rise buildings. In addition, California may add
extra protection to buildings in case of earthquakes, while Maine would not need such
protection. Also, there was realization during this research that fire alarm systems are
required by law in commercial and public buildings. Most states require that all plans for
new construction and renovations be inspected and approved for adherence to fire codes
by the fire marshal’s office. This system ensures that buildings are equipped for
emergency situations and the general safety of its occupants is ensured. (Dean, John C.)
Developed by the NFPA, codes and standards are intended to minimize the
possibility and effects of fire and other risks. Virtually every building, process, service,
design, and installation in the United States is addressed by NFPA documents. Some of

7/28/2019 Vs Iqp Final
http://slidepdf.com/reader/full/vs-iqp-final 16/122
5
the various standards include NFPA 13, which deals with sprinkler technology, NFPA
25, dealing with minimum requirements necessary for inspection, testing and
maintenance of water extinguishing systems, and NFPA 72, which consists of
requirements for the full range of fire alarm systems. All of these standards compliment
building codes, but describes how things should be done and what is required by
inspectors. (National Fire Protection Association)
2.1.2 Building Codes
Sections of NFPA 5000 (Building Construction and Safety Code) identify the
construction requirements of commercial-type building spaces. This code not only
dictates how these buildings should be designed, but also what sort of fire alarm system
must be installed. According to this code, most commercial buildings are required to have
alarm systems, though they are not necessarily required to have smoke detection. The
code takes into account factors like building capacity, disbursement of people inside the
building, and hazards within the building to recommend specific components of the alarm
or detection system. (National Fire Protection Association)
The International Building Codes were also researched to find differences between
those and NFPA 5000. The International Building Codes classify buildings by their
occupancy type and in some cases by level of contained hazards. These
recommendations were created accordingly to develop fire alarm requirements.
International Building Codes and NFPA 5000 are quite similar with respect to fire alarm
requirements. For most commercial and public buildings, alarm systems can be activated
manually and/or by activation of an automatic sprinkler system. Automatic smoke
detection is generally not required. (National Fire Protection Association)
7/28/2019 Vs Iqp Final
http://slidepdf.com/reader/full/vs-iqp-final 17/122
6
State-enforced building codes are developed in the same fashion as fire codes.
Some codes are adopted directly from the International Building Codes, and/or NFPA
5000, while others are modifications made to those codes by officials on the state level.
(Dean, John C.)
2.1.3 Authority Having Jurisdiction
The Authority Having Jurisdiction or AHJ is the organization, office, or
individual responsible for approving equipment, installation, or a procedure. The term
AHJ is used in a broad manner by the NFPA due to the large variation of responsibilities
by jurisdiction and approval agencies. Where public safety comes first, the authority
having jurisdiction may be a federal, state, local, or other regional department. The AHJ
may also be an individual such as fire chief or others having statutory authority. For
insurance purposes, an insurance inspection department, rating bureau, or other insurance
representative may be the authority having jurisdiction. Many times, the property owner
or a designated agent assumes the role of AHJ. (Baker, Michael)
2.2 Different Types of Detectors
Fire detectors are common throughout all commercial and public buildings.
These detectors are usually tied together into a larger system which will audibly and
visually notify the occupants, in order to allow evacuation of the building in a timely
fashion in addition to notifying emergency services.
When looking into the different types of fire detectors, it is important to have an
understanding of where these detectors are required, and where they will be placed
throughout building spaces. The difference in space usage can mean a great deal,
7/28/2019 Vs Iqp Final
http://slidepdf.com/reader/full/vs-iqp-final 18/122
7
depending how much dust is in the air, or how often steam or smoke is released into the
air in the room. There are three types of automatic detection systems for fire alarms.
They include smoke detectors, heat detectors, and infrared detectors. (McEwen, R.H.L)
2.2.1 Smoke Detectors
Smoke detectors are used to look for the presence of smoke within a given area.
These detectors are commonly found in commercial buildings, however they are not
often found in cooking areas because steam and smoke resulting from normal cooking
activities can result in false positives. False positives are when a detector goes off
because there is dust, dirt, and/or smoke in the air, which has caused the alarm (instead of
smoke from an actual fire). Smoke detectors consist of three general types; ionization
detectors, photo-electric detectors, and air sampling detectors. All three detection
methods provide reliable detection times after combustion particles spark fire conditions.
2.2.1.1 Ionization Smoke Detectors
Ionization smoke detectors ionize the air making a conductive path in which the
current flowing through can be measured. A change in current caused by the presence of
smoke particles will trigger the smoke alarm. One downside to these detectors is that
they can easily have a false alarm if the detector is placed too close to a high humidity
area such as a bathroom. (Apollo Fire)
2.2.1.2 Photo-electric Smoke Detectors
Photo-electric smoke detectors usually contain a light source shining directly or
indirectly on a photo-electric cell. When the light is obstructed or reflected by smoke
particles, the change in current on the photo-electric cell can be measured and interpreted
7/28/2019 Vs Iqp Final
http://slidepdf.com/reader/full/vs-iqp-final 19/122
8
and used to trigger the fire alarm. Photo-electric detectors are a better choice for steamy
areas or areas where ionization could occur in the air, as this will not create false alarms.
However, these detectors are prone to false alarms if located in dusty areas or areas
influenced by outdoor conditions because dust particles can have the same effect as
smoke on the detector. (Apollo Fire)
2.2.1.3 Air Sampling Smoke Detectors
Air sampling smoke detectors are a newer technology which was developed in
order to achieve earlier detection of smoke particles. Air sampling detectors monitor
increasing smoke levels in the air and compare these values to preset threshold limits.
These detectors can detect smoke while in the incipient stage, allowing time for human
intervention which can prevent material flame up and costly damages.
Most air sampling detectors pull air into a pipe network through openings in the
ceiling. This air is passed through a filter where smoke particulates can be separated
from large dust particles. Then there is either laser based or LED based smoke detection.
These air sampling systems are able to continually monitor the smoke content of a given
area, as it will keep working after it sets off the alarm. This can provide valuable data to
occupants and emergency personnel. (Vision Systems document 10947, version 01)
2.2.2 Heat Detectors
Heat detectors are used to monitor air temperature or to detect the rate of
temperature change in a given area. These detectors are used more often found around
bathrooms and kitchens. Heat detectors will not sense steam released into the air by

7/28/2019 Vs Iqp Final
http://slidepdf.com/reader/full/vs-iqp-final 20/122
9
boiling water or by smoking food. The detector will only be triggered if the air by the
detector reaches a set threshold or by a rapid heating of the air. (McEwen, R.H.L.)
Sprinkler heads on automatic suppression systems are also heat detectors. As a
fire reaches a sprinkler head and heats it to a set threshold, the fire will cause a metal link
to melt or a piece of glass in the sprinkler head to break. The melted link or ruptured
glass causes the suppression system to release water or other fire suppressants. A flow
detector is tied to all automatic fire suppression systems, which when triggered sets off
visual and audible alarm systems. (Rohr and Hall)
2.2.3 Near-Infrared Radiation Detectors
Near-infrared radiation detectors are new technologies which operate on the
principle of apparent source temperatures obtained from spectral radiation intensity
measurements at two near-infrared wavelengths. The system combines smoke sensors
and temperature sensors. An advantage of such a system is the system is less prone to
false alarms than a conventional smoke detector. There is also an interest in the systems
due to fast response time and because most natural fires are easily distinguished by the
unsteady nature of the emitted radiation. However, the initial and maintenance costs of
near-infrared radiation detectors are more costly. (Sivathanu, Yudaya R.)
2.3 Detection in Commercial Buildings
The definition of a commercial building is one where more than fifty percent of
its floor space is used for commercial activities. They include, but are not limited to,
stores, offices, schools, churches, libraries, museums hospitals, warehouses, and jails.
7/28/2019 Vs Iqp Final
http://slidepdf.com/reader/full/vs-iqp-final 21/122
10
Government buildings are also included with the exception of military bases or
reservations.
2.3.1 What is used due to Requirements
Commercial buildings are required to have a code complying fire detection
system. Minimum requirement is a manual pull box that a person could trigger the fire
alarm upon seeing a fire. Also, a basic sprinkler head detection system is used in many
buildings. For this type of system, a sprinkler head will go off (releasing water) and set
off a water-flow sensor. The water-flow sensor is then able to set off the alarm system.
2.3.2 What is used in Addition to Requirements
In more specialized areas such as clean rooms, server rooms, and general
computer labs there should be minimal or no smoke in such an area, as it could damage
the contents of the room. This leads to a need for more sensitive smoke detection to
prevent damages. This gap is what brought about air sampling, which allows for smoke
detection at 0.0015 percent obscurity per foot, which can be found in the very early
stages of a fire, such as smoldering or pre-flame. Most smoke detectors may only be
able to detect about 2.00 percent obscurity per foot. When detecting a fire at a very
early stage, it can easily be extinguished with minimal or no water usage to prevent
damages not only from flames but from suppression as well. Air sampling detectors are
now able to span twenty thousand square feet on one detector, which will save money
and allow for easier zone monitoring. (www.vision-fs.com)
An early warning to a potential fire buys time to investigate and intervene which
potentially avoids the damage, downtime, and cost of suppression release (Vision

7/28/2019 Vs Iqp Final
http://slidepdf.com/reader/full/vs-iqp-final 22/122
11
Systems document 10947, version 01). Suppression release can be costly and
disruptive. However, an early warning allows the prevention of this exercise saving time
and money. The early warning can also provide notification to fire departments or other
emergency response organizations before the situation worsens.
A detection system is run by the control panel, which electronically monitors all
the sensors that are contained within the system. It is responsible for devices such as
manual and automatic detection components as well as triggering alarm devices. The
more complex the system, the more specific the control panel is to an area. The panel
would be able to pick up an “input” signal from a certain area and alert the people where
the signal comes from. Compared to a basic suppression system, such as a sprinkler
system in which it is activated by a glass head breaking, this is considered an
“intelligent” system. (www.vision-fs.com)
2.3.3 Insurance Benefits of Additional Detection
Insurance is an important factor in a building or company. The insurance
agencies go through a questionnaire or checklist that involves the following risk
exposures before a policy is written:
o Property losses
o Business interruption losses
o Liability losseso Key person losseso Automobile losseso
Injury to employees
Property losses can come from physical damage to the property or losing use of
the property for a period of time.

7/28/2019 Vs Iqp Final
http://slidepdf.com/reader/full/vs-iqp-final 23/122
12
Business interruption losses are not always covered. Only a special kind of
insurance covers such indirect losses. Business interruption insurance reimburses the
difference between normal income and the income during the interruption.
Liability losses can occur when a court decides the company is responsible for
bodily injury. If a person is injured in a fire because the company did not provide
adequate detection then the company could be charged and have to pay liability loss.
Key person losses occur when a business owner or important member of the
business falls ill or dies. If something happens to the business owner in a fire, often an
attorney, accountant, or insurance agent helps in developing a plan for the survival of the
company.
Once exposures are identified and analyzed, the business must consider its risk
management. Loss control and guaranteeing availability of funds should be kept in mind
during risk management analysis. Transferring risk is a method of managing exposure to
loss. Most businesses do this by buying insurance. Insurance agents have been trained in
risk analysis in addition to being familiar with financial strategies and regulations that
govern them in each state. If extra measures have been taking, such as advanced smoke
and fire detection, the agent can amend a basic policy by adding special coverage and
endorsements. (Anastasio, Susan)
2.3.4 Reasons Certain Smoke Detection is not used
Each type of detector has positive and negative qualities. Smoke detectors are
great for a household, and smaller buildings which do not require a large volume of
people to move if there is an alarm. However, when evacuating large commercial
buildings, such as a mall, there are security and life safety issues to consider. Also, false
7/28/2019 Vs Iqp Final
http://slidepdf.com/reader/full/vs-iqp-final 24/122
13
alarms are more likely in some areas, which should be taken into consideration before
detectors are installed and employed. It is common for smoke detectors to trip when
people walk out of a steamy bathroom or where food is cooked, releasing steam or smoke
into the air. To solve this problem, heat detectors are used in such places. (Vision
Systems document 10947, version 01)
An “intelligent” system is more resourceful than a basic system. Intelligent
systems utilize microprocessors which is capable of incorporating and triggering many
systems such as alarms, ventilation and suppression systems. These systems have a
higher stability, enhanced maintenance, and ease of modification. This means that if a
building owner with such a system wants to add a detector to the alarm system the
operator would program this into the control panel of the system rather than rewire the
entire system. Also the stability of the device prevents false alarms. If the system detects
a problem, it attempts a quick reset. If dust or an insect is the problem, the detector
would fix itself on the quick reset. If the problem is smoke or fire condition then the
detector reenters the alarm mode immediately after the reset and the panel will now
regard this as a fire condition (Artim, Nick).
Maintenance of “intelligent” systems is often more simple than that of a basic
system. The system monitors the status of each detector. As it becomes dirty, the
microprocessor recognizes a decreased capability, and provides a maintenance alert.
Also, the system can be modified, adding or deleting a detector, by simply connecting or
removing the device from the addressable circuit, and changing the memory section
(Artim, Nick). These features suggest that the more basic systems would become less
likely to be used in newer and upgraded buildings.

7/28/2019 Vs Iqp Final
http://slidepdf.com/reader/full/vs-iqp-final 25/122
14
2.4 What has not been researched
Through the data collected through research, it is apparent that there has not been
sufficient research done into why fire and smoke detection systems are not utilized in
commercial buildings. Some factors may include financial obligations, legal reasons, or
negligence. In discovering this information, it could provide potential markets for
detection systems which address these features. This project would potentially expand
the market for Vision Systems’ PROACTIV®
fire alarm control panel and VESDA®
air
sampling smoke detector systems by exposing the holes in the market.

7/28/2019 Vs Iqp Final
http://slidepdf.com/reader/full/vs-iqp-final 26/122
15
3 MethodologyThe goal of this Interactive Qualifying Project was to provide Vision Systems
with insight for potential markets for their PROACTIV® integrated fire alarm control
panel and VESDA® air sampling smoke detector systems within large commercial
buildings. This chapter introduces the procedure that was used to analyze and identify
types of commercial buildings, and how effective current detectors are in reducing losses,
and increasing safety during fires.
3.1 Identifying ways to find potential markets
3.1.1 National Fire Incident Reporting System
The National Fire Incident Reporting System (NFIRS) was used as a primary
research tool. The NFIRS database is a compilation of fire department database reports
on every incident to which they responded. This yielded a general overview of the types
of incidents across the United States. In working with this data, it was discovered not
only what types of incidents occurred, but also how frequently. It was also determined
what types of deaths, injuries, detection systems, extinguishing systems, and causes were
involved with each fire.
In order to sort through and extract the relevant data contained in NFIRS, the field
was narrowed to larger commercial buildings such as public recreational complexes,
stadiums, medical complexes, hotels, warehouses, industrial plants, office buildings, as
well as shopping complexes. These buildings were known for having a larger building
structure classification, which could allow implementation of more preventative
detection.

7/28/2019 Vs Iqp Final
http://slidepdf.com/reader/full/vs-iqp-final 27/122
16
A program was written to allow a database to be created. This database
incorporated a few different files that included civilian deaths, firefighter deaths, areas of
origin, relative damages, and the ignited materials. The programs were used to
incorporate the tables into one large database which can be found in Appendix I. The
first program was used to incorporate data from years 1990 through 1998. The second
program was used incorporate data from 1999 through 2004.
In order to sort the data, Microsoft Access was used. Access allowed the data to
be narrowed down specifically to large commercial (non-residential) buildings. This was
accomplished by referencing the NFIRS’ Manual for value types. In each column on the
table (in the database), values are given which relate to specific building types, casualties,
locations, and materials involved in incidents. Once the database was sorted down to
large commercial buildings, information began to be extrapolated from the database in
the form of statistics. These statistics were broken down by year, in order to get insight
into general trends. Areas of the fires’ origin, initial material ignited, and casualties’ data
was then analyzed. Types of detectors and sprinkler systems located inside of buildings
with fires will also be analyzed from years 1999 through 2004. This data allowed insight
into which types of systems or combination of systems were best at reducing chances of
damages and casualties.
3.1.2 Interviews
In order to make use of some of the information received from the NFIRS and to
look into the current and future market for detection systems, it was important to talk to
current professionals that have created, tested, recommended, implemented and used
various detection systems.
7/28/2019 Vs Iqp Final
http://slidepdf.com/reader/full/vs-iqp-final 28/122
17
Insurance companies, building owners, system developers, fire marshals and
various consulting firms were contacted to see what types of systems they favor, and why
they recommended the systems they did in various situations. Through fire investigators,
fire marshals and building owners, it was possible to gain insight into systems that are/are
not used and why. Consulting firms and fire investigators provided insight into what are
the best and most feasible locations for air sampling detection systems. In many cases,
they were also able to discuss the limitations and problems that may arise with the
systems.
Some consulting and insurance firms also do testing on various systems. Through
these tests, and contacting of individuals that ran these tests, insight was given into how
accurate various systems are and how each type goes above and beyond the current
markets capabilities with regards to smoke, heat, and water flow/sprinkler detection
systems.
All of the individuals interviewed came from a list of professionals provided by
Vision Systems and Worcester Polytechnic Institute’s staff. These individuals were
asked for their qualifications, to determine each person’s credibility and allowing insight
into their fire protection background. A range of questions were then asked that
included:
- In your opinion, where are the top places to use air sampling and very earlydetection fire detectors?
- How effective do you feel these systems are compared to traditional systems?
- Do you know the difference between Vision System’s VESDA®
and Fenwal’s
AnaLASER air sampling systems?o What some of the limitations of each due to building construction and
environment?

7/28/2019 Vs Iqp Final
http://slidepdf.com/reader/full/vs-iqp-final 29/122
18
- How dependable are smart detection systems that have continual monitoring
capabilities, and how useful will they be.
- What are the limitations of each due to building construction and design?
- What are your qualifications and where have you worked in the fire protectionindustry?
4 Results and Analysis
4.1 NFIRS Data Collection
An analysis of the National Fire Incident Reporting System (NFIRS) revealed
many trends. The data was collected by fire departments across the United States. They
report on many aspects of fire incidents, some of which include location of the fire,
general building type, what material was ignited, what type of detection and sprinkler
systems were present (if any), as well as data on casualties.
Often NFIRS reports are incomplete with fields left blank. This is most likely due
to lack of knowledge with the reporting system. There is no required training for the
NFIRS reporting system and there are no regulations requiring reports to be filled out in
any specific manner. Due to this, as data is presented there may be columns with an
“unknown” value. This is to show where no data was entered into the report on that
subject matter.
As data was sorted and analyzed there were a few issues. In 1998, the NFIRS
reporting format changed. One result of this change in format was the addition of detector
type in the building. Because of this, detector types were able to be determined for fires
from 1999-2004 but not from 1990-1998. Despite this difference, the majority of the
NFIRs data remained the same between 1999-2004 and 1990-1998.

7/28/2019 Vs Iqp Final
http://slidepdf.com/reader/full/vs-iqp-final 30/122
19
In order to find a good location for VESDA air sampling smoke detection, it is a
good idea to know what fires are common in larger scale commercial buildings.
Statistics were sorted out by year to determine which areas of origin and causes of
ignition are most common for structure fires.
All data from the National Fire Incident Reports were inputted into tables which
can be found in Appendix II. The graphs found in sections 4.1.1 and 4.1.2 represent
average incidents from 1990 through 2004.
4.1.1 Areas of Fires
The areas of fire origin of structure fires were evaluated. Figure 1 illustrates that
“function areas”, “storage areas”, and “structural areas” are three major areas in which
detection systems would be beneficial. Before a recommendation can be made, a further
analysis of each area type must be done.

7/28/2019 Vs Iqp Final
http://slidepdf.com/reader/full/vs-iqp-final 31/122
20
Figure 2 breaks down the most common places of origin. It is seen that the three
most common areas were “kitchen and cooking areas”, “sleeping areas”, along with
“lavatories, locker rooms, and cloakrooms.”
Area of Origin(Average percentages in fires from 1990-2004)
3% 5%
25%
15%5%
14%
10%
18%
3%
2%
Means of Egress Assembly, Sales Areas Function Areas (sleeping, kitchen, etc)
Function Areas (laboratory, etc.) Storage Areas Service Facilities
Service, Equipment Areas Structural Areas Transportation, Vehicle Areas
Other Areas of Origin
Figure 1-Area of Origin

7/28/2019 Vs Iqp Final
http://slidepdf.com/reader/full/vs-iqp-final 32/122
21
Area of OriginFunction Areas
20%
4%
7%
34%
16%
12%
6%1%
Sleeping room for under 5 persons. Sleeping area for 5 or more persons. Dining area, lunchroom, cafeteria.
Kitchen, cooking area. Lavatory, locker room, cloakroom. Laundry room, area.
Office. Personal service area.
Figure 2-Area of Origin's Function Areas
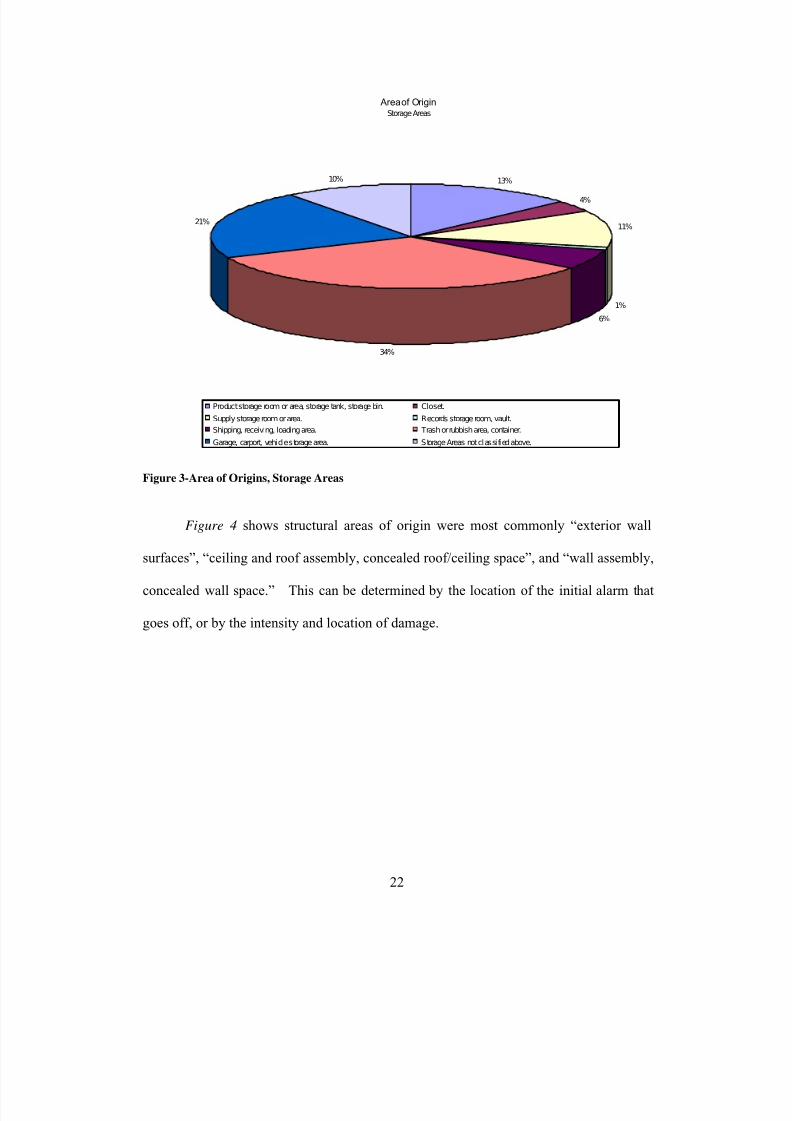
Throughout storage areas, “trash and rubbish containers” were found to be the
most common area of origin for fires. “Vehicle storage” and “product storage” areas
were also found to be frequent areas of origin. This is seen in Figure 3.
7/28/2019 Vs Iqp Final
http://slidepdf.com/reader/full/vs-iqp-final 33/122
22
Area of OriginStorage Areas
13%
4%
11%
1%
6%
34%
21%
10%
Product storage room or area, storage tank, storage bin. Closet.
Supply storage room or area. Records storage room, vault.
Shipping, receiving, loading area. Trash or rubbish area, container.
Garage, carport, vehicle storage area. Storage Areas not classified above.
Figure 3-Area of Origins, Storage Areas
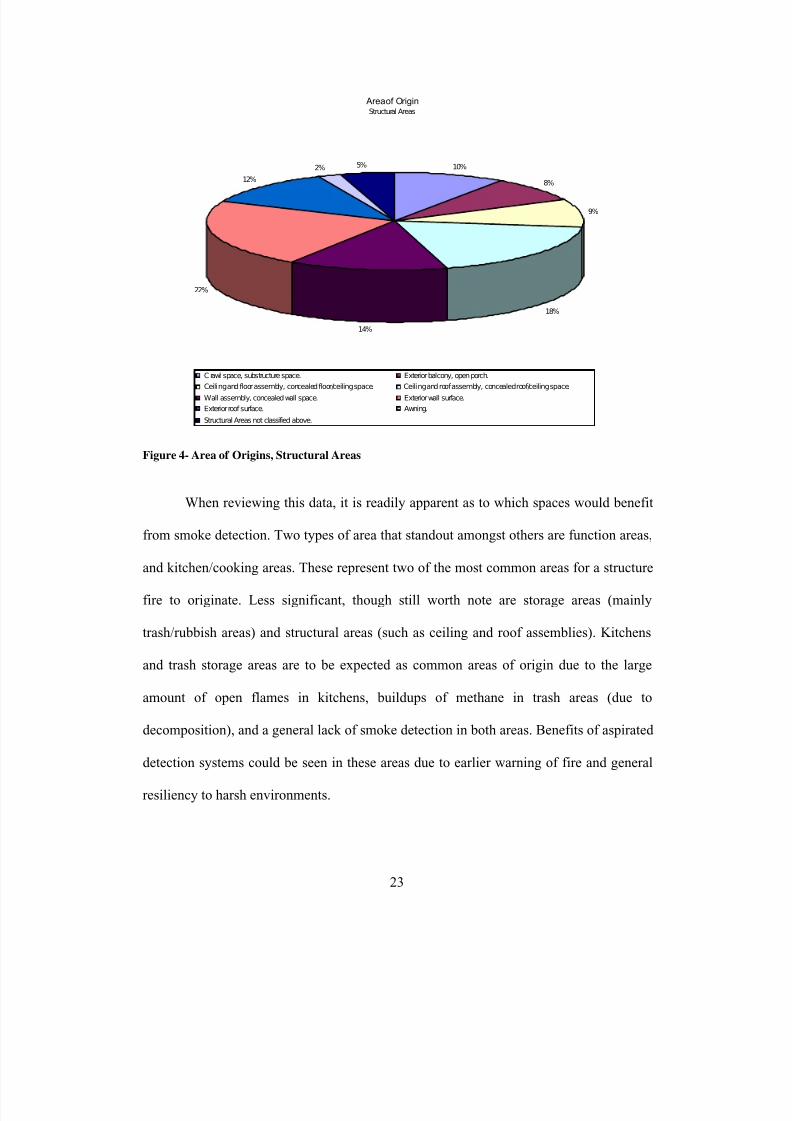
Figure 4 shows structural areas of origin were most commonly “exterior wall
surfaces”, “ceiling and roof assembly, concealed roof/ceiling space”, and “wall assembly,
concealed wall space.” This can be determined by the location of the initial alarm that
goes off, or by the intensity and location of damage.
7/28/2019 Vs Iqp Final
http://slidepdf.com/reader/full/vs-iqp-final 34/122
23
Area of OriginStructural Areas
10%
8%
9%
18%
14%
22%
12%
2% 5%
C rawl space, substructure space. Exterior balcony, open porch.
Ceiling and floor assembly, concealed floor/ceiling space. Ceiling and roof assembly, concealed roof/ceiling space.
Wall assembly, concealed wall space. Exterior wall surface.
Exterior roof surface. Awning.
Structural Areas not classified above.
Figure 4- Area of Origins, Structural Areas
When reviewing this data, it is readily apparent as to which spaces would benefit
from smoke detection. Two types of area that standout amongst others are function areas,
and kitchen/cooking areas. These represent two of the most common areas for a structure
fire to originate. Less significant, though still worth note are storage areas (mainly
trash/rubbish areas) and structural areas (such as ceiling and roof assemblies). Kitchens
and trash storage areas are to be expected as common areas of origin due to the large
amount of open flames in kitchens, buildups of methane in trash areas (due to
decomposition), and a general lack of smoke detection in both areas. Benefits of aspirated
detection systems could be seen in these areas due to earlier warning of fire and general
resiliency to harsh environments.

7/28/2019 Vs Iqp Final
http://slidepdf.com/reader/full/vs-iqp-final 35/122
24
4.1.2 Materials ignited
The leading materials ignited during incidents were primarily “wood, paper”,
“fabrics, textiles, furs”, and “natural products.” Similar to areas of origin, the materials
ignited must be analyzed further to draw any conclusions.
Type of Material Ignited(Average percentages in fires from 1990-2004)
2% 7%
7%
8%
25%
10%
40%
1%
Gas Flammable, Combustible Liquid Volatile Solid, Chemical
Natural Product Wood, Paper Fabric, Textile, Fur
Material Compounded with Oil Other, Material not Classified Above
Figure 5-Type of Material Ignited
As shown by Figure 5, wood and paper products are reported as the cause of 25%
of structure fires from 1990-2005. While already a large percentage, it appears even more
significant when considering that forty percent of the materials were listed as
“unclassified”. Out of all the fires caused by wood and paper products, thirty percent
were cause by sawn wood and twelve percent were caused by wood shavings (see Figure
6 , below). These findings are significant as they point to saw mills and wood-working
shops as potential areas for aspirated smoke detection systems. Buildings like saw mills

7/28/2019 Vs Iqp Final
http://slidepdf.com/reader/full/vs-iqp-final 36/122
25
and wood-working shops are at high risk for two specific reasons. First, the equipment
used creates very high levels of friction which, when combined with the present materials
(sawdust, dried lumber, etc.) creates a fire hazard. Secondly, this type of facility often
does not employ smoke detection because of its limitations in a high-dust atmosphere.
Thus, aspirated smoke detection systems would be vital to control and prevent fire in
these areas mainly for the very early warning properties but also for their filtering
capability in the dusty environments.
Type of Material IgnitedWood, Paper
3%10%
30%
12%6%
4%
20%
8%
7%
Growing wood. Felled but unsawn wood.
Sawn wood. Wood shavings.
Hardboard, plywood. Fiberboard (lowdensity material), wood pulp.
Paper, untreated, uncoated. Cardboard.
Wood, Paper; insufficient information available to classify further.
Figure 6-Type of Material Ignited, Wood and Paper
“Man-made fabric, fiber, finished goods” were ignited the most often throughout
the fabrics, textiles and fur category. “Furs, silk, other fabric, finished goods” followed
behind at almost one fifth the number of confirmed fires started by man-made fabrics.
This is shown in Figure 7 .

7/28/2019 Vs Iqp Final
http://slidepdf.com/reader/full/vs-iqp-final 37/122
26
Material IgnitedFabric, Textile, Fur
50%
13%0%
1%
36%
Man-made fabric, fiber, finished goods. Fur, silk, other fabric, finished goods.
Wig. Human hair.
Fabric, Textile, Fur; insufficient information available to classify further.
Figure 7-Type of Material Ignited , Fabric, Textiles and Fur
From a breakdown of natural products ignited, shown in Figure 8 , “grass, leaves,
hay, straw” were the most commonly ignited material. “Tobacco” and “food, starch”
ranked second and third, in this category.

7/28/2019 Vs Iqp Final
http://slidepdf.com/reader/full/vs-iqp-final 38/122
27
Type of Material IgnitedNatural Product
1% 2%
52%
6%
5%
12%
11%
11%
Cork. Leather.
Grass, leaves, hay, straw. Grain, natural fiber (pre-process).
Coal, coke, briquettes, peat. Food, starch.
Tobacco. Natural Product; insufficient information available to classify further.
Figure 8-Type of Material Ignited, Natural Products
It can be seen that one-fourth of the reported fires were started by wood and
paper. This is a high number considering forty percent of the materials were listed as
unknown or not reported. The other two types of material in the top three did not
combine to make up the number wood and paper did. However, fabrics and man-made
textiles were also a significant source of the fires along with grass, leaves, hay, and straw.
This can be expected due to the fact that when heated grass and hay could ignite easily
compared to something such as rubber.

7/28/2019 Vs Iqp Final
http://slidepdf.com/reader/full/vs-iqp-final 39/122
28
4.1.3 Deaths in relation to Sprinkler and Detection systems
Overall when looking into deaths during fires, the use of sprinklers and general
detection systems decreased the amount of deaths in a structure. Combination systems
were more effective than sprinkler systems alone. Having only detection systems would
result in a slightly higher death rate than both of the above. When looking into areas
which did not have any detection or sprinklers present, a drastic rise in death rate
occurred. This rise was usually about ten times higher than the amount of deaths that
resulted from a combination sprinkler and detection system, or sprinklers alone. These
results are seen in Figure 9.
Figure 9-Casualty Data with/without Sprinklers and Detectors
Casualty Data With and Withou t Sprinklers and DetectorsFrom 1990 through 2004
41%
5%
23%
27%
4%
Unknown With Sprinklers and Detectors
With Sprinklers Only
With Detectors Only
Without Detectors and Sprinklers
7/28/2019 Vs Iqp Final
http://slidepdf.com/reader/full/vs-iqp-final 40/122
29
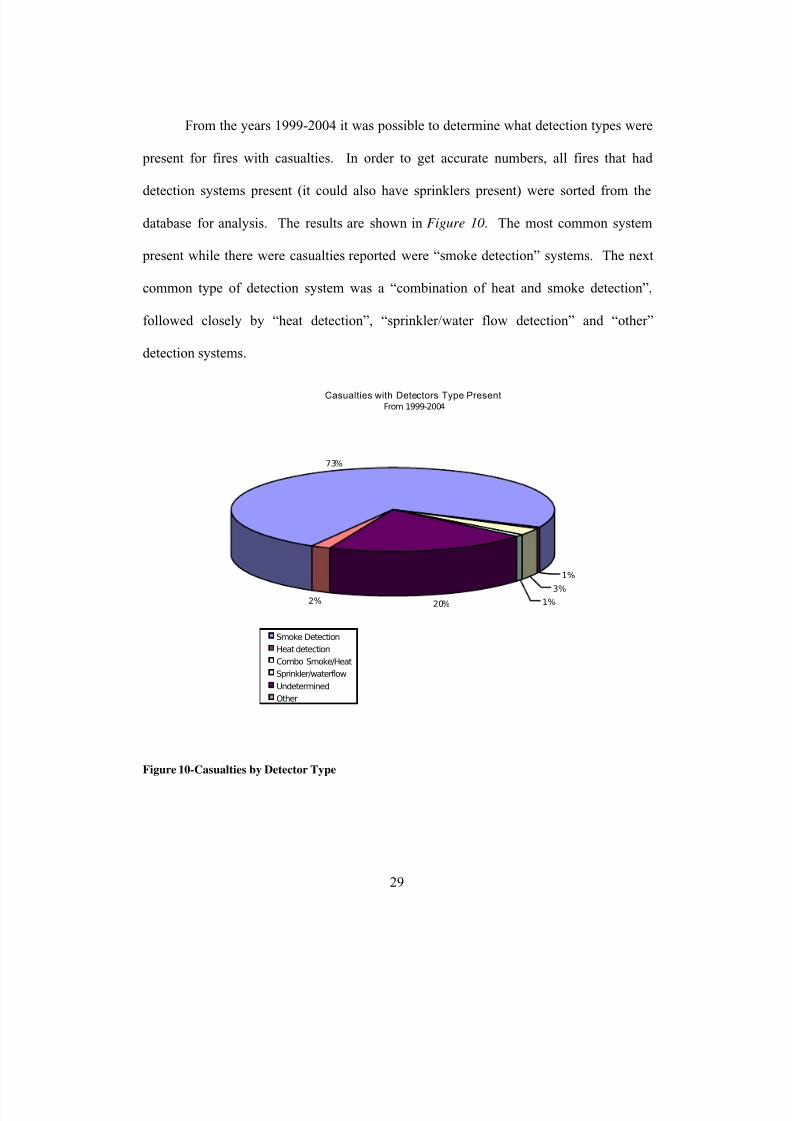
From the years 1999-2004 it was possible to determine what detection types were
present for fires with casualties. In order to get accurate numbers, all fires that had
detection systems present (it could also have sprinklers present) were sorted from the
database for analysis. The results are shown in Figure 10. The most common system
present while there were casualties reported were “smoke detection” systems. The next
common type of detection system was a “combination of heat and smoke detection”,
followed closely by “heat detection”, “sprinkler/water flow detection” and “other”
detection systems.
Figure 10-Casualties by Detector Type
Casualties with Detectors Type PresentFrom 1999-2004
73%
1% 3%
1% 20%2%
Smoke Detection
Heat detection
Combo Smoke/Heat
Sprinkler/waterflow
Undetermined
Other

7/28/2019 Vs Iqp Final
http://slidepdf.com/reader/full/vs-iqp-final 41/122
30
While analyzing NFIRS data concerning casualties it was noted that smoke
detection was present in a large number of casualty-producing incidents. This fact
seemed contrary to popular belief and research showing that smoke detection saves lives.
Further analysis of the data was performed to find a reason for this odd result. Sorting the
general database of incidents by the detection type present revealed the answer. It could
be seen that thirty three percent of buildings had a combination of smoke and heat
detection while twenty two percent had only smoke detection. This means that fifty five
percent of buildings had smoke detection in place while the remaining forty five percent
had an array of different systems (heat detection only, water flow/sprinkler detection,
etc.). Since a majority of the buildings had smoke detection in place, it makes sense
(statistically) that casualties would appear more often with smoke detection. Because
NFIRS doesn’t note the number of lives saved in any given incident it is impossible to
comment with certainty on the comparative effectiveness of smoke detection.
4.2 Interview results People were contacted and asked questions regarding their professional view on
the air sampling smoke detection systems. In total, 925 individuals were contacted via e-
mail with a response rate of 3.25%. Fire Protection and industry engineers accounted for
64.3% of those contacted. According to the answers received, Fire Protection Engineers
view the VESDA system very favorably. Respondents listed numerous features that they
felt made the VESDA system advantageous, however one feature seemed particularly
popular. The ability for the VESDA system to be easily integrated into a large number of
fire alarm control panels appears to make the system stand out against its competitors in
the eyes of fire protection engineers. Another feature that sticks out to engineers is
7/28/2019 Vs Iqp Final
http://slidepdf.com/reader/full/vs-iqp-final 42/122
31
VESDA’s ability to deal with smoke detection in buildings with atriums. The precision
smoke detection offered by VESDA allows for smoke detection in high roofed areas and
places with very large temperature gradients. However, there were complaints on
VESDA’s inability to deal with smoke detection in inert environments. This is a cause for
concern in chemical storage rooms and other places where the system may be used when
air circulation is a factor.
When asked about the limitations of the air sampling systems compared to the
limitations of spot detections, the answers revealed some weaknesses in both systems. Of
the engineers contacted, 64 percent cited a problem with spot detectors as having
difficulties with high ceilings and large temperature gradients, problems that the VESDA
system is well suited in handling. However, according to the answers received, VESDA
also had some difficulties with certain environments. As previously mentioned, inert air
systems can cause problems for the VESDA system. In addition, fire protection systems
in facilities such as nuclear power plants and even biomedical facilities must be able to
provide adequate protection and also prevent radiation or biological contamination of
outside zones. VESDA does have the ability to maintain itself in individual quarantine
zones; however it might be cost prohibitive to install a separate VESDA system in each
quarantined room. Other difficulties noted in the responses were the problems involved
with troubleshooting pipe flow. According to one respondent, problems have occurred
where scanning the entire length of an air pipe was required to find a problem. This
means removing wall, ceiling and floor panels and scanning individual pipes to find the
problem. Vision Systems has acknowledged this problem and has introduced measures to

7/28/2019 Vs Iqp Final
http://slidepdf.com/reader/full/vs-iqp-final 43/122
32
alert the control panel of precisely where blockages have occurred, see the literature
review for more information.
Of the respondents who were familiar with the VESDA system, everyone had
good things to say about VESDA. The ability for the system to integrate into many
panels, to detect combustion at different levels, and the ability to provide protection
virtually anywhere make the system almost the perfect system for any location. However,
contamination risks, inert environments and, most importantly, prohibitive costs are the
main problems areas reported back by fire protection engineers that have worked with the
systems. According to the respondents of the questionnaire the most popularly viewed
areas that would make use of VESDA’s system include historical buildings, lobbies with
large atriums, explosives storage, high cost storage rooms, service dependent areas,
server rooms, and live broadcast television studios.
4.3 Compiled Analysis
As shown by a review of building/fire codes and standards, detection systems are
not explicitly required in large commercial buildings. The codes reviewed focus mainly
upon safety of occupants inside the building rather than the structure itself. Generally,
these buildings require sprinkler systems along with a manual “pull box” and a public
address system. While such a system is not exactly proactive in its detection of fire, it
will give occupants more time to evacuate though not necessarily save the building.
The interviews of AHJs have shown, that they favored a detection system that
constantly monitors a building for fire, opposed to detects that respond once a fire has
already begun, such as spot detectors A common theme was that an earlier notification of
fire is always better, preferably one that can detect combustion in the incipient stage.
7/28/2019 Vs Iqp Final
http://slidepdf.com/reader/full/vs-iqp-final 44/122
33
Notification of a fire during this stage would give the building occupants enough time to
respond to the situation before the combustion has advanced. Another example given by
AHJ’s was that early detection (in their experience) is best used in buildings containing
irreplaceable items, expensive items, or buildings of historical value.
Although smoke detection, including air sampling smoke detection, systems are not
required by code, it may be in the best interest of building owners to take a proactive
approach to fire detection. According to the interviews conducted, the chance of
preventing bodily harm and reduced losses due to fires are significantly decreased with
early detection systems. It was learned that the type of materials stored in the buildings
affects what type of detection system building owners prefer to use. VESDA has been
recommended for use in chemical storage facilities with heat sensitive materials and also
pharmaceutical storage facilities. Correlations between type of material stored and their
risks are represented in the NFIRS data.
NFIRS reiterated that specific materials housed within a building pose higher risk
of fire than others. Leading materials were “wood and paper”, “fabrics, textiles, and fur”,
and “other natural products”. Areas housing materials such as these could make use of an
early detection system, as their fire load is extremely high with potential for a rapidly
spreading fire. Scaled down air sampling systems that are made only to cover high-risk
areas may be beneficial to building owners. These building owners could protect
valuable products while keeping protection costs down. The areas housing these “high
risk” materials were also analyzed with the NFIRS reports. These high risk areas of
origin were found to be larger scale “storage areas” and “production and manufacturing”
areas. Adopting an air sampling systems in these likely fire origin areas would have been

7/28/2019 Vs Iqp Final
http://slidepdf.com/reader/full/vs-iqp-final 45/122
34
very beneficial in keeping fires small throughout the NFIRS reports that were analyzed.
From these results, conclusions and recommendations can be drawn for viable marketing
niche for Vision Systems’ VESDA air sampling system.

7/28/2019 Vs Iqp Final
http://slidepdf.com/reader/full/vs-iqp-final 46/122
35
5 Conclusions
Through the data collected, it was observed that to successfully market the VESDA
product it is important to exemplify the strengths of the system and to modify the system
to overcome the problems that have come up. The following suggestions are
recommended to increase the marketability of Vision Systems’ VESDA system.
VESDA’s ability to detect smoke during the incipit stages allows the system to be
implemented in scenarios where heat sensitive chemicals or pharmaceutical storage is
involved. By gaining understanding of the needs of such an industry, VESDA could
break into a large market which it could potentially dominate. A main hindrance of
VESDA’s widespread use is the perception of higher cost. There are two options that
should be considered. First would be to consider actively promoting the full product
range such as a scaled-down and less expensive VESDA system LaserFOCUS for use in
smaller spaces. This would allow the system to be implemented strategically and provide
incentive to prospective buyers. Another route would be to develop a clear picture of total
cost of system ownership, including on-going system maintenance needs and high system
reliability to change people’s perception of higher first installation cost.
The ability for VESDA to be able to detect small changes in the quantity of smoke
particles in the air provides another market for the system. VESDA could possibly be
used as a friction/over-friction monitoring device in manufacturing facilities. This would
allow Vision Systems to enter an entirely new market that could potentially be a very
easy transition.
Another recommendation is to further the ability of the VESDA system to easily
integrate into a large number of control boxes. This ability is highly advantageous to
7/28/2019 Vs Iqp Final
http://slidepdf.com/reader/full/vs-iqp-final 47/122
36
installers and engineers and provides a way to further VESDA’s penetration into the high
end smoke detection market.
The system’s technology allows its use in nearly every building condition. If the first
install price of the systems could be lowered while still maintaining a modest profit
margin for the manufacturer, the AHJ’s expressed a notion that the system would be a
valid fire safety option for many United States buildings.
The objective of this project was to find a profitable marketing solution for Vision
Systems’ VESDA air sampling system. In the future, Vision Systems may find it
profitable to decrease their prices while marketing to more business owners who wish to
proactively protect their building and its contents. In addition, using VESDA’s
technology in other applicable situations may allow Vision Systems to expand into more
specialized and less populated markets.

7/28/2019 Vs Iqp Final
http://slidepdf.com/reader/full/vs-iqp-final 48/122
37
6 Glossary of abbreviations
Abbreviation Actual Name
USFA United States Fire Administration
NFIRS National Fire Incident Reporting System
NFPA National Fire Protection Association
IBC International Building Codes
AHJ Authority Having Jurisdiction
VESDA ® Vision System©’s Very Early Smoke Detection Apparatus

7/28/2019 Vs Iqp Final
http://slidepdf.com/reader/full/vs-iqp-final 49/122
38
7 Works Cited
Anastasio, Susan. “Small Business Insurance & Risk Management Guide.” U.S. Small
Business Administration. The Travelers, Hartford, CT.
Artim, Nick. “An Introduction to Fire Detection, Alarm, and Automatic, Fire
Sprinklers.” Northeast Document Conservation Center. 1999.
Baker, Michael. “Fire Protection Glossary.” ETnews.org Michael Baker & Associates
Inc. Gladstone, OR. 2006.
Dean, John C. "State of Maine Fire Marshall's Office." Maine State Fire Marshall.
<http://www.maine.gov/dps/fmo>.
Fekete, Chen-Fang Chang. “Air-fuel ratio control in spark-ignition engines using
estimationtheory.” Control Systems Technology. March 1995.
Karter, Michale K. “Fire Loss in the United States During 2005: Full Report”
National Fire Protection Association, 2006
McEwen, R.H.L. “Fire Alarm and Detection Systems”
Canadian Building Digest, August 1984
National Fire Protection Association. National Fire Codes. Vol. 2005 Fall Revision
Cycle., 2005
Robin, Mark and Forsell, Eric. “Comparison Testing in a Simulated Data
Processing/Telecommunications Facility: FM-200® and Automatic Sprinkler
Systems.” Hughes Associates, Inc., West Lafayette, IN.
Sivathanu, Yudaya R. “Fire Detection Using Near-IR Radiation and Source Temperature
Discrimination.” Perdue University, West Lafayette, IN.

7/28/2019 Vs Iqp Final
http://slidepdf.com/reader/full/vs-iqp-final 50/122
39
Tabor, Caterina. “Modern Fire Protection System safeguards Venues.”
International Association of Assembly Managers, 2006
Vision Systems. “VESDA Buys Time. Air Sampling Smoke Detection.” Part no:
30101, document: 10947, version: 01. July 2006.
Rohr, Kimberly D. and Hall, John R. Jr. “U.S. Experience with Sprinklers and Other Fire
Extinguishing Equipment”, National Fire Protection Association, August 2005

7/28/2019 Vs Iqp Final
http://slidepdf.com/reader/full/vs-iqp-final 51/122
40
8 Appendix I -NFIRS sorting programming codes
8.1 Program 1 (1999-2004)
Program one was run for the combining of NFIRS from the years 1999 through
2004. Program located below.
#include <stdio.h>#include <stdlib.h> /* for malloc() */
#define INPUTLINELENGTH 150 /* max length of input file line. */
/* structure for holding relevant data from inputfile */ typedef struct FireRecP {
int FDID,IncidentNumber,ExposureNumber;char textRecord[INPUTLINELENGTH];
struct FireRecP *Next,*End;} fireRec;
/* function prototypes */
fireRec *addToList(fireRec*,int,int,int,int,char*);
int findMatchesInLists(fireRec*,fireRec*);
int main()
{
fireRec
*t20List, /* list of type20 records */*t55List; /* list of type55 records */
int FDID,IncNum,ExpNum,RecType, /* NFIRS record vars */
numType20,numType55, /* record type counters */matchesFound; /* No. 55/20 matches found */
char inputLine[INPUTLINELENGTH]; /* char array for holding lines
from inputfile */
t20List=t55List=NULL; /* initialize list pointers to NULL */
numType20=numType55=0; /* initialize counters *//* Part 1: we read in the input file... taking t20 and t55
records....... */
while (fgets(inputLine,INPUTLINELENGTH,stdin)!=NULL)
{ /* while we still have inputlines, read 'em in. */sscanf(inputLine,"%d,%d,%d,%d", /* use nasty slow scanf library routine */
&FDID,&IncNum,&ExpNum,&RecType);
/* If the rec is a type20 or type55 add it to a list of those
records: */
switch (RecType){
case 20:
t20List=addToList(t20List,FDID,IncNum,ExpNum,RecType,inputLine);
numType20++;if (numType20%50000==0)
fprintf(stderr,"read %9d t20, %7d t55 records...\n",
numType20,numType55);

7/28/2019 Vs Iqp Final
http://slidepdf.com/reader/full/vs-iqp-final 52/122
41
break;
case 55:
t55List=addToList(t55List,FDID,IncNum,ExpNum,RecType,inputLine);
numType55++;
if (numType55%5000==0)
fprintf(stderr,"read %9d t20, %7d t55 records...\n",
numType20,numType55); break;
default: break;
}
/* OK, done reading the inputfile, now do our search for Russo:
for each t20 record, find any corresponding t55. If you find
a corresponding record, tack the inputlines for the t20 and
t55 together, and output them to stdout. */
}
fprintf(stderr,"TOTAL: Read %d t20 records and %d t55 records.\n",
numType20,numType55);
/*
Now that we have our t20 and t55 record lists, go through the 20's
looking for matches in the 55's. Which way would be faster?Probably "foreach 55, look for 20's." as opposed to "foreach 20,
look for 55's" since there are fewer 55's than 20's by a long
margin.
*/
matchesFound=findMatchesInLists(t20List,t55List);
fprintf(stderr,"Found %d t20/t55 matches in the input.\n",
matchesFound);
return(0);
}
int findMatchesInLists(fireRec *t20List, fireRec *t55List) {
int matches,
num55sSearched;
fireRec *t20Place,*t55Place;
t55Place=t55List;
matches=num55sSearched=0;
while(t55Place!=NULL)
{
t20Place=t20List;
while (t20Place!=NULL)
{
if (t20Place->FDID==t55Place->FDID)
{
if (t20Place->IncidentNumber==t55Place->IncidentNumber)
{if (t20Place->ExposureNumber==t55Place->ExposureNumber)
{
printf("%s,%s\n",t20Place->textRecord,
t55Place->textRecord);
matches++;
}
}
}

7/28/2019 Vs Iqp Final
http://slidepdf.com/reader/full/vs-iqp-final 53/122
42
t20Place=t20Place->Next;
}
t55Place=t55Place->Next;
num55sSearched++;
if (num55sSearched%1000==0)
fprintf(stderr,"Searched %d t55 records...\n",num55sSearched);
}return(matches);
}
fireRec *addToList(fireRec *list, int FDID, int IncNum, int ExpNum, int RecType,
char *inputLine)
{
fireRec *place;
int i=0;
if (list==NULL)
{
list=(fireRec *)malloc(sizeof(fireRec));
if (list==NULL)
{ perror("\nAdd To List (1):");
exit(1); /* exit 1 is bad malloc making initial list node */
}
place=list;
}
else
{
place=list->End;
place->Next=(fireRec *)malloc(sizeof(fireRec));
if (place->Next==NULL)
{
perror("\nAdd To List (2):");
exit(2); /* exit 2 is bad malloc making initial list node */
}
place=place->Next;
}
place->Next=NULL;
list->End=place;
place->FDID=FDID; place->IncidentNumber=IncNum; place->ExposureNumber=ExpNum;
while (inputLine[i]!=0 && inputLine[i]!='\r')
{ /* while loop above should also check "&& i<INPUTLINELENGTH" but
I removed it to speed up processing --mvoorhis */
place->textRecord[i]=inputLine[i];
i++;
} place->textRecord[i]=0; /* remember to null-terminate the string */
return(list);
}

7/28/2019 Vs Iqp Final
http://slidepdf.com/reader/full/vs-iqp-final 54/122
43
8.2 Program 2 (1990-1998)
Program one was run for the combing of NFIRS from the years 1990 through
1998. Program is located below.
#include <stdio.h>
#include <stdlib.h> /* for malloc() */
#define INPUTLINELENGTH 150 /* max length of input file line. */
/* structure for holding relevant data from inputfile */ typedef struct FireRecP {
int FDID,IncidentNumber,ExposureNumber;
char textRecord[INPUTLINELENGTH];
struct FireRecP *Next,*End;
} fireRec;
/* function prototypes */
fireRec *addToList(fireRec*,int,int,int,int,char*);
int findMatchesInLists(fireRec*,fireRec*);
int main()
{
fireRec
*t20List, /* list of type20 records */
*t55List; /* list of type55 records */
int FDID,IncNum,ExpNum,RecType, /* NFIRS record vars */
numType20,numType55, /* record type counters */
matchesFound; /* No. 55/20 matches found */
char inputLine[INPUTLINELENGTH]; /* char array for holding linesfrom inputfile */
t20List=t55List=NULL; /* initialize list pointers to NULL */
numType20=numType55=0; /* initialize counters */
/* Part 1: we read in the input file... taking t20 and t55
records....... */
while (fgets(inputLine,INPUTLINELENGTH,stdin)!=NULL)
{ /* while we still have inputlines, read 'em in. */
sscanf(inputLine,"%d,%d,%d,%d", /* use nasty slow scanf library routine */
&FDID,&IncNum,&ExpNum,&RecType);
/* If the rec is a type20 or type55 add it to a list of those
records: */
switch (RecType)
{case 20:
t20List=addToList(t20List,FDID,IncNum,ExpNum,RecType,inputLine);
numType20++;
if (numType20%50000==0)
fprintf(stderr,"read %9d t20, %7d t55 records...\n",
numType20,numType55);
break;
case 55:
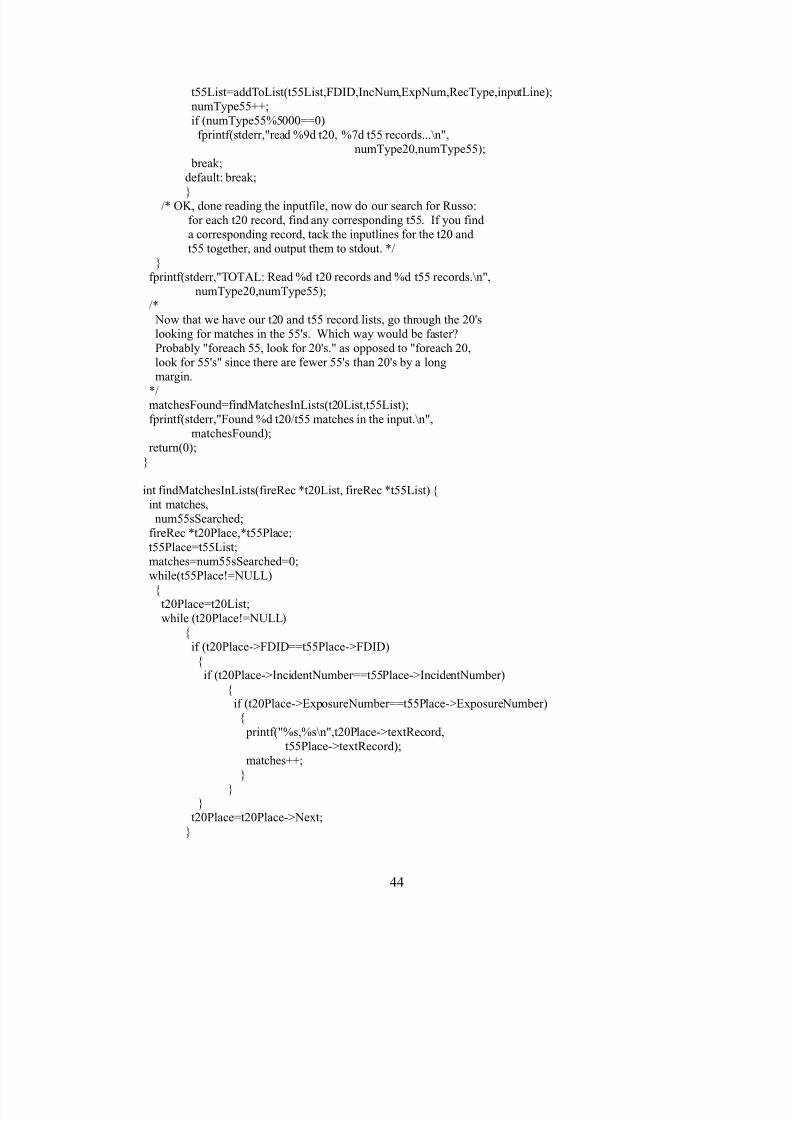
7/28/2019 Vs Iqp Final
http://slidepdf.com/reader/full/vs-iqp-final 55/122
44
t55List=addToList(t55List,FDID,IncNum,ExpNum,RecType,inputLine);
numType55++;
if (numType55%5000==0)
fprintf(stderr,"read %9d t20, %7d t55 records...\n",
numType20,numType55);
break;
default: break;}
/* OK, done reading the inputfile, now do our search for Russo:
for each t20 record, find any corresponding t55. If you find
a corresponding record, tack the inputlines for the t20 and
t55 together, and output them to stdout. */
}
fprintf(stderr,"TOTAL: Read %d t20 records and %d t55 records.\n",
numType20,numType55);
/*
Now that we have our t20 and t55 record lists, go through the 20's
looking for matches in the 55's. Which way would be faster?
Probably "foreach 55, look for 20's." as opposed to "foreach 20,
look for 55's" since there are fewer 55's than 20's by a longmargin.
*/
matchesFound=findMatchesInLists(t20List,t55List);
fprintf(stderr,"Found %d t20/t55 matches in the input.\n",
matchesFound);
return(0);
}
int findMatchesInLists(fireRec *t20List, fireRec *t55List) {
int matches,
num55sSearched;
fireRec *t20Place,*t55Place;
t55Place=t55List;
matches=num55sSearched=0;
while(t55Place!=NULL)
{
t20Place=t20List;
while (t20Place!=NULL)
{
if (t20Place->FDID==t55Place->FDID)
{
if (t20Place->IncidentNumber==t55Place->IncidentNumber)
{
if (t20Place->ExposureNumber==t55Place->ExposureNumber)
{ printf("%s,%s\n",t20Place->textRecord,
t55Place->textRecord);
matches++;
}
}
}
t20Place=t20Place->Next;
}
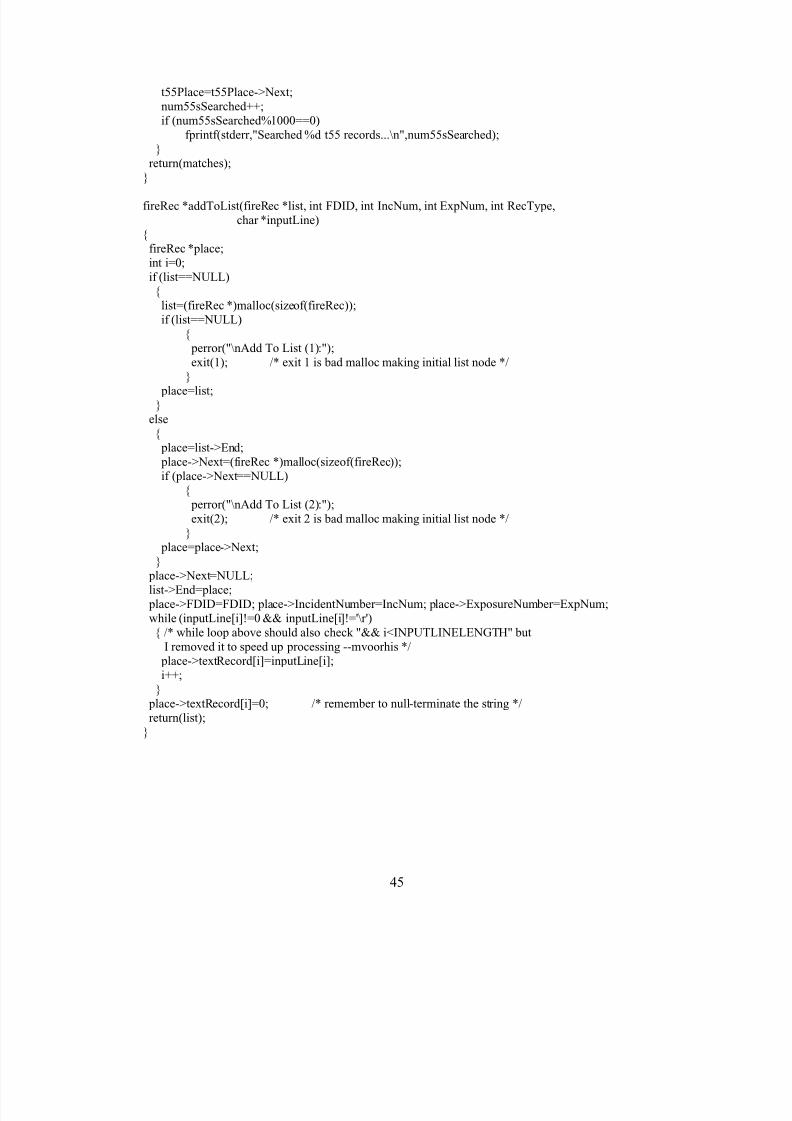
7/28/2019 Vs Iqp Final
http://slidepdf.com/reader/full/vs-iqp-final 56/122
45
t55Place=t55Place->Next;
num55sSearched++;
if (num55sSearched%1000==0)
fprintf(stderr,"Searched %d t55 records...\n",num55sSearched);
}
return(matches);
}
fireRec *addToList(fireRec *list, int FDID, int IncNum, int ExpNum, int RecType,
char *inputLine)
{
fireRec *place;
int i=0;
if (list==NULL)
{
list=(fireRec *)malloc(sizeof(fireRec));
if (list==NULL)
{
perror("\nAdd To List (1):");
exit(1); /* exit 1 is bad malloc making initial list node */}
place=list;
}
else
{
place=list->End;
place->Next=(fireRec *)malloc(sizeof(fireRec));
if (place->Next==NULL)
{
perror("\nAdd To List (2):");
exit(2); /* exit 2 is bad malloc making initial list node */
}
place=place->Next;
}
place->Next=NULL;
list->End=place;
place->FDID=FDID; place->IncidentNumber=IncNum; place->ExposureNumber=ExpNum;
while (inputLine[i]!=0 && inputLine[i]!='\r')
{ /* while loop above should also check "&& i<INPUTLINELENGTH" but
I removed it to speed up processing --mvoorhis */
place->textRecord[i]=inputLine[i];
i++;
}
place->textRecord[i]=0; /* remember to null-terminate the string */
return(list);}

7/28/2019 Vs Iqp Final
http://slidepdf.com/reader/full/vs-iqp-final 57/122
46
9 Appendix II -Data TablesData Table from f irst run of NFIRs (1999-2004)
Fires in Commercial build ingsHad detectors 39.96%
Did not have any type of detector present 60.04%
Detector Type(out of the 39.96 percent with detectors)
smoke 78.72%
heat 1.25%
both 4.83%
sprinkler/water flow detection 1.44%
had multiple types 3.13%
confirmed other type 0.66%
unknown type 9.97%
Detector operation
Detector(s) in the room or space of fire origin, and they operated. 13.66%
Detector(s) not in the room or space of fire origin, and they operated. 54.01%
Detector(s) in the room or space of fire origin, and they did not operate. 14.18%
Detector(s) in the room or space of fire origin, but fire too small to require to set off detectors 2.13%
undetermined/unknown 16.02%
Number of buildings involved
One Buildings 99.27%
Two Buildings 0.53%
Three Buildings 0.10%
Four Buildings or more 0.10%
Cause of ignition
Unknown/undetermined 10.74%
Incendiary 7.29%
Suspicious 43.66%
Misuse of heat ignited 15.84%
Misuse of material ignited 2.08%
Mechanical failure/malfunction 14.62%
Other 5.77%
Fire Spread
Confined to object of origin 18.52%
Confined to room of origin 33.47%
Confined to floor of origin 8.42%
Confined to building of origin 33.02%
Beyond building of origin 6.57%
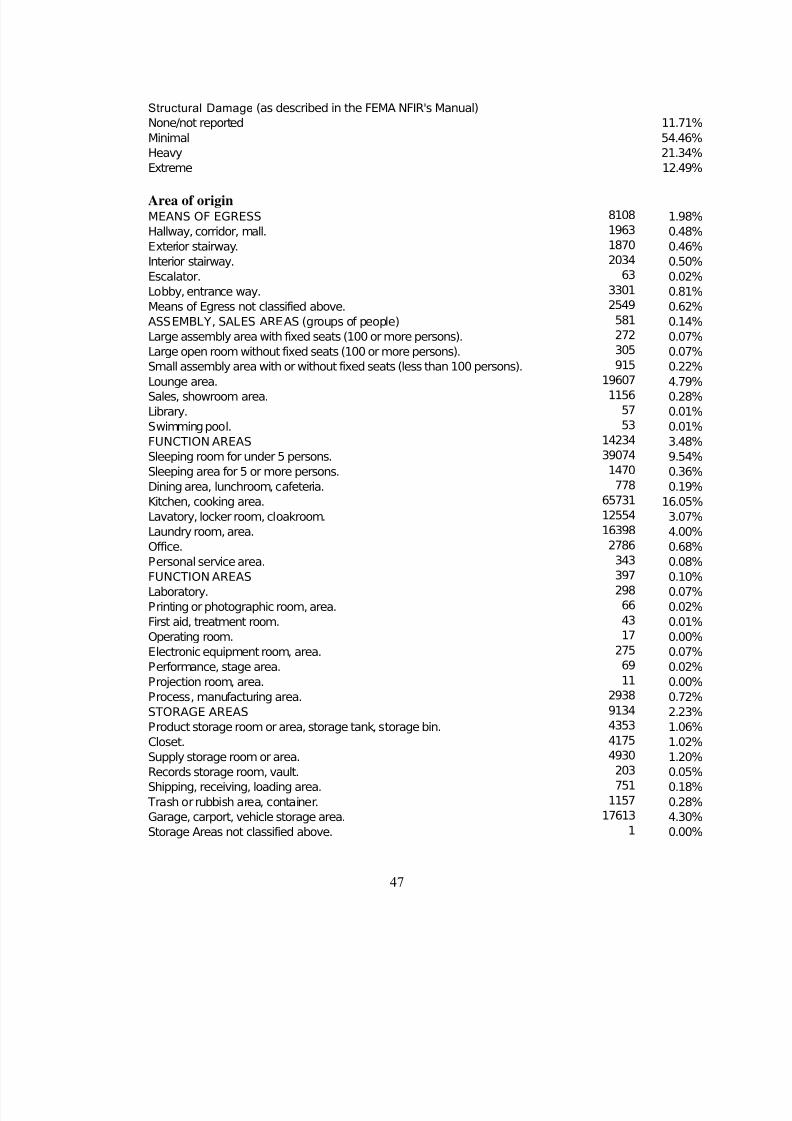
7/28/2019 Vs Iqp Final
http://slidepdf.com/reader/full/vs-iqp-final 58/122
47
Structural Damage (as described in the FEMA NFIR's Manual)
None/not reported 11.71%
Minimal 54.46%
Heavy 21.34%
Extreme 12.49%
Area of originMEANS OF EGRESS 8108 1.98%
Hallway, corridor, mall. 1963 0.48%
Exterior stairway. 1870 0.46%
Interior stairway. 2034 0.50%
Escalator. 63 0.02%
Lobby, entrance way. 3301 0.81%
Means of Egress not classified above. 2549 0.62%
ASSEMBLY, SALES AREAS (groups of people) 581 0.14%
Large assembly area with fixed seats (100 or more persons). 272 0.07%
Large open room without fixed seats (100 or more persons). 305 0.07%
Small assembly area with or without fixed seats (less than 100 persons). 915 0.22%
Lounge area. 19607 4.79%
Sales, showroom area. 1156 0.28%
Library. 57 0.01%
Swimming pool. 53 0.01%
FUNCTION AREAS 14234 3.48%
Sleeping room for under 5 persons. 39074 9.54%
Sleeping area for 5 or more persons. 1470 0.36%
Dining area, lunchroom, cafeteria. 778 0.19%
Kitchen, cooking area. 65731 16.05%
Lavatory, locker room, cloakroom. 12554 3.07%
Laundry room, area. 16398 4.00%
Office. 2786 0.68%
Personal service area. 343 0.08%
FUNCTION AREAS 397 0.10%
Laboratory. 298 0.07%
Printing or photographic room, area. 66 0.02%
First aid, treatment room. 43 0.01%
Operating room. 17 0.00%
Electronic equipment room, area. 275 0.07%
Performance, stage area. 69 0.02%
Projection room, area. 11 0.00%
Process, manufacturing area. 2938 0.72%
STORAGE AREAS 9134 2.23%
Product storage room or area, storage tank, storage bin. 4353 1.06%
Closet. 4175 1.02%
Supply storage room or area. 4930 1.20%
Records storage room, vault. 203 0.05%
Shipping, receiving, loading area. 751 0.18%
Trash or rubbish area, container. 1157 0.28%
Garage, carport, vehicle storage area. 17613 4.30%
Storage Areas not classified above. 1 0.00%
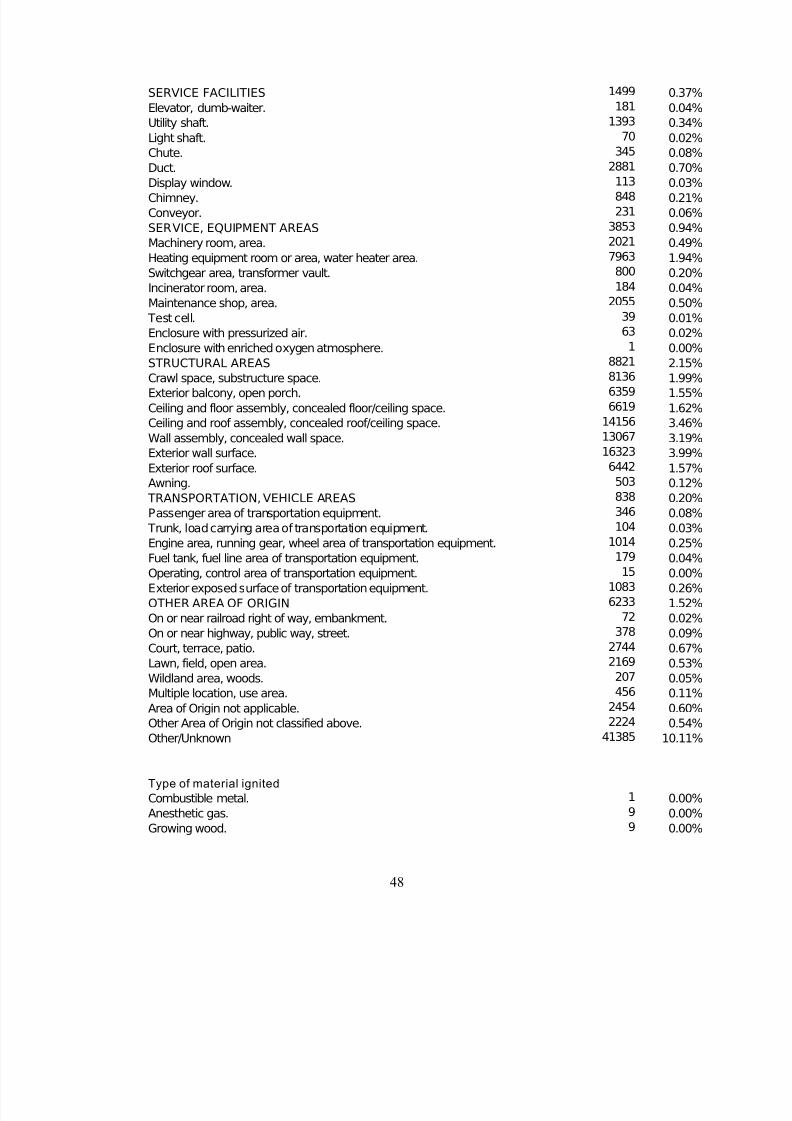
7/28/2019 Vs Iqp Final
http://slidepdf.com/reader/full/vs-iqp-final 59/122
48
SERVICE FACILITIES 1499 0.37%
Elevator, dumb-waiter. 181 0.04%
Utility shaft. 1393 0.34%
Light shaft. 70 0.02%
Chute. 345 0.08%
Duct. 2881 0.70%
Display window. 113 0.03%Chimney. 848 0.21%
Conveyor. 231 0.06%
SERVICE, EQUIPMENT AREAS 3853 0.94%
Machinery room, area. 2021 0.49%
Heating equipment room or area, water heater area. 7963 1.94%
Switchgear area, transformer vault. 800 0.20%
Incinerator room, area. 184 0.04%
Maintenance shop, area. 2055 0.50%
Test cell. 39 0.01%
Enclosure with pressurized air. 63 0.02%
Enclosure with enriched oxygen atmosphere. 1 0.00%
STRUCTURAL AREAS 8821 2.15%Crawl space, substructure space. 8136 1.99%
Exterior balcony, open porch. 6359 1.55%
Ceiling and floor assembly, concealed floor/ceiling space. 6619 1.62%
Ceiling and roof assembly, concealed roof/ceiling space. 14156 3.46%
Wall assembly, concealed wall space. 13067 3.19%
Exterior wall surface. 16323 3.99%
Exterior roof surface. 6442 1.57%
Awning. 503 0.12%
TRANSPORTATION, VEHICLE AREAS 838 0.20%
Passenger area of transportation equipment. 346 0.08%
Trunk, load carrying area of transportation equipment. 104 0.03%
Engine area, running gear, wheel area of transportation equipment. 1014 0.25%Fuel tank, fuel line area of transportation equipment. 179 0.04%
Operating, control area of transportation equipment. 15 0.00%
Exterior exposed surface of transportation equipment. 1083 0.26%
OTHER AREA OF ORIGIN 6233 1.52%
On or near railroad right of way, embankment. 72 0.02%
On or near highway, public way, street. 378 0.09%
Court, terrace, patio. 2744 0.67%
Lawn, field, open area. 2169 0.53%
Wildland area, woods. 207 0.05%
Multiple location, use area. 456 0.11%
Area of Origin not applicable. 2454 0.60%
Other Area of Origin not classified above. 2224 0.54%Other/Unknown 41385 10.11%
Type of material ignited
Combustible metal. 1 0.00%
Anesthetic gas. 9 0.00%
Growing wood. 9 0.00%

7/28/2019 Vs Iqp Final
http://slidepdf.com/reader/full/vs-iqp-final 60/122
49
Volatile Solid, Chemical; insufficient information available to classify further 26 0.01%
Specialty gas other than anesthetic. 30 0.01%
Felled but unsawn wood. 37 0.01%
Class IA flammable liquid. 51 0.01%Flammable, Combustible Liquid; insufficient information available to classifyfurther.
570.01%
Polyurethane. 80 0.02%Applied paint, varnish. 90 0.02%
Fiberboard (low density material), wood pulp. 109 0.03%
Class II combustible liquid. 166 0.04%
Gas; insufficient information available to classify further. 167 0.04%
Natural Product; insufficient information available to classify further. 188 0.05%
Acetylene. 191 0.05%
Hardboard, plywood. 205 0.05%
Adhesive, resin, tar. 263 0.06%
Polyacrylic. 269 0.07%
Grain, natural fiber (pre-process). 297 0.07%
Polyolefin. 307 0.07%
Class IIIB combustible liquid. 333 0.08%Gasoline. 362 0.09%
Polyvinyl. 381 0.09%
Polish. 696 0.17%
Sawn wood. 712 0.17%
Grease (nonfood). 779 0.19%
Wood shavings. 829 0.20%
Fat, grease (food). 911 0.22%
Rubber. 1051 0.26%
Class IC flammable liquid. 1090 0.27%
Paper, untreated, uncoated. 1165 0.28%
Volatile Solid, Chemical not classified above. 1257 0.31%
LP-gas. 1407 0.34%LP-City Gas (LP and air mix). 1638 0.40%
Plastic; insufficient information available to classify further. 1890 0.46%
Manufactured gas. 2500 0.61%
Polystyrene. 2623 0.64%
Gas not classified above. 3399 0.83%
Food, starch. 3595 0.88%
Class IB flammable liquid. 4208 1.03%
Polyester. 4443 1.08%
Radioactive material. 4807 1.17%
Tobacco. 6673 1.63%
Flammable, Combustible Liquid not classified above. 7383 1.80%
Leather. 8004 1.95%Class IIIA combustible liquid. 9377 2.29%
Grass, leaves, hay, straw. 9808 2.40%
Coal, coke, briquettes, peat. 10045 2.45%
Type of Material not classified above. 11535 2.82%
Plastic not classified above. 11937 2.91%
Natural gas. 14105 3.44%
Solid chemical (specify type). 26570 6.49%
Natural Product not classified above. 42025 10.26%

7/28/2019 Vs Iqp Final
http://slidepdf.com/reader/full/vs-iqp-final 61/122
50
Cork. 47568 11.62%
Type of Material undetermined or not reported 61957 39.52%
Heat source
HEAT FROM FUEL-FIRED, FUEL-POWERED OBJ ECT 21241 5.19%
Spark, ember, flame escaping from gas fueled equipment. 40299 9.84%
Heat from gas fueled equipment. 21498 5.25%Spark, ember, flame escaping from liquid fueled equipment. 46081 11.25%
HEAT FROM OPEN FLAME, SPARK 34858 8.51%
Cutting torch operation (separating metals). 19384 4.73%
Welding torch operation (joining metals). 2662 0.65%
Torch operation, other than cutting and welding. 3193 0.78%
HEAT FROM HOT OBJ ECT 18188 4.44%
Heat, spark from friction. 312 0.08%
Hot ember, ash. 25 0.01%
Electric lamp. 21 0.01%
Rekindle, reignition. 1402 0.34%
Heat from properly operating electrical equipment. 34 0.01%
HEAT FROM EXPLOSIVE, FIREWORKS 1524 0.37%Explosive. 13037 3.18%
Blasting agent. 12155 2.97%
Fireworks. 218 0.05%
Paper cap, party popper. 1896 0.46%
Model rocket, not amateur rocketry. 6900 1.68%
Incendiary device. 8346 2.04%
Heat from Explosive, Fireworks not classified above. 13622 3.33%Heat from Explosive, Fireworks; insufficient information available to classifyfurther.
820.02%
HEAT FROM NATURAL SOURCE 212 0.05%
Sun's heat. 2955 0.72%
Spontaneous ignition, chemical reaction. 1005 0.25%Lightning discharge. 192 0.05%
Static discharge. 1919 0.47%
HEAT SPREADING FROM ANOTHER HOSTILE FIRE (Exposure) 6217 1.52%
Heat from direct flame, convection currents. 270 0.07%
Radiated heat. 1704 0.42%
Heat from flying brand, ember, spark. 3332 0.81%
Conducted heat. 4345 1.06%
Multiple forms of heat of ignition. 254 0.06%
Other Form of Heat of Ignition not classified above. 421 0.10%
Form of Heat of Ignition undetermined or not reported 2192 29.23%
Structure TypeFire resistive. 396572 96.84%
Protected noncombustible or limited combustible. 8797 2.15%
Protected ordinary structure 216 0.05%
Unprotected ordinary structure 1265 0.31%
Protected Wood Frame 313 0.08%
Unprotected wood frame 2343 0.57%
Fire Fighter Deaths With/without detectors

7/28/2019 Vs Iqp Final
http://slidepdf.com/reader/full/vs-iqp-final 62/122
51
Detectors were present in the building 27.21%
Detectors were not present in the building 72.79%
Total number of deaths 136
Detector type present in fi res with firefighter deaths
Smoke detector 86.49%
Combination of smoke and heat detector 5.41%More than one type of detector present 2.70%
Unknown or unconfirmed detector type 5.41%
Power supply for detectors present in fires with firefighter deaths
Battery only 26 70.27%
Hardwired only 4 10.81%
hardwired with battery back-up 3 8.11%
Multiple detectors and power supplies 1 2.70%
Unknown/Unconfirmed 3 8.11%
Power Supply in detectors
Battery only 868 0.53%Hardwired only 77792 47.54%
Plug-in detector 26558 16.23%
hardwired with battery back-up 445 0.27%
Plug-in detector with battery back-up 24045 14.69%
Mechanical. (Includes spring-wound, stored pressure source, etc.) 1158 0.71%
Multiple detectors and power supplies 692 0.42%
Confirmed other type of power supply 5104 3.12%
Unknown/Unconfirmed 26977 16.49%
Damages incured during f ires where smoke detectors were present
Minimal 120368 80.24%Heavy 22577 15.05%
Extreme 7071 4.71%
NFIRs Data 1990
Fires in Commercial build ings
Had detectors 27486 49.07%
Did not have any type of detector present 28529 37.94%
Structural Damage (as described in the FEMA NFIR's Manual)
None/not reported 3184 5.68%
Minimal 26353 47.05%
Heavy 4533 8.09%
Extreme 14251 25.44%
Area of originMEANS OF EGRESS
Hallway, corridor, mall. 606 1.08%
Exterior stairway. 103 0.18%

7/28/2019 Vs Iqp Final
http://slidepdf.com/reader/full/vs-iqp-final 63/122
52
Interior stairway. 101 0.18%
Escalator. 10 0.02%
Lobby, entrance way. 296 0.53%
Means of Egress not classified above. 87 0.16%
ASSEMBLY, SALES AREAS (groups of people)
Large assembly area with fixed seats (100 or more persons). 66 0.12%
Large open room without fixed seats (100 or more persons). 121 0.22%Small assembly area with or without fixed seats (less than 100 persons). 184 0.33%
Lounge area. 534 0.95%
Sales, showroom area. 724 1.29%
Library. 9 0.02%
Swimming pool. 22 0.04%
Assembly, Sales Areas not classified above. 50 0.09%
FUNCTION AREAS
Sleeping room for under 5 persons. 1389 2.48%
Sleeping area for 5 or more persons. 65 0.12%
Dining area, lunchroom, cafeteria. 292 0.52%
Kitchen, cooking area. 2298 4.10%
Lavatory, locker room, cloakroom. 1051 1.88%Laundry room, area. 1176 2.10%
Office. 906 1.62%
Personal service area. 59 0.11%
FUNCTION AREAS
Laboratory. 150 0.27%
Printing or photographic room, area. 97 0.17%
First aid, treatment room. 50 0.09%
Operating room. 21 0.04%
Electronic equipment room, area. 274 0.49%
Performance, stage area. 25 0.04%
Projection room, area. 8 0.01%
Process, manufacturing area. 1900 3.39%Function Areas not classified above. 160 0.29%
STORAGE AREAS
Product storage room or area, storage tank, storage bin. 1878 3.35%
Closet. 184 0.33%
Supply storage room or area. 1515 2.70%
Records storage room, vault. 85 0.15%
Shipping, receiving, loading area. 507 0.91%
Trash or rubbish area, container. 5980 10.68%
Garage, carport, vehicle storage area. 1438 2.57%
Storage Areas not classified above. 776 1.39%
SERVICE FACILITIES
Elevator, dumb-waiter. 146 0.26%Utility shaft. 113 0.20%
Light shaft. 24 0.04%
Chute. 37 0.07%
Duct. 536 0.96%
Display window. 47 0.08%
Chimney. 162 0.29%
Conveyor. 126 0.22%
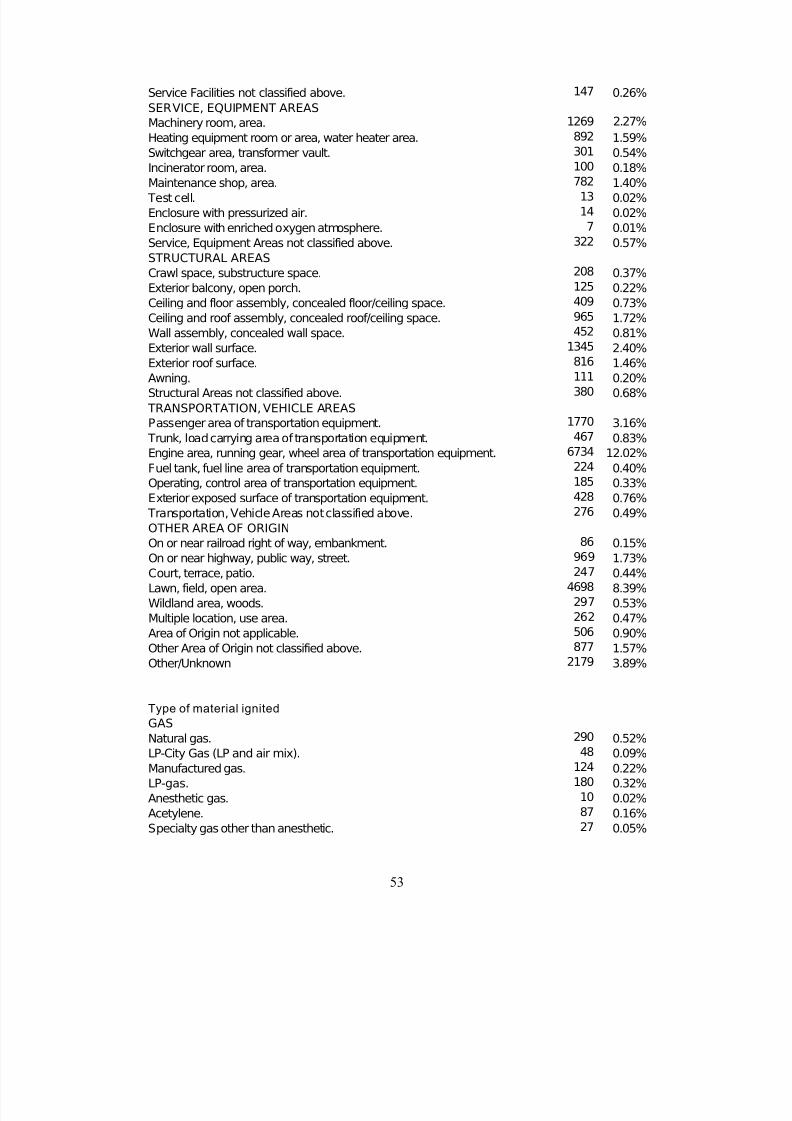
7/28/2019 Vs Iqp Final
http://slidepdf.com/reader/full/vs-iqp-final 64/122
53
Service Facilities not classified above. 147 0.26%
SERVICE, EQUIPMENT AREAS
Machinery room, area. 1269 2.27%
Heating equipment room or area, water heater area. 892 1.59%
Switchgear area, transformer vault. 301 0.54%
Incinerator room, area. 100 0.18%
Maintenance shop, area. 782 1.40% Test cell. 13 0.02%
Enclosure with pressurized air. 14 0.02%
Enclosure with enriched oxygen atmosphere. 7 0.01%
Service, Equipment Areas not classified above. 322 0.57%
STRUCTURAL AREAS
Crawl space, substructure space. 208 0.37%
Exterior balcony, open porch. 125 0.22%
Ceiling and floor assembly, concealed floor/ceiling space. 409 0.73%
Ceiling and roof assembly, concealed roof/ceiling space. 965 1.72%
Wall assembly, concealed wall space. 452 0.81%
Exterior wall surface. 1345 2.40%
Exterior roof surface. 816 1.46%Awning. 111 0.20%
Structural Areas not classified above. 380 0.68%
TRANSPORTATION, VEHICLE AREAS
Passenger area of transportation equipment. 1770 3.16%
Trunk, load carrying area of transportation equipment. 467 0.83%
Engine area, running gear, wheel area of transportation equipment. 6734 12.02%
Fuel tank, fuel line area of transportation equipment. 224 0.40%
Operating, control area of transportation equipment. 185 0.33%
Exterior exposed surface of transportation equipment. 428 0.76%
Transportation, Vehicle Areas not classified above. 276 0.49%
OTHER AREA OF ORIGIN
On or near railroad right of way, embankment. 86 0.15%On or near highway, public way, street. 969 1.73%
Court, terrace, patio. 247 0.44%
Lawn, field, open area. 4698 8.39%
Wildland area, woods. 297 0.53%
Multiple location, use area. 262 0.47%
Area of Origin not applicable. 506 0.90%
Other Area of Origin not classified above. 877 1.57%
Other/Unknown 2179 3.89%
Type of material ignited
GASNatural gas. 290 0.52%
LP-City Gas (LP and air mix). 48 0.09%
Manufactured gas. 124 0.22%
LP-gas. 180 0.32%
Anesthetic gas. 10 0.02%
Acetylene. 87 0.16%
Specialty gas other than anesthetic. 27 0.05%
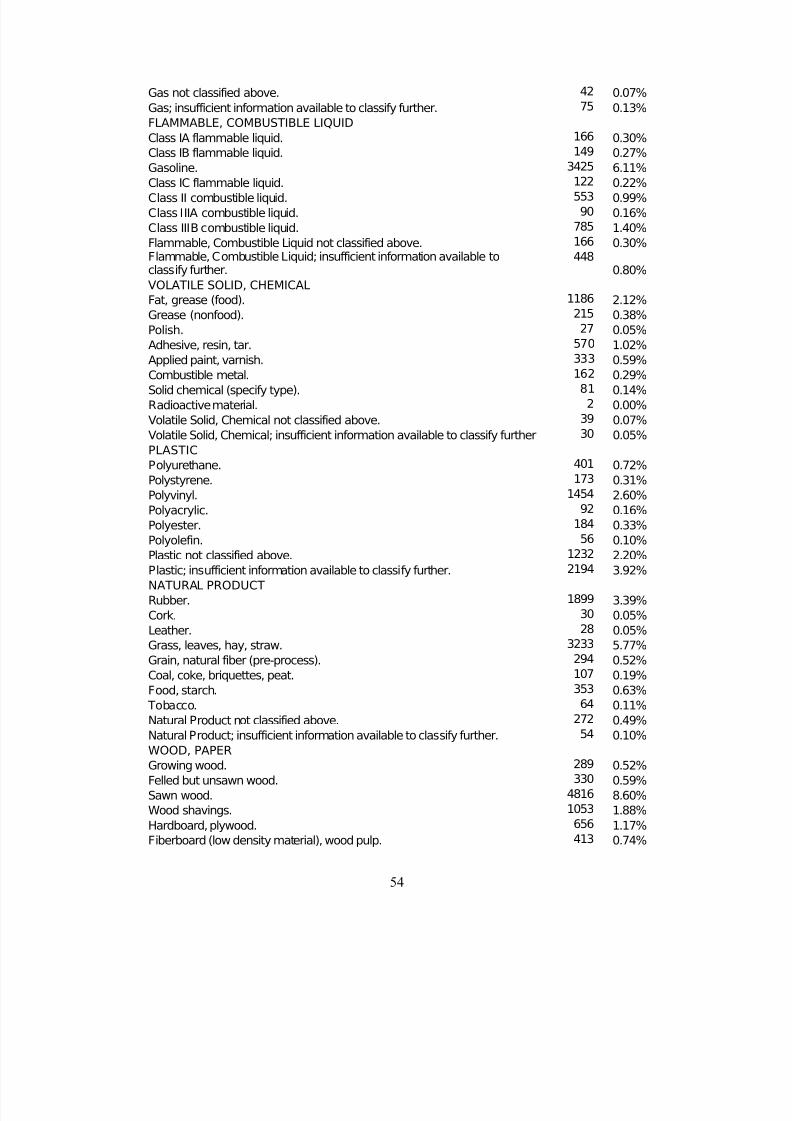
7/28/2019 Vs Iqp Final
http://slidepdf.com/reader/full/vs-iqp-final 65/122
54
Gas not classified above. 42 0.07%
Gas; insufficient information available to classify further. 75 0.13%
FLAMMABLE, COMBUSTIBLE LIQUID
Class IA flammable liquid. 166 0.30%
Class IB flammable liquid. 149 0.27%
Gasoline. 3425 6.11%
Class IC flammable liquid. 122 0.22%Class II combustible liquid. 553 0.99%
Class IIIA combustible liquid. 90 0.16%
Class IIIB combustible liquid. 785 1.40%
Flammable, Combustible Liquid not classified above. 166 0.30%Flammable, Combustible Liquid; insufficient information available toclassify further.
4480.80%
VOLATILE SOLID, CHEMICAL
Fat, grease (food). 1186 2.12%
Grease (nonfood). 215 0.38%
Polish. 27 0.05%
Adhesive, resin, tar. 570 1.02%
Applied paint, varnish. 333 0.59%Combustible metal. 162 0.29%
Solid chemical (specify type). 81 0.14%
Radioactive material. 2 0.00%
Volatile Solid, Chemical not classified above. 39 0.07%
Volatile Solid, Chemical; insufficient information available to classify further 30 0.05%
PLASTIC
Polyurethane. 401 0.72%
Polystyrene. 173 0.31%
Polyvinyl. 1454 2.60%
Polyacrylic. 92 0.16%
Polyester. 184 0.33%
Polyolefin. 56 0.10%Plastic not classified above. 1232 2.20%
Plastic; insufficient information available to classify further. 2194 3.92%
NATURAL PRODUCT
Rubber. 1899 3.39%
Cork. 30 0.05%
Leather. 28 0.05%
Grass, leaves, hay, straw. 3233 5.77%
Grain, natural fiber (pre-process). 294 0.52%
Coal, coke, briquettes, peat. 107 0.19%
Food, starch. 353 0.63%
Tobacco. 64 0.11%
Natural Product not classified above. 272 0.49%Natural Product; insufficient information available to classify further. 54 0.10%
WOOD, PAPER
Growing wood. 289 0.52%
Felled but unsawn wood. 330 0.59%
Sawn wood. 4816 8.60%
Wood shavings. 1053 1.88%
Hardboard, plywood. 656 1.17%
Fiberboard (low density material), wood pulp. 413 0.74%

7/28/2019 Vs Iqp Final
http://slidepdf.com/reader/full/vs-iqp-final 66/122
55
Paper, untreated, uncoated. 5965 10.65%
Cardboard. 1497 2.67%
Wood, Paper not classified above. 1014 1.81%
Wood, Paper; insufficient information available to classify further. 795 1.42%
FABRIC, TEXTILE, FUR
Man-made fabric, fiber, finished goods. 1582 2.82%
Cotton, rayon, cotton fabric, finished goods. 2244 4.01%Wool, wool mixture fabric, finished goods. 71 0.13%
Fur, silk, other fabric, finished goods. 22 0.04%
Wig. 33 0.06%
Human hair. 9 0.02%
Fabric, Textile, Fur not classified above. 196 0.35%
Fabric, Textile, Fur; insufficient information available to classify further. 319 0.57%
MATERIAL COMPOUNDED WITH OIL
Linoleum. 18 0.03%
Oil cloth. 17 0.03%
Treated and/or coated paper. 81 0.14%
Waterproof canvas. 31 0.06%
Oily rags. 192 0.34%Asphalt treated material. 241 0.43%
Material Compounded with Oil not classified above. 149 0.27%Material Compounded with Oil; insufficient information available to classifyfurther.
810.14%
OTHER TYPE OF MATERIAL
Multiple types of material first ignited. 1941 3.47%
Type of Material not classified above. 2442 4.36%
Type of Material undetermined or not reported 7362 13.14%
Construction Type
Fire resistive. 3900 6.96%
Heavy timber. 670 1.20%Protected noncombustible or limited combustible. 2296 4.10%
Unprotected noncombustible or limited combustible not qualifying for 3. 3072 5.48%
Protected ordinary. 3416 6.10%
Unprotected ordinary, not qualifying 5. 4059 7.25%
Protected Wood Frame 2084 3.72%
Unprotected wood frame not qualifying for 7. 3924 7.01%
Not classified above 452 0.81%
Undetermined or not reported 3531 6.30%
Structural Damage with Sprinklers Only total 28328
None/not reported 301 0.54%
Minimal 13999 24.99%Heavy 3388 6.05%
Extreme 6567 11.72%
Structural Damage with Sprinklers and Smoke Detection total 27289
None/not reported 301 0.54%
Minimal 13701 24.46%
Heavy 3279 5.85%
Extreme 6036 10.78%

7/28/2019 Vs Iqp Final
http://slidepdf.com/reader/full/vs-iqp-final 67/122
56
NFIRs Data 1991
Fires in Commercial build ings
Had detectors 27951 48.10%
Did not have any type of detector present 30165 36.56%
Structural Damage (as described in the FEMA NFIR's Manual)
None/not reported 3089 5.32%
Minimal 27187 46.78%
Heavy 4527 7.79%
Extreme 16142 27.78%
Area of originMEANS OF EGRESS
Hallway, corridor, mall. 609 1.05%
Exterior stairway. 97 0.17%
Interior stairway. 99 0.17%Escalator. 6 0.01%
Lobby, entrance way. 356 0.61%
Means of Egress not classified above. 93 0.16%
ASSEMBLY, SALES AREAS (groups of people)
Large assembly area with fixed seats (100 or more persons). 48 0.08%
Large open room without fixed seats (100 or more persons). 126 0.22%
Small assembly area with or without fixed seats (less than 100 persons). 191 0.33%
Lounge area. 462 0.79%
Sales, showroom area. 680 1.17%
Library. 11 0.02%
Swimming pool. 14 0.02%
Assembly, Sales Areas not classified above. 41 0.07%FUNCTION AREAS
Sleeping room for under 5 persons. 1248 2.15%
Sleeping area for 5 or more persons. 59 0.10%
Dining area, lunchroom, cafeteria. 255 0.44%
Kitchen, cooking area. 2340 4.03%
Lavatory, locker room, cloakroom. 1113 1.92%
Laundry room, area. 1146 1.97%
Office. 968 1.67%
Personal service area. 51 0.09%
FUNCTION AREAS
Laboratory. 165 0.28%
Printing or photographic room, area. 95 0.16%First aid, treatment room. 50 0.09%
Operating room. 19 0.03%
Electronic equipment room, area. 237 0.41%
Performance, stage area. 22 0.04%
Projection room, area. 12 0.02%
Process, manufacturing area. 1798 3.09%
Function Areas not classified above. 194 0.33%
STORAGE AREAS

7/28/2019 Vs Iqp Final
http://slidepdf.com/reader/full/vs-iqp-final 68/122
57
Product storage room or area, storage tank, storage bin. 1826 3.14%
Closet. 183 0.31%
Supply storage room or area. 1531 2.63%
Records storage room, vault. 81 0.14%
Shipping, receiving, loading area. 495 0.85%
Trash or rubbish area, container. 6316 10.87%
Garage, carport, vehicle storage area. 1657 2.85%Storage Areas not classified above. 835 1.44%
SERVICE FACILITIES
Elevator, dumb-waiter. 139 0.24%
Utility shaft. 119 0.20%
Light shaft. 25 0.04%
Chute. 44 0.08%
Duct. 484 0.83%
Display window. 42 0.07%
Chimney. 174 0.30%
Conveyor. 120 0.21%
Service Facilities not classified above. 159 0.27%
SERVICE, EQUIPMENT AREASMachinery room, area. 1222 2.10%
Heating equipment room or area, water heater area. 866 1.49%
Switchgear area, transformer vault. 261 0.45%
Incinerator room, area. 116 0.20%
Maintenance shop, area. 748 1.29%
Test cell. 17 0.03%
Enclosure with pressurized air. 19 0.03%
Enclosure with enriched oxygen atmosphere. 1 0.00%
Service, Equipment Areas not classified above. 352 0.61%
STRUCTURAL AREAS
Crawl space, substructure space. 247 0.43%
Exterior balcony, open porch. 133 0.23%Ceiling and floor assembly, concealed floor/ceiling space. 344 0.59%
Ceiling and roof assembly, concealed roof/ceiling space. 947 1.63%
Wall assembly, concealed wall space. 415 0.71%
Exterior wall surface. 1510 2.60%
Exterior roof surface. 828 1.42%
Awning. 104 0.18%
Structural Areas not classified above. 363 0.62%
TRANSPORTATION, VEHICLE AREAS
Passenger area of transportation equipment. 1741 3.00%
Trunk, load carrying area of transportation equipment. 447 0.77%
Engine area, running gear, wheel area of transportation equipment. 7177 12.35%
Fuel tank, fuel line area of transportation equipment. 225 0.39%Operating, control area of transportation equipment. 223 0.38%
Exterior exposed surface of transportation equipment. 392 0.67%
Transportation, Vehicle Areas not classified above. 279 0.48%
Man-made fabric, fiber, finished goods. 1586 2.73%
Cotton, rayon, cotton fabric, finished goods. 2188 3.76%
Wool, wool mixture fabric, finished goods. 69 0.12%
Fur, silk, other fabric, finished goods. 29 0.05%

7/28/2019 Vs Iqp Final
http://slidepdf.com/reader/full/vs-iqp-final 69/122
58
Wig. 25 0.04%
Human hair. 7 0.01%
Fabric, Textile, Fur not classified above. 206 0.35%
Fabric, Textile, Fur; insufficient information available to classify further. 323 0.56%
MATERIAL COMPOUNDED WITH OIL
Linoleum. 19 0.03%
Oil cloth. 16 0.03% Treated and/or coated paper. 220 0.38%
Waterproof canvas. 33 0.06%
Oily rags. 217 0.37%
Asphalt treated material. 215 0.37%
Material Compounded with Oil not classified above. 160 0.28%Material Compounded with Oil; insufficient information available to classifyfurther.
850.15%
OTHER TYPE OF MATERIAL
Multiple types of material first ignited. 2127 3.66%
Type of Material not classified above. 2556 4.40%
Type of Material undetermined or not reported 8060 13.87%
Construction Type
Fire resistive. 3841 6.61%
Heavy timber. 687 1.18%
Protected noncombustible or limited combustible. 2402 4.13%
Unprotected noncombustible or limited combustible not qualifying for 3. 3115 5.36%
Protected ordinary. 3481 5.99%
Unprotected ordinary, not qualifying 5. 3906 6.72%
Protected Wood Frame 2205 3.79%
Unprotected wood frame not qualifying for 7. 4086 7.03%
Not classified above 509 0.88%
Undetermined or not reported 3775 6.50%
Structural Damage with Sprinklers Only total 28815
None/not reported 274 0.47%
Minimal 14522 24.99%
Heavy 3456 5.95%
Extreme 6878 11.83%
Structural Damage with Sprinklers and Smoke Detection total 27743
None/not reported 274 0.47%
Minimal 14222 24.47%
Heavy 3378 5.81%
Extreme 6299 10.84%
NFIRs Data 1992
Fires in Commercial build ings
Had detectors 27493 48.94%
Did not have any type of detector present 28680 37.83%
Structural Damage (as described in the FEMA NFIR's Manual)

7/28/2019 Vs Iqp Final
http://slidepdf.com/reader/full/vs-iqp-final 70/122
59
None/not reported 2506 4.46%
Minimal 27374 48.73%
Heavy 4440 7.90%
Extreme 14520 25.85%
Area of originMEANS OF EGRESS
Hallway, corridor, mall. 529 0.94%
Exterior stairway. 96 0.17%
Interior stairway. 76 0.14%
Escalator. 8 0.01%
Lobby, entrance way. 349 0.62%
Means of Egress not classified above. 97 0.17%
ASSEMBLY, SALES AREAS (groups of people)
Large assembly area with fixed seats (100 or more persons). 56 0.10%
Large open room without fixed seats (100 or more persons). 128 0.23%
Small assembly area with or without fixed seats (less than 100 persons). 157 0.28%
Lounge area. 428 0.76%
Sales, showroom area. 662 1.18%
Library. 6 0.01%
Swimming pool. 28 0.05%
Assembly, Sales Areas not classified above. 48 0.09%
FUNCTION AREAS
Sleeping room for under 5 persons. 1186 2.11%
Sleeping area for 5 or more persons. 56 0.10%
Dining area, lunchroom, cafeteria. 265 0.47%
Kitchen, cooking area. 2424 4.32%
Lavatory, locker room, cloakroom. 1081 1.92%
Laundry room, area. 1120 1.99%
Office. 982 1.75%
Personal service area. 64 0.11%
FUNCTION AREAS
Laboratory. 150 0.27%
Printing or photographic room, area. 68 0.12%
First aid, treatment room. 52 0.09%
Operating room. 22 0.04%
Electronic equipment room, area. 263 0.47%
Performance, stage area. 18 0.03%
Projection room, area. 9 0.02%
Process, manufacturing area. 1681 2.99%
Function Areas not classified above. 176 0.31%
STORAGE AREAS
Product storage room or area, storage tank, storage bin. 1735 3.09%
Closet. 165 0.29%
Supply storage room or area. 1372 2.44%
Records storage room, vault. 83 0.15%
Shipping, receiving, loading area. 472 0.84%
Trash or rubbish area, container. 5501 9.79%
Garage, carport, vehicle storage area. 1449 2.58%
Storage Areas not classified above. 822 1.46%

7/28/2019 Vs Iqp Final
http://slidepdf.com/reader/full/vs-iqp-final 71/122
60
SERVICE FACILITIES
Elevator, dumb-waiter. 133 0.24%
Utility shaft. 112 0.20%
Light shaft. 19 0.03%
Chute. 48 0.09%
Duct. 516 0.92%
Display window. 46 0.08%Chimney. 155 0.28%
Conveyor. 119 0.21%
Service Facilities not classified above. 162 0.29%
SERVICE, EQUIPMENT AREAS
Machinery room, area. 1209 2.15%
Heating equipment room or area, water heater area. 882 1.57%
Switchgear area, transformer vault. 267 0.48%
Incinerator room, area. 100 0.18%
Maintenance shop, area. 715 1.27%
Test cell. 7 0.01%
Enclosure with pressurized air. 17 0.03%
Enclosure with enriched oxygen atmosphere. 3 0.01%Service, Equipment Areas not classified above. 297 0.53%
STRUCTURAL AREAS
Crawl space, substructure space. 264 0.47%
Exterior balcony, open porch. 123 0.22%
Ceiling and floor assembly, concealed floor/ceiling space. 369 0.66%
Ceiling and roof assembly, concealed roof/ceiling space. 941 1.68%
Wall assembly, concealed wall space. 462 0.82%
Exterior wall surface. 1412 2.51%
Exterior roof surface. 810 1.44%
Awning. 86 0.15%
Structural Areas not classified above. 353 0.63%
TRANSPORTATION, VEHICLE AREASPassenger area of transportation equipment. 1522 2.71%
Trunk, load carrying area of transportation equipment. 421 0.75%
Engine area, running gear, wheel area of transportation equipment. 7171 12.77%
Fuel tank, fuel line area of transportation equipment. 175 0.31%
Operating, control area of transportation equipment. 176 0.31%
Exterior exposed surface of transportation equipment. 409 0.73%
Transportation, Vehicle Areas not classified above. 295 0.53%
OTHER AREA OF ORIGIN
On or near railroad right of way, embankment. 79 0.14%
On or near highway, public way, street. 1083 1.93%
Court, terrace, patio. 310 0.55%
Lawn, field, open area. 4664 8.30%Wildland area, woods. 517 0.92%
Multiple location, use area. 268 0.48%
Area of Origin not applicable. 914 1.63%
Other Area of Origin not classified above. 1038 1.85%
Other/Unknown 2893 5.15%

7/28/2019 Vs Iqp Final
http://slidepdf.com/reader/full/vs-iqp-final 72/122
61
Type of material ignited
GAS
Natural gas. 312 0.56%
LP-City Gas (LP and air mix). 47 0.08%
Manufactured gas. 114 0.20%
LP-gas. 178 0.32%
Anesthetic gas. 13 0.02%Acetylene. 78 0.14%
Specialty gas other than anesthetic. 30 0.05%
Gas not classified above. 68 0.12%
Gas; insufficient information available to classify further. 118 0.21%
FLAMMABLE, COMBUSTIBLE LIQUID
Class IA flammable liquid. 225 0.40%
Class IB flammable liquid. 133 0.24%
Gasoline. 3063 5.45%
Class IC flammable liquid. 104 0.19%
Class II combustible liquid. 345 0.61%
Class IIIA combustible liquid. 66 0.12%
Class IIIB combustible liquid. 742 1.32%Flammable, Combustible Liquid not classified above. 203 0.36%Flammable, Combustible Liquid; insufficient information available toclassify further.
4690.83%
VOLATILE SOLID, CHEMICAL
Fat, grease (food). 1192 2.12%
Grease (nonfood). 266 0.47%
Polish. 21 0.04%
Adhesive, resin, tar. 531 0.95%
Applied paint, varnish. 283 0.50%
Combustible metal. 153 0.27%
Solid chemical (specify type). 76 0.14%
Radioactive material. 1 0.00%Volatile Solid, Chemical not classified above. 46 0.08%Volatile Solid, Chemical; insufficient information available to classifyfurther
360.06%
PLASTIC
Polyurethane. 400 0.71%
Polystyrene. 186 0.33%
Polyvinyl. 1686 3.00%
Polyacrylic. 78 0.14%
Polyester. 156 0.28%
Polyolefin. 74 0.13%
Plastic not classified above. 1293 2.30%
Plastic; insufficient information available to classify further. 2504 4.46%NATURAL PRODUCT
Rubber. 1884 3.35%
Cork. 21 0.04%
Leather. 34 0.06%
Grass, leaves, hay, straw. 3515 6.26%
Grain, natural fiber (pre-process). 377 0.67%
Coal, coke, briquettes, peat. 109 0.19%
Food, starch. 474 0.84%

7/28/2019 Vs Iqp Final
http://slidepdf.com/reader/full/vs-iqp-final 73/122
62
Tobacco. 56 0.10%
Natural Product not classified above. 351 0.62%
Natural Product; insufficient information available to classify further. 97 0.17%
WOOD, PAPER
Growing wood. 275 0.49%
Felled but unsawn wood. 301 0.54%
Sawn wood. 4316 7.68%Wood shavings. 1063 1.89%
Hardboard, plywood. 672 1.20%
Fiberboard (low density material), wood pulp. 307 0.55%
Paper, untreated, uncoated. 4961 8.83%
Cardboard. 1497 2.66%
Wood, Paper not classified above. 932 1.66%
Wood, Paper; insufficient information available to classify further. 1167 2.08%
FABRIC, TEXTILE, FUR
Man-made fabric, fiber, finished goods. 1434 2.55%
Cotton, rayon, cotton fabric, finished goods. 2051 3.65%
Wool, wool mixture fabric, finished goods. 58 0.10%
Fur, silk, other fabric, finished goods. 25 0.04%Wig. 41 0.07%
Human hair. 11 0.02%
Fabric, Textile, Fur not classified above. 201 0.36%
Fabric, Textile, Fur; insufficient information available to classify further. 325 0.58%
MATERIAL COMPOUNDED WITH OIL
Linoleum. 11 0.02%
Oil cloth. 16 0.03%
Treated and/or coated paper. 411 0.73%
Waterproof canvas. 32 0.06%
Oily rags. 170 0.30%
Asphalt treated material. 214 0.38%
Material Compounded with Oil not classified above. 146 0.26%Material Compounded with Oil; insufficient information available toclassify further.
720.13%
OTHER TYPE OF MATERIAL
Multiple types of material first ignited. 1945 3.46%
Type of Material not classified above. 2713 4.83%
Type of Material undetermined or not reported 7887 14.04%
Construction Type
Fire resistive. 3528 6.28%
Heavy timber. 694 1.24%
Protected noncombustible or limited combustible. 2568 4.57%
Unprotected noncombustible or limited combustible not qualifying for 3. 3244 5.78%Protected ordinary. 3446 6.13%
Unprotected ordinary, not qualifying 5. 3881 6.91%
Protected Wood Frame 1876 3.34%
Unprotected wood frame not qualifying for 7. 3912 6.96%
Not classified above 531 0.95%
Undetermined or not reported 3393 6.04%
Structural Damage with Sprinklers Only total 27748

7/28/2019 Vs Iqp Final
http://slidepdf.com/reader/full/vs-iqp-final 74/122
63
None/not reported 3 0.01%
Minimal 15336 27.30%
Heavy 3381 6.02%
Extreme 5630 10.02%
Structural Damage with Sprinklers and Smoke Detection total 27336
None/not reported 3 0.01%Minimal 15101 26.88%
Heavy 3313 5.90%
Extreme 5584 9.94%
NFIRs Data 1993
Fires in Commercial build ings
Had detectors 27493 48.94%
Did not have any type of detector present 28680 37.83%
Structural Damage (as described in the FEMA NFIR's Manual)
None/not reported 2506 4.46%
Minimal 27374 48.73%
Heavy 4440 7.90%
Extreme 14520 25.85%
Area of originMEANS OF EGRESS
Hallway, corridor, mall. 529 0.94%
Exterior stairway. 96 0.17%
Interior stairway. 76 0.14%
Escalator. 8 0.01%
Lobby, entrance way. 349 0.62%Means of Egress not classified above. 97 0.17%
ASSEMBLY, SALES AREAS (groups of people)
Large assembly area with fixed seats (100 or more persons). 56 0.10%
Large open room without fixed seats (100 or more persons). 128 0.23%
Small assembly area with or without fixed seats (less than 100 persons). 157 0.28%
Lounge area. 428 0.76%
Sales, showroom area. 662 1.18%
Library. 6 0.01%
Swimming pool. 28 0.05%
Assembly, Sales Areas not classified above. 48 0.09%
FUNCTION AREAS
Sleeping room for under 5 persons. 1186 2.11%Sleeping area for 5 or more persons. 56 0.10%
Dining area, lunchroom, cafeteria. 265 0.47%
Kitchen, cooking area. 2424 4.32%
Lavatory, locker room, cloakroom. 1081 1.92%
Laundry room, area. 1120 1.99%
Office. 982 1.75%
Personal service area. 64 0.11%
FUNCTION AREAS
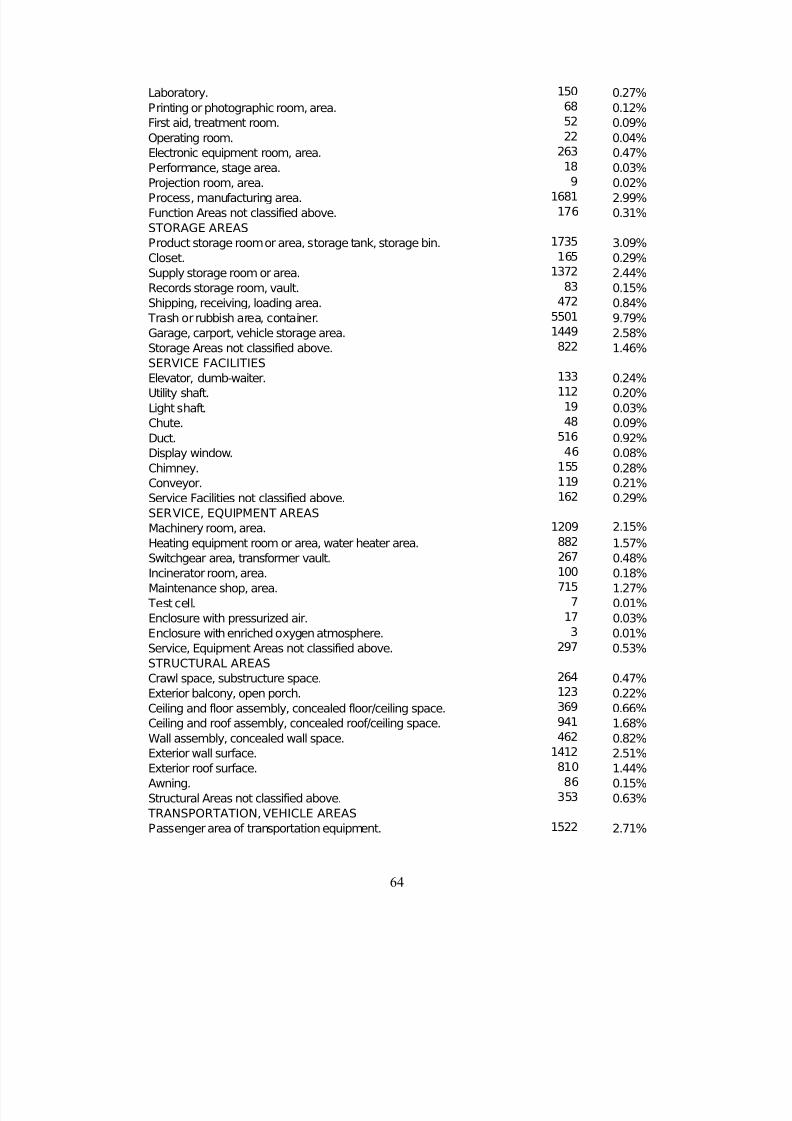
7/28/2019 Vs Iqp Final
http://slidepdf.com/reader/full/vs-iqp-final 75/122
64
Laboratory. 150 0.27%
Printing or photographic room, area. 68 0.12%
First aid, treatment room. 52 0.09%
Operating room. 22 0.04%
Electronic equipment room, area. 263 0.47%
Performance, stage area. 18 0.03%
Projection room, area. 9 0.02%Process, manufacturing area. 1681 2.99%
Function Areas not classified above. 176 0.31%
STORAGE AREAS
Product storage room or area, storage tank, storage bin. 1735 3.09%
Closet. 165 0.29%
Supply storage room or area. 1372 2.44%
Records storage room, vault. 83 0.15%
Shipping, receiving, loading area. 472 0.84%
Trash or rubbish area, container. 5501 9.79%
Garage, carport, vehicle storage area. 1449 2.58%
Storage Areas not classified above. 822 1.46%
SERVICE FACILITIESElevator, dumb-waiter. 133 0.24%
Utility shaft. 112 0.20%
Light shaft. 19 0.03%
Chute. 48 0.09%
Duct. 516 0.92%
Display window. 46 0.08%
Chimney. 155 0.28%
Conveyor. 119 0.21%
Service Facilities not classified above. 162 0.29%
SERVICE, EQUIPMENT AREAS
Machinery room, area. 1209 2.15%
Heating equipment room or area, water heater area. 882 1.57%Switchgear area, transformer vault. 267 0.48%
Incinerator room, area. 100 0.18%
Maintenance shop, area. 715 1.27%
Test cell. 7 0.01%
Enclosure with pressurized air. 17 0.03%
Enclosure with enriched oxygen atmosphere. 3 0.01%
Service, Equipment Areas not classified above. 297 0.53%
STRUCTURAL AREAS
Crawl space, substructure space. 264 0.47%
Exterior balcony, open porch. 123 0.22%
Ceiling and floor assembly, concealed floor/ceiling space. 369 0.66%
Ceiling and roof assembly, concealed roof/ceiling space. 941 1.68%Wall assembly, concealed wall space. 462 0.82%
Exterior wall surface. 1412 2.51%
Exterior roof surface. 810 1.44%
Awning. 86 0.15%
Structural Areas not classified above. 353 0.63%
TRANSPORTATION, VEHICLE AREAS
Passenger area of transportation equipment. 1522 2.71%

7/28/2019 Vs Iqp Final
http://slidepdf.com/reader/full/vs-iqp-final 76/122
65
Trunk, load carrying area of transportation equipment. 421 0.75%
Engine area, running gear, wheel area of transportation equipment. 7171 12.77%
Fuel tank, fuel line area of transportation equipment. 175 0.31%
Operating, control area of transportation equipment. 176 0.31%
Exterior exposed surface of transportation equipment. 409 0.73%
Transportation, Vehicle Areas not classified above. 295 0.53%
OTHER AREA OF ORIGINOn or near railroad right of way, embankment. 79 0.14%
On or near highway, public way, street. 1083 1.93%
Court, terrace, patio. 310 0.55%
Lawn, field, open area. 4664 8.30%
Wildland area, woods. 517 0.92%
Multiple location, use area. 268 0.48%
Area of Origin not applicable. 914 1.63%
Other Area of Origin not classified above. 1038 1.85%
Other/Unknown 2893 5.15%
Type of material ignitedGAS
Natural gas. 312 0.56%
LP-City Gas (LP and air mix). 47 0.08%
Manufactured gas. 114 0.20%
LP-gas. 178 0.32%
Anesthetic gas. 13 0.02%
Acetylene. 78 0.14%
Specialty gas other than anesthetic. 30 0.05%
Gas not classified above. 68 0.12%
Gas; insufficient information available to classify further. 118 0.21%
FLAMMABLE, COMBUSTIBLE LIQUID
Class IA flammable liquid. 225 0.40%Class IB flammable liquid. 133 0.24%
Gasoline. 3063 5.45%
Class IC flammable liquid. 104 0.19%
Class II combustible liquid. 345 0.61%
Class IIIA combustible liquid. 66 0.12%
Class IIIB combustible liquid. 742 1.32%
Flammable, Combustible Liquid not classified above. 203 0.36%Flammable, Combustible Liquid; insufficient information available toclassify further.
4690.83%
VOLATILE SOLID, CHEMICAL
Fat, grease (food). 1192 2.12%
Grease (nonfood). 266 0.47%Polish. 21 0.04%
Adhesive, resin, tar. 531 0.95%
Applied paint, varnish. 283 0.50%
Combustible metal. 153 0.27%
Solid chemical (specify type). 76 0.14%
Radioactive material. 1 0.00%
Volatile Solid, Chemical not classified above. 46 0.08%
Volatile Solid, Chemical; insufficient information available to classify 36 0.06%

7/28/2019 Vs Iqp Final
http://slidepdf.com/reader/full/vs-iqp-final 77/122
66
further
PLASTIC
Polyurethane. 400 0.71%
Polystyrene. 186 0.33%
Polyvinyl. 1686 3.00%
Polyacrylic. 78 0.14%
Polyester. 156 0.28%Polyolefin. 74 0.13%
Plastic not classified above. 1293 2.30%
Plastic; insufficient information available to classify further. 2504 4.46%
NATURAL PRODUCT
Rubber. 1884 3.35%
Cork. 21 0.04%
Leather. 34 0.06%
Grass, leaves, hay, straw. 3515 6.26%
Grain, natural fiber (pre-process). 377 0.67%
Coal, coke, briquettes, peat. 109 0.19%
Food, starch. 474 0.84%
Tobacco. 56 0.10%Natural Product not classified above. 351 0.62%
Natural Product; insufficient information available to classify further. 97 0.17%
WOOD, PAPER
Growing wood. 275 0.49%
Felled but unsawn wood. 301 0.54%
Sawn wood. 4316 7.68%
Wood shavings. 1063 1.89%
Hardboard, plywood. 672 1.20%
Fiberboard (low density material), wood pulp. 307 0.55%
Paper, untreated, uncoated. 4961 8.83%
Cardboard. 1497 2.66%
Wood, Paper not classified above. 932 1.66%Wood, Paper; insufficient information available to classify further. 1167 2.08%
FABRIC, TEXTILE, FUR
Man-made fabric, fiber, finished goods. 1434 2.55%
Cotton, rayon, cotton fabric, finished goods. 2051 3.65%
Wool, wool mixture fabric, finished goods. 58 0.10%
Fur, silk, other fabric, finished goods. 25 0.04%
Wig. 41 0.07%
Human hair. 11 0.02%
Fabric, Textile, Fur not classified above. 201 0.36%
Fabric, Textile, Fur; insufficient information available to classify further. 325 0.58%
MATERIAL COMPOUNDED WITH OIL
Linoleum. 11 0.02%Oil cloth. 16 0.03%
Treated and/or coated paper. 411 0.73%
Waterproof canvas. 32 0.06%
Oily rags. 170 0.30%
Asphalt treated material. 214 0.38%
Material Compounded with Oil not classified above. 146 0.26%Material Compounded with Oil; insufficient information available toclassify further.
720.13%
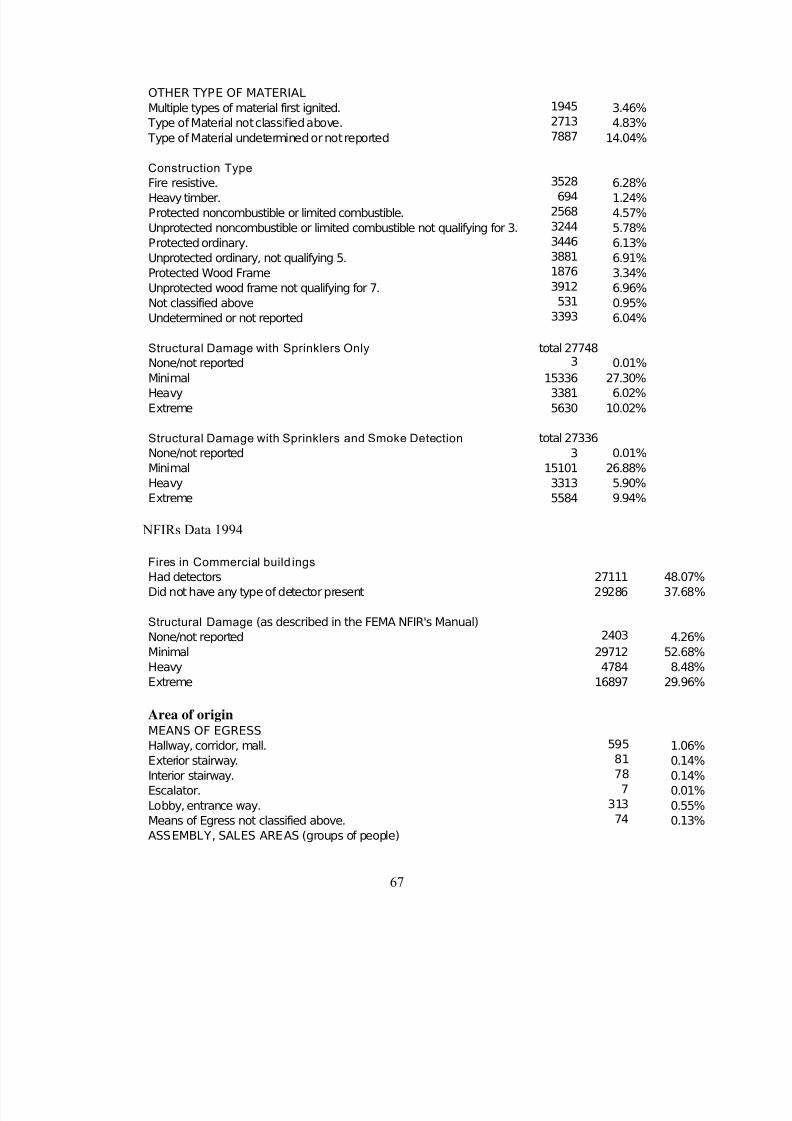
7/28/2019 Vs Iqp Final
http://slidepdf.com/reader/full/vs-iqp-final 78/122
67
OTHER TYPE OF MATERIAL
Multiple types of material first ignited. 1945 3.46%
Type of Material not classified above. 2713 4.83%
Type of Material undetermined or not reported 7887 14.04%
Construction Type
Fire resistive. 3528 6.28%Heavy timber. 694 1.24%
Protected noncombustible or limited combustible. 2568 4.57%
Unprotected noncombustible or limited combustible not qualifying for 3. 3244 5.78%
Protected ordinary. 3446 6.13%
Unprotected ordinary, not qualifying 5. 3881 6.91%
Protected Wood Frame 1876 3.34%
Unprotected wood frame not qualifying for 7. 3912 6.96%
Not classified above 531 0.95%
Undetermined or not reported 3393 6.04%
Structural Damage with Sprinklers Only total 27748
None/not reported 3 0.01%Minimal 15336 27.30%
Heavy 3381 6.02%
Extreme 5630 10.02%
Structural Damage with Sprinklers and Smoke Detection total 27336
None/not reported 3 0.01%
Minimal 15101 26.88%
Heavy 3313 5.90%
Extreme 5584 9.94%
NFIRs Data 1994
Fires in Commercial build ings
Had detectors 27111 48.07%
Did not have any type of detector present 29286 37.68%
Structural Damage (as described in the FEMA NFIR's Manual)
None/not reported 2403 4.26%
Minimal 29712 52.68%
Heavy 4784 8.48%
Extreme 16897 29.96%
Area of originMEANS OF EGRESS
Hallway, corridor, mall. 595 1.06%
Exterior stairway. 81 0.14%
Interior stairway. 78 0.14%
Escalator. 7 0.01%
Lobby, entrance way. 313 0.55%
Means of Egress not classified above. 74 0.13%
ASSEMBLY, SALES AREAS (groups of people)

7/28/2019 Vs Iqp Final
http://slidepdf.com/reader/full/vs-iqp-final 79/122
68
Large assembly area with fixed seats (100 or more persons). 50 0.09%
Large open room without fixed seats (100 or more persons). 136 0.24%
Small assembly area with or without fixed seats (less than 100 persons). 180 0.32%
Lounge area. 335 0.59%
Sales, showroom area. 628 1.11%
Library. 7 0.01%
Swimming pool. 14 0.02%Assembly, Sales Areas not classified above. 63 0.11%
FUNCTION AREAS
Sleeping room for under 5 persons. 1119 1.98%
Sleeping area for 5 or more persons. 37 0.07%
Dining area, lunchroom, cafeteria. 254 0.45%
Kitchen, cooking area. 2491 4.42%
Lavatory, locker room, cloakroom. 998 1.77%
Laundry room, area. 1170 2.07%
Office. 895 1.59%
Personal service area. 66 0.12%
FUNCTION AREAS
Laboratory. 116 0.21%Printing or photographic room, area. 83 0.15%
First aid, treatment room. 56 0.10%
Operating room. 21 0.04%
Electronic equipment room, area. 266 0.47%
Performance, stage area. 24 0.04%
Projection room, area. 4 0.01%
Process, manufacturing area. 1665 2.95%
Function Areas not classified above. 208 0.37%
STORAGE AREAS
Product storage room or area, storage tank, storage bin. 1553 2.75%
Closet. 138 0.24%
Supply storage room or area. 1320 2.34%Records storage room, vault. 59 0.10%
Shipping, receiving, loading area. 492 0.87%
Trash or rubbish area, container. 5332 9.45%
Garage, carport, vehicle storage area. 1422 2.52%
Storage Areas not classified above. 833 1.48%
SERVICE FACILITIES
Elevator, dumb-waiter. 111 0.20%
Utility shaft. 103 0.18%
Light shaft. 18 0.03%
Chute. 46 0.08%
Duct. 524 0.93%
Display window. 37 0.07%Chimney. 155 0.27%
Conveyor. 131 0.23%
Service Facilities not classified above. 124 0.22%
SERVICE, EQUIPMENT AREAS
Machinery room, area. 1233 2.19%
Heating equipment room or area, water heater area. 857 1.52%
Switchgear area, transformer vault. 314 0.56%

7/28/2019 Vs Iqp Final
http://slidepdf.com/reader/full/vs-iqp-final 80/122
69
Incinerator room, area. 82 0.15%
Maintenance shop, area. 637 1.13%
Test cell. 18 0.03%
Enclosure with pressurized air. 19 0.03%
Enclosure with enriched oxygen atmosphere. 3 0.01%
Service, Equipment Areas not classified above. 305 0.54%
STRUCTURAL AREASCrawl space, substructure space. 248 0.44%
Exterior balcony, open porch. 129 0.23%
Ceiling and floor assembly, concealed floor/ceiling space. 324 0.57%
Ceiling and roof assembly, concealed roof/ceiling space. 896 1.59%
Wall assembly, concealed wall space. 434 0.77%
Exterior wall surface. 1429 2.53%
Exterior roof surface. 793 1.41%
Awning. 99 0.18%
Structural Areas not classified above. 389 0.69%
TRANSPORTATION, VEHICLE AREAS
Passenger area of transportation equipment. 1565 2.77%
Trunk, load carrying area of transportation equipment. 460 0.82%Engine area, running gear, wheel area of transportation equipment. 7523 13.34%
Fuel tank, fuel line area of transportation equipment. 187 0.33%
Operating, control area of transportation equipment. 201 0.36%
Exterior exposed surface of transportation equipment. 498 0.88%
Transportation, Vehicle Areas not classified above. 249 0.44%
OTHER AREA OF ORIGIN
On or near railroad right of way, embankment. 95 0.17%
On or near highway, public way, street. 1120 1.99%
Court, terrace, patio. 351 0.62%
Lawn, field, open area. 5283 9.37%
Wildland area, woods. 510 0.90%
Multiple location, use area. 250 0.44%Area of Origin not applicable. 623 1.10%
Other Area of Origin not classified above. 1127 2.00%
Other/Unknown 3017 5.35%
Type of material ignited
GAS
Natural gas. 310 0.55%
LP-City Gas (LP and air mix). 35 0.06%
Manufactured gas. 84 0.15%
LP-gas. 203 0.36%
Anesthetic gas. 7 0.01%Acetylene. 83 0.15%
Specialty gas other than anesthetic. 40 0.07%
Gas not classified above. 54 0.10%
Gas; insufficient information available to classify further. 119 0.21%
FLAMMABLE, COMBUSTIBLE LIQUID
Class IA flammable liquid. 210 0.37%
Class IB flammable liquid. 122 0.22%

7/28/2019 Vs Iqp Final
http://slidepdf.com/reader/full/vs-iqp-final 81/122
70
Gasoline. 2917 5.17%
Class IC flammable liquid. 75 0.13%
Class II combustible liquid. 345 0.61%
Class IIIA combustible liquid. 82 0.15%
Class IIIB combustible liquid. 770 1.37%
Flammable, Combustible Liquid not classified above. 213 0.38%
Flammable, Combustible Liquid; insufficient information available to classifyfurther.
3730.66%
VOLATILE SOLID, CHEMICAL
Fat, grease (food). 1168 2.07%
Grease (nonfood). 247 0.44%
Polish. 25 0.04%
Adhesive, resin, tar. 419 0.74%
Applied paint, varnish. 278 0.49%
Combustible metal. 145 0.26%
Solid chemical (specify type). 69 0.12%
Radioactive material. 3 0.01%
Volatile Solid, Chemical not classified above. 48 0.09%
Volatile Solid, Chemical; insufficient information available to classify further 28 0.05%PLASTIC
Polyurethane. 394 0.70%
Polystyrene. 170 0.30%
Polyvinyl. 1752 3.11%
Polyacrylic. 71 0.13%
Polyester. 156 0.28%
Polyolefin. 77 0.14%
Plastic not classified above. 1393 2.47%
Plastic; insufficient information available to classify further. 2593 4.60%
NATURAL PRODUCT
Rubber. 1802 3.20%
Cork. 17 0.03%Leather. 28 0.05%
Grass, leaves, hay, straw. 3559 6.31%
Grain, natural fiber (pre-process). 263 0.47%
Coal, coke, briquettes, peat. 124 0.22%
Food, starch. 589 1.04%
Tobacco. 65 0.12%
Natural Product not classified above. 421 0.75%
Natural Product; insufficient information available to classify further. 100 0.18%
WOOD, PAPER
Growing wood. 302 0.54%
Felled but unsawn wood. 314 0.56%
Sawn wood. 4224 7.49%Wood shavings. 1246 2.21%
Hardboard, plywood. 775 1.37%
Fiberboard (low density material), wood pulp. 339 0.60%
Paper, untreated, uncoated. 4155 7.37%
Cardboard. 1381 2.45%
Wood, Paper not classified above. 895 1.59%
Wood, Paper; insufficient information available to classify further. 1161 2.06%
FABRIC, TEXTILE, FUR
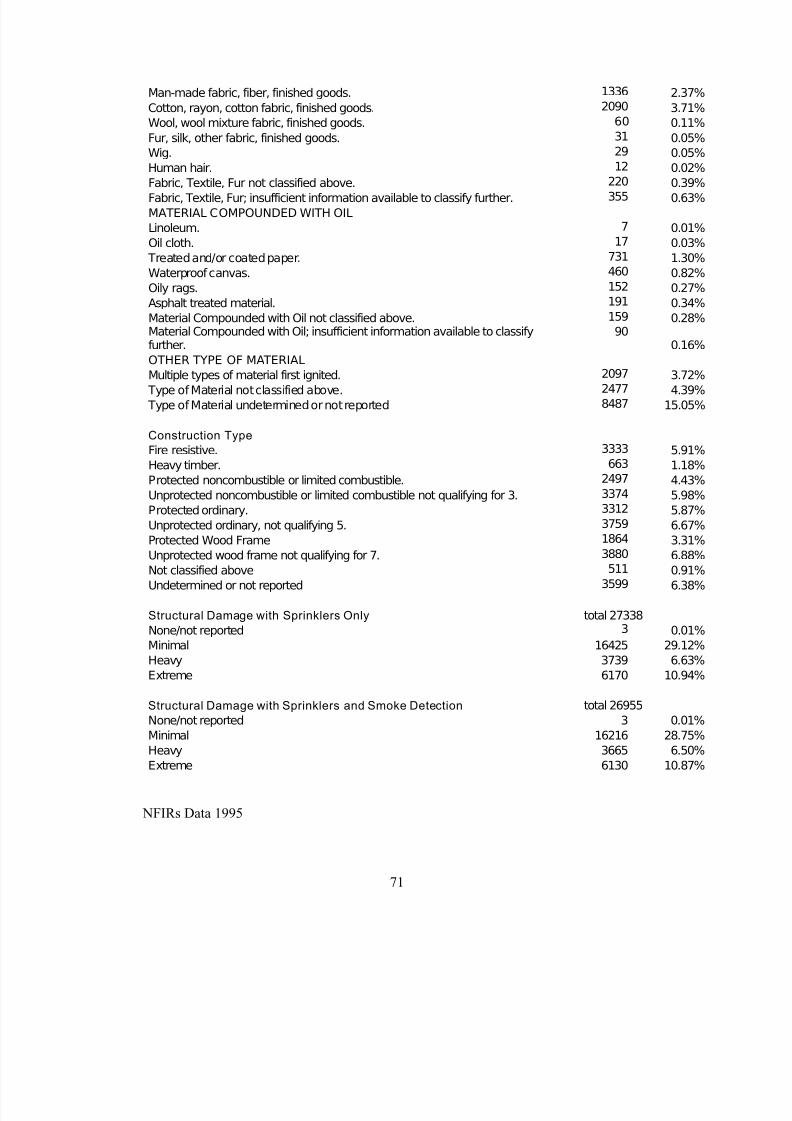
7/28/2019 Vs Iqp Final
http://slidepdf.com/reader/full/vs-iqp-final 82/122
71
Man-made fabric, fiber, finished goods. 1336 2.37%
Cotton, rayon, cotton fabric, finished goods. 2090 3.71%
Wool, wool mixture fabric, finished goods. 60 0.11%
Fur, silk, other fabric, finished goods. 31 0.05%
Wig. 29 0.05%
Human hair. 12 0.02%
Fabric, Textile, Fur not classified above. 220 0.39%Fabric, Textile, Fur; insufficient information available to classify further. 355 0.63%
MATERIAL COMPOUNDED WITH OIL
Linoleum. 7 0.01%
Oil cloth. 17 0.03%
Treated and/or coated paper. 731 1.30%
Waterproof canvas. 460 0.82%
Oily rags. 152 0.27%
Asphalt treated material. 191 0.34%
Material Compounded with Oil not classified above. 159 0.28%Material Compounded with Oil; insufficient information available to classifyfurther.
900.16%
OTHER TYPE OF MATERIALMultiple types of material first ignited. 2097 3.72%
Type of Material not classified above. 2477 4.39%
Type of Material undetermined or not reported 8487 15.05%
Construction Type
Fire resistive. 3333 5.91%
Heavy timber. 663 1.18%
Protected noncombustible or limited combustible. 2497 4.43%
Unprotected noncombustible or limited combustible not qualifying for 3. 3374 5.98%
Protected ordinary. 3312 5.87%
Unprotected ordinary, not qualifying 5. 3759 6.67%
Protected Wood Frame 1864 3.31%Unprotected wood frame not qualifying for 7. 3880 6.88%
Not classified above 511 0.91%
Undetermined or not reported 3599 6.38%
Structural Damage with Sprinklers Only total 27338
None/not reported 3 0.01%
Minimal 16425 29.12%
Heavy 3739 6.63%
Extreme 6170 10.94%
Structural Damage with Sprinklers and Smoke Detection total 26955
None/not reported 3 0.01%Minimal 16216 28.75%
Heavy 3665 6.50%
Extreme 6130 10.87%
NFIRs Data 1995

7/28/2019 Vs Iqp Final
http://slidepdf.com/reader/full/vs-iqp-final 83/122
72
Fires in Commercial build ings
Had detectors 25455 47.98%
Did not have any type of detector present 27598 40.05%
Structural Damage (as described in the FEMA NFIR's Manual)
None/not reported 2075 3.91%
Minimal 26225 49.43%Heavy 4446 8.38%
Extreme 14608 27.53%
Area of originMEANS OF EGRESS
Hallway, corridor, mall. 526 0.99%
Exterior stairway. 89 0.17%
Interior stairway. 56 0.11%
Escalator. 15 0.03%
Lobby, entrance way. 312 0.59%
Means of Egress not classified above. 75 0.14%
ASSEMBLY, SALES AREAS (groups of people)
Large assembly area with fixed seats (100 or more persons). 46 0.09%
Large open room without fixed seats (100 or more persons). 131 0.25%
Small assembly area with or without fixed seats (less than 100 persons). 131 0.25%
Lounge area. 330 0.62%
Sales, showroom area. 557 1.05%
Library. 10 0.02%
Swimming pool. 13 0.02%
Assembly, Sales Areas not classified above. 70 0.13%
FUNCTION AREAS
Sleeping room for under 5 persons. 969 1.83%
Sleeping area for 5 or more persons. 54 0.10%
Dining area, lunchroom, cafeteria. 221 0.42%
Kitchen, cooking area. 2299 4.33%
Lavatory, locker room, cloakroom. 916 1.73%
Laundry room, area. 1114 2.10%
Office. 800 1.51%
Personal service area. 68 0.13%
FUNCTION AREAS
Laboratory. 143 0.27%
Printing or photographic room, area. 76 0.14%
First aid, treatment room. 48 0.09%
Operating room. 20 0.04%
Electronic equipment room, area. 256 0.48%
Performance, stage area. 9 0.02%
Projection room, area. 10 0.02%
Process, manufacturing area. 1574 2.97%
Function Areas not classified above. 210 0.40%
STORAGE AREAS
Product storage room or area, storage tank, storage bin. 1434 2.70%
Closet. 174 0.33%
Supply storage room or area. 1233 2.32%
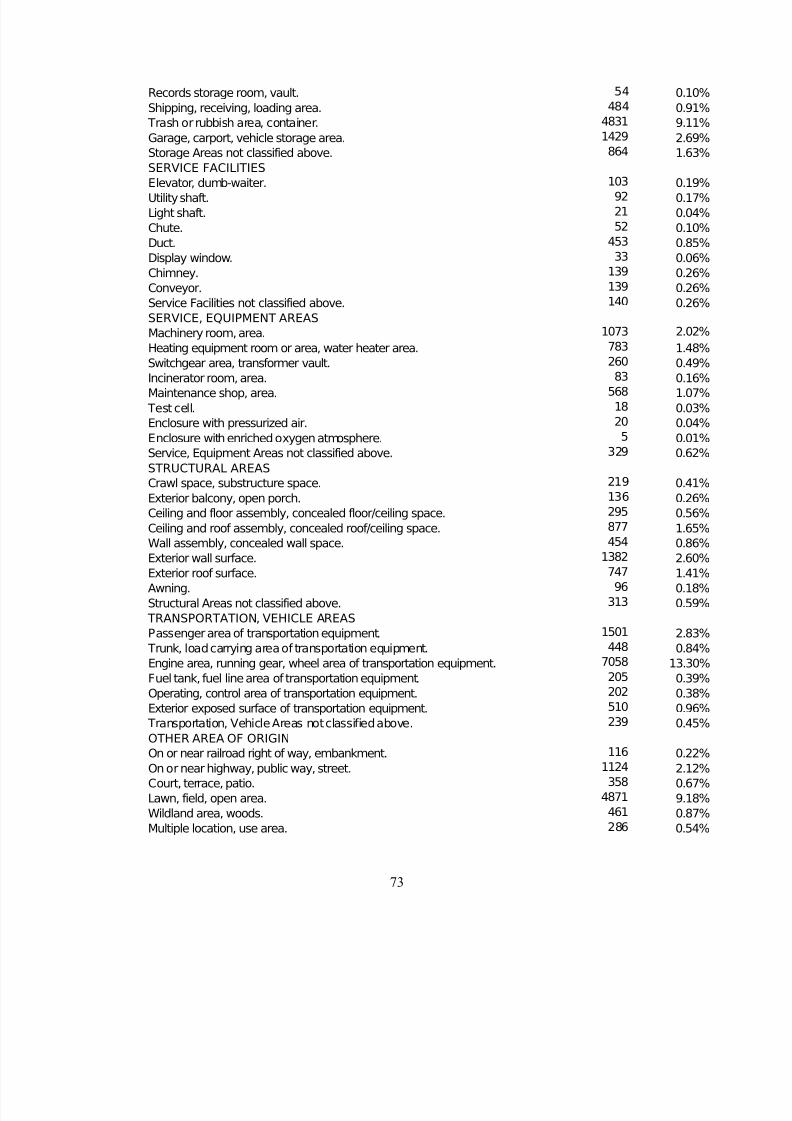
7/28/2019 Vs Iqp Final
http://slidepdf.com/reader/full/vs-iqp-final 84/122
73
Records storage room, vault. 54 0.10%
Shipping, receiving, loading area. 484 0.91%
Trash or rubbish area, container. 4831 9.11%
Garage, carport, vehicle storage area. 1429 2.69%
Storage Areas not classified above. 864 1.63%
SERVICE FACILITIES
Elevator, dumb-waiter. 103 0.19%Utility shaft. 92 0.17%
Light shaft. 21 0.04%
Chute. 52 0.10%
Duct. 453 0.85%
Display window. 33 0.06%
Chimney. 139 0.26%
Conveyor. 139 0.26%
Service Facilities not classified above. 140 0.26%
SERVICE, EQUIPMENT AREAS
Machinery room, area. 1073 2.02%
Heating equipment room or area, water heater area. 783 1.48%
Switchgear area, transformer vault. 260 0.49%Incinerator room, area. 83 0.16%
Maintenance shop, area. 568 1.07%
Test cell. 18 0.03%
Enclosure with pressurized air. 20 0.04%
Enclosure with enriched oxygen atmosphere. 5 0.01%
Service, Equipment Areas not classified above. 329 0.62%
STRUCTURAL AREAS
Crawl space, substructure space. 219 0.41%
Exterior balcony, open porch. 136 0.26%
Ceiling and floor assembly, concealed floor/ceiling space. 295 0.56%
Ceiling and roof assembly, concealed roof/ceiling space. 877 1.65%
Wall assembly, concealed wall space. 454 0.86%Exterior wall surface. 1382 2.60%
Exterior roof surface. 747 1.41%
Awning. 96 0.18%
Structural Areas not classified above. 313 0.59%
TRANSPORTATION, VEHICLE AREAS
Passenger area of transportation equipment. 1501 2.83%
Trunk, load carrying area of transportation equipment. 448 0.84%
Engine area, running gear, wheel area of transportation equipment. 7058 13.30%
Fuel tank, fuel line area of transportation equipment. 205 0.39%
Operating, control area of transportation equipment. 202 0.38%
Exterior exposed surface of transportation equipment. 510 0.96%
Transportation, Vehicle Areas not classified above. 239 0.45%OTHER AREA OF ORIGIN
On or near railroad right of way, embankment. 116 0.22%
On or near highway, public way, street. 1124 2.12%
Court, terrace, patio. 358 0.67%
Lawn, field, open area. 4871 9.18%
Wildland area, woods. 461 0.87%
Multiple location, use area. 286 0.54%

7/28/2019 Vs Iqp Final
http://slidepdf.com/reader/full/vs-iqp-final 85/122
74
Area of Origin not applicable. 555 1.05%
Other Area of Origin not classified above. 1059 2.00%
Other/Unknown 2788 5.26%
Type of material ignited
GASNatural gas. 274 0.52%
LP-City Gas (LP and air mix). 39 0.07%
Manufactured gas. 94 0.18%
LP-gas. 159 0.30%
Anesthetic gas. 5 0.01%
Acetylene. 70 0.13%
Specialty gas other than anesthetic. 36 0.07%
Gas not classified above. 70 0.13%
Gas; insufficient information available to classify further. 131 0.25%
FLAMMABLE, COMBUSTIBLE LIQUID
Class IA flammable liquid. 216 0.41%
Class IB flammable liquid. 113 0.21%Gasoline. 2594 4.89%
Class IC flammable liquid. 84 0.16%
Class II combustible liquid. 342 0.64%
Class IIIA combustible liquid. 82 0.15%
Class IIIB combustible liquid. 627 1.18%
Flammable, Combustible Liquid not classified above. 201 0.38%Flammable, Combustible Liquid; insufficient information available to classifyfurther.
3970.75%
VOLATILE SOLID, CHEMICAL
Fat, grease (food). 1172 2.21%
Grease (nonfood). 193 0.36%
Polish. 16 0.03%Adhesive, resin, tar. 416 0.78%
Applied paint, varnish. 317 0.60%
Combustible metal. 142 0.27%
Solid chemical (specify type). 82 0.15%
Radioactive material. 0.00%
Volatile Solid, Chemical not classified above. 52 0.10%
Volatile Solid, Chemical; insufficient information available to classify further 36 0.07%
PLASTIC
Polyurethane. 366 0.69%
Polystyrene. 156 0.29%
Polyvinyl. 1647 3.10%
Polyacrylic. 70 0.13%Polyester. 149 0.28%
Polyolefin. 65 0.12%
Plastic not classified above. 1404 2.65%
Plastic; insufficient information available to classify further. 2497 4.71%
NATURAL PRODUCT
Rubber. 1789 3.37%
Cork. 12 0.02%
Leather. 36 0.07%

7/28/2019 Vs Iqp Final
http://slidepdf.com/reader/full/vs-iqp-final 86/122
75
Grass, leaves, hay, straw. 3427 6.46%
Grain, natural fiber (pre-process). 269 0.51%
Coal, coke, briquettes, peat. 83 0.16%
Food, starch. 520 0.98%
Tobacco. 70 0.13%
Natural Product not classified above. 410 0.77%
Natural Product; insufficient information available to classify further. 114 0.21%WOOD, PAPER
Growing wood. 262 0.49%
Felled but unsawn wood. 297 0.56%
Sawn wood. 4056 7.65%
Wood shavings. 1174 2.21%
Hardboard, plywood. 746 1.41%
Fiberboard (low density material), wood pulp. 318 0.60%
Paper, untreated, uncoated. 3711 6.99%
Cardboard. 1262 2.38%
Wood, Paper not classified above. 890 1.68%
Wood, Paper; insufficient information available to classify further. 1055 1.99%
FABRIC, TEXTILE, FURMan-made fabric, fiber, finished goods. 1279 2.41%
Cotton, rayon, cotton fabric, finished goods. 1914 3.61%
Wool, wool mixture fabric, finished goods. 38 0.07%
Fur, silk, other fabric, finished goods. 15 0.03%
Wig. 20 0.04%
Human hair. 9 0.02%
Fabric, Textile, Fur not classified above. 199 0.38%
Fabric, Textile, Fur; insufficient information available to classify further. 322 0.61%
MATERIAL COMPOUNDED WITH OIL
Linoleum. 12 0.02%
Oil cloth. 12 0.02%
Treated and/or coated paper. 628 1.18%Waterproof canvas. 409 0.77%
Oily rags. 159 0.30%
Asphalt treated material. 172 0.32%
Material Compounded with Oil not classified above. 138 0.26%Material Compounded with Oil; insufficient information available to classifyfurther.
840.16%
OTHER TYPE OF MATERIAL
Multiple types of material first ignited. 1938 3.65%
Type of Material not classified above. 2452 4.62%
Type of Material undetermined or not reported 7942 14.97%
Construction TypeFire resistive. 2927 5.52%
Heavy timber. 612 1.15%
Protected noncombustible or limited combustible. 2407 4.54%
Unprotected noncombustible or limited combustible not qualifying for 3. 3109 5.86%
Protected ordinary. 3212 6.05%
Unprotected ordinary, not qualifying 5. 3517 6.63%
Protected Wood Frame 1714 3.23%
Unprotected wood frame not qualifying for 7. 3737 7.04%

7/28/2019 Vs Iqp Final
http://slidepdf.com/reader/full/vs-iqp-final 87/122
76
Not classified above 492 0.93%
Undetermined or not reported 3384 6.38%
Structural Damage with Sprinklers Only total 25662
None/not reported 2 3.76982E-05
Minimal 14475 0.272840367
Heavy 3400 0.064086857Extreme 4736 0.089269221
Structural Damage with Sprinklers and Smoke Detection total 25360
None/not reported 2 3.76982E-05
Minimal 14313 0.269786817
Heavy 3335 0.062861667
Extreme 4692 0.088439862
NFIRs Data 1996
Fires in Commercial build ings
Had detectors 25164 47.26%
Did not have any type of detector present 28081 39.91%
Structural Damage (as described in the FEMA NFIR's Manual)
None/not reported 2331 4.38%
Minimal 25747 48.36%
Heavy 4528 8.50%
Extreme 14636 27.49%
Area of originMEANS OF EGRESS
Hallway, corridor, mall. 450 0.85%Exterior stairway. 65 0.12%
Interior stairway. 80 0.15%
Escalator. 10 0.02%
Lobby, entrance way. 347 0.65%
Means of Egress not classified above. 90 0.17%
ASSEMBLY, SALES AREAS (groups of people)
Large assembly area with fixed seats (100 or more persons). 57 0.11%
Large open room without fixed seats (100 or more persons). 169 0.32%
Small assembly area with or without fixed seats (less than 100 persons). 141 0.26%
Lounge area. 329 0.62%
Sales, showroom area. 517 0.97%
Library. 8 0.02%Swimming pool. 24 0.05%
Assembly, Sales Areas not classified above. 69 0.13%
FUNCTION AREAS
Sleeping room for under 5 persons. 1042 1.96%
Sleeping area for 5 or more persons. 43 0.08%
Dining area, lunchroom, cafeteria. 237 0.45%
Kitchen, cooking area. 2342 4.40%
Lavatory, locker room, cloakroom. 988 1.86%
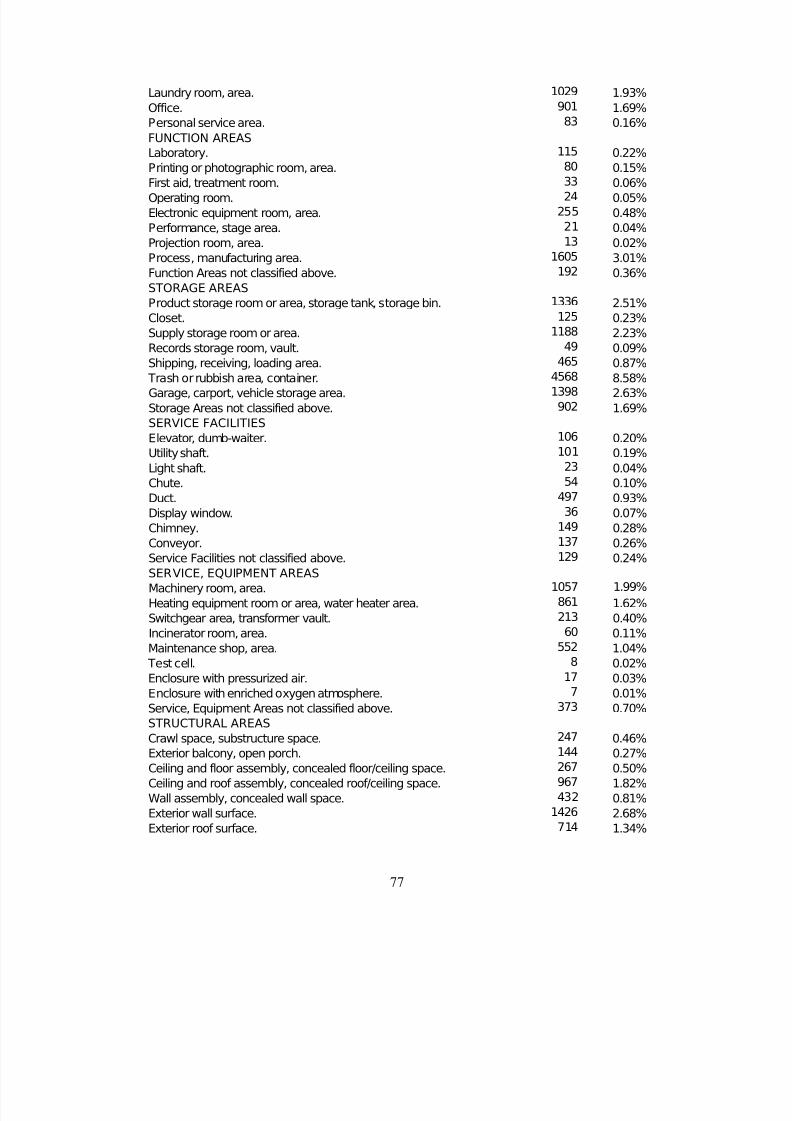
7/28/2019 Vs Iqp Final
http://slidepdf.com/reader/full/vs-iqp-final 88/122
77
Laundry room, area. 1029 1.93%
Office. 901 1.69%
Personal service area. 83 0.16%
FUNCTION AREAS
Laboratory. 115 0.22%
Printing or photographic room, area. 80 0.15%
First aid, treatment room. 33 0.06%Operating room. 24 0.05%
Electronic equipment room, area. 255 0.48%
Performance, stage area. 21 0.04%
Projection room, area. 13 0.02%
Process, manufacturing area. 1605 3.01%
Function Areas not classified above. 192 0.36%
STORAGE AREAS
Product storage room or area, storage tank, storage bin. 1336 2.51%
Closet. 125 0.23%
Supply storage room or area. 1188 2.23%
Records storage room, vault. 49 0.09%
Shipping, receiving, loading area. 465 0.87% Trash or rubbish area, container. 4568 8.58%
Garage, carport, vehicle storage area. 1398 2.63%
Storage Areas not classified above. 902 1.69%
SERVICE FACILITIES
Elevator, dumb-waiter. 106 0.20%
Utility shaft. 101 0.19%
Light shaft. 23 0.04%
Chute. 54 0.10%
Duct. 497 0.93%
Display window. 36 0.07%
Chimney. 149 0.28%
Conveyor. 137 0.26%Service Facilities not classified above. 129 0.24%
SERVICE, EQUIPMENT AREAS
Machinery room, area. 1057 1.99%
Heating equipment room or area, water heater area. 861 1.62%
Switchgear area, transformer vault. 213 0.40%
Incinerator room, area. 60 0.11%
Maintenance shop, area. 552 1.04%
Test cell. 8 0.02%
Enclosure with pressurized air. 17 0.03%
Enclosure with enriched oxygen atmosphere. 7 0.01%
Service, Equipment Areas not classified above. 373 0.70%
STRUCTURAL AREASCrawl space, substructure space. 247 0.46%
Exterior balcony, open porch. 144 0.27%
Ceiling and floor assembly, concealed floor/ceiling space. 267 0.50%
Ceiling and roof assembly, concealed roof/ceiling space. 967 1.82%
Wall assembly, concealed wall space. 432 0.81%
Exterior wall surface. 1426 2.68%
Exterior roof surface. 714 1.34%

7/28/2019 Vs Iqp Final
http://slidepdf.com/reader/full/vs-iqp-final 89/122
78
Awning. 91 0.17%
Structural Areas not classified above. 300 0.56%
TRANSPORTATION, VEHICLE AREAS
Passenger area of transportation equipment. 1485 2.79%
Trunk, load carrying area of transportation equipment. 412 0.77%
Engine area, running gear, wheel area of transportation equipment. 7005 13.16%
Fuel tank, fuel line area of transportation equipment. 190 0.36%Operating, control area of transportation equipment. 176 0.33%
Exterior exposed surface of transportation equipment. 433 0.81%
Transportation, Vehicle Areas not classified above. 260 0.49%
OTHER AREA OF ORIGIN
On or near railroad right of way, embankment. 96 0.18%
On or near highway, public way, street. 1088 2.04%
Court, terrace, patio. 364 0.68%
Lawn, field, open area. 4842 9.09%
Wildland area, woods. 477 0.90%
Multiple location, use area. 217 0.41%
Area of Origin not applicable. 585 1.10%
Other Area of Origin not classified above. 1109 2.08%Other/Unknown 3307 6.21%
Type of material ignited
GAS 1
Natural gas. 268 0.50%
LP-City Gas (LP and air mix). 41 0.08%
Manufactured gas. 93 0.17%
LP-gas. 196 0.37%
Anesthetic gas. 2 0.00%
Acetylene. 90 0.17%
Specialty gas other than anesthetic. 36 0.07%Gas not classified above. 67 0.13%
Gas; insufficient information available to classify further. 142 0.27%
FLAMMABLE, COMBUSTIBLE LIQUID
Class IA flammable liquid. 209 0.39%
Class IB flammable liquid. 94 0.18%
Gasoline. 2375 4.46%
Class IC flammable liquid. 85 0.16%
Class II combustible liquid. 291 0.55%
Class IIIA combustible liquid. 92 0.17%
Class IIIB combustible liquid. 591 1.11%
Flammable, Combustible Liquid not classified above. 203 0.38%
Flammable, Combustible Liquid; insufficient information available toclassify further.
4110.77%
VOLATILE SOLID, CHEMICAL
Fat, grease (food). 1168 2.19%
Grease (nonfood). 246 0.46%
Polish. 27 0.05%
Adhesive, resin, tar. 380 0.71%
Applied paint, varnish. 261 0.49%
Combustible metal. 101 0.19%

7/28/2019 Vs Iqp Final
http://slidepdf.com/reader/full/vs-iqp-final 90/122
79
Solid chemical (specify type). 41 0.08%
Radioactive material. 3 0.01%
Volatile Solid, Chemical not classified above. 50 0.09%Volatile Solid, Chemical; insufficient information available to classifyfurther
260.05%
PLASTIC
Polyurethane. 329 0.62%Polystyrene. 150 0.28%
Polyvinyl. 1703 3.20%
Polyacrylic. 80 0.15%
Polyester. 120 0.23%
Polyolefin. 85 0.16%
Plastic not classified above. 1555 2.92%
Plastic; insufficient information available to classify further. 2424 4.55%
NATURAL PRODUCT
Rubber. 1631 3.06%
Cork. 11 0.02%
Leather. 23 0.04%
Grass, leaves, hay, straw. 3595 6.75%Grain, natural fiber (pre-process). 295 0.55%
Coal, coke, briquettes, peat. 84 0.16%
Food, starch. 496 0.93%
Tobacco. 163 0.31%
Natural Product not classified above. 381 0.72%
Natural Product; insufficient information available to classify further. 140 0.26%
WOOD, PAPER
Growing wood. 293 0.55%
Felled but unsawn wood. 304 0.57%
Sawn wood. 4125 7.75%
Wood shavings. 977 1.83%
Hardboard, plywood. 743 1.40%Fiberboard (low density material), wood pulp. 303 0.57%
Paper, untreated, uncoated. 3455 6.49%
Cardboard. 1345 2.53%
Wood, Paper not classified above. 873 1.64%
Wood, Paper; insufficient information available to classify further. 1159 2.18%
FABRIC, TEXTILE, FUR
Man-made fabric, fiber, finished goods. 1335 2.51%
Cotton, rayon, cotton fabric, finished goods. 1794 3.37%
Wool, wool mixture fabric, finished goods. 61 0.11%
Fur, silk, other fabric, finished goods. 20 0.04%
Wig. 39 0.07%
Human hair. 11 0.02%Fabric, Textile, Fur not classified above. 219 0.41%
Fabric, Textile, Fur; insufficient information available to classify further. 368 0.69%
MATERIAL COMPOUNDED WITH OIL
Linoleum. 21 0.04%
Oil cloth. 4 0.01%
Treated and/or coated paper. 701 1.32%
Waterproof canvas. 364 0.68%
Oily rags. 104 0.20%

7/28/2019 Vs Iqp Final
http://slidepdf.com/reader/full/vs-iqp-final 91/122
80
Asphalt treated material. 187 0.35%
Material Compounded with Oil not classified above. 160 0.30%Material Compounded with Oil; insufficient information available toclassify further.
920.17%
OTHER TYPE OF MATERIAL
Multiple types of material first ignited. 1866 3.50%
Type of Material not classified above. 2433 4.57% Type of Material undetermined or not reported 8468 15.90%
Construction Type
Fire resistive. 2877 5.40%
Heavy timber. 606 1.14%
Protected noncombustible or limited combustible. 2509 4.71%
Unprotected noncombustible or limited combustible not qualifying for 3. 3224 6.06%
Protected ordinary. 3202 6.01%
Unprotected ordinary, not qualifying 5. 3482 6.54%
Protected Wood Frame 1756 3.30%
Unprotected wood frame not qualifying for 7. 3512 6.60%
Not classified above 452 0.85%Undetermined or not reported 3214 6.04%
Structural Damage with Sprinklers Only total 25329
None/not reported 3 0.01%
Minimal 13724 25.78%
Heavy 3340 6.27%
Extreme 4997 9.38%
Structural Damage with Sprinklers and Smoke Detection total 25060
None/not reported 3 0.01%
Minimal 13577 25.50%
Heavy 3300 6.20%Extreme 4960 9.32%
NFIRs Data 1997
Fires in Commercial build ings
Had detectors 22026 50.90%
Did not have any type of detector present 21250 49.10%
Structural Damage (as described in the FEMA NFIR's Manual)
None/not reported 5 0.01%
Minimal 20806 48.08%Heavy 3752 8.67%
Extreme 13188 30.47%
Area of origin
MEANS OF EGRESS
Hallway, corridor, mall. 418 0.97%

7/28/2019 Vs Iqp Final
http://slidepdf.com/reader/full/vs-iqp-final 92/122
81
Exterior stairway. 67 0.15%
Interior stairway. 64 0.15%
Escalator. 7 0.02%
Lobby, entrance way. 270 0.62%
Means of Egress not classified above. 97 0.22%
ASSEMBLY, SALES AREAS (groups of people)
Large assembly area with fixed seats (100 or more persons). 41 0.09%
Large open room without fixed seats (100 or more persons). 101 0.23%
Small assembly area with or without fixed seats (less than 100 persons). 158 0.37%
Lounge area. 263 0.61%
Sales, showroom area. 491 1.13%
Library. 5 0.01%
Swimming pool. 17 0.04%
Assembly, Sales Areas not classified above. 42 0.10%
FUNCTION AREAS
Sleeping room for under 5 persons. 794 1.83%
Sleeping area for 5 or more persons. 22 0.05%
Dining area, lunchroom, cafeteria. 191 0.44%
Kitchen, cooking area. 2065 4.77%
Lavatory, locker room, cloakroom. 735 1.70%
Laundry room, area. 915 2.11%
Office. 700 1.62%
Personal service area. 77 0.18%
FUNCTION AREAS
Laboratory. 115 0.27%
Printing or photographic room, area. 54 0.12%
First aid, treatment room. 38 0.09%
Operating room. 14 0.03%
Electronic equipment room, area. 216 0.50%
Performance, stage area. 19 0.04%
Projection room, area. 5 0.01%
Process, manufacturing area. 1404 3.24%
Function Areas not classified above. 181 0.42%
STORAGE AREAS
Product storage room or area, storage tank, storage bin. 1063 2.46%
Closet. 98 0.23%
Supply storage room or area. 903 2.09%
Records storage room, vault. 46 0.11%
Shipping, receiving, loading area. 395 0.91%
Trash or rubbish area, container. 3527 8.15%
Garage, carport, vehicle storage area. 1059 2.45%
Storage Areas not classified above. 703 1.62%
SERVICE FACILITIES
Elevator, dumb-waiter. 104 0.24%
Utility shaft. 104 0.24%
Light shaft. 14 0.03%
Chute. 40 0.09%
Duct. 438 1.01%
Display window. 28 0.06%
Chimney. 143 0.33%
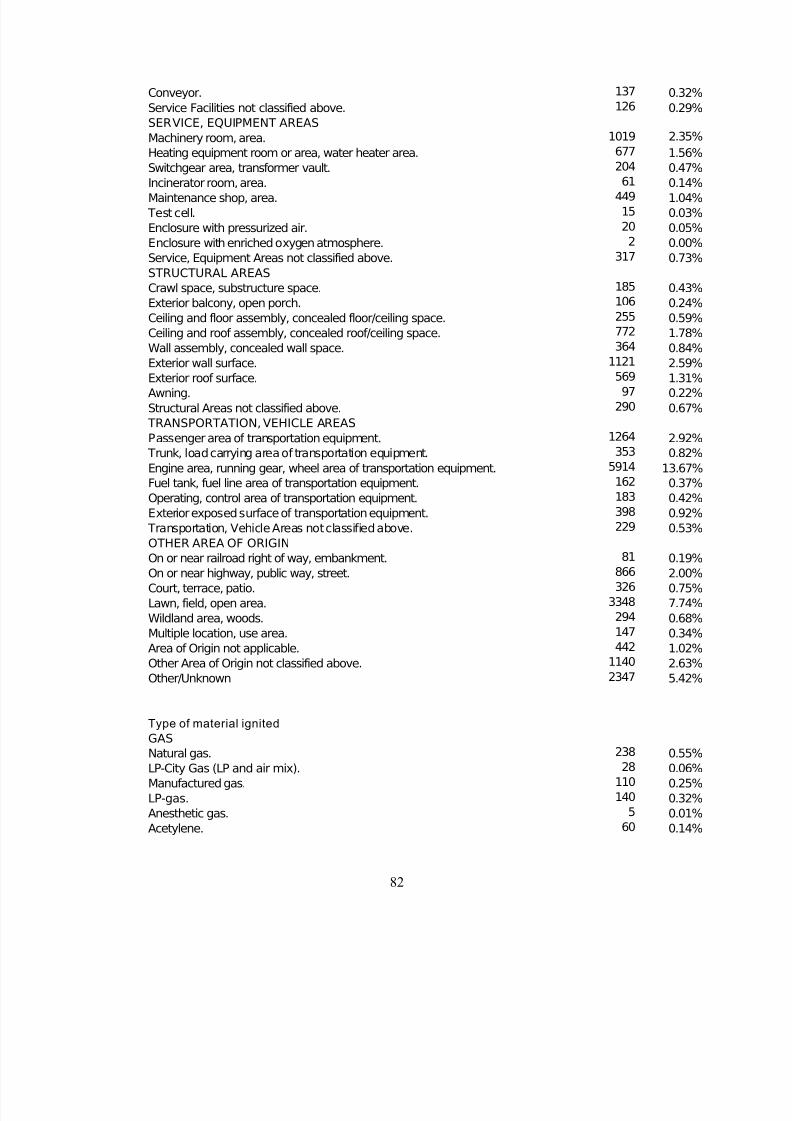
7/28/2019 Vs Iqp Final
http://slidepdf.com/reader/full/vs-iqp-final 93/122
82
Conveyor. 137 0.32%
Service Facilities not classified above. 126 0.29%
SERVICE, EQUIPMENT AREAS
Machinery room, area. 1019 2.35%
Heating equipment room or area, water heater area. 677 1.56%
Switchgear area, transformer vault. 204 0.47%
Incinerator room, area. 61 0.14%Maintenance shop, area. 449 1.04%
Test cell. 15 0.03%
Enclosure with pressurized air. 20 0.05%
Enclosure with enriched oxygen atmosphere. 2 0.00%
Service, Equipment Areas not classified above. 317 0.73%
STRUCTURAL AREAS
Crawl space, substructure space. 185 0.43%
Exterior balcony, open porch. 106 0.24%
Ceiling and floor assembly, concealed floor/ceiling space. 255 0.59%
Ceiling and roof assembly, concealed roof/ceiling space. 772 1.78%
Wall assembly, concealed wall space. 364 0.84%
Exterior wall surface. 1121 2.59%Exterior roof surface. 569 1.31%
Awning. 97 0.22%
Structural Areas not classified above. 290 0.67%
TRANSPORTATION, VEHICLE AREAS
Passenger area of transportation equipment. 1264 2.92%
Trunk, load carrying area of transportation equipment. 353 0.82%
Engine area, running gear, wheel area of transportation equipment. 5914 13.67%
Fuel tank, fuel line area of transportation equipment. 162 0.37%
Operating, control area of transportation equipment. 183 0.42%
Exterior exposed surface of transportation equipment. 398 0.92%
Transportation, Vehicle Areas not classified above. 229 0.53%
OTHER AREA OF ORIGINOn or near railroad right of way, embankment. 81 0.19%
On or near highway, public way, street. 866 2.00%
Court, terrace, patio. 326 0.75%
Lawn, field, open area. 3348 7.74%
Wildland area, woods. 294 0.68%
Multiple location, use area. 147 0.34%
Area of Origin not applicable. 442 1.02%
Other Area of Origin not classified above. 1140 2.63%
Other/Unknown 2347 5.42%
Type of material ignited
GAS
Natural gas. 238 0.55%
LP-City Gas (LP and air mix). 28 0.06%
Manufactured gas. 110 0.25%
LP-gas. 140 0.32%
Anesthetic gas. 5 0.01%
Acetylene. 60 0.14%

7/28/2019 Vs Iqp Final
http://slidepdf.com/reader/full/vs-iqp-final 94/122
83
Specialty gas other than anesthetic. 18 0.04%
Gas not classified above. 64 0.15%
Gas; insufficient information available to classify further. 144 0.33%
FLAMMABLE, COMBUSTIBLE LIQUID
Class IA flammable liquid. 149 0.34%
Class IB flammable liquid. 97 0.22%
Gasoline. 1854 4.28%Class IC flammable liquid. 62 0.14%
Class II combustible liquid. 246 0.57%
Class IIIA combustible liquid. 56 0.13%
Class IIIB combustible liquid. 471 1.09%
Flammable, Combustible Liquid not classified above. 214 0.49%Flammable, Combustible Liquid; insufficient information available to classifyfurther.
3790.88%
VOLATILE SOLID, CHEMICAL
Fat, grease (food). 1076 2.49%
Grease (nonfood). 201 0.46%
Polish. 23 0.05%
Adhesive, resin, tar. 322 0.74%Applied paint, varnish. 220 0.51%
Combustible metal. 159 0.37%
Solid chemical (specify type). 47 0.11%
Radioactive material. 1 0.00%
Volatile Solid, Chemical not classified above. 44 0.10%
Volatile Solid, Chemical; insufficient information available to classify further 33 0.08%
PLASTIC
Polyurethane. 340 0.79%
Polystyrene. 168 0.39%
Polyvinyl. 1518 3.51%
Polyacrylic. 69 0.16%
Polyester. 102 0.24%Polyolefin. 68 0.16%
Plastic not classified above. 1182 2.73%
Plastic; insufficient information available to classify further. 2299 5.31%
NATURAL PRODUCT
Rubber. 1328 3.07%
Cork. 7 0.02%
Leather. 20 0.05%
Grass, leaves, hay, straw. 2336 5.40%
Grain, natural fiber (pre-process). 269 0.62%
Coal, coke, briquettes, peat. 63 0.15%
Food, starch. 449 1.04%
Tobacco. 146 0.34%Natural Product not classified above. 218 0.50%
Natural Product; insufficient information available to classify further. 105 0.24%
WOOD, PAPER
Growing wood. 250 0.58%
Felled but unsawn wood. 181 0.42%
Sawn wood. 3200 7.39%
Wood shavings. 964 2.23%
Hardboard, plywood. 614 1.42%

7/28/2019 Vs Iqp Final
http://slidepdf.com/reader/full/vs-iqp-final 95/122
84
Fiberboard (low density material), wood pulp. 264 0.61%
Paper, untreated, uncoated. 3049 7.05%
Cardboard. 1177 2.72%
Wood, Paper not classified above. 781 1.80%
Wood, Paper; insufficient information available to classify further. 977 2.26%
FABRIC, TEXTILE, FUR
Man-made fabric, fiber, finished goods. 1116 2.58%Cotton, rayon, cotton fabric, finished goods. 1493 3.45%
Wool, wool mixture fabric, finished goods. 33 0.08%
Fur, silk, other fabric, finished goods. 15 0.03%
Wig. 13 0.03%
Human hair. 7 0.02%
Fabric, Textile, Fur not classified above. 170 0.39%
Fabric, Textile, Fur; insufficient information available to classify further. 306 0.71%
MATERIAL COMPOUNDED WITH OIL
Linoleum. 8 0.02%
Oil cloth. 10 0.02%
Treated and/or coated paper. 31 0.07%
Waterproof canvas. 16 0.04%Oily rags. 113 0.26%
Asphalt treated material. 162 0.37%
Material Compounded with Oil not classified above. 138 0.32%Material Compounded with Oil; insufficient information available to classifyfurther.
970.22%
OTHER TYPE OF MATERIAL
Multiple types of material first ignited. 1689 3.90%
Type of Material not classified above. 1968 4.55%
Type of Material undetermined or not reported 6769 15.64%
Construction Type
Fire resistive. 2661 6.15%Heavy timber. 512 1.18%
Protected noncombustible or limited combustible. 2414 5.58%
Unprotected noncombustible or limited combustible not qualifying for 3. 2876 6.65%
Protected ordinary. 2776 6.41%
Unprotected ordinary, not qualifying 5. 3016 6.97%
Protected Wood Frame 1680 3.88%
Unprotected wood frame not qualifying for 7. 2932 6.78%
Not classified above 424 0.98%
Undetermined or not reported 2502 5.78%
Structural Damage with Sprink lers only
total
22181None/not reported 5 0.01%
Minimal 11555 26.70%
Heavy 2956 6.83%
Extreme 4644 10.73%
Structural Damage with Sprinklers and Smoke Detectiontotal21917
None/not reported 5 0.01%
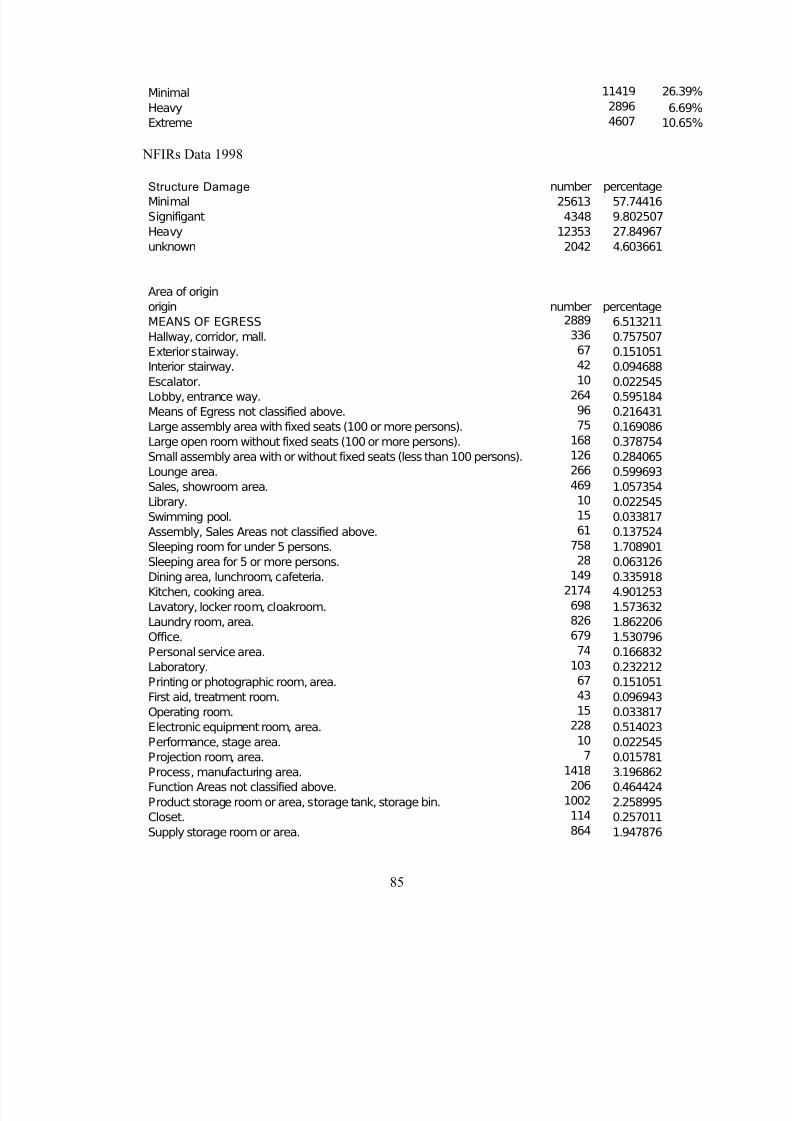
7/28/2019 Vs Iqp Final
http://slidepdf.com/reader/full/vs-iqp-final 96/122
85
Minimal 11419 26.39%
Heavy 2896 6.69%
Extreme 4607 10.65%
NFIRs Data 1998
Structure Damage number percentage
Minimal 25613 57.74416
Signifigant 4348 9.802507
Heavy 12353 27.84967
unknown 2042 4.603661
Area of origin
origin number percentage
MEANS OF EGRESS 2889 6.513211
Hallway, corridor, mall. 336 0.757507
Exterior stairway. 67 0.151051
Interior stairway. 42 0.094688
Escalator. 10 0.022545
Lobby, entrance way. 264 0.595184
Means of Egress not classified above. 96 0.216431
Large assembly area with fixed seats (100 or more persons). 75 0.169086
Large open room without fixed seats (100 or more persons). 168 0.378754
Small assembly area with or without fixed seats (less than 100 persons). 126 0.284065
Lounge area. 266 0.599693
Sales, showroom area. 469 1.057354
Library. 10 0.022545
Swimming pool. 15 0.033817
Assembly, Sales Areas not classified above. 61 0.137524
Sleeping room for under 5 persons. 758 1.708901
Sleeping area for 5 or more persons. 28 0.063126
Dining area, lunchroom, cafeteria. 149 0.335918
Kitchen, cooking area. 2174 4.901253
Lavatory, locker room, cloakroom. 698 1.573632
Laundry room, area. 826 1.862206
Office. 679 1.530796
Personal service area. 74 0.166832
Laboratory. 103 0.232212
Printing or photographic room, area. 67 0.151051
First aid, treatment room. 43 0.096943
Operating room. 15 0.033817
Electronic equipment room, area. 228 0.514023
Performance, stage area. 10 0.022545
Projection room, area. 7 0.015781
Process, manufacturing area. 1418 3.196862
Function Areas not classified above. 206 0.464424
Product storage room or area, storage tank, storage bin. 1002 2.258995
Closet. 114 0.257011
Supply storage room or area. 864 1.947876

7/28/2019 Vs Iqp Final
http://slidepdf.com/reader/full/vs-iqp-final 97/122
86
Records storage room, vault. 47 0.105961
Shipping, receiving, loading area. 396 0.892777
Trash or rubbish area, container. 3904 8.801515
Garage, carport, vehicle storage area. 1051 2.369465
Storage Areas not classified above. 779 1.756245
Elevator, dumb-waiter. 81 0.182613
Utility shaft. 90 0.202904Light shaft. 12 0.027054
Chute. 57 0.128506
Duct. 433 0.976193
Display window. 37 0.083416
Chimney. 116 0.26152
Conveyor. 140 0.315628
Service Facilities not classified above. 138 0.311119
Machinery room, area. 1021 2.301831
Heating equipment room or area, water heater area. 673 1.517269
Switchgear area, transformer vault. 241 0.543331
Incinerator room, area. 62 0.139778
Maintenance shop, area. 465 1.048336 Test cell. 14 0.031563
Enclosure with pressurized air. 23 0.051853
Enclosure with enriched oxygen atmosphere. 4 0.009018
Service, Equipment Areas not classified above. 337 0.759762
Crawl space, substructure space. 173 0.390026
Exterior balcony, open porch. 116 0.26152
Ceiling and floor assembly, concealed floor/ceiling space. 212 0.477951
Ceiling and roof assembly, concealed roof/ceiling space. 739 1.666065
Wall assembly, concealed wall space. 368 0.829651
Exterior wall surface. 1115 2.513752
Exterior roof surface. 633 1.42709
Awning. 74 0.166832Structural Areas not classified above. 276 0.622238
Passenger area of transportation equipment. 1255 2.82938
Trunk, load carrying area of transportation equipment. 384 0.865723
Engine area, running gear, wheel area of transportation equipment. 5887 13.27216
Fuel tank, fuel line area of transportation equipment. 146 0.329155
Operating, control area of transportation equipment. 166 0.374245
Exterior exposed surface of transportation equipment. 362 0.816124
Transportation, Vehicle Areas not classified above. 268 0.604202
On or near railroad right of way, embankment. 70 0.157814
On or near highway, public way, street. 989 2.229687
Court, terrace, patio. 384 0.865723
Lawn, field, open area. 3615 8.149968Wildland area, woods. 406 0.915321
Multiple location, use area. 166 0.374245
Area of Origin not applicable. 535 1.20615
Other Area of Origin not classified above. 1104 2.488953
Area of Origin undetermined or not reported. 435 0.980702
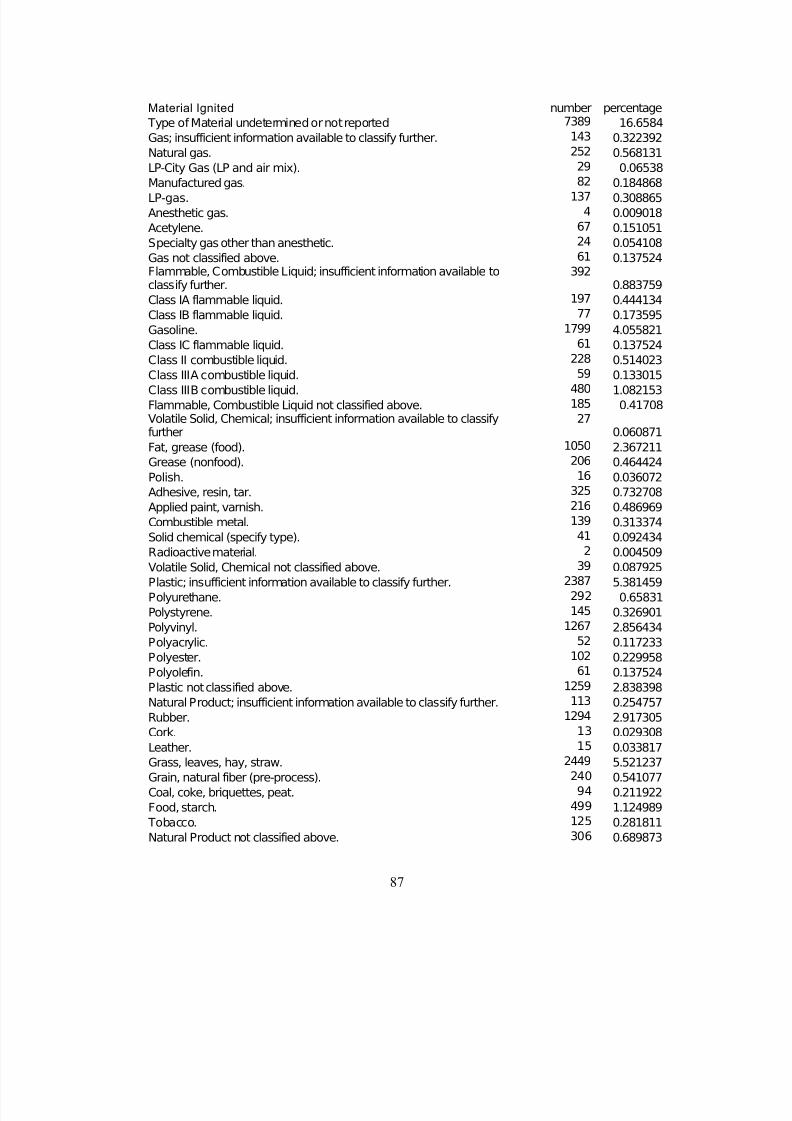
7/28/2019 Vs Iqp Final
http://slidepdf.com/reader/full/vs-iqp-final 98/122
87
Material Ignited number percentage
Type of Material undetermined or not reported 7389 16.6584
Gas; insufficient information available to classify further. 143 0.322392
Natural gas. 252 0.568131
LP-City Gas (LP and air mix). 29 0.06538
Manufactured gas. 82 0.184868LP-gas. 137 0.308865
Anesthetic gas. 4 0.009018
Acetylene. 67 0.151051
Specialty gas other than anesthetic. 24 0.054108
Gas not classified above. 61 0.137524Flammable, Combustible Liquid; insufficient information available toclassify further.
3920.883759
Class IA flammable liquid. 197 0.444134
Class IB flammable liquid. 77 0.173595
Gasoline. 1799 4.055821
Class IC flammable liquid. 61 0.137524
Class II combustible liquid. 228 0.514023Class IIIA combustible liquid. 59 0.133015
Class IIIB combustible liquid. 480 1.082153
Flammable, Combustible Liquid not classified above. 185 0.41708Volatile Solid, Chemical; insufficient information available to classifyfurther
270.060871
Fat, grease (food). 1050 2.367211
Grease (nonfood). 206 0.464424
Polish. 16 0.036072
Adhesive, resin, tar. 325 0.732708
Applied paint, varnish. 216 0.486969
Combustible metal. 139 0.313374
Solid chemical (specify type). 41 0.092434Radioactive material. 2 0.004509
Volatile Solid, Chemical not classified above. 39 0.087925
Plastic; insufficient information available to classify further. 2387 5.381459
Polyurethane. 292 0.65831
Polystyrene. 145 0.326901
Polyvinyl. 1267 2.856434
Polyacrylic. 52 0.117233
Polyester. 102 0.229958
Polyolefin. 61 0.137524
Plastic not classified above. 1259 2.838398
Natural Product; insufficient information available to classify further. 113 0.254757
Rubber. 1294 2.917305Cork. 13 0.029308
Leather. 15 0.033817
Grass, leaves, hay, straw. 2449 5.521237
Grain, natural fiber (pre-process). 240 0.541077
Coal, coke, briquettes, peat. 94 0.211922
Food, starch. 499 1.124989
Tobacco. 125 0.281811
Natural Product not classified above. 306 0.689873

7/28/2019 Vs Iqp Final
http://slidepdf.com/reader/full/vs-iqp-final 99/122
88
Wood, Paper; insufficient information available to classify further. 1163 2.621968
Growing wood. 259 0.583912
Felled but unsawn wood. 214 0.48246
Sawn wood. 2967 6.689061
Wood shavings. 1129 2.545315
Hardboard, plywood. 654 1.474434
Fiberboard (low density material), wood pulp. 305 0.687618Paper, untreated, uncoated. 2911 6.56281
Cardboard. 1156 2.606186
Wood, Paper not classified above. 764 1.722428
Fabric, Textile, Fur; insufficient information available to classify further. 306 0.689873
Man-made fabric, fiber, finished goods. 1035 2.333393
Cotton, rayon, cotton fabric, finished goods. 1414 3.187844
Wool, wool mixture fabric, finished goods. 24 0.054108
Fur, silk, other fabric, finished goods. 18 0.040581
Wig. 13 0.029308
Human hair. 9 0.02029
Fabric, Textile, Fur not classified above. 155 0.349445
Material Compounded with Oil; insufficient information available to classifyfurther.
1160.26152
Linoleum. 10 0.022545
Oil cloth. 11 0.024799
Treated and/or coated paper. 262 0.590675
Waterproof canvas. 10 0.022545
Oily rags. 91 0.205158
Asphalt treated material. 181 0.408062
Material Compounded with Oil not classified above. 139 0.313374
Multiple types of material first ignited. 1601 3.609433
Type of Material not classified above. 267 0.601948
Unknown 2732 6.159257
Structure Type
Type number percentage
other structure type 2848 6.420777
Enclosed building 2628 5.92479
fixed portable or mobile structure 483 1.088917
open structure 2322 5.234917
air supported structure 2685 6.053296
tent 2857 6.441068
open platform 2841 6.404996
underground structure work areas 1500 3.38173
connective structure 2753 6.206601Unknown/ Undetermined 23439 52.84291
NFIRs Data 1999
Structure Damage
Type of damage number percentage
Minimal 3058 31.66%

7/28/2019 Vs Iqp Final
http://slidepdf.com/reader/full/vs-iqp-final 100/122
89
Significant 818 8.47%
Heavy 2080 21.53%
Unknown 3704 38.34%
Total 9660
Area of or ig in
number percentageMEANS OF EGRESS 182 1.88%
Hallway, corridor, mall. 57 0.59%
Exterior stairway. 59 0.61%
Interior stairway. 39 0.40%
Escalator. 3 0.03%
Lobby, entrance way. 88 0.91%
Means of Egress not classified above. 33 0.34%
ASSEMBLY, SALES AREAS (groups of people) 9 0.09%
Large assembly area with fixed seats (100 or more persons). 13 0.13%
Large open room without fixed seats (100 or more persons). 4 0.04%
Small assembly area with or without fixed seats (less than 100 persons). 15 0.16%
Lounge area. 604 6.25%Sales, showroom area. 20 0.21%
Library. 1 0.01%
Swimming pool. 1 0.01%
FUNCTION AREAS 183 1.89%
Sleeping room for under 5 persons. 973 10.07%
Sleeping area for 5 or more persons. 51 0.53%
Dining area, lunchroom, cafeteria. 60 0.62%
Kitchen, cooking area. 1306 13.52%
Lavatory, locker room, cloakroom. 277 2.87%
Laundry room, area. 406 4.20%
Office. 44 0.46%
Personal service area. 12 0.12%FUNCTION AREAS 8 0.08%
Laboratory. 13 0.13%
Printing or photographic room, area. 2 0.02%
First aid, treatment room. 1 0.01%
Operating room. 1 0.01%
Electronic equipment room, area. 16 0.17%
Performance, stage area. 2 0.02%
Process, manufacturing area. 118 1.22%
STORAGE AREAS 187 1.94%
Product storage room or area, storage tank, storage bin. 139 1.44%
Closet. 64 0.66%
Supply storage room or area. 94 0.97%Records storage room, vault. 4 0.04%
Shipping, receiving, loading area. 13 0.13%
Trash or rubbish area, container. 52 0.54%
Garage, carport, vehicle storage area. 550 5.69%
SERVICE FACILITIES 143 1.48%
Elevator, dumb-waiter. 4 0.04%
Utility shaft. 20 0.21%
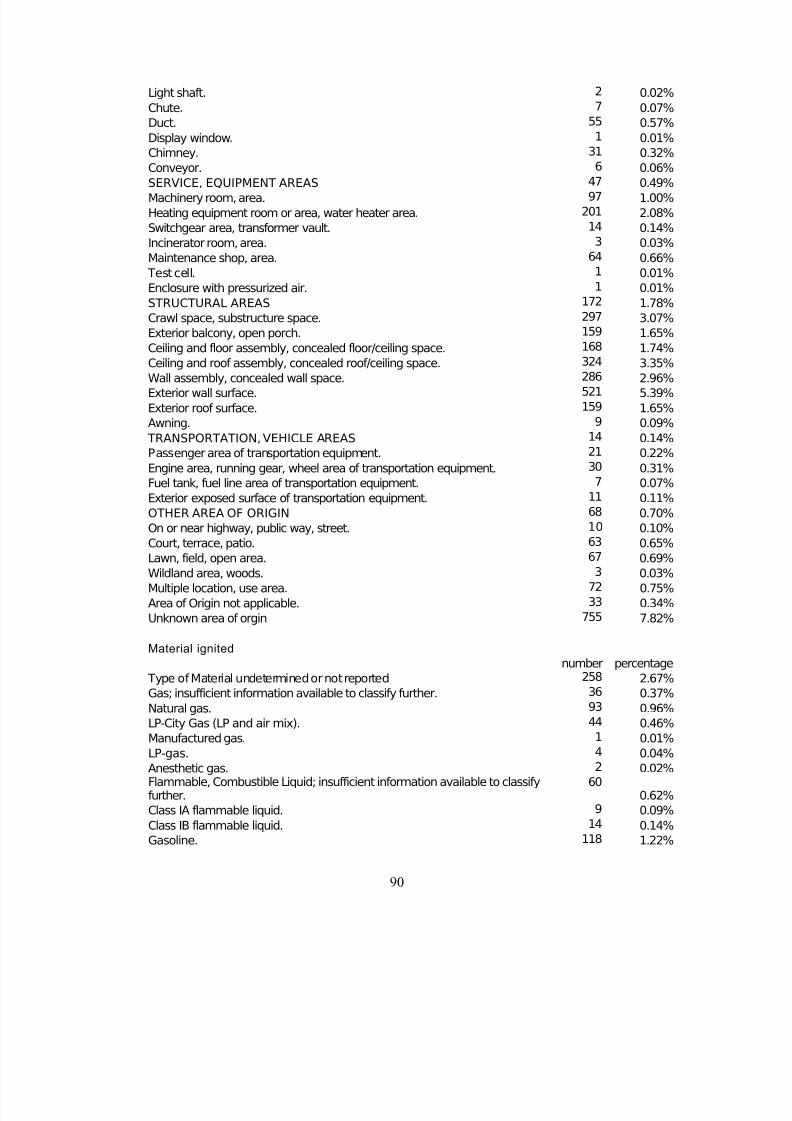
7/28/2019 Vs Iqp Final
http://slidepdf.com/reader/full/vs-iqp-final 101/122
90
Light shaft. 2 0.02%
Chute. 7 0.07%
Duct. 55 0.57%
Display window. 1 0.01%
Chimney. 31 0.32%
Conveyor. 6 0.06%
SERVICE, EQUIPMENT AREAS 47 0.49%Machinery room, area. 97 1.00%
Heating equipment room or area, water heater area. 201 2.08%
Switchgear area, transformer vault. 14 0.14%
Incinerator room, area. 3 0.03%
Maintenance shop, area. 64 0.66%
Test cell. 1 0.01%
Enclosure with pressurized air. 1 0.01%
STRUCTURAL AREAS 172 1.78%
Crawl space, substructure space. 297 3.07%
Exterior balcony, open porch. 159 1.65%
Ceiling and floor assembly, concealed floor/ceiling space. 168 1.74%
Ceiling and roof assembly, concealed roof/ceiling space. 324 3.35%Wall assembly, concealed wall space. 286 2.96%
Exterior wall surface. 521 5.39%
Exterior roof surface. 159 1.65%
Awning. 9 0.09%
TRANSPORTATION, VEHICLE AREAS 14 0.14%
Passenger area of transportation equipment. 21 0.22%
Engine area, running gear, wheel area of transportation equipment. 30 0.31%
Fuel tank, fuel line area of transportation equipment. 7 0.07%
Exterior exposed surface of transportation equipment. 11 0.11%
OTHER AREA OF ORIGIN 68 0.70%
On or near highway, public way, street. 10 0.10%
Court, terrace, patio. 63 0.65%Lawn, field, open area. 67 0.69%
Wildland area, woods. 3 0.03%
Multiple location, use area. 72 0.75%
Area of Origin not applicable. 33 0.34%
Unknown area of orgin 755 7.82%
Material ignited
number percentage
Type of Material undetermined or not reported 258 2.67%
Gas; insufficient information available to classify further. 36 0.37%
Natural gas. 93 0.96%
LP-City Gas (LP and air mix). 44 0.46%Manufactured gas. 1 0.01%
LP-gas. 4 0.04%
Anesthetic gas. 2 0.02%Flammable, Combustible Liquid; insufficient information available to classifyfurther.
600.62%
Class IA flammable liquid. 9 0.09%
Class IB flammable liquid. 14 0.14%
Gasoline. 118 1.22%

7/28/2019 Vs Iqp Final
http://slidepdf.com/reader/full/vs-iqp-final 102/122
91
Class IC flammable liquid. 9 0.09%
Class II combustible liquid. 28 0.29%
Class IIIA combustible liquid. 12 0.12%
Class IIIB combustible liquid. 112 1.16%
Volatile Solid, Chemical; insufficient information available to classify further 11 0.11%
Fat, grease (food). 143 1.48%
Grease (nonfood). 8 0.08%Polish. 21 0.22%
Adhesive, resin, tar. 21 0.22%
Applied paint, varnish. 29 0.30%
Combustible metal. 12 0.12%
Solid chemical (specify type). 4 0.04%
Polyurethane. 569 5.89%
Natural Product; insufficient information available to classify further. 209 2.16%
Rubber. 27 0.28%
Cork. 1 0.01%
Leather. 2 0.02%
Grass, leaves, hay, straw. 61 0.63%
Grain, natural fiber (pre-process). 7 0.07%Coal, coke, briquettes, peat. 7 0.07%
Food, starch. 78 0.81%
Tobacco. 20 0.21%
Wood, Paper; insufficient information available to classify further. 226 2.34%
Growing wood. 43 0.45%
Felled but unsawn wood. 19 0.20%
Sawn wood. 1146 11.86%
Wood shavings. 165 1.71%
Hardboard, plywood. 164 1.70%
Fiberboard (low density material), wood pulp. 5 0.05%
Paper, untreated, uncoated. 316 3.27%
Cardboard. 101 1.05%Fabric, Textile, Fur; insufficient information available to classify further. 272 2.82%
Man-made fabric, fiber, finished goods. 892 9.23%
Fur, silk, other fabric, finished goods. 6 0.06%
Human hair. 2 0.02%Material Compounded with Oil; insufficient information available to classifyfurther.
260.27%
Oil cloth. 3 0.03%
Asphalt treated material. 27 0.28%
Type of Material not classified above. 1378 14.27%
Structure Type
enclosed building 9404 97.35%open structures 169 1.75%
tent 36 0.37%
open platforms/wharves 29 0.30%
Underground structure work areas 7 0.07%
connective structures 15 0.16%
NFIRs Data 2000

7/28/2019 Vs Iqp Final
http://slidepdf.com/reader/full/vs-iqp-final 103/122
92
Structure Damage
Type of damage number percentage
Minimal 6955 32.03%
Significant 1974 9.09%
Heavy 4765 21.94%
Unknown 8021 36.94%
Area of or ig in
number percentage
MEANS OF EGRESS 376 1.73%
Hallway, corridor, mall. 113 0.52%
Exterior stairway. 97 0.45%
Interior stairway. 77 0.35%
Escalator. 1 0.00%
Lobby, entrance way. 206 0.95%
Means of Egress not classified above. 100 0.46%
ASSEMBLY, SALES AREAS (groups of people) 16 0.07%
Large assembly area with fixed seats (100 or more persons). 14 0.06%
Large open room without fixed seats (100 or more persons). 19 0.09%
Small assembly area with or without fixed seats (less than 100 persons). 42 0.19%
Lounge area. 1295 5.96%
Sales, showroom area. 58 0.27%
Library. 4 0.02%
Swimming pool. 6 0.03%
FUNCTION AREAS 690 3.18%
Sleeping room for under 5 persons. 2104 9.69%
Sleeping area for 5 or more persons. 104 0.48%
Dining area, lunchroom, cafeteria. 69 0.32%
Kitchen, cooking area. 3161 14.56%
Lavatory, locker room, cloakroom. 707 3.26%
Laundry room, area. 904 4.16%
Office. 132 0.61%
Personal service area. 17 0.08%
FUNCTION AREAS 17 0.08%
Laboratory. 23 0.11%
Printing or photographic room, area. 2 0.01%
First aid, treatment room. 2 0.01%
Operating room. 2 0.01%
Electronic equipment room, area. 22 0.10%
Performance, stage area. 3 0.01%
Projection room, area. 1 0.00%
Process, manufacturing area. 172 0.79%
STORAGE AREAS 513 2.36%
Product storage room or area, storage tank, storage bin. 299 1.38%
Closet. 215 0.99%
Supply storage room or area. 326 1.50%
Records storage room, vault. 9 0.04%
Shipping, receiving, loading area. 49 0.23%

7/28/2019 Vs Iqp Final
http://slidepdf.com/reader/full/vs-iqp-final 104/122
93
Trash or rubbish area, container. 69 0.32%
Garage, carport, vehicle storage area. 1054 4.85%
SERVICE FACILITIES 87 0.40%
Elevator, dumb-waiter. 8 0.04%
Utility shaft. 64 0.29%
Light shaft. 4 0.02%
Chute. 11 0.05%Duct. 126 0.58%
Display window. 4 0.02%
Chimney. 113 0.52%
Conveyor. 7 0.03%
SERVICE, EQUIPMENT AREAS 136 0.63%
Machinery room, area. 132 0.61%
Heating equipment room or area, water heater area. 470 2.16%
Switchgear area, transformer vault. 32 0.15%
Incinerator room, area. 4 0.02%
Maintenance shop, area. 113 0.52%
Test cell. 2 0.01%
Enclosure with pressurized air. 1 0.00%STRUCTURAL AREAS 456 2.10%
Crawl space, substructure space. 504 2.32%
Exterior balcony, open porch. 294 1.35%
Ceiling and floor assembly, concealed floor/ceiling space. 379 1.75%
Ceiling and roof assembly, concealed roof/ceiling space. 744 3.43%
Wall assembly, concealed wall space. 645 2.97%
Exterior wall surface. 986 4.54%
Exterior roof surface. 342 1.57%
Awning. 22 0.10%
TRANSPORTATION, VEHICLE AREAS 33 0.15%
Passenger area of transportation equipment. 21 0.10%
Trunk, load carrying area of transportation equipment. 3 0.01%Engine area, running gear, wheel area of transportation equipment. 56 0.26%
Fuel tank, fuel line area of transportation equipment. 13 0.06%
Exterior exposed surface of transportation equipment. 40 0.18%
OTHER AREA OF ORIGIN 269 1.24%
On or near railroad right of way, embankment. 5 0.02%
On or near highway, public way, street. 11 0.05%
Court, terrace, patio. 147 0.68%
Lawn, field, open area. 145 0.67%
Wildland area, woods. 19 0.09%
Multiple location, use area. 21 0.10%
Area of Origin not applicable. 166 0.76%
Unknown area of origin 1860 8.57%
Material Ignited
number percent
Unknown 21131 97.31%
Gas; insufficient information available to classify further. 94 0.43%
Natural gas. 158 0.73%
LP-City Gas (LP and air mix). 93 0.43%

7/28/2019 Vs Iqp Final
http://slidepdf.com/reader/full/vs-iqp-final 105/122
94
Manufactured gas. 1 0.00%
LP-gas. 12 0.06%
Anesthetic gas. 3 0.01%Flammable, Combustible Liquid; insufficient information available to classifyfurther.
1540.71%
Class IA flammable liquid. 21 0.10%
Class IB flammable liquid. 5 0.02%Gasoline. 273 1.26%
Class IC flammable liquid. 24 0.11%
Class II combustible liquid. 66 0.30%
Class IIIA combustible liquid. 8 0.04%
Class IIIB combustible liquid. 353 1.63%
Volatile Solid, Chemical; insufficient information available to classify further 20 0.09%
Fat, grease (food). 414 1.91%
Grease (nonfood). 5 0.02%
Polish. 50 0.23%
Adhesive, resin, tar. 57 0.26%
Applied paint, varnish. 34 0.16%
Combustible metal. 22 0.10%Solid chemical (specify type). 10 0.05%
Polyurethane. 1353 6.23%
Natural Product; insufficient information available to classify further. 369 1.70%
Rubber. 78 0.36%
Cork. 2 0.01%
Leather. 6 0.03%
Grass, leaves, hay, straw. 170 0.78%
Grain, natural fiber (pre-process). 24 0.11%
Coal, coke, briquettes, peat. 5 0.02%
Food, starch. 208 0.96%
Tobacco. 19 0.09%
Wood, Paper; insufficient information available to classify further. 609 2.80%Growing wood. 101 0.47%
Felled but unsawn wood. 48 0.22%
Sawn wood. 2846 13.11%
Wood shavings. 387 1.78%
Hardboard, plywood. 529 2.44%
Fiberboard (low density material), wood pulp. 17 0.08%
Paper, untreated, uncoated. 600 2.76%
Cardboard. 217 1.00%
Fabric, Textile, Fur; insufficient information available to classify further. 389 1.79%
Man-made fabric, fiber, finished goods. 2332 10.74%
Fur, silk, other fabric, finished goods. 10 0.05%
Wig. 2 0.01%Human hair. 7 0.03%Material Compounded with Oil; insufficient information available to classifyfurther.
570.26%
Linoleum. 19 0.09%
Oil cloth. 4 0.02%
Asphalt treated material. 62 0.29%
Type of Material not classified above. 490 2.26%

7/28/2019 Vs Iqp Final
http://slidepdf.com/reader/full/vs-iqp-final 106/122
95
Structure type
Enclosed building 21035 96.87%
open structure 504 2.32%
tent 24 0.11%
open platform 44 0.20%
underground structure work areas 10 0.05%connective structure 98 0.45%
NFIRs Data 2001
Structure Damage
damage type number percentage
Minimum 17252 30.34
Significant 5441 9.57
Heavy 14712 25.87
Unknown/not reported 19464 34.23
Area of or ig in
number percentage
Unknown 5495 9.66
Hallway, corridor, mall. 226 0.40
Exterior stairway. 258 0.45
Interior stairway. 255 0.45
Escalator. 7 0.01
Lobby, entrance way. 460 0.81
Means of Egress not classified above. 296 0.52
ASSEMBLY, SALES AREAS (groups of people) 79 0.14
Large assembly area with fixed seats (100 or more persons). 41 0.07
Large open room without fixed seats (100 or more persons). 47 0.08
Small assembly area with or without fixed seats (less than 100 persons). 126 0.22
Lounge area. 3001 5.28
Sales, showroom area. 193 0.34
Library. 7 0.01
Swimming pool. 11 0.02
Assembly, Sales Areas not classified above. 1922 3.38
FUNCTION AREAS 5442 9.57
Sleeping room for under 5 persons. 149 0.26
Sleeping area for 5 or more persons. 162 0.28
Dining area, lunchroom, cafeteria. 8870 15.60
Kitchen, cooking area. 1709 3.01
Lavatory, locker room, cloakroom. 2349 4.13
Laundry room, area. 373 0.66
Office. 39 0.07
Personal service area. 41 0.07
FUNCTION AREAS 29 0.05
Laboratory. 11 0.02
Printing or photographic room, area. 3 0.01
First aid, treatment room. 32 0.06
Electronic equipment room, area. 8 0.01

7/28/2019 Vs Iqp Final
http://slidepdf.com/reader/full/vs-iqp-final 107/122
96
Performance, stage area. 2 0.00
Projection room, area. 386 0.68
Process, manufacturing area. 1273 2.24
STORAGE AREAS 666 1.17
Product storage room or area, storage tank, storage bin. 574 1.01
Closet. 782 1.38
Supply storage room or area. 34 0.06Records storage room, vault. 79 0.14
Shipping, receiving, loading area. 246 0.43
Trash or rubbish area, container. 2701 4.75
Garage, carport, vehicle storage area. 198 0.35
SERVICE FACILITIES 23 0.04
Elevator, dumb-waiter. 163 0.29
Utility shaft. 6 0.01
Light shaft. 44 0.08
Chute. 362 0.64
Duct. 7 0.01
Display window. 401 0.71
Chimney. 37 0.07Conveyor. 465 0.82
SERVICE, EQUIPMENT AREAS 271 0.48
Machinery room, area. 1090 1.92
Heating equipment room or area, water heater area. 130 0.23
Switchgear area, transformer vault. 16 0.03
Incinerator room, area. 327 0.58
Maintenance shop, area. 5 0.01
Test cell. 10 0.02
Enclosure with pressurized air. 1099 1.93
STRUCTURAL AREAS 1326 2.33
Crawl space, substructure space. 880 1.55
Exterior balcony, open porch. 798 1.40Ceiling and floor assembly, concealed floor/ceiling space. 2034 3.58
Ceiling and roof assembly, concealed roof/ceiling space. 1814 3.19
Wall assembly, concealed wall space. 2513 4.42
Exterior wall surface. 964 1.70
Exterior roof surface. 63 0.11
Awning. 118 0.21
TRANSPORTATION, VEHICLE AREAS 77 0.14
Passenger area of transportation equipment. 26 0.05
Trunk, load carrying area of transportation equipment. 242 0.43
Engine area, running gear, wheel area of transportation equipment. 22 0.04
Fuel tank, fuel line area of transportation equipment. 4 0.01
Operating, control area of transportation equipment. 152 0.27Exterior exposed surface of transportation equipment. 811 1.43
OTHER AREA OF ORIGIN 19 0.03
On or near railroad right of way, embankment. 147 0.26
On or near highway, public way, street. 412 0.72
Court, terrace, patio. 517 0.91
Lawn, field, open area. 38 0.07
Wildland area, woods. 68 0.12

7/28/2019 Vs Iqp Final
http://slidepdf.com/reader/full/vs-iqp-final 108/122
97
Multiple location, use area. 496 0.87
Area of Origin not applicable. 289 0.51
Type of Materials ignited
number percentage
Gas; insufficient information available to classify further. 220 0.39
Natural gas. 366 0.64LP-City Gas (LP and air mix). 238 0.42
Manufactured gas. 3 0.01
LP-gas. 38 0.07
Anesthetic gas. 5 0.01Flammable, Combustible Liquid; insufficient information available toclassify further.
4610.81
Class IA flammable liquid. 31 0.05
Class IB flammable liquid. 7 0.01
Gasoline. 666 1.17
Class IC flammable liquid. 51 0.09
Class II combustible liquid. 148 0.26
Class IIIA combustible liquid. 26 0.05Class IIIB combustible liquid. 1258 2.21Volatile Solid, Chemical; insufficient information available to classifyfurther
420.07
Fat, grease (food). 1063 1.87
Grease (nonfood). 8 0.01
Polish. 131 0.23
Adhesive, resin, tar. 129 0.23
Applied paint, varnish. 102 0.18
Combustible metal. 47 0.08
Solid chemical (specify type). 15 0.03
Polyurethane. 3839 6.75
Natural Product; insufficient information available to classify further. 734 1.29Rubber. 168 0.30
Cork. 3 0.01
Leather. 12 0.02
Grass, leaves, hay, straw. 408 0.72
Grain, natural fiber (pre-process). 64 0.11
Coal, coke, briquettes, peat. 32 0.06
Food, starch. 640 1.13
Tobacco. 52 0.09
Wood, Paper; insufficient information available to classify further. 1578 2.77
Growing wood. 280 0.49
Felled but unsawn wood. 135 0.24
Sawn wood. 7076 12.44Wood shavings. 1061 1.87
Hardboard, plywood. 1347 2.37
Fiberboard (low density material), wood pulp. 40 0.07
Paper, untreated, uncoated. 1554 2.73
Cardboard. 517 0.91
Fabric, Textile, Fur; insufficient information available to classify further. 1005 1.77
Man-made fabric, fiber, finished goods. 6147 10.81
Fur, silk, other fabric, finished goods. 28 0.05

7/28/2019 Vs Iqp Final
http://slidepdf.com/reader/full/vs-iqp-final 109/122
98
Wig. 1 0.00
Human hair. 8 0.01
Fabric, Textile, Fur not classified above. 89 0.16Material Compounded with Oil; insufficient information available to classifyfurther.
1300.23
Linoleum. 37 0.07
Oil cloth. 12 0.02Asphalt treated material. 202 0.36
Type of Material not classified above. 1437 2.53
Structure Type
Enclosed building 55183 97.04
open structure 1202 2.11
tent 29 0.05
open platform 172 0.30
underground structure work areas 32 0.06
connective structure 251 0.44
NFIRs Data 2002
Structure Damage
damages number percentage
Minimum 25033 31.89283
significant 7501 9.55651
heavy 15834 20.17301
unknown 30123 38.37765
Area of or ig in
number percentage
Hallway, corridor, mall. 334 0.425526
Exterior stairway. 383 0.487954
Interior stairway. 313 0.398772
Escalator. 5 0.00637
Lobby, entrance way. 623 0.793722
Means of Egress not classified above. 495 0.630646
ASSEMBLY, SALES AREAS (groups of people) 108 0.137595
Large assembly area with fixed seats (100 or more persons). 40 0.050961
Large open room without fixed seats (100 or more persons). 47 0.059879
Small assembly area with or without fixed seats (less than 100 persons). 185 0.235696
Lounge area. 3794 4.833675
Sales, showroom area. 222 0.282835
Library. 16 0.020385
Swimming pool. 10 0.01274
FUNCTION AREAS 2760 3.516327
Sleeping room for under 5 persons. 7577 9.653336

7/28/2019 Vs Iqp Final
http://slidepdf.com/reader/full/vs-iqp-final 110/122
99
Sleeping area for 5 or more persons. 273 0.347811
Dining area, lunchroom, cafeteria. 136 0.173268
Kitchen, cooking area. 12627 16.08719
Lavatory, locker room, cloakroom. 2484 3.164694
Laundry room, area. 3238 4.125314
Office. 534 0.680333
Personal service area. 69 0.087908FUNCTION AREAS 80 0.101923
Laboratory. 55 0.070072
Printing or photographic room, area. 16 0.020385
First aid, treatment room. 10 0.01274
Operating room. 7 0.008918
Electronic equipment room, area. 60 0.076442
Performance, stage area. 6 0.007644
Projection room, area. 4 0.005096
Process, manufacturing area. 611 0.778433
STORAGE AREAS 1849 2.355684
Product storage room or area, storage tank, storage bin. 837 1.066364
Closet. 830 1.057446Supply storage room or area. 958 1.220522
Records storage room, vault. 46 0.058605
Shipping, receiving, loading area. 162 0.206393
Trash or rubbish area, container. 203 0.258628
Garage, carport, vehicle storage area. 3570 4.548292
SERVICE FACILITIES 263 0.33507
Elevator, dumb-waiter. 19 0.024207
Utility shaft. 253 0.32233
Light shaft. 11 0.014014
Chute. 68 0.086634
Duct. 569 0.724924
Display window. 19 0.024207Chimney. 141 0.179638
Conveyor. 35 0.044591
SERVICE, EQUIPMENT AREAS 757 0.964442
Machinery room, area. 413 0.526175
Heating equipment room or area, water heater area. 1676 2.135277
Switchgear area, transformer vault. 149 0.189831
Incinerator room, area. 32 0.040769
Maintenance shop, area. 411 0.523627
Test cell. 10 0.01274
Enclosure with pressurized air. 11 0.014014
STRUCTURAL AREAS 1751 2.230829
Crawl space, substructure space. 1584 2.018066Exterior balcony, open porch. 1325 1.688092
Ceiling and floor assembly, concealed floor/ceiling space. 1242 1.582347
Ceiling and roof assembly, concealed roof/ceiling space. 2914 3.712528
Wall assembly, concealed wall space. 2746 3.49849
Exterior wall surface. 3330 4.242525
Exterior roof surface. 1352 1.72249
Awning. 93 0.118485

7/28/2019 Vs Iqp Final
http://slidepdf.com/reader/full/vs-iqp-final 111/122
100
TRANSPORTATION, VEHICLE AREAS 179 0.228052
Passenger area of transportation equipment. 63 0.080264
Trunk, load carrying area of transportation equipment. 23 0.029303
Engine area, running gear, wheel area of transportation equipment. 192 0.244614
Fuel tank, fuel line area of transportation equipment. 38 0.048413
Operating, control area of transportation equipment. 3 0.003822
Exterior exposed surface of transportation equipment. 247 0.314686OTHER AREA OF ORIGIN 1268 1.615472
On or near railroad right of way, embankment. 14 0.017836
On or near highway, public way, street. 57 0.07262
Court, terrace, patio. 572 0.728746
Lawn, field, open area. 397 0.50579
Wildland area, woods. 32 0.040769
Multiple location, use area. 77 0.0981
Area of Origin not applicable. 493 0.628097
Area of origin unknown 8085 10.30054
Material Ignited
number percentageNatural gas. 347 0.442089
LP-City Gas (LP and air mix). 476 0.606439
Manufactured gas. 265 0.337618
LP-gas. 1 0.001274
Anesthetic gas. 26 0.033125Flammable, Combustible Liquid; insufficient information available toclassify further.
50.00637
Class IA flammable liquid. 696 0.886726
Class IB flammable liquid. 28 0.035673
Gasoline. 5 0.00637
Class IC flammable liquid. 846 1.077831
Class II combustible liquid. 88 0.112115Class IIIA combustible liquid. 213 0.271369
Class IIIB combustible liquid. 31 0.039495Volatile Solid, Chemical; insufficient information available to classifyfurther
18942.413016
Fat, grease (food). 57 0.07262
Grease (nonfood). 1526 1.944172
Polish. 13 0.016562
Adhesive, resin, tar. 212 0.270095
Applied paint, varnish. 182 0.231874
Combustible metal. 140 0.178364
Solid chemical (specify type). 42 0.053509
Polyurethane. 21 0.026755Rubber. 5416 6.900154
Cork. 966 1.230714
Leather. 262 0.333796
Grass, leaves, hay, straw. 5 0.00637
Grain, natural fiber (pre-process). 12 0.015288
Coal, coke, briquettes, peat. 589 0.750405
Food, starch. 93 0.118485
Tobacco. 65 0.082812

7/28/2019 Vs Iqp Final
http://slidepdf.com/reader/full/vs-iqp-final 112/122
101
Wood, Paper; insufficient information available to classify further. 865 1.102037
Growing wood. 59 0.075168
Felled but unsawn wood. 2413 3.074238
Sawn wood. 385 0.490502
Wood shavings. 196 0.24971
Hardboard, plywood. 9733 12.40015
Fiberboard (low density material), wood pulp. 1535 1.955638Paper, untreated, uncoated. 2008 2.558255
Cardboard. 65 0.082812
Fabric, Textile, Fur; insufficient information available to classify further. 2022 2.576092
Man-made fabric, fiber, finished goods. 700 0.891822
Fur, silk, other fabric, finished goods. 1294 1.648597
Wig. 8461 10.77958
Human hair. 47 0.059879
Fabric, Textile, Fur not classified above. 2 0.002548Material Compounded with Oil; insufficient information available to classifyfurther.
10.001274
Linoleum. 143 0.182186
Asphalt treated material. 152 0.193653 Type of Material not classified above. 2252 2.869119
Unknown 31636 40.30526
structure type
type number percentage
Enclosed building 75964 96.78052
open structure 1671 2.128906
tent 30 0.038221
open platform 253 0.32233
underground structure work areas 57 0.07262
connective structure 516 0.6574
NFIRs Data 2003
Structure Damage
damages number percentage
Minimum 34774 30.96996
Significant 10344 9.212436
Heavy 22455 19.99858
Uknown 44710 39.81903
Areas of origin
number percent
MEANS OF EGRESS 2266 2.018115
Hallway, corridor, mall. 522 0.464897
Exterior stairway. 496 0.441741
Interior stairway. 636 0.566426
Escalator. 20 0.017812
Lobby, entrance way. 911 0.811343
Means of Egress not classified above. 799 0.711595
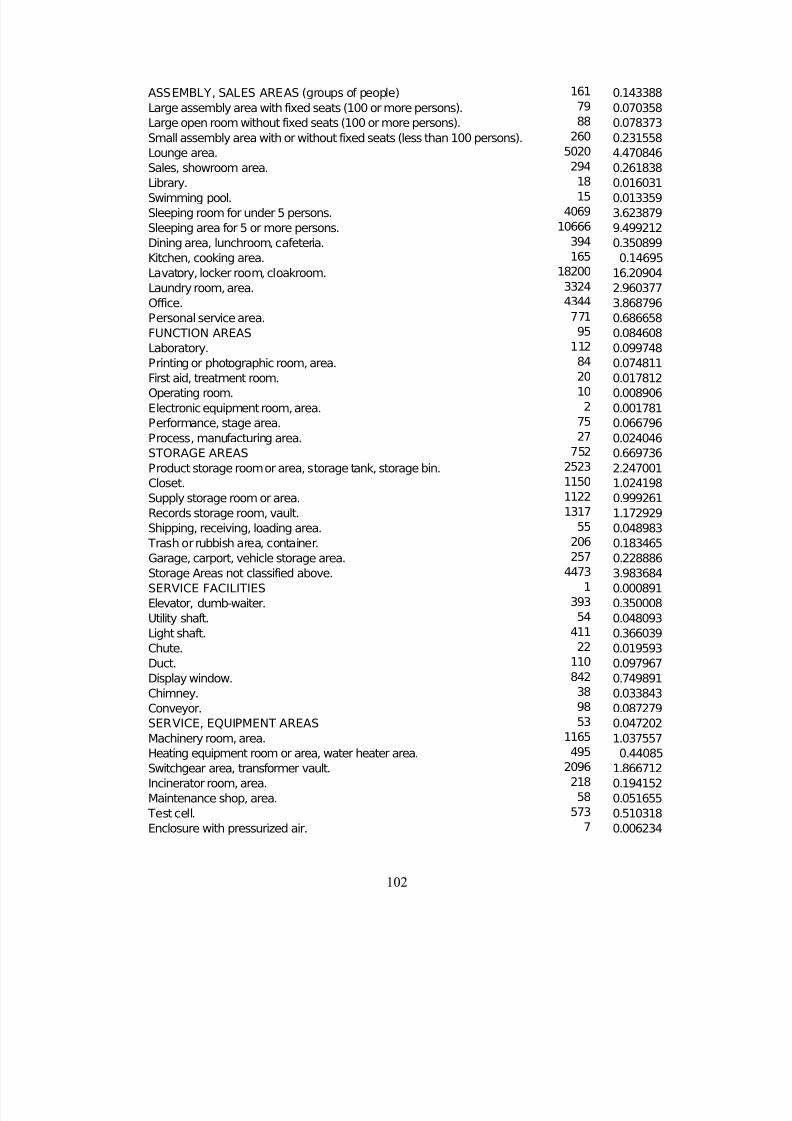
7/28/2019 Vs Iqp Final
http://slidepdf.com/reader/full/vs-iqp-final 113/122
102
ASSEMBLY, SALES AREAS (groups of people) 161 0.143388
Large assembly area with fixed seats (100 or more persons). 79 0.070358
Large open room without fixed seats (100 or more persons). 88 0.078373
Small assembly area with or without fixed seats (less than 100 persons). 260 0.231558
Lounge area. 5020 4.470846
Sales, showroom area. 294 0.261838
Library. 18 0.016031Swimming pool. 15 0.013359
Sleeping room for under 5 persons. 4069 3.623879
Sleeping area for 5 or more persons. 10666 9.499212
Dining area, lunchroom, cafeteria. 394 0.350899
Kitchen, cooking area. 165 0.14695
Lavatory, locker room, cloakroom. 18200 16.20904
Laundry room, area. 3324 2.960377
Office. 4344 3.868796
Personal service area. 771 0.686658
FUNCTION AREAS 95 0.084608
Laboratory. 112 0.099748
Printing or photographic room, area. 84 0.074811First aid, treatment room. 20 0.017812
Operating room. 10 0.008906
Electronic equipment room, area. 2 0.001781
Performance, stage area. 75 0.066796
Process, manufacturing area. 27 0.024046
STORAGE AREAS 752 0.669736
Product storage room or area, storage tank, storage bin. 2523 2.247001
Closet. 1150 1.024198
Supply storage room or area. 1122 0.999261
Records storage room, vault. 1317 1.172929
Shipping, receiving, loading area. 55 0.048983
Trash or rubbish area, container. 206 0.183465Garage, carport, vehicle storage area. 257 0.228886
Storage Areas not classified above. 4473 3.983684
SERVICE FACILITIES 1 0.000891
Elevator, dumb-waiter. 393 0.350008
Utility shaft. 54 0.048093
Light shaft. 411 0.366039
Chute. 22 0.019593
Duct. 110 0.097967
Display window. 842 0.749891
Chimney. 38 0.033843
Conveyor. 98 0.087279
SERVICE, EQUIPMENT AREAS 53 0.047202Machinery room, area. 1165 1.037557
Heating equipment room or area, water heater area. 495 0.44085
Switchgear area, transformer vault. 2096 1.866712
Incinerator room, area. 218 0.194152
Maintenance shop, area. 58 0.051655
Test cell. 573 0.510318
Enclosure with pressurized air. 7 0.006234

7/28/2019 Vs Iqp Final
http://slidepdf.com/reader/full/vs-iqp-final 114/122
103
Enclosure with enriched oxygen atmosphere. 20 0.017812
STRUCTURAL AREAS 1 0.000891
Crawl space, substructure space. 2506 2.231861
Exterior balcony, open porch. 2129 1.896102
Ceiling and floor assembly, concealed floor/ceiling space. 1700 1.514032
Ceiling and roof assembly, concealed roof/ceiling space. 1875 1.669888
Wall assembly, concealed wall space. 3719 3.312167Exterior wall surface. 3539 3.151857
Exterior roof surface. 4219 3.75747
Awning. 1674 1.490876
TRANSPORTATION, VEHICLE AREAS 156 0.138935
Passenger area of transportation equipment. 238 0.211964
Trunk, load carrying area of transportation equipment. 72 0.064124
Engine area, running gear, wheel area of transportation equipment. 30 0.026718
Fuel tank, fuel line area of transportation equipment. 215 0.19148
Operating, control area of transportation equipment. 59 0.052546
Exterior exposed surface of transportation equipment. 3 0.002672
OTHER AREA OF ORIGIN 302 0.268963
On or near railroad right of way, embankment. 1763 1.57014On or near highway, public way, street. 9 0.008015
Court, terrace, patio. 71 0.063233
Lawn, field, open area. 680 0.605613
Wildland area, woods. 466 0.415023
Multiple location, use area. 53 0.047202
Area of Origin not applicable. 13059 11.63043
Unknown 1293 1.151555
Material Ignited
number percentage
Type of Material undetermined or not reported 3884 3.459117
Gas; insufficient information available to classify further. 467 0.415913Natural gas. 646 0.575332
LP-City Gas (LP and air mix). 383 0.341102
Manufactured gas. 1 0.000891
LP-gas. 60 0.053436
Anesthetic gas. 9 0.008015Flammable, Combustible Liquid; insufficient information available toclassify further.
9120.812233
Class IA flammable liquid. 39 0.034734
Class IB flammable liquid. 13 0.011578
Gasoline. 1084 0.965418
Class IC flammable liquid. 104 0.092623
Class II combustible liquid. 291 0.259167Class IIIA combustible liquid. 40 0.035624
Class IIIB combustible liquid. 2614 2.328046Volatile Solid, Chemical; insufficient information available to classifyfurther
890.079264
Fat, grease (food). 1967 1.751824
Grease (nonfood). 12 0.010687
Polish. 233 0.207511
Adhesive, resin, tar. 192 0.170996

7/28/2019 Vs Iqp Final
http://slidepdf.com/reader/full/vs-iqp-final 115/122
104
Applied paint, varnish. 201 0.179012
Combustible metal. 63 0.056108
Solid chemical (specify type). 24 0.021375
Polyurethane. 7130 6.350026
Natural Product; insufficient information available to classify further. 1212 1.079415
Rubber. 334 0.297463
Cork. 7 0.006234Leather. 18 0.016031
Grass, leaves, hay, straw. 678 0.603831
Grain, natural fiber (pre-process). 79 0.070358
Coal, coke, briquettes, peat. 63 0.056108
Food, starch. 1249 1.112368
Tobacco. 77 0.068577
Wood, Paper; insufficient information available to classify further. 3241 2.886457
Growing wood. 484 0.431054
Felled but unsawn wood. 284 0.252932
Sawn wood. 12594 11.2163
Wood shavings. 2285 2.035036
Hardboard, plywood. 2655 2.364561Fiberboard (low density material), wood pulp. 68 0.060561
Paper, untreated, uncoated. 2546 2.267485
Cardboard. 954 0.849639
Fabric, Textile, Fur; insufficient information available to classify further. 1702 1.515813
Man-made fabric, fiber, finished goods. 11221 9.993499
Fur, silk, other fabric, finished goods. 48 0.042749
Wig. 2 0.001781
Human hair. 10 0.008906
Fabric, Textile, Fur not classified above. 206 0.183465Material Compounded with Oil; insufficient information available to classifyfurther.
2310.20573
Linoleum. 43 0.038296Oil cloth. 28 0.024937
Asphalt treated material. 288 0.256495
Type of Material not classified above. 3194 2.844598
Structure Typenumber percentage
Enclosed building 108679 96.79025
open structure 2441 2.173971
tent 40 0.035624
open platform 361 0.321509
underground structure work areas 101 0.089951
connective structure 661 0.588691
NFIRs Data 2004
Structure Damage
damages number percentage
Minimum 40261 30.85418
significant 12215 9.361014

7/28/2019 Vs Iqp Final
http://slidepdf.com/reader/full/vs-iqp-final 116/122
105
heavy 26292 20.14898
Unknown 51720 39.63583
Area of or ig in
number percentage
MEANS OF EGRESS 2926 2.242352Hallway, corridor, mall. 711 0.544878
Exterior stairway. 577 0.442186
Interior stairway. 714 0.547177
Escalator. 27 0.020692
Lobby, entrance way. 1013 0.776317
Means of Egress not classified above. 826 0.633008
ASSEMBLY, SALES AREAS (groups of people) 208 0.159402
Large assembly area with fixed seats (100 or more persons). 85 0.06514
Large open room without fixed seats (100 or more persons). 100 0.076635
Small assembly area with or without fixed seats (less than 100 persons). 287 0.219944
Lounge area. 5893 4.516124
Sales, showroom area. 369 0.282785Library. 11 0.00843
Swimming pool. 10 0.007664
FUNCTION AREAS 4610 3.532892
Sleeping room for under 5 persons. 12312 9.43535
Sleeping area for 5 or more persons. 499 0.382411
Dining area, lunchroom, cafeteria. 186 0.142542
Kitchen, cooking area. 21567 16.52796
Lavatory, locker room, cloakroom. 4053 3.106033
Laundry room, area. 5157 3.952088
Office. 932 0.714242
Personal service area. 111 0.085065
FUNCTION AREAS 139 0.106523Laboratory. 94 0.072037
Printing or photographic room, area. 15 0.011495
First aid, treatment room. 17 0.013028
Operating room. 5 0.003832
Electronic equipment room, area. 70 0.053645
Performance, stage area. 23 0.017626
Projection room, area. 4 0.003065
Process, manufacturing area. 899 0.688952
STORAGE AREAS 2789 2.137361
Product storage room or area, storage tank, storage bin. 1262 0.967139
Closet. 1370 1.049905
Supply storage room or area. 1453 1.113512Records storage room, vault. 55 0.042149
Shipping, receiving, loading area. 242 0.185458
Trash or rubbish area, container. 330 0.252897
Garage, carport, vehicle storage area. 5265 4.034854
SERVICE FACILITIES 415 0.318037
Elevator, dumb-waiter. 73 0.055944
Utility shaft. 482 0.369383

7/28/2019 Vs Iqp Final
http://slidepdf.com/reader/full/vs-iqp-final 117/122
106
Light shaft. 25 0.019159
Chute. 105 0.080467
Duct. 927 0.71041
Display window. 44 0.03372
Chimney. 64 0.049047
Conveyor. 93 0.071271
SERVICE, EQUIPMENT AREAS 1283 0.983232Machinery room, area. 613 0.469775
Heating equipment room or area, water heater area. 2430 1.86224
Switchgear area, transformer vault. 257 0.196953
Incinerator room, area. 71 0.054411
Maintenance shop, area. 567 0.434523
Test cell. 14 0.010729
Enclosure with pressurized air. 20 0.015327
STRUCTURAL AREAS 2837 2.174146
Crawl space, substructure space. 2296 1.759549
Exterior balcony, open porch. 2001 1.533474
Ceiling and floor assembly, concealed floor/ceiling space. 2157 1.653026
Ceiling and roof assembly, concealed roof/ceiling space. 4421 3.388051Wall assembly, concealed wall space. 4037 3.093771
Exterior wall surface. 4754 3.643247
Exterior roof surface. 1951 1.495157
Awning. 160 0.122617
TRANSPORTATION, VEHICLE AREAS 256 0.196187
Passenger area of transportation equipment. 92 0.070505
Trunk, load carrying area of transportation equipment. 22 0.01686
Engine area, running gear, wheel area of transportation equipment. 279 0.213813
Fuel tank, fuel line area of transportation equipment. 40 0.030654
Operating, control area of transportation equipment. 5 0.003832
Exterior exposed surface of transportation equipment. 331 0.253663
OTHER AREA OF ORIGIN 2054 1.574091On or near railroad right of way, embankment. 25 0.019159
On or near highway, public way, street. 82 0.062841
Court, terrace, patio. 870 0.666728
Lawn, field, open area. 577 0.442186
Wildland area, woods. 62 0.047514
Multiple location, use area. 159 0.12185
Area of Origin not applicable. 665 0.509625
Uknown 14961 11.46542
Materials ignited
number percentage
Type of Material undetermined or not reported 4638 3.55435Gas; insufficient information available to classify further. 474 0.363252
Natural gas. 761 0.583195
LP-City Gas (LP and air mix). 384 0.29428
Manufactured gas. 2 0.001533
LP-gas. 51 0.039084
Anesthetic gas. 6 0.004598Flammable, Combustible Liquid; insufficient information available toclassify further.
11160.855251

7/28/2019 Vs Iqp Final
http://slidepdf.com/reader/full/vs-iqp-final 118/122
107
Class IA flammable liquid. 39 0.029888
Class IB flammable liquid. 7 0.005364
Gasoline. 1221 0.935718
Class IC flammable liquid. 86 0.065906
Class II combustible liquid. 344 0.263626
Class IIIA combustible liquid. 49 0.037551
Class IIIB combustible liquid. 3146 2.41095Volatile Solid, Chemical; insufficient information available to classifyfurther
1140.087364
Fat, grease (food). 2270 1.739624
Grease (nonfood). 11 0.00843
Polish. 264 0.202317
Adhesive, resin, tar. 198 0.151738
Applied paint, varnish. 190 0.145607
Combustible metal. 77 0.059009
Solid chemical (specify type). 16 0.012262
Radioactive material. 1 0.000766
Polyurethane. 8263 6.332383
Rubber. 1317 1.009288Cork. 388 0.297345
Leather. 8 0.006131
Grass, leaves, hay, straw. 30 0.022991
Grain, natural fiber (pre-process). 717 0.549476
Coal, coke, briquettes, peat. 114 0.087364
Food, starch. 97 0.074336
Tobacco. 1403 1.075195
Wood, Paper; insufficient information available to classify further. 80 0.061308
Growing wood. 3870 2.96579
Felled but unsawn wood. 597 0.457513
Sawn wood. 369 0.282785
Wood shavings. 14173 10.86154Hardboard, plywood. 2571 1.970296
Fiberboard (low density material), wood pulp. 3105 2.379529
Paper, untreated, uncoated. 102 0.078168
Cardboard. 3007 2.304426
Fabric, Textile, Fur; insufficient information available to classify further. 1106 0.847588
Man-made fabric, fiber, finished goods. 2011 1.541138
Fur, silk, other fabric, finished goods. 12972 9.941144
Wig. 49 0.037551
Human hair. 2 0.001533
Fabric, Textile, Fur not classified above. 9 0.006897Material Compounded with Oil; insufficient information available to
classify further.
224
0.171663Linoleum. 233 0.17856
Oil cloth. 51 0.039084
Asphalt treated material. 43 0.032953
Type of Material not classified above. 3854 2.953528
Unknown 19717 15.1102
Structure type

7/28/2019 Vs Iqp Final
http://slidepdf.com/reader/full/vs-iqp-final 119/122
108
number percentage
Enclosed building 126307 96.79587
open structure 2810 2.153455
tent 57 0.043682
open platform 406 0.31114
underground structure work areas 106 0.081234
connective structure 802 0.614616 NFIRs Data (averages 1990-2004)
Area of Origin Average 1990-2004
Means of Egress 3.12975
Assembly, Sales Areas 4.607125
Function Areas (sleeping, kitchen, etc) 24.40539
Function Areas (laboratory, etc.) 3.093394
Storage Areas 15.30354
Service Facilities 2.246183
Service, Equipment Areas 5.436019Structural Areas 13.98335
Transpor tation, Vehicle Areas 9.667235
Other Areas of Origin 17.89068
Type of Material Ignited
Gas 2.218369
Flammable, Combustible Liquid 6.792603
Volatile Solid, Chemical 6.990576
Natural Product 8.137504
Wood, Paper 25.0864
Fabric , Textile, Fur 9.64206
Material Compounded with Oil 1.378411Other, Material not Classified Above 39.754
Area of Origin- Structural Areas
Crawl space, substructure space. 1.28%
Exterior balcony, open porch. 1.10%
Ceiling and floor assembly, concealed floor/ceiling space. 1.24%
Ceiling and roof assembly, concealed roof/ceiling space. 2.50%
Wall assembly, concealed wall space. 1.86%
Exterior wall sur face. 3.03%
Exterior roof sur face. 1.57%
Awning. 0.26%
Structural Areas not classi fied above. 0.63%
Function Areas
Sleeping room for under 5 persons. 4.57%
Sleeping area for 5 or more persons. 1.00%
Dining area, lunchroom, cafeteria. 1.66%
Kitchen, cooking area. 7.52%
Lavatory, locker room, cloakroom. 3.63%
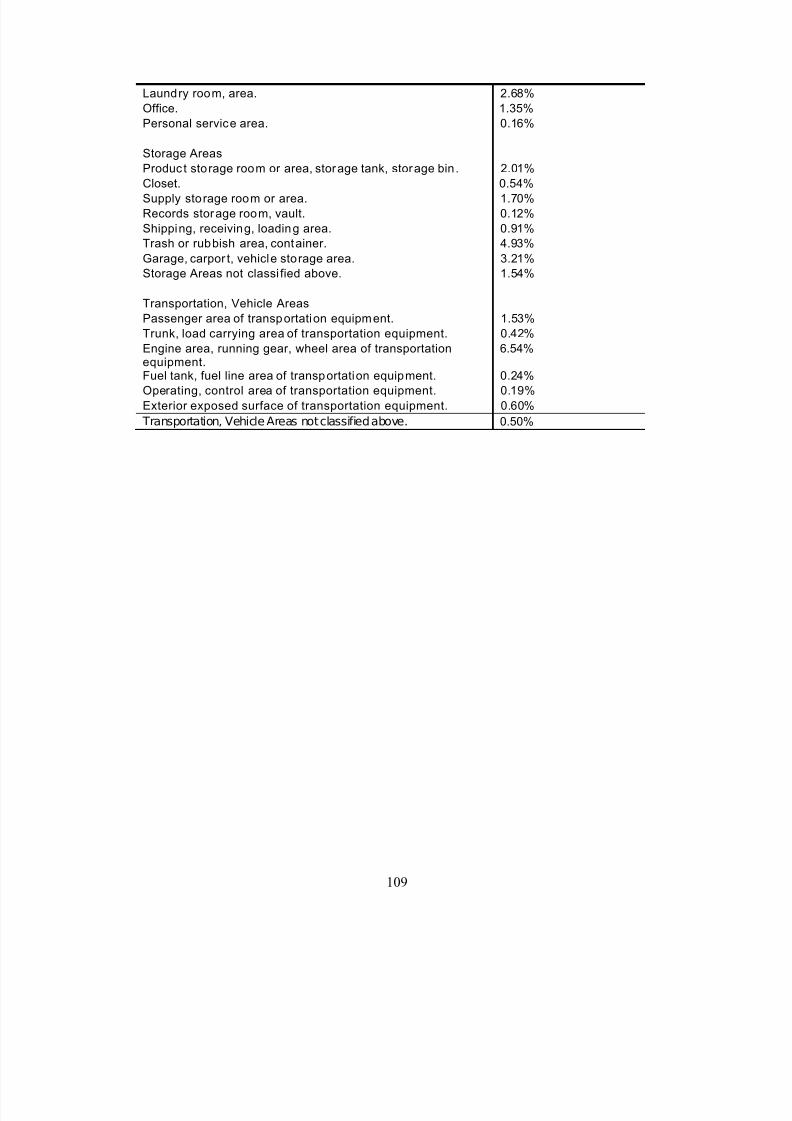
7/28/2019 Vs Iqp Final
http://slidepdf.com/reader/full/vs-iqp-final 120/122
109
Laundry room, area. 2.68%
Office. 1.35%
Personal service area. 0.16%
Storage Areas
Product storage room or area, storage tank, storage bin. 2.01%
Closet. 0.54%
Supply storage room or area. 1.70%
Records storage room, vault. 0.12%
Shipping, receiving, loading area. 0.91%
Trash or rubbish area, container. 4.93%
Garage, carpor t, vehicle storage area. 3.21%
Storage Areas not classi fied above. 1.54%
Transportation, Vehicle Areas
Passenger area of transportation equipment. 1.53%
Trunk, load carrying area of transportation equipment. 0.42%
Engine area, running gear, wheel area of transportation
equipment.
6.54%
Fuel tank, fuel line area of transportation equipment. 0.24%
Operating, control area of transportation equipment. 0.19%
Exterior exposed surface of transportation equipment. 0.60%
Transportation, Vehicle Areas not classified above. 0.50%
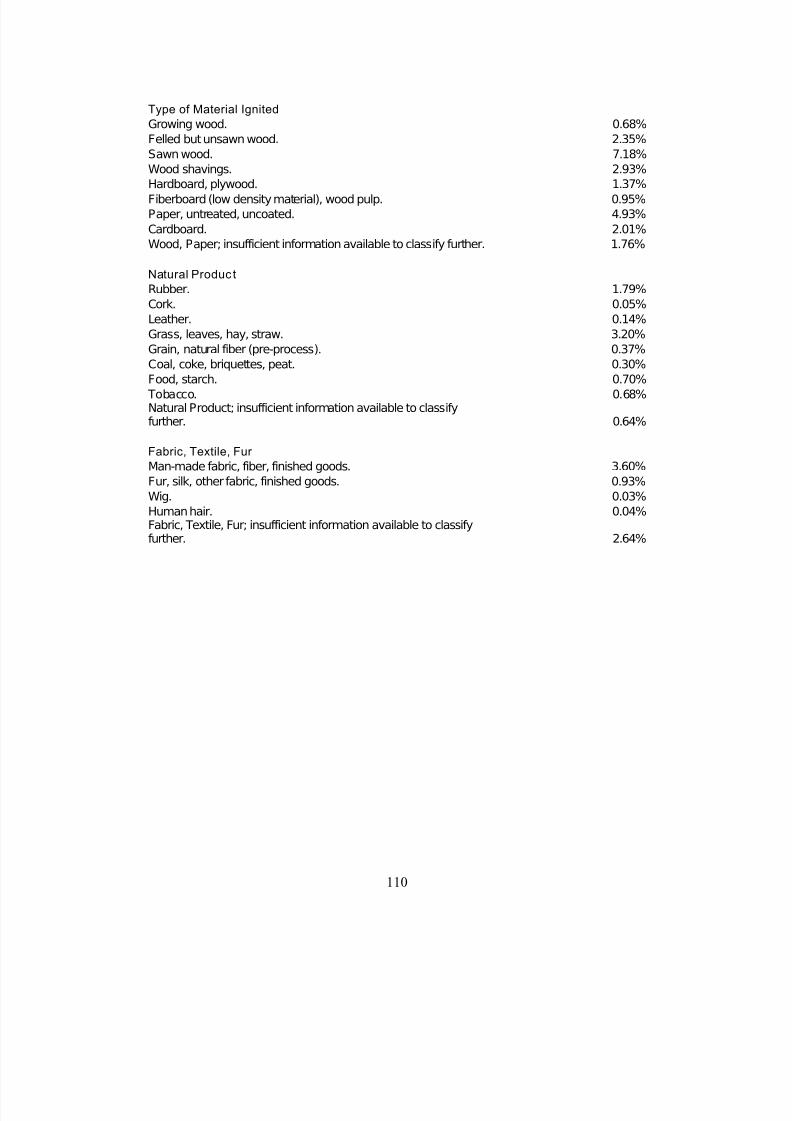
7/28/2019 Vs Iqp Final
http://slidepdf.com/reader/full/vs-iqp-final 121/122
110
Type of Material Ignited
Growing wood. 0.68%
Felled but unsawn wood. 2.35%
Sawn wood. 7.18%
Wood shavings. 2.93%
Hardboard, plywood. 1.37%
Fiberboard (low density material), wood pulp. 0.95%
Paper, untreated, uncoated. 4.93%
Cardboard. 2.01%
Wood, Paper; insufficient information available to classify further. 1.76%
Natural Product
Rubber. 1.79%
Cork. 0.05%
Leather. 0.14%
Grass, leaves, hay, straw. 3.20%
Grain, natural fiber (pre-process). 0.37%
Coal, coke, briquettes, peat. 0.30%
Food, starch. 0.70%
Tobacco. 0.68%Natural Product; insufficient information available to classifyfurther. 0.64%
Fabric, Textile, Fur
Man-made fabric, fiber, finished goods. 3.60%
Fur, silk, other fabric, finished goods. 0.93%
Wig. 0.03%
Human hair. 0.04%Fabric, Textile, Fur; insufficient information available to classify
further. 2.64%
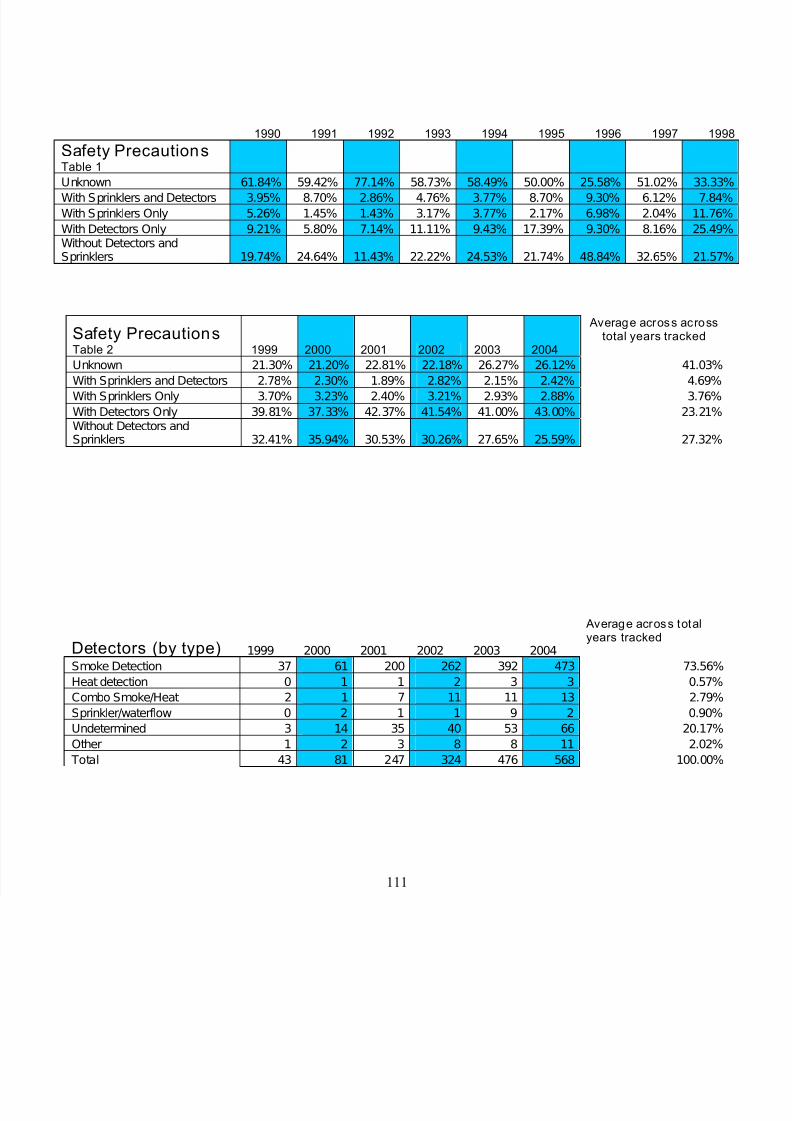
7/28/2019 Vs Iqp Final
http://slidepdf.com/reader/full/vs-iqp-final 122/122
1990 1991 1992 1993 1994 1995 1996 1997 1
Safety PrecautionsTable 1
Unknown 61.84% 59.42% 77.14% 58.73% 58.49% 50.00% 25.58% 51.02% 33.3With Sprinklers and Detectors 3.95% 8.70% 2.86% 4.76% 3.77% 8.70% 9.30% 6.12% 7.8
With Sprinklers Only 5.26% 1.45% 1.43% 3.17% 3.77% 2.17% 6.98% 2.04% 11.7
With Detectors Only 9.21% 5.80% 7.14% 11.11% 9.43% 17.39% 9.30% 8.16% 25.4Without Detectors andSprinklers 19.74% 24.64% 11.43% 22.22% 24.53% 21.74% 48.84% 32.65% 21.5
Safety PrecautionsTable 2 1999 2000 2001 2002 2003 2004
Average across acrostotal years tracked
Unknown 21.30% 21.20% 22.81% 22.18% 26.27% 26.12% 41.03
With Sprinklers and Detectors 2.78% 2.30% 1.89% 2.82% 2.15% 2.42% 4.69
With Sprinklers Only 3.70% 3.23% 2.40% 3.21% 2.93% 2.88% 3.76
With Detectors Only 39.81% 37.33% 42.37% 41.54% 41.00% 43.00% 23.21Without Detectors andSprinklers 32.41% 35.94% 30.53% 30.26% 27.65% 25.59% 27.32