Usefullness of Tissue Doppler in CRT
8
Usefulness of Tissue Doppler Velocity and Strain Dyssynchrony for Predicting Left Ventricular Reverse Remodeling Response After Cardiac Resynchronization Therapy Cheuk-Man Yu, MD a, *, John Gorcsan III, MD b , Gabe B. Bleeker, MD c , Qing Zhang, MD a , Martin J. Schalij, MD, PhD c , Matthew S. Suffoletto, MD b , Jeffrey Wing-Hong Fung, MD a , David Schwartzman, MD b , Yat-Sun Chan, MRCP a , Masaki Tanabe, MD b , and Jeroen J. Bax, MD, PhD c The assessment of systolic dyssynchrony by echocardiography is useful in predicting a favorable response to cardiac resynchronization therapy (CRT). Tissue Doppler velocity and tissue Doppler longitudinal strain have been suggested for this purpose. This study compared parameters of systolic dyssynchrony derived from these 2 imaging modalities for their predictive values of CRT response. Two hundred fifty-six patients from 3 different centers who rece ived CRT were fol lowe d for 6 3 mont hs . Parameters of systolic dyssynchrony based on tissue Doppler velocity and strain imaging were assessed for the prediction of left ventricular (LV) reverse remodeling (reduction of LV end-systolic volume >15%). These included time to peak systolic velocity (or peak strain) of 12 LV segments to calculate the SD (Ts-SD or T-SD), maximal difference in delay (Ts-Diff or T-Diff), and opposite wall delay (Ts-OW or T-OW). The septal-to-lateral delay (Ts-Sep-Lat or T- Sep -Lat) was als o mea sur ed. LV revers e remode lin g, defi ned as imp roveme nt in end - systolic volume >15%, was observed in 141 patients (55%). All 4 tissue velocity parameters predicted LV reverse remodeling, and the areas under the receiver-operating characteristic curves were 0.86, 0.85, 0.84, and 0.79 for Ts-SD, Ts-Diff, Ts-OW, and Ts-Sep-Lat, respec- tively (all p <0.001). The cut-of f values derived from recei ver-op eratin g chara cteri stic curve analysis were 33 ms for Ts-SD, 100 ms for Ts-Diff, 90 ms for Ts-OW, and 60 ms for Ts-Sep-Lat, and their sensitivities were 93%, 92%, 81%, and 70%, with specificities of 78%, 68%, 80%, and 76%, respectively. In contrast, none of the longitudinal strain parameters predicted LV reverse remodeling. The areas under the receiver-operating characteristic curves ran ged from 0. 49 to 0. 53 (al l p NS). The same con cl us ions were obtained in subgroup analyses of QRS duration (120 to 150 vs >150 ms) and ischemic or nonischemic cause of heart failure. In conclusion, parameters of tissue Doppler longitudinal velocity, but not longit udin al strain , predic ted LV rever se remod eling afte r CRT. © 2007 Elsevi er Inc. All rights reserved. (Am J Cardiol 2007;100:1263–1270) Despite the compelling evidence of the benefits of cardiac resynchronization therapy (CRT), the lack of a clinical or reverse remodeling response has been observed in about 1/3 of patients. 1,2 In the past few years, the role of echocardi- ography to assess mechanical dyssynchrony in patients re- ceiving CRT, in particular tissue Doppler imaging (TDI), has undergone continuous exploration. 3–11 TDI is used to examine the time to peak systolic velocity from Ն2 left ventricular (LV) segments to calculate parameters of sys- tolic dyssynchrony. Recently, other TDI postprocessing ap- proaches that calculate longitudinal strain have been explored, although the results of studies have not been uniform, with 1 study reporting a fair correlation with LV reverse remod- eling after CRT and another study reporting a lack of a relation. 12,13 Because the discussion of which echocardio- graphic technique to use continues, in this study, we aimed to compar e parame ters of systoli c dyssync hrony derived from longitudinal tissue Doppler velocity and tissue Dopp- ler strain imaging for the prediction of LV reverse remod- eli ng aft er CRT in a lar ge pat ien t popula tio n, wit h dat a derived from 3 different clinical centers. This large patient sample also per mit ted the evalua tio n of the infl uence of QRS width (Ͼ150 vs 120 to 150 ms) and the cause of heart failu re (ische mic vs nonisch emic) . Methods Two hundred fifty-six patients with heart failure (mean age 65.3 Ϯ 11.2 years; 74% men) who received CRT at 3 different centers were included in the study. The mean follow-up dura- tion was 6 Ϯ 3 months. The inclusion criteria for CRT were compa tible with curre nt guidel ines, including New York a Division of Cardiology, Department of Medicine and Therapeutics, Prince of Wales Hospital, The Chinese University of Hong Kong, Hong Kong; b Cardiovascula r Inst itut e, Univ ersit y of Pitt sbur gh, Pittsbur gh, Pennsylvan ia; and c Department of Cardiology, Leiden University Medical Center, Leiden, The Netherlands. Manuscript received March 27, 2007; revised manuscript received and accepted May 22, 2007. *Corresponding author: Tel: 852-2632-3594; fax: 852-2637-5643. E-mail address: [email protected] (C.-M. Yu). 0002-9149/07/$ – see front matter © 2007 Elsevier Inc. All rights reserved. www.AJConline.org doi:10.1016/j.amjcard.2007.05.060
-
Upload
onon-essayed -
Category
Documents
-
view
220 -
download
0
Transcript of Usefullness of Tissue Doppler in CRT
7/30/2019 Usefullness of Tissue Doppler in CRT
http://slidepdf.com/reader/full/usefullness-of-tissue-doppler-in-crt 1/8
Usefulness of Tissue Doppler Velocity and Strain Dyssynchrony for
Predicting Left Ventricular Reverse Remodeling Response After
Cardiac Resynchronization Therapy
Cheuk-Man Yu, MDa,*, John Gorcsan III, MDb, Gabe B. Bleeker, MDc, Qing Zhang, MDa,Martin J. Schalij, MD, PhDc, Matthew S. Suffoletto, MDb, Jeffrey Wing-Hong Fung, MDa,
David Schwartzman, MDb
, Yat-Sun Chan, MRCPa
, Masaki Tanabe, MDb
, andJeroen J. Bax, MD, PhDc
The assessment of systolic dyssynchrony by echocardiography is useful in predicting afavorable response to cardiac resynchronization therapy (CRT). Tissue Doppler velocityand tissue Doppler longitudinal strain have been suggested for this purpose. This studycompared parameters of systolic dyssynchrony derived from these 2 imaging modalities fortheir predictive values of CRT response. Two hundred fifty-six patients from 3 differentcenters who received CRT were followed for 6 3 months. Parameters of systolicdyssynchrony based on tissue Doppler velocity and strain imaging were assessed for theprediction of left ventricular (LV) reverse remodeling (reduction of LV end-systolic volume>15%). These included time to peak systolic velocity (or peak strain) of 12 LV segments tocalculate the SD (Ts-SD or T-SD), maximal difference in delay (Ts-Diff or T-Diff), and
opposite wall delay (Ts-OW or T-OW). The septal-to-lateral delay (Ts-Sep-Lat or T-Sep-Lat) was also measured. LV reverse remodeling, defined as improvement in end-systolic volume >15%, was observed in 141 patients (55%). All 4 tissue velocity parameterspredicted LV reverse remodeling, and the areas under the receiver-operating characteristiccurves were 0.86, 0.85, 0.84, and 0.79 for Ts-SD, Ts-Diff, Ts-OW, and Ts-Sep-Lat, respec-tively (all p <0.001). The cut-off values derived from receiver-operating characteristiccurve analysis were 33 ms for Ts-SD, 100 ms for Ts-Diff, 90 ms for Ts-OW, and 60 ms forTs-Sep-Lat, and their sensitivities were 93%, 92%, 81%, and 70%, with specificities of 78%,68%, 80%, and 76%, respectively. In contrast, none of the longitudinal strain parameterspredicted LV reverse remodeling. The areas under the receiver-operating characteristiccurves ranged from 0.49 to 0.53 (all p NS). The same conclusions were obtained insubgroup analyses of QRS duration (120 to 150 vs >150 ms) and ischemic or nonischemiccause of heart failure. In conclusion, parameters of tissue Doppler longitudinal velocity, but
not longitudinal strain, predicted LV reverse remodeling after CRT. © 2007 Elsevier Inc.All rights reserved. (Am J Cardiol 2007;100:1263–1270)
Despite the compelling evidence of the benefits of cardiacresynchronization therapy (CRT), the lack of a clinical orreverse remodeling response has been observed in about 1/3of patients.1,2 In the past few years, the role of echocardi-ography to assess mechanical dyssynchrony in patients re-ceiving CRT, in particular tissue Doppler imaging (TDI),has undergone continuous exploration.3–11 TDI is used toexamine the time to peak systolic velocity from Ն2 leftventricular (LV) segments to calculate parameters of sys-
tolic dyssynchrony. Recently, other TDI postprocessing ap-proaches that calculate longitudinal strain have been explored,
although the results of studies have not been uniform, with1 study reporting a fair correlation with LV reverse remod-eling after CRT and another study reporting a lack of arelation.12,13 Because the discussion of which echocardio-graphic technique to use continues, in this study, we aimedto compare parameters of systolic dyssynchrony derivedfrom longitudinal tissue Doppler velocity and tissue Dopp-ler strain imaging for the prediction of LV reverse remod-eling after CRT in a large patient population, with data
derived from 3 different clinical centers. This large patientsample also permitted the evaluation of the influence of QRS width (Ͼ150 vs 120 to 150 ms) and the cause of heartfailure (ischemic vs nonischemic).
Methods
Two hundred fifty-six patients with heart failure (mean age65.3Ϯ 11.2 years; 74% men) who received CRT at 3 differentcenters were included in the study. The mean follow-up dura-tion was 6 Ϯ 3 months. The inclusion criteria for CRT werecompatible with current guidelines, including New York
aDivision of Cardiology, Department of Medicine and Therapeutics,
Prince of Wales Hospital, The Chinese University of Hong Kong, Hong
Kong; bCardiovascular Institute, University of Pittsburgh, Pittsburgh,
Pennsylvania; and cDepartment of Cardiology, Leiden University Medical
Center, Leiden, The Netherlands. Manuscript received March 27, 2007;
revised manuscript received and accepted May 22, 2007.
*Corresponding author: Tel: 852-2632-3594; fax: 852-2637-5643.
E-mail address: [email protected] (C.-M. Yu).
0002-9149/07/$ – see front matter © 2007 Elsevier Inc. All rights reserved. www.AJConline.orgdoi:10.1016/j.amjcard.2007.05.060
7/30/2019 Usefullness of Tissue Doppler in CRT
http://slidepdf.com/reader/full/usefullness-of-tissue-doppler-in-crt 2/8
Figure 1. Ts-OW. In each of the apical (4-, 2-, and 3-chamber) views, the maximal differences in Ts between the opposite wall segments at the basal and
mid levels were identified (sampling points indicted by arrows). Then the largest value among the 3 views was taken as Ts-OW. In this patient, the opposite
wall delays in the 4-, 2-, and 3-chamber views were 110, 90, and 120 ms, respectively. Therefore, the Ts-OW was 120 ms. Ts-SD was 51 ms and Ts-Diff was 130 ms.
1264 The American Journal of Cardiology (www.AJConline.org)
7/30/2019 Usefullness of Tissue Doppler in CRT
http://slidepdf.com/reader/full/usefullness-of-tissue-doppler-in-crt 3/8
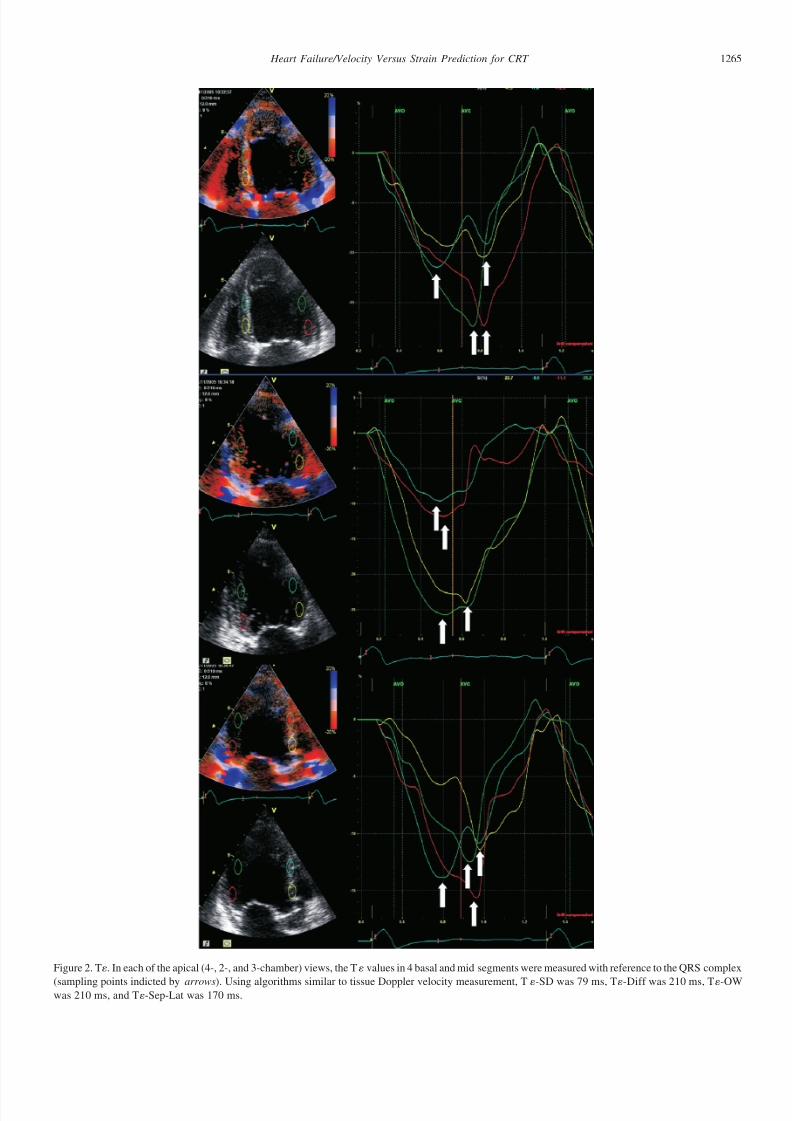
Figure 2. T. In each of the apical (4-, 2-, and 3-chamber) views, the T values in 4 basal and mid segments were measured with reference to the QRS complex
(sampling points indicted by arrows). Using algorithms similar to tissue Doppler velocity measurement, T-SD was 79 ms, T-Diff was 210 ms, T-OWwas 210 ms, and T-Sep-Lat was 170 ms.
1265 Heart Failure/Velocity Versus Strain Prediction for CRT
7/30/2019 Usefullness of Tissue Doppler in CRT
http://slidepdf.com/reader/full/usefullness-of-tissue-doppler-in-crt 4/8
Heart Association class III (88%) or IV (12%) heart failuredespite optimal pharmacologic therapy, evidence of LVsystolic dysfunction (LV ejection fractionϽ35%), and QRSduration Ͼ120 ms. The causes of heart failure were ische-mic in 144 patients (56%) and nonischemic in 112 patients(44%). The study protocol was approved by the ethicscommittees, and informed consent was obtained.
Biventricular devices were implanted as previously de-scribed.1,14 The LV pacing lead was inserted by a transvenousapproach through the coronary sinus and targeted into eitherthe lateral or posterolateral cardiac vein. Conventional rightventricular and right atrial leads were implanted. The choicesof CRT device included InSync, InSync III, InSync Marquis,
and InSync Sentry (Medtronic Inc., Minneapolis, Minnesota),as well as Contak TR, Contak TR II, and Contak CD (GuidantInc., St. Paul, Minnesota).
Standard 2-dimensional and Doppler echocardiographywas performed as previously described,14,15 and all deviceswere programmed in simultaneous biventricular pacingmode. TDI was performed as previously reported (Vivid 7;GE-Vingmed Ultrasound AS, Horten, Norway).8,14 All 3centers had similar echocardiographic facilities for imageacquisition and off-line analysis. During on-line image ac-quisition, Ն3 cardiac cycles were analyzed in a blindedfashion, and average values of the different parameters werederived. The LV volumes and ejection fractions were as-
sessed using the biplane Simpson’s equation in the apical 4-and 2-chamber views. Two-dimensional color-coded TDIwas performed in the 3 apical views (apical 4- and 2-cham-ber and long-axis views) at 2 institutions (n ϭ 174; Princeof Wales Hospital, The Chinese University of Hong Kong,Hong Kong, and the Cardiovascular Institute, University of Pittsburgh, Pittsburgh, Pennsylvania) and in the apical4-chamber view at all institutions to assess longitudinaldynamics, as previously described.6 Images were optimizedfor pulse repetition frequency, color saturation, sector size,and depth and allowed a highest possible frame rate of Ն100 frames/s. Images were analyzed off-line in a blindedfashion (EchoPac-PC version 3.1.3; GE-Vingmed Ultra-
sound AS) using the 6-basal and 6-mid segmental model of the left ventricle, as previously described.4,14 During offline
analysis, a sampling window of 6 ϫ 12 mm was used fortissue Doppler velocity and 12 mm for strain measurements.The ejection interval was determined from aortic valveopening and aortic valve closure from LV outflow tractDoppler, and postsystolic peaks were not included in theanalysis. Tissue synchronization imaging was activated tocolor-coded time to peak velocity in the ejection phase andassisted in placing regions of interest, but dyssynchronyanalysis was performed at the myocardial velocity curvesin all cases.9,16 Regions of interest were placed in the basaland midventricular walls and manually adjusted up and
down and left to right within the segment to create themyocardial velocity curve and determine the region with themost reproducible peaks. The time to peak myocardial sys-tolic velocity during the ejection phase (Ts) was measuredwith reference to the onset of the QRS complex.4,8 Param-eters of systolic dyssynchrony were calculated, including (1)the SD of Ts from 12 LV segments (Ts-SD); (2) the maximaldifference in Ts from 12 LV segments (Ts-Diff); (3) oppositewall delay in Ts from 12 LV segments (Ts-OW) (in thismethod, the largest difference in Ts between opposing wallswas measured in each of the 3 apical views [2 basal and 2 midsegments per view], and the maximal value of delay amongthese 3 views was selected [Figure 1]); and (4) septal-to-lateral
delay in Ts (Ts-Sep-Lat).Tissue Doppler strain imaging was performed by program-
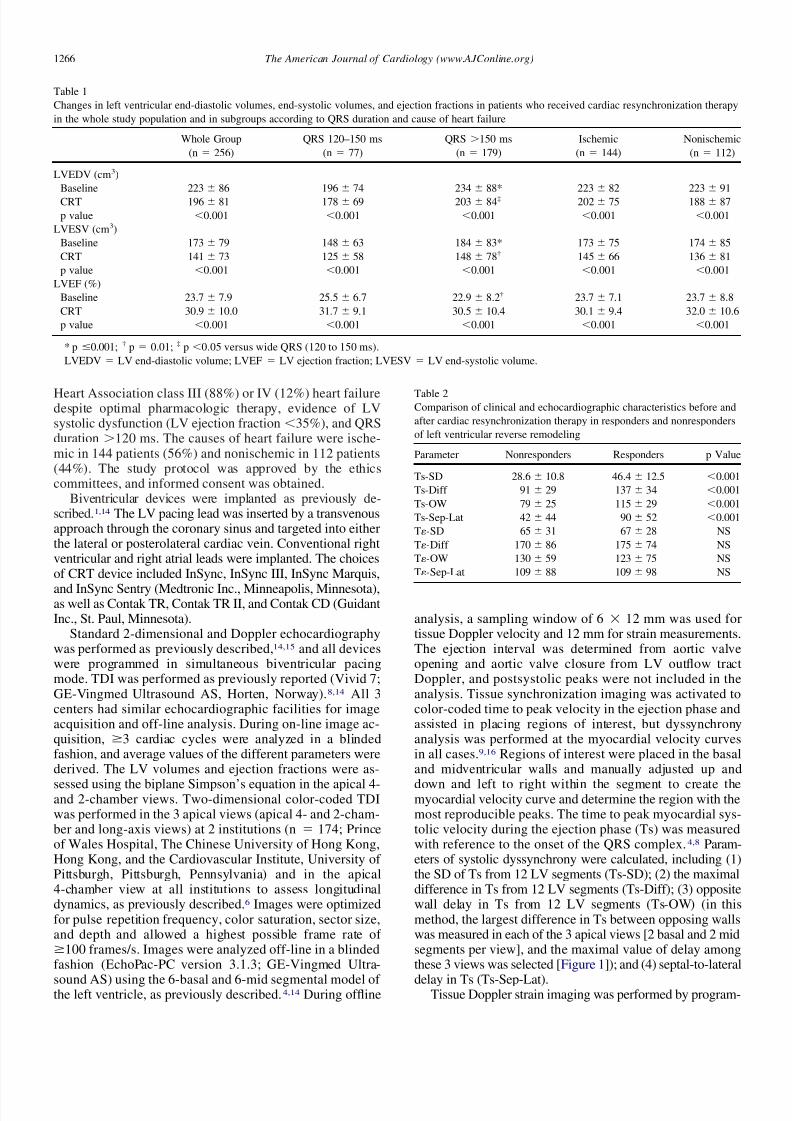
Table 1
Changes in left ventricular end-diastolic volumes, end-systolic volumes, and ejection fractions in patients who received cardiac resynchronization therapy
in the whole study population and in subgroups according to QRS duration and cause of heart failure
Whole Group QRS 120–150 ms QRS Ͼ150 ms Ischemic Nonischemic
(n ϭ 256) (n ϭ 77) (n ϭ 179) (n ϭ 144) (n ϭ 112)
LVEDV (cm3)
Baseline 223Ϯ 86 196Ϯ 74 234Ϯ 88* 223Ϯ 82 223Ϯ 91
CRT 196Ϯ 81 178Ϯ 69 203Ϯ 84‡ 202Ϯ 75 188Ϯ 87
p value Ͻ0.001 Ͻ0.001 Ͻ0.001 Ͻ0.001 Ͻ0.001
LVESV (cm3)
Baseline 173Ϯ 79 148Ϯ 63 184Ϯ 83* 173Ϯ 75 174Ϯ 85
CRT 141Ϯ 73 125Ϯ 58 148Ϯ 78† 145Ϯ 66 136Ϯ 81
p value Ͻ0.001 Ͻ0.001 Ͻ0.001 Ͻ0.001 Ͻ0.001
LVEF (%)
Baseline 23.7Ϯ 7.9 25.5Ϯ 6.7 22.9Ϯ 8.2† 23.7 Ϯ 7.1 23.7Ϯ 8.8
CRT 30.9Ϯ 10.0 31.7Ϯ 9.1 30.5Ϯ 10.4 30.1Ϯ 9.4 32.0Ϯ 10.6
p value Ͻ0.001 Ͻ0.001 Ͻ0.001 Ͻ0.001 Ͻ0.001
* p Յ0.001; † p ϭ 0.01; ‡ p Ͻ0.05 versus wide QRS (120 to 150 ms).
LVEDV ϭ LV end-diastolic volume; LVEF ϭ LV ejection fraction; LVESV ϭ LV end-systolic volume.
Table 2Comparison of clinical and echocardiographic characteristics before and
after cardiac resynchronization therapy in responders and nonresponders
of left ventricular reverse remodeling
Parameter Nonresponders Responders p Value
Ts-SD 28.6Ϯ 10.8 46.4Ϯ 12.5 Ͻ0.001
Ts-Diff 91Ϯ 29 137Ϯ 34 Ͻ0.001
Ts-OW 79Ϯ 25 115Ϯ 29 Ͻ0.001
Ts-Sep-Lat 42Ϯ 44 90Ϯ 52 Ͻ0.001
T-SD 65Ϯ 31 67Ϯ 28 NS
T-Diff 170Ϯ 86 175Ϯ 74 NS
T-OW 130Ϯ 59 123Ϯ 75 NS
T-Sep-Lat 109Ϯ 88 109Ϯ 98 NS
1266 The American Journal of Cardiology (www.AJConline.org)
7/30/2019 Usefullness of Tissue Doppler in CRT
http://slidepdf.com/reader/full/usefullness-of-tissue-doppler-in-crt 5/8
ming the sampling points of 6 ϫ 12 mm at different myocar-dial segments. Tissue strain () was calculated using the for-mula ϭ (LϪ L0)/L0 ϫ 100%, where L is the instantaneouslength and L0 is the original length. The time to peak negativestrain (T) was measured. Using methods similar to that of longitudinal tissue Doppler velocity, parameters of systolicdyssynchrony were measured (Figure 2), including (1) the SD
of T in the LV segments (T-SD); (2) the maximal differencein T in the LV segments (T-Diff); (3) opposite wall delay inT in the LV segments (T-OW); and (4) septal-to-lateraldelay in T (T-Sep-Lat).
For measuring the timing of tissue velocity, the interob-server variability ranged from 5% to 10%, and the intraob-server variability was 4% to 5%. For measuring the timingof tissue strain, these percentages were 8% to 13% and 7%to 10%, respectively.
For statistical comparison of parametric variables beforeand after CRT, the paired-sample Student’s t test was used.Receiver-operating characteristic (ROC) curves were ana-lyzed for the area under the curves to determine the optimal
cut-off values of systolic dyssynchrony that predicted LVreverse remodeling after CRT. All parametric data are ex-
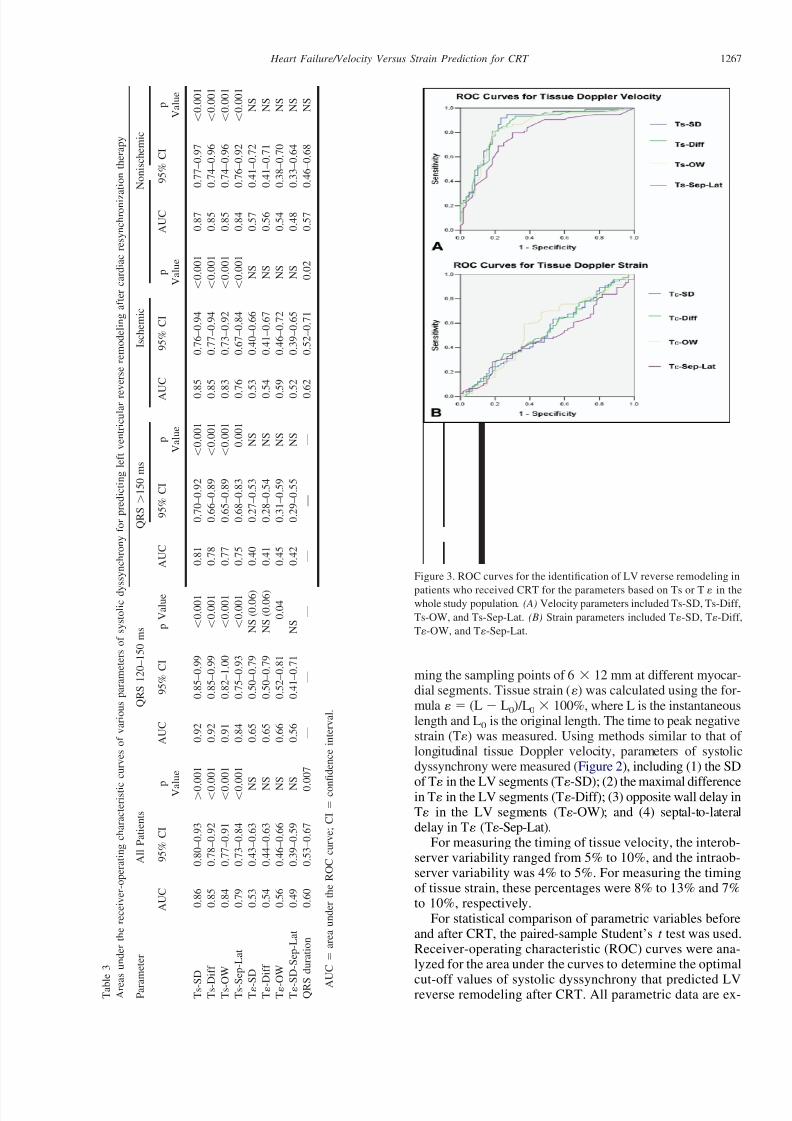
Figure 3. ROC curves for the identification of LV reverse remodeling in
patients who received CRT for the parameters based on Ts or T in thewhole study population. (A) Velocity parameters included Ts-SD, Ts-Diff,
Ts-OW, and Ts-Sep-Lat. (B) Strain parameters included T-SD, T-Diff,
T-OW, and T-Sep-Lat.
T a b l e 3
A r e a
s u n d e r t h e r e c e i v e r - o p e r a t i n g c h a r a c t e r i s t i c
c u r v e s o f v a r i o u s p a r a m e t e r s o f s y s t o l i c d y
s s y n c h r o n y f o r p r e d i c t i n g l e f t v e n t r i c u l a r r e
v e r s e r e m o d e l i n g a f t e r c a r d i a c r e s y n c h r o n i z a t i o n t h e r a p y
P a r a
m e t e r
A l l P a t i e n t s
Q R S 1 2 0 – 1 5 0 m s
Q R S Ͼ 1 5 0 m s
I s c h e m i c
N o n i s c h e m i c
A U C
9 5 % C I
p V a l u e
A U C
9 5 % C I
p V a l u e
A U C
9 5 % C I
p V a l u e
A U C
9 5 % C I
p V a l u e
A U C
9 5 % C I
p V a l u e
T s - S
D
0 . 8 6
0 . 8 0 – 0 . 9 3
Ͼ 0 . 0
0 1
0 . 9 2
0 . 8 5 – 0 . 9 9
Ͻ 0 . 0 0 1
0 . 8 1
0 . 7
0 – 0 . 9
2
Ͻ 0 . 0 0 1
0 . 8 5
0 . 7 6 – 0 . 9 4
Ͻ 0 . 0
0 1
0 . 8
7
0 . 7 7 – 0 . 9 7
Ͻ 0 . 0 0 1
T s - D
i f f
0 . 8 5
0 . 7 8 – 0 . 9 2
Ͻ 0 . 0
0 1
0 . 9 2
0 . 8 5 – 0 . 9 9
Ͻ 0 . 0 0 1
0 . 7 8
0 . 6
6 – 0 . 8
9
Ͻ 0 . 0 0 1
0 . 8 5
0 . 7 7 – 0 . 9 4
Ͻ 0 . 0
0 1
0 . 8
5
0 . 7 4 – 0 . 9 6
Ͻ 0 . 0 0 1
T s - O
W
0 . 8 4
0 . 7 7 – 0 . 9 1
Ͻ 0 . 0
0 1
0 . 9 1
0 . 8 2 – 1 . 0 0
Ͻ 0 . 0 0 1
0 . 7 7
0 . 6
5 – 0 . 8
9
Ͻ 0 . 0 0 1
0 . 8 3
0 . 7 3 – 0 . 9 2
Ͻ 0 . 0
0 1
0 . 8
5
0 . 7 4 – 0 . 9 6
Ͻ 0 . 0 0 1
T s - S
e p - L a t
0 . 7 9
0 . 7 3 – 0 . 8 4
Ͻ 0 . 0
0 1
0 . 8 4
0 . 7 5 – 0 . 9 3
Ͻ 0 . 0 0 1
0 . 7 5
0 . 6
8 – 0 . 8
3
0 . 0 0 1
0 . 7 6
0 . 6 7 – 0 . 8 4
Ͻ 0 . 0
0 1
0 . 8
4
0 . 7 6 – 0 . 9 2
Ͻ 0 . 0 0 1
T - S
D
0 . 5 3
0 . 4 3 – 0 . 6 3
N
S
0 . 6 5
0 . 5 0 – 0 . 7 9
N S ( 0 . 0 6 )
0 . 4 0
0 . 2
7 – 0 . 5
3
N S
0 . 5 3
0 . 4 0 – 0 . 6 6
N S
0 . 5
7
0 . 4 1 – 0 . 7 2
N S
T - D
i f f
0 . 5 4
0 . 4 4 – 0 . 6 3
N
S
0 . 6 5
0 . 5 0 – 0 . 7 9
N S ( 0 . 0 6 )
0 . 4 1
0 . 2
8 – 0 . 5
4
N S
0 . 5 4
0 . 4 1 – 0 . 6 7
N S
0 . 5
6
0 . 4 1 – 0 . 7 1
N S
T - O
W
0 . 5 6
0 . 4 6 – 0 . 6 6
N
S
0 . 6 6
0 . 5 2 – 0 . 8 1
0 . 0 4
0 . 4 5
0 . 3
1 – 0 . 5
9
N S
0 . 5 9
0 . 4 6 – 0 . 7 2
N S
0 . 5
4
0 . 3 8 – 0 . 7 0
N S
T - S
D - S e p - L a t
0 . 4 9
0 . 3 9 – 0 . 5 9
N
S
0 . 5 6
0 . 4 1 – 0 . 7 1
N S
0 . 4 2
0 . 2
9 – 0 . 5
5
N S
0 . 5 2
0 . 3 9 – 0 . 6 5
N S
0 . 4
8
0 . 3 3 – 0 . 6 4
N S
Q R S
d u r a t i o n
0 . 6 0
0 . 5 3 – 0 . 6 7
0 . 0
0 7
—
—
—
—
—
—
0 . 6 2
0 . 5 2 – 0 . 7 1
0 . 0
2
0 . 5
7
0 . 4 6 – 0 . 6 8
N S
A U C ϭ
a r e a u n d e r t h e R O C c u r v e ; C I ϭ
c o n
fi d e n c e i n t e r v a l .
1267 Heart Failure/Velocity Versus Strain Prediction for CRT

7/30/2019 Usefullness of Tissue Doppler in CRT
http://slidepdf.com/reader/full/usefullness-of-tissue-doppler-in-crt 6/8
pressed as mean Ϯ SD. A p value Ͻ0.05 was consideredstatistically significant.
Results
There were reductions in LV end-diastolic (p Ͻ0.001) and
end-systolic (pϽ0.001) volumes, with improvements in LVejection fractions (p Ͻ0.001), after CRT (Table 1). A re-sponse of LV reverse remodeling was defined as a reductionin LV end-systolic volume of Ն15%,7,8,14 which was ob-served in 141 patients (55%). The other 115 patients (45%),who had reductions in LV end-systolic volumeϽ15%, wereclassified as nonresponders. The baseline LV sizes andejection fractions were similar between responders and non-responders of LV reverse remodeling (Table 1). However,responders exhibited more severe systolic dyssynchronywhen parameters of tissue Doppler velocity were compared.Tissue Doppler strain parameters showed minimal differ-ence in systolic dyssynchrony between responders and non-
responders (Table 2).Table 3 lists the areas under the ROC curves of the tissue
Doppler velocity parameters that predicted LV reverse re-modeling. The areas under the ROC curves were similar forTs-SD, Ts-Diff, and Ts-OW (0.84 to 0.86, all pϽ0.001) andslightly less for Ts-Sep-Lat (0.79, p Ͻ0.001; Figure 3).
Table 4 lists the optimal cut-off values for the predictionof LV reverse remodeling response by different tissueDoppler velocity echocardiographic parameters, with theiroptimal sensitivities and specificities derived from the“shoulders” of the ROC curves. All parameters derivedfrom 12 LV segments had reasonably high sensitivities topredict LV reverse remodeling. A cut-off value for Ts-SD of
33 ms yielded a sensitivity of 93% and a specificity of 73%.A cut-off value for Ts-Diff of 100 ms had sensitivity andspecificity of 92% and 68%, respectively. A cut-off valuefor Ts-OW of 90 ms resulted in sensitivity and specificity of 81% and 80%, respectively, and a cut-off value for Ts-Sep-Lat of 60 ms resulted in sensitivity and specificity of 70%and 76%, respectively.
In contrast to tissue Doppler velocity, none of the pa-rameters of systolic dyssynchrony derived from tissueDoppler strain were able to predict LV reverse remodeling.All the areas under the ROC curves were close to thereference value of 0.50 (Table 3, Figure 3).
The predictive value of QRS duration on electrocardiog-
raphy was also evaluated. The area under the ROC curvewas 0.60 (p ϭ 0.007). A cut-off value of 145 ms had a
sensitivity of 81% and a specificity of 36% to predict LVreverse remodeling.
Seventy-seven patients (30%) had QRS durations of 120to 150 ms, and 179 patients (70%) had QRS durationsϾ150ms. The improvements of LV end-diastolic volumes, end-systolic volumes, and ejection fractions were consistentlyobserved in the 2 subgroups, although patients with QRSdurations Ͼ150 ms appeared to have higher baseline LV
volumes and lower ejection fractions compared with pa-tients with QRS durations of 120 to 150 ms (Table 1).
Figure 4. ROC curves for the identification of LV reverse remodeling in
patients who received CRT for the subgroups with QRS durations of 120to 150 ms (A) and QRS durations Ͼ150 ms (B). These parameters were
based on tissue velocity measurement, including Ts-SD, Ts-Diff, Ts-OW,
and Ts-Sep-Lat.
Table 4
Cut-off values, sensitivities, and specificities of various parameters of systolic dyssynchrony for predicting left ventricular reverse remodeling after
cardiac resynchronization therapy
Parameter Cutoff (ms) All Patients QRS 120–150 ms QRS Ͼ150 ms Ischemic Nonischemic
Sensitivity
(%)
Specificity
(%)
Sensitivity
(%)
Specificity
(%)
Sensitivity
(%)
Specificity
(%)
Sensitivity
(%)
Specificity
(%)
Sensitivity
(%)
Specificity
(%)
Ts-SD 33 93 73 96 79 94 67 92 74 97 77Ts-SD-Diff 100 92 68 96 76 90 59 92 71 94 68
Ts-OW 90 81 80 88 91 78 67 74 84 89 73
Ts-Sep-Lat 60 70 76 63 86 73 71 66 74 75 78
QRS duration 145 81 36 — — — — 77 37 85 36
1268 The American Journal of Cardiology (www.AJConline.org)
7/30/2019 Usefullness of Tissue Doppler in CRT
http://slidepdf.com/reader/full/usefullness-of-tissue-doppler-in-crt 7/8
The prevalence of responders was lower among the pa-tients with QRS durations of 120 to 150 ms (n ϭ 35 [46%])than the patients with QRS durations Ͼ150 ms (n ϭ 106[59%]) (chi-square 4.12, p ϭ 0.04).
Ts-SD, Ts-Diff, and Ts-OW had the highest areas under theROC curves (0.91 to 0.92, all pϽ0.001) to predict LV reverseremodeling in the group with QRS durations of 120 to 150 ms(Table 3). Interestingly, the areas under the ROC curves for all
tissue Doppler velocity parameters were consistently larger forthe group with QRS durations of 120 to 150 ms compared withpatients with QRS durations Ͼ150 ms (Figure 4). Conse-quently, for the same cut-off values, the sensitivities to predictresponse to CRT were comparable between the 2 groups,whereas the specificities were higher in patients with QRSdurations of 120 to 150 ms (Table 4).
One hundred forty-four patients (56%) had ischemic causesof heart failure, and the other 112 patients (44%) had causesthat were nonischemic in origin. The 2 subgroups showedsignificant improvements in LV volumes and ejection frac-tions, and there was no difference in the baseline and follow-upvalues between the 2 subgroups. The prevalence of responders
of LV reverse remodeling was slightly less in the ischemicpatients (n ϭ 74 [51%]) compared with nonischemic patients
(n ϭ 67 [60%]), although the difference was not statisticallysignificant (chi-square 1.44, p ϭ NS).
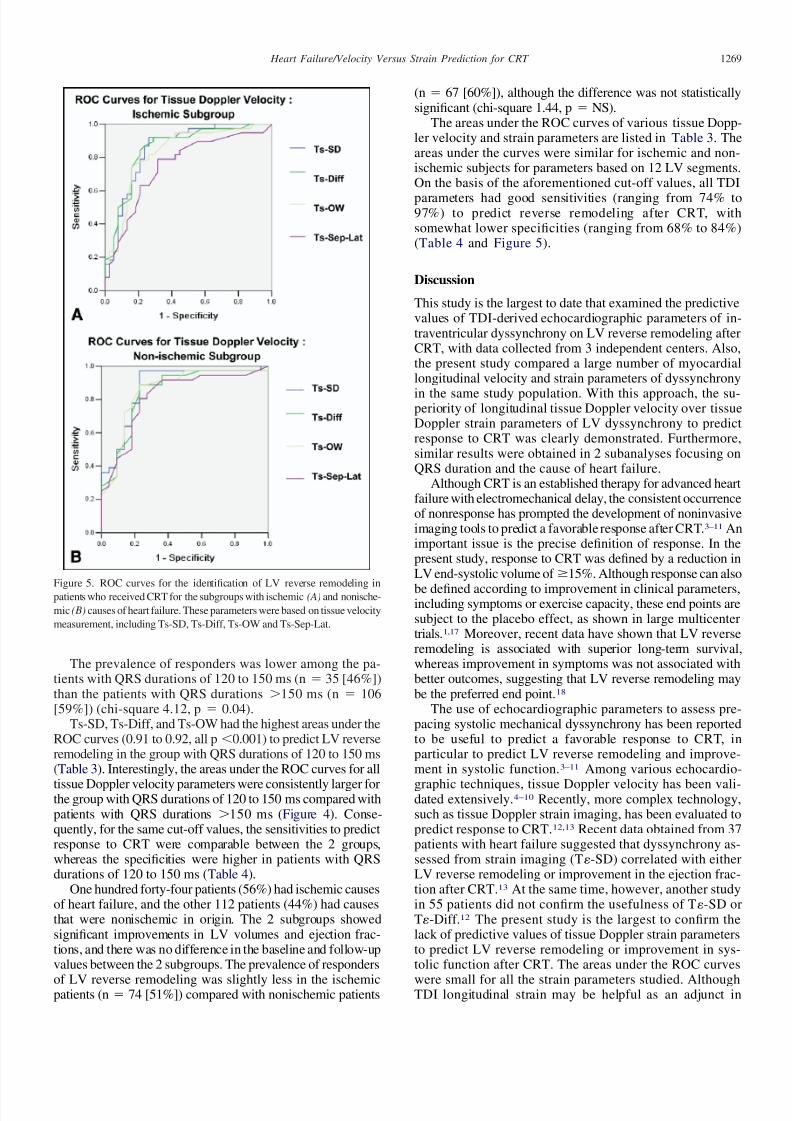
The areas under the ROC curves of various tissue Dopp-ler velocity and strain parameters are listed in Table 3. Theareas under the curves were similar for ischemic and non-ischemic subjects for parameters based on 12 LV segments.On the basis of the aforementioned cut-off values, all TDI
parameters had good sensitivities (ranging from 74% to97%) to predict reverse remodeling after CRT, withsomewhat lower specificities (ranging from 68% to 84%)(Table 4 and Figure 5).
Discussion
This study is the largest to date that examined the predictivevalues of TDI-derived echocardiographic parameters of in-traventricular dyssynchrony on LV reverse remodeling afterCRT, with data collected from 3 independent centers. Also,the present study compared a large number of myocardiallongitudinal velocity and strain parameters of dyssynchrony
in the same study population. With this approach, the su-periority of longitudinal tissue Doppler velocity over tissueDoppler strain parameters of LV dyssynchrony to predictresponse to CRT was clearly demonstrated. Furthermore,similar results were obtained in 2 subanalyses focusing onQRS duration and the cause of heart failure.
Although CRT is an established therapy for advanced heartfailure with electromechanical delay, the consistent occurrenceof nonresponse has prompted the development of noninvasiveimaging tools to predict a favorable response after CRT.3–11 Animportant issue is the precise definition of response. In thepresent study, response to CRT was defined by a reduction inLV end-systolic volume of Ն15%. Although response can also
be defined according to improvement in clinical parameters,including symptoms or exercise capacity, these end points aresubject to the placebo effect, as shown in large multicentertrials.1,17 Moreover, recent data have shown that LV reverseremodeling is associated with superior long-term survival,whereas improvement in symptoms was not associated withbetter outcomes, suggesting that LV reverse remodeling maybe the preferred end point.18
The use of echocardiographic parameters to assess pre-pacing systolic mechanical dyssynchrony has been reportedto be useful to predict a favorable response to CRT, inparticular to predict LV reverse remodeling and improve-ment in systolic function.3–11 Among various echocardio-
graphic techniques, tissue Doppler velocity has been vali-dated extensively.4–10 Recently, more complex technology,such as tissue Doppler strain imaging, has been evaluated topredict response to CRT.12,13 Recent data obtained from 37patients with heart failure suggested that dyssynchrony as-sessed from strain imaging (T-SD) correlated with eitherLV reverse remodeling or improvement in the ejection frac-tion after CRT.13 At the same time, however, another studyin 55 patients did not confirm the usefulness of T-SD orT-Diff.12 The present study is the largest to confirm thelack of predictive values of tissue Doppler strain parametersto predict LV reverse remodeling or improvement in sys-tolic function after CRT. The areas under the ROC curves
were small for all the strain parameters studied. AlthoughTDI longitudinal strain may be helpful as an adjunct in
Figure 5. ROC curves for the identification of LV reverse remodeling in
patients who received CRT for the subgroups with ischemic (A) and nonische-
mic (B) causes of heart failure. These parameters were based on tissue velocity
measurement, including Ts-SD, Ts-Diff, Ts-OW and Ts-Sep-Lat.
1269 Heart Failure/Velocity Versus Strain Prediction for CRT
7/30/2019 Usefullness of Tissue Doppler in CRT
http://slidepdf.com/reader/full/usefullness-of-tissue-doppler-in-crt 8/8
patients with high data quality, it was not consistently pre-dictive in this large series of patients studied. An importantproblem with such strain calculation is that the scan lineangle of incidence may not be aligned precisely with thedirection of shortening of the LV wall. This occurs indilated, spherically distorted left ventricles, which are oftenencountered in the CRT population. A more recent ap-
proach to assess regional strain and dyssynchrony usingspeckle tracking from routine grayscale echocardiographicimages that is not affected by Doppler angle of incidencehas been more promising to predict response to CRT.11
In the present study, myocardial velocity parameters de-rived from TDI predicted a favorable volumetric response toCRT. The areas under the ROC curves that predicted reverseremodeling response were consistently high for all the param-eters of systolic dyssynchrony derived from 12 LV segments.Among these parameters, the cut-off values derived from theROC curves for Ts-SD and Ts-Diff had high sensitivities,whereas those derived from Ts-OW had relatively higher spec-ificities. Ts-Sep-Lat, which examined only septal-to-lateral wall
delay in a single apical view, also had reasonably high sensitivityand specificity. Furthermore, the cut-off values derived from theROC curves substantiated previous findings.10,19
Another important observation is that the predictive valuesof TDI velocity parameters are consistently present in differentsubgroups, namely, those with different degrees of widening of the QRS complex (120 to 150 orϾ150 ms) and causes of heartfailure (ischemic or nonischemic). Because the study includeda large population, it allowed for meaningful analyses andsubgroup comparisons. It was interesting to note that in pa-tients with QRS durations Ͼ150 ms, the specificity of thedyssynchrony parameters tended to be lower than in patientswith QRS durations of 120 to 150 ms. This may have been
related to the fact that a wide QRS duration of Ͼ150 msalready preselected those patients with more severe systolicdyssynchrony, resulting in a higher response rate comparedwith patients with less wide QRS complexes.20
The present study did not reveal an obvious difference inpredictive value for LV reverse remodeling between ische-mic and nonischemic subgroups, although the response rateto CRT has been shown previously to be lower in ischemicthan nonischemic subgroups.1 In fact, the cut-off values de-rived from the whole study population that predicted LV re-verse remodeling after CRT could also be applied to thesesubgroups, yielding similar predictive values.
1. Abraham WT, Fisher WG, Smith AL, DeLurgio DB, Leon AR, Loh E,Kocovic DZ, Packer M, Clavell AL, Hayes DL, et al. Cardiac resyn-chronization in chronic heart failure. N Engl J Med 2002;346:1845–1853.
2. Bax JJ, Abraham T, Barold SS, Breithardt OA, Fung JW, Garrigue S,Gorcsan J III, Hayes DL, Kass DA, Knuuti J, et al. Cardiac resyn-chronization therapy: Part 1—issues before device implantation. J Am
Coll Cardiol 2005;46:2153–2167.3. Pitzalis MV, Iacoviello M, Romito R, Massari F, Rizzon B, Luzzi G,
Guida P, Andriani A, Mastropasqua F, Rizzon P. Cardiac resynchro-nization therapy tailored by echocardiographic evaluation of ventric-ular asynchrony. J Am Coll Cardiol 2002;40:1615–1622.
4. Yu CM, Fung JWH, Lin H, Zhang Q, Sanderson JE, Lau CP. Predic-tors of left ventricular reverse remodeling after cardiac resynchroni-zation therapy for heart failure secondary to idiopathic dilated orischemic cardiomyopathy. Am J Cardiol 2003;91:684–688.
5. Bax JJ, Molhoek SG, van Erven L, Voogd PJ, Somer S, Boersma E,Steendijk P, Schalij MJ, van der Wall EE. Usefulness of myocardial
tissue Doppler echocardiography to evaluate left ventriculardyssynchrony before and after biventricular pacing in patients withidiopathic dilated cardiomyopathy. Am J Cardiol 2003;91:94–97.
6. Dohi K, Suffoletto MS, Schwartzman D, Ganz L, Pinsky MR, GorcsanJ III. Utility of echocardiographic radial strain imaging to quantify leftventricular dyssynchrony and predict acute response to cardiac resyn-chronization therapy. Am J Cardiol 2005;96:112–116.
7. Notabartolo D, Merlino JD, Smith AL, DeLurgio DB, Vera FV, Easley
KA, Martin RP, Leon AR. Usefulness of the peak velocity differenceby tissue Doppler imaging technique as an effective predictor of response to cardiac resynchronization therapy. Am J Cardiol 2004;94:817–820.
8. Yu CM, Fung JW, Zhang Q, Chan CK, Chan YS, Lin H, Kum LC,Kong SL, Zhang Y, Sanderson JE. Tissue Doppler imaging is superiorto strain rate imaging and postsystolic shortening on the prediction of reverse remodeling in both ischemic and nonischemic heart failureafter cardiac resynchronization therapy. Circulation 2004;110:66–73.
9. Gorcsan J III, Kanzaki H, Bazaz R, Dohi K, Schwartzman D. Useful-ness of echocardiographic tissue synchronization imaging to predictacute response to cardiac resynchronization therapy. Am J Cardiol
2004;93:1178–1181.10. Bax JJ, Bleeker GB, Marwick TH, Molhoek SG, Boersma E, Steendijk
P, van der Wall EE, Schalij MJ. Left ventricular dyssynchrony predictsresponse and prognosis after cardiac resynchronization therapy. J Am
Coll Cardiol 2004;44:1834–1840.11. Suffoletto MS, Dohi K, Cannesson M, Saba S, Gorcsan J III. Novel
speckle-tracking radial strain from routine black-and-white echocar-diographic images to quantify dyssynchrony and predict response tocardiac resynchronization therapy. Circulation 2006;113:960–968.
12. Yu CM, Zhang Q, Chan YS, Chan CK, Yip GW, Kum LC, Wu EB,Lee PW, Lam YY, Chan S, Fung JW. Tissue Doppler velocity issuperior to displacement and strain mapping in predicting left ventric-ular reverse remodeling response after cardiac resynchronization ther-apy. Heart 2006;19:422–428.
13. Mele D, Pasanisi G, Capasso F, De Simone A, Morales MA, Poggio D,Capucci A, Tabacchi G, Sallusti L, Ferrari R. Left intraventricularmyocardial deformation dyssynchrony identifies responders to cardiacresynchronization therapy in patients with heart failure. Eur Heart J
2006;27:1070–1078.14. Yu CM, Chau E, Sanderson JE, Fan K, Tang MO, Fung WH, Lin H,
Kong SL, Lam YM, Hill MR, Lau CP. Tissue Doppler echocardio-graphic evidence of reverse remodeling and improved synchronicityby simultaneously delaying regional contraction after biventricularpacing therapy in heart failure. Circulation 2002;105:438–445.
15. Bargiggia GS, Bertucci C, Recusani F, Raisaro A, de Servi S, Valdes-Cruz LM, Sahn DJ, Tronconi L. A new method for estimating leftventricular dP/dt by continuous wave Doppler-echocardiography. Val-idation studies at cardiac catheterization. Circulation 1989;80:1287–1292.
16. Yu CM, Zhang Q, Fung JW, Chan HC, Chan YS, Yip GW, Kong SL,Lin H, Zhang Y, Sanderson JE. A novel tool to assess systolic asyn-chrony and identify responders of cardiac resynchronization therapyby tissue synchronization imaging. J Am Coll Cardiol 2005;45:677–684.
17. Young JB, Abraham WT, Smith AL, Leon AR, Lieberman R, Wilkoff
B, Canby RC, Schroeder JS, Liem LB, Hall S, Wheelan K. Combinedcardiac resynchronization and implantable cardioversion defibrillationin advanced chronic heart failure: the MIRACLE ICD trial. JAMA
2003;289:2685–2694.18. Yu CM, Bleeker GB, Fung JW, Schalij MJ, Zhang Q, van der Wall EE,
Chan YS, Kong SL, Bax JJ. Left ventricular reverse remodeling butnot clinical improvement predicts long-term survival after cardiacresynchronization therapy. Circulation 2005;112:1580–1586.
19. Bax JJ, Marwick TH, Molhoek SG, Bleeker GB, van Erven L,Boersma E, Steendijk P, van der Wall EE, Schalij MJ. Left ventriculardyssynchrony predicts benefit of cardiac resynchronization therapy inpatients with end-stage heart failure before pacemaker implantation. Am J Cardiol 2003;92:1238–1240.
20. Yu CM, Fung JW, Chan CK, Chan YS, Zhang Q, Lin H, Yip GW,Kum LC, Kong SL, Zhang Y, Sanderson JE. Comparison of efficacyof reverse remodeling and clinical improvement for relatively narrow
and wide QRS complexes after cardiac resynchronization therapy forheart failure. J Cardiovasc Electrophysiol 2004;15:1058–1065.
1270 The American Journal of Cardiology (www.AJConline.org)