Urban Landscape Quality Index – Planning Tool for ... · Peer-review under responsibility of the...
13
Procedia Environmental Sciences 32 (2016) 155 – 167 1878-0296 © 2016 The Authors. Published by Elsevier B.V. This is an open access article under the CC BY-NC-ND license (http://creativecommons.org/licenses/by-nc-nd/4.0/). Peer-review under responsibility of the organizing committee of ECOSMART 2015 doi:10.1016/j.proenv.2016.03.020 Available online at www.sciencedirect.com ScienceDirect International Conference – Environment at a Crossroads: SMART approaches for a sustainable future Urban Landscape Quality Index – planning tool for evaluating urban landscapes and improving the quality of life Athanasios Alexandru Gavrilidis a *, Cristiana Maria Ciocănea a , Mihai Răzvan Niță a , Diana Andreea Onose a , Irina Iulia Năstase a a University of Bucharest, Centre for Environmental Research and Impact Studies, N. Bălcescu, no.1, Sector 1, Bucharest, 010041, Romania Abstract Researchers and planners worldwide have emphasized the need for a better planning in an urbanizing world. The expansion of urbanized areas has increased people’s access to modern facilities and urban infrastructures but decreased the quality of lif e due to social imbalances characterizing large cities. The quality of urban landscape can be used as an indicator of high or low quality of life levels. Our study proposesed the assessment of urban landscape using an Urban Landscape Quality Index (ULQI) used for mapping the landscape quality within a city. The methodology used for calculating ULQI was based on an expert assessment of the urban landscape items from a first rank city from Romania followed by the calculation of the index itself. The assessment was made at a neighbourhood level and using the generated values we were able to process a map representing the quality of the urban landscape in the inhabited areas of Ploieşti. The results were compared with the answers from a survey targeting the landscap e quality perception of the locals. A 75% accuracy was recorded between the visual assessment of the urban landscape and the perception of the locals. The study showed that using visual assessment of the landscape and calculating ULQI is an efficient and useful approach that doesn’t require a high amount of resources and can generate an outline over a city in short period. ULQI values can be used by planners, landscapers or authorities in order to prioritize the areas of an urban area that need to be taken into consideration. Keywords: urban landscape; urban landscape quality index ; quality of life; * Gavrilids A.A.. Tel.: +40-726-520-990. E-mail address: [email protected] © 2016 The Authors. Published by Elsevier B.V This is an open access article under the CC BY-NC-ND license (http://creativecommons.org/licenses/by-nc-nd/4.0/). Peer-review under responsibility of the organizing committee of ECOSMART 2015
Transcript of Urban Landscape Quality Index – Planning Tool for ... · Peer-review under responsibility of the...

Procedia Environmental Sciences 32 ( 2016 ) 155 – 167
1878-0296 © 2016 The Authors. Published by Elsevier B.V. This is an open access article under the CC BY-NC-ND license (http://creativecommons.org/licenses/by-nc-nd/4.0/).Peer-review under responsibility of the organizing committee of ECOSMART 2015doi: 10.1016/j.proenv.2016.03.020
Available online at www.sciencedirect.com
ScienceDirect
International Conference – Environment at a Crossroads: SMART approaches for a sustainable future
Urban Landscape Quality Index – planning tool for evaluating urban landscapes and improving the quality of life
Athanasios Alexandru Gavrilidisa*, Cristiana Maria Ciocăneaa, Mihai Răzvan Nițăa, Diana Andreea Onosea, Irina Iulia Năstasea
aUniversity of Bucharest, Centre for Environmental Research and Impact Studies, N. Bălcescu, no.1, Sector 1, Bucharest, 010041, Romania
Abstract
Researchers and planners worldwide have emphasized the need for a better planning in an urbanizing world. The expansion of urbanized areas has increased people’s access to modern facilities and urban infrastructures but decreased the quality of life due to social imbalances characterizing large cities. The quality of urban landscape can be used as an indicator of high or low quality of life levels. Our study proposesed the assessment of urban landscape using an Urban Landscape Quality Index (ULQI) used for mapping the landscape quality within a city. The methodology used for calculating ULQI was based on an expert assessment of the urban landscape items from a first rank city from Romania followed by the calculation of the index itself. The assessment was made at a neighbourhood level and using the generated values we were able to process a map representing the quality of the urban landscape in the inhabited areas of Ploieşti. The results were compared with the answers from a survey targeting the landscape quality perception of the locals. A 75% accuracy was recorded between the visual assessment of the urban landscape and the perception of the locals. The study showed that using visual assessment of the landscape and calculating ULQI is an efficient and useful approach that doesn’t require a high amount of resources and can generate an outline over a city in short period. ULQI values can be used by planners, landscapers or authorities in order to prioritize the areas of an urban area that need to be taken into consideration. © 2016 The Authors. Published by Elsevier B.V. Peer-review under responsibility of the organizing committee of ECOSMART 2015.
Keywords: urban landscape; urban landscape quality index ; quality of life;
* Gavrilids A.A.. Tel.: +40-726-520-990.
E-mail address: [email protected]
© 2016 The Authors. Published by Elsevier B.V This is an open access article under the CC BY-NC-ND license (http://creativecommons.org/licenses/by-nc-nd/4.0/).Peer-review under responsibility of the organizing committee of ECOSMART 2015
156 Athanasios Alexandru Gavrilidis et al. / Procedia Environmental Sciences 32 ( 2016 ) 155 – 167
1. Introduction
Landscape has become one of the key themes for environmental and territorial sustainability, concerning environmental, cultural and social matters [1]. The new methods proposed for landscape evaluation bring up the definition that landscape and environment can be used as an integrated concept [2] as landscape represents the perceived environment by individuals. According to the European landscape convention, there are two major classes when talking about landscape: natural landscape and anthropic landscape [3], the second being plainly represented by the urban landscape. More than a quarter of the European Union’s territory has been directly affected by urban land use [4], therefore more of half of the EU’s population lives in an urban environment that has to provide a decent quality of life.
The current urban shapes are the result of successive planning policies, some of them being coherent with the previous ones and some of them being antithetic. However, planning is a necessary measure for a sustainable development of the cities but in the same time it can be the other way around if planning activities are not focused on decreasing the effects of contemporary issues such as: climate change, social imbalances, cultural segregation, pollution, GHG emissions or urban sprawl phenomena. Most of the malfunction that occur in the urban settlements are a direct or indirect consequence of the urbanization processes, specifically, a consequence of urban sprawl [4-6]. The urbanization processes combined, based on poor grounded policies can lead to conflicts between different urban function, especially in the periurban area[7] or metropolitan areas [8]. Future planning strategies have to consider coping with different types of land use conflicts [9] in order to ensure the sustainability of cities and the improvement of relationship between different stakeholders and actors. Urban planning strategies are directly linked with political ideologies [10] and there is a significant difference of approach between developed and developing countries [11]. At a European level there is a major difference of urban planning between the groups of countries placed on the both sides of the former Iron Curtain. The transition to a market economy in Eastern European countries revealed a common pattern in urban land use. The decay of centralized agriculture system resulted in the fragmentation of the former compact agricultural lands into small patches that were transferred in the private property of the owners. Thus, former agriculture land abandonment was a spread practice [12, 13] in the urban areas’ outskirts, this phenomena becoming a precursor of build-up development [14-16], favoring the sprawling extent of cities. Another planning challenge of the former socialist cities was the management of the ex-industrial sites being transformed into brownfields. In most of the cases these sites proved to be a proof of urban regeneration being reconverted into commercial areas, logistic and business center or residential area [17, 18] despite the general negative feedback from the local population that were nostalgic after their former work places [19]. A high number of researchers identified that institutional actors play a major role in planning and a main issue is the control of residential areas expansion [20]. From a dynamics perspective, post-socialist countries faced a more accelerated process of land use changes in the proximities of urban areas [21] leading to the need of planning strategies in order to fringe the negative effects of poor policies [22].
The urban settlements evolve on permanent basis due to its internalities and externalities, thus the urban landscape faces continuous changes, recording an interlinked flow of systems and epochs, a synergy of historical moments compressed in a limited area [23]. The development of sustainable urban landscape is an issue that has to be tackled by almost all stakeholders, from local authorities to citizens, meaning to develop an integrated approach of urban ecology, urban planning and environmental management [24]. The importance of urban landscapes is destined to be accentuated in the current transition phase toward the society of culture and knowledge, in which the role of the city is always less entrusted with the classic functions of tertiary and quaternary sectors, and even more with symbolic relationships, identifing images, and intangible dynamics [2]. Today, more urban planners and architects emphasize the idea of compact cities to limit the effects of urbanization over the surrounding landscape and local environment. For the assessment of urban compactness, landscape ecology methods were applied for urban landscape, such as the analysis of patch shape and patch fragmentation [25]. In the same time the need for natural or cultivated areas in or nearby urban settlements became of great importance for planners and local governments because these areas provide several services for the cities such as food [26], adaptation to climate change [27-30] , recreation [31] or general quality of life improvements [32]. The protection of heritage values of landscape focus upon sustainability of existing values, but they are under a significant pressure from the urbanization processes [33]. The expansion of urban functions into the areas surrounding the cities has an important environmental consequence,

157 Athanasios Alexandru Gavrilidis et al. / Procedia Environmental Sciences 32 ( 2016 ) 155 – 167
that’s why the research community urges that peripheral land use management should be co-ordinated with landscape planning and citizens’ demands [34].
The quality of life levels are projected in the quality of the environment and landscape, but at the same time landscape and environmental quality influence the quality of life. Thus, assessing the quality of life, especially in the urban areas has become a great challenge due to the numerous indicators that have to be analyzed and processed. Approaches to measure quality of life are either objective, based on secondary analysis of data derived from statistical collection or subjective, based on primary data collected through sample surveys in which people’s perceptions of quality of life domains are measured on scaled attributes related to those attributes [35]. In the report published by the European Commission [36] regarding the quality of life in European cities, four issues were adressed: people satisfaction with their cities, people’s view about their city, environment and people’s personal situation. The surveys covered 79 European cities and in the end it emphasized that Europeans living in urban areas were particularly concerned about health services, unemployment, education and safety. No matter what research subject you want to address, the use of indicators is necessary for reaching comprehensive results and conclusions, and studies regarding the human welfare includes indicators from apparently different research topics such as economy, environmental or ecological studies. It has been agreed that there are two complementary approaches to study the quality of life of a community – the objective approach, based on the manipulation of observable and measurable indicators and the qualitative approach based on citizens’ perceptions of the conditions of their lives [37]. Assessing quality of life using qualitative methods can generated biased results that are not a reflection of the reality, but on the other hand if the general wellbeing is not perceived by the citizens, then it doesn’t exists. One of the key criticism directed towards quality of life indicators is the notion of encapsulating essentially qualitative information in one measurable indicator [38]. Thus there is a strong need for an interdisciplinary approach to assess the quality of life levels, aimed to identify what originates happiness to a city and its inhabitants, using both subjective and objective methods [39]. Different movements and scientific communities concentrate on the role that the landscape can have on improving the quality of living [2]. Urban quality of life is a concept that has the challenge to solve the problems of urban areas, to control urban sprawl and to prevent environmental deterioration [40, 41] therefore the urban landscape is shaped according to specific processes triggered to improve the quality of life. Indicators and measures regarding quality of life represent the core of current theories of urban design and planning but to achieve a better quality for existing communities, priorities must be identified to direct efforts towards relevant sectors [42].
Landscape quality assessment has different kind of approaches depending on what indicators are used. As landscape represents the perceived environment [3], landscape quality assessments are often based on visual perception. Measuring the perception over the landscape is difficult and involves many critical assumptions [1], thus landscape quality assessment based on perception may be considered subjective. Nevertheless, according to the European Landscape Convention, landscape is considered a resource used and consumed by people, thus the quality of this resource is important. In contrast with other raw resources, landscape can be managed in order to provide the best services for people and these services are established according to people’s needs. Researcher have used and measured public perception over the landscape or its components for some time and their results and conclusion were used in public policies. For a better analysis, public perception are often required to be accompanied and balanced with the perception of other relevant parties [43]. Concerns regarding urban landscape perception were mostly focused on the natural green areas within the cities, such as parks and recreation needs [44], derelict land [45] or urban natural landscape preferences [46].
Evaluating perception, using surveys, is an useful tool to understand the human needs and required services from a landscape, but for a better quality assessment further steps have to be made for a more objective research. Visual assessment of landscape has been often used for natural landscapes. A model of observation sheet applied by landscape ecologists for visual evaluations was the one proposed by Almo Farina [47]. There were also adaptations of this observation sheet for other natural landscapes [48, 49] but also for urban landscapes [50]. Criteria selection for the visual evaluation of urban landscape has to be specific and oriented towards the landscape elements needed to be assessed.
Most visual landscape assessments occur at a single level using one methodology, but for assessing the landscape quality of an urban area, a selection of methodologies have to be combined in order to generate a reasonable result [51]. In this paper we tried assessing the urban landscape quality of a Romanian industrial city, using an index (Urban Landscape Quality Index – ULQI) calculated based on the data gathered during a visual
158 Athanasios Alexandru Gavrilidis et al. / Procedia Environmental Sciences 32 ( 2016 ) 155 – 167
evaluation of the urban landscape. The main objective of this research was to develop a handy and comprehensive method for urban landscape quality evaluation, to be used by local authorities or other parties involved in urban landscape management.
2. Study area
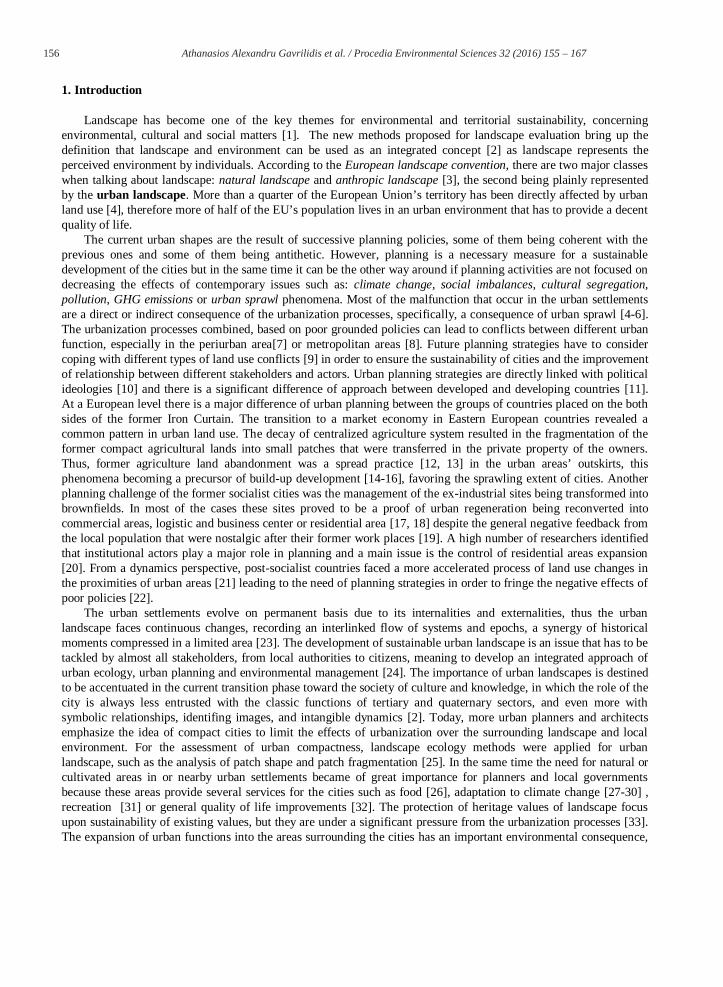
Ploiești is an important industrial city from Prahova County that lays in the south-east part of Romania (fig. 1).The city has developed in the last 500 years, becoming one of the main engines of the Romanian economy. It expanded rapidly after 1856 when the world first refinery was built here [10, 52], reaching today a total area of 6047.84 ha. The city registered a number of 209,945 inhabitants according to the national census from 2011 [53], living in 36 neighborhoods, most of them being former rural settlements in the city’s proximities. The industrial pattern of Ploiesti is confirmed by the 41.29% of land occupied by industrial buildings and their sanitary protection areas [54]. Thus the city is representative for Romania and for the entire ex-communist block by having similar urban dynamics and evolution with other cities.
Ploiești developed in a plain area without any major natural restrictions, fact that facilitated the expansion of the city. In the transition period (from the 90’s and mid 2000’s) the city faced a reconversion of the former communist industrial sites that were not involved in the oil processing activities [17], a refurbishment and restructuring of the surviving industrial activities [55, 56], a high rate of agricultural land abandonment due to real estate development [12, 57] and an expansion of the build-up areas in the outskirts of the city through the development of new commercial, industrial, logistics and residential buildings [58, 59].
All these changes, specific to all important cities in Romania, led to several imbalances in the landscape quality and the overall quality of life due to the lack of planning policies and gaps in the national and local legislation.
3. Methods
For the calculation of ULQI, five steps needed to be fulfilled and then, the results were mapped for the entire city and compared with the results of a survey, focused on evaluating people’s perception over the local urban landscape (fig. 2).
Fig. 1 Study area position within the country

159 Athanasios Alexandru Gavrilidis et al. / Procedia Environmental Sciences 32 ( 2016 ) 155 – 167
For the visual assessment of the urban landscape we build an observation sheet based on the main principles
proposed by Almo Farina [47] for landscape surveying, but we adapted its content in order to be suited for urban landscape assessment. Thus we selected six urban landscape components for visual assessments as it is shown in Table 1. For each of the six landscape components, a five level Likert scale was used for the visual evaluation, level 1 meaning a very good landscape and level 5 a very bad landscape. In order to decrease the subjectivism degree of the visual analysis, for each level of the Likert scale was established a set of precise criteria that the landscape items of the six components had to fulfil.
Table 1 Urban landscape components and their composing ellements that were visualy assessed
Landscape component Landscape elements included in the analysis
The building assembly (C1) height, color, aesthetics, architecture, age
Multi store residential buildings (C2) height, balconies, AC devices, TV aerials, thermic insolation, window types
Individual dwellings (C3) height, age, architecture, gardens, fences, roofs
Urban infrastructures (C4) roads, sidewalks, headboards, sewage, urban furniture, public waste management, urban fauna, playgrounds
Green infrastructures (C5) parks, squares, public gardens, trees
Other landscape elements (C6) rivers, lakes, forests, pedestrian areas, individual buildings or groups of buildings with different architecture, history or cultural meaning
The scale to which the visual landscape quality assessment was made was maintained at a neighbourhood area.
For each of the 36 neighbourhoods three random streets were selected for the visual landscape assessment. We excluded the main boulevards of the city due to the fact that these are more representative at a city level than a neighbourhood area and analysing them may alter the calculation of ULQI. The observation sheets were applied by an operator that was not a resident of the city as another way to decrease the levels of subjectivism. The observation sheets were applied in the summer of 2013.
Another milestone in the methodological process of calculating ULQI was to insert the gathered data from the visual evaluation into a centralized database. The final step before the calculation of ULQI was to assign importance weights for every urban landscape component included in the observation sheet. These weights were assigned using values from 1 to 5 according to the influence and impact that each urban landscape component has over the general landscape. Thus, a value of 1 was assigned to the component with a lower impact and influence over the urban
Fig. 2 Methodological steps used in the study
160 Athanasios Alexandru Gavrilidis et al. / Procedia Environmental Sciences 32 ( 2016 ) 155 – 167
( )
Tcs cs
iscs cw
n
( )
19
iscw
nULQI
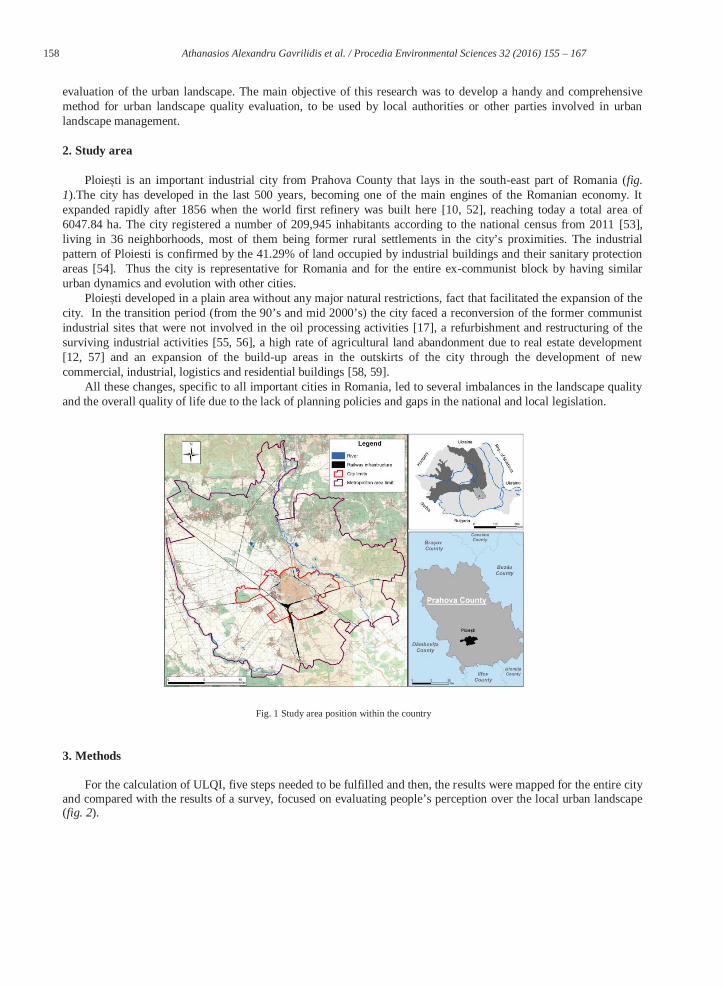
landscape and a value of 5 was assigned to the component with the highest influence and impact over the urban landscape (Table 2).
Table 2 Weight assignment for the urban landscape components
Landscape component
Weight Weight assignment motivation
C1 5 Building density, structures and architectures have the major impact over the urban landscape and has a major influence over the people’s perception whether they are locals or visitors
C2 4 Residential buildings have a great share in the urban landscape composition
C3 4 Residential buildings have a great share in the urban landscape composition
C4 3 Public infrastructures influence the people perception over the overall quality of the landscape but it is mostly perceived by the locals
C5 2 Public green areas represents adjacent surfaces for buildup areas and they have an important impact over the local landscape but they do not occur all over a city
C6 1 The elements included in this component do not represent major landscape elements and can’t influence the general quality at a wider range as they occur only in some areas
After the weights were assigned, all the gathered and centralised data from the visual assessment were used for
the calculation of ULQI. The first goal was to calculate ULQI for every of the 108 streets that were visually assessed. The calculation of the index was made using the formula:
Tcs represents the total score recorded for all six urban landscape components and the value of 19 represents the perfect landscape score where all the items of the six landscape components where assigned a value of 1 (very good landscape). This coefficient was reached by using the following algorithm:
where cs represents the score for each of the six landscape components, is represents the sore of each of the items included in the landscape components, n represents the number of items in each component and cw represents the weight assigned to the component. An extended formula of ULQI will be:
The Urban Landscape Quality Index (ULQI) can take values from 1 to 5, using the same logics as for the Likert scale from the observation sheet. As we stated before, ULQI was calculated for each of the three streets randomly selected in a neighborhood. The neighborhood’s index value was the mean of the three values calculated before.
After reaching a value of ULQI for all neighborhoods, the data were centralized (Error! Reference source not found.) and then used for mapping.
19
TcsULQI

161 Athanasios Alexandru Gavrilidis et al. / Procedia Environmental Sciences 32 ( 2016 ) 155 – 167
For mapping the results of ULQI calculation, all 36 neighborhoods were digitized in ArcGIS desktop 10.2 and the ULQI values were assigned in the attribute table for each neighborhood. For the visual representation of the index, the values were sort ascending, using colors from green (good values) to red (worse values).
Table 3 ULQI values for each neighbourhood
ID Neighborhood name ULQI values ID Neighborhood name ULQI values
1 9 mai 1.68 19 Mihai Eminescu 1.69
2 Albert 1.79 20 Mimiu 2.3
3 Alexandru Lapusneanu 1.87 21 Motoi 1.4
4 Ana Ipatescu 1.67 22 Nord 1.4
5 Andrei Mureseanu 2.51 23 Penes Curcanul 1.69
6 Bereasca 2.15 24 Petrolului 1.56
7 Buda 1.45 25 Pictor Rosenthal 1.64
8 Bulevardul Bucuresti 1.89 26 Ploiesti Vest - Mitica Apostol 1.81
9 Cantacuzino 1.88 27 Postei Bucov 2.01
10 Centru 1.65 28 Radu de la Afumati 1.97
11 Democratiei 2.18 29 Rafov 1.6
12 Enachita Vacarescu 1.87 30 Republicii I 1.67
13 Eroilor 1.9 31 Republicii II 2.63
14 Gheorghe Doja 2.2 32 Rudului 1.59
15 Lupeni 1.65 33 Traian 1.9
16 Malu Rosu 1.85 34 Transilvaniei 1.61
17 Marasesti 1.99 35 Vest I 1.8
18 Mihai Bravu 1.68 36 Vest II - Lamaita 1.74
In order to validate the obtained ULQI values we decided to compare the results based on the visual assessment
of the urban landscape quality with the results of a survey meant to evaluate the people’s perception over the landscape quality of their city. The survey was answered by 61 people living in Ploieşti with ages between 14 and 65. The similarities between the two assessments were that they were both made at a neighbourhood scale and they both used a Likert scale method of grading. The difference between the two analysis consisted in the fact that in the survey it was used a three level Likert scale from 1 to 3, where 1 meant a good landscape and 3 meant a poor landscape, unlike the visual analysis where the Likert scale from the observation sheet had 5 levels. In order to compare the results from the two methods we classified the ULQI values in ArcGis, using three defined intervals as it is shown in Table 4. Then we introduced the obtained results from the survey for each neighbourhood in the attribute table of the neighborhoods shapefile and we overlapped the new classified ULQI values over the survey results to see if there were any similarities between the approaches to measure the urban landscape quality.
Table 4 ULQI values adapted to the values resulted after measuring public perception over the quality of urban landscape
ULQI values range New values explanation
1.400000 - 1.578000 1 (good landscape quality)
1.578001 - 2.104000 2 (medium landscape quality)
2.104001 - 2.630000 3 (poor landscape quality)

162 Athanasios Alexandru Gavrilidis et al. / Procedia Environmental Sciences 32 ( 2016 ) 155 – 167
4. Results
The calculation of ULQI for all the city’s neighborhoods revealed that the index took values from 1.40 to 2.63, with an overall value of 1.87 which means that the general landscape quality of Ploieşti is good. Our analysis included only the inhabited areas from the city, without the industrial sites and the agricultural or derelict lands located inside the city’s administrative units. For visually assessing these areas with the same method, it is necessary to build a new observation sheet being focused on their distinctive characteristics.
Mapping of ULQI values revealed that most of the neighborhoods that are near industrial sites or railway infrastructures recorded lower values (fig. 3). Also the neighborhoods where there is a high density of collective residential units recorded lower ULQI values (fig. 4) unlike the neighborhoods where there is a high density of individual houses (fig. 5). These values are justified by the fact that individual housing is accompanied by private gardens, thus there is a high surface of green space assigned to these types of neighborhoods. A distinctive phenomenon happens in the neighborhoods 22-Nord and 6-Bereasca. In the neighborhood 22-Nord, despite the high density of collective residential units there is a high amount of green spaces, especially trees that improve the ULQI values. On the other side, the neighborhood 6-Bereascaii, which is exclusive compose out of individual houses, it is inhabited by a population with low standards of living, thus decreasing the ULQI values.
Fig. 3 ULQI values for Ploiesti's neighbourhoods

163 Athanasios Alexandru Gavrilidis et al. / Procedia Environmental Sciences 32 ( 2016 ) 155 – 167
The comparison between the visual assessment of the landscape and the analysis based on the landscape quality perception emphasized that 75% accuracy. This means that in 27 out of 36 neighborhoods people perceived the landscape quality in accordance with the ULQI values. The differences occurred due to the fact that people’s perception is built on personal and subjective criteria. Overlapping the ULQI values with the grades attributed by the locals to the city’s neighborhoods’ landscape we noticed that the highest score assigned by the respondents were for the neighborhoods 10 – Centru and 2 – Albert (fig. 6). The first one, 10 – Centru represents the city center and this is the place where most of the shops, pubs, public or cultural institutions are, and as in all human settlements, the center is the area that is familiar and the nicest for all citizens within that settlements. On the other hand, the neighbourhood 2 – Albert represents a new neighbourhood with new residential buildings and people always perceive a new building or group of buildings as a nice thing, thus it is explained why it was assigned a high grade. Also, as the survey
Fig. 4 Collective residential units overlapped on the ULQI values Fig. 5 Individual houses overlapped on the ULQI values
Fig. 6 Comparison between ULQI values and public perception over the quality of urban landscape

164 Athanasios Alexandru Gavrilidis et al. / Procedia Environmental Sciences 32 ( 2016 ) 155 – 167
revealed, the respondents identified several issues and landscape items that have an impact over their perception over the landscape (Table 5).
Table 5 Issues or landscape items considered to have an influence over the urbanl landscape quality
Issues or landscape items Influence over the landscape
Negative Positive Neutral
Buildings 34.43% 62.30% 3.28%
Green areas 1.64% 95.08% 3.28%
Transport infrastructures 42.62% 44.26% 13.11%
Urban fauna 77.05% 9.84% 13.11%
Industrial sites 72.13% 14.75% 13.11%
Commercial places 22.95% 67.21% 9.84%
Worship places 8.20% 67.21% 24.59%
Public institution 13.11% 62.30% 24.59%
Traffic 63.93% 19.67% 16.39%
People's living conditions 50.82% 22.95% 26.23%
Ethnical structure of the population 47.54% 14.75% 37.70%
Waste management 39.34% 34.43% 26.23%
5. Discussions
ULQI proved to be an easy to use tool in order to assess the urban landscape quality in a quite short period of time and in an explicit manner. It can be used by local authorities through the fact that it doesn’t require a complicated methodology to reach the results. The observation sheet can be adapted to any city in order to provide more accurate results.
The values recorded after the calculation of ULQI emphasized that no neighbourhood registered values higher than 3 and for many this might be question how it was possible that none of the analyzed neighborhoods to have a medium, poor or very poor landscape? The answer lays in the observation sheet and in its 5 leveled Likert scale. The observation sheet was built not to serve only for Ploieşti, but also for any other city. Therefore ULQI values can differ for other cities and record a poorer landscape quality depending on how the six landscape components taken into consideration are maintained. This is the reason why we adapted only the recorded ULQI values to the Likert scale used to measure people’s perception over the quality of the urban landscape. The criteria used in visually assessing and grading the landscape items in the observation sheet were very rigid in order to decrease the level of subjectivism, this is the main reason why, in the end, there were no recorded ULQI values higher than 2.63. Another explanation of the ULQI values is that the analysis was made at a neighbourhood scale. If the analysis was to be conducted at a street level or a smaller scale it could record values higher than 3. For instance if in an analyzed neighbourhood two out of three streets recorded an ULQI value of 1 and the third recorded an ULQI value of 5, the overall value of the index for the entire neighbourhood would have been 2.33.
A positive aspect of this method is represented by the fact that it can be used in different scale analysis. The more detailed the scale is that the results can be extrapolated to for an overall situation. The low resource requirements and the short time of analysis are the major arguments in favor of using this method of visual evaluation of landscape quality. Also the observation sheet used for the field observation can be modified and adapted to any special case or situation. The ones used in this study focused only on the inhabited areas but the study can be extended in order to include other functional zones of city such as industrial sites, agricultural land, commercial areas or business parks.
One important variable that can influence the visual assessment of the urban landscape is the season when the observations are made due to the fact that vegetation can blur the buildings or other infrastructure and improve the

165 Athanasios Alexandru Gavrilidis et al. / Procedia Environmental Sciences 32 ( 2016 ) 155 – 167
perceived quality of the landscape. This issue was limited in our study because the items that had to be visually assessed had to be seen each one apart from other items, including vegetation.
Most landscape visual assessments were made using photographs of the landscape required to be assessed. Despite other studies, that rely on people’s perception [60, 61] or experts’ perception [51], our research was based on visual assessment in site and made by an expert. This approach had the purpose to generate more objective results of the visual assessment and to provide realistic values for ULQI. Calculating and index based on landscape criteria in order to generate maps of the landscape quality was inspired by the studies conducted by Store et al [62] for producing a sensitivity assessment method for visual forest landscape and Bishop and Miller [63] for visual assessment of off-shore wind turbines. The idea of in index used for urban landscape quality rooted in the fact that most landscape quality studies have a qualitative perspective. It is not enough to conclude that a landscape is good or poor but also to highlight how good and how poor.
Comparing the results of ULQI with the public perception of the locals gave us the information needed to see how similar the results are between the two ways to assess the quality of an urban landscape. The survey was made online, as Roth [64] concluded in his study that internet surveys are an objective and reliable instrument for gathering valid data on landscape perception and visual landscape assessments.
6. Conclusions
As the urban landscape is the environment where most of the people live today, an index such as ULQI can be used in determining whether the urban quality of life levels are high or low. The economic, social and environmental indicators used to assess the quality of urban life are not always enough for the general wellbeing of individuals. A high level of landscape quality can increase the productivity of people due to a mental relaxation generating an overall happiness.
Evaluating the urban landscape quality may show several issues specific to an urban settlement as the landscape represents the projection of environment quality and quality of life. The lack of planning or a poor city management, social imbalances and low quality of life standards have an effect over the landscape quality. Investigating the urban landscape from a qualitative perspective represents the basis for further investigation in order to constantly improve the livability and sustainability of a city
Acknowledgements
This work was supported by a grant of the Romanian National Authority for Scientific Research and Innovation, CNCS – UEFISCDI, project number PN-II-RU-TE-2014-4-0434 - Developing a model for evaluating the potential of urban green infrastructures for sustainable planning. References
1. Cassatella, C. and A. Peano, eds. Landscape indicators. Assessing and Monitoring Landscape Quality. 2011, Springer. 2. Sargolini, M., Urban Landscapes: Environmental Networks and the Quality of Life. 2012: Springer Science & Business Media. 3. European Council, European landscape convention, E. Council, Editor. 2000, European Council. 4. EEA, Urban sprawl in Europe. The ignored challenge. 2006, European Environment Agency: Copenhagen. 5. Carter, J.G., Climate change adaptation in European cities. Current opinion in environmental sustainability, 2011. 3(3): p. 193-198. 6. Suditu, B., et al., Urban sprawl characteristics and typologies in Romania. Human Geographies–Journal of Studies and Research in Human Geography, 2010. 4(2): p. 79-87v. 7. Von Der Dunk, A., et al., Defining a typology of peri-urban land-use conflicts–A case study from Switzerland. Landscape and Urban Planning, 2011. 101(2): p. 149-156. 8. Iojă, C.I., et al., Using multi-criteria analysis for the identification of spatial land-use conflicts in the Bucharest Metropolitan Area. Ecological Indicators, 2014. 42: p. 112–121. 9. Godschalk, D.R., Land use planning challenges: Coping with conflicts in visions of sustainable development and livable communities. Journal of the American Planning Association, 2004. 70(1): p. 5-13. 10. Gavrilidis, A., Alexandru, et al., Land use and land cover dynamics in the periurban area of an industrialized East-European city. An overview of the last 100 years. Carpathian Journal of Earth and Environmental Sciences, 2015. 10: p. 29-38. 11. de Graaf, R.S. and G.P. Dewulf, Applying the lessons of strategic urban planning learned in the developing world to the Netherlands: A case study of three industrial area development projects. Habitat International, 2010. 34(4): p. 471-477. 12. Grădinaru, S.R., et al., Land abandonment changes between 2005 and 2008 in Bucharest city. Procedia Technology, 2013. 8: p. 536-539.
166 Athanasios Alexandru Gavrilidis et al. / Procedia Environmental Sciences 32 ( 2016 ) 155 – 167
13. Kuemmerle, T., et al., Land use change in Southern Romania after the collapse of socialism. Regional Environmental Change, 2009. 9(1): p. 1-12. 14. Grădinaru, S.R., et al., Land abandonment as a precursor of built-up development at the sprawling periphery of former socialist cities. Ecological Indicators, 2015. 57: p. 305-313. 15. Roose, A., et al., Land use policy shocks in the post-communist urban fringe: A case study of Estonia. Land Use Policy, 2013. 30(1): p. 76-83. 16. Ioja, I., et al., The conversion of agricultural lands into built surfaces in Romania. Recent Researches in Urban Sustainability and Green Development, 2011. 6: p. 115-20. 17. Gavrilidis, A.A., I. Ioja, and I. Saghin, Urban Regeneration through Industrial Restructuring of Brownfields in the Local Economies of Post Communist Countries. Case Study: Romania, in 47th ISOCARP Congress Liveable Cities: Urbanising World, Meeting the Challenge. 2011: Wuhan, China. 18. Patroescu, M., et al., New residential areas in Bucharest Metropolitan Area–Iocation, type and characteristics. 2009: na. 19. Saghin, I., et al. Perception of the Industrial Areas Conversion in Romanian Cities-Indicator of Human Settlements Sustainability. in 48th ISOCARP Congress. 2012. Perm, Russia. 20. Halleux, J.-M., S. Marcinczak, and E. van der Krabben, The adaptive efficiency of land use planning measured by the control of urban sprawl. The cases of the Netherlands, Belgium and Poland. Land Use Policy, 2012. 29(4): p. 887-898. 21. Stanilov, K., Urban planning and the challenges of the post-socialist transformation, in The Post-Socialist City. 2007, Springer. p. 413-425. 22. Tsenkova, S., Urban futures: Strategic planning in post-socialist Europe, in The Post-Socialist City. 2007, Springer. p. 447-471. 23. Waldheim, C., The landscape urbanism reader. 2012: Chronicle Books. 24. Cilliers, S., et al., Sustainable urban landscapes: South African perspectives on transdisciplinary possibilities. Landscape and Urban Planning, 2014. 125: p. 260-270. 25. Minx, J., et al., Developing a Pragmatic Approach to Assess Urban Metabolism in Europe. A Report to the Environment Agency prepared by Technische Universität Berlin and Stockholm Environment Institute. 2011, Climatecon Working Paper 01/2011, Technische Universität Berlin. 26. Farina, A., Ecology, cognition and landscape: linking natural and social systems. Vol. 11. 2009: Springer Science & Business Media. 27. Matthews, T., A.Y. Lo, and J.A. Byrne, Reconceptualizing green infrastructure for climate change adaptation: Barriers to adoption and drivers for uptake by spatial planners. Landscape and Urban Planning, 2015. 138: p. 155-163. 28. EEA, Green infrastructure and territorial cohesion. The concept of green infrastructure and its integration into policies using monitoring systems. 2011, European Environment Agency: Copenhagen. 29. EEA, Urban adaptation to climate change in Europe. Challenges and opportunities for cities together with supportive national and European policies. . 2012, European Environment Agency: Copenhagen. 30. La Greca, P., et al., Agricultural and green infrastructures: The role of non-urbanised areas for eco-sustainable planning in a metropolitan region. Environmental Pollution, 2011. 159(8): p. 2193-2202. 31. Hillsdon, M., et al., The relationship between access and quality of urban green space with population physical activity. Public health, 2006. 120(12): p. 1127-1132. 32. Thompson, C.W., J. Roe, and P. Aspinall, Woodland improvements in deprived urban communities: What impact do they have on people's activities and quality of life? Landscape and Urban Planning, 2013. 118: p. 79-89. 33. Antrop, M., Sustainable landscapes: contradiction, fiction or utopia? Landscape and Urban Planning, 2006. 75(3): p. 187-197. 34. Niţă, M.R., et al., Land use consequences of the evolution of cemeteries in the Bucharest Metropolitan Area. Journal of Environmental Planning and Management, 2014. 57(7): p. 1066-1082. 35. Marans, W., Robert and J. Stimson, Stimson, Investigating Quality of Urban Life: Theory, Methods, and Empirical Research. 2011: Springer. 36. European Commision, Quality of life in cities 2013, European Commision: Bruxelles. 37. Pissourios, I.A., An interdisciplinary study on indicators: A comparative review of quality-of-life, macroeconomic, environmental, welfare and sustainability indicators. Ecological Indicators, 2013. 34: p. 420-427. 38. Fahy, F. and M.Ó. Cinnéide, Developing and testing an operational framework for assessing quality of life. Environmental Impact Assessment Review, 2008. 28(6): p. 366-379. 39. Ballas, D., What makes a ‘happy city’? Cities, 2013. 32: p. S39-S50. 40. El Din, H.S., et al., Principles of urban quality of life for a neighborhood. HBRC Journal, 2013. 9(1): p. 86-92. 41. EEA, Ensuring quality of life in Europe's cities and towns. Tackling the environmental challenges driven by European and global change. . 2009, European Environment Agency Copenhagen. 42. Khalil, H.A.E.E., Enhancing quality of life through strategic urban planning. Sustainable cities and society, 2012. 5: p. 77-86. 43. Conrad, E., M. Christie, and I. Fazey, Understanding public perceptions of landscape: a case study from Gozo, Malta. Applied Geography, 2011. 31(1): p. 159-170. 44. Zhang, H., et al., Landscape perception and recreation needs in urban green space in Fuyang, Hangzhou, China. Urban Forestry & Urban Greening, 2013. 12(1): p. 44-52. 45. Hofmann, M., et al., Perceptions of parks and urban derelict land by landscape planners and residents. Urban Forestry & Urban Greening, 2012. 11(3): p. 303-312. 46. Pazhouhanfar, M. and M. Kamal, Effect of predictors of visual preference as characteristics of urban natural landscapes in increasing perceived restorative potential. Urban Forestry & Urban Greening, 2014. 13(1): p. 145-151. 47. Farina, A., Principles and methods in landscape ecology: towards a science of the landscape. Vol. 3. 2008: Springer Science & Business Media. 48. Pătru-Stupariu, I., Peisaj şi gestiunea durabilă a peisajului. Aplicaţii la Culoarul transcarpatic Bran–Rucăr–Dragoslavele. 2011, Bucureşti: Editura Universităţii din Bucureşti. 49. Pătru-Stupariu, I., et al., Elaborating and implementing an algorithm for landscape evaluation and prognosis. Application for the mountainous and the subcarpathian sectors of Prahova Valley. 2011, Bucharest Editura Universității din București. 50. Pǎtru-Stupariu, I., M.S. Stupariu, and A. Huzui, Mathematical models for visual landscape assessment. Case study: Sinaia. Forum Geografic, 2010. 9: p. 133–138. 51. Schmitz, S. and V. Vanderheyden, Reflexive loops on scaling issues in landscape quality assessment. Land Use Policy, 2015.

167 Athanasios Alexandru Gavrilidis et al. / Procedia Environmental Sciences 32 ( 2016 ) 155 – 167
52. Neacşu, M.C., Imaginea urbană. Element esenţial în organizarea spaţiului. Studiu de caz: Municipiul Ploieşti, in Facultatea de Geografie. 2008, Universitatea din Bucureşti: Bucureşti. 53. National Institute of Statistics, National Census of Population and Dwellings 2011. 54. Gavrilidis, A., Alexandru, Efecte spațiale și peisagere ale expansiunii și dinamicii urbane în România in Școala doctorală „Simion Mehedinți” - Natură și dezvoltare durabilă. 2014, University of Bucharest Bucharest 55. Hirt, S. and K. Stanilov, Twenty years of transition: The evolution of urban planning in Eastern Europe and the Former Soviet Union, 1989–2009. 2009, UNHABITAT: Nairobi. 56. Hirt, S., Whatever happened to the (post)socialist city? Cities, 2013. in press. 57. Müller, D., P.J. Leitão, and T. Sikor, Comparing the determinants of cropland abandonment in Albania and Romania using boosted regression trees. Agricultural Systems, 2013. 117: p. 66-77. 58. Stanilov, K., Urban development policies in Central and Eastern Europe during the transition period and their impact on urban form , in The Post-Socialist City. 2007, Springer. p. 347-359. 59. Creţan, R., A. Ianăş, and A. Satmari, The Romanian Post-socialist City: Urban Renewal and Gentrification, S. Voiculescu, Editor. 2009, Ed. Universităţii de Vest din Timişoara: Timişoara. p. 183. 60. Hernández, J., L. Garcıa, and F. Ayuga, Assessment of the visual impact made on the landscape by new buildings: a methodology for site selection. Landscape and Urban Planning, 2004. 68(1): p. 15-28. 61. de Val, G.d.l.F., J.A. Atauri, and J.V. de Lucio, Relationship between landscape visual attributes and spatial pattern indices: a test study in Mediterranean-climate landscapes. Landscape and Urban Planning, 2006. 77(4): p. 393-407. 62. Store, R., et al., Producing a sensitivity assessment method for visual forest landscapes. Landscape and Urban Planning, 2015. 144: p. 128-141. 63. Bishop, I.D. and D.R. Miller, Visual assessment of off-shore wind turbines: the influence of distance, contrast, movement and social variables. Renewable Energy, 2007. 32(5): p. 814-831. 64. Roth, M., Validating the use of Internet survey techniques in visual landscape assessment—An empirical study from Germany. Landscape and Urban Planning, 2006. 78(3): p. 179-192.