University Advancement, University Relations and ... · Penny Helms Carter Turner. White. Scott...
71
University Advancement, University Relations and Enrollment Management Committee September 2018 Page 1 of 71
Transcript of University Advancement, University Relations and ... · Penny Helms Carter Turner. White. Scott...

University Advancement,
University Relations and Enrollment
ManagementCommittee
September 2018
Page 1 of 71

UNIVERSITY ADVANCEMENT, UNIVERSITY RELATIONS AND
ENROLLMENT MANAGEMENT COMMITTEE
2:00 P.M. **
SEPTEMBER 13, 2018
MARY ANN JENNINGS HOVIS MEMORIAL BOARD ROOM
THIRD FLOOR, MARTIN HALL, RADFORD, VA
DRAFT
AGENDA
Ms. Krisha Chachra, Chair
Ms. Krisha Chachra, Chair
Ms. Krisha Chachra, Chair
Ms. Kitty McCarthy, Vice President
for Enrollment Management
Ms. Wendy Lowery, Vice President
for University Advancement
Ms. Ashley Schumaker, Vice President
for University Relations
Ms. Krisha Chachra, Chair
• CALL TO ORDER
• APPROVAL OF AGENDA
• APPROVAL OF MINUTES
o May 3, 2018
• ENROLLMENT MANAGEMENT REPORT
o Enrollment and Recruitment Update
• UNIVERSITY ADVANCEMENT REPORT
o FY 18 Giving Overview
FY 2018 Overview
FY 2019 Goals
Leadership Council Engagement
o Strategic Priorities Progress
Increase Staffing
Parent and Family Outreach
Alumni and Donor Engagement
o Upcoming Engagement Opportunities
Partners in Excellence
Homecoming 2018
Presidential Tours
• UNIVERSITY RELATIONS REPORT
o FY 2018 Campaign Performance Review
o Strategic Approach FY19 Campaign
• OTHER BUSINESS
• ADJOURNMENT Ms. Krisha Chachra, Chair
** All start times for committees are approximate only. Meetings may begin either before or after the listed
approximate start time as committee members are ready to proceed.
Page 2 of 71

COMMITTEE MEMBERS
Ms. Krisha Chachra, Chair
Mr. James R. Kibler, Jr., Vice Chair
Ms. Karyn K. Moran
Ms. Nancy Angland Rice
Ms. Lisa Throckmorton
Page 3 of 71

September 2018 Meeting Materials
Page 4 of 71

September 13, 2018
Enrollment and Recruitment Update
Board of Visitors
Page 5 of 71

Placeholder
Enrollment Management
Page 6 of 71

Discussion
Enrollment Management
Page 7 of 71

September 13, 2018
University Advancement and Alumni Relations
Board of Visitors
Page 8 of 71

FY18 Giving Overview
University Advancement
Fiscal Year-End Giving
FY 2017-2018Final
FY18 % Increaseover FY17
FY 2016-2017Final
FY 2015-2016Final
FY 2014-2015Final
FY 2013-2014Final
New Pledge Balances $ 10,553,110 44% $ 7,311,589 $ 1,160,325 $ 505,474 $ 1,100,504
New Planned Gifts $ 1,565,555 31% $ 1,192,050 $ 5,090,000 $ 1,282,000 $ 752,500
Outright Cash Gifts $ 2,155,139 2% $ 2,108,057 $ 1,522,719 $ 2,130,090 $ 1,879,136
Gifts-in-kind $ 926,320 622% $ 128,299 $ 223,955 $ 200,775 $ 105,257
Sponsored Programs $ 57,490 n/a $ 52,485 $ 10,000 n/a n/a
Total Giving $ 15,257,613 41% $ 10,792,480 $ 8,006,999 $ 4,118,339 $ 3,837,397
Total Number of Donors 5,262 0.1% 5,253 4,435 4,731 5,221
Total Number of New Donors 2,018 -3% 2,090 1,350 1,076 1,199Page 9 of 71

FY18 Overview
University Advancement
Page 10 of 71

FY19 Goals• Evaluation of Previous Performance
• Portfolio Assessment
• Annual Giving & Alumni Relations
• Advancement Communication
• Culture & Continuous Improvement
Leadership Council Engagement
• Fiscal Year Goal Setting
• Professional DevelopmentUniversity Advancement
Page 11 of 71

Strategic Priorities Update – Increase Staffing
University Advancement
Wendy Lowery
Dale Parris
Carter TurnerPenny Helms White
Scott Davis
Susan Taylor
Ben Hill Stephanie Overton
Vanessa Quesenberry
Page 12 of 71

Strategic Priorities Update: Parent and Family Outreach
• Quest• Highlander Family Fund• Portfolio Development• Family Focus Group – Family Weekend 2018
University Advancement
Page 13 of 71

Strategic Priorities Update: Alumni and Donor EngagementHighlander Hometown Tour
Presidential Tour – Spring/Summer 2019
Homecoming Highlights
University Advancement
Page 14 of 71

Upcoming Engagement Opportunities
• Partners in Excellence – October 18, 2018• Homecoming – October 19-21, 2018• Presidential Tours
University Advancement
Page 15 of 71

Discussion
University Advancement
Page 16 of 71

September 13, 2018
University Relations
Board of Visitors
Page 17 of 71

University Relations
FY18 Campaign Performance Review
The 2017-2018 campaign year has resulted in the following performance:
• Over 99 million paid media impressions delivered in support of general branding, undergraduate, transfer and COBE/MBA campaigns
• More than 329,000 website sessions as a result of paid advertising
• More than 211,000 visits to the Radford.edu marketing landing pages from paid digital media sources
• Over 18 billion earned media impressions realized as a result of the
NCAA March Madness tournament, totaling over $44 million in equivalent
ad value Page 18 of 71

University Relations
Strategic Approach FY19 Campaign• Generate traditional TV exposure in Norfolk and Richmond markets where
opportunity for increased awareness may be needed, based on enrollment data
• Utilize Streaming TV opportunities like Hulu as an alternative to TV in cost-
prohibitive markets such as Northern Virginia and as a targeted complement to TV
strategy in all Virginia markets
• Consolidate digital display and video partners to maximize cost efficiencies and
consistent audience targeting
• Extend paid social media as a continuous campaign with a more robust budget;
rotate evergreen messaging with temporal event-driven messaging from month to
month, including coordination with Radford’s campus events calendar
• Begin to leverage retargeting capabilities through AdWords and consider stronger
calls-to-action with retargetingPage 19 of 71

Geographic Marketing Approach
University Relations
• Advertising to be focused in key
in-state markets based on
information gathered from
Admission data:
• Northern Virginia – 30%
• Richmond – 25%
• Norfolk – 20%
• Roanoke – 15%
• Other/Regional – 10%
Page 20 of 71

Marketing Approach – Enrollment Phases
University Relations
Page 21 of 71

Executive Summary of FY19 Media Tactics
University Relations
• Build high-level visibility and generate brand awareness through TV and out of home
• Hyper-target the most relevant prospects online through digital display
• Complement the reach/frequency of the TV campaign, communicate time sensitive Open House messaging and target prospects in additional markets using streaming TV & digital video
• Engage and interact with a younger generation through paid social media
• Influence active searchers to visit the website and take action through paid search
Page 22 of 71

Discussion
University Relations
Page 23 of 71

May 2018 Minutes
Page 24 of 71

UNIVERSITY ADVANCEMENT, UNIVERSITY RELATIONS AND
ENROLLMENT MANAGEMENT COMMITTEE
10:00 A.M.
MAY 3, 2018
MARY ANN JENNINGS HOVIS MEMORIAL BOARD ROOM
THIRD FLOOR, MARTIN HALL, RADFORD, VA
DRAFT
MINUTES
COMMITTEE MEMBERS PRESENT
Ms. Krisha Chachra, Chair Mr. Robert A. Archer
Mr. James R. Kibler, Jr,
Ms. Karyn K. Moran
Ms. Lisa Throckmorton
OTHER BOARD MEMBERS PRESENT
Mr. Mark S, Lawrence, Rector
Mr. Randy J. Marcus, Vice Rector
Dr. Jay A. Brown
Dr. Rachel D. Fowlkes
Dr. Susan Whealler Johnston
Mr. Steve A. Robinson
Ms. Georgia Anne Snyder-Falkinham
Dr. Jake Fox, Faculty Representative (non-voting advisory member)
OTHERS PRESENT
President Brian O. Hemphill
Mr. Richard Alvarez, Vice President for Finance and Administration and Chief Financial Officer
Mr. Joe Carpenter, Vice President for University Relations and Chief Communications Officer
Ms. Karen Casteele, Secretary to the Board of Visitors and Special Assistant to the President
Dr. Kenna Colley, Interim Provost and Vice President for Academic Affairs
Ms. Lisa Ghidotti, Director of State Government Relations
Mr. Danny M. Kemp, Vice President for Information Technology and Chief Information Officer
Dr. Ann Marie Klotz, Vice President for Student Affairs
Ms. Wendy Lowery, Vice President for University Advancement
Ms. Kitty McCarthy, Vice President for Enrollment Management
Ms. Margaret McManus, University Auditor
Mr. Chad Reed, Associate Vice President for Budget and Financial Planning
Ms. Ashley Schumaker, Chief of Staff, Office of the President
Mr. Allen Wilson, Senior Assistant Attorney General, Commonwealth of Virginia
Radford University faculty and staff Page 25 of 71

2
CALL TO ORDER Ms. Krisha Chachra, Chair, called the meeting to order at 10:01 a.m. in the Mary Ann Jennings Hovis
Memorial Board Room on Third Floor, Martin Hall at Radford University, Radford, Virginia.
APPROVAL OF AGENDA
Ms. Chachra requested a motion to approve the May 3, 2018 agenda, as published. Mr. Robert Archer so
moved, Mr. James Kibler seconded and the agenda was unanimously approved, as published.
APPROVAL OF MINUTES
Ms. Chachra requested a motion to approve the February 15, 2018 minutes, as published. Mr. Archer so
moved, Mr. Kibler seconded the motion and the minutes were unanimously approved, as published.
ENROLLMENT MANAGEMENT REPORT
Ms. Kitty McCarthy, Vice President for Enrollment Management, provided an update regarding new
student recruitment and enrollment for fall 2018, as of May 2, 2018. A copy of the report is attached
hereto as Attachment A and is made a part hereof.
During the report, Ms. McCarthy stated that 13,870 new freshmen applications have been received for
fall 2018 compared to 14,300 for fall 2017, a decrease of 430 or 3%; 10,287 individuals have been
offered admission for fall 2018, a difference of 379 or -3.6% over fall 2017’s 10,666; and 1,825
admitted freshmen have made a deposit for fall 2018, a decrease of 4.7% or 91 students compared to
1,916 deposits received for fall 2107. Ms. McCarthy added that the academic quality of new freshmen
who have deposited is holding constant with fall 2017, with the average SAT of 1,047 for fall 2018
compared to 1,048 for fall 2017 and the average GPA of 3.27 compared to 3.21 for fall 2017.
Ms. McCarthy also noted that 1,465 transfer applications have been received for fall 2018 compared to
1,624 for fall 2017. For fall 2018, 844 transfer students have been offered admission, down by 111 over
fall 2017’s 955 and 377 have made deposits for fall 2018, down 40 deposits compared to 417 deposits
received for fall 2017. Ms. McCarthy remarked that staff is working diligently to close the gap and
surpass last year’s results.
Before concluding her report, Ms. McCarthy updated the Board of Visitors members on summer
activities in her area which included engagement with prospective students and changes to Quest, the
new student orientation.
UNIVERSITY ADVANCEMENT REPORT
Ms. Wendy Lowery, Vice President for University Advancement, focused on the following during the
University Advancement report. A copy the report is attached hereto as Attachment B and is made a part
hereof.
Ms. Lowery shared the updated Comparative Giving Report as of April 25, 2018, which included overall
giving is up 36% compared to the same time last fiscal year. A total of $14,747,499 has been raised to
date and on target to reach the $15 million goal for fiscal year ending June 30, 2018.
In a Major Gift Highlights, Ms. Lowery noted the importance of working across the entire University to
fulfill strategic initiatives for academics and athletics. She focused on major gifts received in each of the
colleges and athletics this fiscal year.
Ms. Lowery provide an update on the Annual Giving effort, Spring Fever Week of Giving. The Spring
Fever Bash was introduced this year as an additional way to engage students, faculty and staff with over
Page 26 of 71

3
250 students and 50 faculty and staff attending. Ms. Lowery reported that during the week, $37,174 was
raised, compared to $26,025 last year and the number of donors increased to 517 compared to 136 last
year.
Ms. Lowery reported that the Capital Campaign Steering Committee met on April 17, 2018 and
discussed campaign elements such as theme, working goal and the case for support. The next meeting
will be held in the fall.
Ms. Lowery provided an overview of Alumni Engagement by highlighting the partnership with the
Office of Admissions outreach, tournament watch parties across the country and the Russell Hall Block
Party. Ms. Lowery concluded by asking members to save the dates of October 19-21, 2018 for
Homecoming.
UNIVERSITY RELATIONS REPORT
Mr. Joe Carpenter, Vice President for University Relations and Chief Communications Officer, provided
an update on the closeout of this semester’s advertising campaign. A copy of the report is attached
hereto as Attachment C and is made a part hereof. Global and digital key performance indicators
illustrate that University Relations is ahead of their year-to-date goal of advertising impressions,
sessions and inquiries.
Mr. Carpenter provided details on the marketing impact of the men’s basketball NCAA tournament, as
well as the University’s active promotion of milestone events throughout Radford University’s
participation in the tournament. Mr. Carpenter reported that these activities included television
advertisements and digital advertising in nine strategic markets, including the first ever broadcast of
Radford University television advertising in the Baltimore, Maryland; Washington, D.C.; Bluefield,
West Virginia; Charlottesville and Harrisonburg, Virginia; and Wilmington, North Carolina markets.
Mr. Carpenter shared that based on an industry standard assessment, the press and social media
reporting of Radford University’s Big South tournament championship win, and NCAA tournament
participation resulted in the equivalent of $44.6 million of advertising for the University.
ADJOURNMENT
With no further business to come before the committee, Ms. Chachra requested a motion to adjourn the
meeting. Mr. Archer made the motion to adjourn, Ms. Lisa Throckmorton seconded and the motion
carried unanimously. The meeting adjourned at 11:06 a.m.
Respectfully submitted,
Kathy Murphy
Executive Assistant to the Vice President for Enrollment Management
Page 27 of 71

Fall 2018 Recruitment Update
Office of Enrollment Management May 3, 2018
ATTACHMENT A
Page 28 of 71

New Freshmen Applications (May 2nd)
7,309
5,888
14,300
10,666
13,870
10,287
0
2,000
4,000
6,000
8,000
10,000
12,000
14,000
16,000
Applications Admitted
Fall 2016 Fall 2017 Fall 2018
Office of Enrollment Management
Page 29 of 71

New Freshmen Deposits (May 2nd)
1,7331,916
1,825
0
500
1,000
1,500
2,000
2,500
Deposits
Fall 2016 Fall 2017 Fall 2018
Office of Enrollment Management
Page 30 of 71
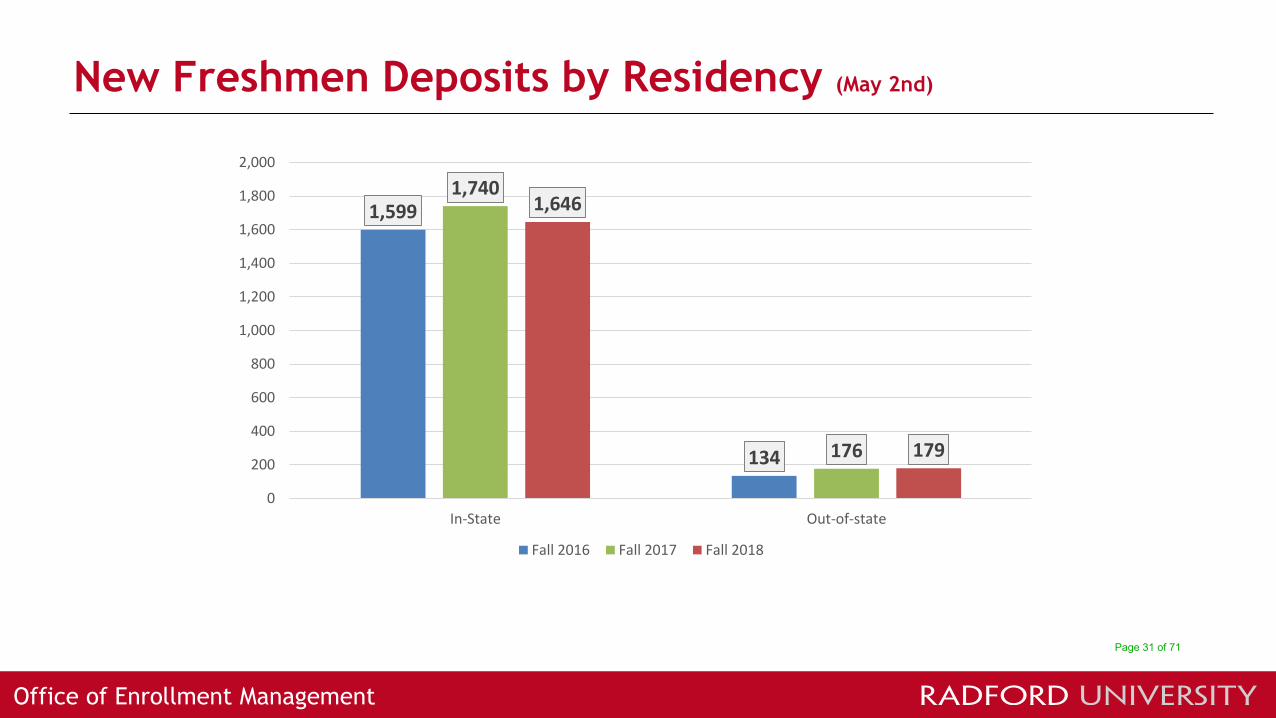
New Freshmen Deposits by Residency (May 2nd)
1,599
134
1,740
176
1,646
179
0
200
400
600
800
1,000
1,200
1,400
1,600
1,800
2,000
In-State Out-of-state
Fall 2016 Fall 2017 Fall 2018
Office of Enrollment Management
Page 31 of 71

New Freshmen Deposits by VA Region (May 2nd)
Region Fall 2016 Fall 2017 Fall 2018
Central Va 163 139 129
Northern Va 499 480 414
Peninsula 78 113 107
Richmond 195 198 201
Roanoke Metro 122 120 144
South Central 44 59 50
Southwest 193 235 228
Tidewater 147 180 187
Valley 150 191 182
In-State, Unknown 8 25 4
Office of Enrollment Management
Page 32 of 71

New Freshmen Deposits by Top States (May 2nd)
State Fall 2016 Fall 2017 Fall 2018
Maryland 25 46 38
District of Columbia 15 15 27
North Carolina 14 25 26
Pennsylvania 10 6 11
New Jersey 11 9 9
West Virginia 7 10 9
Florida 6 7 8
Tennessee 2 4 6
Georgia 6 4 5
New York 7 4 5
Office of Enrollment Management
Page 33 of 71

New Freshmen Deposits by Ethnicity (May 2nd)
Ethnicity Fall 2016 Fall 2017 Fall 2018
American Indian or Alaska Native 0 3 5
Asian 34 18 28
Black or African American 316 353 350
Hispanic 145 156 153
Native Hawaiian or Other Pacific Islander 0 2 2
White 1,140 1,208 1,114
Two or more races 68 118 118
Nonresident Alien 4 4 6
Race and Ethnicity Unknown 26 54 49
Office of Enrollment Management
Page 34 of 71

New Freshmen Deposits Average SAT Scores (May 2nd)
1,044 1,048 1,047
0
200
400
600
800
1,000
1,200
Average
Fall 2016 Fall 2017 Fall 2018
Office of Enrollment Management
Page 35 of 71
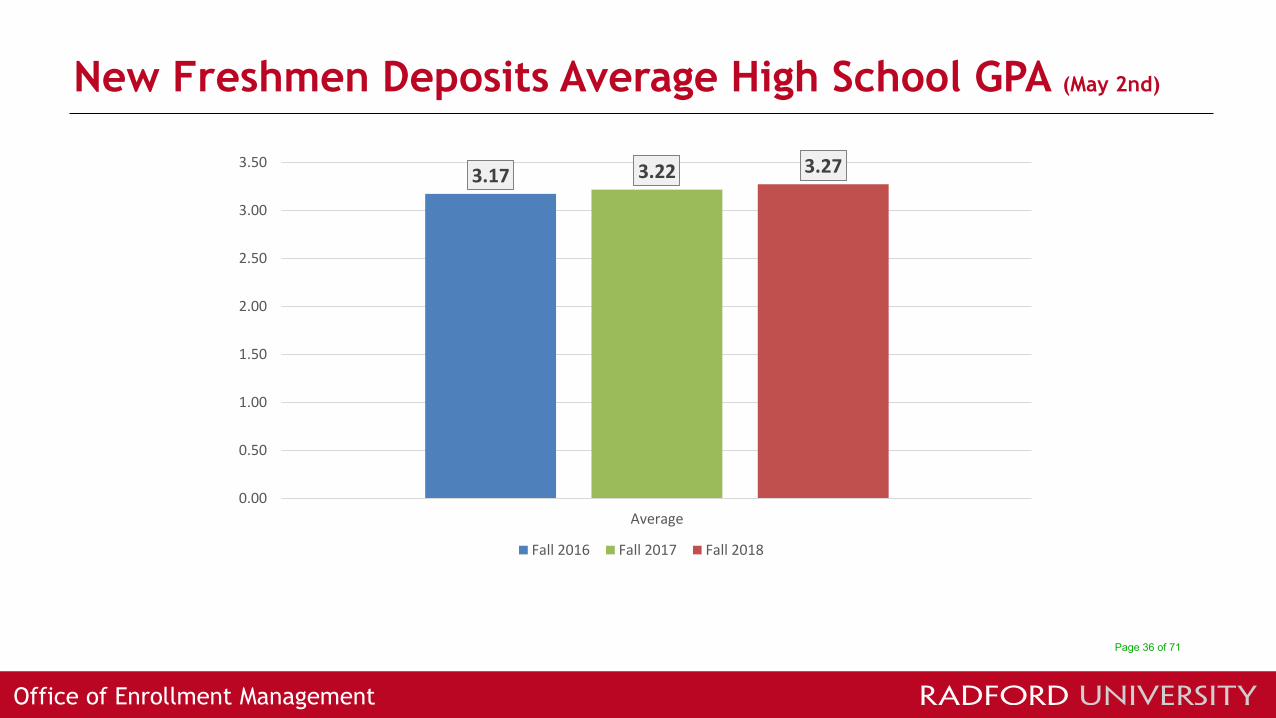
New Freshmen Deposits Average High School GPA (May 2nd)
3.17 3.22 3.27
0.00
0.50
1.00
1.50
2.00
2.50
3.00
3.50
Average
Fall 2016 Fall 2017 Fall 2018
Office of Enrollment Management
Page 36 of 71

What We Know
Office of Enrollment Management
• JMU, VCU, ODU, VT, Longwood• Campus environment, academic reputation,
location, major, cost• Cost:
46.5% as expected17.6% less16.5% more
Page 37 of 71

New Transfer Applications (May 2nd)
1,294
832
1,624
955
1,465
844
0
200
400
600
800
1,000
1,200
1,400
1,600
1,800
Applications Admitted
Fall 2016 Fall 2017 Fall 2018
Office of Enrollment Management
Page 38 of 71

New Transfer Deposits (May 2nd)
421 417
377
0
50
100
150
200
250
300
350
400
450
Deposits
Fall 2016 Fall 2017 Fall 2018
Office of Enrollment Management
Page 39 of 71

Summer 2018
Office of Enrollment Management
• New applications – freshman and transfer• Managing melt• New student orientation• Assess and plan
Page 40 of 71

Discussion
14Office of Enrollment Management
Page 41 of 71

May 3, 2018
Office for University Advancement
and Alumni Relations
Board of Visitors
ATTACHMENT B
Page 42 of 71

Comparative Giving Report
Office for University Advancement
Radford University - University AdvancementFiscal Year-to-Date Giving:
FY 2017-2018(7/1/17 - 4/25/18)
FY18 - % Increase
over FY17FY 2016-2017
(7/1/16 - 4/30/17)
FY 2015-2016(7/1/15 - 4/30/16)
FY 2014-2015(7/1/14 - 4/30/15)
New Pledge Balances $11,097,910 36% $7,112,896 $1,077,193 $823,770
Current-Year Pledge Payments $319,266 -48% $473,330 $291,977 $289,682
New Planned Gifts $1,565,555 24% $1,192,050 $4,840,000 $982,000
Outright Cash Gifts $1,447,846 9% $1,317,022 $940,547 $1,182,210
Gifts-in-kind $268,231 55% $119,488 $191,698 $189,921
Sponsored Programs $48,692 n/a $42,485 $10,000 n/a
Total Giving $14,747,499 30% $10,257,270 $7,351,415 $3,467,584
Total Number of Donors 4,919 -3% 5,050 4,142 4,447
*FY18 as of April 25th; other FYs are final as of April 30th
Fiscal Year-End Giving:FY 2016-2017
Final
FY 2015-2016
Final
FY 2014-2015
Final
FY 2013-2014
Final
New Pledge Balances $7,311,589 $1,160,325 $505,474 $1,100,504
Current-Year Pledge Payments $544,121 $344,401 $793,813 $513,692
New Planned Gifts $1,192,050 $5,090,000 $1,282,000 $752,500
Outright Cash Gifts $1,563,936 $1,178,318 $1,336,277 $1,365,443
Gifts-in-kind $128,299 $223,955 $200,775 $105,257
Sponsored Programs $52,485 $10,000 n/a n/a
Total Giving $10,792,480 $8,006,999 $4,118,339 $3,837,397
Total Number of Donors 5,253 4,435 4,731 5,221
Page 43 of 71

FY18 Major Gift Highlights
Office for University Advancement
Page 44 of 71

Spring Fever
Total Raised: $37,174 (includes $5,049 from seniors for the Highlander Senior Class Scholarship)
Unique Donors: 991(includes 474 senior donors and 138 first-time donors!)
Most Donors: College of Humanities and Behavioral Sciences (272 donors)
Most Dollars: College of Business and Economics ($9,006)
Spring Fever Bash: Nearly 250 students and close to 50 faculty/staff members
Office for University Advancement
Page 45 of 71

Spring Fever Bash
Office for University Advancement
Page 46 of 71

Capital Campaign Update
Office for University Advancement
Page 47 of 71

Save the Date - Homecoming
October 19-21, 2018
Office for University Advancement
Page 48 of 71

University Advancement
Discussion
Page 49 of 71

May 3, 2018
University Relations
Update
Board of Visitors
ATTACHMENT C
Page 50 of 71

Advertising Update
University Relations2
Media Tactic Market(s) Placement DetailsDelivery
(thru 3/15)*%
Comp.
Out of Home• Roanoke• Northern Virginia• Richmond
• ROA Airport Digital Wall Screen (Annual)• Bus Kings & Rail Station Posters in NOVA (WMATA)• Digital billboards on I-64, I-95 (Jan 2018)
13.6M impressions 97%
Print • All Markets• USA Today College Guide, VA Colors, VA Business, Washington
Monthly, Richmond Mag, Delta Sky, AA Mag1.84M impressions 80%
TV• Roanoke/Richmond
/Norfolk• Various (NCAA)**
• 4-week TV run in all markets in January/early February• 4-week TV extension in Norfolk market 2/19-3/25• :30 in-game spots during NCAA play-in game & first round
17.5M impressions 100%
Radio• Roanoke• DC/Virginia
• Stations include WSLC, WXLK, WROV, WJJS, WYYD, WSNV• NPR “With Good Reason” underwriting
1.9M impressions 75%
Streaming Audio • Priority Markets • Pandora 628K audio spots 67%
Online Video • All Markets• DynAdmic partnership to support General/Multicultural message• ZEFR (contextual youtube) partnership to support COBE message
2.7M video plays 54%
Digital Display • All Markets• Amobee & AdTheorent; site list includes, but not limited to
BuzzFeed, Roanoke.com, Forbes25.9M impressions 69%
Paid Social • Priority Markets • Facebook, Instagram 2.7M impressions 56%
Paid Search • All Markets • Google 57,811 clicks 58%
*Includes NCAA TV spots that ran on 3/13 & 3/15**Additional info on markets presented on slide 6
Page 51 of 71

University Relations
Key Performance Indicators Update
Digital KPI FY18 YTD FY18 Goal% Comp
YTD% Goal Pacing*
Digital KPI Notes
Digital Impressions 32,662,241 48,000,000 68% +13%Digital media represents 48% of all advertising impressions.
Marketing Landing Page Sessions
151,679 188,000 80% +26%Elevated rate of web page visits can be attributed to a more efficient and effective digital media campaign.
Marketing LandingPage Inquiries
6,979 10,800 64% +7%An updated version of the marketing landing pages has led to an increase in inquiry engagements.
Global KPI FY18 YTD FY18 Goal% Comp
YTD% Goal Pacing*
Global KPI Notes
Advertising Impressions
68,294,658 85,750,000 80% +26%Introduction of Broadcast & Cable TV during Q1 2018 aided in bump of impressions during this period.
Admissions Section Sessions
320,060 500,000 64% +7% Website visitation is on pace with FY18 projection.
Application Page Inquiries
31,392 51,275 61% +2%Includes all “Apply Now” inquiries that direct www.radford.edu users to the application portal
*Pacing performance based on 60% of FY campaign completed
3
Page 52 of 71

NCAA Tournament Coverage Milestones
University Relations4
March 4 March 5 March 15March 13
Page 53 of 71

University Relations
Promotion
5
Page 54 of 71
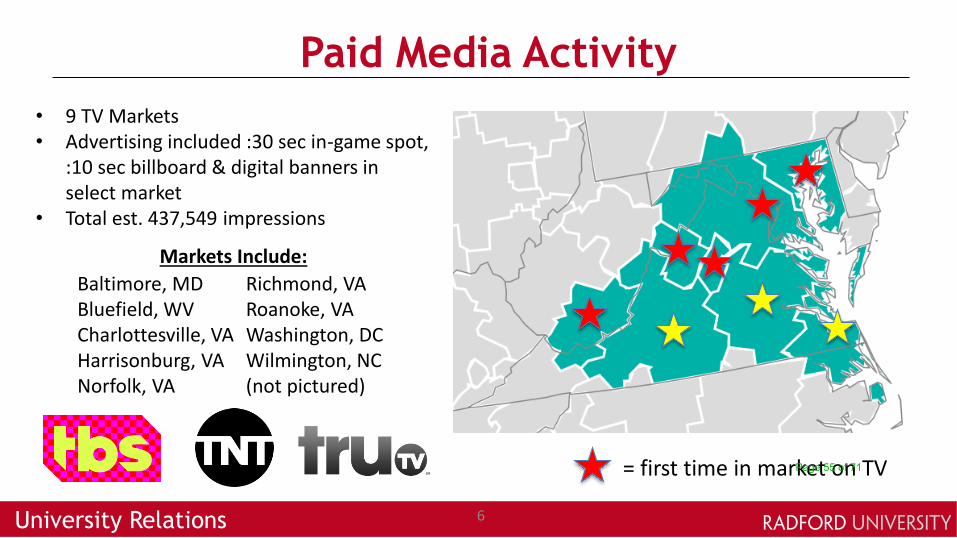
Paid Media Activity
University Relations 6
Baltimore, MDBluefield, WVCharlottesville, VAHarrisonburg, VANorfolk, VA
Richmond, VARoanoke, VAWashington, DCWilmington, NC (not pictured)
= first time in market on TV
Markets Include:
• 9 TV Markets• Advertising included :30 sec in-game spot,
:10 sec billboard & digital banners in select market
• Total est. 437,549 impressions
Page 55 of 71

Social Media Assessment
7University Relations 7
0
100
200
March 7, 2018 March 14,2018
Twitter Mentions
Mentions
18733
8181
18885
8243
TWITTER INSTAGRAM
Followers
March 7, 2018 March 14, 2018
111734
0
500
1000
March 7, 2018 March 14, 2018
Likes for Published Tweets
Likes for Published Tweets
828
MARCH 7, 2018 MARCH 14, 2018
Facebook New Fans
New Fans
0
1000
March 7, 2018 March 14, 2018
Instagram Engagement
EngagementPage 56 of 71

Web Communications Assessment
University Relations 8
Who We Are Page
6,5331,677
Where We Are Page6,442564
289.56% increase in traffic year over year
1,042.20% increase in traffic year over year
Page 57 of 71

Earned Media Assessment
University Relations 9
Page 58 of 71

Earned Media Assessment
University Relations 10
Page 59 of 71

Conclusions
University Relations 11
Page 60 of 71

Discussion
University Relations 11
Page 61 of 71

May 3, 2018
Addendum Slides
University Relations
Page 62 of 71

Social Media Promotion
University Relations 14
Page 63 of 71

Social Media Promotion
University Relations 15
Page 64 of 71
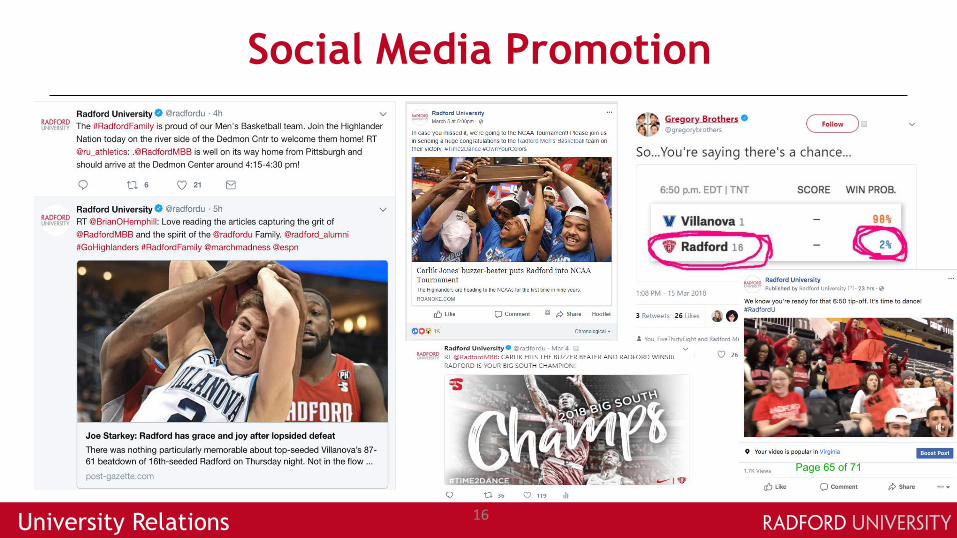
Social Media Promotion
University Relations 16
Page 65 of 71

Social Media Promotion
University Relations 17
Page 66 of 71

Social Media Promotion
University Relations 18
Page 67 of 71

Web Communication Activity
University Relations 11
Page 68 of 71

Web Communication Activity
University Relations 11
Page 69 of 71

Web Communication Activity
University Relations 11
Page 70 of 71

End of Board of Visitors Materials
Page 71 of 71